Competing Deformation Mechanisms in Periclase: Implications for Lower Mantle Anisotropy

1
Department of Geology and Geophysics, University of Utah, Salt Lake City, UT 84112, USA
2
Kansas Water Resource Center, United States Geological Survey, 1204 Canterbury Dr, Hays, KS 67601, USA
*
Author to whom correspondence should be addressed.
Minerals 2019, 9(11), 650; https://doi.org/10.3390/min9110650
Submission received: 1 September 2019
/
Revised: 21 October 2019
/
Accepted: 22 October 2019
/
Published: 23 October 2019
(This article belongs to the Special Issue Texture and Microstructural Analysis of Crystalline Solids)
Abstract
:Seismic anisotropy is observed above the core-mantle boundary in regions of slab subduction and near the margins of Large Low Shear Velocity Provinces (LLSVPs). Ferropericlase is believed to be the second most abundant phase in the lower mantle. As it is rheologically weak, it may be a dominant source for anisotropy in the lowermost mantle. Understanding deformation mechanisms in ferropericlase over a range of pressure and temperature conditions is crucial to interpret seismic anisotropy. The effect of temperature on deformation mechanisms of ferropericlase has been established, but the effects of pressure are still controversial. With the aim to clarify and quantify the effect of pressure on deformation mechanisms, we perform room temperature compression experiments on polycrystalline periclase to 50 GPa. Lattice strains and texture development are modeled using the Elasto-ViscoPlastic Self Consistent method (EVPSC). Based on modeling results, we find that slip is increasingly activated with higher pressure and is fully activated at ~50 GPa. Pressure and temperature have a competing effect on activities of dominant slip systems. An increasing : ratio of slip activity is expected as material moves from cold subduction regions towards hot upwelling region adjacent to LLSVPs. This could explain observed seismic anisotropy in the circum-Pacific region that appears to weaken near margins of LLVSPs.
1. Introduction
Shear wave splitting is widely used to document seismic anisotropy in the lower mantle. In the bulk of the lower mantle, there is no compelling evidence for the existence of widespread anisotropy (e.g., [1,2,3,4]). However, anisotropy is widely observed above the core-mantle boundary (CMB) near regions of slab subduction and adjacent to the borders of Large Low Shear Velocity Provinces (LLVSPs). Generally, shear wave splitting of VSH > VSV is observed for ray paths that are approximately parallel to the CMB in the circum-Pacific regions (e.g., [3,5,6]). Decreased anisotropy is typically observed towards LLVSP boundaries and becomes vanishing small within the LLVSPs (e.g., [7,8,9]). It is generally assumed that observed anisotropy is the result of plastic deformation of mantle rocks by dislocation creep (e.g., [9,10,11,12]). Several experiments have been conducted to study deformation mechanism of bridgmanite (e.g., [13,14]), the most abundant phase of the lower mantle, and post-perovskite (e.g., [10,11]), which is believed to be the most abundant phase in colder regions of the D” layer just above the CMB. Studies using 2D and 3D flow field methods [15,16,17,18] generally conclude that post-perovskite is consistent with observed anisotropy in the D″. Ferropericlase, which is the second most abundant phase of the lower mantle, is also likely to be important. Due to its rheological weakness, comparatively large amounts of strain may be accommodated by ferropericlase [19]. This combined with high single crystal elastic anisotropy [20,21] implies that ferropericlase is an important contributor to D″ anisotropy. Thus, understanding the deformation mechanisms of the ferropericlase at D″ conditions is of great importance for understanding sources of anisotropy in the lower mantle. Deformation mechanisms of periclase have been shown to vary at different pressure and temperature conditions (e.g., [22]). Generating D″ pressure and temperature conditions in deformation experiments is challenging and is not currently achievable. However, it is feasible to reach high pressure at low temperature or high temperature at low pressure, which gives the opportunity to separately study temperature and pressure effects on deformation mechanisms. Temperature effects on periclase deformation mechanisms have been well documented. Early experiments at low pressure inferred a dominant slip system at ambient conditions and an increase in activity of the slip system with elevated temperature (e.g., [23,24,25,26,27,28,29]). However, pressure effects on deformation mechanisms are still controversial. Recent calculations on critical resolved shear stress (CRSS) of single crystal MgO predicted a transition to dominant slip between 30 GPa and 60 GPa [30]. In contrast, earlier theoretical work showed dominant slip up to 100 GPa [31]. High pressure single crystal deformation experiments showed trends in slip system strengths consistent with a change in dominant slip system from to at 23 GPa and 1000 K [32].
The plasticity behavior of polycrystals can be quite different compared to single crystals due to intergranular stress and strain heterogeneity, crystallographic preferred orientation (texture), microstructure, and grain interaction. Typically, the deformation of single crystals is fulfilled by a single slip system while in polycrystals multiple slip systems tend to be active. In polycrystals, back stress induced due to grain boundary interactions may hinder dislocations and force multiple slip systems to be activated, causing tangling of dislocations and hardening. The activity of slip systems may also be hampered by an unfavorable Schmid factor, which describes how stress is resolved on a slip plane and direction. Constraints on compatibility may also force activation of geometrically necessary slip systems. Thus, it can be difficult to directly apply single crystal CRSS to deduce polycrystals’ deformation behavior. Room temperature deformation experiments of polycrystalline ferropericlase and periclase have documented texture consistent with dominant slip [25,33,34,35]. Recent work on ferropericlase found a surprising increase in differential stresses at mid mantle pressures. It was suggested that this increase in flow stress may be due to a change in deformation mechanisms with increasing pressure [36]. This study did not document a significant change in texture evolution, and as such, the deformation mechanism responsible for the increase in flow stress was not identified. Furthermore, it is not clear from this study if the inferred change in deformation mechanism is related to Fe content or if it also occurs in Fe free samples. Resistive heated Diamond Anvil Cell (DAC) experiments on the same composition of ferropericlase as [36] shows evidence of comparable activation of both and slip systems at ~1400 K in a range of 30–60 GPa [37]. [37] suggested that {100} is favored by both high temperature and pressure. However as is strongly favored by high temperature [25], the increased activity of {100} may be primarily due to temperature.
In order to quantify the effect of pressure on deformation mechanisms and to understand the role of Fe changes in deformation mechanisms, we performed two DAC compression experiments on polycrystalline periclase up to 50 GPa at room temperature. Lattice strains and texture evolution at varying pressures are recorded using radial diffraction geometry and modeled as a function of slip system activities using the Elasto-ViscoPlastic Self Consistent method (EVPSC).
2. Experiment and Methods
2.1. Experiment Details
Starting material of ground MgO powder (Alfa Aesar, 99.95% purity, stock# 14684, lot# J03Q037) was loaded in a boron-kapton gasket [38] with a 350 µm diameter boron insert and a 50 µm diameter sample chamber. A panoramic type diamond anvil cell with 300-micron culet diamond anvils was used to compress the sample to high pressure. Synchrotron X-ray diffraction in radial geometry was performed at beamline 12.2.2 of the Advanced Light Source (ALS) (Lawrence Berkeley National Lab, Berkeley, CA, USA) using an X-ray wavelength of 0.49594 Å. The sample detector distance and detector non-orthogonality were calibrated using a CeO2 standard. Diffraction images were recorded using a MAR345 detector and an exposure time of 240 s.
2.2. Experiment Data Analysis
The stress state in DAC experiments can be decomposed into hydrostatic and non-hydrostatic components as:
where is the hydrostatic stress, and differential stress can be used to infer the flow stress of the sample, assuming plastic flow occurs in DAC. Due to the deviatoric stress imposed on the sample, the measured d-spacing (distance between lattice planes) is a function of the angle between the compression axis () and diffraction plane normal , as described in Singh, 1993 [39]:
where is the d-spacing under hydrostatic stress. describes the shift in measured d-spacing from hydrostatic and can be used to represent average lattice strain for plane (Figure 1). Pressure is calculated using a 3rd Birch–Murnaghan equation of state for MgO from Zha et al. (2000) [40]. The differential stress can be estimated from the lattice strains using following relationship:
where is the shear modulus of the aggregates. Systematic intensity variation along the diffraction rings indicates texture (Figure 1). Diffraction images are analyzed for lattice strain and texture using the Rietveld method implemented in the Materials Analysis Using Diffraction (MAUD) software [41]. Refinement closely follows the method for DAC data as outlined in [42].
2.3. Plasticity Simulations
Lattice strains and texture are modeled using the EVPSC method [43]. EVPSC is an effective medium self-consistent method, which considers individual grains as inclusions in a homogenous but anisotropic medium. The inclusions interact with the medium and the macroscopic properties are updated when the average strain and stress of all inclusion equals the macroscopic stress and strain at each deformation step. The plastic behavior of the inclusions is described by a rate-sensitive constitutive law on various slip systems:
where is the reference shear strain rate, is the rate sensitive critical resolved shear stress (CRSS) of a slip system s at the reference strain rate, is the symmetric Schmid factor for the slip system s, n is an empirical stress exponent, is the local stress tensor. When the stress resolved onto a given slip system is close to the threshold value , deformation will occur on the slip system. Since EVPSC does not explicitly account for complex grain to grain interactions and back-stress induced by misorientation of neighboring grains. These processes are accounted for in a “polycrystal CRSS” or effective CRSS. This effective CRSS is not equivalent to single crystal CRSS. The details of EVPSC simulation for high pressure deformation experiments can be found in [33].
3. Results and Discussion
The samples in both experiment runs are compressed up to ~50 GPa. At pressure below 20 GPa, the lattice strains of {200}, {220}, and {111} plane are in an order of Q(220) > Q(111) > Q(200). Above 20 GPa, Q(111), and Q(220) gradually increase. The slope of Q(111) is larger than Q(220) thus Q(111) surpasses Q(220) at ~25 GPa to 30 GPa, and the separation between Q(111) and Q(220) becomes larger with increasing pressure (Figure 2). Based on the previous results of EVPSC modeling for periclase [33], when the slip system is fully activated, the lattice strains are in an order of Q(111) > Q(220) > Q(200). In contrast, an inverted order of Q(200) > Q(220) > Q(111) occurs when is fully activated. Activation of slip decreases Q(111) and increases Q(200). Experimental lattice strains at high pressure above 30 GPa resemble the case where is fully activated. Below 20 GPa, the lattice strains resemble Q-factor ordering consistent with mixed and slip. Based on the previous modeling, a concentrated (100) compression texture indicates a high activity of slip, while a (110) texture indicates slip [33]. In this study, periclase develops a concentrated (100) texture (Figure 3), due to high activity of the slip system. Given these experimental results, we suggest a deformation scenario in which and slip systems are both activated at relatively low pressure below 20 GPa and become more active with increasing pressure.
In order to clarify and quantify this suggestion, we model the lattice strain and texture development in Run 1 using EVPSC method. The related modeling parameters are listed in Table 1. A stress exponent of 8 is chosen for dislocation glide in a relatively rate-insensitive material. Theoretical calculations show that slip system is unlikely to activate at room temperature (e.g., [44]). Furthermore, activation of the system will give an intense (110) texture and Q-factors all with similar magnitudes [33]. Consequently, a very high CRSS is given to in order to fully suppress this system. Below 20 GPa, the CRSS of and are set in order to match experimental lattice strains. In the experiments, we do not observe a decrease of all lattice strains. Thus, the increased activity of slip system is unlikely due to softening of but “pressure hardening” of slip system. Single crystal CRSSs are not directly transferable to polycrystal behavior, since both “soft” and “hard” systems are activated as this is geometrically necessary to accommodate deformation of neighboring grains. However, the single crystal calculations [44] find that the CRSS of starts to increase around 20 GPa to 30 GPa. The calculated single crystal CRSS of is close to the polycrystal magnitude (GPa) found here while single crystal CRSS for is much smaller. Thus, the pressure induced change in the single crystal CRSS of the harder system may represent the general trend in the polycrystal. That is to say that because harder slip systems are geometrically necessary for polycrystal deformation, harder single crystal slip systems maybe more similar to polycrystal CRSS and more representative of the bulk strength of the polycrystal. In EVPSC, above 20 GPa, the activity of is suppressed gradually by imposing a steep increase of CRSS with pressure (Table 1). The modeled lattice strains and texture provide a close match to the experiment (Figure 4 and Figure 5). Below 20 GPa, and are activated in a ratio of ~70:30. Above 20 GPa, due to the “pressure hardening” of the slip system, the activity of gradually increases and reaches nearly 100% by ~50 GPa (Figure 6). Q(111) surpasses Q(220) at ~25 GPa, where and are activated in a ratio of 80:20 (Figure 4; Figure 6). In the simulation, periclase develops a concentrated (100) texture (Figure 5) consistent with the experiment (Figure 3).
The reordering of lattice strains observed in this study is similar to that observed by Marquardt and Miyagi (2015) [36], indicating that this phenomenon is not related to Fe substitution as it is observed both in periclase and ferropericlase. We find that the polycrystal flow strength increases ~25% due to pressure hardening of the slip system (Figure 7). The flow strength measured here is lower compared to previous DAC experiments on periclase [34,45]. This is potentially due to grain-size differences between these experiments [45]. A yield strength increase above 20 GPa is not obvious in [34] since there are only limited data points above 20 GPa. In the work of Singh et al. (2004) [45], there is a jump in measured differential stresses around 20 GPa which may be related to Q(111) crossing Q(220), but individual Q factors were not reported. However, the magnitude of the increase in strength is similar to that observed in this study. Based on these results, slip is increasingly activated with higher pressure. Since previous work has established that is more active at higher temperature, temperature and pressure seem to have a competing effect on slip system activities.
It is possible that and slip systems may have comparable activity at D″ conditions. Thus, slip system activity of ferropericlase in a slab that impinges on the CMB boundary could vary as a function of position. If this is the case, activity could increase as material moves from cold subduction areas to hot areas adjacent to LLVSPs. Shear wave splitting then should also vary along the slab due to different texture patterns in ferropericlase. In order to provide an observable that can be compared with seismic data, we simulate anisotropy associated with this slip system transition. Texture development is modeled for 100% simple shear strain with different slip system activities using the Viscoplastic Self Consistent method (VPSC), and shear wave splitting (Figure 8) is calculated using MgO single elastic constant at ~125 GPa and 3000 K from Karki et al. (1999) [46]. When the slip system is dominant, VSH > VSV splitting should be observed for waves that travel parallel to the CMB (Figure 8), similar to observations in the circum-Pacific. With increasing activity of the slip system as temperature increases towards upwelling regions adjacent to LLVSPs, shear wave anisotropy gradually weakens (Figure 8). This is consistent with seismic observations of a weakened anisotropy adjacent to the LLVSP boundary [7,9]. When and have a similar activity, shear wave anisotropy is weakest, which might be the case at LLVSP boundaries. These simulations of anisotropy associated with a slip system transition in ferropericlase are compatible with seismic observations and provide constraints on the potential contributions of ferropericlase to anisotropy in the deep Earth. The yield strength of ferropericlase is also dependent on slip system activities. In addition to the weakening effects of higher temperature, more activation slip systems could further decrease the yield strength due to an increase in the degrees of freedom for deformation to occur in the crystal (Figure 7). This may result in a strong yield strength contrast between cold and hot regions. Thus, ferropericlase potentially accommodates more strain adjacent to LLVSPs and contributes more to anisotropy or lack thereof in these regions.
4. Conclusions
In this work, we study the effects of pressure on deformation mechanisms in polycrystalline periclase. We compress samples from ambient conditions up to 50 GPa and record lattice strain and texture evolution. We find an unexpected lattice strain reordering due to a large increase of Q(111) starting at ~20 GPa. Similar behavior was previously observed in ferropericlase. We model experimental lattice strains and texture development using the EVPSC method. We find that the slip system is increasingly activated above ~20 GPa and is fully activated at ~50 GPa due to “pressure hardening” of the slip system. This can explain both texture development and lattice strain reordering. slip becomes more favored with higher pressures. Thus, pressure and temperature have a competing effect on the activity of versus slip. A transition from a high activity of to comparable activation of and in a subducted slab provides an explanation of observed VSH > VSV in the circum-Pacific with a decrease in anisotropy near the margins of LLVSPs.
Author Contributions
Experiment, F.L., S.C., and M.J.; data analysis, F.L.; writing—original draft preparation, F.L.; writing—review and editing, L.M.; supervision, L.M.
Funding
L.M. acknowledges support from the National Science Foundation through EAR-1654687. This work has been supported by the US Department of Energy, National Nuclear Security Administration, through the Capital-DOE Alliance Center (DE-NA0003858), which provided graduate student financial support for M.J. and S.C. as well as support for beamtime.
Acknowledgments
This work was performed at beamline 12.2.2 of the Advanced Light Source. Beamline 12.2.2 at the Advanced Light Source is a DOE Office of Science User Facility under contract no. DE-AC02-05CH11231. This research was partially supported by COMPRES, the Consortium for Materials Properties Research in Earth Sciences under NSF Cooperative Agreement EAR 1606856. We acknowledge Martin Kunz at ALS for technical support.
Conflicts of Interest
The authors declare no conflict of interest.
References
- Meade, C.; Silver, P.G.; Kaneshima, S. Laboratory and seismological observations of lower mantle isotropy. Geophys. Res. Lett. 1995, 22, 1293–1296. [Google Scholar] [CrossRef]
- Montagner, J.P.; Kennett, B.L.N. How to reconcile body-wave and normal-mode reference Earth models. Geophys. J. Int. 1996, 125, 229–248. [Google Scholar] [CrossRef]
- Panning, M.; Romanowicz, B. A three-dimensional radially anisotropic model of shear velocity in the whole mantle. Geophys. J. Int. 2006, 167, 361–379. [Google Scholar] [CrossRef]
- Niu, F.; Perez, A.M. Seismic anisotropy in the lower mantle: A comparison of waveform splitting of SKS and SKKS. Geophys. Res. Lett. 2004, 31. [Google Scholar] [CrossRef] [Green Version]
- Lay, T.; Williams, Q.; Garnero, E.J.; Kellogg, L.; Wysession, M.E. Seismic wave anisotropy in the D″ region and its implications. Core-Mantle Bound. Reg. 1998, 28, 299–318. [Google Scholar]
- Garnero, E.J.; Maupin, V.; Lay, T.; Fouch, M.J. Variable azimuthal anisotropy in Earth’s lowermost mantle. Science 2004, 306, 259–261. [Google Scholar] [CrossRef]
- Cottaar, S.; Romanowicz, B. Observations of changing anisotropy across the southern margin of the African LLSVP. Geophys. J. Int. 2013, 195, 1184–1195. [Google Scholar] [CrossRef] [Green Version]
- Lynner, C.; Long, M.D. Lowermost mantle anisotropy and deformation along the boundary of the African LLSVP. Geophys. Res. Lett. 2014, 41, 3447–3454. [Google Scholar] [CrossRef]
- Romanowicz, B.; Wenk, H.R. Anisotropy in the deep Earth. Phys. Earth Planet. Inter. 2017, 269, 58–90. [Google Scholar] [CrossRef]
- Merkel, S.; McNamara, A.K.; Kubo, A.; Speziale, S.; Miyagi, L.; Meng, Y.; Duffy, T.; Wenk, H.R. Deformation of (Mg, Fe) SiO3 post-perovskite and D″ anisotropy. Science 2007, 316, 1729–1732. [Google Scholar] [CrossRef]
- Miyagi, L.; Kanitpanyacharoen, W.; Kaercher, P.; Lee, K.K.; Wenk, H.R. Slip systems in MgSiO3 post-perovskite: Implications for D′′ anisotropy. Science 2010, 329, 1639–1641. [Google Scholar] [CrossRef] [PubMed]
- Nowacki, A.; Wookey, J.; Kendall, J.M. New advances in using seismic anisotropy, mineral physics and geodynamics to understand deformation in the lowermost mantle. J. Geodyn. 2011, 52, 205–228. [Google Scholar] [CrossRef] [Green Version]
- Miyagi, L.; Wenk, H.R. Texture development and slip systems in bridgmanite and bridgmanite+ ferropericlase aggregates. Phys. Chem. Miner. 2016, 43, 597–613. [Google Scholar] [CrossRef]
- Tsujino, N.; Nishihara, Y.; Yamazaki, D.; Seto, Y.; Higo, Y.; Takahashi, E. Mantle dynamics inferred from the crystallographic preferred orientation of bridgmanite. Nature 2016, 539, 81. [Google Scholar] [CrossRef] [PubMed]
- Wenk, H.R.; Speziale, S.; McNamara, A.K.; Garnero, E.J. Modeling lower mantle anisotropy development in a subducting slab. Earth Planet. Sci. Lett. 2006, 245, 302–314. [Google Scholar] [CrossRef]
- Wenk, H.R.; Cottaar, S.; Tomé, C.N.; McNamara, A.; Romanowicz, B. Deformation in the lowermost mantle: From polycrystal plasticity to seismic anisotropy. Earth Planet. Sci. Lett. 2011, 306, 33–45. [Google Scholar] [CrossRef]
- Walker, A.M.; Forte, A.M.; Wookey, J.; Nowacki, A.; Kendall, J.M. Elastic anisotropy of D″ predicted from global models of mantle flow. Geochem. Geophys. Geosyst. 2011, 12. [Google Scholar] [CrossRef]
- Cottaar, S.; Li, M.; McNamara, A.K.; Romanowicz, B.; Wenk, H.R. Synthetic seismic anisotropy models within a slab impinging on the core–mantle boundary. Geophys. J. Int. 2014, 199, 164–177. [Google Scholar] [CrossRef]
- Girard, J.; Amulele, G.; Farla, R.; Mohiuddin, A.; Karato, S.I. Shear deformation of bridgmanite and magnesiowüstite aggregates at lower mantle conditions. Science 2016, 351, 144–147. [Google Scholar] [CrossRef]
- Marquardt, H.; Speziale, S.; Reichmann, H.J.; Frost, D.J.; Schilling, F.R.; Garnero, E.J. Elastic shear anisotropy of ferropericlase in Earth’s lower mantle. Science 2009, 324, 224–226. [Google Scholar] [CrossRef]
- Finkelstein, G.J.; Jackson, J.M.; Said, A.; Alatas, A.; Leu, B.M.; Sturhahn, W.; Toellner, T.S. Strongly Anisotropic Magnesiowüstite in Earth’s Lower Mantle. J. Geophys. Res. Solid Earth 2018, 123, 4740–4750. [Google Scholar] [CrossRef]
- Amodeo, J.; Merkel, S.; Tromas, C.; Carrez, P.; Korte-Kerzel, S.; Cordier, P.; Chevalier, J. Dislocations and Plastic Deformation in MgO Crystals: A Review. Crystals 2018, 8, 240. [Google Scholar] [CrossRef]
- Copley, S.M.; Pask, J.A. Plastic deformation of MgO single crystals up to 1600 C. J. Am. Ceram. Soc. 1965, 48, 139–146. [Google Scholar] [CrossRef]
- Hulse, C.O.; Copley, S.M.; Pask, J.A. Effect of crystal orientation on plastic deformation of magnesium oxide. J. Am. Ceram. Soc. 1963, 46, 317–323. [Google Scholar] [CrossRef]
- Paterson, M.S.; Weaver, C.W. Deformation of polycrystalline MgO under pressure. J. Am. Ceram. Soc. 1970, 53, 463–471. [Google Scholar] [CrossRef]
- Sato, F.; Sumino, K. The yield strength and dynamic behavior of dislocations in MgO crystals at high temperatures. J. Mater. Sci. 1980, 15, 1625–1634. [Google Scholar] [CrossRef]
- Barthel, C. Plastiche Anisotropie von Bleisulfid und Magnesiumoxid; University of Gottingen: Gottingen, Germany, 1984. [Google Scholar]
- Appel, F.; Wielke, B. Low temperature deformation of impure MgO single crystals. Mater. Sci. Eng. 1985, 73, 97–103. [Google Scholar] [CrossRef]
- Stretton, I.; Heidelbach, F.; Mackwell, S.; Langenhorst, F. Dislocation creep of magnesiowüstite (Mg0. 8Fe0. 2O). Earth Planet. Sci. Lett. 2001, 194, 229–240. [Google Scholar] [CrossRef]
- Amodeo, J.; Carrez, P.; Cordier, P. Modelling the effect of pressure on the critical shear stress of MgO single crystals. Philos. Mag. 2012, 92, 1523–1541. [Google Scholar] [CrossRef]
- Carrez, P.; Ferré, D.; Cordier, P. Peierls–Nabarro modelling of dislocations in MgO from ambient pressure to 100 GPa. Model. Simul. Mater. Sci. Eng. 2009, 17, 035010. [Google Scholar] [CrossRef]
- Girard, J.; Chen, J.; Raterron, P. Deformation of periclase single crystals at high pressure and temperature: Quantification of the effect of pressure on slip-system activities. J. Appl. Phys. 2012, 111, 112607. [Google Scholar] [CrossRef]
- Lin, F.; Hilairet, N.; Raterron, P.; Addad, A.; Immoor, J.; Marquardt, H.; Tomé, C.N.; Miyagi, L.; Merkel, S. Elasto-viscoplastic self consistent modeling of the ambient temperature plastic behavior of periclase deformed up to 5.4 GPa. J. Appl. Phys. 2017, 122, 205902. [Google Scholar] [CrossRef]
- Merkel, S.; Wenk, H.R.; Shu, J.; Shen, G.; Gillet, P.; Mao, H.K.; Hemley, R.J. Deformation of polycrystalline MgO at pressures of the lower mantle. J. Geophys. Res. Solid Earth 2002, 107, ECV-3. [Google Scholar] [CrossRef]
- Lin, J.F.; Wenk, H.R.; Voltolini, M.; Speziale, S.; Shu, J.; Duffy, T.S. Deformation of lower-mantle ferropericlase (Mg, Fe) O across the electronic spin transition. Phys. Chem. Miner. 2009, 36, 585. [Google Scholar] [CrossRef]
- Marquardt, H.; Miyagi, L. Slab stagnation in the shallow lower mantle linked to an increase in mantle viscosity. Nat. Geosci. 2015, 8, 311. [Google Scholar] [CrossRef]
- Immoor, J.; Marquardt, H.; Miyagi, L.; Lin, F.; Speziale, S.; Merkel, S.; Buchen, J.; Kurnosov, A.; Liermann, H.P. Evidence for {100}<011> slip in ferropericlase in Earth’s lower mantle from high-pressure/high-temperature experiments. Earth Planet. Sci. Lett. 2018, 489, 251–257. [Google Scholar] [CrossRef]
- Merkel, S.; Yagi, T. X-ray transparent gasket for diamond anvil cell high pressure experiments. Rev. Sci. Instrum. 2005, 76, 046109. [Google Scholar] [CrossRef]
- Singh, A.K. The lattice strains in a specimen (cubic system) compressed nonhydrostatically in an opposed anvil device. J. Appl. Phys. 1993, 73, 4278–4286. [Google Scholar] [CrossRef] [Green Version]
- Zha, C.S.; Mao, H.K.; Hemley, R.J. Elasticity of MgO and a primary pressure scale to 55 GPa. Proc. Natl. Acad. Sci. USA 2000, 97, 13494–13499. [Google Scholar] [CrossRef] [Green Version]
- Lutterotti, L.; Matthies, S.; Wenk, H.R.; Schultz, A.S.; Richardson, J.W., Jr. Combined texture and structure analysis of deformed limestone from time-of-flight neutron diffraction spectra. J. Appl. Phys. 1997, 81, 594–600. [Google Scholar] [CrossRef]
- Wenk, H.R.; Lutterotti, L.; Kaercher, P.; Kanitpanyacharoen, W.; Miyagi, L.; Vasin, R. Rietveld texture analysis from synchrotron diffraction images. II. Complex multiphase materials and diamond anvil cell experiments. Powder Diffr. 2014, 29, 220–232. [Google Scholar] [CrossRef] [Green Version]
- Wang, H.; Wu, P.D.; Tomé, C.N.; Huang, Y. A finite strain elastic–viscoplastic self-consistent model for polycrystalline materials. J. Mech. Phys. Solids 2010, 58, 594–612. [Google Scholar] [CrossRef]
- Amodeo, J.; Dancette, S.; Delannay, L. Atomistically-informed crystal plasticity in MgO polycrystals under pressure. Int. J. Plast. 2016, 82, 177–191. [Google Scholar] [CrossRef]
- Singh, A.K.; Liermann, H.P.; Saxena, S.K. Strength of magnesium oxide under high pressure: Evidence for the grain-size dependence. Solid State Commun. 2004, 132, 795–798. [Google Scholar] [CrossRef]
- Karki, B.B.; Wentzcovitch, R.D.; De Gironcoli, S.; Baroni, S. First-principles determination of elastic anisotropy and wave velocities of MgO at lower mantle conditions. Science 1999, 286, 1705–1707. [Google Scholar] [CrossRef]
Figure 1.
An unrolled diffraction image and MAUD fit of the MgO sample. Black arrow indicates the compression direction. Sinusoidal distortion of diffraction line indicates lattice strain. Systematic intensity variation along azimuth indicates texture.
Figure 1.
An unrolled diffraction image and MAUD fit of the MgO sample. Black arrow indicates the compression direction. Sinusoidal distortion of diffraction line indicates lattice strain. Systematic intensity variation along azimuth indicates texture.

Figure 2.
Experimental lattice strains of {200}, {220}, and {111} planes. Rectangles represent data in Run 1; circles represent data in Run 2.
Figure 2.
Experimental lattice strains of {200}, {220}, and {111} planes. Rectangles represent data in Run 1; circles represent data in Run 2.

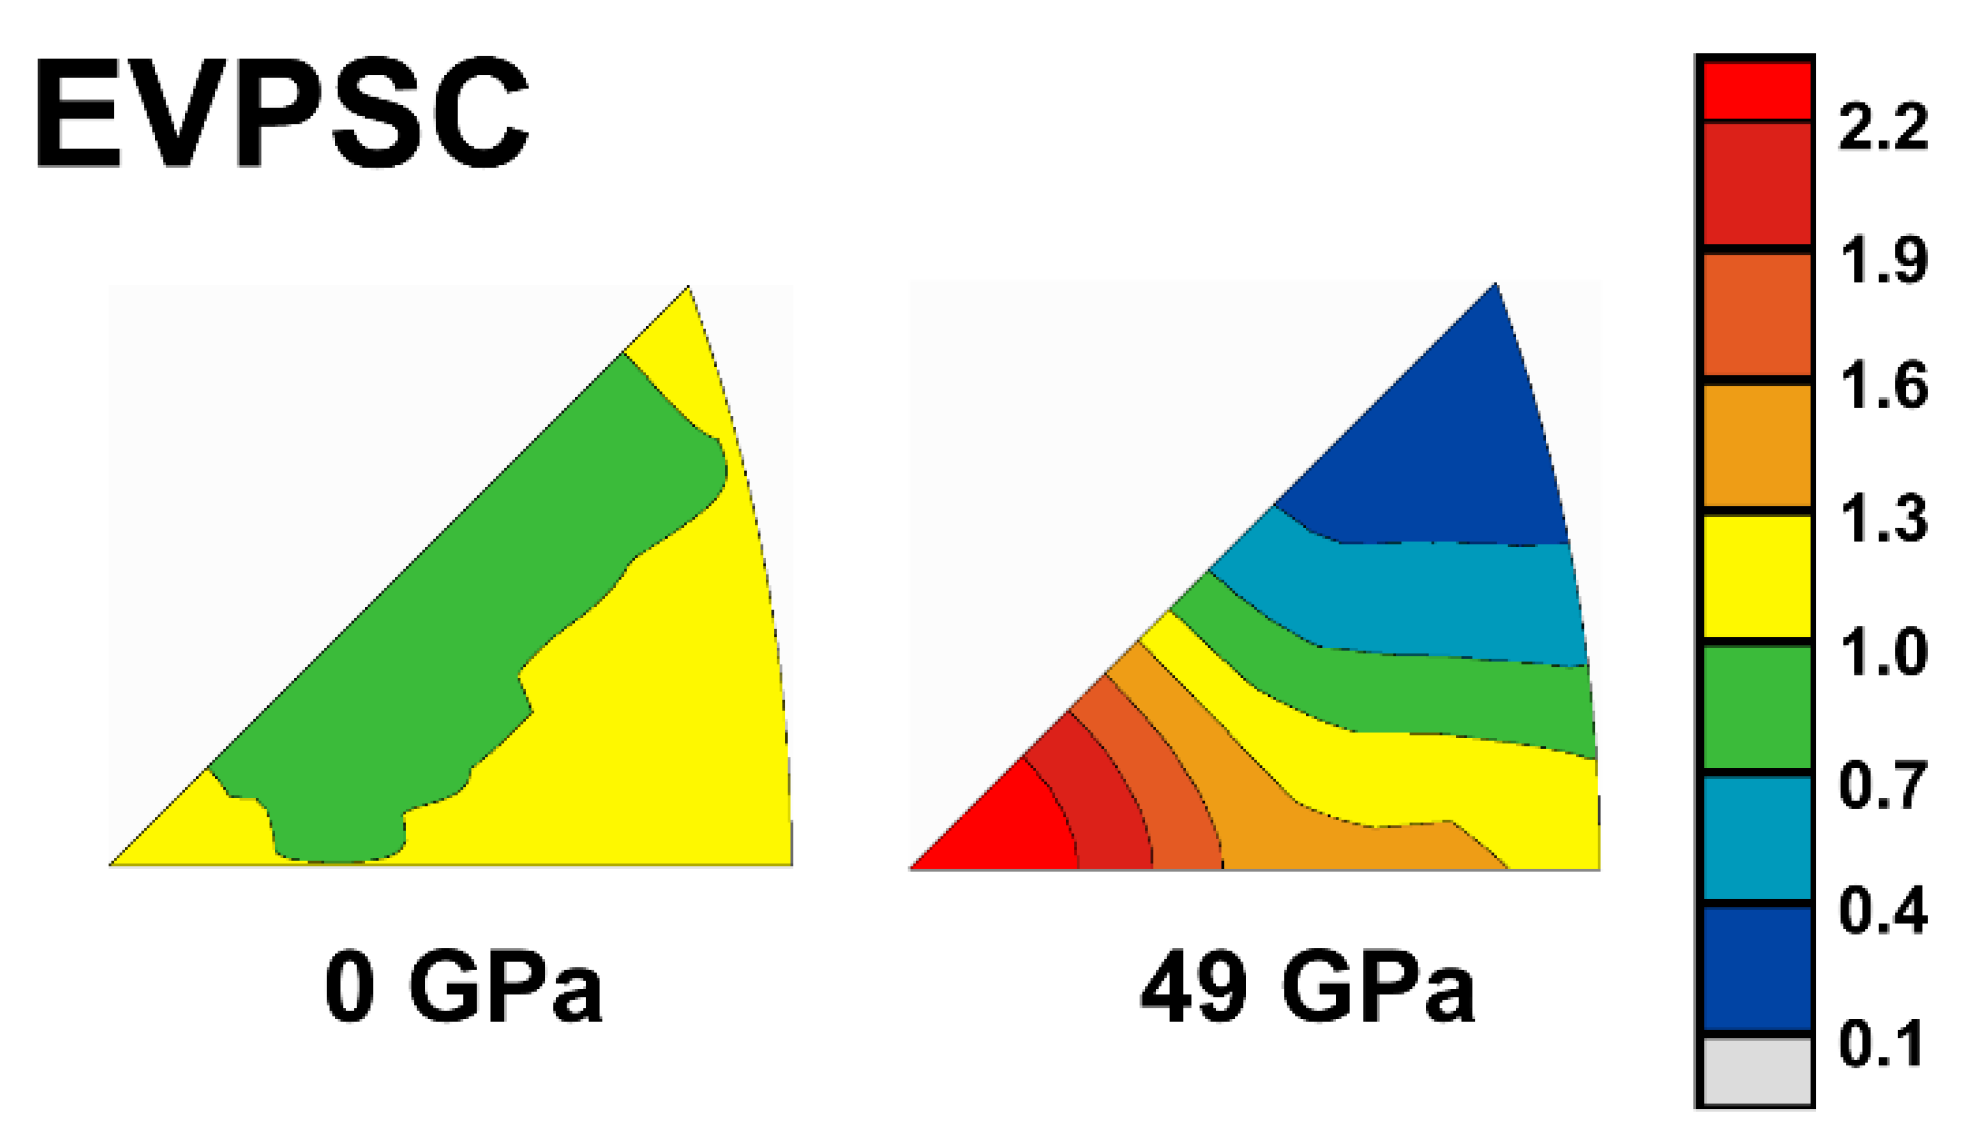
Figure 3.
Inverse Pole Figures (IPFs) of the compression direction for periclase showing texture evolution with pressure. Scale bar is given in multiples of random distribution (m.r.d.).
Figure 3.
Inverse Pole Figures (IPFs) of the compression direction for periclase showing texture evolution with pressure. Scale bar is given in multiples of random distribution (m.r.d.).

Figure 4.
Lattice strains in the EVPSC simulation. Above 20 GPa, Q(111) gradually surpasses Q(220) due to “pressure hardening” of slip system.
Figure 4.
Lattice strains in the EVPSC simulation. Above 20 GPa, Q(111) gradually surpasses Q(220) due to “pressure hardening” of slip system.

Figure 5.
Texture evolution in the EVPSC simulation.

Figure 6.
Activity of slip systems in EVPSC simulation. and slip systems are activated with a ratio of 70:30 and gradually reach 100:0 at ~50 GPa.
Figure 6.
Activity of slip systems in EVPSC simulation. and slip systems are activated with a ratio of 70:30 and gradually reach 100:0 at ~50 GPa.

Figure 7.
Flow stress of experiment Run 1 calculated using Equation (3) and the EVPSC simulation. Based on the simulation result, the flow stress increases ~25% due to ‘pressure hardening’ of slip system.
Figure 7.
Flow stress of experiment Run 1 calculated using Equation (3) and the EVPSC simulation. Based on the simulation result, the flow stress increases ~25% due to ‘pressure hardening’ of slip system.

Figure 8.
(a) Simplified scheme of a slab sheared along CMB. The greyscale gradient arrow indicates increasing {100} activity towards LLVSP. (b) Modeled shear wave anisotropy under 100% simple shear with different slip system activities. The CMB is horizontal and simple shear is top to the left, parallel to CMB. The black lines indicate the fast shear wave polarization direction. The anisotropy weakens towards the LLVSP due to increasing activity of the {100} system.


Table 1.
CRSSs value used in EVPSC. Values at 0 GPa are the initial CRSSs. A stress exponent of 8 is used for all slip systems.
Table 1.
CRSSs value used in EVPSC. Values at 0 GPa are the initial CRSSs. A stress exponent of 8 is used for all slip systems.
| Pressure | 0 GPa | 0–20 GPa | 20–50 GPa | |
|---|---|---|---|---|
| Slip System | ||||
| 1.2 GPa | 1.2 GPa | 1.2 GPa | ||
| 2.1 GPa | d(CRSS)/dP = 0.01 | d(CRSS)/dP = 0.1 | ||
© 2019 by the authors. Licensee MDPI, Basel, Switzerland. This article is an open access article distributed under the terms and conditions of the Creative Commons Attribution (CC BY) license (http://creativecommons.org/licenses/by/4.0/).
Share and Cite
MDPI and ACS Style
Lin, F.; Couper, S.; Jugle, M.; Miyagi, L. Competing Deformation Mechanisms in Periclase: Implications for Lower Mantle Anisotropy. Minerals 2019, 9, 650. https://doi.org/10.3390/min9110650
AMA Style
Lin F, Couper S, Jugle M, Miyagi L. Competing Deformation Mechanisms in Periclase: Implications for Lower Mantle Anisotropy. Minerals. 2019; 9(11):650. https://doi.org/10.3390/min9110650
Chicago/Turabian StyleLin, Feng, Samantha Couper, Mike Jugle, and Lowell Miyagi. 2019. "Competing Deformation Mechanisms in Periclase: Implications for Lower Mantle Anisotropy" Minerals 9, no. 11: 650. https://doi.org/10.3390/min9110650
Note that from the first issue of 2016, this journal uses article numbers instead of page numbers. See further details here.