Article

Geochemical Fractions of the Agricultural Soils of Southern Poland and the Assessment of the Potentially Harmful Element Mobility

by
Agnieszka Gruszecka-Kosowska
1,*,
Agnieszka Baran
2,
Katarzyna Mazur-Kajta
3 and
Tomasz Czech
2
1
Faculty of Geology, Geophysics, and Environmental Protection, Department of Environmental Protection, AGH University of Science and Technology, Al. Mickiewicza 30, 30-059 Kraków, Poland
2
Faculty of Agriculture and Economics, Department of Agricultural and Environmental Chemistry, University of Agriculture in Kraków, Al. A. Mickiewicza 21, 31-120 Kraków, Poland
3
Faculty of Economics and Management, Department of International Economic Relations, Opole University of Technology, ul. Prószkowska 76, 45-758 Opole, Poland
*
Author to whom correspondence should be addressed.
Minerals 2019, 9(11), 674; https://doi.org/10.3390/min9110674
Submission received: 24 September 2019 / Revised: 24 October 2019 / Accepted: 29 October 2019 / Published: 31 October 2019
(This article belongs to the Special Issue Trace Element Biogeochemistry)

Abstract

:
Surface samples (0–25 cm each) of agricultural soils were investigated in five Regions (voivodeships) of southern Poland. The mean Potentially Harmful Element (PHE) pseudototal content ranges were as follows (mg/kg): As 5.19–10.9, Cd 0.34–1.56, Co 1.92–6.70, Cr 9.05–25.7, Cu 8.74–69.4, Hg 0.001–0.08, Ni 3.93–19.9, Pb 20.3–183, Sb 0.80–1.42, Tl 0.04–0.17, and Zn 61.3–422. The PHE availability depended on pH, the organic carbon (Corg) content, and the pseudototal PHE content in soils. Exchangeable and acid soluble PHE contents (BCRF1) determined in the Community Bureau of Reference (BCR) three-step sequential extraction procedure decreased in this order: Cd > Zn > Co > Ni = Sb > Cu > Tl > As > Cr = Pb. Actually available PHE contents in pore water (0.01 mol/dm3 CaCl2) ranged as follows: Cd 0.81–17%, Cr 0–0.25%, Cu 0.01–2.31%, Ni 0.16–2%, Pb 0.2–0.49%, and Zn 0.25–2.12%. The potential soluble total content of PHEs in pore water (0.05 mol/dm3 Na2EDTA) ranged as follows: Cd 27–91%, Cr 0.7–7.1%, Cu 6.7–98%, Ni 3.6–41%, Pb 15–41%, and Zn 3–34%. The mobility factor (MF) values indicated Cd (31.6%) and Zn (21.0%) as the most mobile elements in soil. Other PHEs followed the order of Co > Ni > Tl > As > Sb > Cu > Cr > Pb, with the MF values <10%. The risk assessment code (RAC) values revealed a very high ecological risk of Cd and Zn in the Podkarpackie Region and a high ecological risk of Cd in the Regions of Opolskie, Śląskie, Małopolskie, and Podkarpackie, and the same of Zn in the Opolskie and Śląskie. The modified risk assessment code (mRAC) index pointed a very high potential of adverse effects in soils in the Podkarpackie and a medium potential in the Opolskie, Śląskie, Małopolskie, and Świętokrzyskie. The potential adverse effect risk, described by the individual contamination factor (ICF) factor, was the following in the Regions, in the decreasing order: Cd > Pb > Sb > Zn > Co > Cu > Ni > Tl > As > Cr, and the same as described by the global contamination factor (GCF) values: Opolskie > Podkarpackie > Świętokrzyskie > Śląskie > Małopolskie.

1. Introduction

Potentially harmful elements (PHEs) can pose a threat to living organisms due to their toxic and carcinogenic effects [1]. They are still considered to be some of the most hazardous groups of inorganic contaminants in the environment. Thirteen trace metals and metalloids are recognised to be priority pollutants [2], i.e., Ag, As, Be, Cd, Cr, Cu, Hg, Ni, Pb, Sb, Se, Tl, and Zn. However, certain trace elements are beneficial for plant growth (for example Zn, Cu, Cr, and Co) or animal nutrition (for example Co, Cr, and Se). Additionally, humans require certain trace elements. Those elements are generally divided into macro- and microelements [3]. Other metals, e.g., Pb and Cd, are considered to be harmful to humans, even in low concentrations [4].
PHEs can occur in soils due to natural phenomena, e.g., weathering of the parent rock or metalliferous ores exposing metallic minerals. The most significant anthropogenic sources of PHE contamination include agriculture (fertilizers, animal manure, or pesticides), metallurgy (mining and smelting), energy production (leaded gasoline, battery production, or power generation), sewage sludge, and waste disposal [5,6]. Consequently, the contamination of agricultural soils has become a worldwide problem [4,7,8,9,10,11,12,13,14,15,16]. Similarly, the areas of southern Poland, being the objects of research, struggle with the problem of environmental pollution especially caused by coal, Zn, Pb, and Cu ores mining and processing, urban agglomerations, and intense traffic as was stated before by Gruszecka-Kosowska et al. [17].
Making references to the total PHE concentrations is the most common method of characterizing environmental pollution. For example, the United States Environmental Protection Agency (USEPA) human health risk assessment (HHRA) methodology is based on that approach. One has to have in mind that the total content of elements refers to concentrations of analyzed elements determined after a complete dissolution of the solid matrix with a combination of strong acids i.e., hydrofluoric acid (HF) as well as alkali solutions [18]. However, due to safety precautions HF procedure is not recommended for routine analysis. As an alternative to this procedure is pseudo-total digestion by aqua regia [19]. Although commonly used, aqua regia is often rated as a less suitable solvent for the estimation of the total amount of heavy metals in an environmental matrix [18]. Nevertheless, even high total or pseudototal concentrations of heavy metals do not always pose a threat to the environment. In environmental studies, the mobile portion of the element content gives more reliable information as to potential adverse effect risks for the environment and living organisms, while extraction procedures provide information on mobile and available portions of PHEs.
There are many definitions of contaminant bioavailability in the literature, and the debate on adopting precise definitions continues. It is considered as the fraction of the total contaminant in the interstitial water and soil particles that is available to the receptor organism [20]. Nevertheless, based on the investigations conducted by many scientists in the last 20 years, emphasizing that bioavailability should be considered as a dynamic process, strongly dependent on the type of organism, type of exposure, and metal speciation, as well as soil properties, three separate steps including the descriptions of bioavailability have evolved [21,22,23]. The first step represents the availability of PHEs in soils as a physico-chemically controlled desorption process, and the step is called environmental availability. The second step describes a physiologically controlled uptake process of PHEs by organisms and it is called environmental bioavailability. The third step is a physiologically induced effect, or accumulation of PHEs in living organisms, called toxicological bioavailability. Environmental availability, which is the object of the present study, depends on such soil properties, as e.g., texture, the contents of organic matter, clay minerals, or oxides, and soil pH, as well as the total PHE content and PHE types. The period of PHE contact with the soil matrix is also essential. Besides dissolved free ions and molecules, the fraction in question may also include an amount of PHEs, combined either with dissolved organic matter (humic and fulvic acids) or inorganic anions (Cl, OH, SO42−, or HCO3), especially under slightly acidic and alkaline conditions [23].
There are many measurement methods applied to determine bioavailable fractions. Several groups of chemical extraction procedures can be distinguished. Depending on the number of extraction steps, single or sequential extraction procedures are identified [19,20,24,25,26]. Depending on the type and solution strength, the following procedures are distinguished: acid extraction, extraction in chelating agents, and in buffered or unbuffered salt solutions [27]. The actual PHE quantities collected by plants from soil can be chemically measured via exchange by unbuffered salt mechanism, using 0.01/0.0025/0.001 mol/dm3 CaCl2, 1/0.1 mol/dm3 NaNO3, or 1 mol/dm3 NH4NO3. The results of the extractions mentioned before reflect the actually available element contents in pore water. Those extraction procedures are suitable for highly mobile elements, i.e., Cd, Ni, Zn. To measure the potentially available PHE contents, the methods of desorption by chelating agent extraction in 0.05 mol/dm3 EDTA or 0.005 mol/dm3 DTPA solutions, as well as extractions based on the exchange, with the application of strong acid in 0.43 mol/dm3 HNO3 or 0.1/0.5 mol/dm3 HCl solutions are applied. Those methods determine the potential soluble total element concentration in pore water, in respect of Cd, Cr, Cu, Ni, Pb, and Zn [23]. Moreover, well developed and standardized bioavailability measurement methods are crucial for measurement results, as they lead to ecological and human health risk assessment of potential exposure to the PHE transfers in the soil-crop-human chain [23]. Certain soil leaching procedures described in the above mentioned references have been standardized or are considered to be standardized in various European countries for the soil remediation purposes, based on risk reduction [20,27].
As southern Poland is known for its productive soils [28], thus the previous research of Gruszecka-Kosowska et al. [17] was focused on the pseudototal PHE concentrations in the arable soils of southern Poland. However, as the knowledge about PHE bioavailable forms and their contents in the arable soils seems to be even more important in the context of PHE migration in the food chain. For that reason, the investigations of PHE environmental availability were the goal of the current studies. The investigations were the part of the larger project that was carried out on arable lands in five Regions of southern Poland where edible plants (i.e., vegetables, fruit, and cereals) were cultivated [17]. Detailed objectives of the current research included the following: (1) determination of the mobility using exchangeable and acid soluble (BCRF1) contents determined in the Community Bureau of Reference (BCR) three-step sequential extraction procedure, actually available contents in pore water using 0.01 mol/dm3 CaCl2, and potentially available contents using 0.05 mol/dm3 Na2EDTA of selected PHEs (As, Cd, Co, Cr, Cu, Hg, Ni, Pb, Sb, Se, Tl, and Zn) in reference to the pseudototal element content in soils [17], (2) calculation of single and complex geochemical fractionation indices, and (3) determination of potential contamination of investigated agricultural soils by the selected PHEs in the respective Regions.

2. Materials and Methods
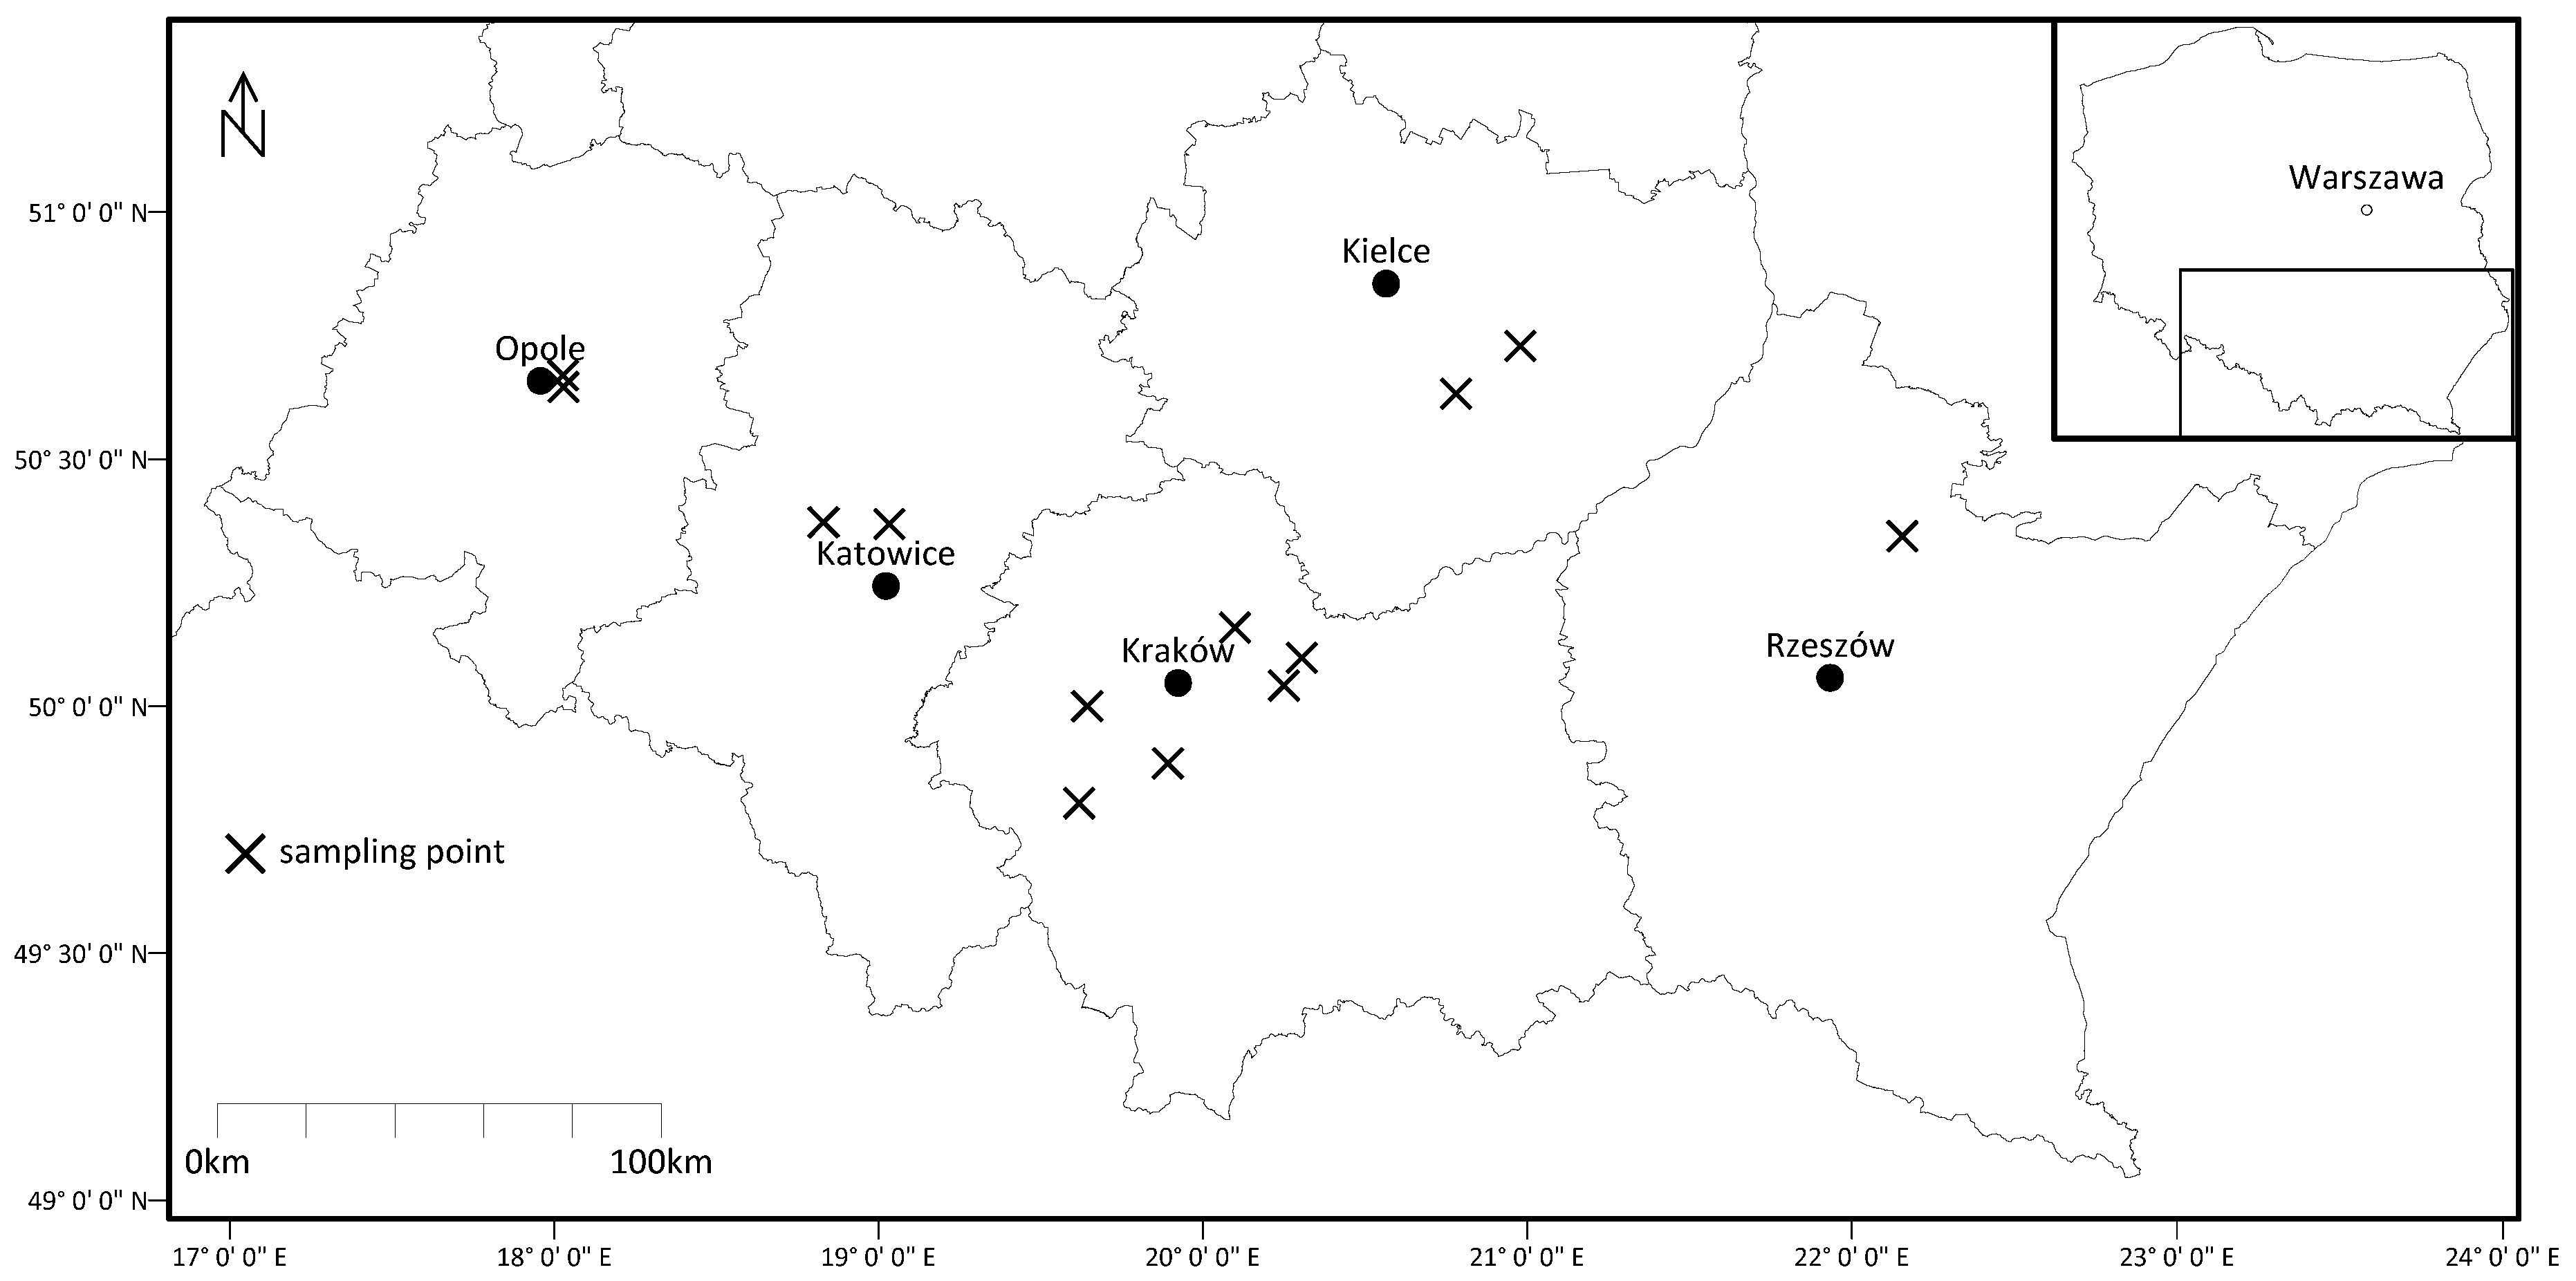
2.1. Study Area

The study area consisted of five Regions (voivodeships) located in southern Poland (Figure 1), from where 30 samples of agricultural soil from the depth of 0–25 cm each were collected as follows: four soil samples from the Opolskie, four samples from the Śląskie, 12 samples from the Małopolskie, six samples from the Świętokrzyskie, and four samples from the Podkarpackie. The soil sampling locations were chosen in similar places where edible plants analyzed in further investigations were cultivated [17].

2.2. Soil Sampling and Preparation

As the current research was part of a larger project, the procedure of soil sampling and preparation was described in detail previously [17]. The soil samples were taken only in the arable soils where edible plants i.e., vegetables, fruits, and cereals, were cultivated and analyzed in the further investigations. Briefly, a total of 30 soil samples were collected in 2015 and 2016. Each soil sample (mass about 1 kg each) was collected from 1 × 1 m square and consisted of five subsamples taken from the square corners and the diagonal intersection from the depth of 0–25 cm. Soil samples and their duplicates were air-dried at the room temperature (25 °C) and homogenized. Sample masses were reduced and were passed through a 2 mm sieve to remove plant parts and gravel before further analysis.

2.3. Sample Analyses

Active (pHH2O) and potential (pHKCl) pH values were determined on duplicate soil samples, as described previously [17]. The organic carbon (Corg) content was determined, using the Tiurin method.
Investigated PHEs were extracted from 1 g of each soil sample during mineralization (DigiPREP—SCP Science Utilities, version 3.0, Quebec, QC, Canada) with aqua regia (HNO3 and HCl at 3:1 v/v) for 2 h in the temperature 130 °C and concentrations of As, Cd, Co, Cr, Cu, Hg, Ni, Pb, Sb, Se, Tl, and Zn were determined by inductively coupled plasma-mass spectrometry ICP-MS (ELAN 6100; Perkin Elmer, Waltham, MA, USA), according to the USEPA 6020B [29] and PN-EN ISO 17294-2:2006 [30] Standard protocols.
The binding forms of PHEs were determined by the BCR sequential extraction procedure [31]. Briefly, 1 g of each soil sample in the BCRF1 step, H2O soluble and acid forms of PHEs (metals on exchangeable positions and bound with carbonates) were extracted with 0.11 mol/dm3 CH3COOH, pH = 2.85; in the BCRF2 step, reducible forms of PHEs (metals bound with oxides and hydro-oxides of Fe and Mn) were extracted with 0.1 mol/dm3 NH2OH·HCl, pH = 2; and in the BCRF3 step, oxidizable forms of PHEs (metals bound with sulphides and organic matter) were extracted with (1) 2 × 30% H2O2; 1 h, 85 °C and (2) 1 mol/dm3 CH3COONH4, pH = 2, respectively. Content of PHEs in residual fraction (BCRF4) was determined in the residues remaining after BCRF3 step at the same aqua regia digestion. For the determination of the PHE mobility their contents in the BCRF1 fraction were used in further analysis.
Actually available PHE contents in pore water were extracted with 20 cm3 of 0.01 mol/dm3 CaCl2 and potential soluble total PHE concentration in pore water were extracted with 0.05 mol/dm3 Na2EDTA from 2 g of each soil sample, followed by shaking for 2 h [27,32,33]. After extraction samples were centrifuged at 3000 rpm for 10 min, and supernatants were separated from precipitate through a filter. The contents of bioavailable contents of PHEs were determined, using the ICP-OES (Inductively Coupled Plasma Optical Emission Spectroscopy) method on an Optima 7300 DV (Perkin-Elmer).

2.4. Quality Control

The quality control was previously described in detail in Gruszecka-Kosowska et al. [17]. Soil analyses were performed under the standard certified analytical quality control procedure according to PN-EN ISO 17294–1:2007 [34] and were also measured, using inductively coupled plasma-optical emission spectroscopy ICP-OES (OPTIMA 7300DV; Perkin Elmer, Waltham, MA, USA), according to the USEPA 6020B [29] and PN-EN ISO 11885:2009 [35] protocols. The recovery rate from analyzed at the same time certified reference material CRM (soil ERM®-CC141) was between 81% and 112% for the majority of the PHEs analyzed, except for As, Co, Cr, and Ni. In that method, reagent blanks and duplicates of each of the three samples were used for quality assurance and quality control. All the reagents used in the laboratory analysis were analytically pure. The results of the sample examinations were within the allowable error change values. Analytical bias was statistically insignificant (p = 0.05). ICP-MS and ICP-OES system precision parameters were satisfactory, verified by six different solution injections. Rh was used as an internal standard. Element correction equations were used for each element to minimize the impact of interferences in the ICP-MS analysis.
The limit of detection (LOD) values of the investigated PHEs were as follows: As < 0.001 mg/dm3, Cd < 0.003 mg/dm3, Co < 0.0002 mg/dm3, Cr < 0.005 mg/dm3, Cu < 0.001 mg/dm3, Hg < 0.0001 mg/dm3, Ni < 0.001 mg/dm3, Pb < 0.0001 mg/dm3, Sb < 0.0002 mg/dm3, Se < 0.01 mg/dm3, Tl < 0.0001 mg/dm3, and Zn < 0.001 mg/dm3.
Recovery compares the total metal content with the sequential extraction steps, according to Equation (1) [36,37]
Recovery = ( i = 1 n sequential   extraction   steps pseudototal   concentration ) × 100 %
The recovery values ranged as follows: As 87–156%, Cd 92–151%, Co 69–156%, Cr 62–151%, Cu 89–107%, Ni 68–119%, Pb 90–131%, Sb 90–129%, Tl 84–147%, and Zn 79–127%.

2.5. Statistical Analysis

The results were verified statistically, using the Statistica 12 software package. The differences between the means were analyzed by the ANOVA test at a significance level of 0.05. Principal Component Analysis (PCA) was preformed to establish the relationship and behavior of PHEs in soils.

2.6. Soil Quality

The permissible levels of metals and metalloids, determined in the Regulation of the Polish Minister of the Environment on how to conduct pollution assessment on the surface of the earth of 1 September 2016 [38], were used to indicate potential contamination of agricultural soils by the investigated PHEs in the respective Regions of southern Poland. Threshold values were chosen, depending on the clay content (fraction < 0.02 mm) in soil, described as a subgroup of ground, from II-1 to II-3. Since not all of PHEs were specified in the Polish law, the Canadian soil quality guidelines for the protection of environmental and human health [39] were also applied.

2.7. Fractionation Indices

The mobility factor (MF), the risk assessment code (mRAC), and the individual contamination factor (ICF) were applied as single fractionation indices in our research. It is commonly known that the total or pseudototal element concentration is not entirely available to biota. Thus, when determining soil contamination, it is better to take into consideration mobile and available contents of particular PHEs that may pose a real threat to the living organisms. Therefore, we focused in our study on the fractionation indices more than on the indices based on the pseudototal concentration of individual PHEs. The mobility factor (MF), the risk assessment code (RAC), and the global contamination factor (GCF), selected from among single fractionation indices, were applied in our investigations. The modified risk assessment code (mRAC) index and the global contamination factor (GCF), as selected from the complex fractionation indices, were applied. A brief description of the calculation of the geochemical fractionation indices applied in the study is given in Table 1.

3. Results and Discussion

3.1. Physico-Chemical Characteristics of Soils
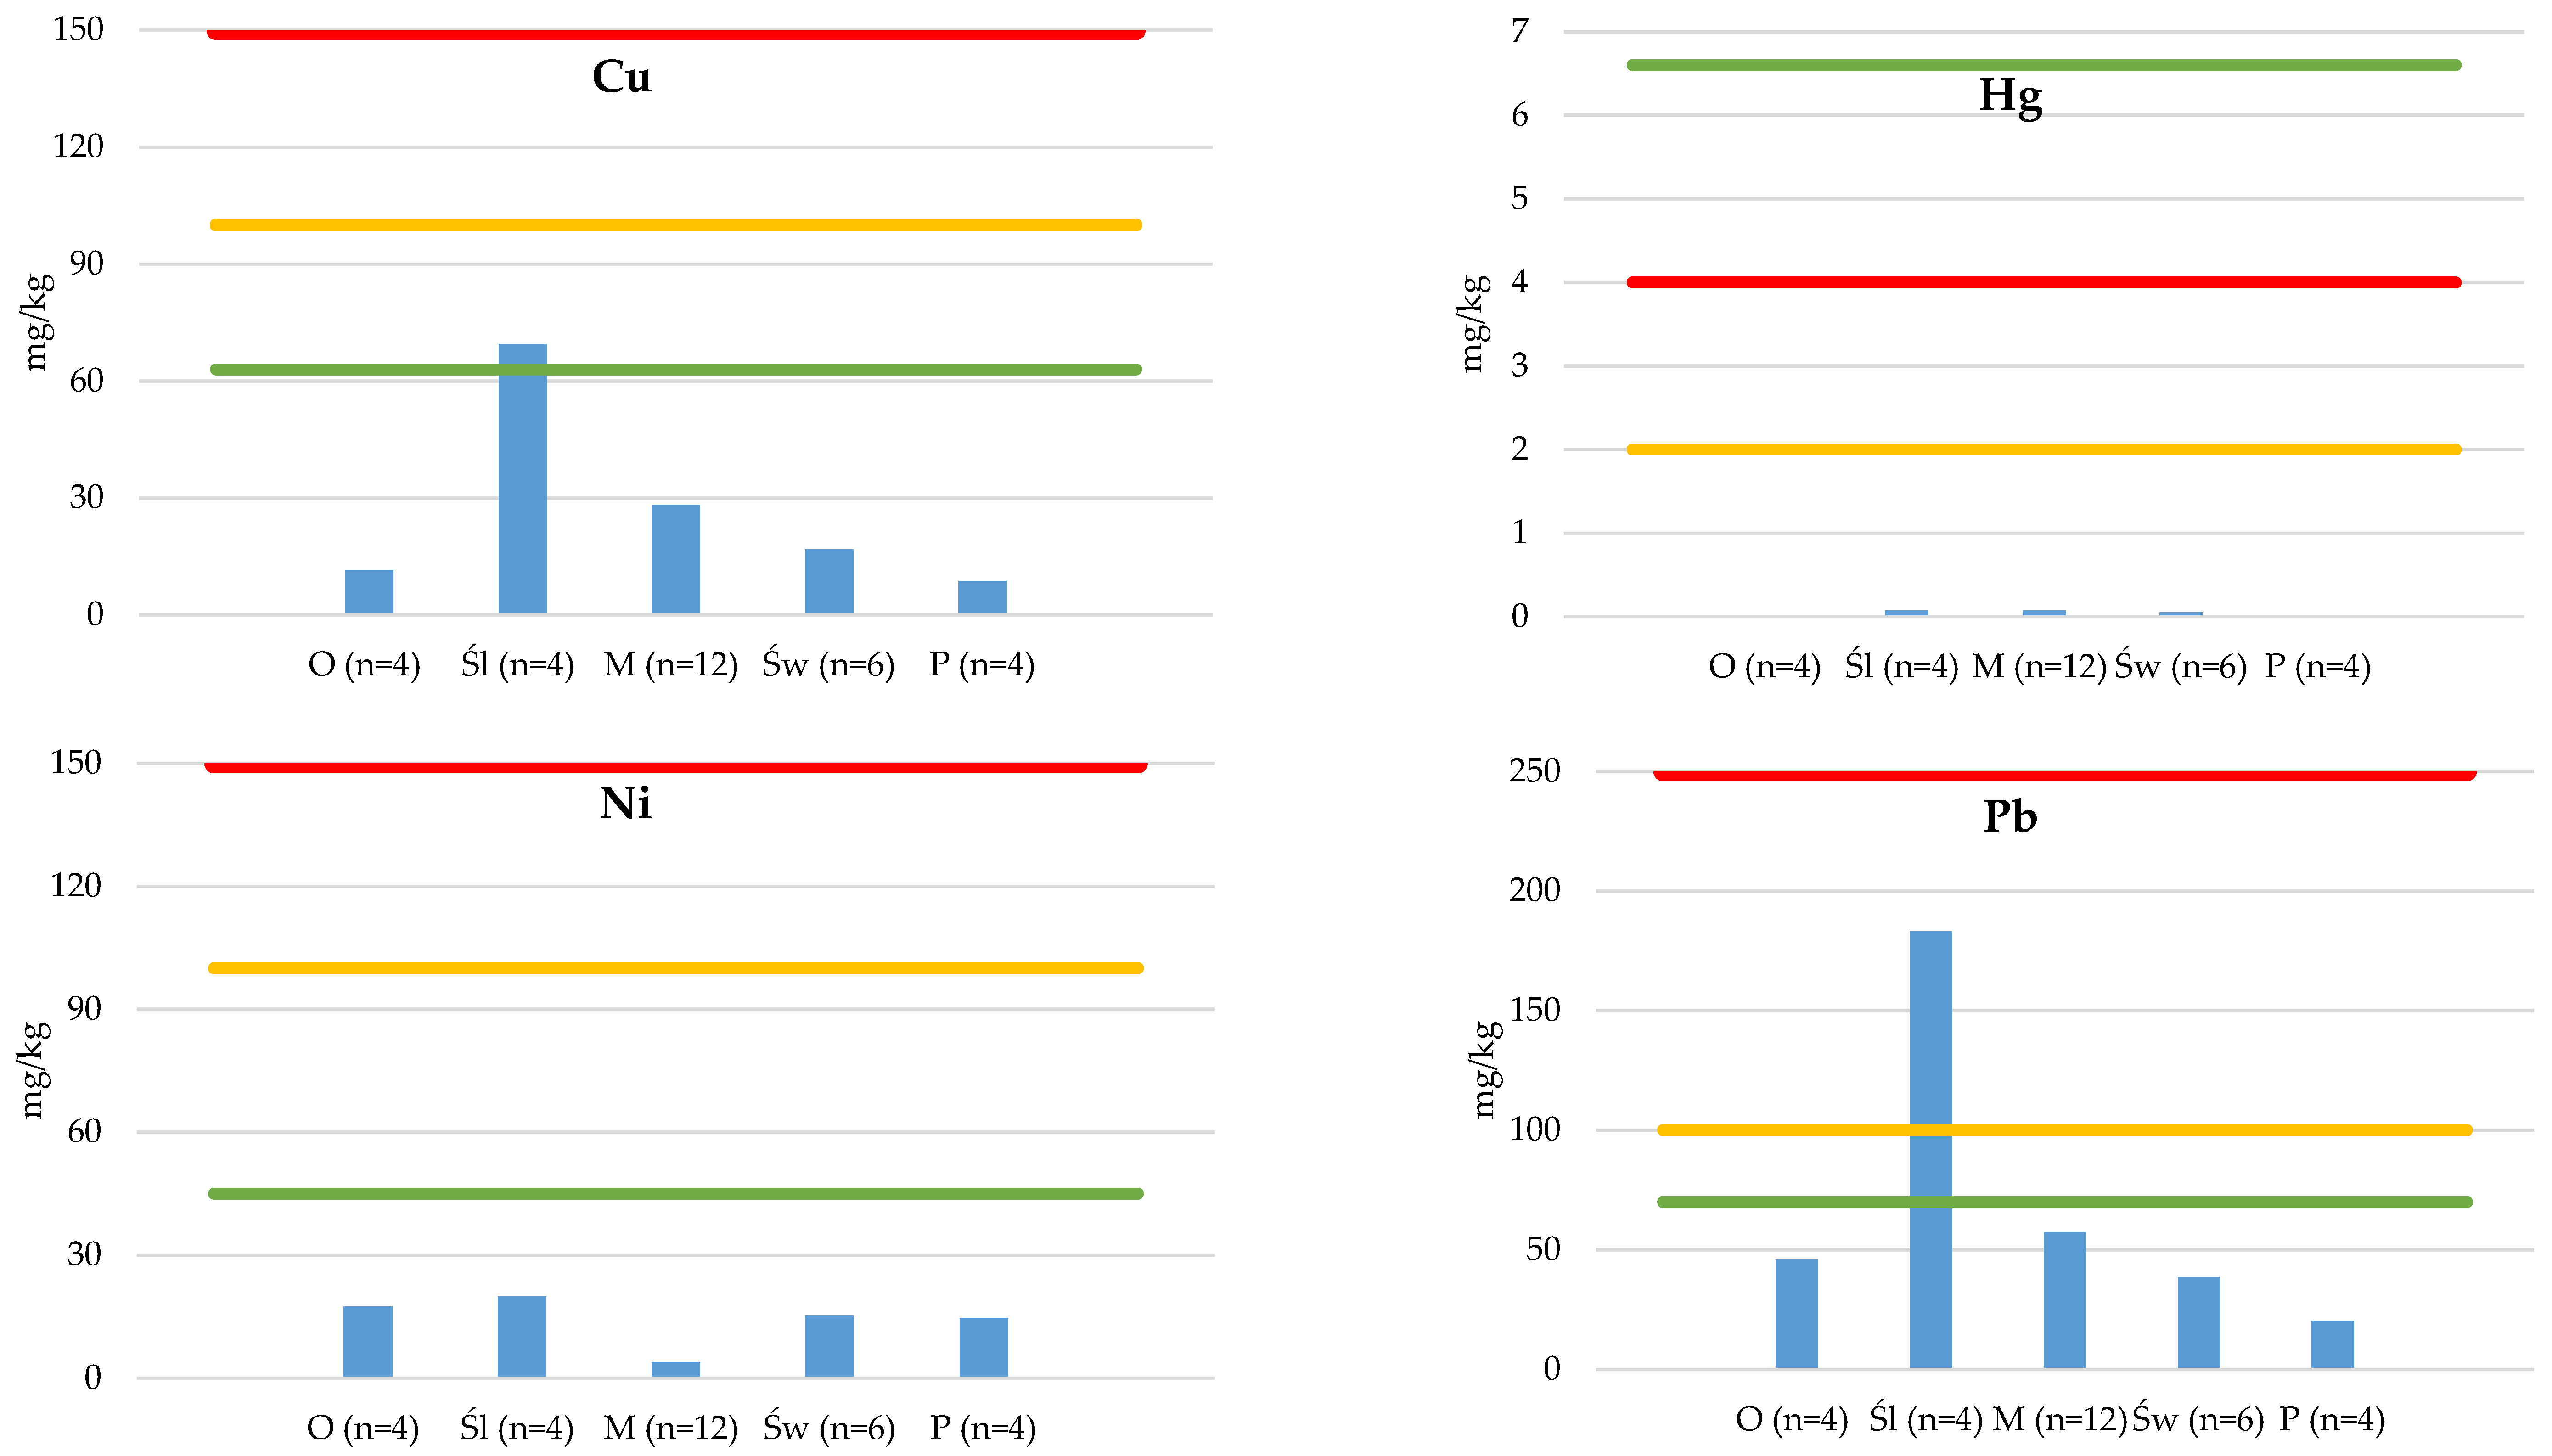
As described previously [17] in southern Poland, where investigations were conducted, soils are generally classified as cambisols, podzols, and luvisols according to the World Reference Base for Soil Resources (IUSS Working Group 2015). The measured pH values classified the investigated agricultural soil samples as neutral in the Opolskie (pHH2O range: 6.8–7.2, mean: 7.0) and Śląskie (pHH2O range: 6.8–8.3, mean: 7.0) and slightly acidic in the Małopolskie (pHH2O range: 4.8–7.9, mean: 6.50), Świętokrzyskie (pHH2O range: 5.4–7.2, mean: 6.4), and Podkarpackie (pHH2O range: 5.6–6.8, mean: 6.2) Regions. The content of Corg (%) in investigated soil samples ranged as follows, with mean values in parentheses: Opolskie 1.12–3.46 (2.24), Śląskie 1.39–2.13 (1.83), Małopolskie 0.60–3.48 (1.56), Świętokrzyskie 0.62–1.37 (1.02), and Podkarpackie 1.26–1.98 (1.57). The clay content (fraction < 0.02 mm, in %) were taken from the Main Inspectorate of Environmental Protection [49] and ranged as follows, with mean values in parentheses: Opolskie 7.00–23.0 (15.0), Śląskie 28.0–50.0 (33.5), Małopolskie 26.0–42.0 (37.3), Świętokrzyskie 8.00–12.0 (10.7), and Podkarpackie 9.00–26.0 (17.5). Basic statistical PHE characteristics in the investigated regions is given on Figure 2. The Se content in all soil samples of each Region was < LOD. Minimum concentrations were also < LOD for Cd, Hg, and Tl in the Świętokrzyskie, for Cd and Hg in the Małopolskie and Podkarpackie, and for Hg in the Opolskie. As for the mean pseudototal content, the decreasing orders of single PHEs were as follows: As: Śląskie > Podkarpackie > Świętokrzyskie > Opolskie > Małopolskie; Cd: Śląskie > Małopolskie > Świętokrzyskie > Opolskie > Podkarpackie; Co: Małopolskie > Świętokrzyskie > Śląskie > Opolskie > Podkarpackie; Cr: Śląskie > Małopolskie > Świętokrzyskie = Podkarpackie > Opolskie; Cu: Śląskie > Małopolskie > Świętokrzyskie > Opolskie > Podkarpackie; Hg: Małopolskie > Śląskie > Świętokrzyskie > Opolskie = Podkarpackie; Ni: Śląskie > Opolskie > Świętokrzyskie > Podkarpackie > Małopolskie; Pb: Śląskie > Małopolskie > Opolskie > Świętokrzyskie > Podkarpackie; Sb: Małopolskie > Śląskie > Opolskie > Świętokrzyskie > Podkarpackie; Tl: Opolskie > Śląskie > Świętokrzyskie > Podkarpackie > Małopolskie; and Zn: Małopolskie > Śląskie > Opolskie > Podkarpackie > Świętokrzyskie.
Our tests of the pseudototal PHE contents in agricultural soil samples confirmed the results of the research conducted previously in the Regions of SE Poland: in Śląskie [28,50,51,52,53], of S Poland: in Małopolskie [33,54,55,56,57,58], and of SE Poland: in Podkarpackie [59] and in Świętokrzyskie [60]. Our results were also comparable to those obtained within the frame of the National Environmental Monitoring System: chemical monitoring of arable soils, performed by the IUNG Institute of Soil Science and Plant Cultivation in Puławy [49]; five measurement-control profiles of arable soils in the Małopolskie (No. 417 Wadowice–Chocznia, No. 421 Brzyczyna, No. 349 Grojec, No. 353 Pleszów, No. 355 Posądza), two profiles in the Śląskie (No. 335 Piekary Śląskie, No. 333 Mokre); two profiles in the Opolskie (No. 323 Grabówka, No. 321 Grodzisko); two profiles in the Świętokrzyskie (No. 367 Rzędów, No. 369 Niedziałki); and two profiles in the Podkarpackie (No. 387 Dębno, No. 385 Nisko). Our results were also referred to the geochemical values derived from the existing geochemical atlases of the Małopolskie [61] and Upper Silesia [62,63].

3.2. Soil Quality

Investigated arable soil samples quality determination results are presented in Figure 2. Considering clay content [49] and measured pH investigated soil samples from Opolskie, Świętokrzyskie and Podkarpackie regions were classified to the soil subgroup II-1 and from Śląskie and Małopolskie regions to the soil subgroup II-2, according to the Regulation of the Polish Minister of the Environment [38]. The consequence of such division was that for group II-1 permissible PHE levels were lower than for group II-2. Nevertheless, in reference to the Polish regulations, none of the PHEs exceeded the permissible values. Consequently, the investigated soils were suitable for edible plant cultivation. However, when considering the recommended maximum concentrations specified in the Canadian soil quality guidelines for the protection of environmental and human health, it was found that the guideline values were exceeded about twice for Cd, Cu, Pb, and Zn in the Śląskie and Cd and Zn in the Małopolskie, as well as for Pb in the Śląskie and Zn in the Śląskie and Małopolskie.

3.3. Assessment of Potential Bioavailable Forms of PHEs

3.3.1. Multi-Stage Sequential Extraction: BCR Binding Forms of Soils

In the context of environmental and health protection, not only the total or pseudototal PHE content but also the bioavailable PHE content is crucial. For that reason, the results of the BCR extraction procedure of the investigated PHEs as the relative ratio of a fraction to the summarized extracted fractions expressed in % are presented in Figure 3. The BCR results were not available for Hg and Se, while the pseudototal concentrations of Se were < LOD in all the investigated samples and those of Hg in the majority of the investigated samples. The PHE mobility was as follows, in the decreasing order:
Exchangeable and acid soluble (BCRF1): Cd > Zn > Co > Ni = Sb > Cu > Tl > As > Cr = Pb,
Reducible (BCRF2): Pb > Cd > Tl > Co > Cr > Ni > Cu > Zn > As > Sb,
Oxidizable (BCRF3): Sb > Cu > As > Ni > Co > Zn > Tl > Cr > Pb > Cd,
Residual (BCRF4): Cr > As > Tl > Ni > Cu > Co > Zn > Sb > Pb > Cd.
Since BCRF1 represented the mobile PHE fraction contents, bound with exchangeable and acid soluble forms, the absolute contents of the investigated soil samples were also given (mean values in mg/kg), by Regions: Opolskie: As 0.57, Cd 0.32, Co 0.45, Cr 0.09, Cu 0.81, Ni 1.19, Pb < LOD, Sb 0.04, Tl 0.01, Zn 72.5; Śląskie: As 0.55, Cd 0.69, Co 0.35, Cr 0.26, Cu 1.39, Ni 0.08, Pb < LOD, Sb 0.04, Tl 0.005, Zn 131; Małopolskie: As 0.05, Cd 0.67, Co 0.60, Cr < LOD, Cu 0.56, Ni 0.30, Pb < LOD, Sb 0.04, Tl 0.002, Zn 44.8; Świętokrzyskie: As 0.07, Cd 0.38, Co 0.57, Cr < LOD, Cu 0.50, Ni 1.02, Pb < LOD, Sb 0.05, Tl 0.003, Zn 9.20; Podkarpackie: As 0.14, Cd 0.20, Co 0.21, Cr < LOD, Cu 0.35, Ni 0.58, Pb < LOD, Sb 0.04, Tl 0.002, Zn 60.8. The mobile PHE content (BCRF1) decreased in particular Regions as follows: As: Opolskie > Śląskie > Podkarpackie > Małopolskie = Świętokrzyskie; Cd: Podkarpackie > Świętokrzyskie > Małopolskie > Opolskie > Śląskie; Co: Opolskie > Podkarpackie > Śląskie = Świętokrzyskie > Małopolskie; Cr: Opolskie = Śląskie > Małopolskie = Świętokrzyskie = Podkarpackie; Cu: Opolskie > Podkarpackie > Świętokrzyskie > Małopolskie > Śląskie; Ni: Świętokrzyskie > Opolskie > Podkarpackie > Śląskie = Małopolskie; Sb: Świętokrzyskie > Podkarpackie > Opolskie = Śląskie = Małopolskie; Tl: Opolskie > Małopolskie > Śląskie = Podkarpackie > Świętokrzyskie; Zn: Podkarpackie > Opolskie > Śląskie > Świętokrzyskie > Małopolskie. For Pb in all Regions and for Cr in the Małopolskie, Świętokrzyskie, and Podkarpackie, the mobility associated with the acid soluble (BCRF1) extraction step was <<1%. The content of potentially mobile PHEs (the sum of the BCRF1, BCRF2, and BCRF3 fractions) decreased in the investigated Regions as follows: As: Śląskie > Opolskie > Podkarpackie > Świętokrzyskie > Małopolskie; Cd: Śląskie > Małopolskie > Świętokrzyskie > Opolskie > Podkarpackie; Co: Świętokrzyskie > Małopolskie > Śląskie > Opolskie > Podkarpackie; Cr: Małopolskie > Śląskie > Podkarpackie > Świętokrzyskie > Opolskie; Cu: Śląskie > Małopolskie > Opolskie > Świętokrzyskie > Podkarpackie; Ni: Opolskie > Śląskie > Świętokrzyskie > Podkarpackie > Małopolskie; Pb: Śląskie > Opolskie > Małopolskie > Świętokrzyskie > Podkarpackie; Sb: Opolskie > Małopolskie > Śląskie > Świętokrzyskie > Podkarpackie; Tl: Opolskie > Świętokrzyskie > Śląskie > Podkarpackie > Małopolskie; Zn: Śląskie > Małopolskie > Opolskie > Podkarpackie > Świętokrzyskie. The majority of the PHE contents consisted in the mobile and potentially mobile forms of Cd, Co, Ni, Pb, and Sb in southern Poland, it is in BCRF1 to BCRF3 fractions). As to As, Cr, and Cu (except for the Śląskie, Małopolskie and Świętokrzyskie), Tl (except for the Opolskie and Świętokrzyskie), and Zn (except for the Opolskie, Śląskie, and Podkarpackie), the highest proportions of the PHE contents were in the residual form (BCRF4 step), which may have indicated a natural origin of the elements connected with lithogenic sources.

3.3.2. One-Step Extraction

The contents of the bioavailable forms of PHEs, identified in the soil samples of the investigated Regions, are presented in Table 2. Among the single extractants, lower element concentrations were obtained upon applying CaCl2, in contrast to Na2EDTA. Those results were comparable to the results reported by other authors, since the unbuffered salt solution of CaCl2, simulating natural soil solutions, was useful for the assessment of the ecological relevance of elements [19]. Moreover, Pinto et al. [64] found that CaCl2 was a thinly diluted salt solution and it could only be used as extractant for the elements that existed in exchangeable forms and water-soluble forms. However, the other single extraction procedure, using Na2EDTA, isolated a higher content of potentially mobile soil fraction of PHEs. In our studies, we found some differences between the contents of bioavailable forms of PHEs in the analyzed soils. However, significant differences were demonstrated only in respect of the contents of Cr, Cu, Pb (CaCl2) and Cd, Cu, Cr (Na2EDTA) (with significant differences at p < 0.05) (Table 2). The highest contents of the mobile forms of PHEs were observed in the soil samples collected from the Śląskie, except for Ni and Zn, Cd (CaCl2), with the lowest in the samples from the Podkarpackie, except for Cu (Na2EDTA), Ni (CaCl2), and Zn. The potential bioavailable PHE fractions, extracted by CaCl2, ranged as follows: Cd from 0.81% (Śląskie) to 17% (Świętokrzyskie); Cr from 0% (Podkarpackie and Śląskie) to 0.25% (Opolskie); Cu from 0.01% (Śląskie) to 2.31% (Opolskie); Ni from 0.16% (Śląskie) to 2% (Świętokrzyskie); Pb from 0.2% (Śląskie) to 0.49% (Opolskie); and Zn from 0.25% (Śląskie) to 2.12% (Świętokrzyskie) of the pseudototal contents of those elements. The distribution of the mobile fractions extracted by Na2EDTA ranged as follows: Cd from 27% (Śląskie) to 91% (Małopolskie); Cr from 0.7% (Podkarpackie) to 7.1% (Opolskie); Cu from 6.7% (Śląskie) to 98% (Opolskie); Ni from 3.6% (Śląskie) to 41% (Małopolskie); Pb from 15% (Małopolskie) to 41% (Śląskie); and Zn from 3% (Małopolskie) to 34% (Świętokrzyskie) of the pseudototal contents of the PHEs. Among the analyzed PHEs, Cd was potentially the most mobile and bioavailable element in the studied soils. Moreover, the highest mobility of PHEs was found in the soils collected in the Świętokrzyskie and Opolskie Regions, and the lowest in the Śląskie.

3.3.3. Comparison of the Results Achieved by the Extraction Methods Applied

As it was mentioned in the Introduction above, three different extraction procedures in the investigations were applied. To determine the actually available PHE contents in soils, we applied extraction with 0.01 mol/dm3 CaCl2, as unbuffered salt solution, and 0.11 mol/dm3 CH3COOH, representing the first fraction of the BCR extraction procedure (BCRF1). To determine the potentially available PHE contents in soil, 0.05 mol/dm3 EDTA and the sum of BCRF1 to BCRF3 fractions of the BCR extraction procedure were applied. As the literature specified, 0.05 mol/dm3 EDTA was recommended for agricultural and environmental studies and 0.01 mol/dm3 CaCl2 for soil-plant uptake studies [19], while the 0.11 mol/dm3 CH3COOH fraction described the exchangeable PHEs, bound with carbonates [65]. As one can see in Table 2, the increasing amounts of individual PHEs extracted in the Regions of southern Poland were as follows: Opolskie: Cd, Cr, Cu and Ni: CaCl2 < BCRF1 < Na2EDTA; Zn: CaCl2 < Na2EDTA < BCRF1; and Pb: BCRF1 < CaCl2 < Na2EDTA; Śląskie: Cd, Cu, and Ni: CaCl2 < BCRF1 < Na2EDTA; Cr and Zn: CaCl2 < Na2EDTA < BCRF1; Pb: BCRF1 < CaCl2 < Na2EDTA; Małopolskie: Cu and Ni: CaCl2 < BCRF1 < Na2EDTA; Cd and Zn: CaCl2 < Na2EDTA < BCRF1; Cr and Pb: BCRF1 < CaCl2 < Na2EDTA; Świętokrzyskie: Cu and Ni: CaCl2 < BCRF1 < Na2EDTA; Cd and Zn: CaCl2 < Na2EDTA < BCRF1; Cr and Pb: BCRF1 < CaCl2 < Na2EDTA; Podkarpackie: Cr and Cu: CaCl2 < BCRF1 < Na2EDTA; Cd, Ni, and Zn: CaCl2 < Na2EDTA < BCRF1; and Pb: BCRF1 < CaCl2 < Na2EDTA. Generally, the increasing amounts of extracted individual PHEs were as follows in southern Poland: Cd, Cr, Cu, and Ni: CaCl2 < BCRF1 < Na2EDTA; Zn: CaCl2 < Na2EDTA < BCRF1; and Pb: BCRF1 < CaCl2 < Na2EDTA. Thus, the contents of PHEs extracted in the CaCl2 reagent were equivalent to the amounts that were taken up by plants, the PHE contents extracted with Na2EDTA determined the amounts responsible for the environmental risk, and the potentially mobile PHE contents determined by the BCR extraction procedure indicated environmental threat.
The analysis of the correlations between the contents of the bioavailable forms extracted by CaCl2, Na2EDTA, and BCRF1 is presented in Table 3. The highest correlations were observed between the PHEs extracted by Na2EDTA, followed by those obtained by CaCl2, which confirmed that those contents were bioavailable. Cr and Cu, and partially Cd, Pb, and Zn, were the PHEs that correlated with themselves in different extraction procedures. Under the same reagent procedure, strong positive correlations were observed between the following pairs of PHEs: Cr–Pb and Cu–Pb in CaCl2 extraction; Cd–Cu, Cr–Cu, Cd–Pb, Cr–Pb, Cu–Pb, Cu–Zn, and Pb–Zn in Na2EDTA extraction; and Pb–Zn in BCRF1. A medium positive correlation was observed as follows: Cd–Ni, Cd–Zn, Cr–Cu, Cr–Ni, Cu–Ni, Ni–Pb, Ni–Zn, and Pb–Zn in CaCl2 extraction; Cd–Cr, Cd–Ni, Cd–Zn, Cr–Ni, and Cr–Zn in Na2EDTA extraction; and Cd–Pb, Cu, Pb, and Cu-Zn in BCRF1, with a medium negative correlation of Ni–Pb. Among different extraction procedures, medium positive correlations were observed in the following pairs of PHEs: Cr–Cr, Cr–Cu between CaCl2–Na2EDTA and medium negative correlation of Ni–Zn; Cd–Cd, Cr–Cr, Cu–Cr, Cr–Pb between CaCl2–BCRF1; and Cu–Zn, Ni–Ni, Pb–Pb, Pb–Zn and Zn–Zn between Na2EDTA–BCRF1.

3.4. Principal Component Analysis (PCA) Analyses

The Principal Component Analysis (PCA), performed in respect of the soil properties and the mobile PHE fraction, once PHEs were extracted by CaCl2 and Na2EDTA, indicated similar behavior of PHEs in the examined soil samples (Table 4). PCA allowed us to extract two principal components (PCs), explaining the total variance of the dataset, from 56.9% (Małopolskie) to 89.3% (Śląskie). In the soil samples collected in the Opolskie Region, PC1 explaining 50.1% of the total variance had significant positive loadings on clay; Corg; Cr and Ni (CaCl2); Cd, Cr Cu, and Ni (Na2EDTA), with negative loadings on pH and Zn (Na2EDTA). PC2 explaining 34.9% of the total variance, with a strong positive loading for the total content of Cr; Cu; Ni; Cu (CaCl2); Zn (Na2EDTA) and negative loadings on the pseudototal contents of Cd and Pb (Na2EDTA) (Table 3). The high loadings for clay, Corg and pH suggested the impact on the mobility of trace element in the studied soils. However, the pseudototal contents also played an essential role in the mobility of Cu, Pb, and Zn. In the soils collected from the Śląskie Region, with PC1 explaining 51.1% of the total variance, had a strong positive loading for Corg, the pseudototal content of Cd and Pb; Cu and Pb (CaCl2); Pb and Zn (Na2EDTA), and a significant negative loading for clay and Ni (pseudototal content, CaCl2) (Table 4). The combination of properties in PC1 suggested the importance of Corg, with clay and the pseudototal content of Pb and Ni influencing the behavior of Pb and Ni in soils, respectively. PC2, explaining 38.2% and more of the total variance, had significant positive loadings on pH; Cr, Ni and Cu (Na2EDTA), and negative loadings on the pseudototal content of Cr, Cu, Zn; Cd and Zn (CaCl2). The results indicated that Zn mobility was dependent on pH, clay, and content of Corg, as well as the pseudototal Zn content. In the soils collected from the Małopolskie Region, the first component (PC1) accounted for 35.1% of the total variance, with a strong positive loading for all metal contents extracted by CaCl2, and negative loading with pH. PC2, explaining only 21.9% of the total variance, with a negative loading for all element contents extracted by Na2EDTA. The results indicated that the mobility of trace elements depended on pH. In the soils collected from the Świętokrzyskie Region, PC1 explained 56.9% of the total variance and had strong positive loadings (>0.70) on the pseudototal content of Cu, Ni, Cd, and the mobile forms of all elements (except Cu, Pb, Zn-Na2EDTA), with strong negative loadings on pH, clay, and Corg (Table 4). PC2 explained 20.7% of the total variance, with a strong positive loading for pseudototal content of Zn, Pb, and their mobile contents extracted by Na2EDTA. In the soils collected from the Podkarpackie Region, the first component (PC1) accounted for 57.2% of the total variance, with a strong positive loading on pH, Corg, the pseudototal content of Cu, Ni, Cu, Pb (CaCl2), and all element contents extracted by Na2EDTA, as well as negative loading with Cd (CaCl2) (Table 3). PC2, explaining 28.6% of the total variance with a negative loading for clay and the pseudototal content of Cr and a positive loading on the pseudototal content of Pb, Zn, and the mobile forms of Zn extracted by CaCl2. The results indicated that the mobility of PHEs generally depended on the pH and Corg contents, while the mobility of Cu and Zn depended on the pseudototal contents of those elements in soils. Cr extracted by CaCl2 was not treated by the PC analysis due to the fact that the Cr(III) and Cr(VI) forms were not investigated separately.

3.5. Geochemical Fractionation Indices

While the focus of our study concentrated on the determination of mobile and bioavailable PHE contents in agricultural soils, we also applied geochemical fractionation indices in our studies. The values of the calculated mobility factor (MF) for individual PHEs (Table 5) were the highest for Cd and Zn in all the Regions, as well as for Co in the Opolskie: to put it precisely, the MF values were equal to the following proportions: Opolskie: Cd 31.1%, Zn 31.0%, and Co 13.8%; Śląskie: Cd 30.6% and Zn 23.7%; Małopolskie: Cd 31.5%; Świętokrzyskie: Cd 32.0% and Zn 13.0%; and Podkarpackie: Zn 37.1% and Cd 36.7%. The high values of the MF factor indicated that the respective PHEs, found in the described locations, were the most mobile among the investigated elements, showing potential threat to biota, surface, and groundwater contamination [41].
As to other PHEs found in the investigated Regions, the values of the MF factors were <10%, indicating low element mobility and high stability under specific soil conditions, even when high pseudototal PHE concentrations were determined [66]. The mobility of PHEs followed the next orders, according to the calculated MF values: Opolskie: Cd > Zn > Co > As > Cu > Tl > Ni > Sb > Cr > Pb; Śląskie: Cd > Zn > Co > As > Sb > Tl > Cu > Cr > Ni > Pb; Małopolskie: Cd > Zn > Co > Ni > Tl > Sb > Cu > As > Cr > Pb; Świętokrzyskie: Cd > Zn > Co > Ni > Sb > Cu > Tl > As > Cr > Pb; Podkarpackie: Zn > Cd > Co > Sb > Cu > Ni > Tl > As > Cr > Pb. In southern Poland, the highest MF values were identified for Cd (31.6%) and Zn (21.0%), indicating that those elements were the most mobile. Other PHEs followed the order: Co > Ni > Tl > As > Sb > Cu > Cr > Pb, while their MF values were <10%, indicating that those elements were not readily available under the existing soil conditions. The values of the calculated RAC index (Table 6) indicated that the investigated soils were characterized by very high ecological risks for Cd and Zn in the Podkarpackie Region, while high ecological risks were determined for Cd in the Opolskie, Śląskie, Małopolskie, and Podkarpackie, with Zn in the Opolskie and Śląskie. Medium ecological risks were established for Co in the Opolskie and Podkarpackie and for Zn in the Świętokrzyskie. Low ecological risks were identified for As, Cr, Cu, Ni, Sb, and Tl in the Opolskie, for As, Co, Cr, Cu, Ni, Sb, and Tl in the Śląskie, for As, Co, Cu, Ni, Sb, and Tl in the Małopolskie and Świętokrzyskie, and additionally for Zn in the Małopolskie. No ecological risk was identified for Pb in all the five Regions, or Cr in the Małopolskie, Świętokrzyskie, and Podkarpackie. The modified RAC index (mRAC) revealed a high potential of adverse effects in the investigated soils of the Podkarpackie and a medium potential of adverse effects in the Opolskie, Śląskie, Małopolskie, and Świętokrzyskie, in reference to the contents of all the PHEs analyzed (Table 6). The factor described above took into consideration only the PHE content, bound with the exchangeable and acid soluble fraction of elements (BCRF1 fraction of the BCR extraction procedure). Thus, we also used the ICF factor in our investigations that took into account the potentially mobile fractions of PHEs (BCRF1–BCRF3 fractions of the BCR extraction procedure). The calculated values of the ICF factor (Table 7) arranged PHEs in the following decreasing order of potential adverse effect risks: Opolskie: Pb > Cd > Zn > Sb > Cu > Tl > Ni > Co > As > Cr; Śląskie: Cd > Pb > Zn > Sb > Co > As > Ni > Cu > Tl > Cr; Małopolskie: Cd > Sb > Pb > Co > Ni > Cu > Cr > As > Zn > Tl; Świętokrzyskie: Cd > Pb > Co > Sb > Tl > Ni > Cu > Zn > As > Cr; and Podkarpackie: Cd > Pb > Sb > Zn > Cu > Co > Ni > Tl > As > Cr. Finally, looking at the GCF factor (Table 7), the decreasing order of the Regions described by the potential adverse effect risks of all PHEs in the investigated soils was as follows: Opolskie > Podkarpackie > Świętokrzyskie > Śląskie > Małopolskie.

4. Conclusions

The following conclusions were derived, based on the investigations of agricultural soils samples taken from the depth of 0–25 cm each, particularly where edible plants were cultivated in southern Poland. The measured pH values classified the investigated samples of arable soils as neutral (Opolskie and Śląskie) and slightly acidic (Małopolskie, Świętokrzyskie, and Podkarpackie). The highest pseudototal contents of PHEs were stated in Śląskie and Małopolskie regions for Cd, Cu, Pb, and Zn that can be related with the geochemistry of these regions and particular soil properties. None of PHEs exceeded the permissible content, in reference to the Polish soil quality standards. However, considering the Canadian soil quality guidelines for the protection of environmental and human health, it was revealed that contents of Cd, Cu, Pb, and Zn in the Śląskie and Cd and Zn in the Małopolskie Regions were higher than recommended. However, calculated geochemical fractionation indices revealed that in southern Poland Cd and Zn were the most mobile according to mobility factor (MF) values: Cd (31.6%) and Zn (21.0%). Other PHEs were not readily available under the existing soil conditions their MF values were <10%. Based on the risk assessment code (RAC) values of very high Cd and Zn ecological risks were determined in the Podkarpackie and a high Cd ecological risk in the Opolskie, Śląskie, Małopolskie, and Podkarpackie Regions, as well as a high Zn risk in the Opolskie and Śląskie. The modified risk assessment code index (mRAC) values revealed a high potential of adverse effects in the soils of the Podkarpackie and a medium potential of adverse effects in the Opolskie, Śląskie, Małopolskie, and Świętokrzyskie, in reference to contents of all the PHEs analyzed. The decreasing order of the potential adverse effect risk, in reference to the single geochemical fractionation index (ICF), was as follows: Opolskie: Pb > Cd > Zn > Sb > Cu > Tl > Ni > Co > As > Cr; Śląskie: Cd > Pb > Zn > Sb > Co > As > Ni > Cu > Tl > Cr; Małopolskie: Cd > Sb > Pb > Co > Ni > Cu > Cr > As > Zn > Tl; Świętokrzyskie: Cd > Pb > Co > Sb > Tl > Ni > Cu > Zn > As > Cr, and Podkarpackie: Cd > Pb > Sb > Zn > Cu > Co > Ni > Tl > As > Cr. The global geochemical fractionation index (GCF), describing the potential adverse effect risks of all the PHEs were ordered decreasingly as follows: Opolskie > Podkarpackie > Świętokrzyskie > Śląskie > Małopolskie. The probable source of the detected ecological risk of Cd and Zn, in the regions where it was not caused by the geological background, was phosphate mineral fertilizers applications in agriculture. It has to be stated in conclusion that, apart from the mobile and potentially mobile contents of the elements determined under the extraction procedures, the bioavailability strongly depended on soil properties and the pseudototal concentration of individual elements.

Author Contributions

Conceptualization, A.G.-K. and A.B.; Data curation, A.G.-K. and K.M.-K.; Formal analysis, A.G.-K.; Funding acquisition, A.G.-K.; Investigation, A.G.-K., A.B., K.M.-K. and T.C.; Methodology, A.G.-K., A.B. and T.C.; Project administration, A.G.-K.; Resources, A.G.-K.; Software, A.G.-K. and A.B.; Supervision, A.G.-K.; Validation, A.G.-K.; Visualization, A.G.-K.; Writing—original draft, A.G.-K. and A.B.; Writing—review and editing, A.G.-K.

Funding

This research was funded by Akademia Górniczo-Hutnicza im. Stanislawa Staszica: Dean’s Grant No. 15.11.140.357 and Akademia Górniczo-Hutnicza im. Stanislawa Staszica: Statutory Research Grant No. 11.11.140.199.

Conflicts of Interest

The authors declare no conflict of interest.

References

  1. Bini, C.; Bech, J. PHEs, Environment and Human Health: Potentially Harmful Elements in the Environment and the Impact on Human Health; Springer: Heidelberg, Germany, 2014. [Google Scholar]
  2. Sparks, D.L. Toxic metals in the environment: The role of surface. Elements 2005, 1, 193–196. [Google Scholar] [CrossRef]
  3. Skalnaya, M.G.; Skalny, A.V. Essential Trace Elements in Human Health: A Physician’s View; Publishing House of Tomsk State University: Tomsk, Russia, 2018. [Google Scholar]
  4. Antibachi, D.; Kelepertzis, E.; Kelepertsis, A. Heavy metals in agricultural soils of the Mouriki-Thiva area (Central Greece) and environmental impact implications. Soil Sediment. Contam. 2012, 21, 434–450. [Google Scholar] [CrossRef]
  5. Adriano, D.C. Trace Elements in the Terrestrial Environment: Biogeochemistry, Bioavailability and Risks of Metals, 2nd ed.; Springer: New York, NY, USA, 2001. [Google Scholar]
  6. Shi, T.; Ma, J.; Wu, X.; Ju, T.; Lin, X.; Zhang, Y.; Li, X.; Gong, Y.; Hou, H.; Zhao, L.; et al. Inventories of heavy metal inputs and outputs to and from agricultural soils: A review. Ecotox. Environ. Saf. 2018, 164, 118–124. [Google Scholar] [CrossRef] [PubMed]
  7. Sofianska, E.; Michailidis, K. Chemical assessment and fractionation of some heavy metals and arsenic in agricultural soils of the mining affected Drama plain, Macedonia, northern Greece. Environ. Monit. Assess. 2015, 187, 101. [Google Scholar] [CrossRef] [PubMed]
  8. Sungur, A.; Soylak, M.; Yilmaz, E.; Yilmaz, S.; Ozcan, H. Characterization of heavy metal fractions in agricultural soils by sequential extraction procedure: The relationship between soil properties and heavy metal fractions. Soil Sediment Contam. 2015, 24, 1–15. [Google Scholar] [CrossRef]
  9. Shang, W.; Tang, Q.; Zheng, L.; Cheng, H. Chemical forms of heavy metals in agricultural soils affected by coal mining in the Linhuan subsidence of Huaibei Coalfield, Anhui Province, China. Environ. Sci. Pollut. R. 2016, 23, 23683–23693. [Google Scholar] [CrossRef]
  10. Tóth, G.; Hermann, T.; Da Silva, M.R.; Montanarella, L. Heavy metals in agricultural soils of the European Union with implications for food safety. Environ. Int. 2016, 88, 299–309. [Google Scholar] [CrossRef]
  11. Da Silva, F.B.V.; Nascimento, C.W.A.; Araújo, P.R.M.; da Silva, F.L.; Lima, L.H.V. Soil contamination by metals with high ecological risk in urban and rural areas. Int. J. Environ. Sci. Technol. 2017, 14, 553–562. [Google Scholar] [CrossRef]
  12. Doabi, S.A.; Karami, M.; Afyuni, M.; Yeganeh, M. Pollution and health risk assessment of heavy metals in agricultural soil, atmospheric dust and major food crops in Kermanshah province, Iran. Ecotox. Environ. Saf. 2018, 163, 153–164. [Google Scholar] [CrossRef]
  13. El-Radaideh, N.M.; Al-Kareem Al-Taani, A.A. Geo-environmental study of heavy metals of the agricultural highway soils, NW Jordan. Arab. J. Geosci. 2018, 11, 787. [Google Scholar] [CrossRef]
  14. Cai, L.M.; Wang, Q.S.; Wen, H.H.; Luo, J.; Wang, S. Heavy metals in agricultural soils from a typical township in Guangdong Province, China: Occurrences and spatial distribution. Ecotox. Environ. Saf. 2019, 168, 184–191. [Google Scholar] [CrossRef] [PubMed]
  15. Huang, Y.; Wang, L.; Wang, W.; Li, T.; He, Z.; Yang, X. Current status of agricultural soil pollution by heavy metals in China: A meta-analysis. Sci. Total Environ. 2019, 651, 3034–3042. [Google Scholar] [CrossRef] [PubMed]
  16. Keshavarzi, A.; Kumar, V. Spatial distribution and potential ecological risk assessment of heavy metals in agricultural soils of Northeastern Iran. Geol. Ecol. Landsc. 2019, 1–17. [Google Scholar] [CrossRef]
  17. Gruszecka-Kosowska, A.; Baran, A.; Wdowin, M.; Mazur-Kajta, K.; Czech, T. The contents of the Potentially Harmful Elements in the arable soils of southern Poland, with the assessment of ecological and health risks: A case study. Environ. Geochem. Health 2019, 1–24. [Google Scholar] [CrossRef] [PubMed]
  18. Santoro, A.; Held, A.; Linsinger, T.P.J.; Perez, A.; Ricci, M. Comparison of total and aqua regia extractability of heavy metals in sewage sludge: The case study of the certified reference material. Trends Anal. Chem. 2017, 8, 34–40. [Google Scholar] [CrossRef]
  19. Milićević, T.; Relić, R.; Škrivanj, S.; Tesić, Ž.; Popović, A. Assessment of major and trace element bioavailability in vineyard soil applying different single extraction procedures and pseudo-total digestion. Chemosphere 2017, 171, 284–293. [Google Scholar] [CrossRef]
  20. Meers, E.; Samson, R.; Tack, F.M.G.; Ruttens, A.; Vangegehuchte, M.; Vangronsveld, J.; Verloo, M.G. Phytoavailability assessment of heavy metals in soils by single extractions and accumulation by Phaseolus vulgaris. Environ. Exp. Bot. 2007, 60, 385–396. [Google Scholar] [CrossRef]
  21. Harmsen, J. Measuring bioavailability: From a scientific approach to standard methods. J. Environ. Qual. 2007, 36, 1420–1428. [Google Scholar] [CrossRef]
  22. Harmsen, J. Soil Quality—Requirements and Guidance for the Selection and Application of Methods for the Assessment of Bioavailability of Contaminants in Soil and Soil Materials; Werkgroep ISO/DIS17402 Soil Quality: Geneva, Switzerland, 2008. [Google Scholar]
  23. Kim, R.Y.; Yoon, J.K.; Kim, T.S.; Yang, J.E.; Owens, G.; Kim, K.R. Bioavailability of heavy metals in soils: Definitions and practical implementation—A critical review. Environ. Geochem. Health 2015, 37, 1041–1061. [Google Scholar] [CrossRef]
  24. Nemati, K.; Bakar, N.K.A.; Abas, M.R. Investigations of heavy metals mobility in shrimp aquaculture sludge—Comparison of two sequential extraction procedures. Microchem. J. 2009, 91, 227–231. [Google Scholar] [CrossRef]
  25. Shaheen, S.M.; Rinklebe, J. Geochemical fractions of chromium, copper, and zinc and their vertical distribution in floodplain soil profiles along the Central Elbe. Geoderma 2014, 228, 152–159. [Google Scholar] [CrossRef]
  26. Tessier, A.; Campbell, P.G.C.; Bisson, M. Sequential extraction procedure for the speciation of particulate trace metals. Anal. Chem. 1979, 51, 844–851. [Google Scholar] [CrossRef]
  27. Rauret, G. Extraction procedures for the determination of heavy metals in contaminated soil and sediments. Talanta 1998, 46, 449–455. [Google Scholar] [CrossRef]
  28. Labaz, B.; Kabala, C.; Waroszewski, J. Ambient geochemical baselines for trace elements in Chernozems—Approximation of geochemical soil transformation in an agricultural area. Environ. Monit. Assess. 2019, 191, 19. [Google Scholar]
  29. EPA. Method 6020B: Inductively Coupled Plasma—Mass Spectrometry. Revision 2; USEPA: Washington, DC, USA, 1998.
  30. PN-EN ISO 17294-2:2006. Water Quality—Use of Inductively Induced Plasma Mass Spectrometry (ICP-MS)—Part 2: Determination of 62 Elements; Polish Committee for Standardization: Warsaw, Poland, 2006.
  31. Quevauviller, P.; Rauret, G.; Lopez-Sanchez, J.F.; Rubio, R.; Ure, A.; Muntau, H. Certification of trace metal extractable contents in a sediment reference material (CRM 601) following a three step sequential extraction procedure. Sci. Total Environ. 1997, 205, 223–234. [Google Scholar] [CrossRef]
  32. Pueyo, M.; López-Sánchez, J.F.; Rauret, G. Assessment of CaCl2, NaNO3 and NH4NO3 extraction procedures for the study of Cd, Cu, Pb and Zn extractability in contaminated soils. Anal. Chim. Acta 2004, 504, 217–226. [Google Scholar] [CrossRef]
  33. Wieczorek, J.; Baran, A.; Urbański, K.; Mazurek, K.; Klimkowicz-Pawlas, A. Assessment of the pollution and ecological risk of lead and cadmium in soils. Environ. Geochem. Health 2018, 40, 2325–2342. [Google Scholar] [CrossRef]
  34. PN-EN ISO 17294-1:2007. Water Quality—Induced Plasma Mass Spectrometry (ICP-MS)—Part 1: General Guidelines; Polish Committee for Standardization: Warsaw, Poland, 2007.
  35. PN-EN ISO 11885:2009. Water Quality—Determination of Selected Elements by Inductively Coupled Plasma Optical Emission Spectrometry (ICP-OES); Polish Committee for Standardization: Warsaw, Poland, 2009.
  36. Barona, A.; Aranguiz, I.; Elías, A. Assessment of metal extraction, distribution and contamination in surface soils by a 3-step sequential extraction procedure. Chemosphere 1999, 39, 1911–1922. [Google Scholar] [CrossRef]
  37. Saeedi, M.; Jamshidi-Zanjani, A. Development of a new aggregative index to assess potential effect of metals pollution in aquatic sediments. Ecol. Indic. 2015, 58, 235–243. [Google Scholar] [CrossRef]
  38. Regulation of the Minister of the Environment of 1 September 2016 on the conduct of the assessment of contamination of the surface of the earth. J. Laws 2016, 1396, 1–86.
  39. Canadian soil quality guidelines for the protection of environmental and human health: Summary tables. Updated 7.0. In Canadian Environmental Quality Guidelines, 1999; Canadian Council of Ministers of the Environment: Winnipeg, MB, Canada, 2007.
  40. Gasparatos, D.; Mavromati, G.; Kotsovilis, P.; Massas, I. Fractionation of heavy metals and evaluation of the environmental risk for the alkaline soils of the Thriassio plain: A residential, agricultural, and industrial area in Greece. Environ. Earth Sci. 2015, 74, 1099–1108. [Google Scholar] [CrossRef]
  41. Iwegbue, C.M.A. Chemical fractionation and mobility of heavy metals in soils in the vicinity of asphalt plants in Delta State, Nigeria. Environ. Forensics 2013, 14, 248–259. [Google Scholar] [CrossRef]
  42. Singh, K.P.; Mohan, D.; Singh, V.K.; Malik, A. Studies on distribution and fractionation of heavy metals in Gomti river sediments—A tributary of the Ganges, India. J. Hydrol. 2005, 312, 14–27. [Google Scholar] [CrossRef]
  43. Naji, A.; Ismail, A.; Ismail, A.R. Chemical speciation and contamination assessment of Zn and Cd by sequential extraction in surface sediment of Klang River, Malaysia. Microchem. J. 2010, 95, 285–292. [Google Scholar] [CrossRef]
  44. Håkanson, L. An ecological risk index for aquatic pollution control. A sedimentological approach. Water Res. 1980, 14, 975–1001. [Google Scholar] [CrossRef]
  45. Gong, Q.; Deng, J. Calculating pollution indices by heavy metals in ecological geochemistry assessment and as case study in parks of Beijing. J. China Univ. Geosci. 2008, 19, 230–241. [Google Scholar]
  46. Chai, L.; Li, H.; Yang, Z.; Min, X.; Liao, Q.; Liu, Y.; Men, S.; Yan, Y.; Xu, J. Heavy metals and metalloids in the surface sediments of the Xiangjiang River, Hunan, China: Distribution, contamination, and ecological risk assessment. Environ. Sci. Pollut. R. 2017, 24, 874–885. [Google Scholar] [CrossRef]
  47. Liu, Y.; Wang, Q.; Zhuang, W.; Yuan, Y.; Jiao, K.; Wang, M.; Chen, Q. Calculation of thallium’s toxicity coefficient in the evaluation of potential ecological risk index: A case study. Chemosphere 2018, 194, 562–569. [Google Scholar] [CrossRef]
  48. Wang, N.; Wang, A.; Kong, L.; He, M. Calculation and application of Sb toxicity coefficient for potential ecological risk assessment. Sci. Total Environ. 2018, 610, 167–174. [Google Scholar] [CrossRef]
  49. Chemical Monitoring of Arable Soils IUNG Institute of Soil Science and Plant Cultivation in Puławy, Main Inspectorate of Environmental Protection. 2017. Available online: http://www.gios.gov.pl/chemizm_gleb/index.php?mod=monit (accessed on 19 September 2012).
  50. Loska, K.; Wiechuła, D.; Korus, I. Metal contamination of farming soils affected by industry. Environ. Int. 2004, 30, 159–165. [Google Scholar] [CrossRef]
  51. Pająk, M.; Błońska, E.; Szostak, M.; Gąsiorek, M.; Pietrzykowski, M.; Urban, O.; Derbis, P. Restoration of vegetation in relation to soil properties of spoil heap heavily contaminated with heavy metals. Water Air Soil Poll. 2018, 229, 392. [Google Scholar] [CrossRef] [PubMed]
  52. Piekut, A.; Baranowska, R.; Marchwińska-Wyrwał, E.; Ćwieląg-Drabek, M.; Hajok, I.; Dziubanek, G.; Grochowska-Niedworok, E. Is the soil quality monitoring an effective tool in consumers’ protection of agricultural crops from cadmium soil contamination?—A case of the Śląskie region (Poland). Environ. Monit. Assess. 2018, 190, 25. [Google Scholar] [CrossRef] [PubMed]
  53. Waroszewski, J.; Sprafke, T.; Kabała, C.; Kobierski, M.; Kierczak, J.; Musztyfaga, E.; Loba, A.; Mazurek, R.; Łabaz, B. Tracking textural, mineralogical and geochemical signatures in soils developed from basalt-derived materials covered with loess sediments (SW Poland). Geoderma 2019, 337, 983–997. [Google Scholar] [CrossRef]
  54. Krzaklewski, W.; Barszcz, J.; Małek, S.; Kozioł, K.; Pietrzykowski, M. Contamination of forest soils in the vicinity of the sedimentation pond after zinc and lead ore flotation (in the region of Olkusz, southern Poland). Water Air Soil Poll. 2004, 159, 151–164. [Google Scholar] [CrossRef]
  55. Baran, A.; Czech, T.; Wieczorek, J. Chemical properties and toxicity of soils contaminated by mining activity. Ecotoxicology 2014, 2, 1234–1244. [Google Scholar]
  56. Baran, A.; Wieczorek, J. Application of geochemical and ecotoxicity indices for assessment of heavy metals content in soils. Arch. Environ. Prot. 2015, 41, 54–63. [Google Scholar] [CrossRef]
  57. Baran, A.; Wieczorek, J.; Mazurek, R.; Urbański, K.; Klimkowicz-Pawlas, A. Potential ecological risk assessment and predicting zinc accumulation in soils. Environ. Geochem. Health. 2018, 40, 435–450. [Google Scholar] [CrossRef]
  58. Mazurek, R.; Kowalska, J.B.; Gąsiorek, M.; Zadrożny, P. Pollution indices as comprehensive tool for evaluation of the accumulation and provenance of potentially harmful elements in soils in Ojców National Park. J. Geochem. Explor. 2019, 201, 13–30. [Google Scholar] [CrossRef]
  59. Mazurek, R.; Kowalska, J.; Gąsiorek, M.; Zadrożny, P.; Józefowska, A.; Zaleski, T.; Kepka, W.; Tymczuk, W.; Orłowska, K. Assessment of heavy metals contamination in surface layers of Roztocze National Park forest soils (SE Poland) by indices of pollution. Chemosphere 2017, 168, 839–850. [Google Scholar] [CrossRef]
  60. Gałuszka, A.; Migaszewski, Z.M.; Dołęgowska, S.; Michalik, A. Geochemical anomalies of trace elements in unremediated soils of Mt. Karczówka, a historic lead mining area in the city of Kielce, Poland. Sci. Total Environ. 2018, 639, 397–405. [Google Scholar] [CrossRef]
  61. Lis, J.; Pasieczna, A. Geochemical Atlas of Kraków and Environs, 1:100,000; Państwowy Instytut Geologiczny: Warszawa, Poland, 1995. [Google Scholar]
  62. Lis, J.; Pasieczna, A. Geochemical Atlas of Upper Silesia, 1:100,000; Państwowy Instytut Geologiczny: Warszawa, Poland, 1995. [Google Scholar]
  63. Pasieczna, A.; Fajfer, J.; Strzemińska, K. Szczegółowa mapa geochemiczna Górnego Śląska w skali 1:25 000 Arkusz Zabrze M-34-62-B-a: Detailed Geochemical Map of Upper Silesia in the Scale of 1:25,000 Zabrze sheet M-34-62-B-a; Państwowy Instytut Geologiczny: Warszawa, Poland, 2016. [Google Scholar]
  64. Pinto, E.; Almeida, A.A.; Ferreira, I.M.P.L.V.O. Assessment of metal(loid)s phytoavailability in intensive agricultural soils by the application of single extractions to rhizosphere soil. Ecotox. Environ. Saf. 2015, 113, 418–424. [Google Scholar] [CrossRef] [PubMed]
  65. Liu, G.; Tao, L.; Liu, X.; Hou, J.; Wang, A.; Li, R. Heavy metals speciation and pollution of agricultural soils along Jishui River in non-ferrous metal mine area in Jiangxi Province, China. J. Geochem. Explor. 2013, 132, 156–163. [Google Scholar] [CrossRef]
  66. Lei, M.; Zhang, Y.; Khan, S.; Qin, P.F.; Liao, B.H. Pollution, fractionation, and mobility of Pb, Cd, Cu, and Zn in garden and paddy soils from a Pb/Zn mining area. Environ. Monit. Assess. 2010, 168, 215–222. [Google Scholar] [CrossRef] [PubMed]
Figure 1. Agricultural soil-sampling site locations in the Regions of southern Poland (modified from [17]).
Minerals 09 00674 g001
Figure 2. Pseudototal Potentially Harmful Element (PHE) contents in the agricultural soils in the Regions of southern Poland and soil quality; O—Opolskie, Śl—Śląskie, M—Małopolskie, Św—Świętokrzyskie, P—Podkarpackie.
Minerals 09 00674 g002aMinerals 09 00674 g002bMinerals 09 00674 g002c
Figure 3. PHE content (%) from the Community Bureau of Reference (BCR) extraction procedure as the relative ratio of a fraction to the summarized extracted fractions expressed in the agricultural soils of southern Poland; O—Opolskie, Śl—Śląskie, M—Małopolskie, Św—Świętokrzyskie, P—Podkarpackie.
Minerals 09 00674 g003
Table 1. Description of the geochemical fractionation indices applied in the study.
IndexFormulaExplanationsLimit ValuesClassificationReference
Single Indices
Mobility factor
MF
MF = BCRF 1 ( BCRF 1 + BCRF 2 + BCRF 3 + BCRF 4 ) × 100%BCRF1–BCRF4—content of single PHE in each fraction in % according to the BCR procedureNo limit valuesThe higher MF value the higher PHE mobility[40,41]
Risk assessment code
RAC
content of BCRF1BCRF1—content of single PHE in exchangeable and carbonate fractions in % %BCRF1 < 1No risk[42]
1 < %BCRF1 < 10Low risk
11 < %BCRF1 < 30Medium risk
31 < %BCRF1 < 50High risk
%BCRF1 > 50Very high risk
Individual contamination factor
ICF
ICF = BCRF 1 + BCRF 2 + BCRF 3 BCRF 4 PMF—content in potential mobile fractions (BCRF1–BCRF3)
according to the BCR procedure
No limit valuesThe higher value the higher ecological risk[43]
Complex Indices
Modified risk assessment codem
RAC
mRAC = i = 1 n Tri   RACi i = 1 n Tri RACi—percentage of each PHE in potential mobile fractions; Tri—toxic response of the PHE; n—number of PHEsmRAC < 1No potential of adverse effect[37,44,45,46,47,48]
1 ≤ mRAC < 10Low potential of adverse effect
10 ≤ mRAC < 30Medium potential of adverse effect
30 ≤ mRAC < 50High potential of adverse effect
mRAC ≥ 50Very high potential of adverse effect
Global contamination factor
GCF
GCF = Σ ICFICF—individual contamination factor of single PHENo limit valuesThe higher value the higher ecological risk[36,43]
Table 2. Forms of PHEs that are bioavailable for plants in the agricultural soils in the Regions of southern Poland.
PHEs
Mean
(mg/kg)
ReagentOpolskie
(n = 4)
Śląskie (n = 4)Małopolskie (n = 12)Świętokrzyskie
(n = 6)
Podkarpackie
(n = 4)
CdCaCl20.050.060.050.080.03
Na2EDTA *0.362.480.370.230.17
BCRF10.320.690.670.380.2
CrCaCl2 *0.023<LOD0.0030.003<LOD
Na2EDTA *0.640.250.200.150.13
BCRF10.090.26<LOD<LOD<LOD
CuCaCl2 *0.270.010.010.010.01
Na2EDTA *11.34.753.291.181.73
BCRF10.811.390.560.50.35
NiCaCl20.120.030.050.310.04
Na2EDTA2.000.761.751.380.54
BCRF11.190.080.31.020.58
PbCaCl2 *0.220.040.050.050.04
Na2EDTA15.570.99.326.254.68
BCRF1<LOD<LOD<LOD<LOD<LOD
ZnCaCl21.320.791.341.302.08
Na2EDTA51.795.613.85.4934.9
BCRF172.513144.89.260.8
<LOD below the limit of detection, * significant at p ≤ 0.05.
Table 3. Analysis of the correlation between the contents of bioavailable forms (p ≤ 0.05).
CaCl2Na2EDTABCRF1
CdCrCuNiPbZnCdCrCuNiPbZnCdCrCuNiPbZn
CaCl2Cd1.00
Cr0.171.00
Cu0.240.691.00
Ni0.590.530.501.00
Pb0.350.730.840.591.00
Zn0.690.250.420.620.531.00
Na2EDTACd0.120.100.14−0.15−0.09−0.301.00
Cr−0.130.550.500.000.27−0.220.661.00
Cu−0.230.180.25−0.26−0.07−0.340.790.801.00
Ni−0.320.330.070.01−0.080.510.510.590.441.00
Pb0.080.200.30−0.150.06−0.220.870.760.840.301.00
Zn−0.120.040.27−0.280.07−0.080.630.620.820.120.721.00
BCRF1Cd0.52−0.200.040.06−0.010.160.46−0.060.12−0.240.380.191.00
Cr0.140.670.530.460.620.270.050.430.210.070.150.23−0.021.00
Cu0.270.270.400.380.280.380.320.310.43−0.100.430.360.410.471.00
Ni−0.050.18−0.090.33−0.06−0.17−0.04−0.07−0.140.51−0.29−0.390.050.15−0.001.00
Pb0.430.090.380.130.240.280.450.280.39−0.330.670.500.520.130.590.561.00
Zn0.19−0.060.31−0.070.170.260.370.270.51−0.330.510.830.430.280.52−0.440.701.00
0 < r < 0.3 very low correlation; 0.3 ≤ r < 0.5 low correlation; 0.5 ≤ r < 0.7 medium correlation; 0.7 ≤ r < 0.9 strong correlation; 0.9 ≤ r < 1 very strong correlation.
Table 4. Component matrix of variables (n = 30).
VariablesOpolskieŚląskieMałopolskie ŚwiętokrzyskiePodkarpackie
PCA1PCA2PCA1PCA2PCA1PCA2PCA1PCA2PCA1PCA2
pHKCl−0.99.0.040.410.86−0.92−0.05−0.88−0.090.79−0.46
clay0.790.61−0.890.41−0.490.01−0.690.130.48−0.87
Corg0.86−0.100.95−0.190.120.48−0.820.510.83−0.44
Cd0.30−0.770.830.31−0.34−0.170.88−0.280.50−0.64
Cr−0.080.96−0.38−0.780.18−0.28−0.50−0.560.02−0.99
Cu−0.020.990.51−0.86−0.550.540.730.050.910.33
Ni0.580.81−0.80−0.380.48−0.300.840.080.980.06
Pb0.56−0.120.950.270.35−0.03−0.220.900.190.81
Zn0.011.00−0.16−0.98−0.49−0.29−0.240.940.050.86
Cd CaCl2−0.54−0.49−0.28−0.960.71−0.190.95−0.21−0.930.25
Cr CaCl20.93−0.13--0.720.160.94−0.12--
Cu CaCl20.060.980.860.270.90−0.020.860.050.790.38
Ni CaCl20.820.54−0.74−0.400.92−0.150.90−0.15−0.060.69
Pb CaCl2−0.65−0.570.780.080.89−0.180.95−0.130.790.38
Zn CaCl2−0.890.030.24−0.970.92−0.290.91−0.08−0.060.96
Cd Na2EDTA0.92−0.400.93−0.30−0.120.960.850.450.770.17
Cr Na2EDTA0.95−0.090.430.850.050.670.880.340.96−0.27
Cu Na2EDTA 0.940.330.630.70−0.120.970.140.501.00−0.07
Ni Na2EDTA 1.000.06−0.470.88−0.200.870.920.080.98−0.11
Pb Na2EDTA0.07−0.900.73−0.680.060.83−0.160.800.97−0.23
Zn Na2EDTA0.060.770.910.27−0.140.780.450.820.99−0.09
Total variance %50.134.951.138.235.121.956.920.757.228.6
Cumulative variance %50.185.151.189.335.156.956.977.657.285.8
Factor loadings exceeding > 0.6 or < −0.6 are shown in bold; - not taken for PC analysis.
Table 5. The mobility factor (MF) values of individual PHEs of the agricultural soils in the Regions of southern Poland.
MFOpolskie
(n = 4)
Śląskie
(n = 4)
Małopolskie
(n = 12)
Świętokrzyskie
(n = 6)
Podkarpackie
(n = 4)
As8.264.760.990.991.96
Cd31.130.631.532.036.7
Co13.89.098.269.099.91
Cr0.990.990.000.000.00
Cu6.541.961.962.913.85
Ni6.420.397.186.303.85
Pb0.000.000.000.000.00
Sb2.912.912.914.764.76
Tl6.542.913.851.962.91
Zn31.023.79.0913.037.1
Table 6. Ecological risk of PHEs in soils, according to the risk assessment code (RAC) and modified RAC (mRAC) indices.
RACOpolskie
(n = 4)
Śląskie
(n = 4)
Małopolskie
(n = 12)
Świętokrzyskie
(n = 6)
Podkarpackie
(n = 4)
Aslowlowlowlowlow
Cdhighhighhighhighvery high
Comediumlowlowlowmedium
Crlowlowno riskno riskno risk
Culowlowlowlowlow
Nilowlowlowlowlow
Pbno riskno riskno riskno riskno risk
Sblowlowlowlowlow
Tllowlowlowlowlow
Znhighhighlowmediumvery high
mRACmedium potential of adverse effectmedium potential of adverse effectmedium potential of adverse effectmedium potential of adverse effectmedium potential of adverse effect
Table 7. Potential adverse effect risks, according to the individual contamination factor (ICE) and global contamination factor (GCF) indices.
ICFOpolskie
(n = 4)
Śląskie
(n = 4)
Małopolskie
(n = 12)
Świętokrzyskie
(n = 6)
Podkarpackie
(n = 4)
As1.001.000.590.470.72
Cd32.319.09.0024.049.0
Co1.131.221.443.001.44
Cr0.640.350.720.350.49
Cu4.560.820.791.002.23
Ni1.700.890.891.171.04
Pb49.03.001.593.7615.7
Sb4.881.943.173.007.33
Tl2.700.750.321.221.04
Zn7.172.160.520.796.14
GCF10531.119.038.885.1

