The Effect of Weathering on Salt Release from Coal Mine Spoils


1
Centre for Mined Land Rehabilitation, Sustainable Minerals Institute, The University of Queensland, Brisbane, QLD 4072, Australia
2
Centre for Water in the Minerals Industry, Sustainable Minerals Institute, The University of Queensland, Brisbane, QLD 4072, Australia
3
Geotechnical and Hydrological Engineering Research Group, Federation University, Churchill, VIC 3841, Australia
*
Author to whom correspondence should be addressed.
Minerals 2019, 9(12), 760; https://doi.org/10.3390/min9120760
Submission received: 5 November 2019
/
Revised: 3 December 2019
/
Accepted: 4 December 2019
/
Published: 6 December 2019
(This article belongs to the Section Environmental Mineralogy and Biogeochemistry)
Abstract
:Coal mine spoils have the potential to create environmental impacts, such as salt load to surrounding environments, particularly when exposed to weathering processes. This study was conducted to understand the effect of physical and chemical weathering on the magnitude, rate, and dynamics of salt release from different coal mine spoils. Five spoil samples from three mines in Queensland were sieved to three different particle size fractions (<2 mm, 2–6 mm, and >6 mm). Two samples were dispersive spoils, and three samples were nondispersive spoils. The spoils were subjected to seven wet–dry cycles, where the samples were periodically leached with deionised water. The rate, magnitude, and dynamics of solutes released from spoils were spoil specific. One set of spoils did not show any evidence of weathering, but initially had higher accumulation of salts. In contrast, broad oxidative weathering occurred in another set of spoils; this led to acid generation and resulted in physical weathering, promoting adsorption–desorption and dissolution and, thus, a greater release of salts. This study indicated that the rate and magnitude of salt release decreased with increasing particle size. Nevertheless, when the spoil is dispersive, the degree of weathering manages salt release irrespective of initial particle size. This study revealed that the long-term salt release from spoils is not only governed by geochemistry, weathering degree, and particle size but also controlled by the water/rock ratio and hydrological conditions of spoils.
1. Introduction
During coal mining activities, overburden is removed and deposited on land in the form of waste rock dumps commonly known as spoil piles [1,2,3]. When these coal mine spoils are exposed to atmospheric conditions, weathering processes occur that can potentially generate adverse environmental impacts through salt release into final voids and water ways, and/or salt crust formation on the land surface restricting plant growth [4,5]. The potential for impacts can be managed by rehabilitation, for example, by using soil and vegetation covers that exclude most of the rainfall from the underlying rock [2]; however, prior to, during, and following rehabilitation, it is essential to understand the trajectory and magnitude of salt release and transport from spoils.
Salt generation from a spoil heap typically depends on the geochemical properties of the rock [1,6]. As an example, in Australia, water seepage from coal mine spoils tends to be saline due to the presence of soluble ions and their leaching from the spoils during rainfall [6]. Salt leaching processes typically include the dissolution of salts, displacement of the saline solution by water of different hydro-chemical qualities, and then the discharge of saline solution from the porous media [7,8,9]. Adsorption–desorption processes can also occur during displacement and leaching [10,11]. Where some reactive compounds and sulfide-bearing minerals (e.g., pyrite) exist, oxidation (chemical weathering) can occur, leading to acid generation from coal mine spoils that can increase salt load to the surrounding environments [12,13]. This has most commonly been observed in the USA [14].
The quantity of solutes released from the spoils may not only depend on their geochemical properties and processes, but may also be governed by their physical properties. One of these physical properties is particle size [15,16]. The particle size correlates to pore size distribution, which partially controls the flow, flow velocity, its spatial distribution, and its contact time with particle surfaces and, hence, the amount of salt released from the porous media [9,17,18]. For instance, heterogeneous particle size distributions, arising from the rock sources and dumping methods [19,20], may induce preferential flow paths partitioning the pore system into two or more separate porous systems, with different water flux densities and solute mass transport [16,21,22,23]. In extreme cases, a proportion of the flow will also bypass the porous media in the form of surface runoff or subsurface pipeflow [24]. Thus, heterogeneity in physical properties may provide diversity in the amount and kinetics of salt release from a spoil heap.
Physical breakdown of the spoils during weathering may also impact water movement and solute mass transport, as it can change the particle size [16,25]. The rocks may break down to smaller fragments, as small as clay size, through slaking and dispersion during wet–dry cycles [26,27,28]. A greater clay content can also increase the cation exchange capacity (CEC) which promotes the rate of adsorption–desorption and salt leaching intensity [9,29]. All of these factors can alter the extent of salt load to the surrounding environment and, thus, the magnitude of environmental impact.
Coal mine spoils produced in open-cast mining are of particular interest in many countries (e.g., Australia and USA) because of their salt generating capacity. Previous studies have investigated the leaching potential and leachate chemistry of coal mine spoils [16,30,31,32,33], as well as their geochemical characterisation [6,12,25,34,35,36]. However, the influence of weathering on salt generation processes and the magnitudes and rates of salt release are not well understood. Furthermore, the estimation of salt release parameters used in practice generally relies on column leaching tests, where physical degradation is not controlled or measured. As such, there is a lack of evidence to help scale salt leaching rates to different particle size fractions, in particular, scaling to the range of fractions found in spoil heaps and scaling to account for changes in particle size fractions due to long-term weathering. Therefore, this study aims to advance understanding of (i) the dynamics of salt release from different coal mine spoils and (ii) the rates of salt release from different coal mine spoils.
2. Materials and Methods
Spoils of different origin were sampled and then exposed to weathering (wet–dry cycles) conditions through a laboratory funnel leaching experiment. Details of the materials, weathering experiment (funnel leaching experiment), and physical and chemical analyses are presented in the following sections.
2.1. Sample Collection and Classification
Five coal mine spoils from three mines (A, B, and C) located in the Bowen Basin, Queensland, Australia were selected from a larger number of samples as described by Edraki et al. [37]. The five selected spoils (A10, B8, B9, C4, and C6) originate from the same geological period formation but with widely variable chemical and physical properties (Table 1). The studied spoils were then classified by their physical weathering behaviour (degradation degree) based on a 12-month degradation test that was conducted following Nickmann et al. [38]. The studied spoils (approximately 850 cm3) were saturated with DI water (deionised water) for 48 h and then subjected to ambient atmospheric conditions for 28 days. The ambient potential evaporation ranged between 0.22 and 9.36 mm day−1, and the temperature of the environment fluctuated between 22.8 and 31.4 °C.
The degradation test indicated that some spoils can physically break down to smaller particles (<2 mm), while no physical changes were observed in other spoils over the period of the experiment (12 months). Based on the test, we classified the studied coal mine spoils into two groups—soil-like spoils (dispersive spoils: spoils with high degradation degree) and rock-like spoils (nondispersive spoils: spoils with low degradation degree)—to assess the effect of weathering on their salt release potential. This terminology (soil-like and rock-like) was also consistent with the geotechnical classification of spoils [39]. A comprehensive description of the degradation study was reported in Edraki et al. [37].
2.2. Funnel Leaching Experiment
A series of leaching experiments were conducted using free-draining funnels to simulate the weathering conditions on the studied spoils using wet–dry cycles. The spoil samples were firstly sieved to three different fractions: <2 mm, 2–6 mm, and >6 mm. Therefore, based on the spoils’ type, classification (i.e., rock-like or soil-like) and size, the studied spoils were named as follows: A10RL2 (A10, rock-like spoil with <2 mm particles); A10RL26 (A10, rock-like spoil with 2–6 mm particles); A10RL6 (A10, rock-like spoil with >6 mm particles); B8RL2 (B8, rock-like spoil with <2 mm particles); B8RL26 (B8, rock-like spoil with 2–6 mm particles); B8RL6 (B8, rock-like spoil with >6 mm particles); B9SL2 (B9, soil-like spoil with <2 mm particles); B9SL26 (B9, soil-like spoil with 2–6 mm particles); B9SL6 (B9, soil-like spoil with >6 mm particles); C4RL2 (C4, rock-like spoil with <2 mm particles); C4RL26 (C4, rock-like spoil with 2–6 mm particles); C4RL6 (C4, rock-like spoil with >6 mm particles); C6SL2 (C6, soil-like spoil with <2 mm particles); C6SL26 (C6, soil-like spoil with 2–6 mm particles); C6SL6 (C6, soil-like spoil with >6 mm particles). Buchner funnels (diameter: 120 mm; height: 60 mm) were filled with the spoils of different sizes with bulk density of between 0.86 and 1.47 g cm−3 depending on the spoil type and particle size class (Table 2). The selected particle size classes were the particle sizes that could be adapted to the small size of the Buchner funnels used for the experiment. No replicate was produced for each funnel as funnels were representative of the spoil piles and producing an equal bulk density for the funnels filled with the same spoils was not achievable due to the particle size heterogeneity of the spoils.
The funnels were subjected to seven wet–dry cycles by exposure to atmospheric conditions (ambient oxygen, temperature, humidity, and evaporation) following leaching by DI water. During wetting cycles, the funnels were leached with 550 mL of DI water. This is equivalent to a 49 mm depth of water, representing a typical intensive rainfall event in the Bowen Basin. The DI water was slowly applied to the funnels to prevent surface disturbance. After each wet cycle, the funnels were exposed to atmospheric laboratory conditions for approximately 30 days. The potential evaporation in the laboratory ranged between 0.57 and 1.20 mm day−1, and the temperature of the environment fluctuated between 22 and 26 °C.
During each wet cycle, ten successive leachate solutions were collected, each containing one-tenth of the total leachate volume collected. Each leachate solution was then analysed for EC (electrical conductivity) and pH at 20 °C using a TPS 901-CP meter (TPS Pty Ltd, Brisbane, Australia). To analyse the leachate solutions for the major cations, chloride, and total S, we followed the Park et al. [6] method. From Cycles 1 to 3, we combined each three leachate solutions (150 mL) of each leaching cycle and discarded the tenth leachate solution [6]. From Cycles 4 to 7, we combined the first three leachate solutions (150 mL) and discharged the remaining leachate solutions [6]. Subsequently, the major cations and total S were analysed using ICP-OES (inductively coupled plasma optical emission spectrometry) (ThermoFisher Scientific, Waltham, MA, USA). Chloride concentrations were also measured using IC (ion chromatography) (ThermoFisher Scientific, Waltham, MA, USA).
2.3. Chemical Analyses
To measure the concentration of soluble salts prior to any leaching and after the final wet–dry cycle (at the end of the experiment), samples were pulverised to <2 mm. The soluble salts were then analysed using a 1:5 (w (weight)/v (volume)) extraction (pulverised spoils/DI water) by mixing for 2 h, resting for 2 h, and then centrifuging (5 min at 3000 rpm) before collecting and filtering the supernatants (using 0.045 µm filter) to analyse the major soluble cations (Na+, K+, Mg2+, Ca2+) by ICP-OES [40]. The exchangeable cations of the spoils were measured using a 1:20 w/v (pulverised spoils/1 M NH4Cl) extraction by mixing for 2 h and resting for 2 h, followed by centrifugation (5 min at 3000 rpm) and filtering (using 0.045 µm filter) [40]. Before analysing the samples for exchangeable cations, the spoils were treated with 60% ethanol and 20% glycerol to eliminate soluble salts [40].
A 1:5 (w/v) suspension of pulverised spoils with DI water was mixed for 1 h and left to stand for 1 h before measuring the supernatant for EC and pH at 20 °C using a TPS 901-CP meter [40]. To measure the chemical composition of spoils, a small sample (250 mg) of each pulverised spoil (<2 mm) was collected and digested using 5 mL nitric acid (HNO3; 70%), 3 mL hydrochloric acid (HCl; 32%), and 2 mL hydrofluoric acid (HF; 50%) for 1 h at room temperature (22 °C). For further digestion, the samples were placed in the carousel in an Ethos-1 digester and heated at 100% power for 40 min at 200 °C. After digestion, the samples were transferred to a 25 mL volumetric flask and the sample was topped up with DI water. Solution samples were then collected to determine the chemical components using ICP-OES. The mineralogy of the spoils was also determined using the X-ray diffraction method. The X-ray diffraction pattern was produced using a Bruker-AXS D4 XRD (Bruker, Karlsruhe, Germany) with copper radiation at 30 kV and 10 mA. The powder mounts were run over a 2θ beam range of 4 to 80°, with a 0.02 degree step and a 2 s per step count time.
2.4. Physical Analyses
The flow rate of the first leachate collected at each cycle was calculated based on the volume of leachate solution, the time taken to collect it, and the cross-sectional area [41]. The bulk density of the samples was calculated based on the following equation [42].
The particle density values of the spoils were measured using a gas pycnometer [41]. Consequently, the porosity of each spoil was calculated as follows [41]:
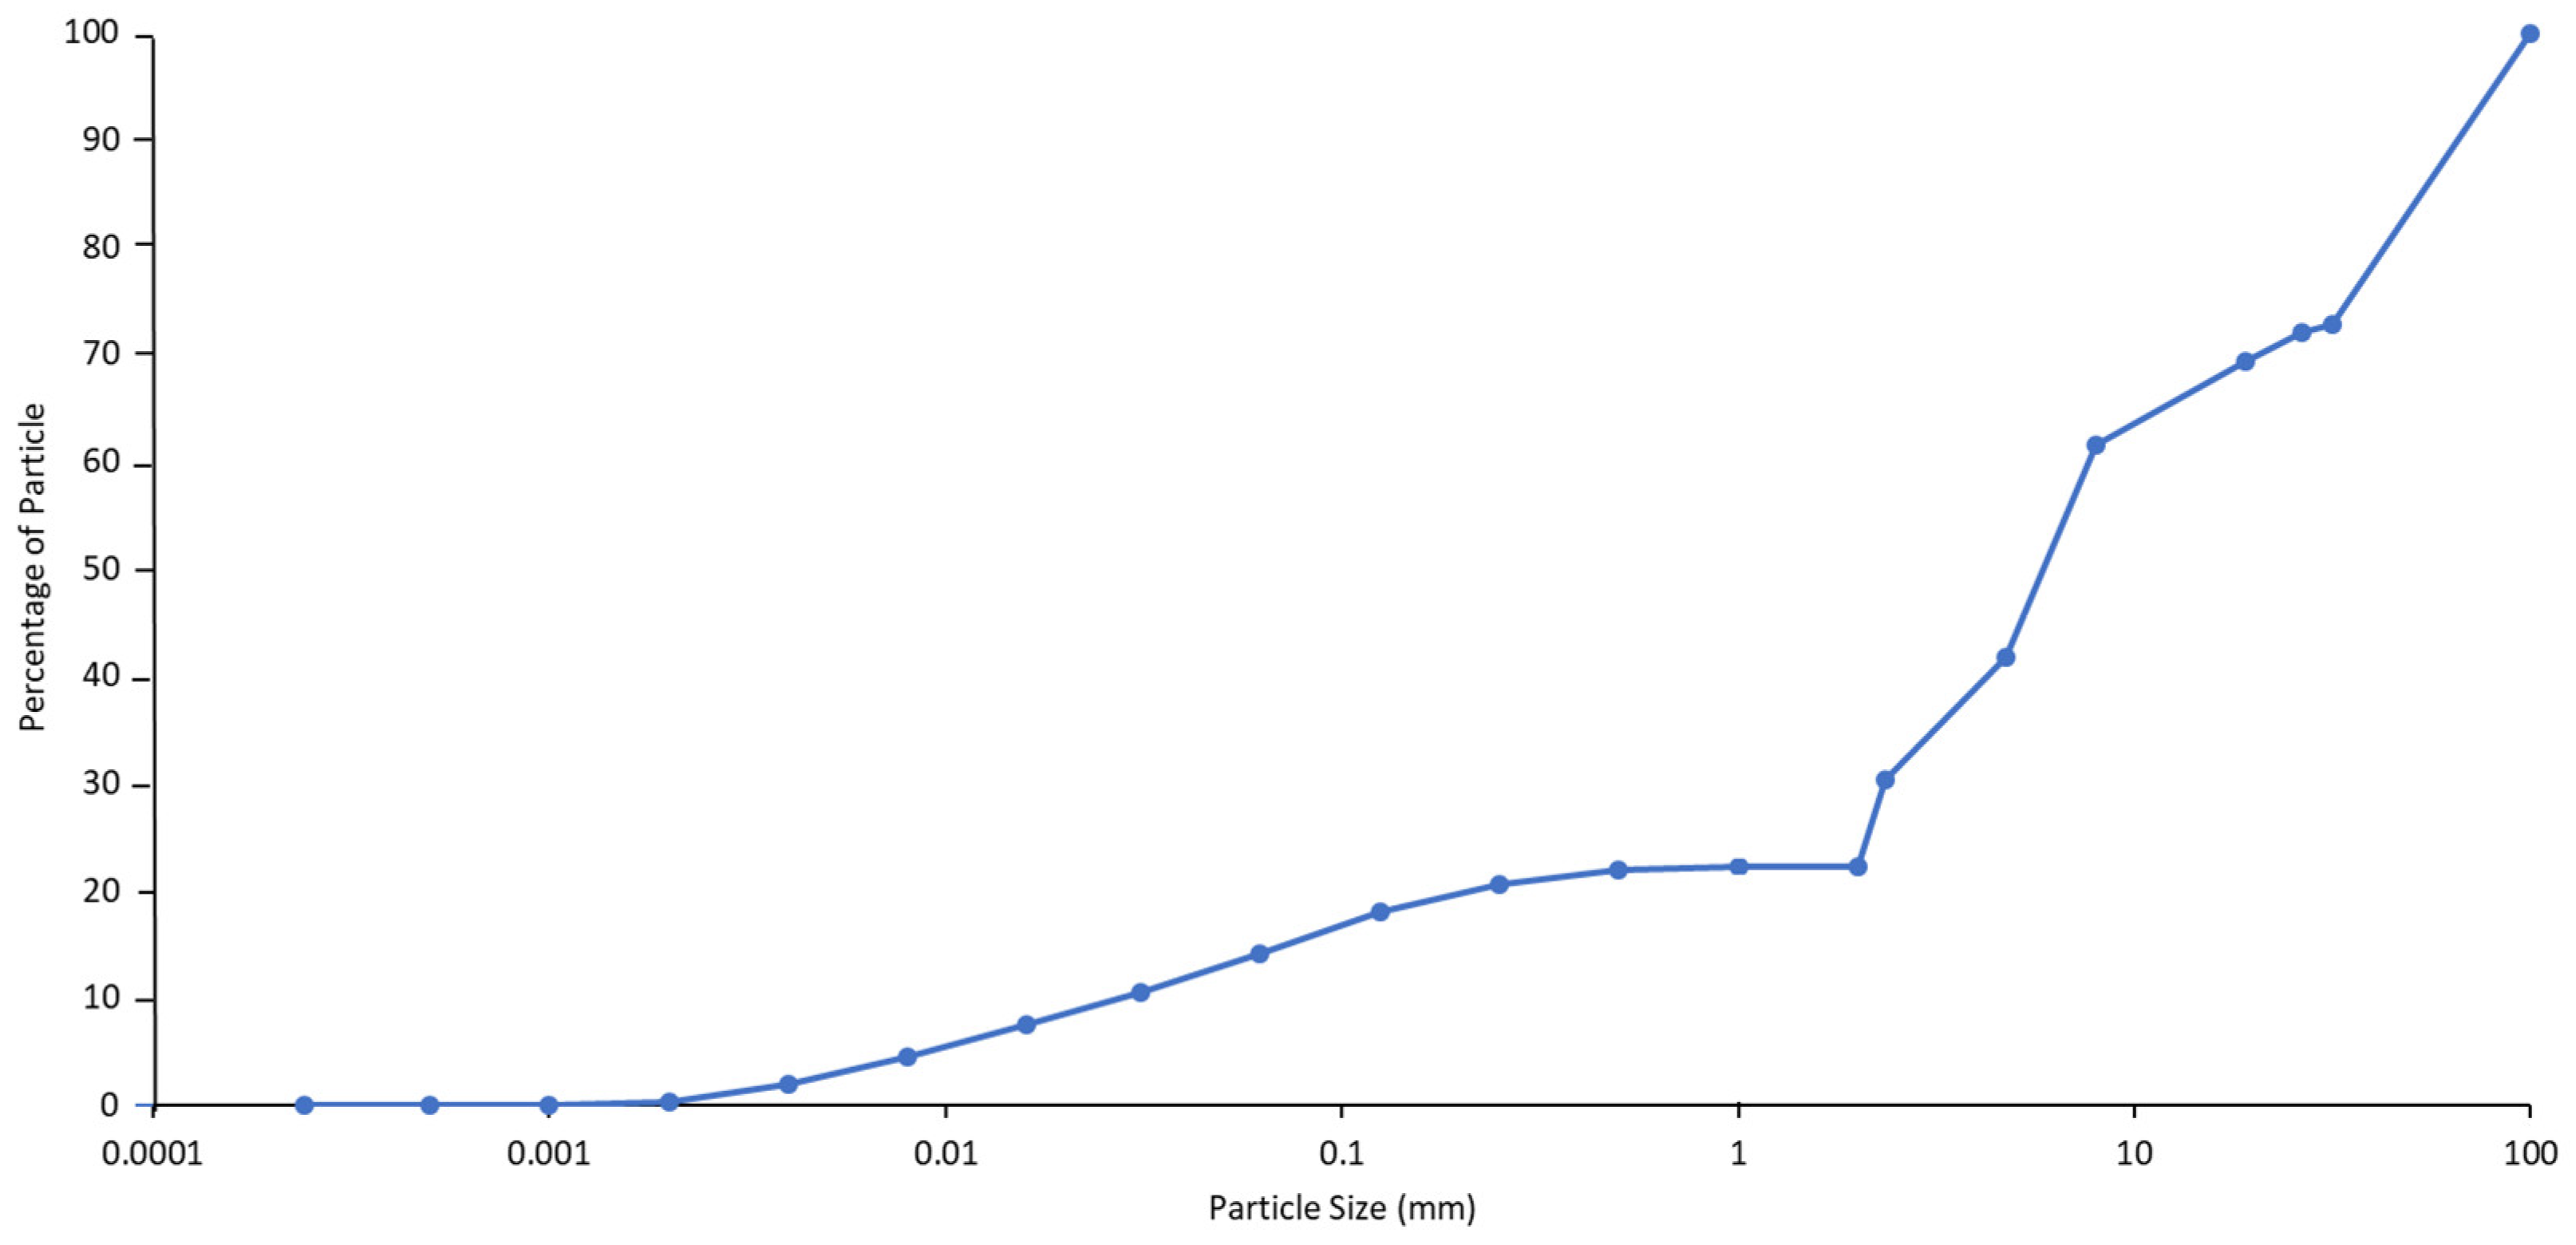
The particle size distributions of three samples (C6SL spoils) were analysed using the hydrometer method as described in Sheldrick and Wang [43]. A 10 mL volume of sodium hexametaphosphate solution (10%) was mixed with each spoil sample (25 g), and a sonifier (Branson model 450) was used for 10 min to break the aggregates [43]. The water retention characteristics of these samples (C6SL spoils) were also determined by the Rosetta model using HYDRUS [44,45]. To calculate the macropore volume of each sample, the water potentials at field capacity were firstly determined based on the following equation as described in Assouline and Or [46].
Subsequently, the volumetric water contents at field capacity were calculated based on the van Genuchten model [47]:
where θ(Ψ) is the water content (L3 L−3); |Ψ| is the suction pressure (L); θs is the saturated water content (L3 L−3); θr is the residual water content (L3 L−3); α is the inverse of the air entry suction (1/L); and n is the measure of the pore size distribution. The macropore volume was then calculated based on the volumetric water content at saturation and field capacity. We analysed the particle size distribution and water retention characteristics for C6SL spoils only, because these spoils were the only ones that showed physical changes (breaking down of the particles) during the laboratory funnel leaching experiment (Figure A1).
2.5. Dynamics of Salt Release and Salt Production Rate
To evaluate the effect of weathering and particle size on the dynamics of salt release from the studied spoils, breakthrough curves were presented with parameters (chemistry of leachate solutions) plotted against the leached pore volume. The studied spoils had different porosity values that resulted in a different number of leached pore volumes for each sample. The same approach was used by other studies [8,9,48] which evaluated the kinetics and the processes involved in salt release from porous media. As the composition of applied water remained constant during the experiment, the breakthrough curves can show detailed variations in the cation composition of the leachate, reflecting processes that occur in the materials over the experiment [48]. In order to be able to use the laboratory data for the assessment of salt release rates from spoils, the mass of salt generated per unit of time was calculated using the following equation [49].
Spearman’s correlation coefficients (p < 0.05) were calculated using R software (Version 3.3.3).
3. Results
3.1. Changes in Physical Properties of the Coal Mine Spoils during Weathering
The initial porosities of samples, which depended on the spoil type and particle size, were found to be between 0.43 and 0.67 cm3 cm−3 (Table 2). The average flow rate increased with increasing particle size for all spoils, excluding the B9SL26 sample, which had a lower flow rate (0.64 mm s−1) compared with the other B9SL spoils (Table 2). The flow rates for C6SL spoils with >2 mm particles decreased over the first three cycles (20 pore volumes of leaching) (Figure 1e), while no such changes in flow rates were observed for the other spoils of that particle size class (Figure 1).
A broad physical breakdown occurred throughout the column after the third and second wet cycle for the C6SL26 and C6SL6 spoils, respectively (Figure A1). These spoils broke down to smaller particles with approximately 23.7% clay content (Table 3). A reduction (up to 13%) was also observed in the porosity values of the C6SL samples (Table 3). A large permanent crack was observed in the C6SL2 sample at the end of the first drying period before the second wet cycle (Figure A1). In contrast, other samples did not show any apparent evidence of physical changes (i.e., permanent vertical cracking) during the experiment (Figure A1).
3.2. Changes in the Chemistry of Leachate Solutions during Weathering
The EC of early leachate solutions was greater (22.1 dS m−1) for the A10RL2 sample than for other spoils (Figure 2). The changes in the EC of the leachate solutions for all A10RL samples followed similar patterns, and decreased gradually to less than 0.58 dS m−1 during leaching of 80 pore volumes (over seven cycles) (Figure 2a). There were no major differences between the ECs of early leachate solutions for B8RL and B9SL spoils with the same particle size class (Figure 2b,c). Over the course of the experiment, the EC of leachate solutions was reduced slightly for B8RL and B9SL spoils with <6 mm particles. However, within each wet cycle, an increase in salinity was observed for the B8RL26 sample (Figure 2b,c). The leachate salinity for the B8RL2 sample also intensified during the sixth wet cycle before reducing to its initial extent (Figure 2b). The EC of the leachate was relatively stable for the B8RL6 and B9SL6 samples (Figure 2b,c).
The continuous application of DI water to C4RL2 resulted in an initial rapid increase in EC, up to 8.3 dS m−1 during the first cycle (up to three pore volumes) (Figure 2d). The EC then gradually reduced to less than 0.3 dS m−1 after 25 pore volumes of leaching (the third wet cycle) before approaching steady state conditions (Figure 2d). The leachate EC from C4RL samples with >2 mm particles declined slightly with some cyclic increases in salinity at the beginning of each cycle (Figure 2d). The EC for the C6SL2 sample reduced from 22 dS m−1 to less than 1.7 dS m−1 during the first cycle (nine pore volumes of leaching) before a substantial decline to 0.2 dS m−1 at the beginning of the second cycle (Figure 2e). The EC then increased instantly to 1.7 dS m−1 before decreasing and remaining relatively constant (Figure 2e). The leachate EC from the C6SL26 sample fluctuated during the first three cycles before increasing to 5.8 dS m−1 and then decreasing to less than 0.2 dS m−1 (Figure 2e). A similar pattern was also observed for the C6SL6 sample with variations in the first two cycles before reducing constantly to 0.3 dS m−1 (Figure 2e).
The pH values for leachate solutions from the C6SL spoils ranged between 2 and 4 (Figure A2). Conversely, other studied spoils (A10RL, B8RL, B9SL, and C4RL) released alkaline leachate solutions, with their pH values ranging between 6 and 10 depending on the spoil type and size (Figure A2).
The initial Na+ concentration of the leachate was greater for the A10RL2 sample (165.8 mmol L−1) than for the other studied spoils (Figure 3). Subsequently, the greatest reduction (164.2 mmol L−1) in Na+ discharge was observed from this sample (Figure 3). The release of Na+ from the A10RL, B8RL, and B9SL spoils followed similar patterns, and Na+ release decreased over the experiment (Figure 3). The sodium ion concentrations of leachate solutions for the C4RL2 sample initially increased from 45 mmol L−1 to 56 mmol L−1 before decreasing gradually to less than 0.6 mmol L−1 over 50 pore volumes (Figure 3d). A slight reduction was also observed in the concentrations of Na+ from C4RL spoils with larger particle sizes (>2 mm), with Na+ falling to less than 1.64 and 1.83 mmol L−1 for C4RL26 and C4RL6, respectively, at the end of the experiment (Figure 3d). For the C6SL2 sample, Na+ concentrations sharply reduced from 0.47 to 0.12 mmol L−1 at the second cycle (14 pore volumes) before increasing to 0.28 mmol L−1 at the end of the experiment (Figure 3e). Likewise, the Na+ concentrations decreased until the third cycle (22 pore volumes) for C6SL samples with >2 mm particles before increasing to approximately their initial extents at the end of the experiment (Figure 3e).
The dynamics of Ca2+ release from the A10RL, B8RL, B9SL, C4RL, and C6SL2 spoils followed a similar pattern to the release of Na+ from these spoils (Figure 3 and Figure 4). In contrast, Ca2+ concentrations in the leachate solutions from the C6SL26 sample increased to 1.4 mmol L−1 at the fourth cycle, before decreasing to 0.08 mmol L−1 at the end of the experiment (Figure 4e). Calcium ion release from the C6SL6 sample followed a similar trend, but the maximum generation of Ca2+ occurred at the third cycle (Figure 4e).
The release of Mg2+ correlated (ρ > 0.70, p < 0.05) with the release of Ca2+ for all spoils, excluding the B8RL26 and C4RL6 spoils (Figure A3). The trajectory of K+ release was spoil specific (Figure 5). The concentrations of K+ increased in the leachate solutions over the cycles, particularly for C6SL spoils (Figure 5). An increase in K+ production was also observed for the A10RL2, A10RL26, B8RL26, and C4RL26 spoils (Figure 5). The A10RL2 sample had a higher initial Cl− production (195 mmol L−1) among the studied spoils, and the concentrations of Cl− in the leachate solutions of all spoils decreased over the course of experiment (Figure A4). However, the release of Cl− from C6SL spoils of >2 mm correlated (ρ > 0.90, p < 0.05) with the trajectory of Mg2+ and total S release (Figure A5). The dynamics of total S production followed similar patterns to the release of Ca2+, particularly for C6SL samples (Figure A6).
3.3. Rate of Salt Release from the Coal Mine Spoils
The rate of the release of soluble ions decreased with the increased size of particles for all studied spoils, excluding the B9SL26 sample, where the rate of release of ions was the greatest among the spoils of same type (Table 4). Greater rates of Na+ (7.4 mg kg−1 day−1) and Cl− (11.54 mg kg−1 day−1) release were calculated for the A10RL2 sample (Table 4). The C6SL2 sample also had higher rates of Mg2+, Ca2+, and total S release (Table 4).
3.4. Changes in Chemical Properties of the Coal Mine Spoils after Weathering
Firstly, the spoils with similar lithology and geological formation were compared to understand whether different degradation degrees could result in a similar amount of salt reduction in spoils of the same particle size at the end of the experiment. In this study, the amount of salt reduction was spoil specific and size specific (Table 5). However, interestingly, the reductions in the salinity values of all C6SL spoils were comparable (Table 5).
Secondly, the exchangeable cations and soluble ions at the beginning and the end of the experiment were compared to detect the occurrence of adsorption–desorption processes during weathering, as Shaygan et al. [9] reported that this comparison can assist with understanding of the magnitude of adsorption–desorption processes. Remarkably, the final exchangeable Na+ and K+ for C6SL spoils were greater than the initial values (Table 5). In contrast, their final exchangeable Ca2+ and Mg2+ were lower than their initial values (Table 5). Likewise, the final soluble Na+ and K+ concentrations for C6SL spoils were greater than their initial values (Table 6). Conversely, their final soluble Ca2+ and Mg2+ concentrations were lower than their initial values (Table 6).
4. Discussion
4.1. The Effect of Particle Size on Salt Release from the Coal Mine Spoils
Salts can be dissolved, displaced by other ions, and leached by water percolating through pores [9]. Therefore, the amount, rate, and trajectory of salt release from porous media depend not only on the geochemistry (primary and secondary mineralogy) of the materials but also on the hydrological conditions (hydraulic conductivity, pore size distribution, and connectivity) of the materials; these are influenced by particle size and affect the rate of water flow and, thus, solute mass transport through modifying leaching characteristics (i.e., adsorption–desorption and dissolution rates) [9,31]. Similar to Jurinak et al. [50], who concluded that increasing soil particle size reduces the dissolution rate and salt release, this study showed that spoils with a larger particle size release lower solute masses (Table 4). Hartmann et al. [18] reported that the accessibility of the exchange surface increases with increasing water percolation time in pore systems. In this study, flow rate was inversely correlated with the magnitude and rate of ion release (Figure 1 and Figure 2 and Table 2, Table 3 and Table 4). Therefore, fast water movement induced by large particles could possibly reduce the contact time for ion exchange between water and spoils’ surfaces and decrease the rates of adsorption–desorption and dissolution processes, thus reducing the leaching efficiency and magnitude of the release of solutes from spoils with larger particles.
The breakdown of fragments into smaller particles can change the pore size distribution and connectivity and induce slower hydraulic conductivity [51,52,53,54]. Physical weathering can also break down fragments into clay size particles with larger reactive surfaces [28,54,55]. All the above factors can lead to a higher leaching efficiency of the materials and also lead to greater salt release from porous media. In this study, physical weathering induced by oxidation (Figure A1) reduced the flow rates of C6SL spoils over the experiment (Figure 1e). Simultaneously, physical weathering increased the amount of clay size particles (Table 3). These factors intensified ion exchange rates and the magnitude of salt release from the C6SL26 and C6SL6 samples (Table 5 and Figure 3 and Figure 4). In this context, Reading et al. [8] reported that prolonged leaching of a pore system can reveal the influence of cation exchange and electrolyte effects on salt release. During the weathering of the C6SL26 and C6SL6 spoils, a reduction in the Ca2+ and Mg2+ concentrations of the leachate solutions coincided with an increase in the Na+ and K+ concentrations of those same solutions, which could indicate the occurrence of ion exchange reactions (Figure 3, Figure 4 and Figure 5 and Figure A3). Ion exchange was also confirmed by the comparison of exchangeable cations before and after the weathering experiment (Table 5). Therefore, the intensified ion exchange rate, in combination with pyrite oxidation, possibly led to a substantial rise in the leachate salinity for the pyrite-containing samples (C6SL26 and C4SL6) during the fourth and third wet cycles (Figure 2e). These processes also controlled the observed similar reduction in salinity of the C6SL spoils with different particle size classes during the weathering experiment (Table 5). All the above suggest that the initial particle size plays an important role in salt production and release. However, in the case of sulfidic spoils, it is the degree of weathering which mainly governs the magnitude, rate, and dynamics of salt release.
4.2. The Effect of Physical and Chemical Weathering on Salt Release from the Coal Mine Spoils
The magnitude of salt release from a porous medium depends on the amount of soluble salts and the dissolution and adsorption–desorption rates [4]. In this study, the A10RL spoils had a higher amount of initial soluble salts (here, NaCl), as they were aged (weathered) spoils collected from the seepage point. These spoils also contained sedimentary sandstone with variable amounts of carbonates and chlorites (Table 1), which could dissolve over time. All the factors mentioned above could elevate the magnitude of salt release from A10RL spoils, particularly for A10RL2 spoils (Table 4 and Figure 2). The same process (dissolution of carbonate compounds) possibly resulted in a cyclic increase of salinity within each cycle for the B8RL26 spoil and caused a sudden rise in the salinity of leachate solutions for the B8RL2 spoil during the sixth cycle (Figure 2). Therefore, this study found that the original lithology, intrinsic salts, and the presence of authigenic minerals (i.e., carbonates), as well as the magnitude of dissolution and adsorption–desorption processes, can affect the quantity and rate of salt release from coal mine spoils.
The exposure of rocks to atmospheric conditions (wet–dry cycles) can result in the physical weathering of the rocks through slaking layered silicates (i.e., clay minerals) and the expansion of clay minerals, which are associated with moisture absorption, and then dispersion (Price, 1995). The degradation test by Edraki et al. [37] (with 48 h saturation and 28 days drying) showed that the B9SL sample is a dispersive spoil. However, in this study, when the moisture regime was changed (49 mm intensive rainfall and no rain for approximately 30 days), B9SL spoils, which are geologically described as mudrock, showed no evidence of physical weathering and released only small amounts of solutes (Figure 2 and Figure A1). This suggests that the salt generation from coal mine spoils containing mudrock is driven by the moisture regime, which determines the degree of dispersion/physical weathering. In other words, a high water/rock ratio (a high volume of water) or saturation conditions and longer residence times are required for the dispersion of mudrock, which promotes salt production. If the interval of wet cycles was shorter, and/or the duration of leaching (wet cycle) was longer, the magnitude and rate of salt release would increase from mudrock (here, the B8RL and B9SL spoils). Therefore, based on the rock type classification, this study suggests that mudrock spoils generally require a high water/rock ratio for weathering to provide conditions for the production of a considerable amount of solutes.
In some instances, a short exposure of spoils to moisture can result in broad physical weathering [26]. An example of this can be found in reactive, sulfide-bearing rocks in the aerated zone of spoil piles, where the oxidative weathering process can occur and lead to acid generation and the formation of secondary friable minerals (e.g., hydrated sulphates) that exacerbate physical weathering. Given that this chemical weathering process is mineralogy (e.g., pyrite) dependent, it can modify the trajectory of salt release and increase the rate and the magnitude of salt production from coal mine spoils, as was demonstrated in the C6SL26 and C6SL6 spoils (Figure 2). Exposure of pyrite to moisture, in the presence of oxygen, generated acid (Figure A2 and Figure A6), which caused the breakdown of spoils to smaller particles (Figure A1 and Figure A8 and Table 3) and amplified the rate and magnitude of salt release from these spoils (Figure 2 and Table 4). The onset of salt release depends on the time in which an optimal volume of moisture and oxygen is achieved from the sulfide-bearing spoils. For this reason, the increase in leachate salinity of the C6SL6 sample commenced sooner than those of other C6SL spoils (Figure 2). The C6SL6 sample had a greater volume of macropores, which trap a greater volume of water, followed by a greater volume of oxygen when water is released, compared with the other C6SL spoils (Table 3). This provided conditions to achieve the optimum volume of oxygen and moisture quicker than other spoils of the same type.
Weathering can create preferred flow pathways within porous media [17]. As water tends to move rapidly through these preferred pathways rather than the soil matrix, at least in wet conditions, a reduction in the release of ions from the pore system occurs [17]. In this study, a large crack which was formed on C6SL2 before the second cycle (Figure A1) possibly resulted in a rapid reduction of salinity in leachate solutions at the beginning of the second cycle (Figure 2e). As the spoil material was moistened, the crack was closed by swelling, and flow rates were reduced (Figure 1e); thus, the salinity of the leachate solutions began to increase (Figure 2e). Although the crack extended throughout the life of the experiment for C6SL2, significant fluctuations were not observed after the second cycle due to the existence of a low amount of soluble salts in the material.
4.3. Implications for Management of Coal Mine Spoils
There is continuous discussion about the projection of salt loads into final voids of coal mines and about what the intensity and longevity may be of the impact caused by the salt release from spoil piles containing different minerals that potentially produce saline and/or acidic discharge. This study showed that firstly, the intensity and longevity of salt release to final voids are spoil specific and are related to the original lithology, intrinsic salts, and the presence of authigenic minerals, as well as the magnitude of dissolution and adsorption–desorption processes. For example, the C6SL and C4RL spoils both belonged to the German Creek formation, comprising sandstone and collected from the same mine site. However, the existence of pyrite and its oxidative weathering resulted in a greater release of solutes from the C6SL spoils compared with the C4RL spoils (Figure 2 and Table 1). Secondly, salt release to final voids is governed by particle size and the hydrological conditions of spoil piles. For instance, the B8RL and B9SL samples, which contained mudrock and were collected from the same mine (Table 1), did not release high amounts of salts due to the moisture-regime-dependent nature of these types of rocks for salt production. This study also confirmed the influence of the hydrological conditions of spoils on salt release through fluctuations in the amount of salt release when a preferred pathway (crack) in the C6SL2 sample occurred.
This study contributes to understanding the mechanisms that control salt generation and release from spoil piles, supporting the use of predictive hydro-geochemical models. The decay values which can be produced based on the results of this study, including the chemistry of leachate solutions (Figure 3, Figure 4 and Figure 5, Figure A2 and Figure A3), initial geochemistry of the spoils (Table 1), and the time of ion discharge can provide a starting point for the long-term prediction of salt release from spoil piles. Hydro-geochemical models, which can perform and integrate complex scenarios and mechanisms, can be used to predict the intensity and longevity of salt release from a spoil pile to surrounding environments (e.g., final voids). Up until now, modelling of salt generation from mine wastes has mostly been based on simulations assuming homogeneous distributions of hydraulic and geochemical properties [56,57]. However, the spoil piles are heterogeneous with strong spatial and temporal variability in their physical and chemical properties [21] which provide challenges for scaling up and the prediction of salt release from spoil piles. The decay values can be used in a hydro-geochemical model that can also consider a range of particle size fractions and thus assist with more precise estimation of salt production (both spatially and temporally) from a coal mine spoil pile. As an example, the Na+ decay values presented in Figure A7 can also be used in hydro-geochemical models for the prediction of salt release. Nevertheless, the decay values require optimisation based on the moisture conditions of the site (i.e., the water/rock ratio), initial hydrological and geochemical characteristics of the spoil pile, and the degree of weathering.
In Australia, similar to other parts of the world, coal mines are required to be rehabilitated either to agricultural or grazing lands, or to be rehabilitated by revegetation, typically using native or local plants to reinstate the disturbed land to a level of ecosystem functionality, preferably to the exact same state as it was prior to coal mining [2,58]. While the types of coal mine spoils are site specific, the typical rehabilitation technique (in Australia) involves creating a landform using spoils, placement of soil (up to a depth of 30 cm [2]) on top of the spoil pile, seeding, and the addition of fertilisers to create conditions for plant growth on the landform [59]. Salt release from coal mine spoils is one of the main factors that can limit plant growth not only by creating saline seepage, but also by upward salt movement during dry periods. This experimental study demonstrated that spoils that had a larger particle size most often generated lower concentrations of saline solutions (Table 4), suggesting that the placement of a layer of spoils with large particles (>6 mm) in the post-mining landform (below the soil cover) may be an effective strategy in reducing saline seepage and upward movement of salt. During wet periods, the spoils with large particles may release a higher volume of water but fewer solutes, as was discussed previously. During drought conditions, the upward movement of solutes is predicted to be lower within the spoils with large particles, due to the lower potential of creating capillary rise, which is inversely related to pore size and particle size [60,61,62]. This can reduce the intensity and longevity of the impacts potentially caused by salt release. Based on the results of this study, with respect to the moisture regime of the site, the application of nondispersive spoils (spoils with low degradation degree; rock-like spoils) with larger particles may be more beneficial, as they are less impacted by weathering and do not provide suitable conditions for salt release to surrounding environments. Further studies are required to examine the effectiveness of the suggested landform design in relation to the climatic conditions and moisture regime of each specific mine site.
5. Conclusions
The amount, rate, and dynamics of salt release to the surrounding area of coal mine spoil piles (e.g., final voids and water ways) are defined by the magnitude of geochemical processes such as dissolution and adsorption–desorption, as well as the quantity of soluble salts and the presence of authigenic minerals in the spoils. This study showed that these geochemical processes can be affected by the weathering degree, particle size, and hydrological conditions of the spoils over time, and thus modify the intensity and longevity of salt release to the surrounding environments. If the spoils are not dispersive (i.e., spoils with low degradation degree), the initial particle size governs salt load to the environment, in which salt production is reduced with increasing particle size. In contrast, the degree of weathering controls the salt release from dispersive spoils (i.e., spoils with high degradation degree). In this context, developing a hydro-geochemical model using the calculated decay curves of salt release for known classes of spoils can assist with scaling up and the accurate prediction of salt load to the surrounding areas.
Author Contributions
Conceptualisation, N.M., T.B. and M.E.; Formal analysis, M.H. and M.S.; Funding acquisition, N.M., T.B. and M.E.; Investigation, M.H. and M.S.; Methodology, N.M., T.B. and M.E.; Writing—original draft, M.S.; Writing—review and editing, M.H., M.S., N.M., T.B. and M.E.
Funding
This research was funded by Australian Coal Association Research Program, grant number C25039.
Acknowledgments
The authors would like to thank Centre for Mined Land Rehabilitation and Centre for Water in the Minerals Industry for technical support of this study.
Conflicts of Interest
The authors declare no conflict of interest. The funders had no role in the design of the study; in the collection, analyses, or interpretation of data; in the writing of the manuscript; or in the decision to publish the results.
Appendix A
Figure A1.
Photos indicating the physical changes in coal mine spoils before each wet cycle.

Figure A2.
pH of leachate solutions as a function of pore volumes: (a) A10RL, (b) B8RL, (c) B9SL, (d) C4RL, and (e) C6SL.
Figure A2.
pH of leachate solutions as a function of pore volumes: (a) A10RL, (b) B8RL, (c) B9SL, (d) C4RL, and (e) C6SL.
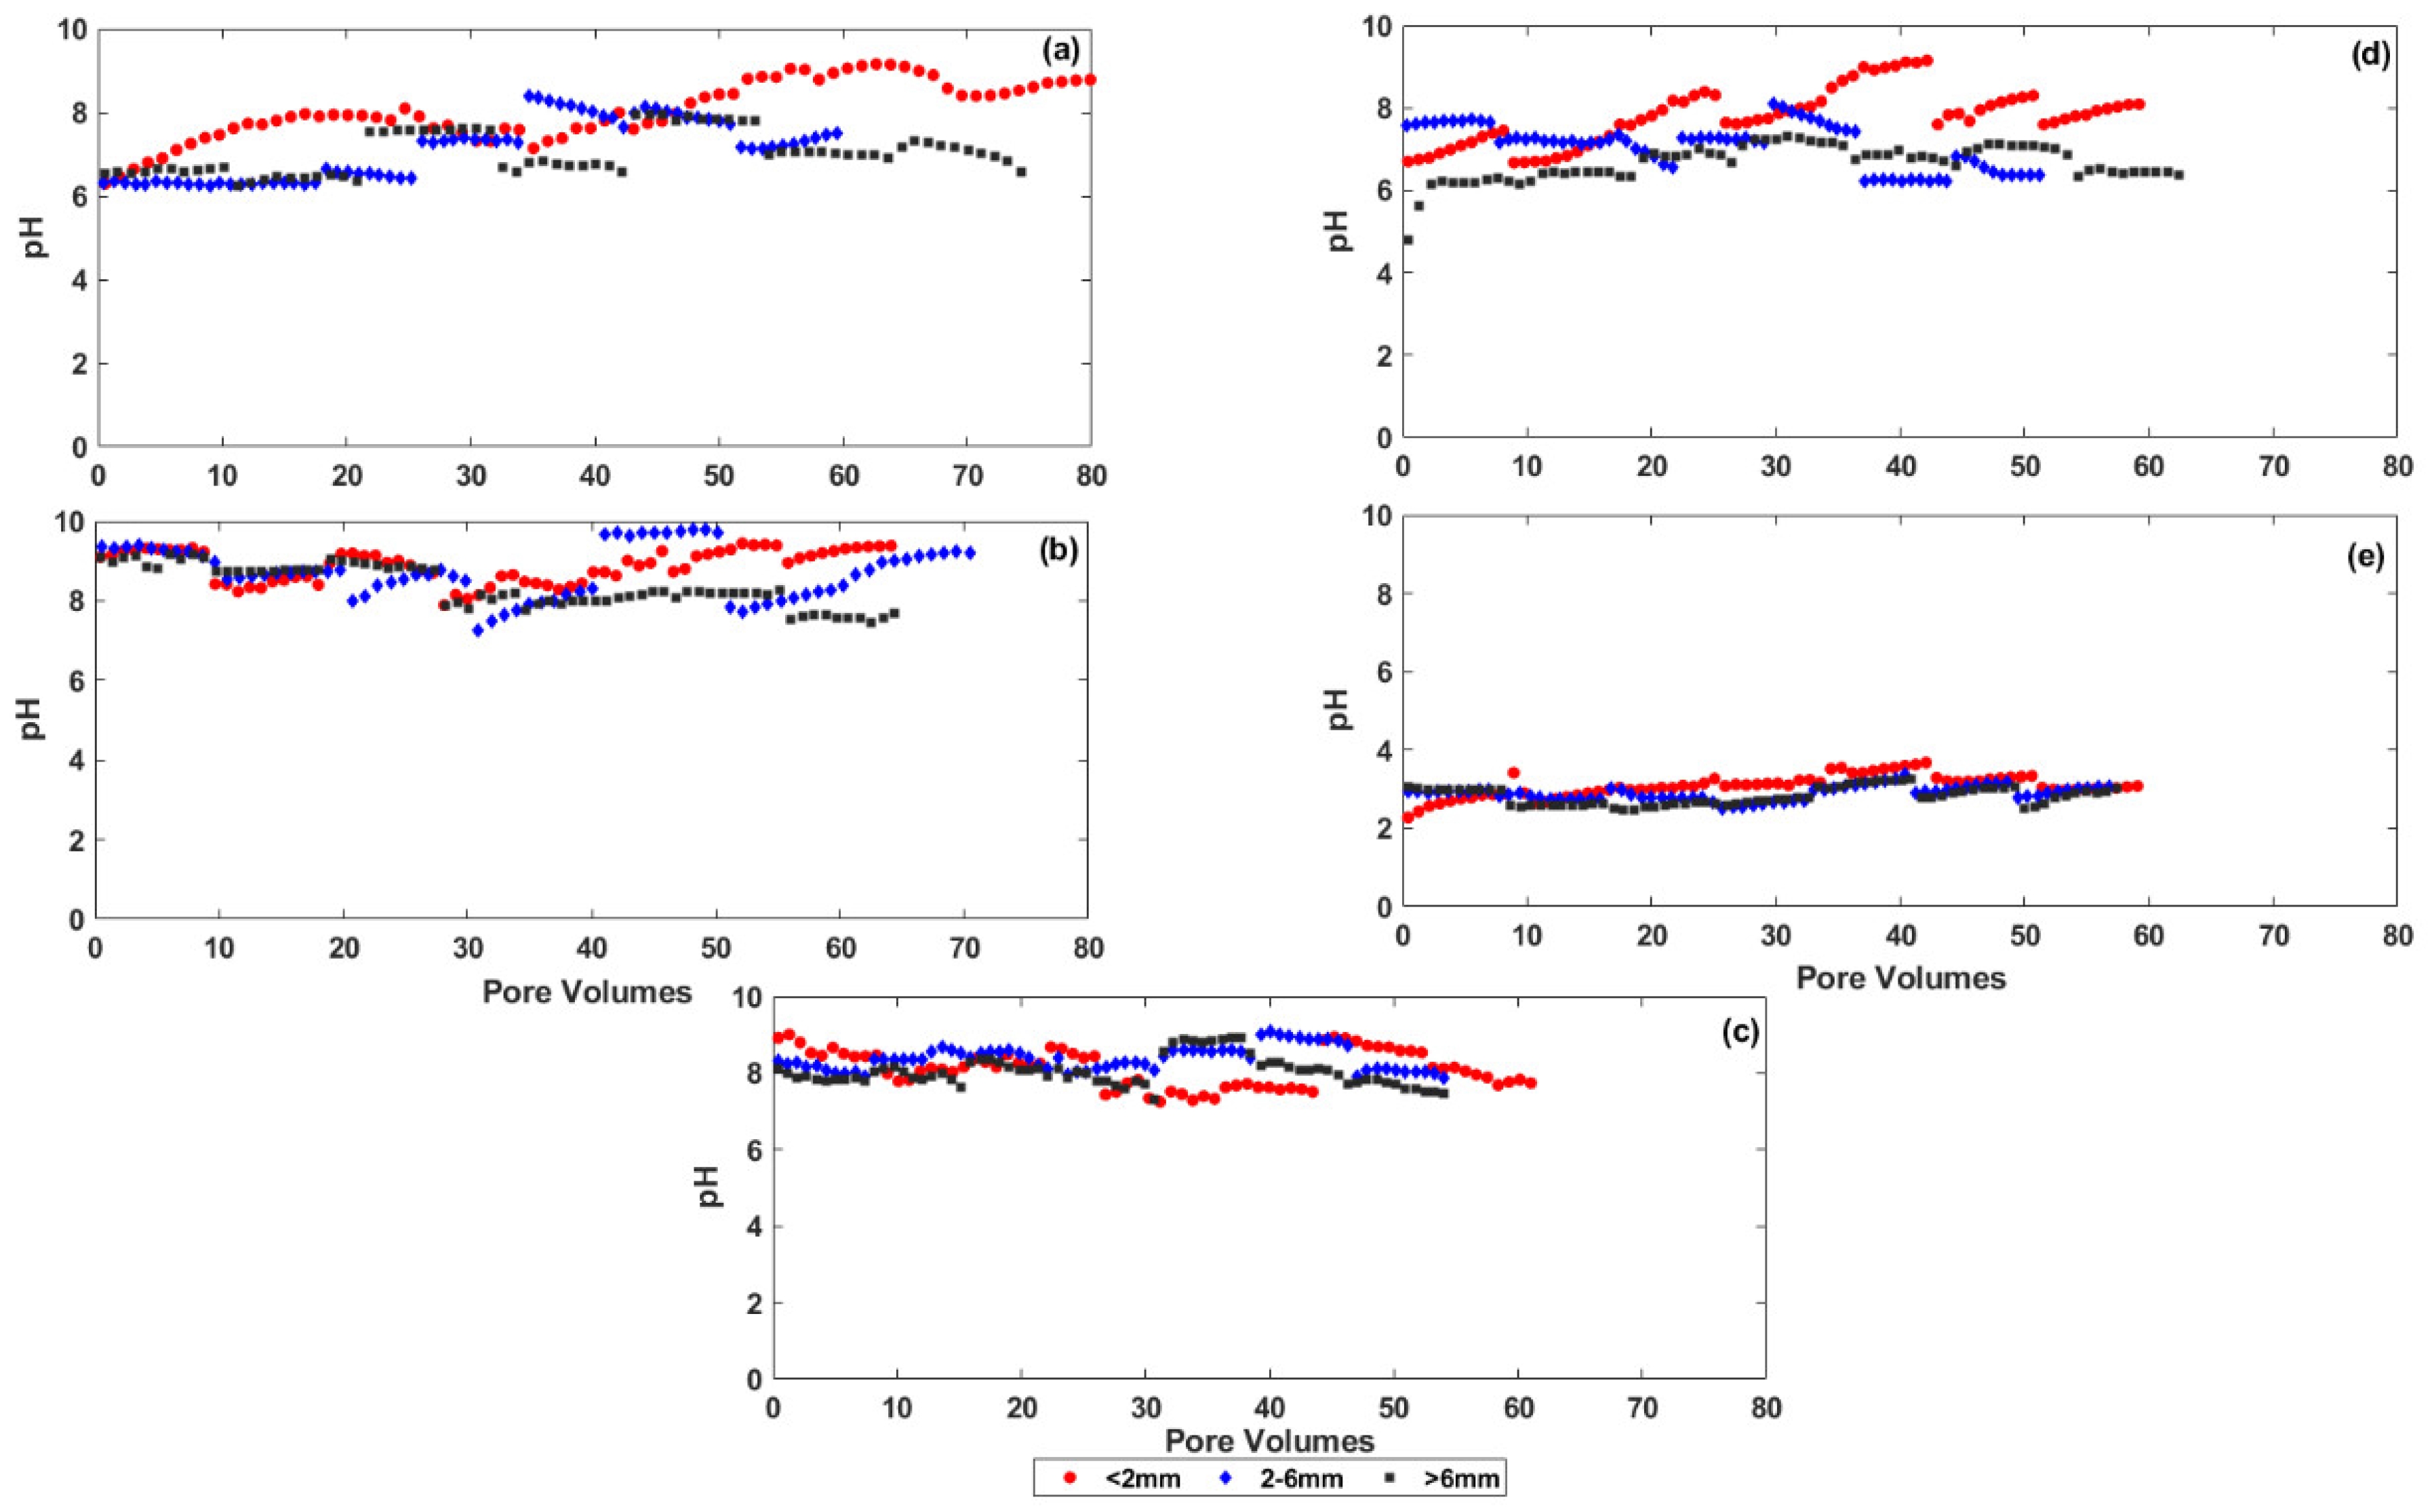
Figure A3.
Magnesium (Mg2+) concentration of leachate solutions as a function of pore volumes: (a) A10RL, (b) B8RL, (c) B9SL, (d) C4RL, and (e) C6SL.
Figure A3.
Magnesium (Mg2+) concentration of leachate solutions as a function of pore volumes: (a) A10RL, (b) B8RL, (c) B9SL, (d) C4RL, and (e) C6SL.
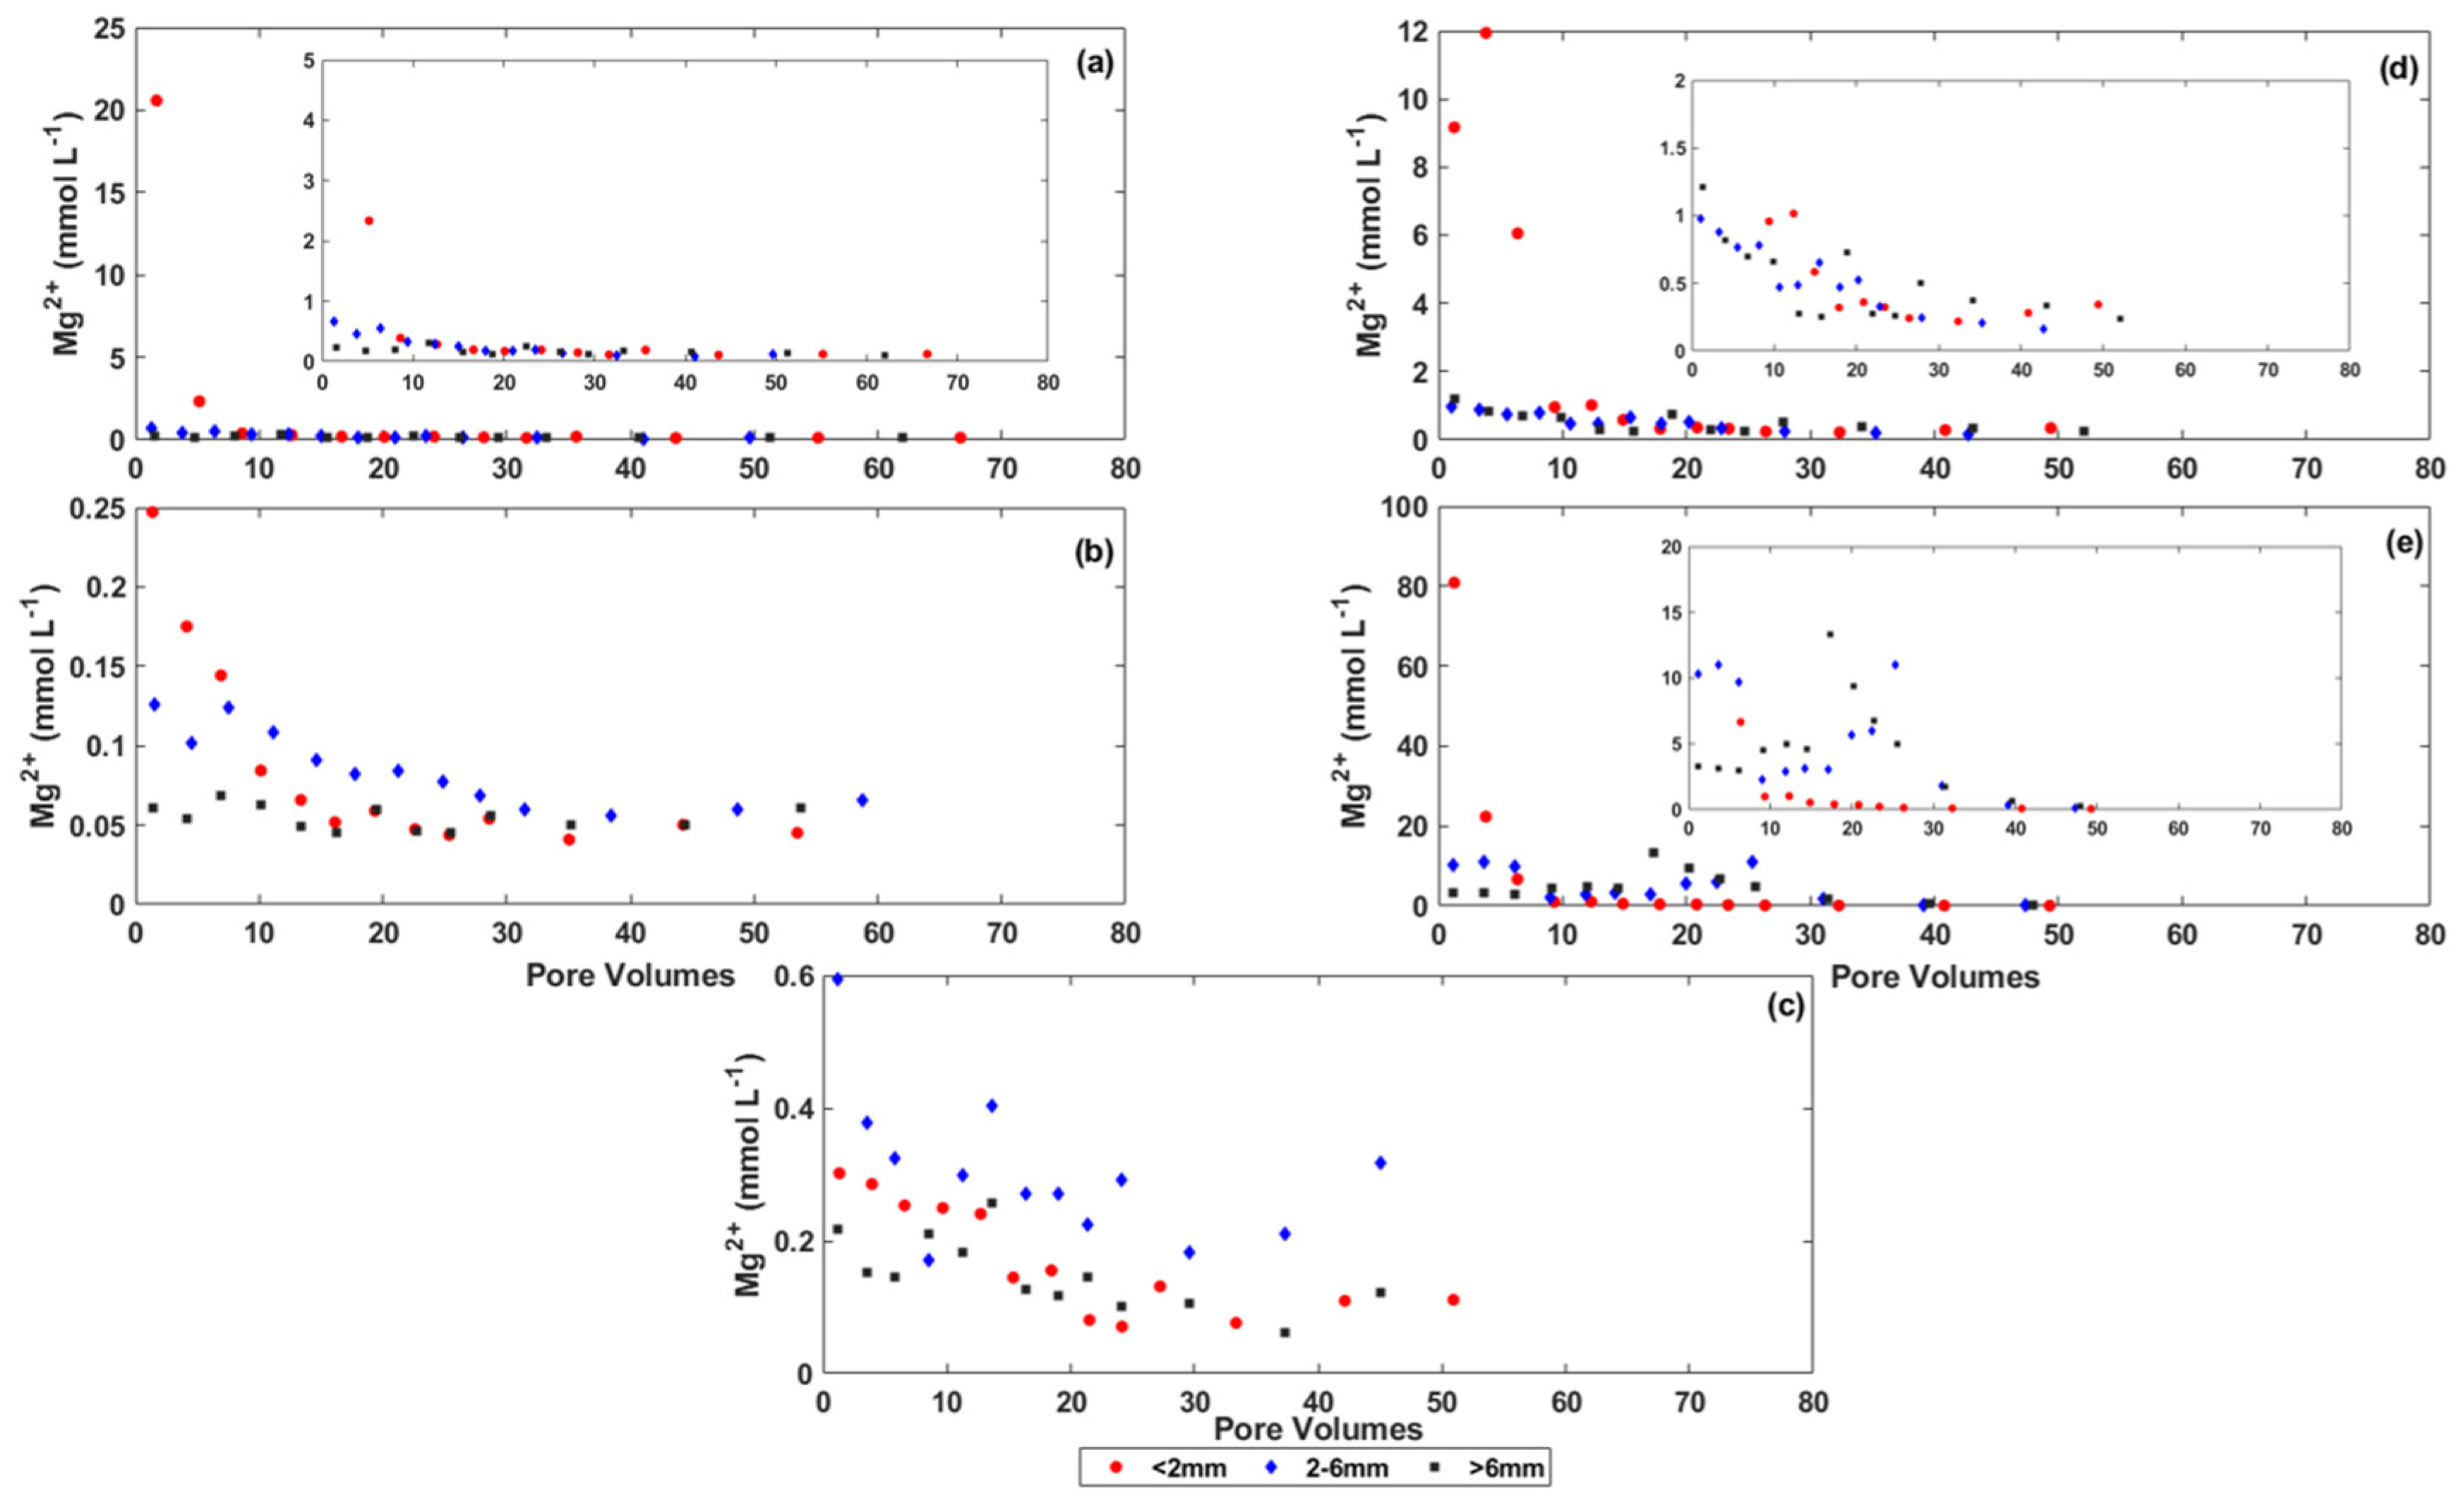
Figure A4.
Chloride (Cl−) concentration of leachate solutions as a function of pore volumes: (a) A10RL, (b) B8RL, (c) B9SL, (d) C4RL, and (e) C6SL.
Figure A4.
Chloride (Cl−) concentration of leachate solutions as a function of pore volumes: (a) A10RL, (b) B8RL, (c) B9SL, (d) C4RL, and (e) C6SL.
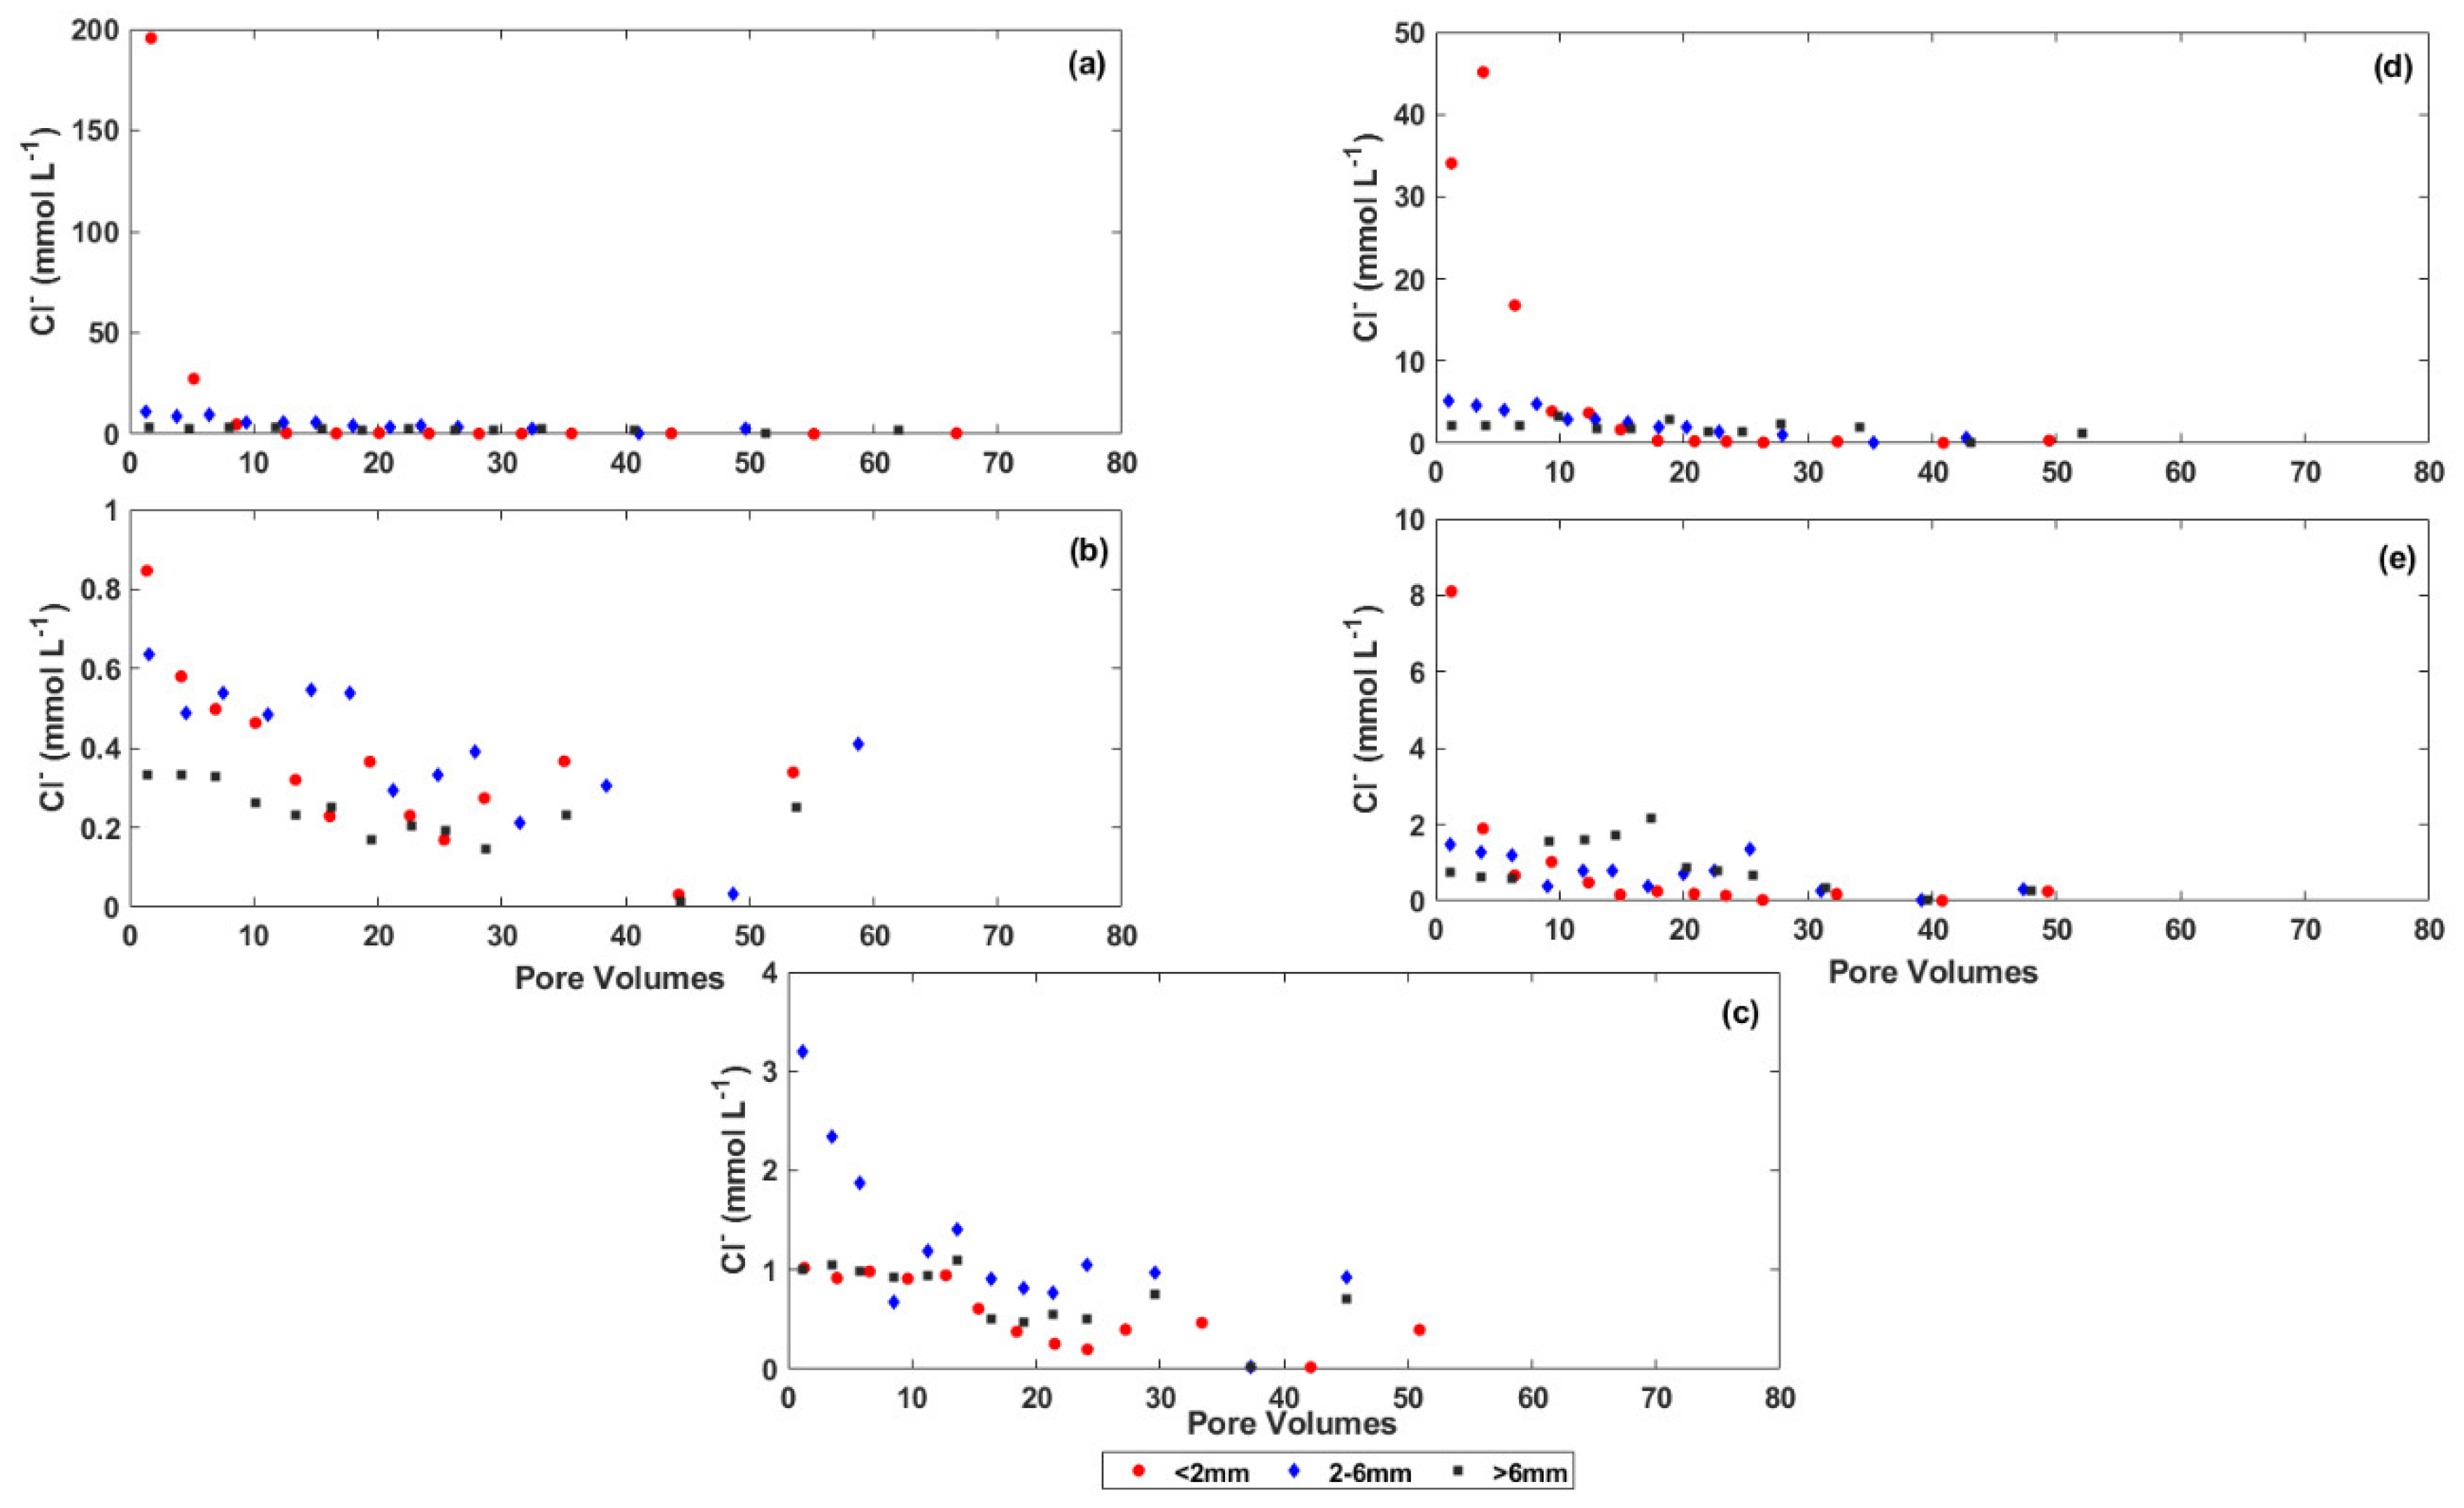
Figure A5.
Spearman’s correlation matrices for C6SL spoils: (a) C6SL2, (b) C6SL26, and (c) C6SL6.
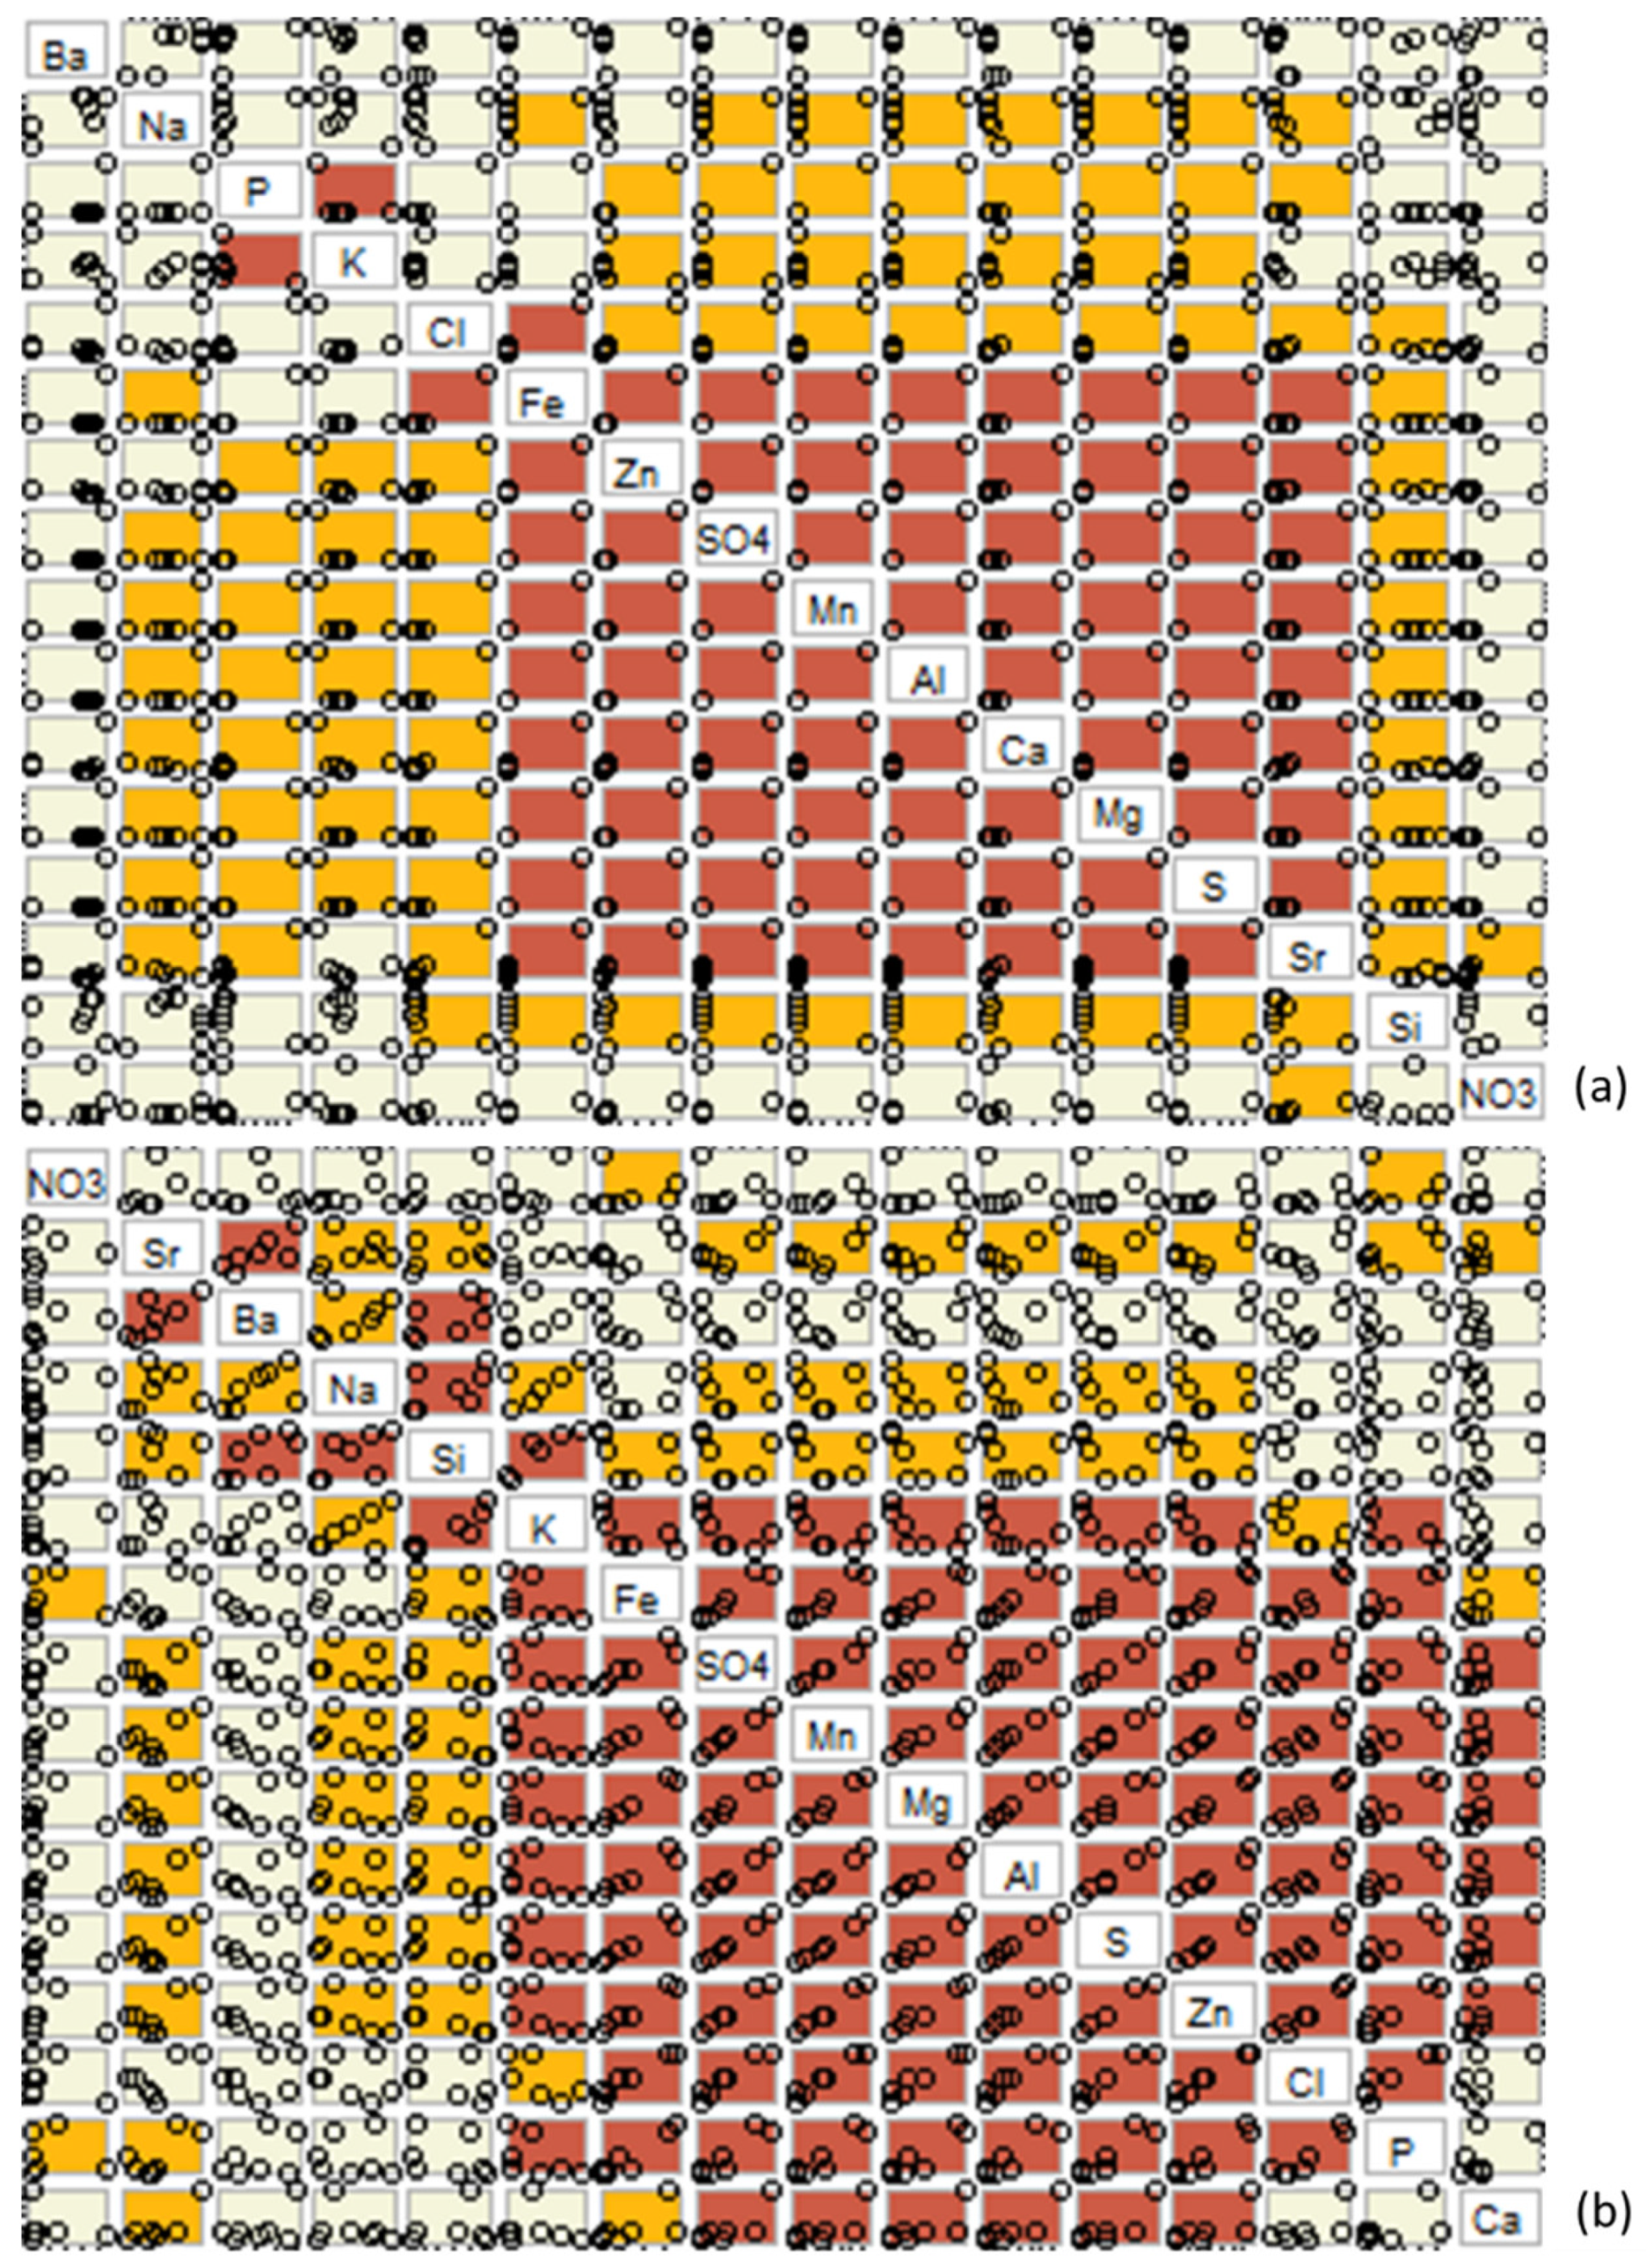
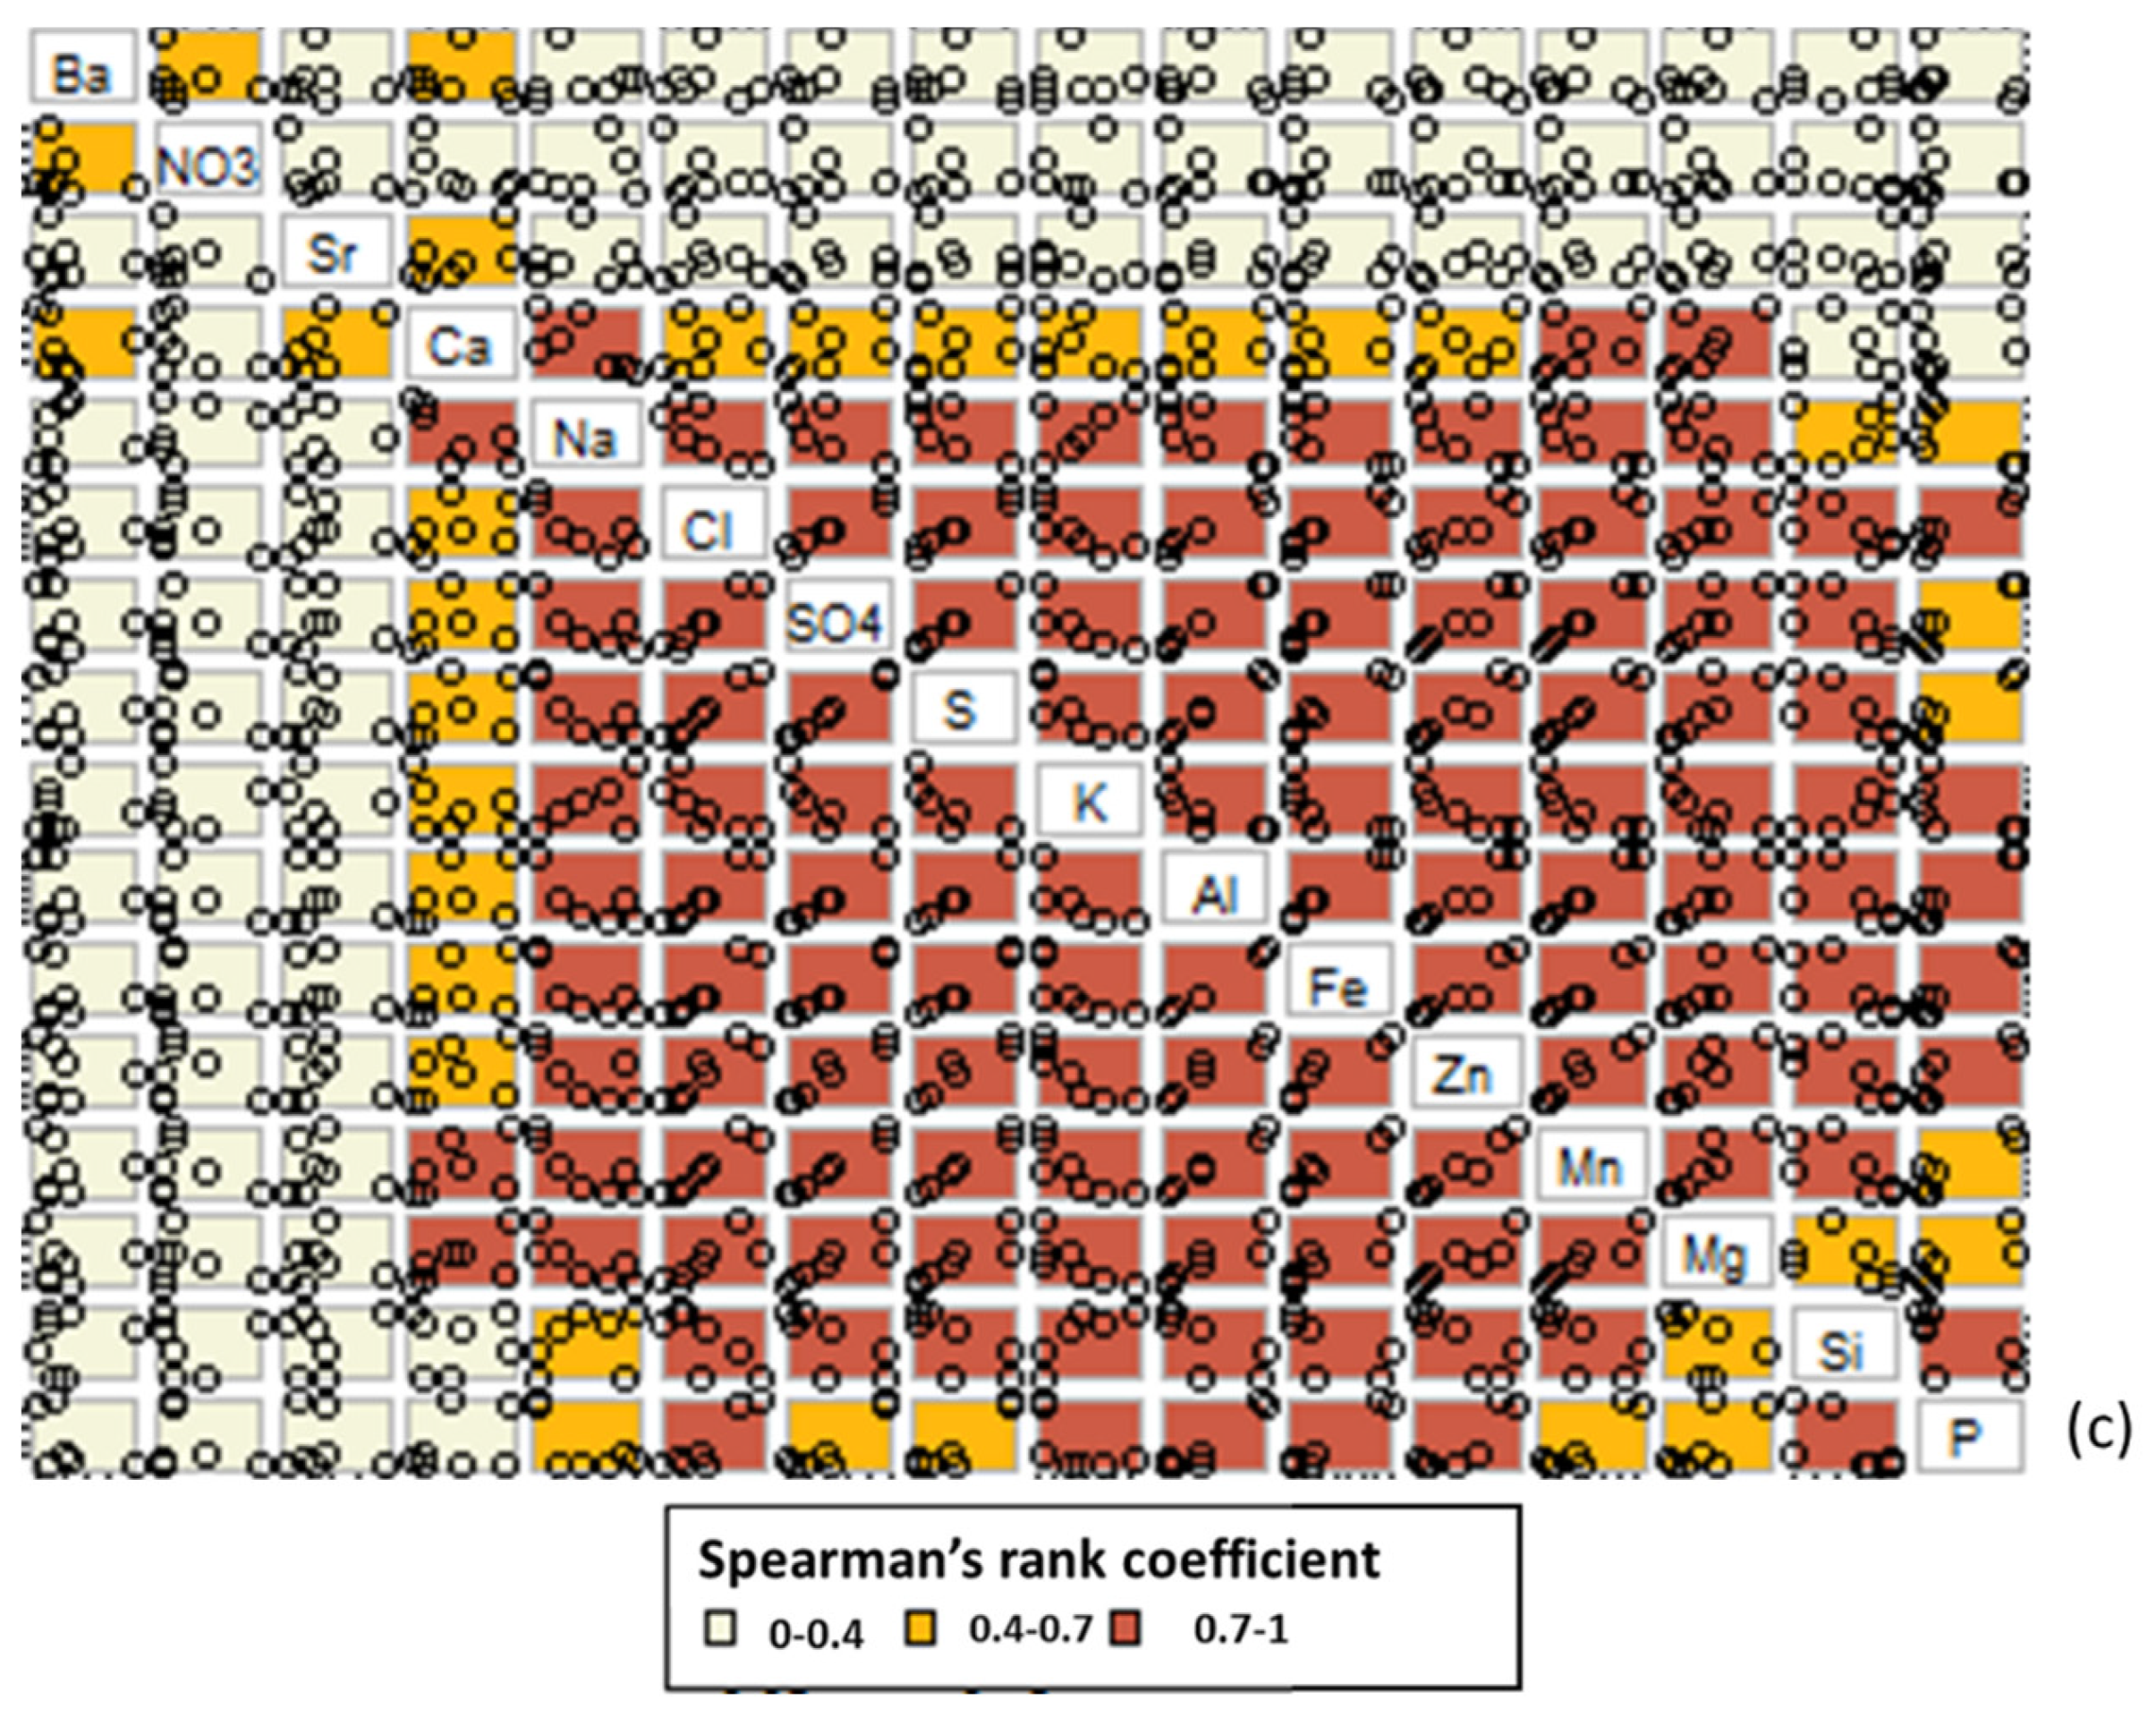
Figure A6.
Total S concentration of leachate solutions as a function of pore volumes: (a) A10RL, (b) B8RL, (c) B9SL, (d) C4RL, and (e) C6SL.
Figure A6.
Total S concentration of leachate solutions as a function of pore volumes: (a) A10RL, (b) B8RL, (c) B9SL, (d) C4RL, and (e) C6SL.
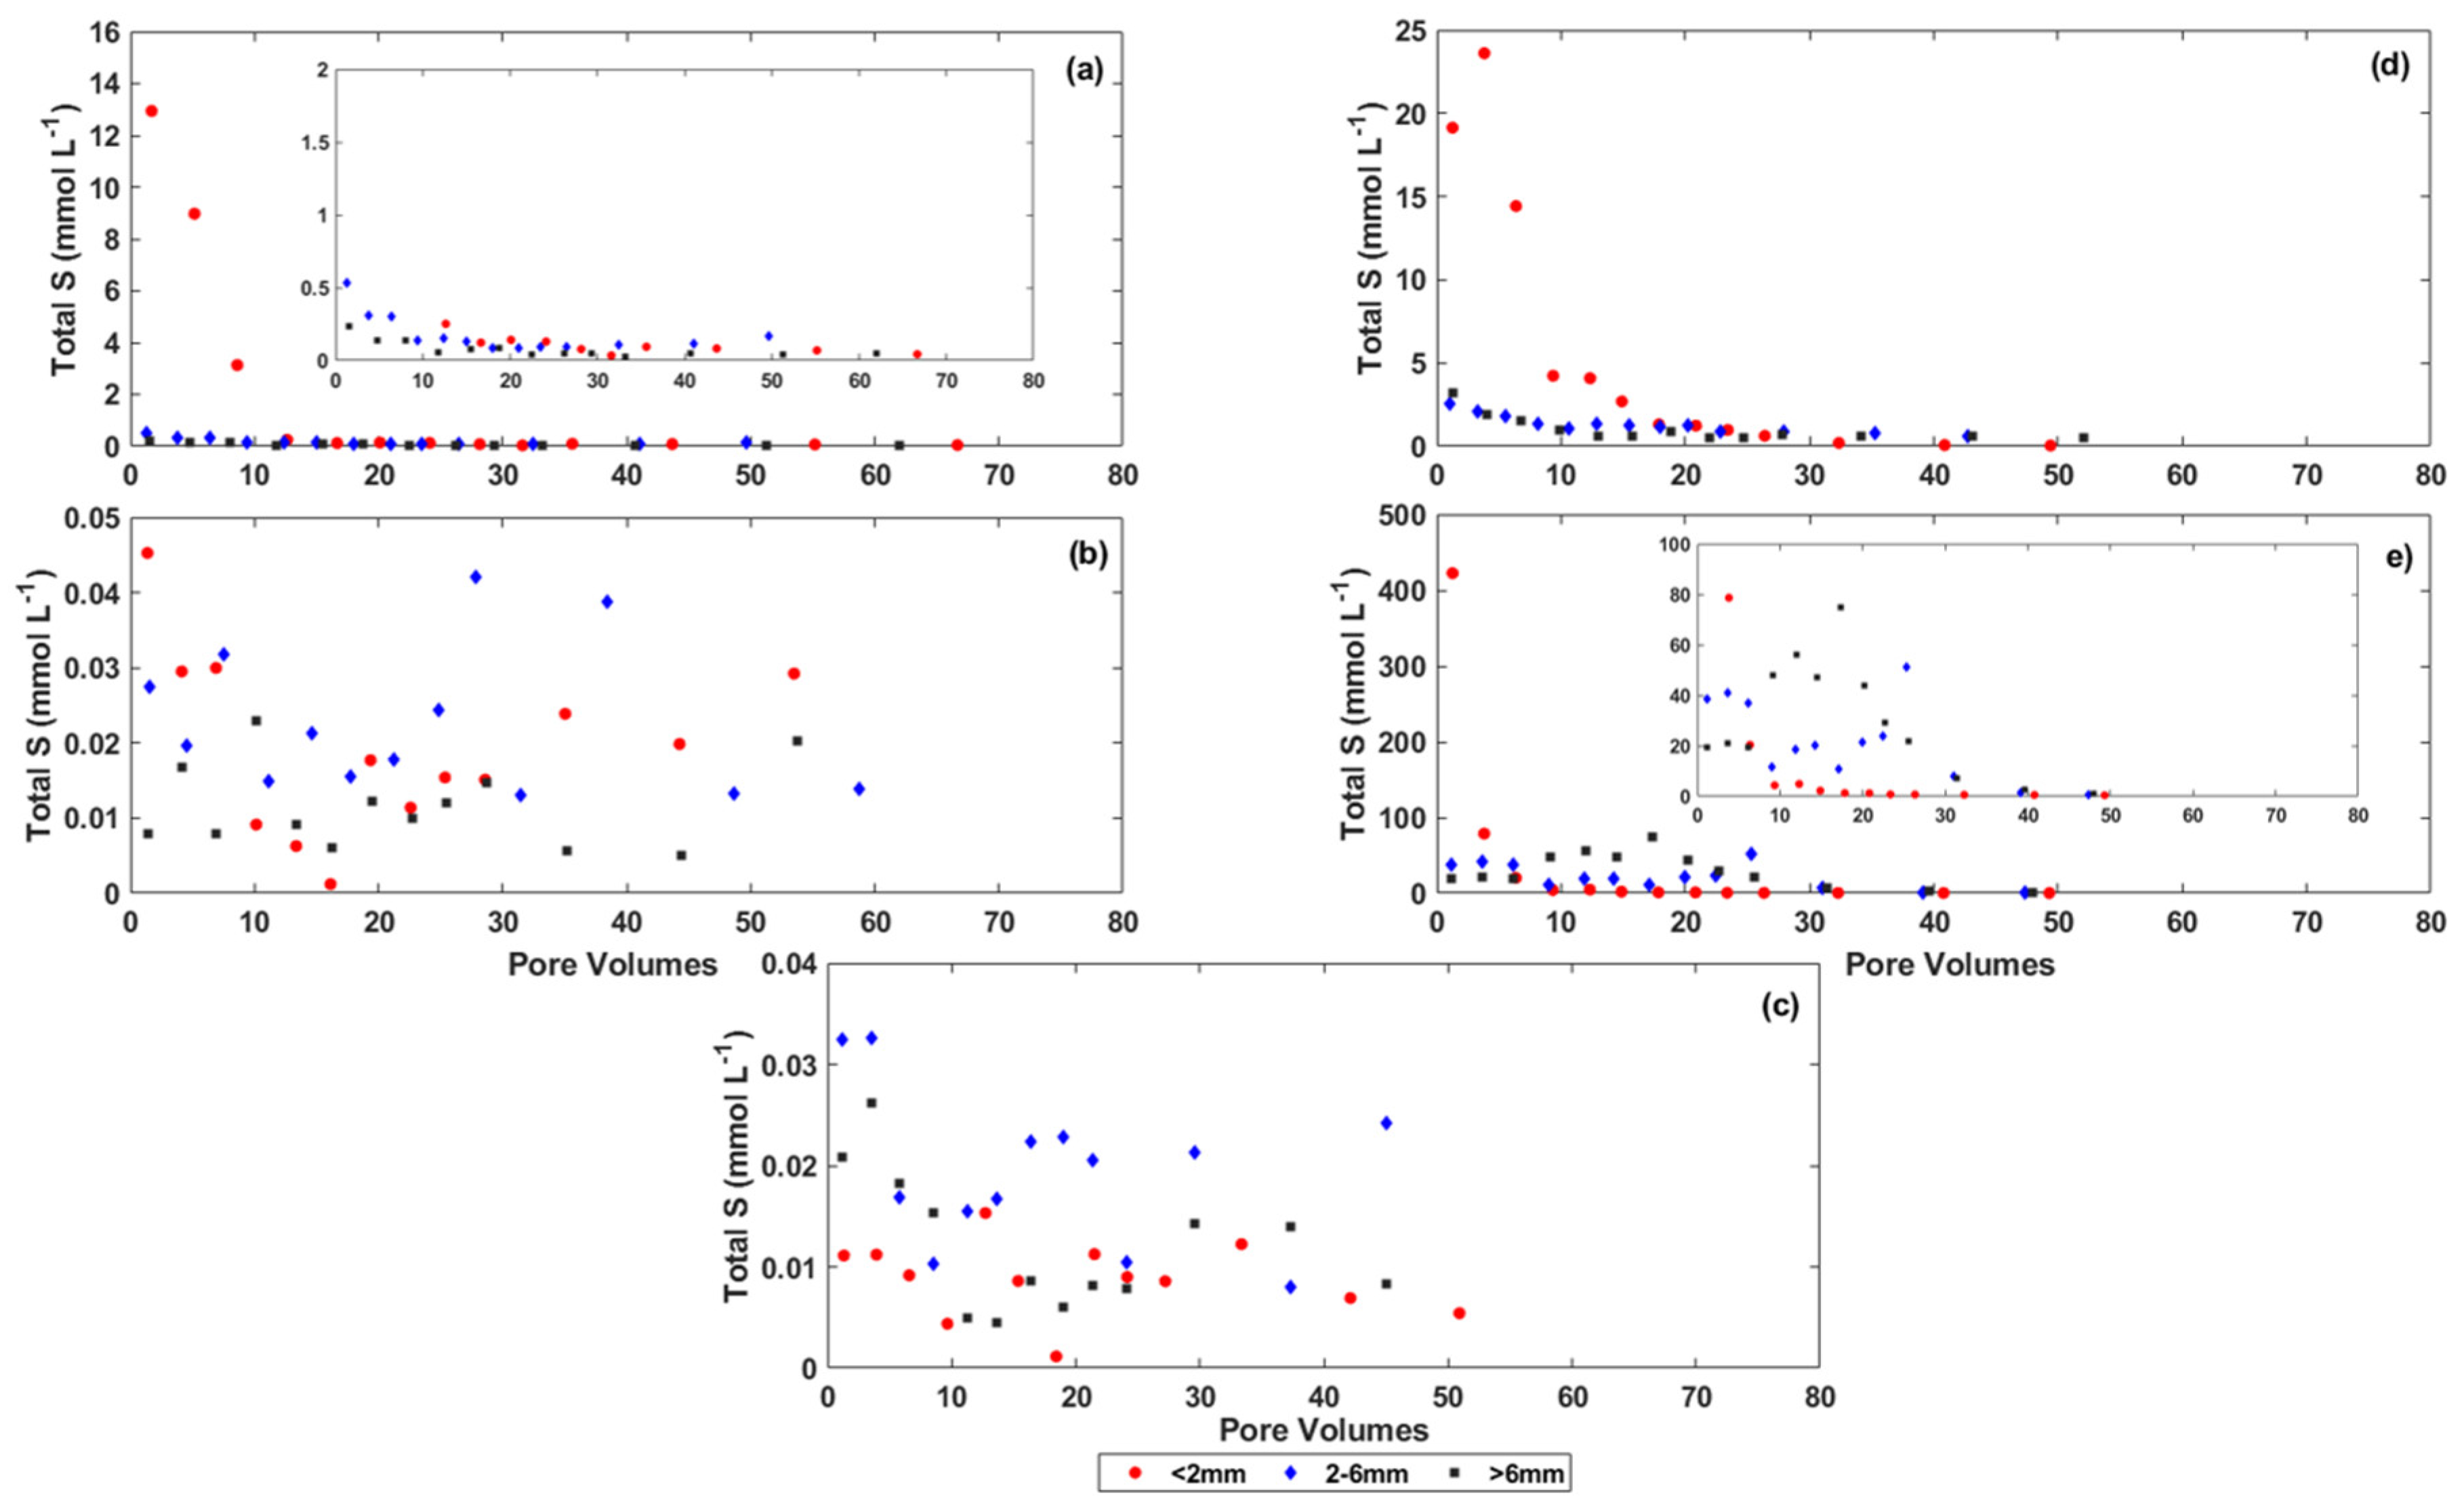
Figure A7.
Decay values for Na+: (a) A10RL, (b) B8RL, (c) B9SL, (d) C4RL, and (e) C6SL.

Figure A8.
Particle size distribution of C6 spoil sample before commencing the experiment.
References
- Szczepanska, J.; Twardowska, I. Distribution and environmental impact of coal-mining wastes in Upper Silesia, Poland. Environ. Geol. 1999, 38, 249–258. [Google Scholar] [CrossRef]
- Spargo, A.; Doley, D. Selective coal mine overburden treatment with topsoil and compost to optimise pasture or native vegetation establishment. J. Environ. Manag. 2016, 182, 342–350. [Google Scholar] [CrossRef] [PubMed]
- Feng, Y.; Wang, J.; Bai, Z.; Reading, L. Effects of surface coal mining and land reclamation on soil properties: A review. Earth Sci. Rev. 2019, 191, 12–25. [Google Scholar] [CrossRef]
- Li, X.; Park, J.H.; Edraki, M.; Baumgartl, T. Understanding the salinity issue of coal mine spoils in the context of salt cycle. Environ. Geochem. Health 2014, 36, 453–465. [Google Scholar] [CrossRef] [PubMed]
- Tiwary, R.K. Environmental impact of coal mining on water regime and its management. Water Air Soil Pollut. 2001, 132, 185–199. [Google Scholar] [CrossRef]
- Park, J.H.; Li, X.; Edraki, M.; Baumgartl, T.; Bernie, K. Geotechnical assessment and classification of f coal mine spoils for better understanding of potential salinity issues at closure. Environ. Sci. Process. Impacts 2013, 15, 1235–1244. [Google Scholar] [CrossRef] [PubMed]
- Al-Sibai, M.; Adey, M.A.; Rose, D.A. Movement of solute through a porous medium under intermittent leaching. Eur. J. Soil Sci. 1997, 48, 711–725. [Google Scholar] [CrossRef]
- Reading, L.P.; Baumgartl, T.; Bristow, K.L.; Lockington, D.A. Hydraulic conductivity increases in a sodic clay soil in response to gypsum applications: Impacts of bulk density and cation exchange. Soil Sci. 2012, 177, 165–171. [Google Scholar] [CrossRef]
- Shaygan, M.; Reading, L.P.; Baumgartl, T. Effect of physical amendments on salt leaching characteristics for reclamation. Geoderma 2017, 292, 96–110. [Google Scholar] [CrossRef]
- David, R.; Dimitrios, P. Diffusion and cation exchange during the reclamation of saline-structured soils. Geoderma 2002, 107, 271–279. [Google Scholar] [CrossRef]
- Marwan, M.M.; Rowell, D.L. Cation exchange, hydrolysis and clay movement during the displacement of saline solutions from soils by water. Irrig. Sci. 1995, 16, 81–87. [Google Scholar] [CrossRef]
- Park, J.H.; Edraki, M.; Baumgartl, T. A practical testing approach to predict the geochemical hazards of in-pit coal mine tailings and rejects. Catena 2017, 148, 3–10. [Google Scholar] [CrossRef]
- Opitz, J.; Edraki, M.; Baumgartl, T. The effect of particle size and mineral liberation on the acid generating potential of sulphidic waste rock. Geochem. Explor. Environ. Anal. 2016, 16, 245–252. [Google Scholar] [CrossRef]
- Kohnke, H. The reclamation of coal mine spoils. In Advances in Agronomy; Norman, A.G., Ed.; Elsevier: Amsterdam, The Netherlands, 1950; Volume 2, pp. 317–349. [Google Scholar]
- Hawkins, J.W.; Aljoe, W. Hydrologic characterization and modeling of a heterogeneous acid-producing surface coal mine spoil, Upshur County, West Virginia. In Proceedings of the Proceedings-National Symposium on Mining, Lexington, KY, USA, 14–18 May 1990; pp. 43–52. [Google Scholar]
- Sáinz, A.; Grande, J.A.; de la Torre, M.L.; Sánchez-Rodas, D. Characterisation of sequential leachate discharges of mining waste rock dumps in the Tinto and Odiel rivers. J. Environ. Manag. 2002, 64, 345–353. [Google Scholar] [CrossRef]
- Beven, K.; Germann, P. Macropores and water flow in soils. Water Resour. Res. 1982, 18, 1311–1325. [Google Scholar] [CrossRef] [Green Version]
- Hartmann, A.; Gräsle, W.; Horn, R. Cation exchange processes in structured soils at various hydraulic properties. Soil Tillage Res. 1998, 47, 67–72. [Google Scholar] [CrossRef]
- Guebert, M.D.; Gardner, T.W. Macropore flow on a reclaimed surface mine: Infiltration and hillslope hydrology. Geomorphology 2001, 39, 151–169. [Google Scholar] [CrossRef]
- Adibee, N.; Osanloo, M.; Rahmanpour, M. Adverse effects of coal mine waste dumps on the environment and their management. Environ. Earth Sci. 2013, 70, 1581–1592. [Google Scholar] [CrossRef]
- Gerke, H.H.; Molson, J.W.; Frind, E.O. Modelling the effect of chemical heterogeneity on acidification and solute leaching in overburden mine spoils. J. Hydrol. 1998, 209, 166–185. [Google Scholar] [CrossRef]
- Gerke, H.H.; Molson, J.W.; Frind, E.O. Modelling the impact of physical and chemical heterogeneity on solute leaching in pyritic overburden mine spoils. Ecol. Eng. 2001, 17, 91–101. [Google Scholar] [CrossRef]
- Gerke, H.H. Preferential flow descriptions for structured soils. J. Plant Nutr. Soil Sci. 2006, 169, 382–400. [Google Scholar] [CrossRef]
- Sidle, R.C.; Kitahara, H.; Terajima, T.; Nakai, Y. Experimental studies on the effects of pipeflow on throughflow partitioning. J. Hydrol. 1995, 165, 207–219. [Google Scholar] [CrossRef]
- Paktunc, A.D. Characterization of mine wastes for prediction of acid mine drainage. In Environmental Impacts of Mining Activities; Springer: Berlin, Germany, 1999; pp. 19–40. [Google Scholar]
- Fookes, P.G.; Gourley, C.S.; Ohikere, C. Rock weathering in engineering time. Q. J. Eng. Geol. Hydrogeol. 1988, 21, 33–57. [Google Scholar] [CrossRef]
- Sumner, M. Sodic soils: New perspectives. Soil Res. 1993, 31, 683–750. [Google Scholar] [CrossRef]
- Price, D.G. Weathering and weathering processes. Q. J. Eng. Geol. Hydrogeol. 1995, 28, 243–252. [Google Scholar] [CrossRef]
- Ghafoor, A.; Hina, K.; Murtaza, G. Estimation of Gapon exchange coefficient for different textured soils and landforms of Punjab, Pakistan. Pak. J. Agric. Sci. 2004, 41, 25–28. [Google Scholar]
- Struthers, P.H. Chemical Weathering of Strip-Mine Spoils. Ohio Sci. J. 1964, 64, 125–131. [Google Scholar]
- Sollins, P.; Radulovich, R. Effects of soil physical structure on solute transport in a weathered tropical soil. Soil Sci. Soc. Am. J. 1988, 52, 1168–1173. [Google Scholar] [CrossRef]
- Orndorff, Z.; Daniels, W.L.; Beck, M.; Eick, M. Leaching potentials of coal spoil and refuse: Acid-base interactions and electrical conductivity. In Proceedings of the 27th National Meeting of the American Society of Mining and Reclamation (ASMR), Pittsburgh, PA, USA, 5–11 June 2010; pp. 736–766. [Google Scholar]
- Orndorff, Z.W.; Daniels, W.L.; Zipper, C.E.; Eick, M.; Beck, M. A column evaluation of Appalachian coal mine spoils’ temporal leaching behavior. Environ. Pollut. 2015, 204, 39–47. [Google Scholar] [CrossRef]
- Dang, Z.; Liu, C.; Haigh, M.J. Mobility of heavy metals associated with the natural weathering of coal mine spoils. Environ. Pollut. 2002, 118, 419–426. [Google Scholar] [CrossRef]
- Dutta, M.; Saikia, J.; Taffarel, S.R.; Waanders, F.B.; De Medeiros, D.; Cutruneo, C.M.; Silva, L.F.; Saikia, B.K. Environmental assessment and nano-mineralogical characterization of coal, overburden and sediment from Indian coal mining acid drainage. Geosci. Front. 2017, 8, 1285–1297. [Google Scholar] [CrossRef]
- Essilfie-Dughan, J.; Hendry, M.J.; Dynes, J.J.; Hu, Y.; Biswas, A.; Barbour, S.L.; Day, S. Geochemical and mineralogical characterization of sulfur and iron in coal waste rock, Elk Valley, British Columbia, Canada. Sci. Total Environ. 2017, 586, 753–769. [Google Scholar] [CrossRef] [PubMed]
- Edraki, M.; McIntyre, N.; Baumgartl, T.; Hilton, M. Prediction of Long-Term Salt Generation from Coal Spoils; The Australian Coal Industry’s Research Program: Brisbane, Australia, 2019; pp. 1–119. [Google Scholar]
- Nickmann, M.; Spaun, G.; Thuro, K. Engineering geological classification of weak rocks. In Proceedings of the 10th International IAEG Congress, Nottingham, UK, 6–10 September 2006. [Google Scholar]
- Simmons, J.; Fityus, S. The Stability of very High Spoil Piles; Australian Coal Association Research Program: Brisbane, Australia, 2016; pp. 1–205. [Google Scholar]
- Rayment, G.E.; Lyons, D.J. Soil Chemical Methods: Australasia; CSIRO: Collingwood, Victoria, Australia, 2011; Volume 3, 512p. [Google Scholar]
- Hillel, D. Introduction to Soil Physics; Elsevier: Amsterdam, The Netherlands, 1982; 392p. [Google Scholar]
- Blake, G.R.; Hartge, K.H. Bulk density. In Methods of Soil Analysis. Part 1. Physical and Mineralogical Properties, Including Statistics of Measurement and Sampling; Klute, A., Ed.; American Society of Agronomy-Soil Science Society of America: Madison, WI, USA, 1986; pp. 363–382. [Google Scholar]
- Sheldrick, B.H.; Wang, C. Particle size distribution. In Soil Sampling and Methods of Analysis; Carter, M.R., Ed.; Lewis Publishers: Boca Raton, FL, USA, 1993; pp. 499–512. [Google Scholar]
- Šimůnek, J.; Šejna, M.; Saito, H.; Sakai, M.; van Genuchten, M.T. The Hydrus-1D Software Package for Simulating the Movement of Water, Heat, and Multiple Solutes in Variably Saturated Media; Department of Environmental Sciences, University of California Riverside: Riverside, CA, USA, 2013; 340p. [Google Scholar]
- Simunek, J.; Van Genuchten, M.T.; Sejna, M. Recent developments and applications of HYDRUS computer software packages. Vadose Zone J. 2016, 15. [Google Scholar] [CrossRef] [Green Version]
- Assouline, S.; Or, D. The concept of field capacity revisited: Defining intrinsic static and dynamic criteria for soil internal drainage dynamics. Water Resour. Res. 2014, 50, 4787–4802. [Google Scholar] [CrossRef]
- van Genuchten, M.T. A Closed-form equation for predicting the hydraulic conductivity of unsaturated soils. Soil Sci. Soc. Am. J. 1980, 44, 892–898. [Google Scholar] [CrossRef] [Green Version]
- Jalali, M. Effect of sodium and magnesium on kinetics of potassium release in some calcareous soils of western Iran. Geoderma 2008, 145, 207–215. [Google Scholar] [CrossRef]
- Forsyth, B. Understanding the Long-Term Seepage Geochemistry of Base Metal Mine Tailings in a Semiarid Subtropical Climate, Mount Isa, Australia. Ph.D. Thesis, The University of Queensland, Brisbane, Australia, 2014. [Google Scholar]
- Jurinak, J.; Whitmore, J.; Wagenet, R. Kinetics of salt release from a saline soil 1. Soil Sci. Soc. Am. J. 1977, 41, 721–724. [Google Scholar] [CrossRef]
- Molyneux, J. Some ecological aspects of colliery waste heaps around Wigan, South Lancashire. J. Ecol. 1963, 51, 315–321. [Google Scholar] [CrossRef]
- Down, C. Soil development on colliery waste tips in relation to age. I. Introduction and physical factors. J. Appl. Ecol. 1975, 12, 613–622. [Google Scholar] [CrossRef]
- Haering, K.C.; Daniels, W.L.; Roberts, J.A. Changes in mine soil properties resulting from overburden weathering. J. Environ. Qual. 1993, 22, 194–200. [Google Scholar] [CrossRef]
- Le Pera, E.; Sorriso-Valvo, M. Weathering and morphogenesis in a Mediterranean climate, Calabria, Italy. Geomorphology 2000, 34, 251–270. [Google Scholar] [CrossRef]
- Chamley, H. Clay formation through weathering. In Clay Sedimentology; Springer: Berlin, Germany, 1989; pp. 21–50. [Google Scholar]
- Jaynes, D.; Pionke, H.; Rogowski, A. Acid mine drainage from reclaimed coal strip mines 2. Simulation results of model. Water Resour. Res. 1984, 20, 243–250. [Google Scholar] [CrossRef]
- Rogowski, A.; Pionke, H.; Broyan, J. Modeling the Impact of Strip Mining and Reclamation Processes on Quality and Quantity of Water in Mined Areas: A Review. J. Environ. Qual. 1977, 6, 237–244. [Google Scholar] [CrossRef]
- Shaygan, M.; Mulligan, D.; Baumgartl, T. The potential of three halophytes (Tecticornia pergranulata, Sclerolaena longicuspis and Frankenia serpyllifolia) for the rehabilitation of brine-affected soils. Land Degrad. Dev. 2018, 29, 2002–2014. [Google Scholar] [CrossRef]
- Hannan, J.C. Mine Rehabilitation: A Handbook for the Coal Mining industry; New South Wales Coal Association: Sydney, Australia, 1995; 124p. [Google Scholar]
- Shaygan, M.; Reading, L.P.; Arnold, S.; Baumgartl, T. Modeling the effect of soil physical amendments on reclamation and revegetation success of a saline-sodic soil in a semi-arid environment. Arid Land Res. Manag. 2018, 32, 379–406. [Google Scholar] [CrossRef]
- Baumgartl, T.; Richards, B. Evaporation and salt transport under variable conditions. In Proceedings of the Life of Mine Conference, Maximising Rehabilitation Outcomes, Brisbane, Australia, 10–12 July 2012; pp. 179–186. [Google Scholar]
- Shaygan, M.; Baumgartl, T.; Arnold, S.; Reading, L.P. The effect of soil physical amendments on reclamation of a saline-sodic soil: Simulation of salt leaching using HYDRUS-1D. Soil Res. 2018, 56, 829–845. [Google Scholar] [CrossRef]
Figure 1.
Flow rate of the first leachate collected at each cycle as a function of pore volumes: (a) A10RL, (b) B8RL, (c) B9SL, (d) C4RL, and (e) C6SL.
Figure 1.
Flow rate of the first leachate collected at each cycle as a function of pore volumes: (a) A10RL, (b) B8RL, (c) B9SL, (d) C4RL, and (e) C6SL.
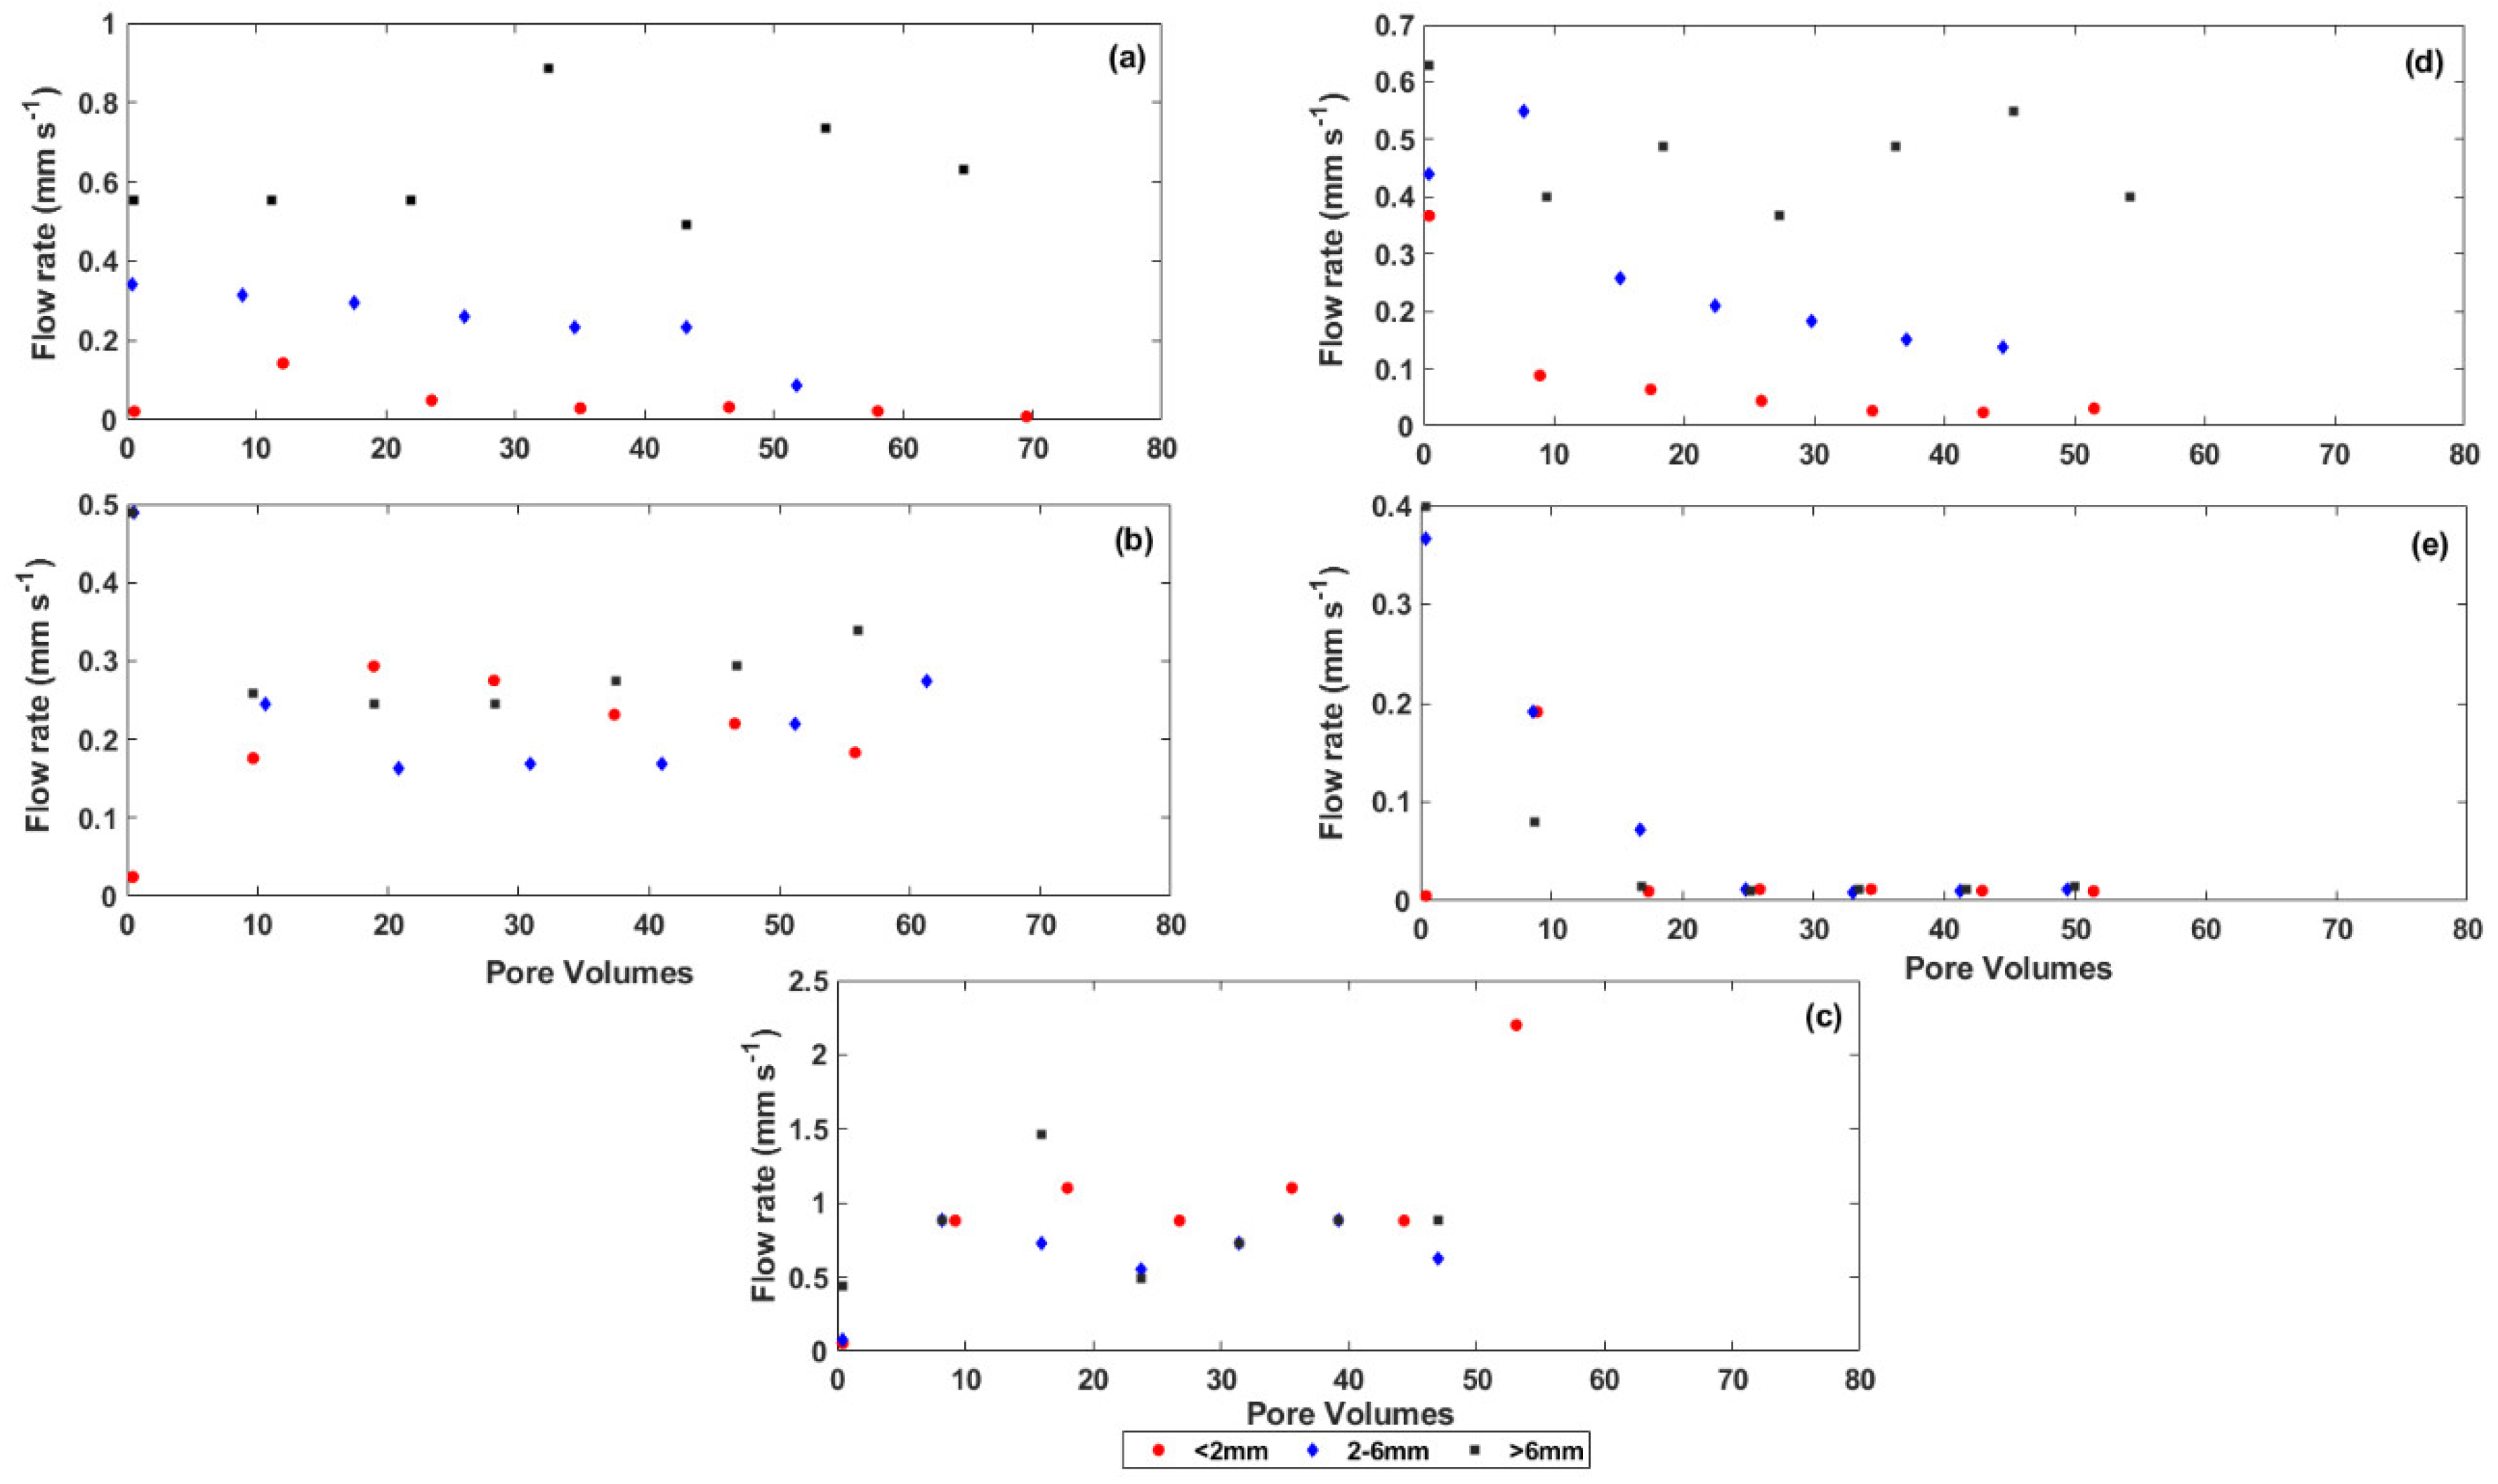
Figure 2.
Electrical conductivity (EC) of leachate solutions as a function of pore volumes: (a) A10RL, (b) B8RL, (c) B9SL, (d) C4RL, and (e) C6SL.
Figure 2.
Electrical conductivity (EC) of leachate solutions as a function of pore volumes: (a) A10RL, (b) B8RL, (c) B9SL, (d) C4RL, and (e) C6SL.

Figure 3.
Sodium (Na+) concentration of leachate solutions as a function of pore volumes: (a) A10RL, (b) B8RL, (c) B9SL, (d) C4RL, and (e) C6SL.
Figure 3.
Sodium (Na+) concentration of leachate solutions as a function of pore volumes: (a) A10RL, (b) B8RL, (c) B9SL, (d) C4RL, and (e) C6SL.

Figure 4.
Calcium (Ca2+) concentration of leachate solutions as a function of pore volumes: (a) A10RL, (b) B8RL, (c) B9SL, (d) C4RL, and (e) C6SL.
Figure 4.
Calcium (Ca2+) concentration of leachate solutions as a function of pore volumes: (a) A10RL, (b) B8RL, (c) B9SL, (d) C4RL, and (e) C6SL.
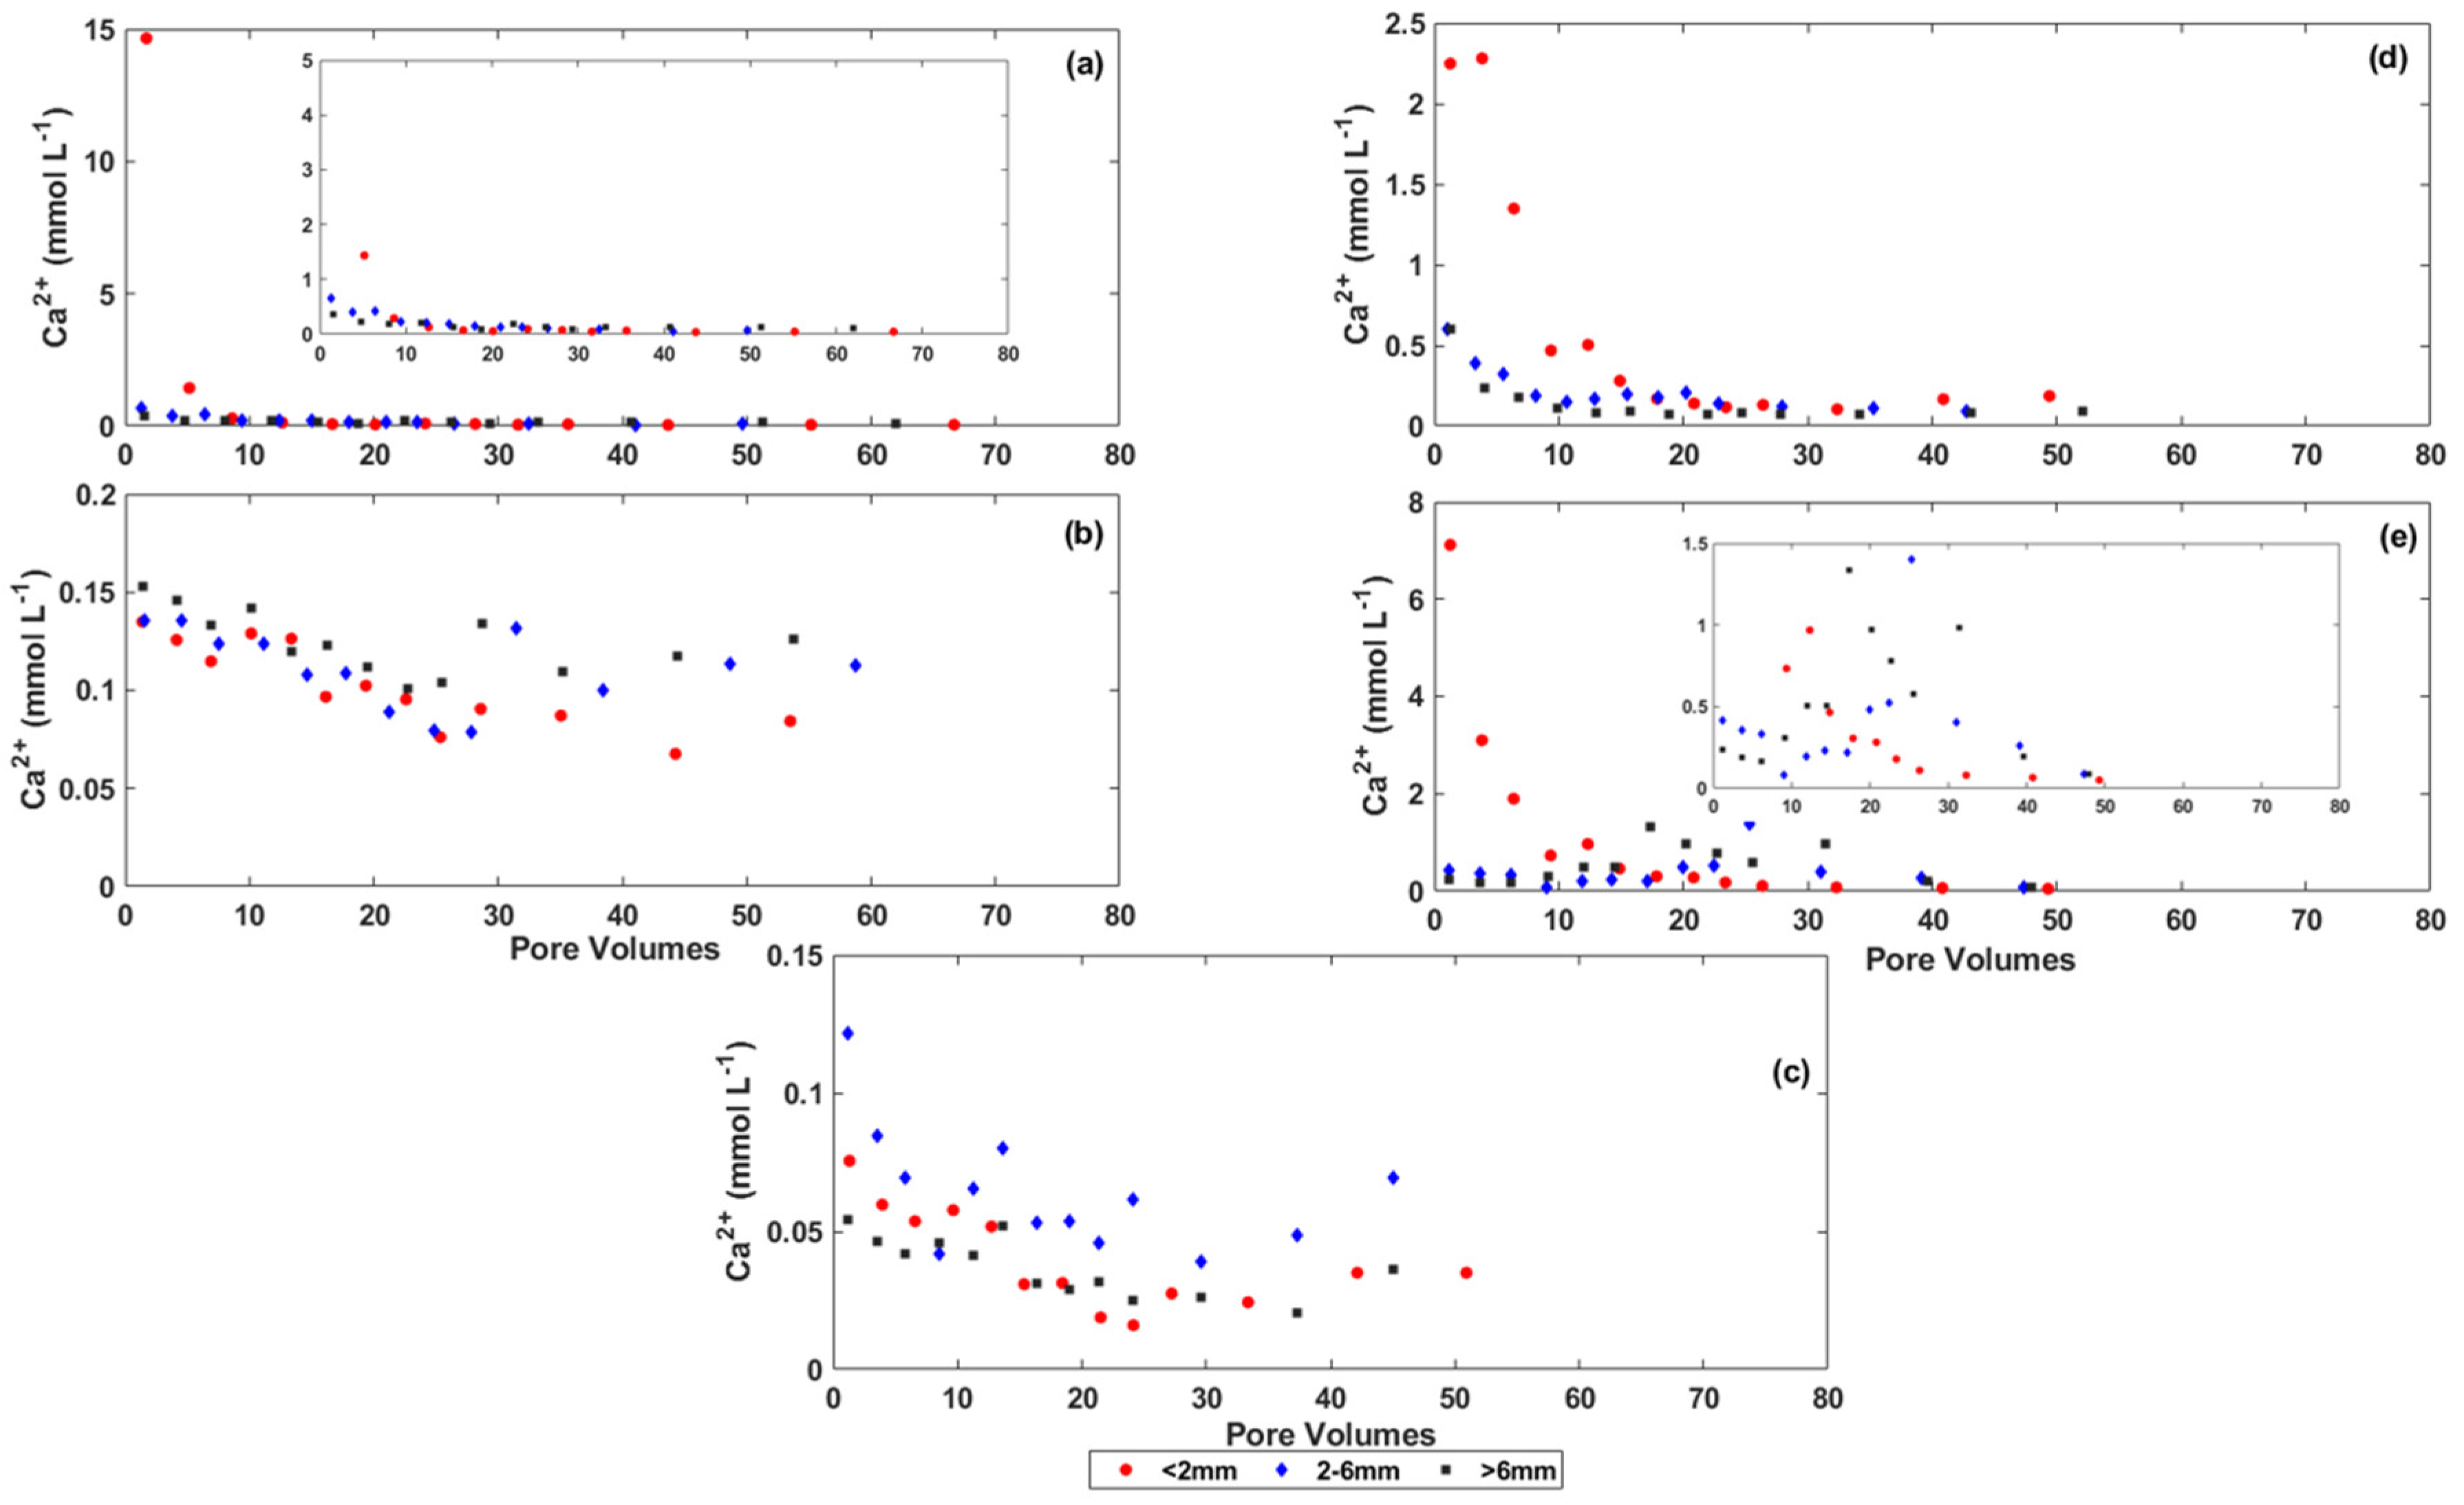
Figure 5.
Potassium (K+) concentration of leachate solutions as a function of pore volumes: (a) A10RL, (b) B8RL, (c) B9SL, (d) C4RL, and (e) C6SL.
Figure 5.
Potassium (K+) concentration of leachate solutions as a function of pore volumes: (a) A10RL, (b) B8RL, (c) B9SL, (d) C4RL, and (e) C6SL.


Table 1.
Summary of the coal mine spoils’ characteristics.
| Coal Mine Spoil | Lithology | Diagnostic Mineral | Degradation Degree | Geology | pH1:5 | EC1:5 (dS m−1) | Chemical Composition (mg kg−1) | |||||
|---|---|---|---|---|---|---|---|---|---|---|---|---|
| Na+ | K+ | Ca2+ | Mg2+ | Total S | Cl− | |||||||
| A10 | Sandstone | Carbonate and chlorite | Low (Rock-like spoil) | Rangal Formation | 6.90 | 2.60 | 7077 | 9367 | 1724 | 338 | 566 | 1979 |
| B8 | Sandstone and mudrock | Dolomite and calcite | Low (Rock-like spoil) | Rangal Formation | 7.17 | 0.46 | 4531 | 12,615 | 15,113 | 1159 | 555 | 121 |
| B9 | Sandstone and mudrock | Calcite | High (Soil-like spoil) | Rangal Formation | 6.04 | 0.51 | 5610 | 8360 | 1654 | 253 | 304 | 241 |
| C4 | Sandstone | Dolomite and calcite | Low (Rock-like spoil) | German Creek Formation | 7.26 | 1.70 | 10056 | 14,680 | 87,472 | 23,546 | 1049 | 556 |
| C6 | Sandstone | Pyrite and carbonate | High (Soil-like spoil) | German Creek Formation | 2.87 | 4.42 | 2935 | 18,431 | 320 | 1444 | 11,755 | 167 |
EC1:5: Electrical conductivity of 1:5 solution extract; pH1:5: pH of 1:5 solution extraction.
Table 2.
Physical properties of coal mine spoils.
| Coal Mine Spoil | Bulk Density (g cm−3) | Particle Density (g cm−3) | Porosity (cm3 cm−3) | Average Flow Rate (mm s−1) (n = 7) |
|---|---|---|---|---|
| A10RL2 | 1.47 | 2.61 | 0.43 | 0.04 |
| A10RL26 | 1.08 | 2.60 | 0.58 | 0.25 |
| A10RL6 | 1.38 | 2.60 | 0.46 | 0.62 |
| B8RL2 | 1.21 | 2.64 | 0.54 | 0.20 |
| B8RL26 | 1.34 | 2.64 | 0.49 | 0.25 |
| B8RL6 | 1.21 | 2.64 | 0.53 | 0.30 |
| B9SL2 | 1.11 | 2.59 | 0.56 | 1.01 |
| B9SL26 | 0.90 | 2.53 | 0.64 | 0.64 |
| B9SL6 | 1.15 | 2.53 | 0.54 | 0.82 |
| C4RL2 | 1.14 | 2.76 | 0.58 | 0.09 |
| C4RL26 | 0.86 | 2.69 | 0.67 | 0.27 |
| C4RL6 | 1.19 | 2.69 | 0.55 | 0.47 |
| C6SL2 | 1.09 | 2.66 | 0.58 | 0.03 |
| C6SL26 | 0.98 | 2.54 | 0.61 | 0.09 |
| C6SL6 | 1.00 | 2.54 | 0.60 | 0.08 |
n: number of samples.
Table 3.
Particle size distribution and water retention characteristics of the C6SL spoils at the end of the experiment.
Table 3.
Particle size distribution and water retention characteristics of the C6SL spoils at the end of the experiment.
| Coal Mine Spoil | Gravel (%) | Coarse Sand (%) | Fine Sand (%) | Silt (%) | Clay (%) | Θs (cm3 cm−3) | Θr (cm3 cm−3) | α (1/cm) | n | Macropore Volume (cm3 cm−3) |
|---|---|---|---|---|---|---|---|---|---|---|
| C6SL2 | 0.0 | 8.2 | 52.4 | 11.6 | 27.2 | 0.55 | 0.08 | 0.023 | 1.36 | 0.22 |
| C6SL26 | 5.6 | 2.0 | 53.2 | 19.7 | 23.7 | 0.53 | 0.07 | 0.017 | 1.41 | 0.23 |
| C6SL6 | 5.6 | 4.0 | 52.1 | 15.8 | 23.7 | 0.54 | 0.07 | 0.019 | 1.38 | 0.24 |
: inverse of the air entry suction; n: measure of the pore size distribution; Θs: saturated water content (porosity); Θr: residual water content.
Table 4.
Production rates (mg kg−1 day−1) of major ions from coal mine spoils.
| Coal Mine Spoil | Na+ | Ca2+ | K+ | Mg2+ | Cl− | Total S |
|---|---|---|---|---|---|---|
| A10RL2 | 7.400 | 0.962 | 0.210 | 0.856 | 11.544 | 1.181 |
| A10RL26 | 2.750 | 0.216 | 0.088 | 0.164 | 4.593 | 0.143 |
| A10RL6 | 1.005 | 0.124 | 0.018 | 0.085 | 1.686 | 0.049 |
| B8RL2 | 0.488 | 0.091 | 0.184 | 0.046 | 0.287 | 0.014 |
| B8RL26 | 0.406 | 0.089 | 0.156 | 0.041 | 0.286 | 0.014 |
| B8RL6 | 0.234 | 0.111 | 0.086 | 0.029 | 0.178 | 0.008 |
| B9SL2 | 0.424 | 0.038 | 0.241 | 0.100 | 0.497 | 0.006 |
| B9SL26 | 0.935 | 0.077 | 0.474 | 0.220 | 1.321 | 0.018 |
| B9SL6 | 0.499 | 0.034 | 0.177 | 0.085 | 0.608 | 0.009 |
| C4RL2 | 7.095 | 0.595 | 0.199 | 1.412 | 6.913 | 4.255 |
| C4RL26 | 2.757 | 0.277 | 0.070 | 0.408 | 2.933 | 1.333 |
| C4RL6 | 1.410 | 0.129 | 0.030 | 0.282 | 1.511 | 0.738 |
| C6SL2 | 0.138 | 1.167 | 0.076 | 5.247 | 0.899 | 32.79 |
| C6SL26 | 0.106 | 0.421 | 0.019 | 3.460 | 0.731 | 19.24 |
| C6SL6 | 0.102 | 0.568 | 0.018 | 3.057 | 0.880 | 26.04 |
Table 5.
Exchangeable cations, EC, and pH before and after the weathering experiment.
| Experimental Conditions | Elements | B8RL | B9SL | C4RL | C6SL | ||||||||
|---|---|---|---|---|---|---|---|---|---|---|---|---|---|
| Before weathering experiment (n = 3) | Na+ (cmolc kg−1) | 1.050 ± 0.058 | 2.552 ± 0.025 | 0.917 ± 0.021 | 0.001 ± 0.0008 | ||||||||
| K+ (cmolc kg−1) | 0.146 ± 0.002 | 0.121 ± 0.010 | 0.104 ± 0.008 | 0.004 ± 0.0003 | |||||||||
| Mg2+ (cmolc kg−1) | 0.718 ± 0.022 | 2.026 ± 0.038 | 1.308 ± 0.069 | 0.813 ± 0.031 | |||||||||
| Ca2+ (cmolc kg−1) | 3.621 ± 0.102 | 1.964 ± 0.196 | 2.339 ± 0.232 | 0.480 ± 0.076 | |||||||||
| CEC (cmolc kg−1) | 5.537 ± 0.163 | 6.664 ± 0.219 | 4.668 ± 0.308 | 1.290 ± 0.102 | |||||||||
| EC1:5 (dS m−1) | 0.462 ± 0.020 | 0.519 ± 0.020 | 1.700 ± 0.120 | 4.420 ± 0.070 | |||||||||
| pH1:5 | 7.170 ± 0.300 | 6.040 ± 0.220 | 7.260 ± 0.070 | 2.870 ± 0.070 | |||||||||
| Elements | B8RL2 | B8RL26 | B8RL6 | B9SL2 | B9SL26 | B9SL6 | C4RL2 | C4RL26 | C4RL6 | C6SL2 | C6SL26 | C6SL6 | |
| After weathering experiment (n = 3) | Na+ (cmolc kg−1) | 0.970 ± 0.033 | 0.980 ± 0.005 | 1.009 ± 0.040 | 1.902 ± 0.032 | 1.808 ± 0.106 | 2.170 ± 0.670 | 0.021 ± 0.0004 | 0.020 ± 0.0008 | 0.410 ± 0.017 | 0.013 ± 0.0008 | 0.032 ± 0.019 | 0.016 ± 0.0006 |
| K+ (cmolc kg−1) | 0.170 ± 0.005 | 0.174 ± 0.004 | 0.172 ± 0.002 | 0.085 ± 0.002 | 0.082 ± 0.005 | 0.107 ± 0.043 | 0.066 ± 0.002 | 0.063 ± 0.003 | 0.080 ± 0.004 | 0.029 ± 0.001 | 0.107 ± 0.118 | 0.025 ± 0.001 | |
| Mg2+ (cmolc kg−1) | 0.797 ± 0.030 | 0.794 ± 0.030 | 0.787 ± 0.009 | 1.45 ± 0.030 | 1.350 ± 0.090 | 1.820 ± 0.540 | 0.984 ± 0.053 | 0.978 ± 0.031 | 1.107 ± 0.046 | 0.083 ± 0.001 | 0.115 ± 0.006 | 0.098 ± 0.002 | |
| Ca2+ (cmolc kg−1) | 3.730 ± 0.128 | 3.906 ± 0.115 | 4.340 ± 0.236 | 1.403 ± 0.107 | 1.103 ± 0.143 | 0.932 ± 0.138 | 3.080 ± 0.105 | 2.900 ± 0.264 | 2.106 ± 0.044 | 0.078 ± 0.003 | 0.150 ± 0.017 | 0.111 ± 0.007 | |
| CEC (cmolc kg−1) | 5.316 ± 0.108 | 5.859 ± 0.088 | 6.309 ± 0.214 | 4.841 ± 0.174 | 4.352 ± 0.178 | 5.030 ± 1.340 | 4.152 ± 0.160 | 3.965 ± 0.299 | 3.703 ± 0.099 | 0.205 ± 0.004 | 0.404 ± 0.157 | 0.253 ± 0.011 | |
| EC1:5 (dS m−1) | 0.335 ± 0.005 | 0.736 ± 0.010 | 0.337 ± 0.009 | 0.863 ± 0.409 | 0.895 ± 0.339 | 0.693 ± 0.273 | 0.092 ± 0.001 | 0.360 ± 0.190 | 0.808 ± 0.010 | 0.084 ± 0.009 | 0.082 ± 0.004 | 0.087 ± 0.003 | |
| pH1:5 | 9.690 ± 0.231 | 9.980 ± 0.055 | 9.990 ± 0.010 | 7.203 ± 0.430 | 8.140 ± 0.158 | 8.280 ± 0.160 | 7.600 ± 0.090 | 8.270 ± 0.200 | 8.200 ± 0.040 | 5.200 ± 0.110 | 4.780 ± 0.110 | 4.310 ± 0.120 | |
Data are given as the average value ± standard deviation over the replicates; n: number of replicates; CEC: cation exchange capacity; EC1:5: electrical conductivity of 1:5 solution extract; pH1:5: pH of 1:5 solution extraction.
Table 6.
Soluble ion concentrations before and after the weathering experiment.
| Experimental Conditions | Major Ions | B8RL | B9SL | C4RL | C6SL | ||||||||
|---|---|---|---|---|---|---|---|---|---|---|---|---|---|
| Before weathering experiment (n = 3) | Na+ (mg kg−1) | 437.630 ± 29.998 | 485.426 ± 22.090 | 587.670 ± 214.950 | 1.160 ± 0.120 | ||||||||
| K+ (mg kg−1) | 8.518 ± 0.919 | 31.099 ± 19.182 | 24.240 ± 9.090 | 0.630 ± 0.150 | |||||||||
| Mg2+ (mg kg−1) | 1.137 ± 0.243 | 15.057 ± 9.817 | 47.130 ± 17.320 | 472.480 ± 80.400 | |||||||||
| Ca2+ (mg kg−1) | 4.187 ± 0.942 | 9.480 ± 0.450 | 58.250 ± 19.580 | 237.810 ± 15.680 | |||||||||
| Major ions | B8RL2 | B8RL26 | B8RL6 | B9SL2 | B9SL26 | B9SL6 | C4RL2 | C4RL26 | C4RL6 | C6SL2 | C6SL26 | C6SL6 | |
| After weathering experiment (n = 3) | Na+ (mg kg−1) | 368.530 ± 10.780 | 376.490 ± 12.890 | 407.900 ± 19.150 | 662.510 ± 11.206 | 505.700 ± 37.460 | 620.690 ± 35.820 | 17.480 ± 0.500 | 257.960 ± 11.690 | 16.960 ± 0.960 | 7.130 ± 0.290 | 6.560 ± 0.030 | 4.080 ± 0.110 |
| K+ (mg kg−1) | 4.795 ± 1.325 | 5.492 ± 0.822 | 4.149 ± 1.562 | 4.323 ± 0.330 | 9.283 ± 3.032 | 3.962 ± 0.299 | 11.090 ± 0.180 | 14.220 ± 1.690 | 10.740 ± 0.440 | 9.410 ± 0.150 | 8.320 ± 0.330 | 7.930 ± 0.250 | |
| Mg2+ (mg kg−1) | 3.869 ± 1.110 | 2.539 ± 0.727 | 0.875 ± 0.200 | 3.676 ± 0.102 | 5.530 ± 1.732 | 2.646 ± 0.172 | 25.900 ± 0.460 | 35.750 ± 4.690 | 25.980 ± 0.400 | 2.100 ± 0.110 | 3.100 ± 0.280 | 5.560 ± 0.200 | |
| Ca2+ (mg kg−1) | 4.790 ± 1.320 | 5.490 ± 0.820 | 4.140 ± 1.560 | 9.780 ± 0.250 | 4.740 ± 2.090 | 3.130 ± 0.380 | 22.980 ± 0.840 | 22.720 ± 2.640 | 22.700 ± 1.010 | 3.090 ± 0.360 | 5.700 ± 0.440 | 3.870 ± 0.220 | |
Data are given as the average value ± standard deviation over the replicates; n: number of replicates.
© 2019 by the authors. Licensee MDPI, Basel, Switzerland. This article is an open access article distributed under the terms and conditions of the Creative Commons Attribution (CC BY) license (http://creativecommons.org/licenses/by/4.0/).
Share and Cite
MDPI and ACS Style
Hilton, M.; Shaygan, M.; McIntyre, N.; Baumgartl, T.; Edraki, M. The Effect of Weathering on Salt Release from Coal Mine Spoils. Minerals 2019, 9, 760. https://doi.org/10.3390/min9120760
AMA Style
Hilton M, Shaygan M, McIntyre N, Baumgartl T, Edraki M. The Effect of Weathering on Salt Release from Coal Mine Spoils. Minerals. 2019; 9(12):760. https://doi.org/10.3390/min9120760
Chicago/Turabian StyleHilton, Melinda, Mandana Shaygan, Neil McIntyre, Thomas Baumgartl, and Mansour Edraki. 2019. "The Effect of Weathering on Salt Release from Coal Mine Spoils" Minerals 9, no. 12: 760. https://doi.org/10.3390/min9120760
Note that from the first issue of 2016, this journal uses article numbers instead of page numbers. See further details here.