Major and Trace Element Geochemistry of Dayakou Vanadium-Dominant Emerald from Malipo (Yunnan, China): Genetic Model and Geographic Origin Determination


School of Gemology, China University of Geosciences Beijing, 29 Xueyuan Road, Haidian District, Beijing 100083, China
*
Author to whom correspondence should be addressed.
Minerals 2019, 9(12), 777; https://doi.org/10.3390/min9120777
Submission received: 28 October 2019
/
Revised: 6 December 2019
/
Accepted: 10 December 2019
/
Published: 12 December 2019
(This article belongs to the Section Mineral Geochemistry and Geochronology)
Abstract
:Emerald from the deposit at Dayakou is classified as a vanadium-dominant emerald together with Lened, Muzo, Mohmand, and Eidsvoll emeralds. Although previous studies defined these V-dominant emeralds and traced the genesis of the Dayakou deposit, there has not been any systematic comparison or discrimination on V-dominant emeralds from these deposits. The origin of the parental fluid and the crystallization process of the Dayakou emerald remain controversial. In this study, both major and trace element signatures of 34 V-dominant samples from Dayakou are analyzed through electron microprobe analysis (EMPA) and laser ablation-inductively coupled plasma-mass spectrometry (LA-ICP-MS). Dayakou emeralds are characterized by high ratios of V/Cr and the enrichment of Li, Cs, W, Sn, and As. These geochemical fingerprints indicate a parental fluid of an Early Cretaceous early-stage granitic fluid associated with Laojunshan granite. The considerable concentration variation of Rb, Cs, Ga and the presence of V-rich oxy-schorl-dravite inclusions in a color zoned sample suggest two generations of emerald precipitation. Thus, a more detailed idealized mineralization model for the Dayakou deposit is proposed. A series of plots, such as Rb vs. Cs, V vs. V/Cr, LILE vs. CTE, and Li vs. Sc, are constructed to discriminate the provenance of V-dominant emeralds.
1. Introduction
Emerald, the green gem variety of beryl, is considered one of the most precious gems. With the ideal formula of Be3Al2(Si6O18), emerald crystallizes in a hexagonal structure which consists of six-membered rings (Si6O18)12− bonded by tetrahedrally coordinated Be2+ (T1 site) and octahedrally coordinated Al3+ (Y site). Y sites, preferentially occupied by Al3+, can accommodate Mg, Mn, Fe, Cr, V, Ti, Sc, Co, and Ni ions, while T1 sites can accommodate Li [1,2,3,4,5]. The six-membered rings filled by Si4+ (T2 site) are stacked one above the other, forming channels of approximately 5.1 Å in diameter along the c-axis. These cavities are large enough to incorporate single molecules of H2O, D2O, HDO, CO2, etc. In addition, many large size cations, such as alkali metal ions, are incorporated into the channel to compensate for the deficiency of positive charges as a result of divalent cation substitutions at Y sites [2,6,7,8,9,10,11,12].
Most previous works have discussed the element concentration differences among the emerald deposits worldwide. Those studies emphasized the channel cations (Na, K) and isomorphic substituents (Fe, Mg, and chromophoric Cr and V) at the Y, T1, and T2 sites [5,13,14,15,16,17,18,19]. References [2] and [10] summarized emerald deposits worldwide and collected their chemical compositions. They defined Dayakou (China), Lened (Canada), Muzo (Colombia), Mohmand (Pakistan), and Eidsvoll (Norway) emeralds as typical V-dominant emeralds based on the greater content of V2O3 than Cr2O3. Those V-dominant emeralds can be easily distinguished from Cr-dominant emeralds. However, there has not been a systematic comparison or discrimination of those V-dominant emeralds from various deposits. With regards to Dayakou emeralds, their chemical compositions have been recently reported [20], but not analyzed in detail.
Trace elements of emerald are powerful indicators for determining the geographic provenance but the number of related studies is limited. For the first time, using Laser Ablation-Inductively Coupled Plasma-Mass Spectrometry (LA-ICP-MS) and Secondary Ion Mass Spectrometry (SIMS) techniques, [21] and [16] determined the origin of emeralds from several deposits by trace elements data, such as Li, B, Rb, Cs, V, Cr, Sc, Ga, etc. So far, only [20] has reported trace elements of Dayakou emerald, but their work focused on the Al3+ replacement degree and Cr/V ratio. The geochemical fingerprints of the Dayakou emerald are not yet determined.
Besides, the trace element geochemistry of emeralds was used for building the genetic model. B, Ga, Ba, Sr, and alkali elements Li, Cs, and Rb are regarded as indicators of parental fluid and the fractionation and evolution for pegmatite [3,4,22,23]. Reference [24] reported the formation conditions of Dayakou emerald, but the crystallization process and the sources of emerald-forming fluids have yet to be determined.
In this study, thirty-four single Dayakou emerald crystals are investigated. Electron microprobe analysis and LA-ICP-MS method were used for measuring major and trace elements of the Dayakou emerald. These analyses can determine the geochemical fingerprints of the Dayakou emerald and help discriminate the geographic origin of V-dominant emeralds. In addition, the geochemical features are linked to the genesis of the Dayakou emerald, revealing the origin of parent fluid and the crystallization process of emerald. The results of this study improve the genetic model of the Dayakou deposit, and determine the geographic origin of V-dominant emeralds.
2. Geological Setting
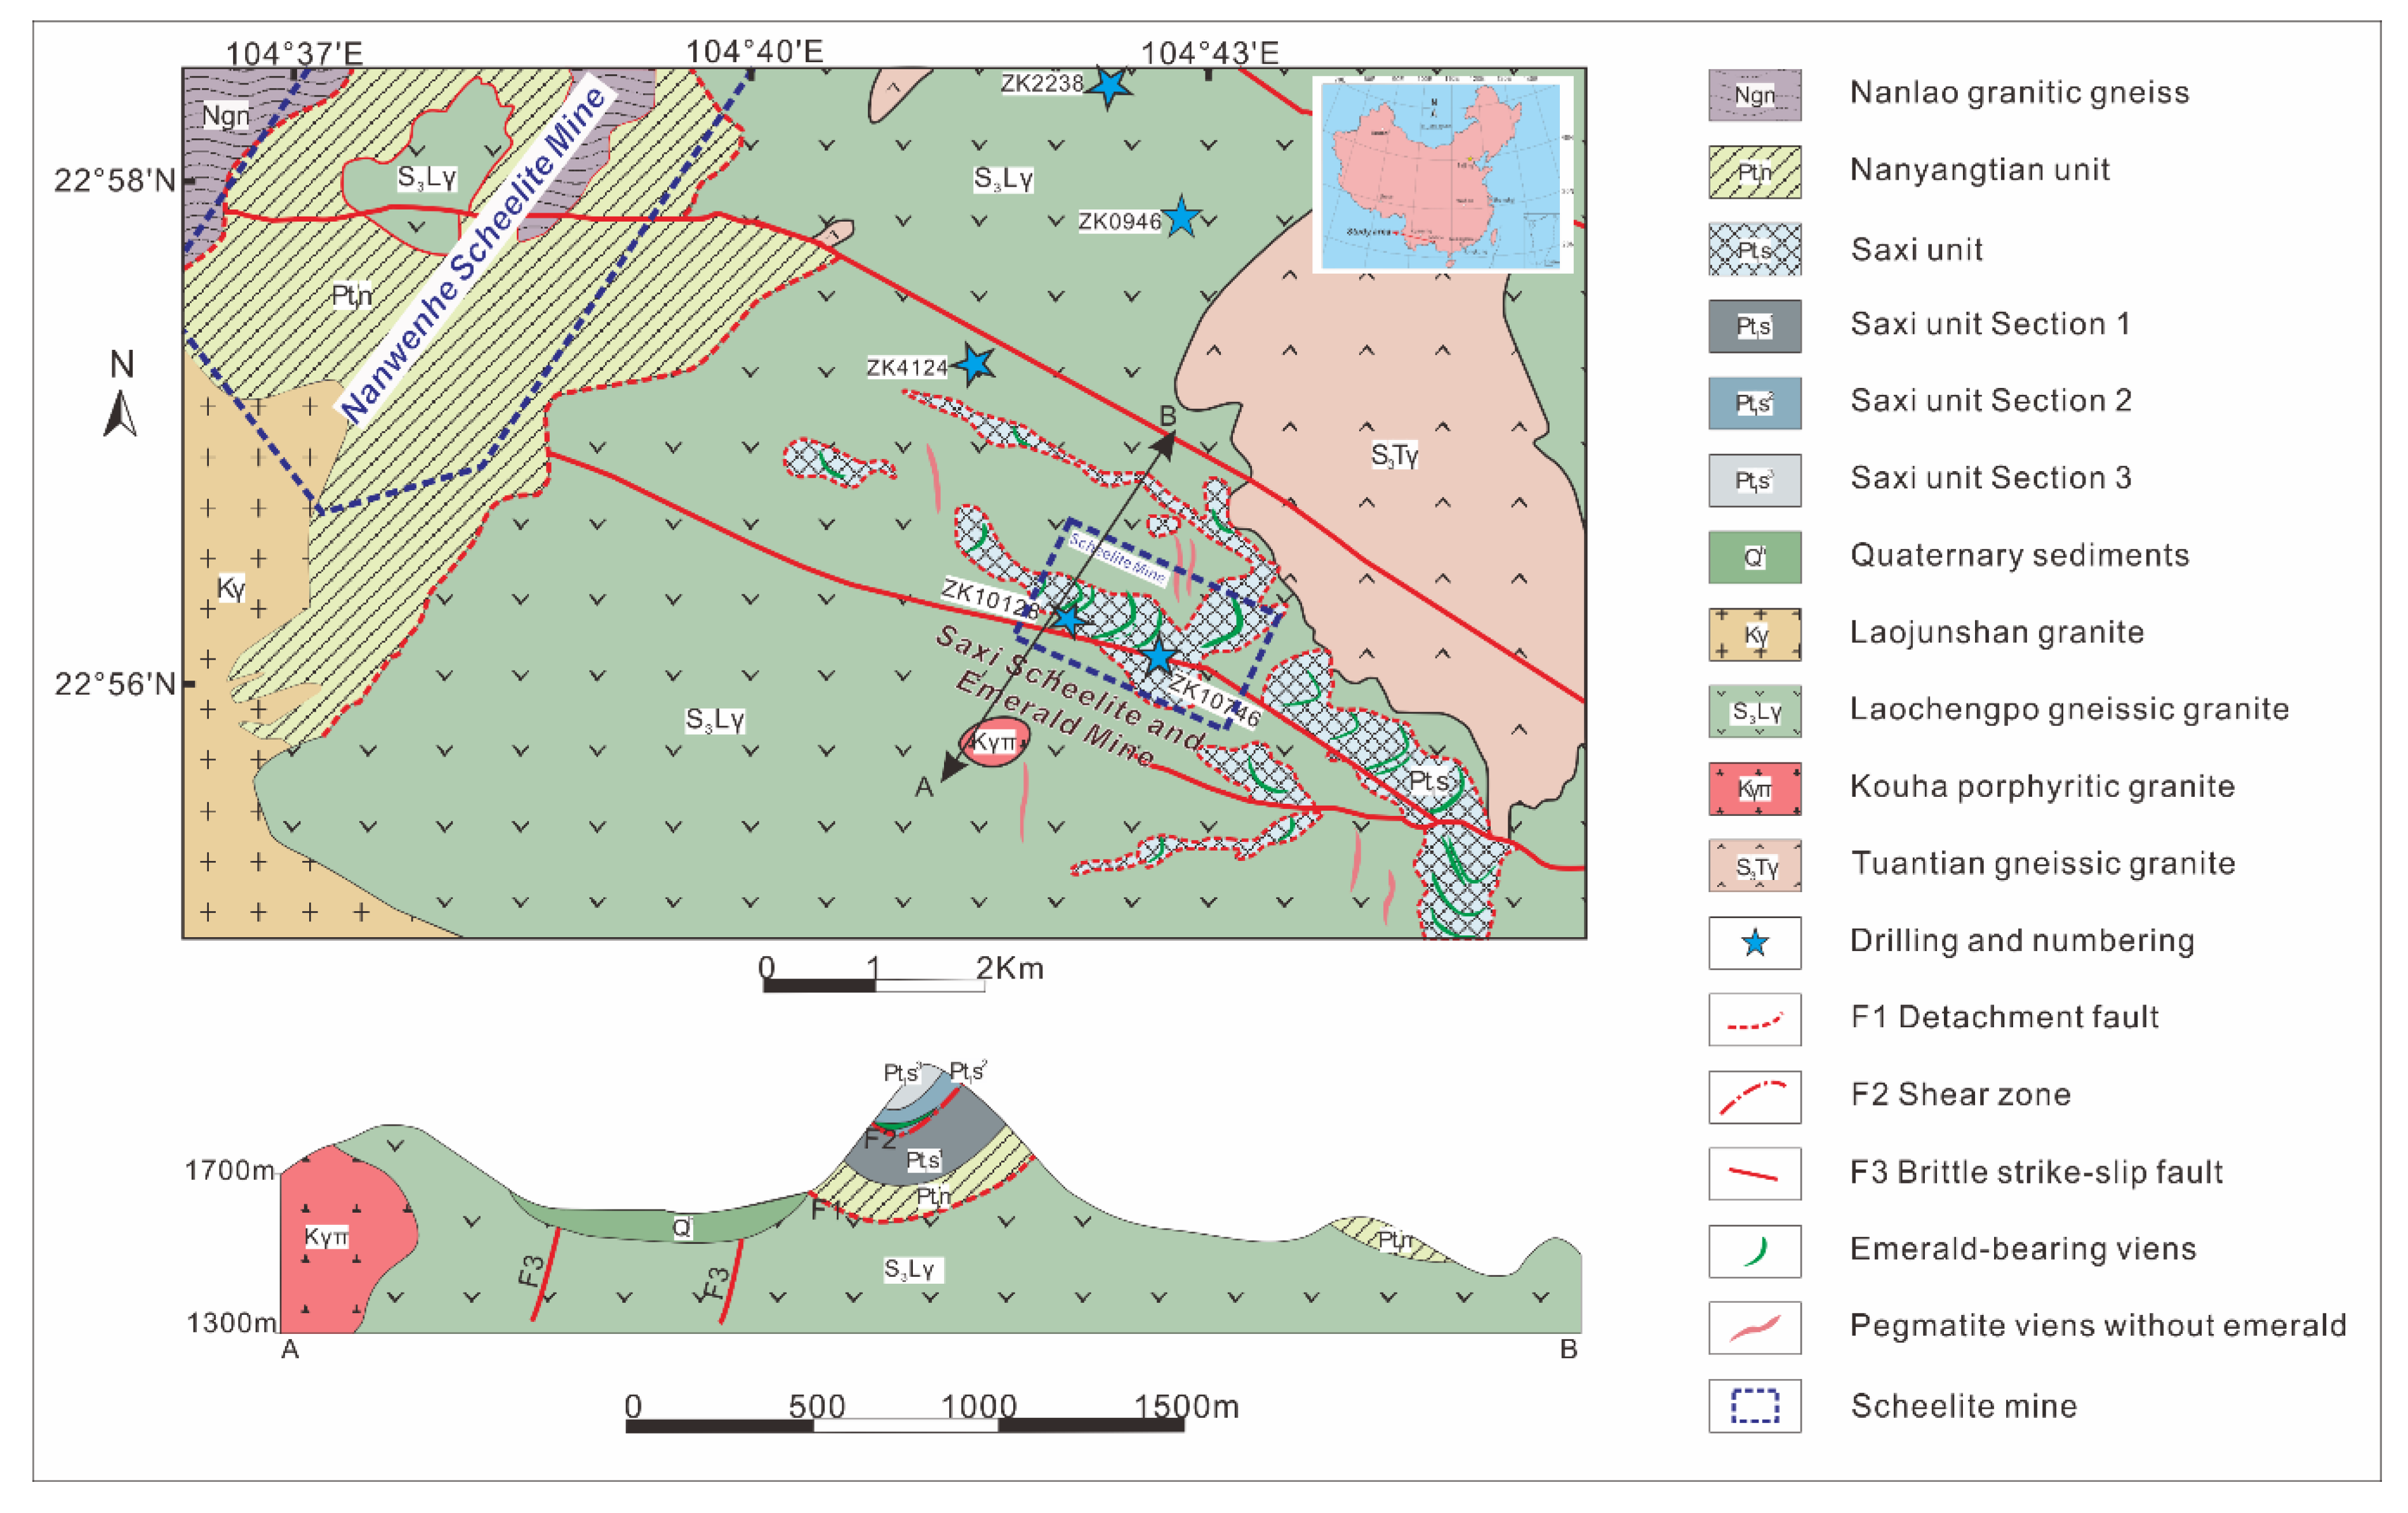
The Dayakou emerald occurrence is located 25 km south of Malipo, in Yunnan Province, China. Regional geological parameters are shown in Figure 1. The occurrence is hosted by the Neoproterozoic Mengdong metamorphic sequence which consists of the older Nanyangtian Unit (Pt3n) and overlying Saxi Unit (Pt3s) [25,26,27,28]. The Saxi Unit mainly consists of biotite-plagioclase granofel with several lenses of plagioclase amphibolite (Pt3s1), striped biotite granofel and biotite-plagioclase gneiss with minor biotite-muscovite schist (Pt3s2), and diopsidite, diopside-plagioclase granofel, and quartzite (Pt3s3). The granofel with scaly granoblastic texture in the Saxi Unit is the only host rock for emerald mineralization in the Dayakou occurrence. The Saxi Unit consists of quartz (30–60%), plagioclase (25–60%), orthoclase (15%), and biotite (10%) with minor muscovite, tourmaline, garnet, apatite, titanite, pyrite, and arsenopyrite [24,27].
The magmatic rocks near the emerald occurrence are mainly derived from magmatic activities in two periods, the Late Silurian and the Cretaceous-Tertiary. The Late Silurian granitic rocks consist of Tuantian gneiss granite, Nanlao granitic gneiss, and Laochengpo gneiss granite (S-type), which were dated by zircon U-Pb age at ~436 Ma, ~430 Ma, and ~427 Ma, respectively [30]. The Cretaceous Laojunshan (S-type) granite, which is mainly composed of biotite porphyry granite, was dated at 88.9 ± 1.1 Ma to 93.9 ± 2.0 Ma [31], 86.66 ± 0.42 Ma, 86.72 ± 0.47 Ma, 86.02 ± 0.48 Ma [32], and 86.5 ± 1 Ma to 117.1± 0.9 Ma [33] using zircon U-Pb techniques, and the inherited zircon U-Pb age are 105~156 Ma [29]. The youngest Kouha granite yielded an Early Tertiary age of 64.40 ± 0.45 Ma by Ar-Ar dating of biotite [24]. With the Ar-Ar age of muscovite and biotite from emerald-bearing veins, the Dayakou emerald deposition was dated at approximately 124 Ma. Neither Laojunshan nor Kouha granites have been proved to be the heat and/or Be source for emerald veins. Kouha porphyry granite shows high concentrations of Be (34.7 ppm), but postdates the Dayakou emerald veins. Laojunshan granite is presumably genetically related to emerald mineralization on account of the similar geological age, but more evidences are required for a reliable interpretation.
There are two main geological structures controlling emerald formation. The older ductile-brittle structure is NW-trending detachment faults. The main detachment faults (F1) separate Nanyangtian Unit and gneiss granite, and the shear zones (F2) separate Pt3s1 and Pt3s2. Another ductile-brittle structure is NNE- (or NE-) trending structural fractures which are formed by the emplacement of the Early Cretaceous granitic intrusion [27].
The Dayakou emerald deposition occurred at approximately 124 Ma, which is consistent with the protracted Cretaceous plutonism [29,32]. When the Early Cretaceous peraluminous granitic to pegmatitic rocks intruded Neoproterozoic metamorphic rocks, granitic to pegmatitic intrusion was the heat and Be source of emerald formation, while granofel of Saxi Unit provided Cr and V. Fluid inclusion studies have shown the presence of H2O-NaCl-CO2-CH4-N2 fluids with a salinity between 0 to 10.5 wt.% equivalent NaCl. Emerald crystallizes at approximately 365 to 420 °C and pressure ranging from approximately 1500 to 3300 bar [24,34].
The Dayakou emerald is mainly located in NNE- or NE-trending pegmatite veins and NW-trending quartz veins in F2 shear zones. Pegmatite veins, generally 5–35 cm in thickness but up to 300 m in length, are the dominant sources to produce emeralds which are more euhedral with poor clarity. The major minerals in pegmatite veins are quartz (75–90%) and albite (5–15%), with minor amounts of potassic feldspar (5–10%), tourmaline (2–10%), beryl (0–8%), and scheelite (2–5%). These veins also contain minor amounts of fluorite, calcite, arsenopyrite, muscovite, and pyrite. Quartz veins, generally only a few centimeters thick but tens of centimeters long, yield less abundant but higher quality small emerald crystals. The minor minerals in quartz veins are chlorite, scheelite, calcite, fluorite, tourmaline, and Cr-bearing muscovite [27,35].
3. Materials and Methods
3.1. Materials
Thirty four representative emerald samples (YE-1 to YE-34) from the Dayakou occurrence, Yunnan, China were selected for this study. These samples consist of crystal fractions and euhedral columnar single crystals with typical beryl crystal habit. Sized from 2 to 20 mm, these crystals are opaque to translucent and their colors cover various shades of green. All the samples were polished with double parallel sides and analyzed by LA-ICP-MS. Twenty-one individual crystals were selected for EMPA.
3.2. Methods
3.2.1. Electron Microprobe Analysis
Chemical composition of emerald crystals and tourmalines were determined by EMPA using a JXA-8230 instrument (Japan Electron, Akishima, Japan) housed at Key Laboratory of Metallogeny and Mineral Assessment, Institute of Mineral Resources, Chinese Academy of Geological Science (CAGS, Beijing, China). Accelerating voltage, current, and beam diameter were 15 kV, 20 nA, and 1–5 μm, respectively. Element peaks and background were measured with counting times of 10 s and 5 s, respectively. NaAlSi3O8 (NaKα, TAP), MgO (MgKα, TAP), Al2O3 (AlKα, TAP), SiO2 (SiKα, TAP), KNbO3 (KKα, PET), pollucite (CsLα, PET), RbTiOPO4 (RbKα, PET), CaSiO3 (CaKα, PET), CoO (CoKα, LIF), MnO2 (MnKα, LIF), TiO2 (TiKα, LIF), NiO (NiKα, LIF), Fe3O4 (FeKα, LIF), Cr2O3 (CrKα, LIF), and V-P-K glass (VKα, LIF) have been used as standards. Matrix corrections were calculated by the ZAF method [36]. The detection limits for an individual element vary from 0.01 to 0.04 wt.%. The structural formulae of emerald were recalculated on the basis of 6 Si atoms per formula unit (apfu). Recalculation of structural formulae of tourmalines was carried out with the program WinTcac developed by [37] on the basis of Si = 6.
3.2.2. Laser Ablation-Inductively Coupled Plasma Mass Spectrometry
In situ trace element measurements were performed using a X-Series ICP-MS (Thermo Fisher Scientific, Waltham, MA, USA) fitted with a 343 nm femto-second laser ablation system (J-100, Applied Spectra, West Sacramento, CA, USA), housed at the National Research Center for Geoanalysis (CAGS). The radiofrequency power of ICP-MS was 1300 W. Helium gas carrying the ablated sample aerosol from the chamber was mixed with argon gas and nitrogen as an additional diatomic gas to enhance sensitivity. A baffled-type smoothing device was used in front of the ICP-MS to reduce fluctuation effects induced by laser-ablation pulses and to improve the analytic quality like [38]. Samples were ablated for 60 s at a repetition rate of 8 Hz at 8 J/cm2, and ablation pits were ~50 μm in diameter. Each analysis incorporated an approximate 20 s background acquisition (gas blank) followed by 50 s data acquisition from the sample. Every twelve analyses were followed by a calibration process with two analyses of NIST 610 and one analysis of NIST 612 in order to correct the time-dependent drift of sensitivity and mass discrimination. All elemental concentrations were calculated by applying 29Si as an internal standard. Data reduction was carried out with the commercial software ICPMSDataCal 10.8 [39]. The analytical procedures and calibration methods were similar to those described by [39]. The detection limits of LA-ICP-MS range from 0.05 to 0.1 ppm for REE. The precision and accuracy are about 10% rel. at ppm level.
4. Results
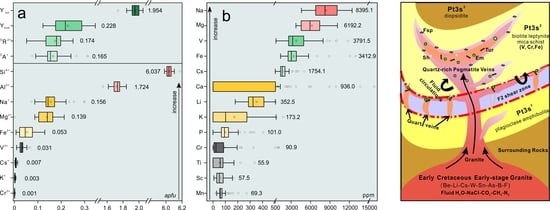
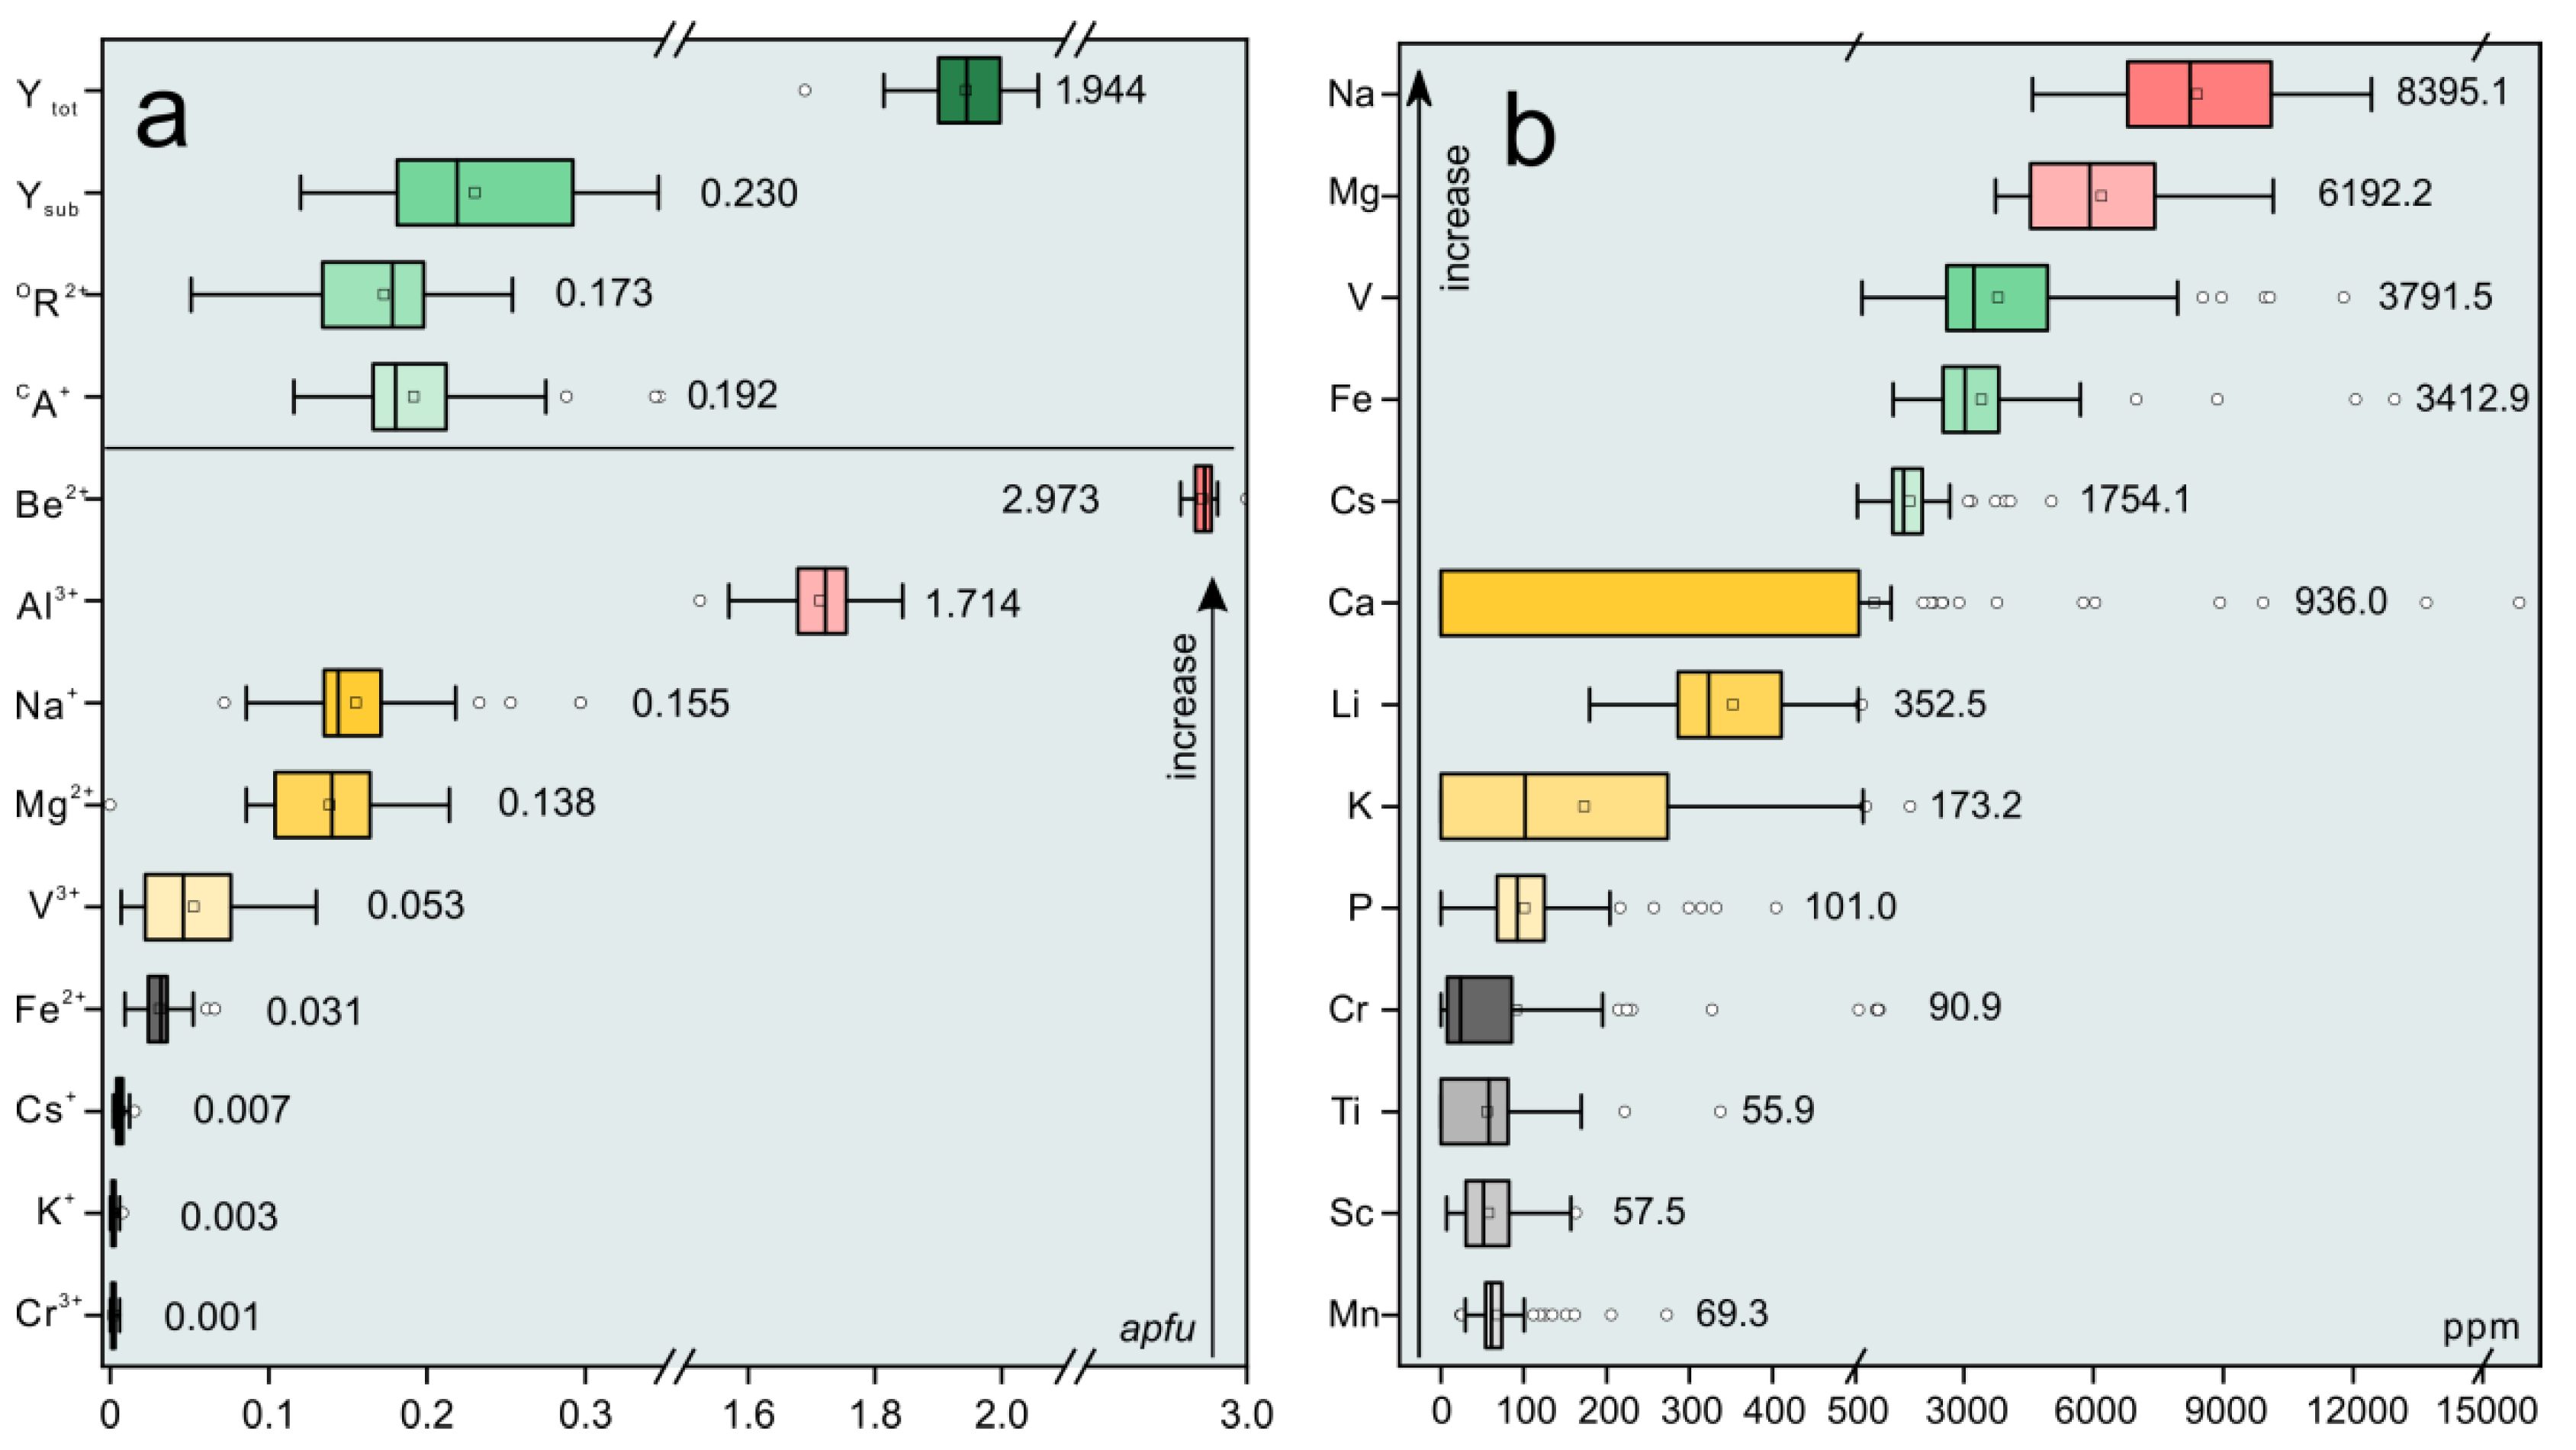
Major and minor elemental compositions of the Dayakou emerald samples expressed in oxides and formula obtained from individual crystals by EMPA are presented in Table 1. A total of 49 electron microprobe analyses of emeralds and four analyses of tourmaline inclusions were obtained from 21 individual crystals. Trace element compositions expressed in ppm were obtained from 34 individual emerald crystals, and results are given in Table 2. An overview of chemical compositions is displayed in boxplots (Figure 2). Al ions (avg. 1.714 apfu) are the ideal occupant of the Y site, but show obvious deficits. Mg (avg. 0.138 apfu), Fe (avg. 0.031 apfu), and V (avg. 0.053 apfu) ions are the main substituents for Al, in the order Mg > V > Fe. The sum of Y site substituents (avg. 0.230 apfu) ranges from 6.9% to 18.4% of the total site occupancy.
The most important chromophore in the Dayakou emerald is V, followed by Fe and negligible Cr (avg. 90.9 ppm). Na (avg. 0.155 apfu), K (avg. 0.003 apfu), and Cs (avg. 0.007 apfu) ions are alkali metal ions (CA+) in structural channel with the concentration decreasing accordingly, indicating the Dayakou emerald are Na-Cs-rich. Ca contents in most samples are below the detection limit. Furthermore, the crystals contain minor concentrations of Sc (avg. 57.5 ppm), Mn (avg. 69.3 ppm), Ti (avg. 55.9 ppm), and P (avg. 101 ppm). Water contents were calculated using the expression modified by [18]:
which yielded a range from 1.7 to 2.6 wt.% H2O.
H2O = 0.5401 ln Na2O + 2.1867
4.1. Major and Minor Elements from EMPA
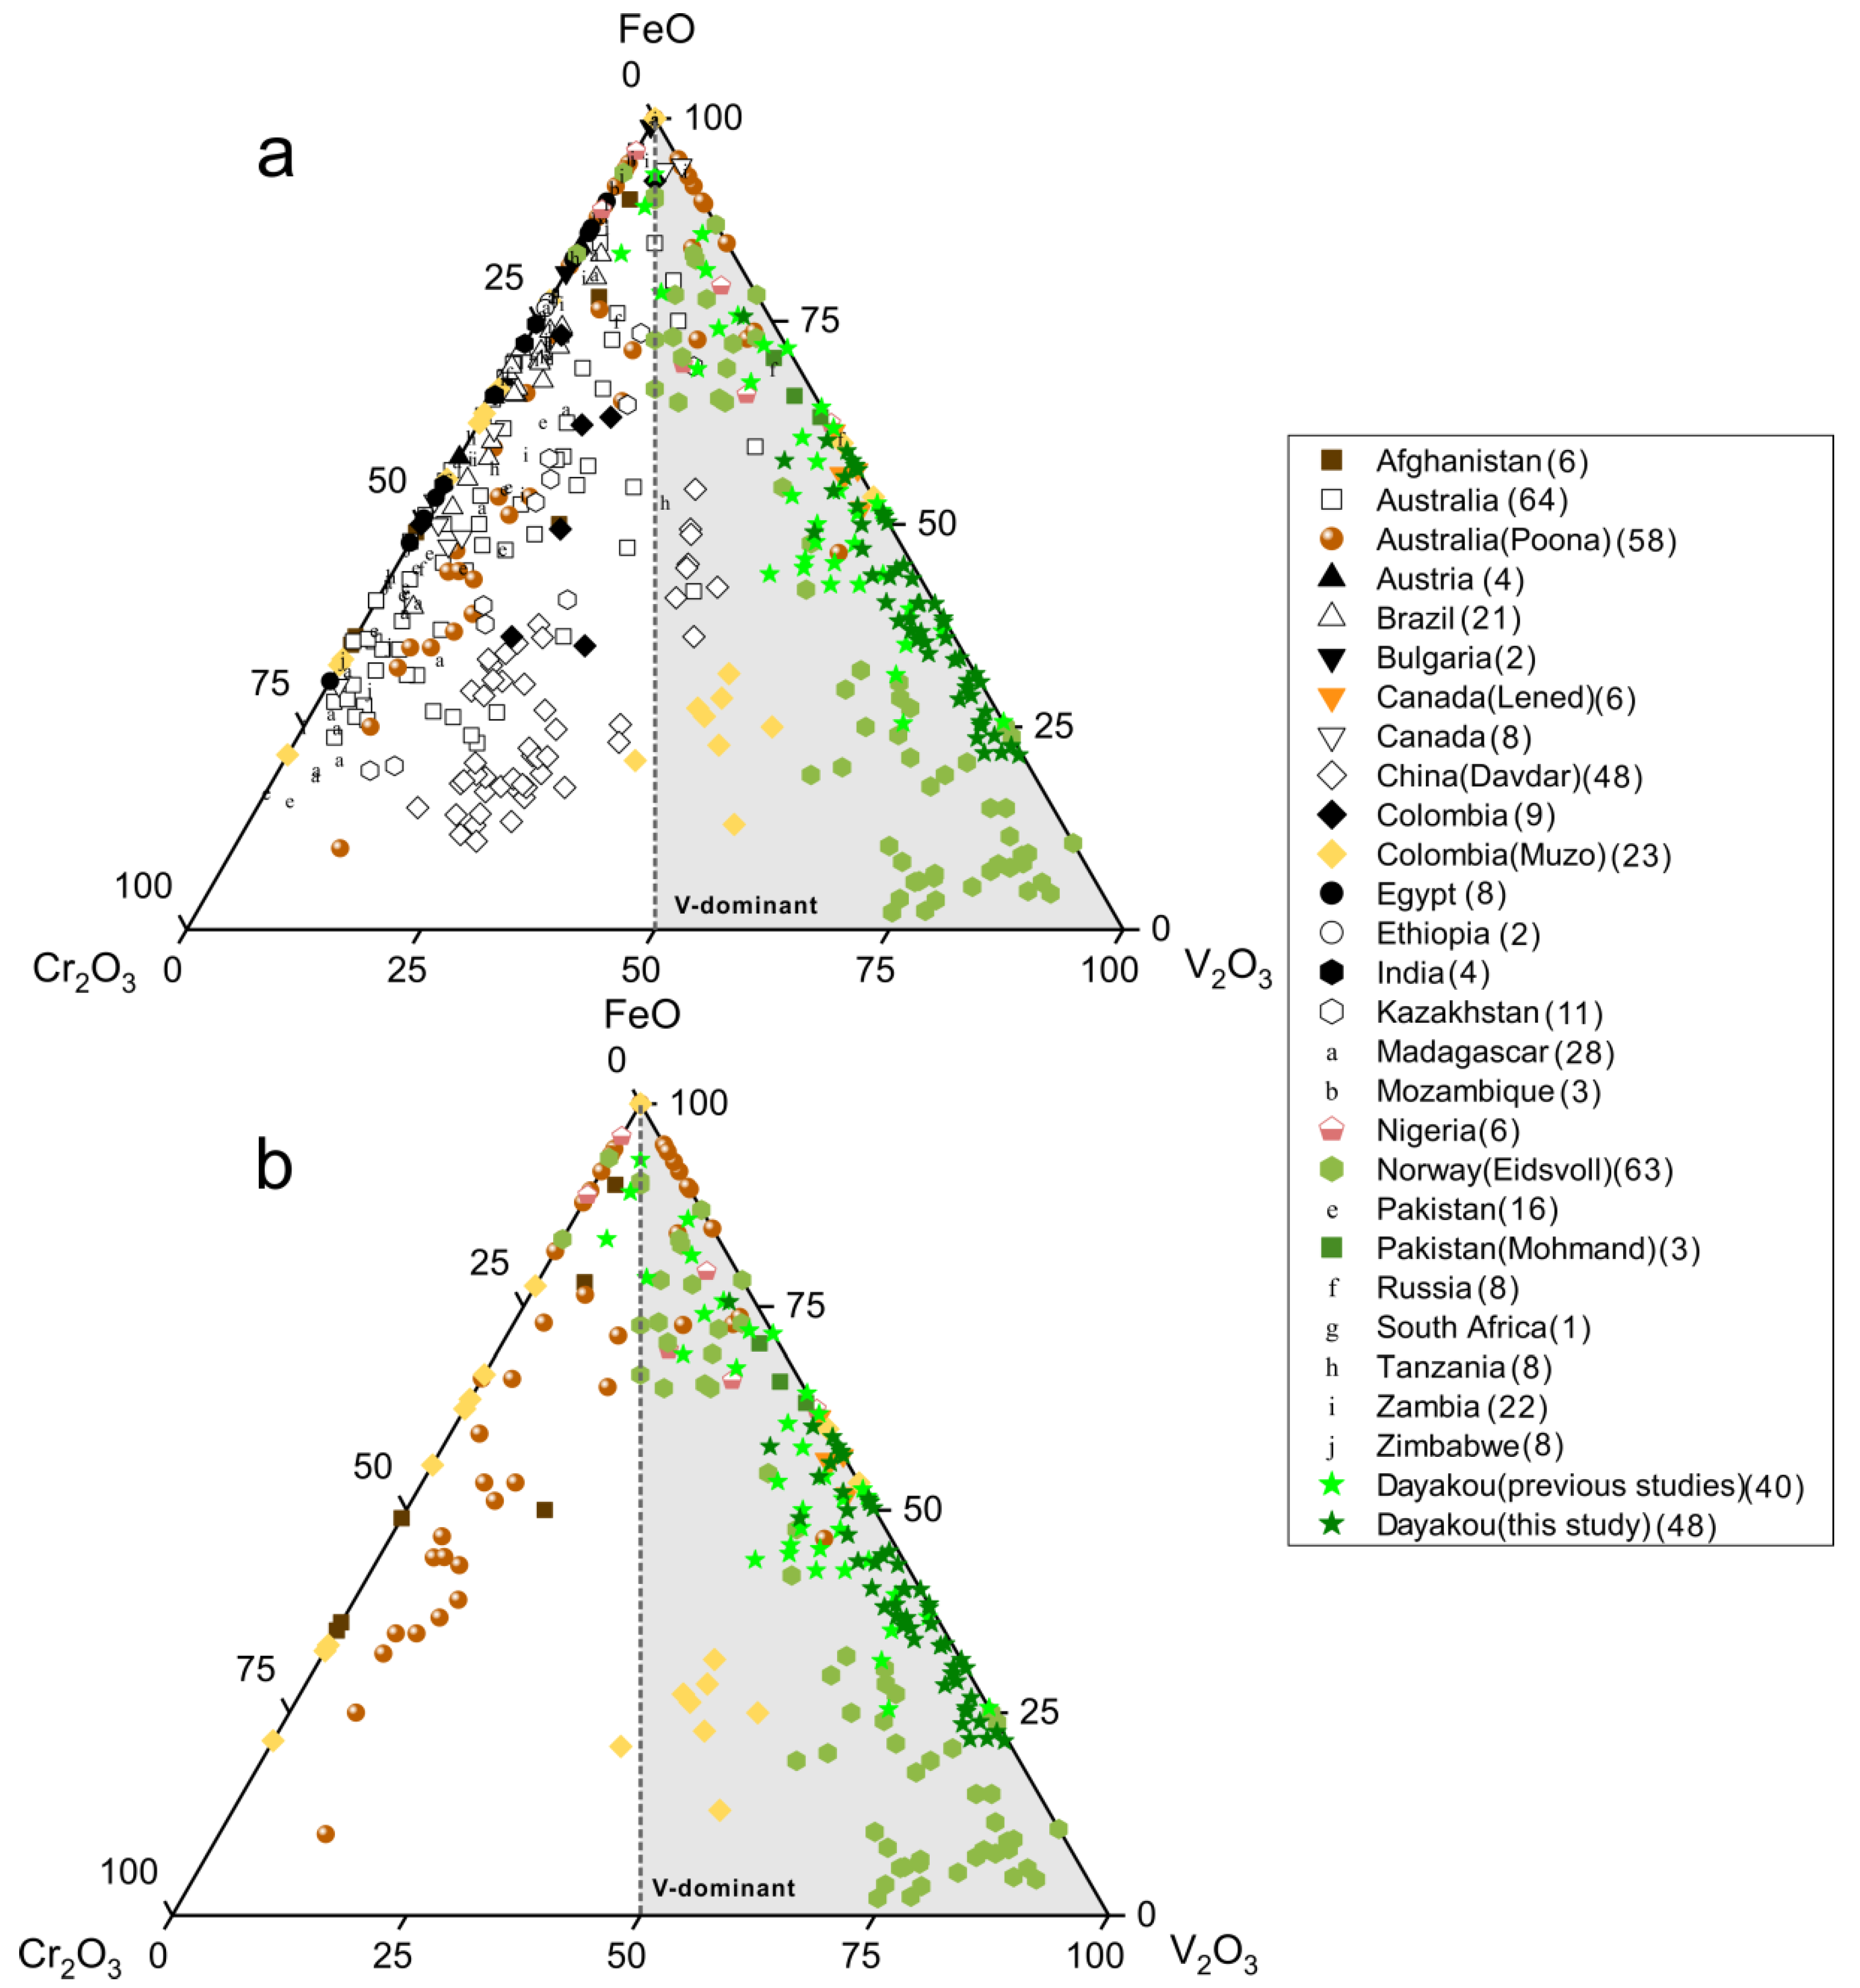
The chromophore elements (Cr, V and Fe) in emerald are plotted as oxides in Figure 3a,b. Cr and V are generally considered to be the primary chromophores. In most cases, Cr is dominant as the higher Cr2O3 contents than V2O3. However, samples from Dayakou (China), Lened (Canada), Muzo (Colombia), Mohmand (Pakistan), Eidsvoll (Norway), Jos (Nigeria), and Poona (Australia) are the main exceptions. V2O3 content is greater than Cr2O3 content in most or partial samples from those deposits. The Panjshir Valley (Afghanistan) emerald is also suspected of being V-dominant emerald on account of the high V2O3 content. Thus, these eight deposits are plotted together in Figure 3b. In the V-dominant area, clusters of Eidsvoll emerald are around V2O3 corner, while those of Dayakou, Lened, and Mohmand extend along the FeO-V2O3 edge of the plot. Clusters of Poona, Jos, and Panjshir Valley are around the FeO corner. Clusters of Muzo show that the V2O3 content is just slightly higher than the Cr2O3 content.
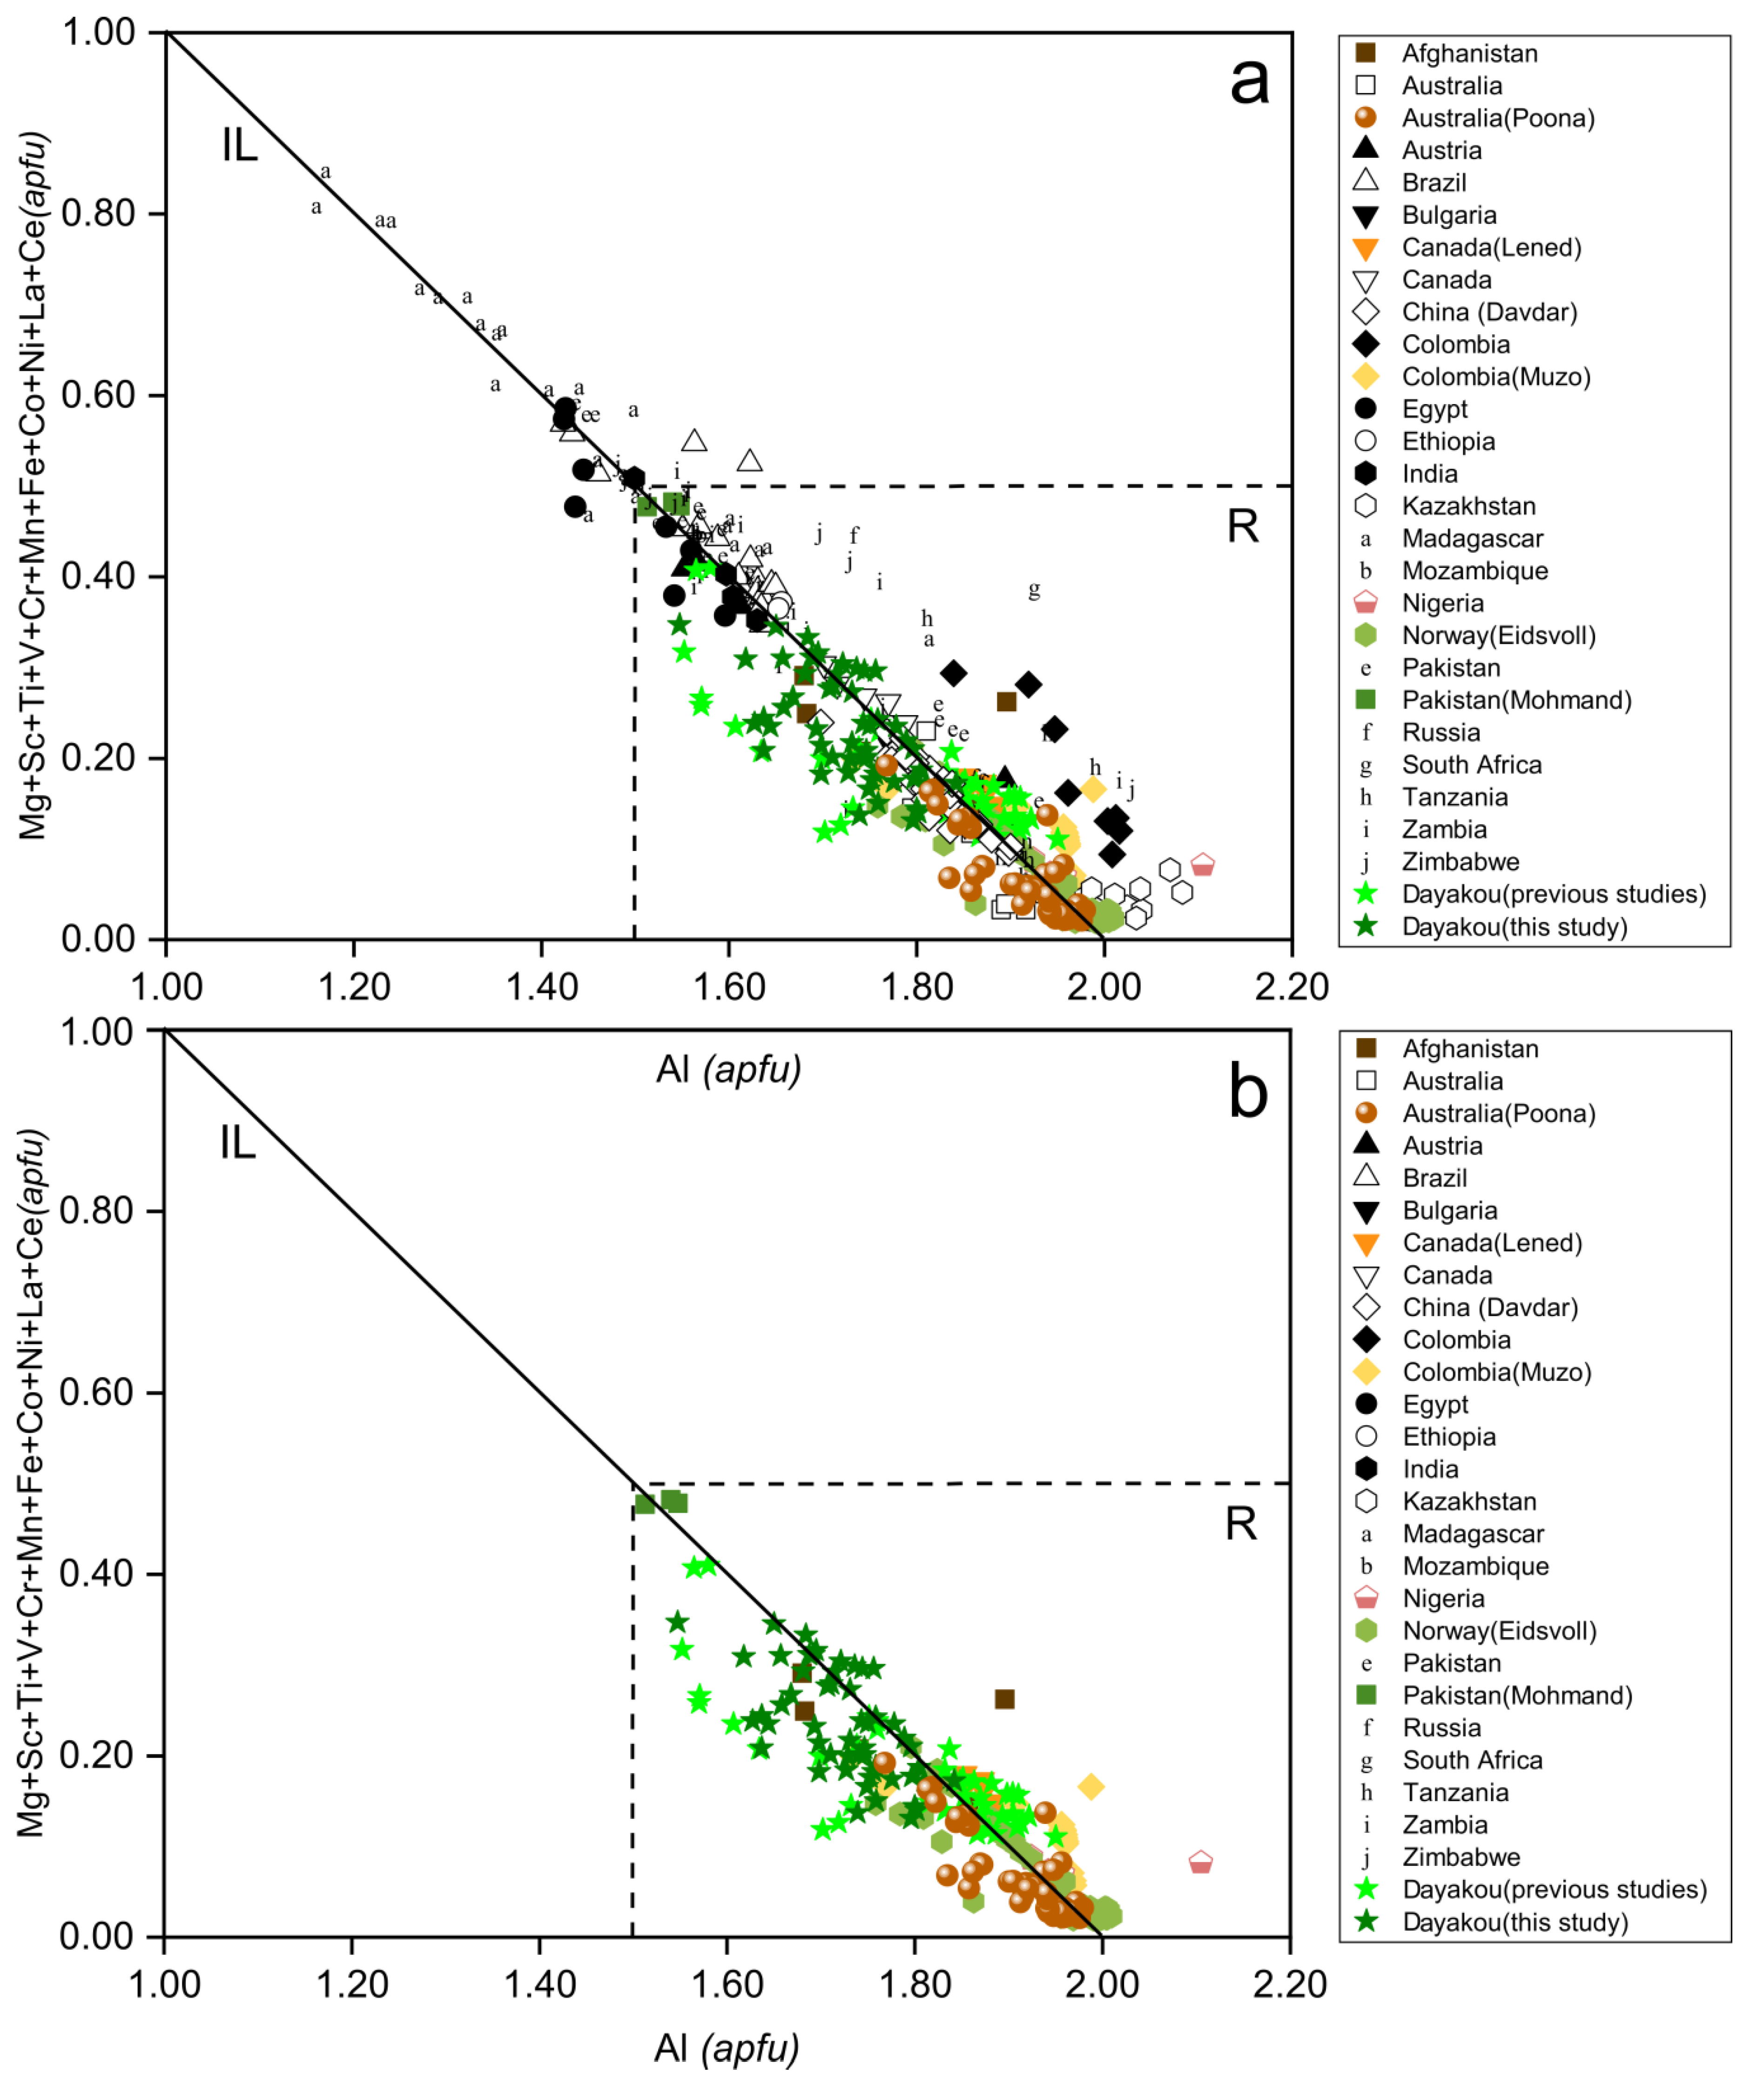
Figure 4a shows Al versus the sum of its substituents at the Y site of emeralds from Dayakou in comparison with worldwide samples from the literature. An expected negative correlation is observed, due to the common isomorphic substitution in octahedral site. In most cases, the Al occupancy in the octahedra is more than 75%, except for Madagascar deposits. Among V-dominant deposits (Figure 4b), the Muzo, Poona, and Eidsvoll compositions are at the Al-rich end, the Dayakou samples show a wide range of Al occupancy, and the Al occupancy of Mohmand is close to 75%.
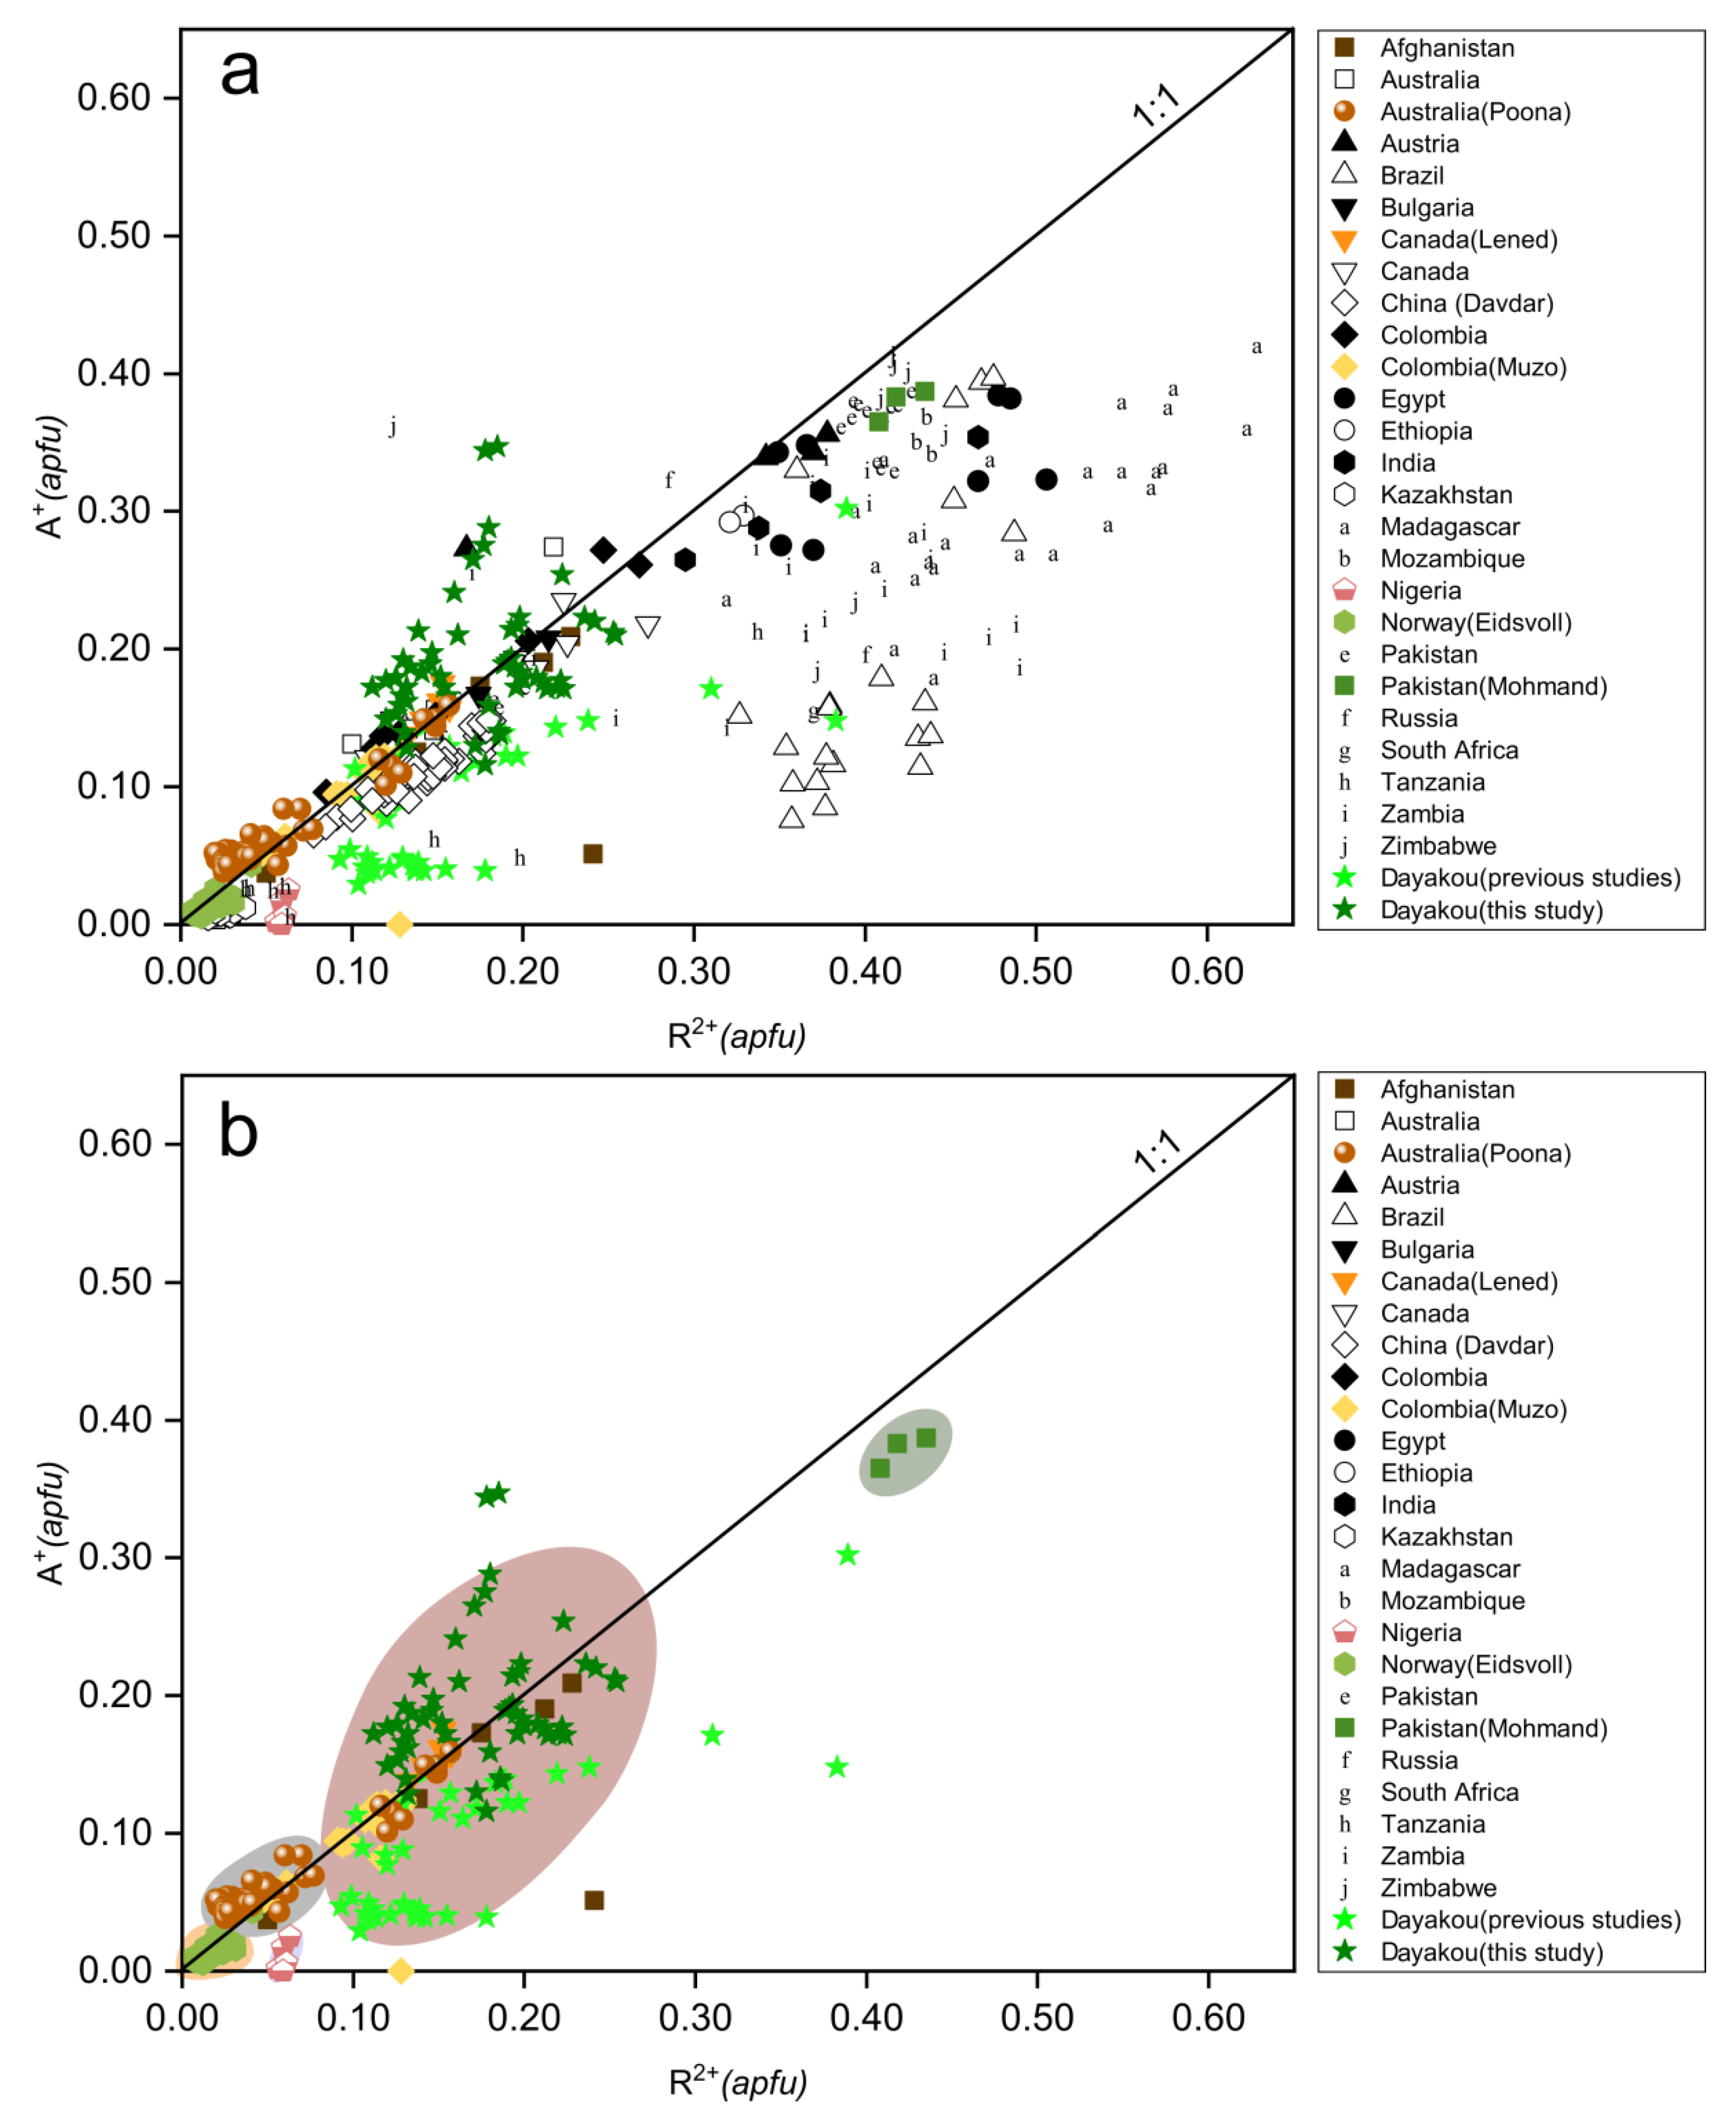
To compensate for the charge deficit introduced by the substitution of divalent cations (R2+ = avg. 0.174 apfu) for Al ions at Y site, the structure channel incorporates monovalent alkali cations (A+ = avg. 0.165 apfu). Figure 5a displays a nearly 1:1 correlation between R2+ (including Mg, Fe, Mn, Co, Ni) and A+ (including Na, K, Rb, Cs). Compositions of some samples lie below the 1:1 line, denoting that some of the Fe is present as Fe3+. Points of partial Dayakou samples lie above the 1:1 line, suggesting that Li+ substitutes Be2+ at T1 sites. In Figure 5b, five colored areas represent the discriminated clusters of V-dominant deposits. Clusters of Jos fall below the 1:1 line obviously, and those of Dayakou, Lened, Muzo, and Panjshir Valley overlap completely. In view of the content of R2+ and A+, the V-dominant deposits are distributed in the order Eidsvoll < Poona < Dayakou, Muzo, Lened, and Panjshir Valley < Mohmand.
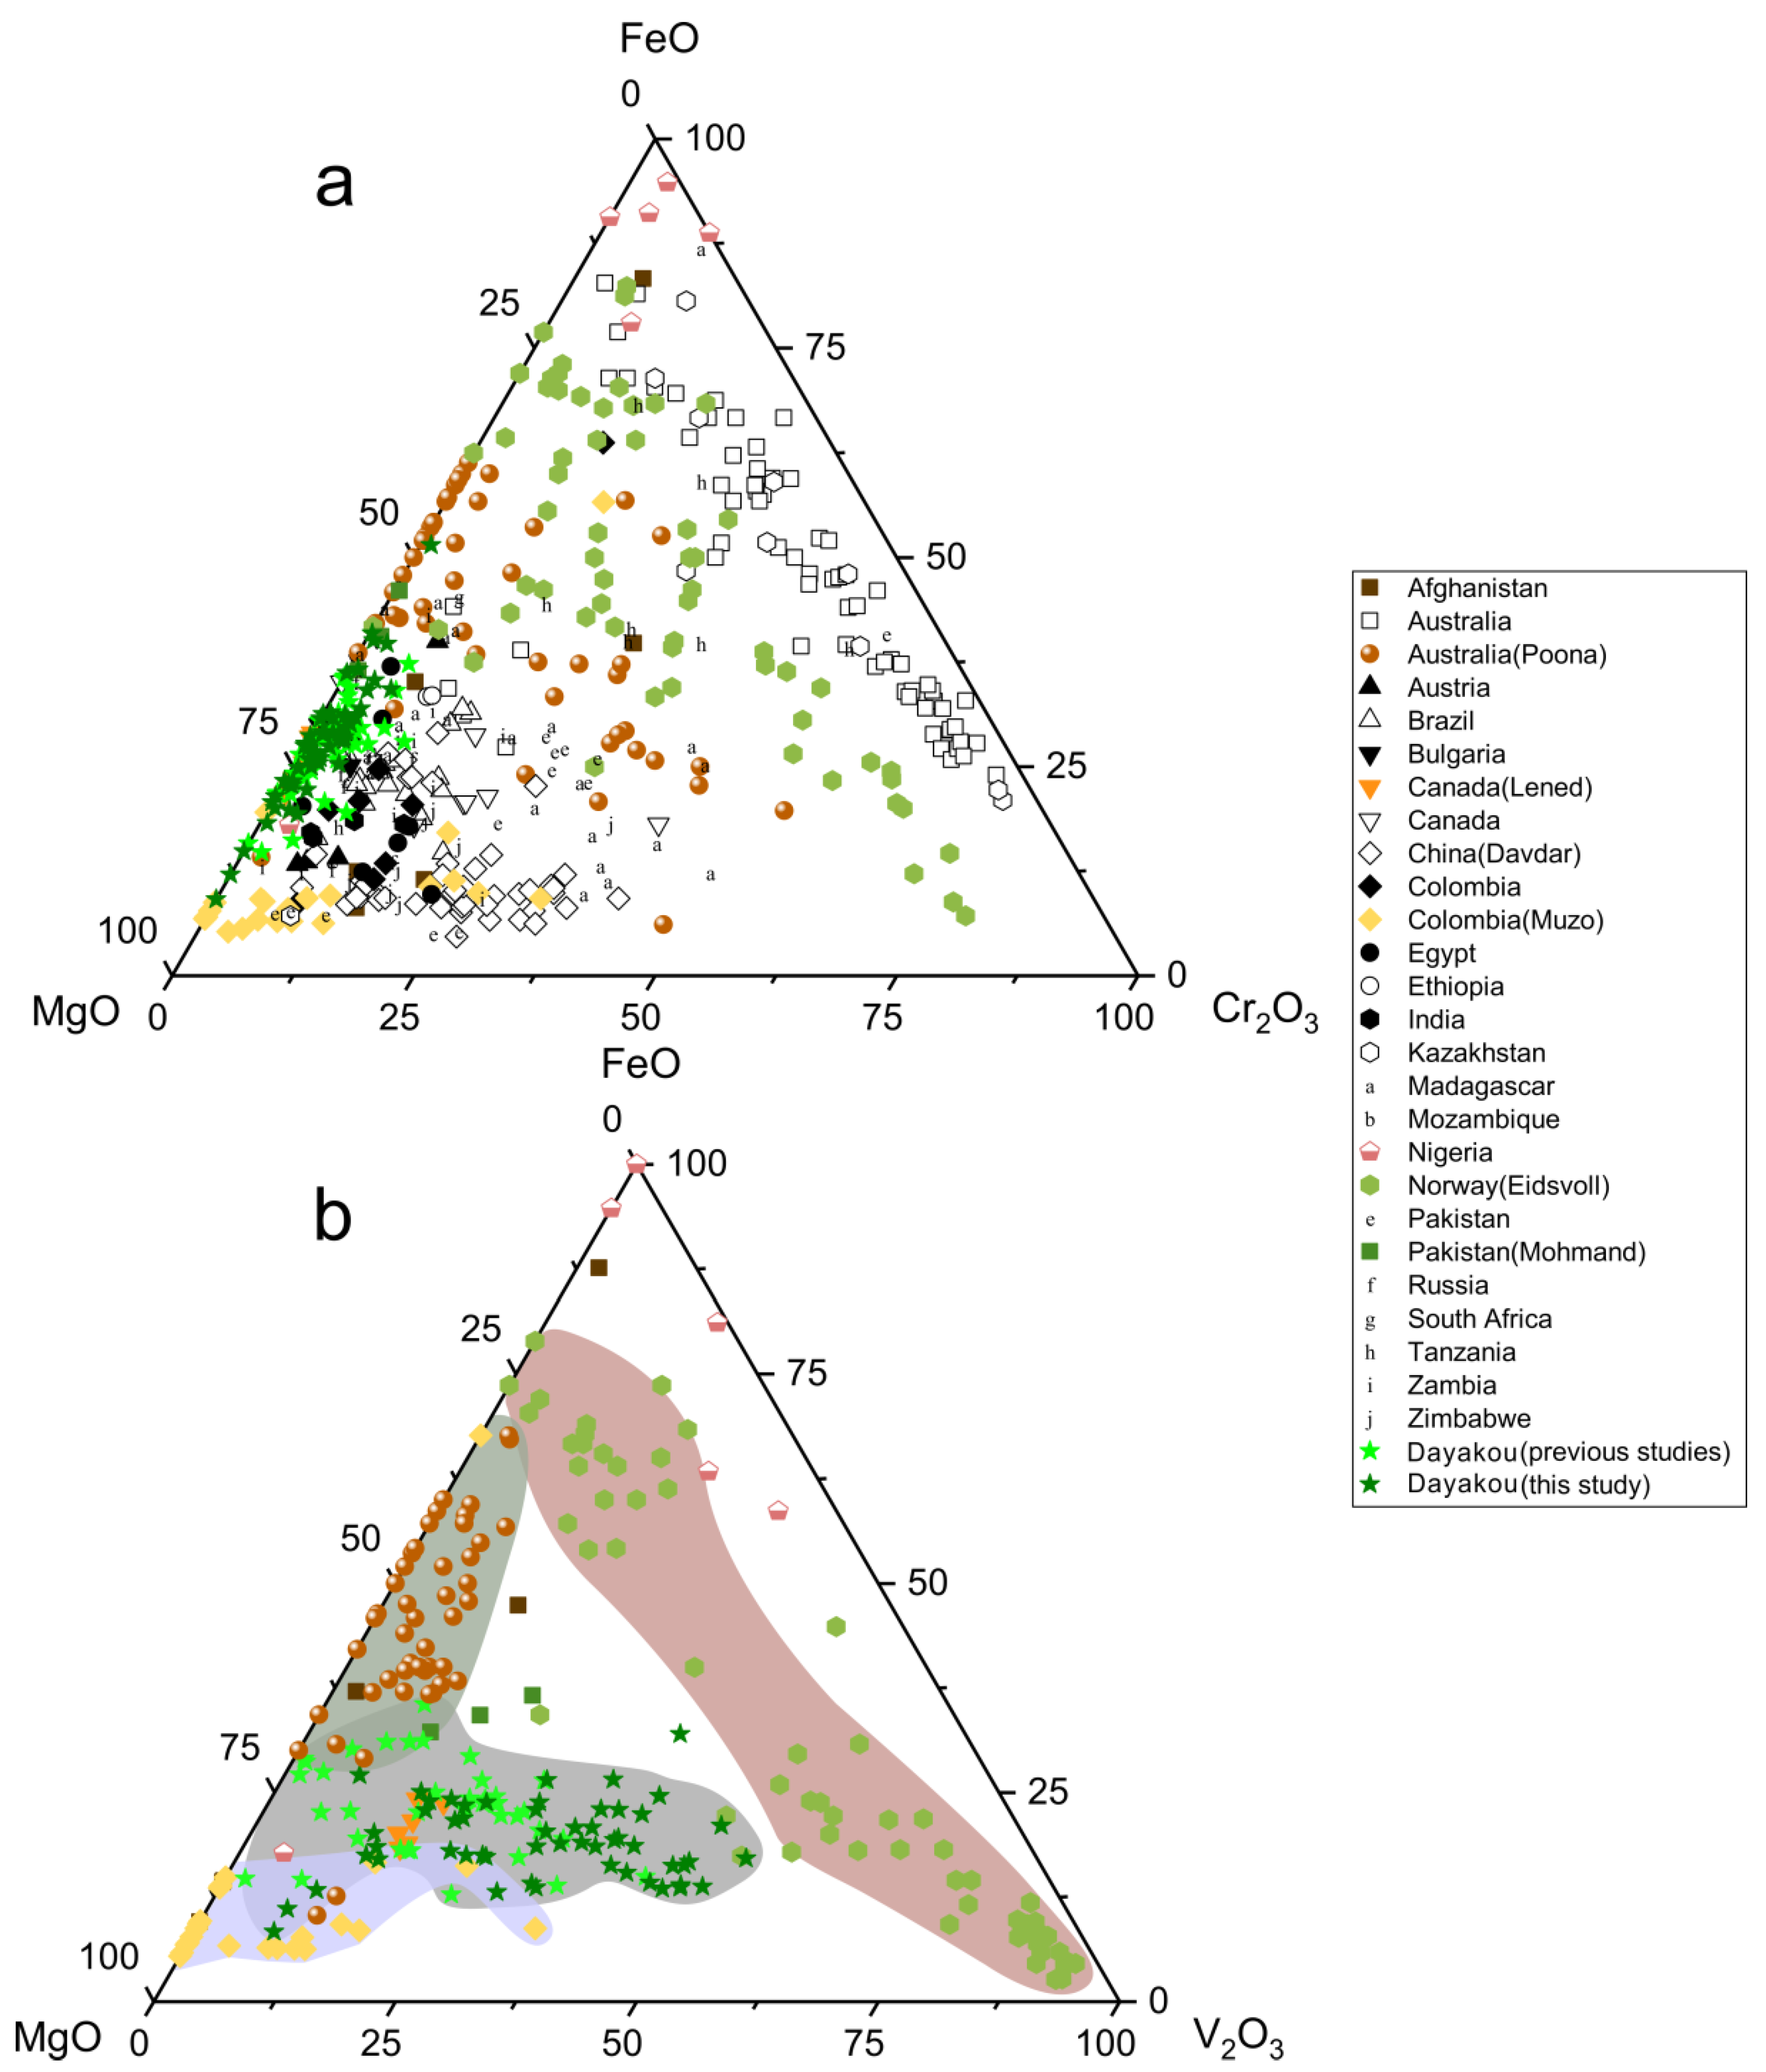
The main substituents for Al at Y site are plotted as oxides in Figure 6. Mg is the main substituent in most cases, as the majority of points is close to the MgO corner (Figure 6a). Only samples from Australia (except the Poona occurrence) show a relatively low content of MgO. Clusters of Davdar and Zimbabwe suggest that Cr2O3 content is higher than FeO content. With regard to V-dominant emerald, vanadium is the more significant substituent at the octahedral site. Figure 6b displays that the Eidsvoll emerald can be distinguished from the Muzo emerald by the content of MgO. Clusters of the Muzo emerald are around the MgO corner. The MgO content of the Eidsvoll emerald remains constant, whereas the main variation is between FeO and Cr2O3. Poona compositions extend along the FeO-MgO edge, showing a relatively low concentration of V2O3. The Dayakou emerald shows variable levels MgO and V2O3.
4.2. Trace Elements from LA-ICP-MS Analysis
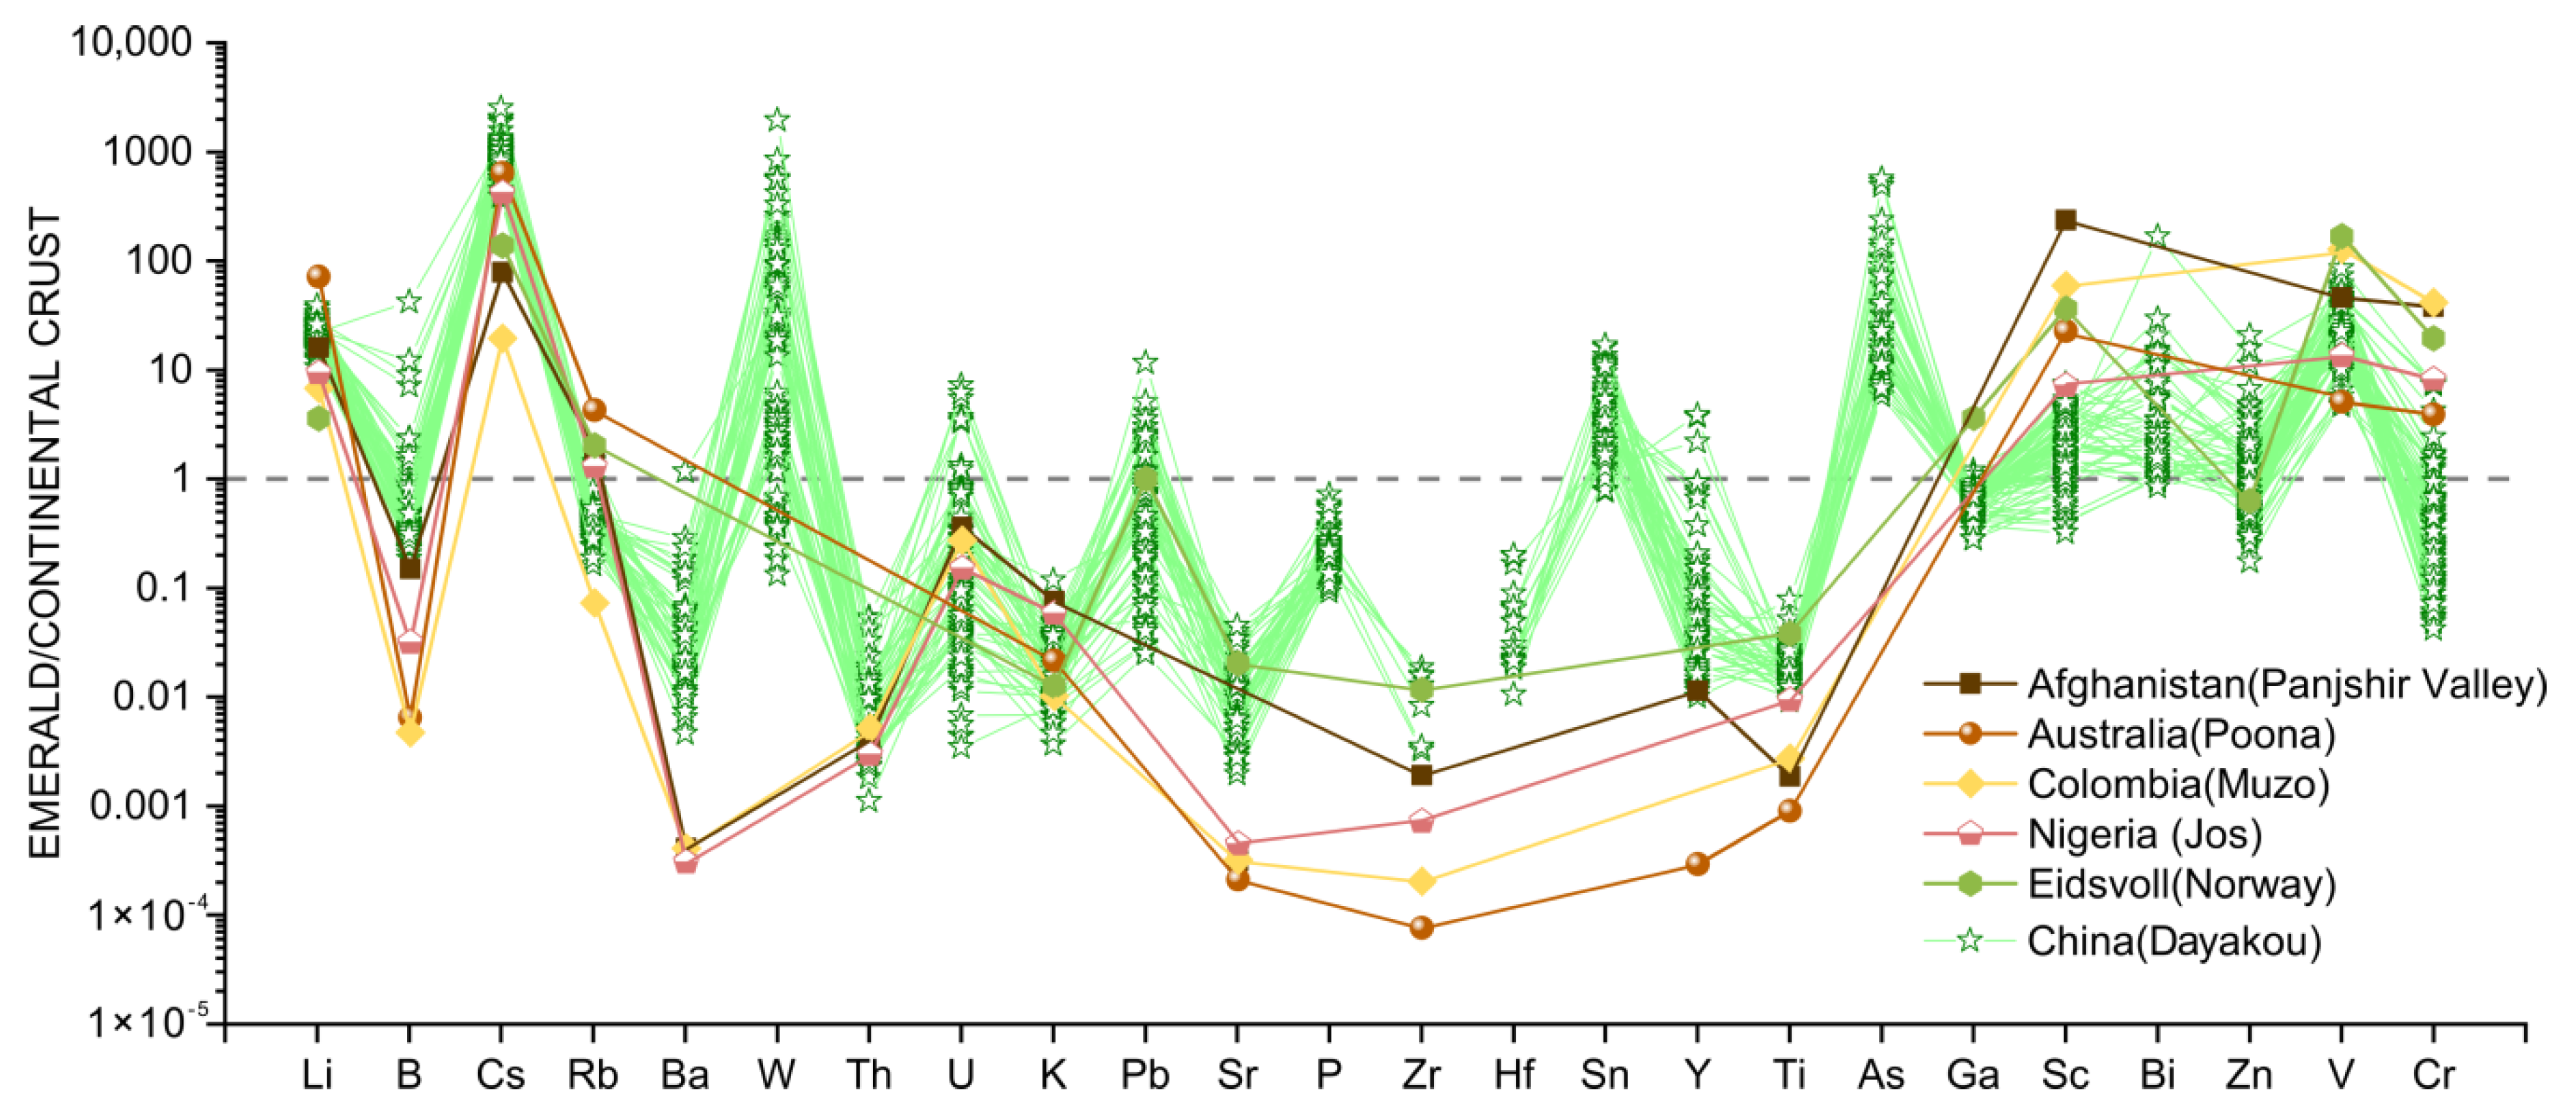
The bulk continental crust normalized [45] multi-element spider diagram (Figure 7) was constructed to illustrate the variation of trace elements in Dayakou emerald samples and to identify the differences among V-dominant emerald deposits worldwide. Trace elements of Dayakou samples in the diagram include light elements (LE: Li, B), incompatible elements (IE: Cs−Ti), and transition metal chromophoric elements (CTE: Cr and V). Other trace elements results from worldwide V-dominant emeralds are summarized from the previous work reported by [16,20,21,42].
Compared to the bulk continental crust, a relative enrichment in Li (avg. 353 ppm), B (avg. 11.6 ppm), Cs (avg. 1754 ppm), W (avg. 80.2 ppm), Sn (avg. 5.4 ppm), As (avg. 89.7 ppm), Bi (avg. 0.7 ppm), and V (avg. 3792 ppm), and depletion in Ba (avg. 17.4 ppm), Th (avg. 0.03 ppm), K (avg. 173 ppm), Sr (avg. 2.2 ppm), Ga (avg. 10.5 ppm), and Ti (avg. 55.9 ppm) for Dayakou emeralds is observed in Figure 7. The contents of Li, Cs, Ga, Ti, and V are variable between relatively narrow limits, while those of W, U, Pb, and Cr between a wide range. In contrast to other V-dominant emerald deposits, the Dayakou emerald shows the highest contents of B, Cs, and Ba, and incorporates significant W, Sn, and As. To explore the discrimination further, a series of binary diagrams were constructed (Figure 8, Figure 9, Figure 10, Figure 11 and Figure 12).
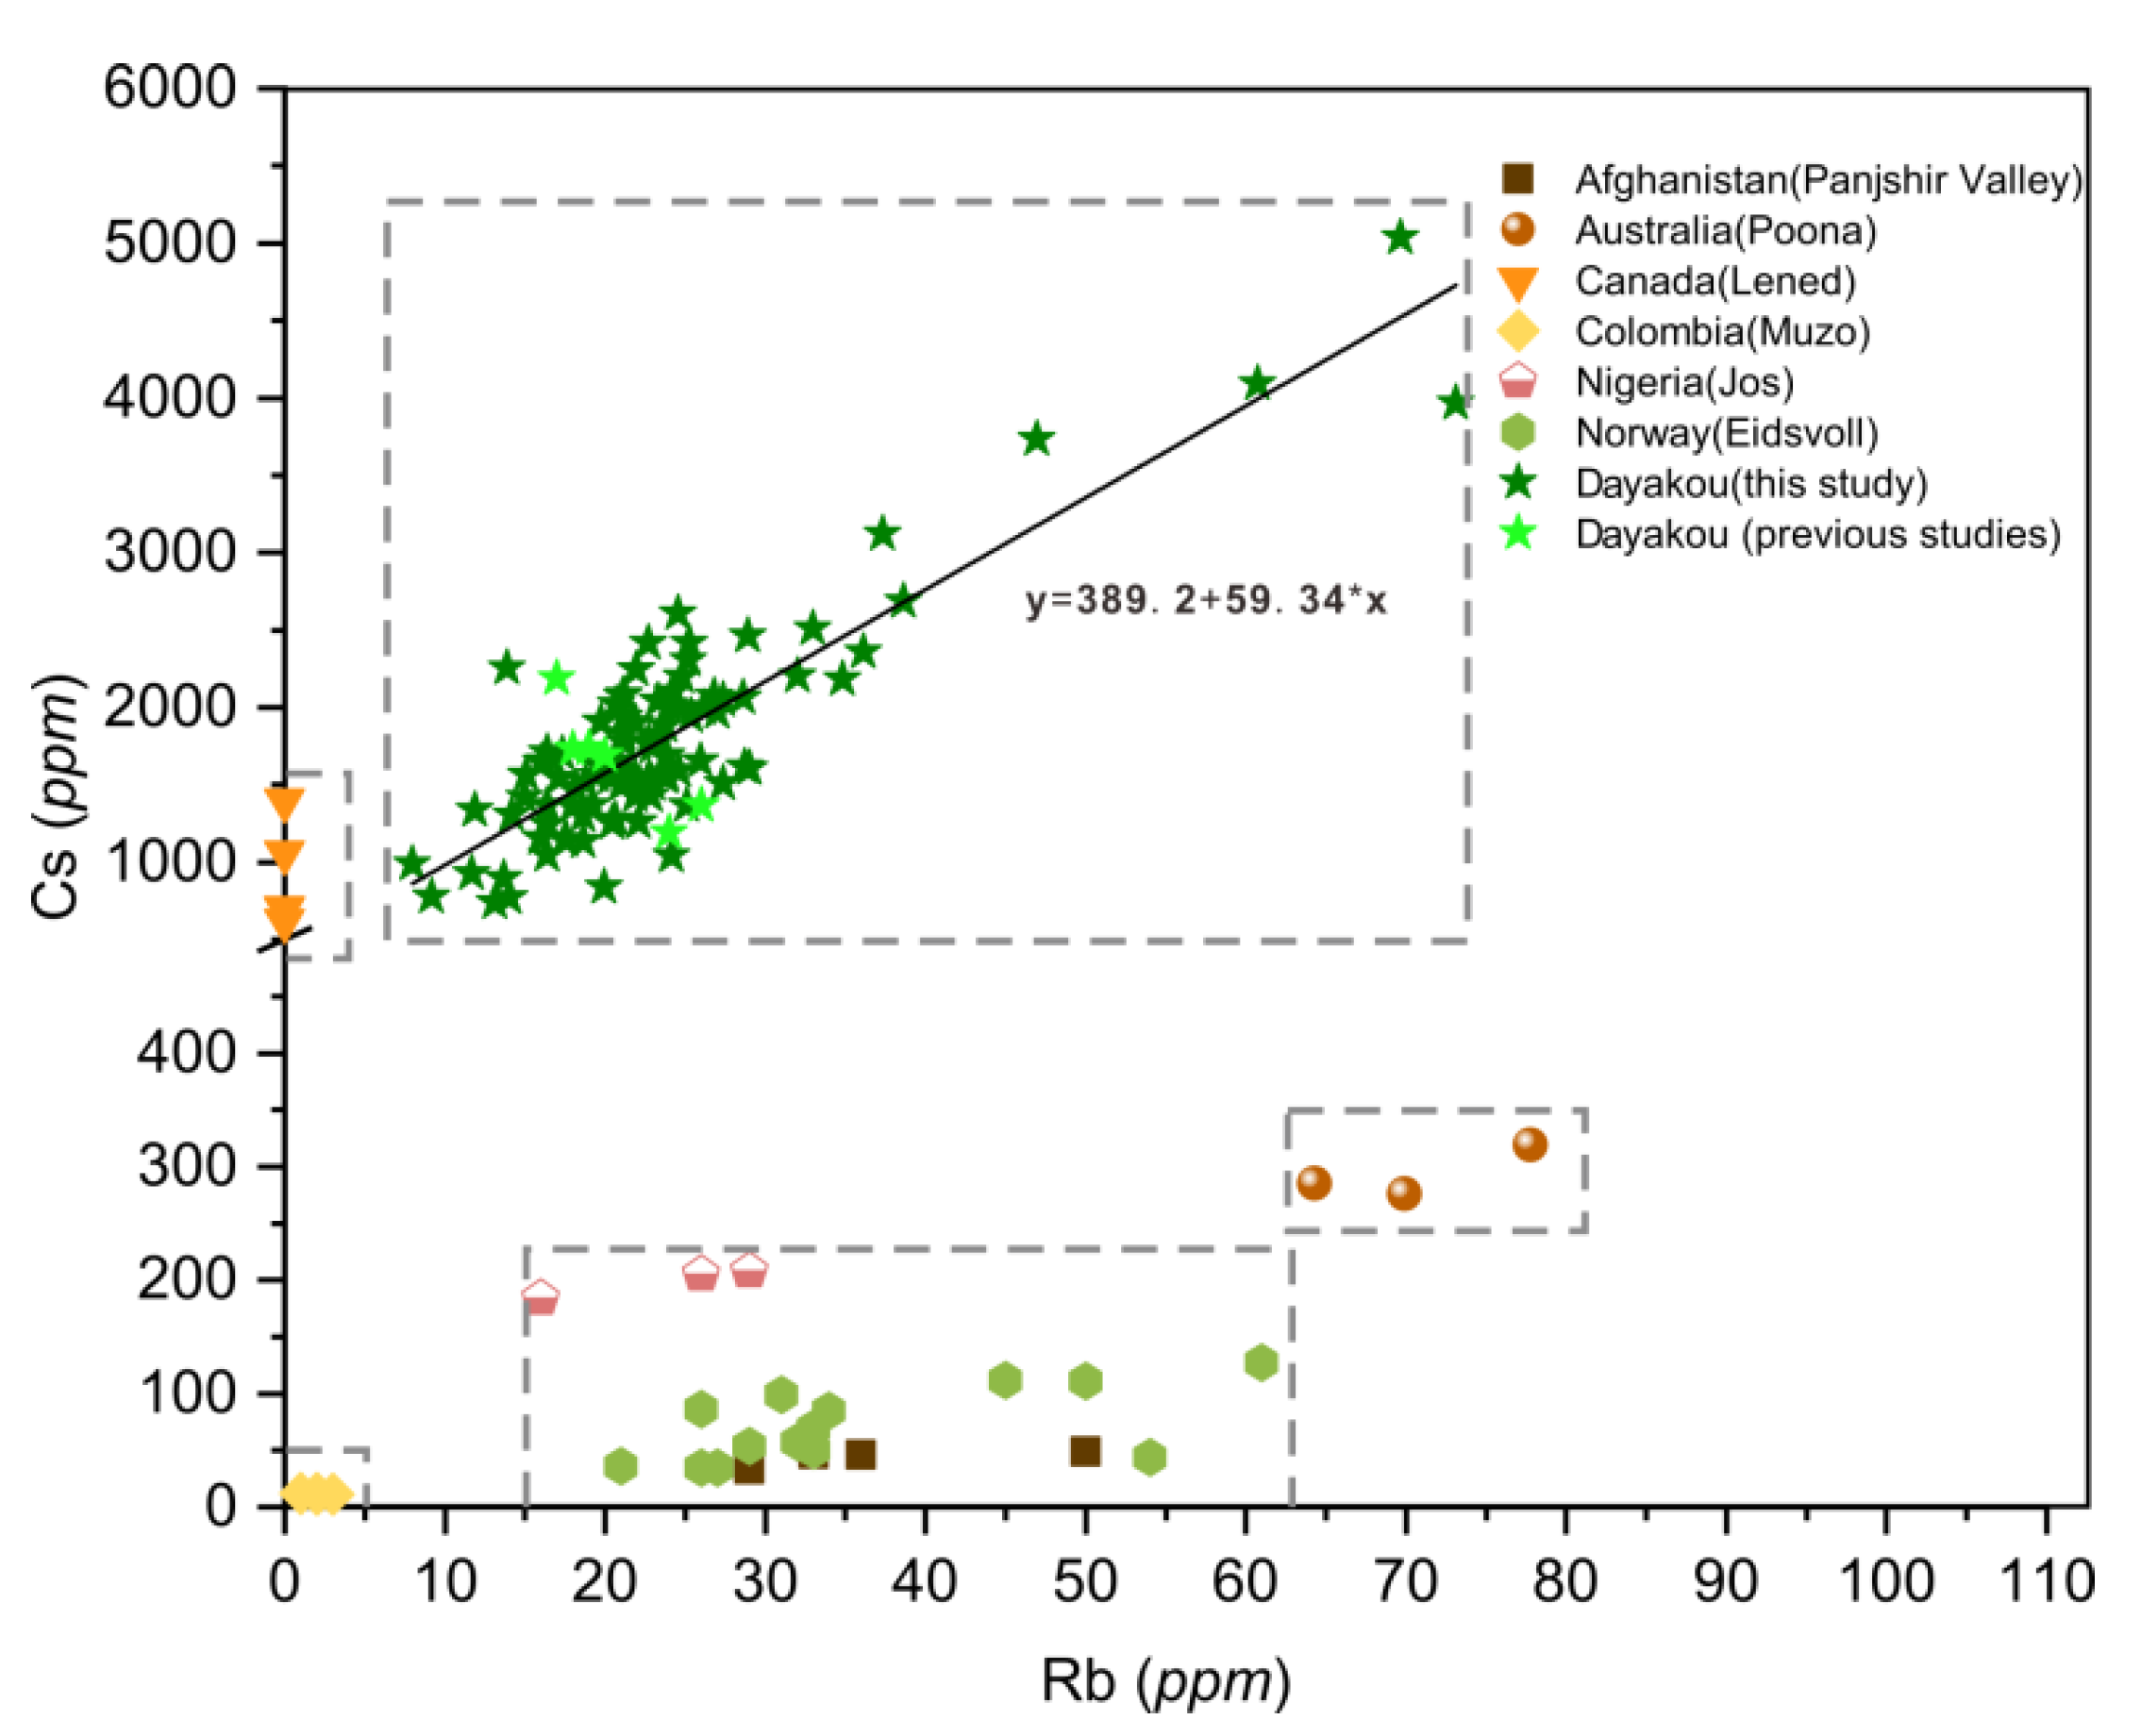
In the Rb versus Cs binary diagram (Figure 8), the Dayakou emerald shows an obvious positive linear correlation between the Rb and Cs, which can be expressed by the following equation:
Cs = 389.2 + 59.34 × Rb,
The Rb content ranges from 7.97 to 73.11 ppm. The Cs content ranges from 737 to 5034 ppm, which is considerably higher than that in other V-dominant deposits. Cs content of Lened emeralds ranges from 621 to 1397 ppm, whereas Rb content is extremely low and generally below the detection limit. Among the rest of V-dominant deposits where Cs content is less than 500 ppm, Muzo emeralds show the lowest Rb and Cs contents (Rb < 5 ppm, Cs < 50 ppm), while Poona emeralds show the relatively highest contents (Rb > 60 ppm, Cs > 250 ppm). Clusters of Eidsvoll emeralds (20 < Rb < 65 ppm, 30 < Cs < 150 ppm) completely overlap with those of Panjshir emeralds.
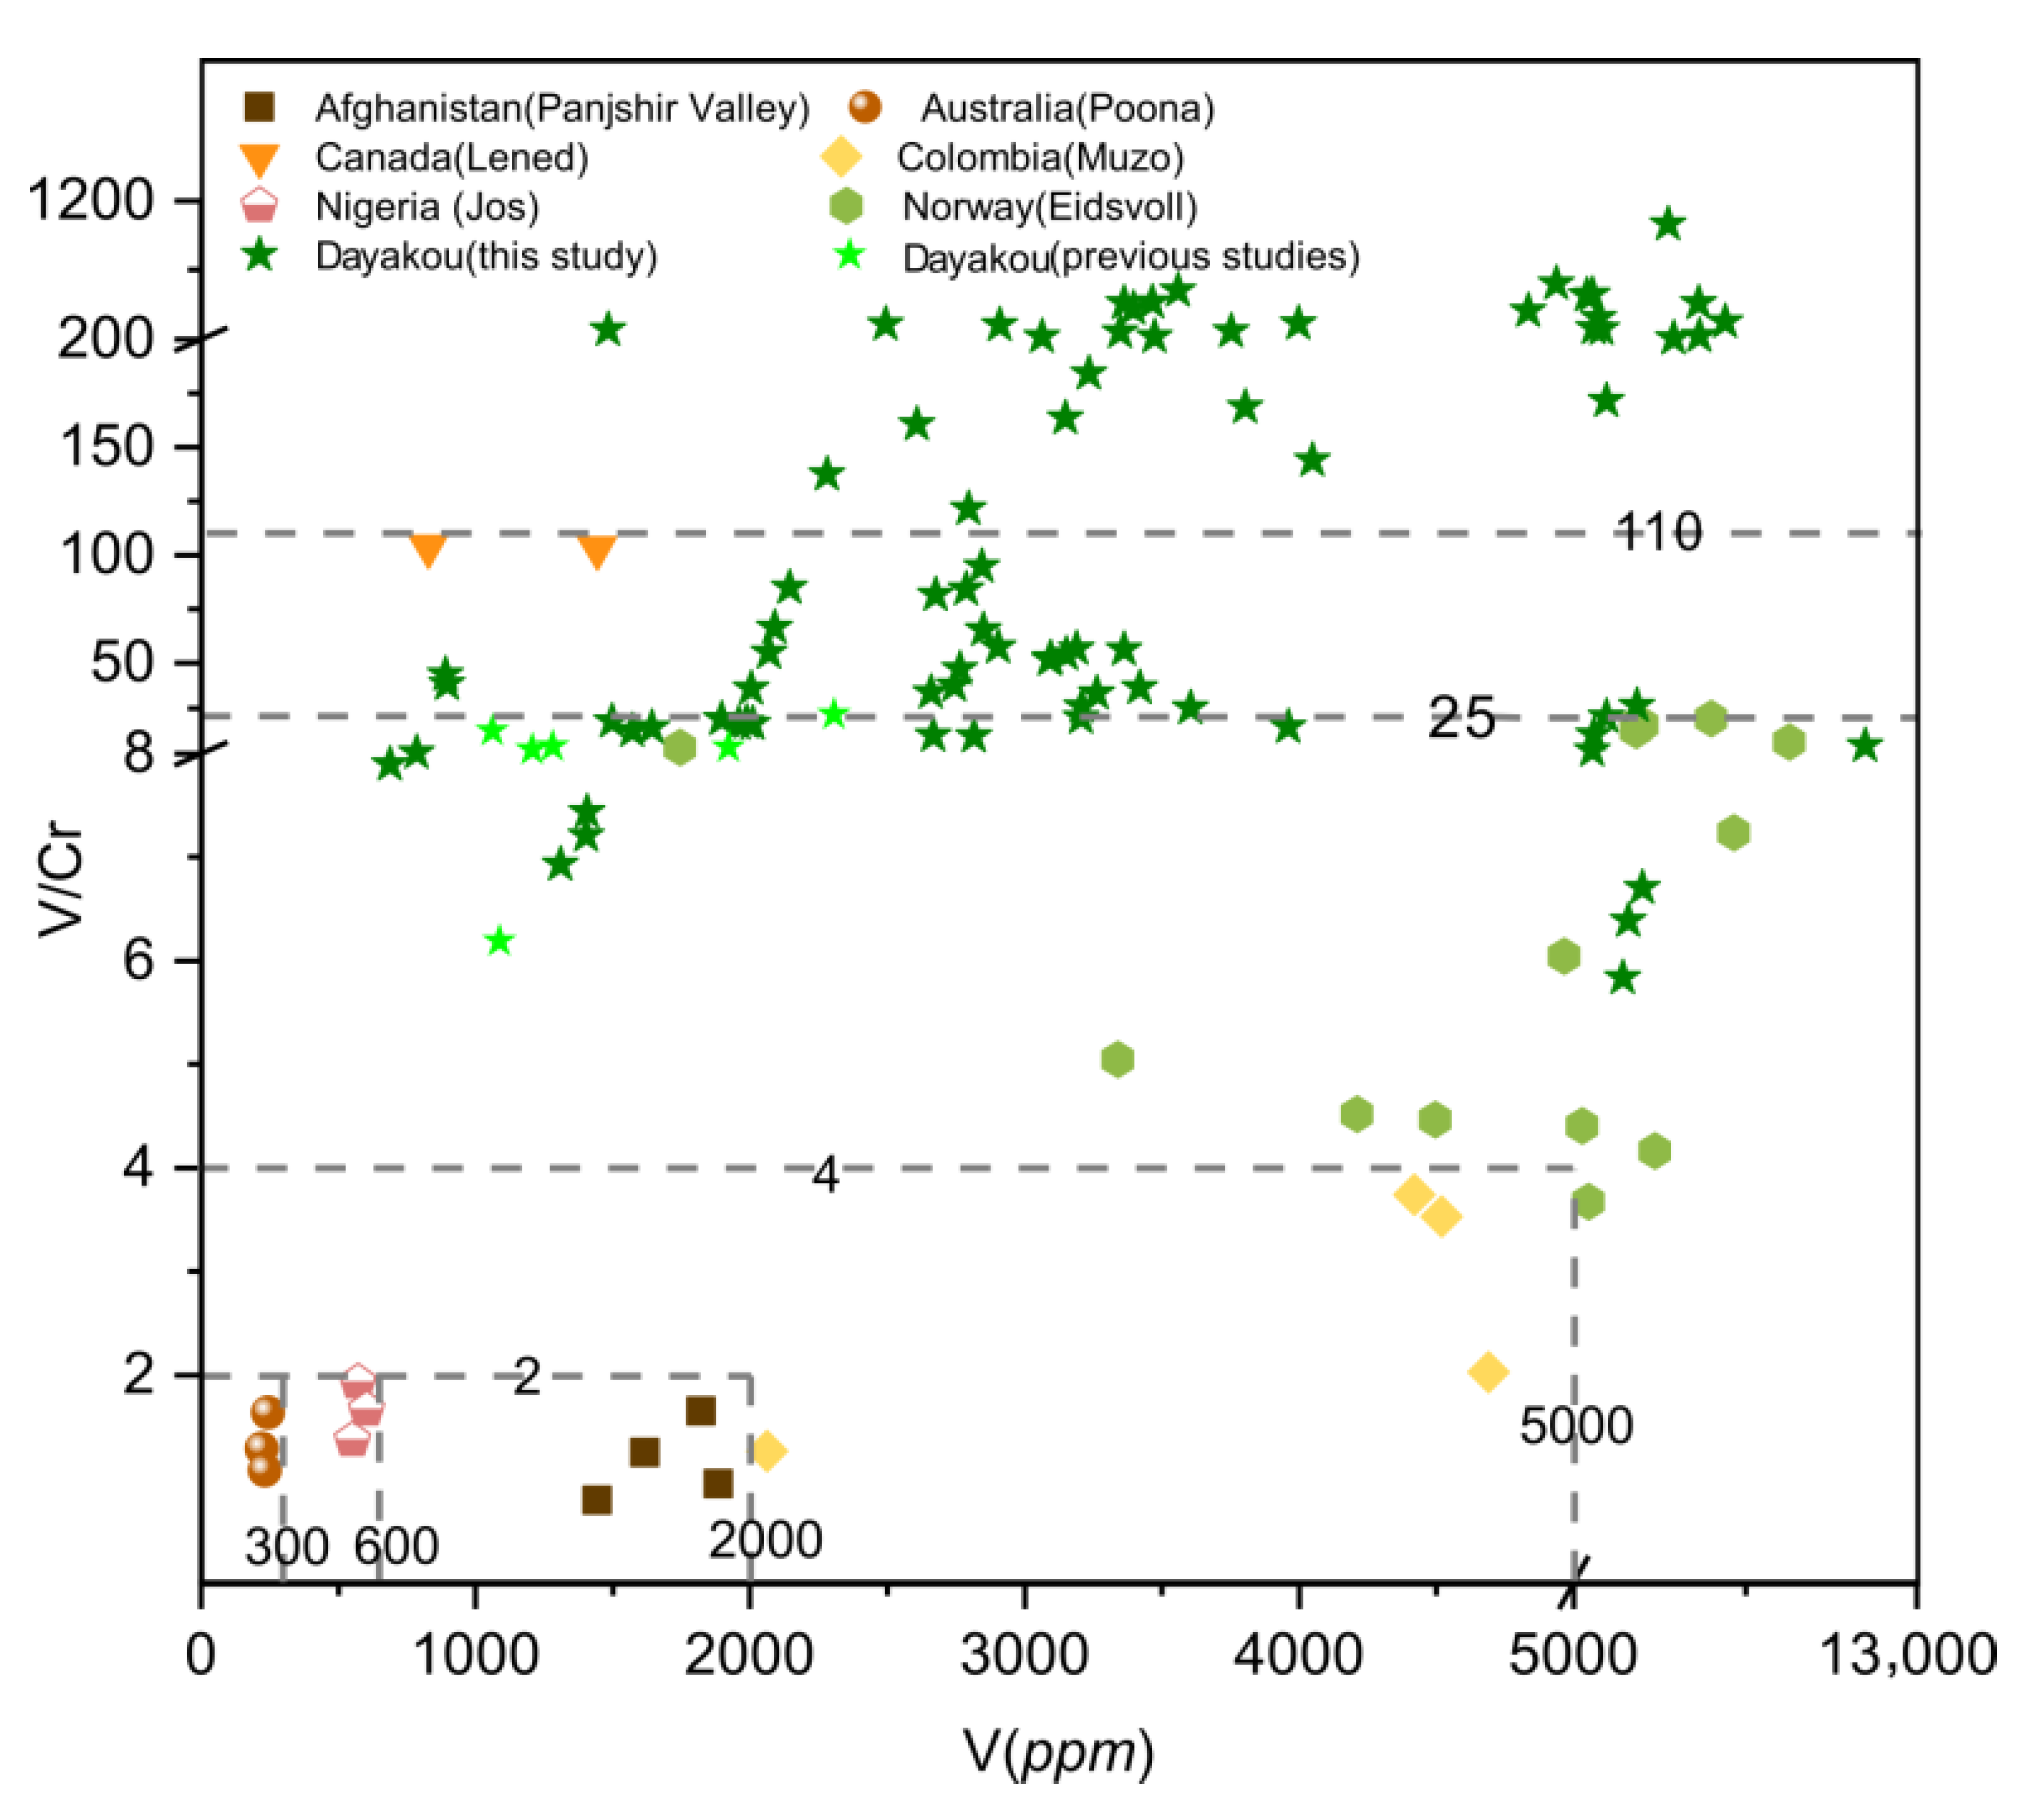
The V/Cr ratio is a common indicator of emerald. A plot of V/Cr ratio versus V (Figure 9) content can easily separate Muzo, Poona, Jos, and Panjshir Valley emeralds. These four deposits are plotted at the area with a V/Cr ratio of less than 4 and a V content of less than 5000 ppm. Emeralds from Muzo are clearly distinguished based on the higher content of V and V/Cr ratios (V ~5000 ppm, V/Cr > 2), and those from Poona, Jos, and Panjshir Valley can be separated by V content. The V/Cr ratios of the Eidsvoll emeralds are lower than 25, and those of Lened emeralds are approximately 100. Only some samples from Dayakou show a V/Cr ratio higher than 110.
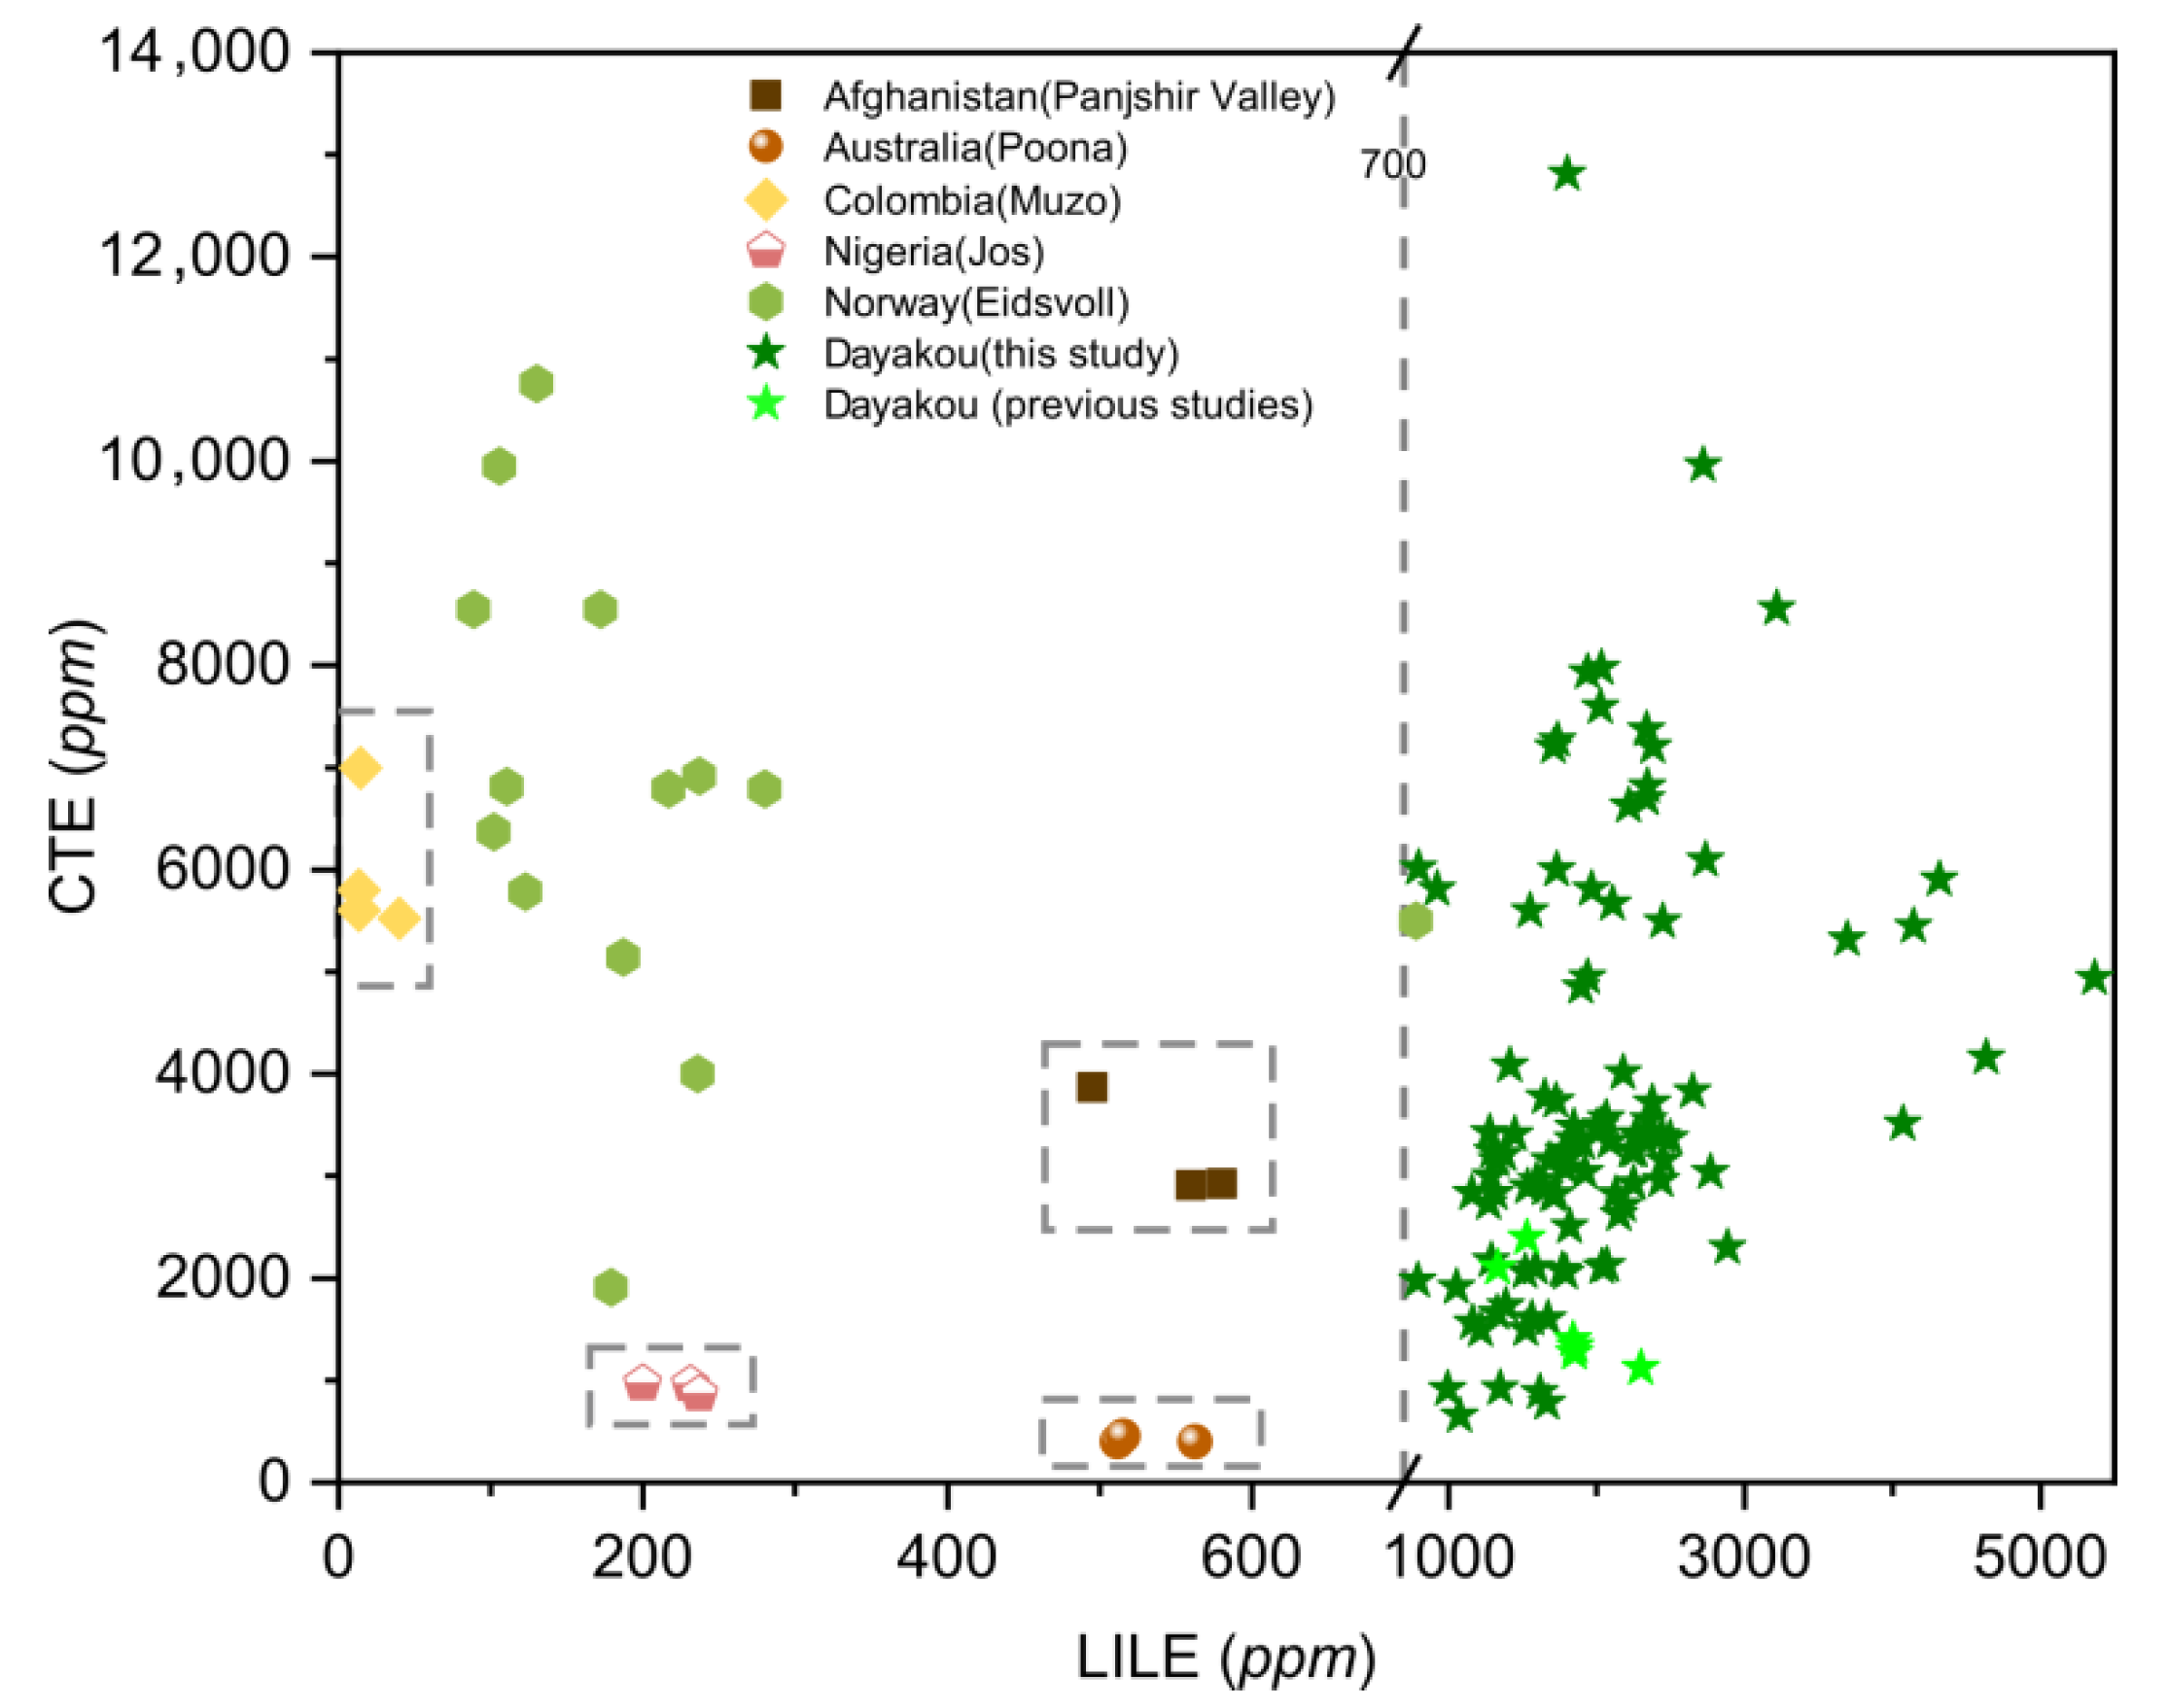
Large ion lithophile (LILE: Rb, Ba, K, Sr, Cs) elements are strongly incompatible elements. A plot of LILE versus CTE (Figure 10) displays the highest LILE content of the Dayakou emerald (>700 ppm) and the lowest content of the Muzo emerald (<50 ppm). The LILE contents of emeralds from both Panjshir Valley and Poona range from 450 to 600 ppm, but the CTE contents allow separating Panjshir Valley emeralds (2500 to 5000 ppm) from Poona emeralds (<1000 ppm). Eidsvoll emeralds display a wide range of CTE content.
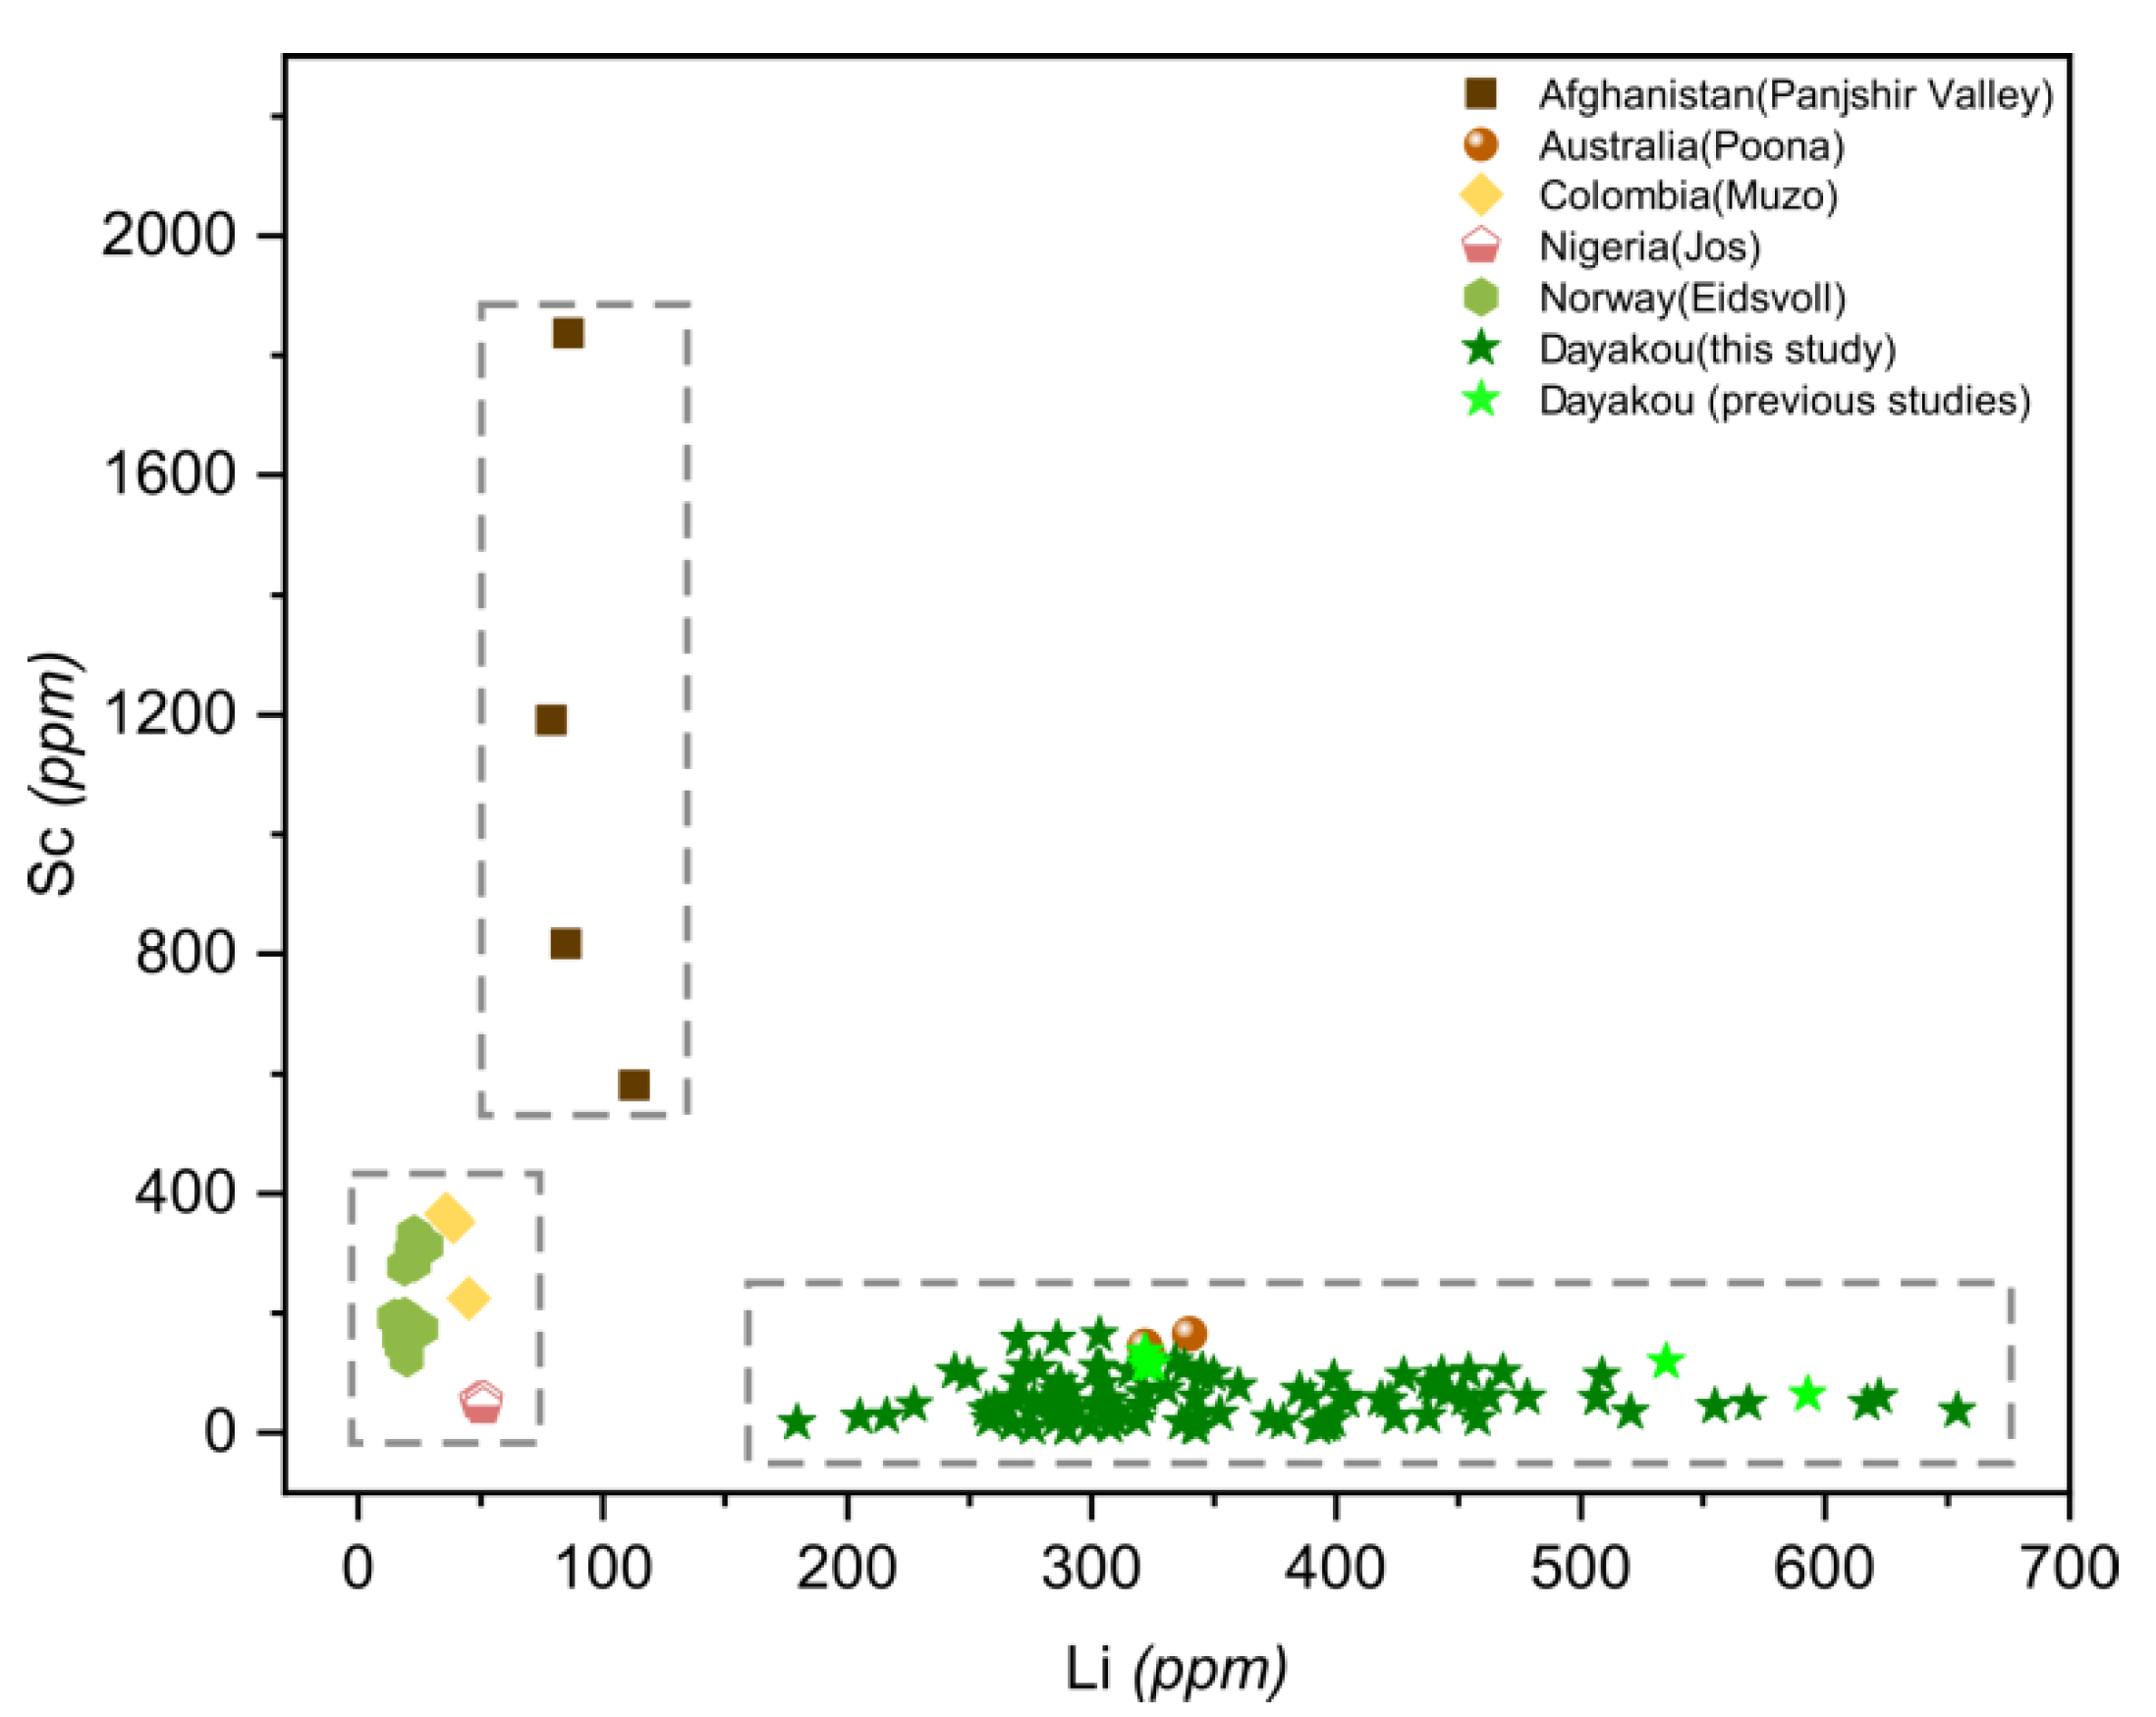
A plot of Li versus Sc (Figure 11) is useful in distinguishing Panjshir Valley emerald from others based on the distinctive high content of Sc (>800 ppm). Dayakou and Poona emeralds are characterized by the enrichment of Li (>150 ppm) and a minor amount of Sc (<200 ppm). Muzo, Jos, and Eidsvoll emeralds are plotted at the same area where the contents of Sc and Li are both low (Li < 50 ppm, Sc < 500 ppm).
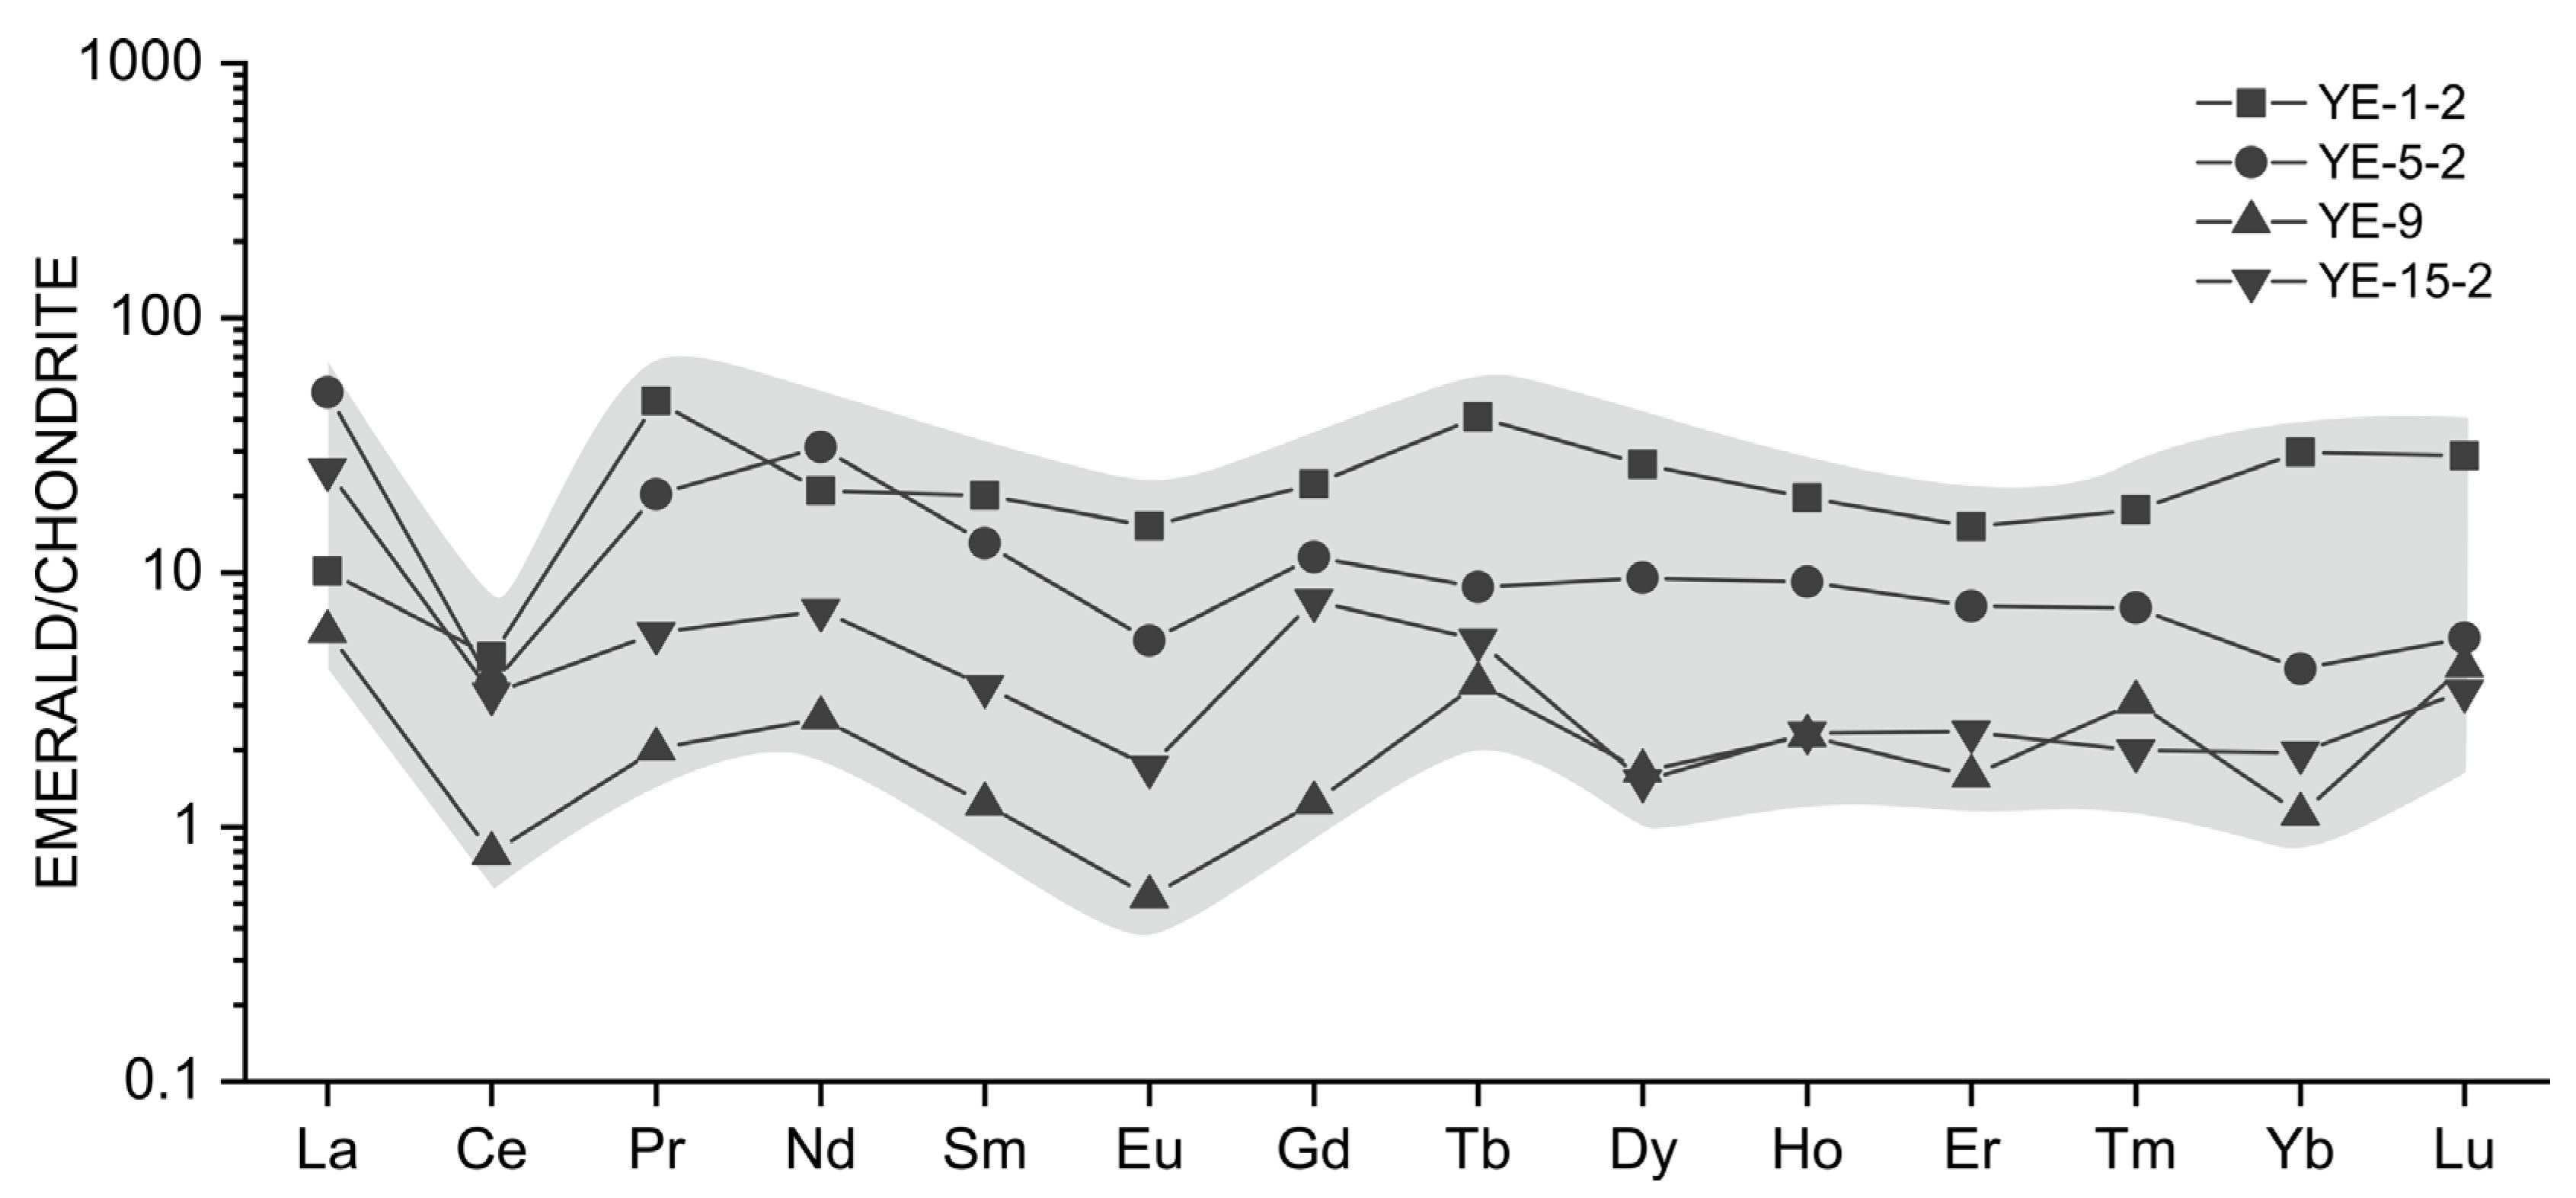
Representative rare earth element (REE) compositions of selected Dyakou emerald samples analyzed by LA-ICP-MS are presented in Table 3. REE studies of emeralds are very limited, as the REE contents of emeralds are always negligible. The Dayakou emerald does not incorporate REEs in large amount, and the concentrations of Eu, Sm, and HREE are always close to or below the detection limit. The total REE (TREE) content of the Dayakou emerald has a relatively wide range (5.03 to 44.84 ppm). The ∑Ce/∑Y ratio ranges from 1.05 to 4.28, and the (La/Yb)N is generally greater than 1, which indicates the relative enrichment of the light rare earth element (LREE). Chondrite-normalized [47] REE patterns (Figure 12) of the Dayakou emerald show overall flat-trending profiles, strong negative Ce anomalies (σ Ce = 0.14 to 0.70), and moderate negative Eu anomalies (σ Eu = 0.33 to 0.72).
4.3. Major and Trace Elements of Color Zoned Sample and Tourmaline Inclusions
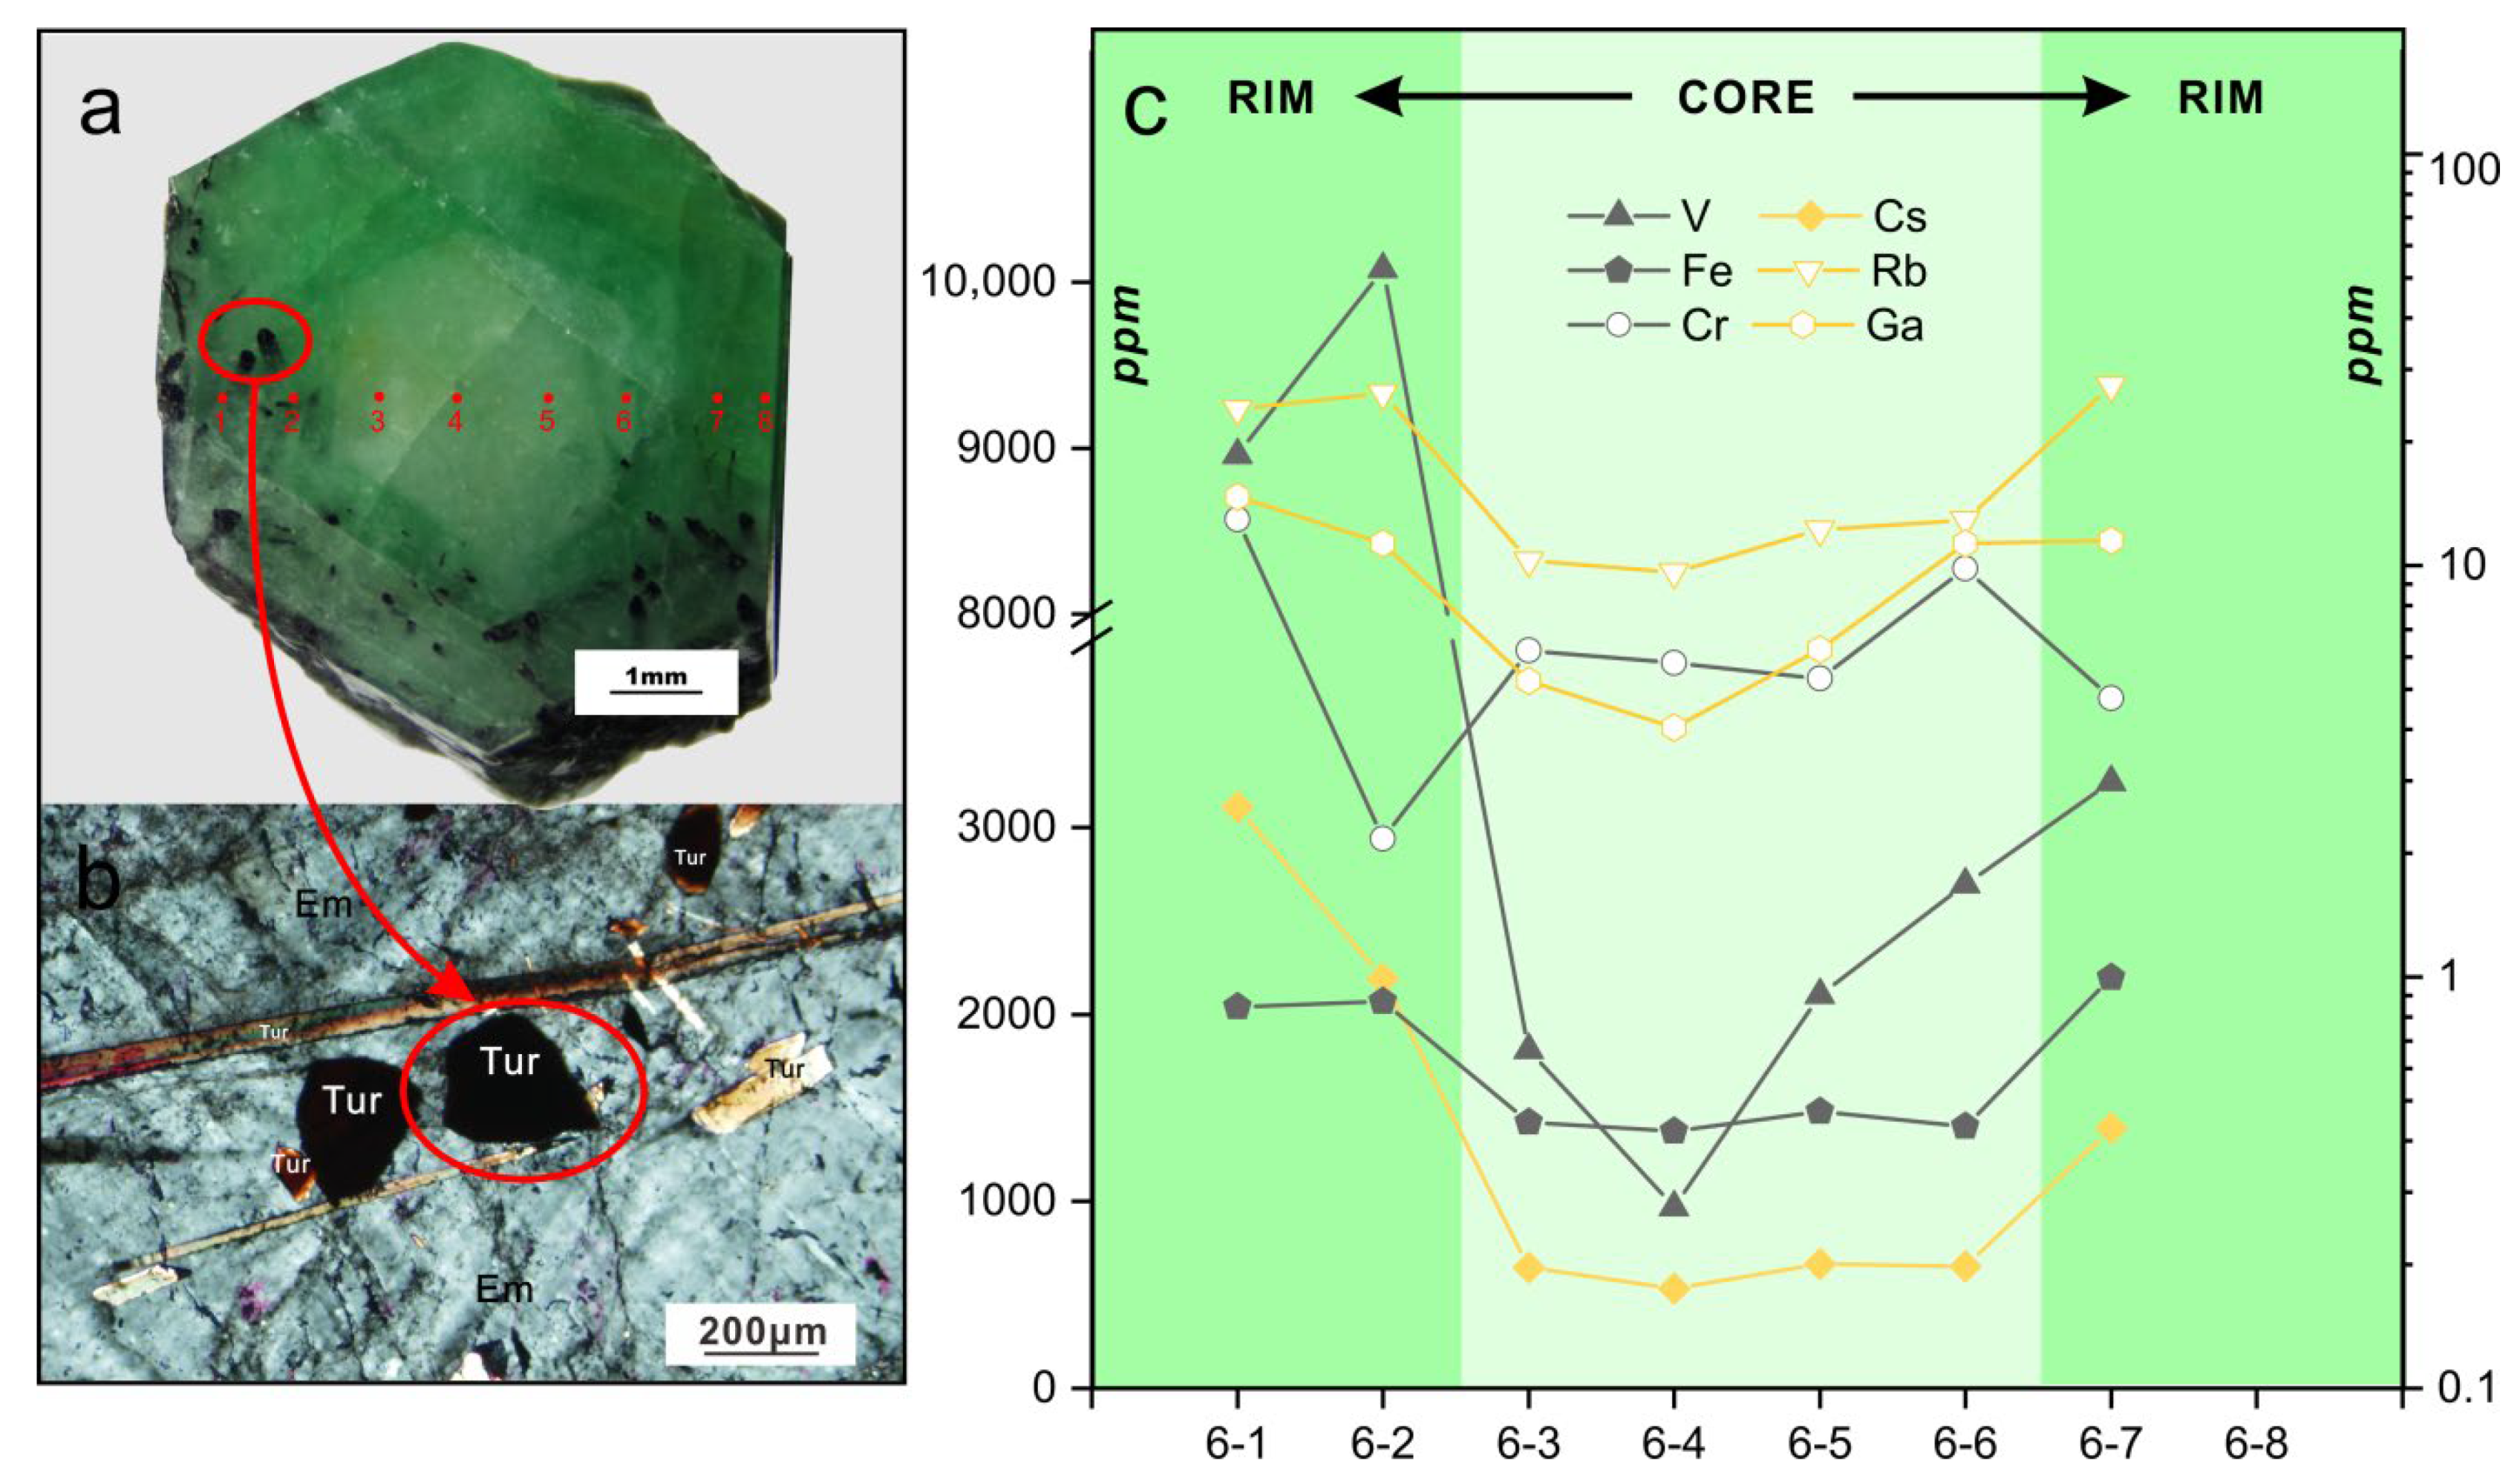
Sample YE-6 is a representative color-zoned emerald crystal, with a greenish-white core and a medium-green rim. EMP and LA-ICP-MS analyses across the emerald crystal shown in Figure 13a were conducted traversing color zones, and the analyses of eight spots are given in Table 1 and Table 2. Needle-like euhedral fuscous inclusions whose cross-sections are convex triangles are only observed in the rim zone and crystal surface of this sample (Figure 13b). These inclusions proved to be tourmalines through and EMPA (Table 1). They show variable orientations but the directions of the c axis of most crystals are consistent with that of the emerald, suggesting that tourmaline mineralization formed simultaneously or earlier compared with the crystallization of rim zone.
Tourmaline has the general chemical formula XY3Z6(T6O18)(BO3)3V3W. Based on EMP analyses of these fuscous tourmalines, T sites in the crystal structure are mainly occupied by Si, octahedral Z sites are dominated by Al, followed by V, Cr, Mg, and the Y sites mainly host Fe (Mg), followed by Mg (Fe), V, and Ti. The X sites are mainly occupied by Na, but also contain Ca, K, and vacancies. The W sites are dominated by O. According to the ions at X, Y and W sites, the fuscous tourmaline is considered to be V-rich intermediate oxy-schorl-dravite [48,49,50].
Compositional variations of trace elements in sample YE-6 are shown in Figure 13c. Most of the elements show stable content in the greenish-white core zone, excluding V. However, from the core to rim, remarkable variations are observed. The contents of Fe (1375 to 2198 ppm), Ga (4 to 14.7 ppm), Rb (9.6 to 27.4 ppm), and Cs (535 to 3108 ppm) increase considerably. The contents of V (970 to 10,077 ppm) show a continuous increase from the center to edge and are constantly higher than the contents of Fe and Cr.
5. Discussion
5.1. Mineralization of the Dayakou Emerald
5.1.1. The Origin of Dayakou Emerald Parental Fluid
Emerald deposits are classified as tectonic magmatic-related Type I deposits and tectonic metamorphic-related Type II deposits with several sub-types based on geological environment, host-rock types, and formation conditions. The Dayakou deposit was classified as tectonic magmatic-related emerald deposit hosted in meta-sedimentary rocks (Type IB) [10]. Considering the presence of syntectonic intrusions of emerald-bearing pegmatites and quartz veins and the highest concentration of Cs ever reported for emeralds, with average content of 1754 ppm, and with average Li content of 353 ppm, a magmatic origin is preferred for the parental fluids of Dayakou emeralds [1,4,10,14,16,22,51]. In addition, the enrichment of Cs, W, Sn, and As in emeralds and the presence of scheelite, tourmaline in pegmatite veins indicate a supply of alkali and incompatible elements such as Be, Rb, Cs, W, Sn, As, F, and B from the parental fluids. Nevertheless, pegmatites in the Dayakou deposit do not show a direct relationship with a granitic source. The Laojunshan granite, outcropping approximate 5 km west of the Dayakou occurrence, shows a similar enrichment in W, Sn, and Zn with depletion in Ba, Sr, and Ti [32], and thus is considered to be the source of the Be-bearing parent fluids of pegmatites. However, the formation of Laojunshan granite dated back to 86–118 Ma [31,32,33], which indicates the granites slightly post-date the emerald formation (124 Ma) [24]. Considering the protracted Cretaceous granitoid magmatism in the region [27,29,32,33], Laojunshan granite and an Early Cretaceous granitoid intrusion genetically related to the emerald mineralization are presumably associated with the same magmatic event. The Rb content, an indicator of fractionation and evolution of pegmatite and granite, can support this hypothesis. The significant enrichment of Rb with values between 326 and 502 ppm in Laojunshan granites suggests a highly evolved late-stage fluid after considerable period of fractionation [23,32], whereas the contents of Rb in emerald-bearing pegmatite (218 ppm), emerald-bearing quartz vein (78.7 ppm) [24], and Dayakou emerald (avg. 22.8 ppm) indicate a less evolved early-stage fluid. In conclusion, the evidence mentioned above supports a hypothesis for the genesis of Dayakou emerald that the parental fluid is the Early Cretaceous less evolved granitic fluid associated with Laojunshan granite.
5.1.2. Multi-Stage Crystallization of the Dayakou Emerald
Most of the emerald-bearing pegmatite veins in the Dayakou occurrence show a local zoning with an outer zone enriched in feldspars, an intermediate zone of scheelite-emerald-bearing quartz vein, and an inner zone of emerald-tourmaline-bearing quartz vein [27]. The moderate negative Eu anomalies in REE patterns of the Dayakou emerald are likely the result of the incorporation of Eu into feldspars in the outer zone. And the decreased negative Eu anomalies, which are not as strong as those in Laojunshan granites, might be attributed to the enrichment of ligands such as chlorine and especially fluorine in the fluids which can elevate the partition coefficient of Eu [23].
In the inner zone of pegmatites, tourmalines coexist with emeralds or occur as inclusions which sometimes show the same orientation with the hosted emerald. It indicates that the tourmaline mineralization formed simultaneously or earlier compared with emerald mineralization, which is similar to the Lened emerald [14]. The presence of tourmaline inclusions and the zoned nature of the emerald (Figure 13) suggest that there may be at least two generations of emerald precipitation at Dayakou [18,52]. First, the greenish-white emerald core is inferred to have formed in the early-stage pegmatitic fluid with a low concentration of Rb, Cs, and Ga and the absence of tourmaline inclusions. V and Cr with low concentrations are released by the circulation and infiltration of fluids. The medium-green emerald rim is supposed to crystallize in a more evolved late-stage pegmatitic-hydrothermal fluid with the presence of tourmaline inclusions and a considerable increase of Rb, Cs, Ga, and replacement degree of Y sites. Crystallization of tourmalines and the increase of incompatible Rb indicate the late stages of pegmatite evolution when incompatible elements and volatiles (e.g., H3BO3) have become sufficiently enriched in the melts to crystallize mineral phases where these elements are essential structural components. The pegmatite melts tend to reach fluid saturation [23].
Nevertheless, an unexpected high V2O3 content (2.92–3.87 wt.%) is noticeable in the oxy-schorl-dravite inclusions, which is consistent with previous study of the Dayakou deposit [53] but different from tourmalines from other deposits. [13] reported Cr2O3 contents in coexisting tourmalines from Regal Ridge emerald deposit in Canada are between 0.01 and 0.20 wt.% with a maximum of 3.28 wt.%. [54] reported a maximum Cr2O3 content of 0.14 wt.% in coexisting tourmalines from the Habachtal emerald deposit in Austria. And [14] reported V2O3 contents in coexisting tourmalines from the Lened emerald deposit in Canada are between 0.09 wt.% and 0.89 wt.%. A possible interpretation for this extremely high V content in tourmalines from the Dayakou deposit is the affection of fluid of metamorphic origin. The oxygen isotope data (δ18O = 10.6–12.4‰) for the Dayakou emeralds were consistent with both magmatic and metamorphic origins for the source of the mineralizing fluid, and the fluctuating salinities from fluid inclusion data suggested the mixture of a brine related to pegmatites and a local metamorphic fluid within regional host rocks [24]. It supports that the late-stage pegmatitic-hydrothermal fluids mixed with the local metamorphic fluids.
5.1.3. Mineralization Model for the Dayakou Emerald
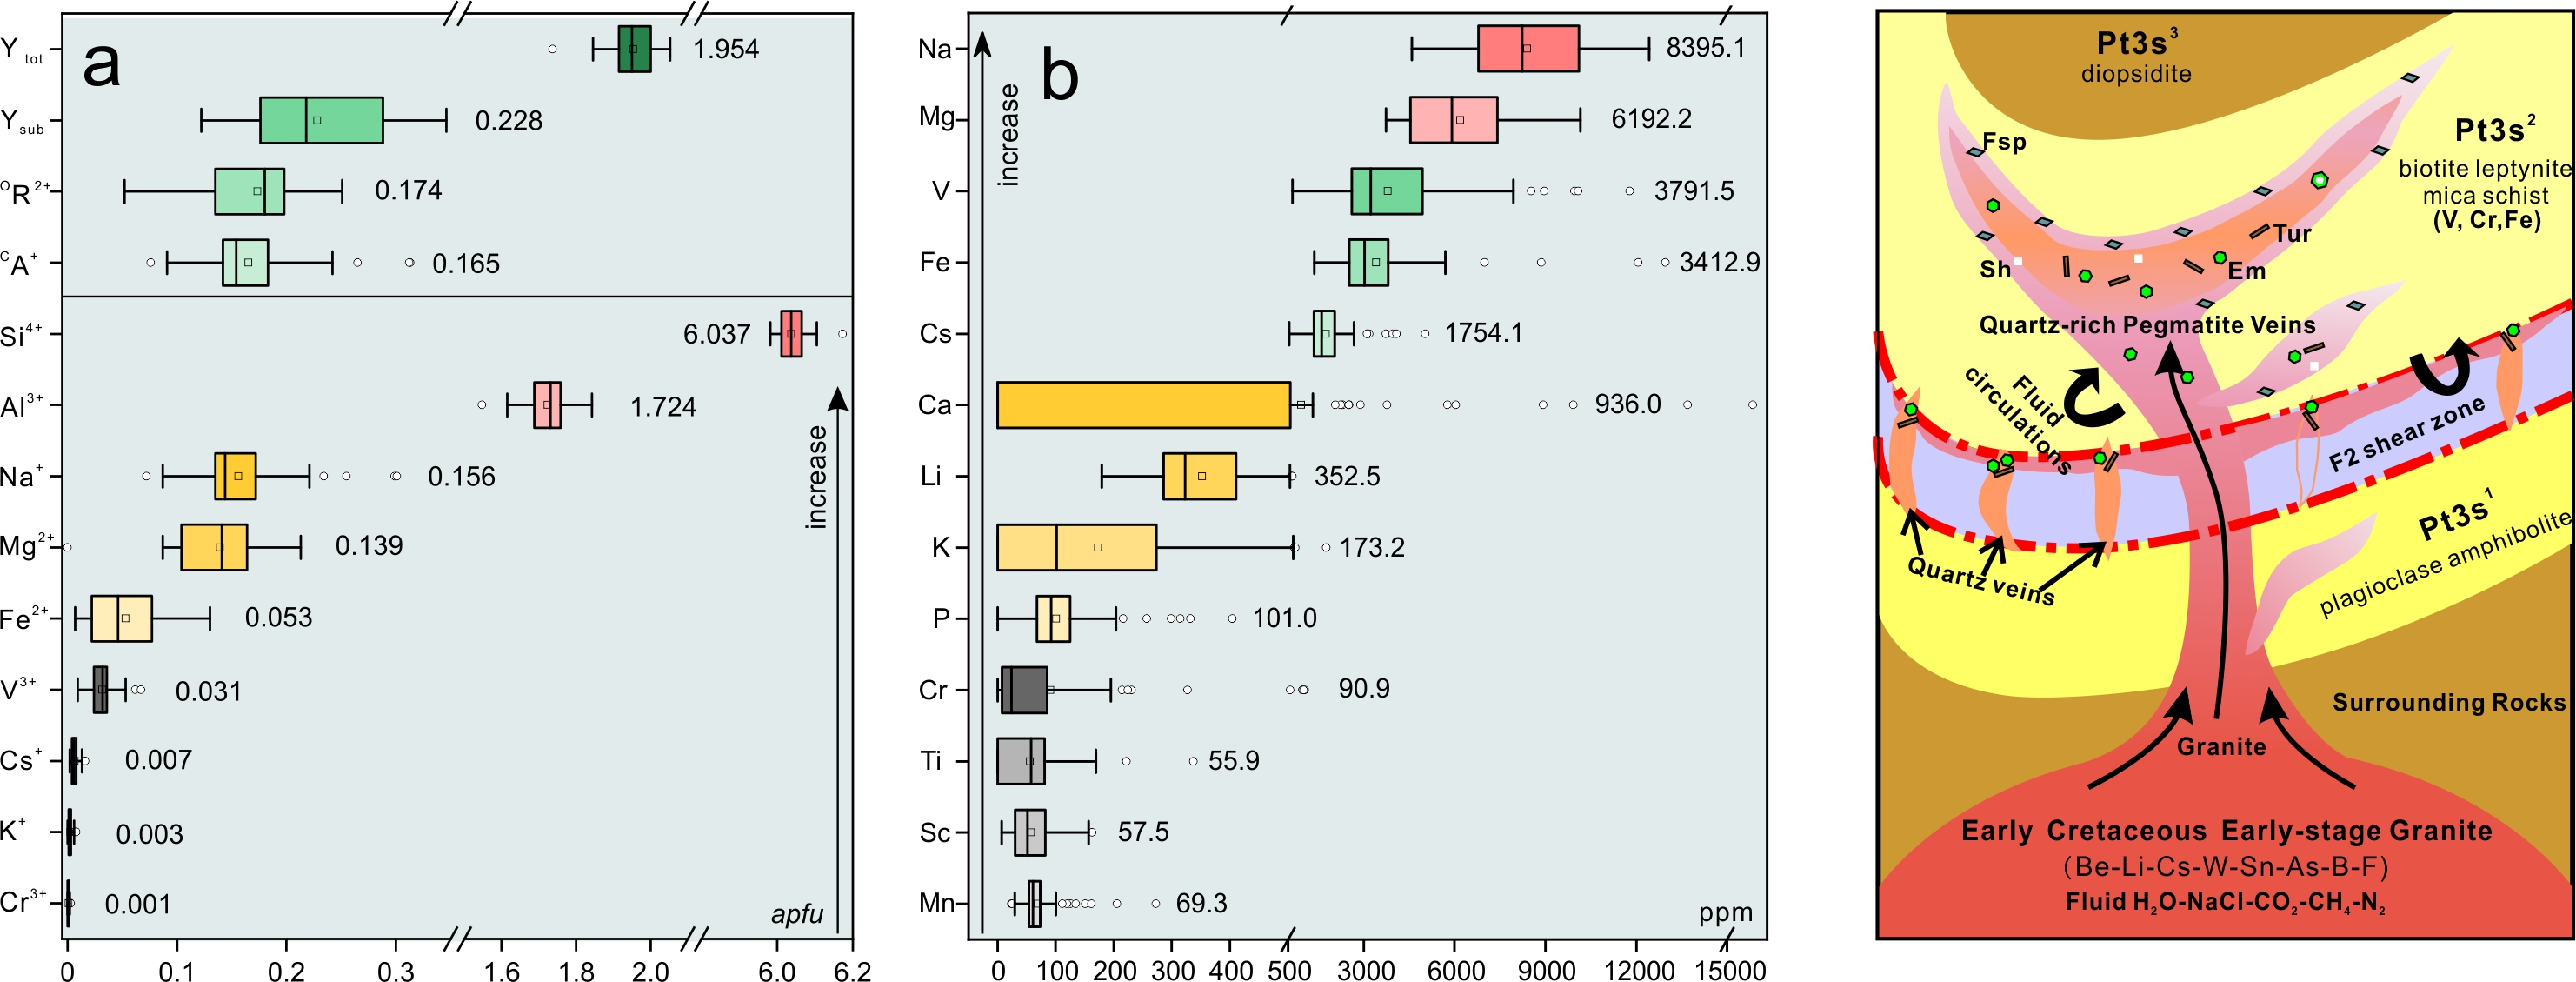
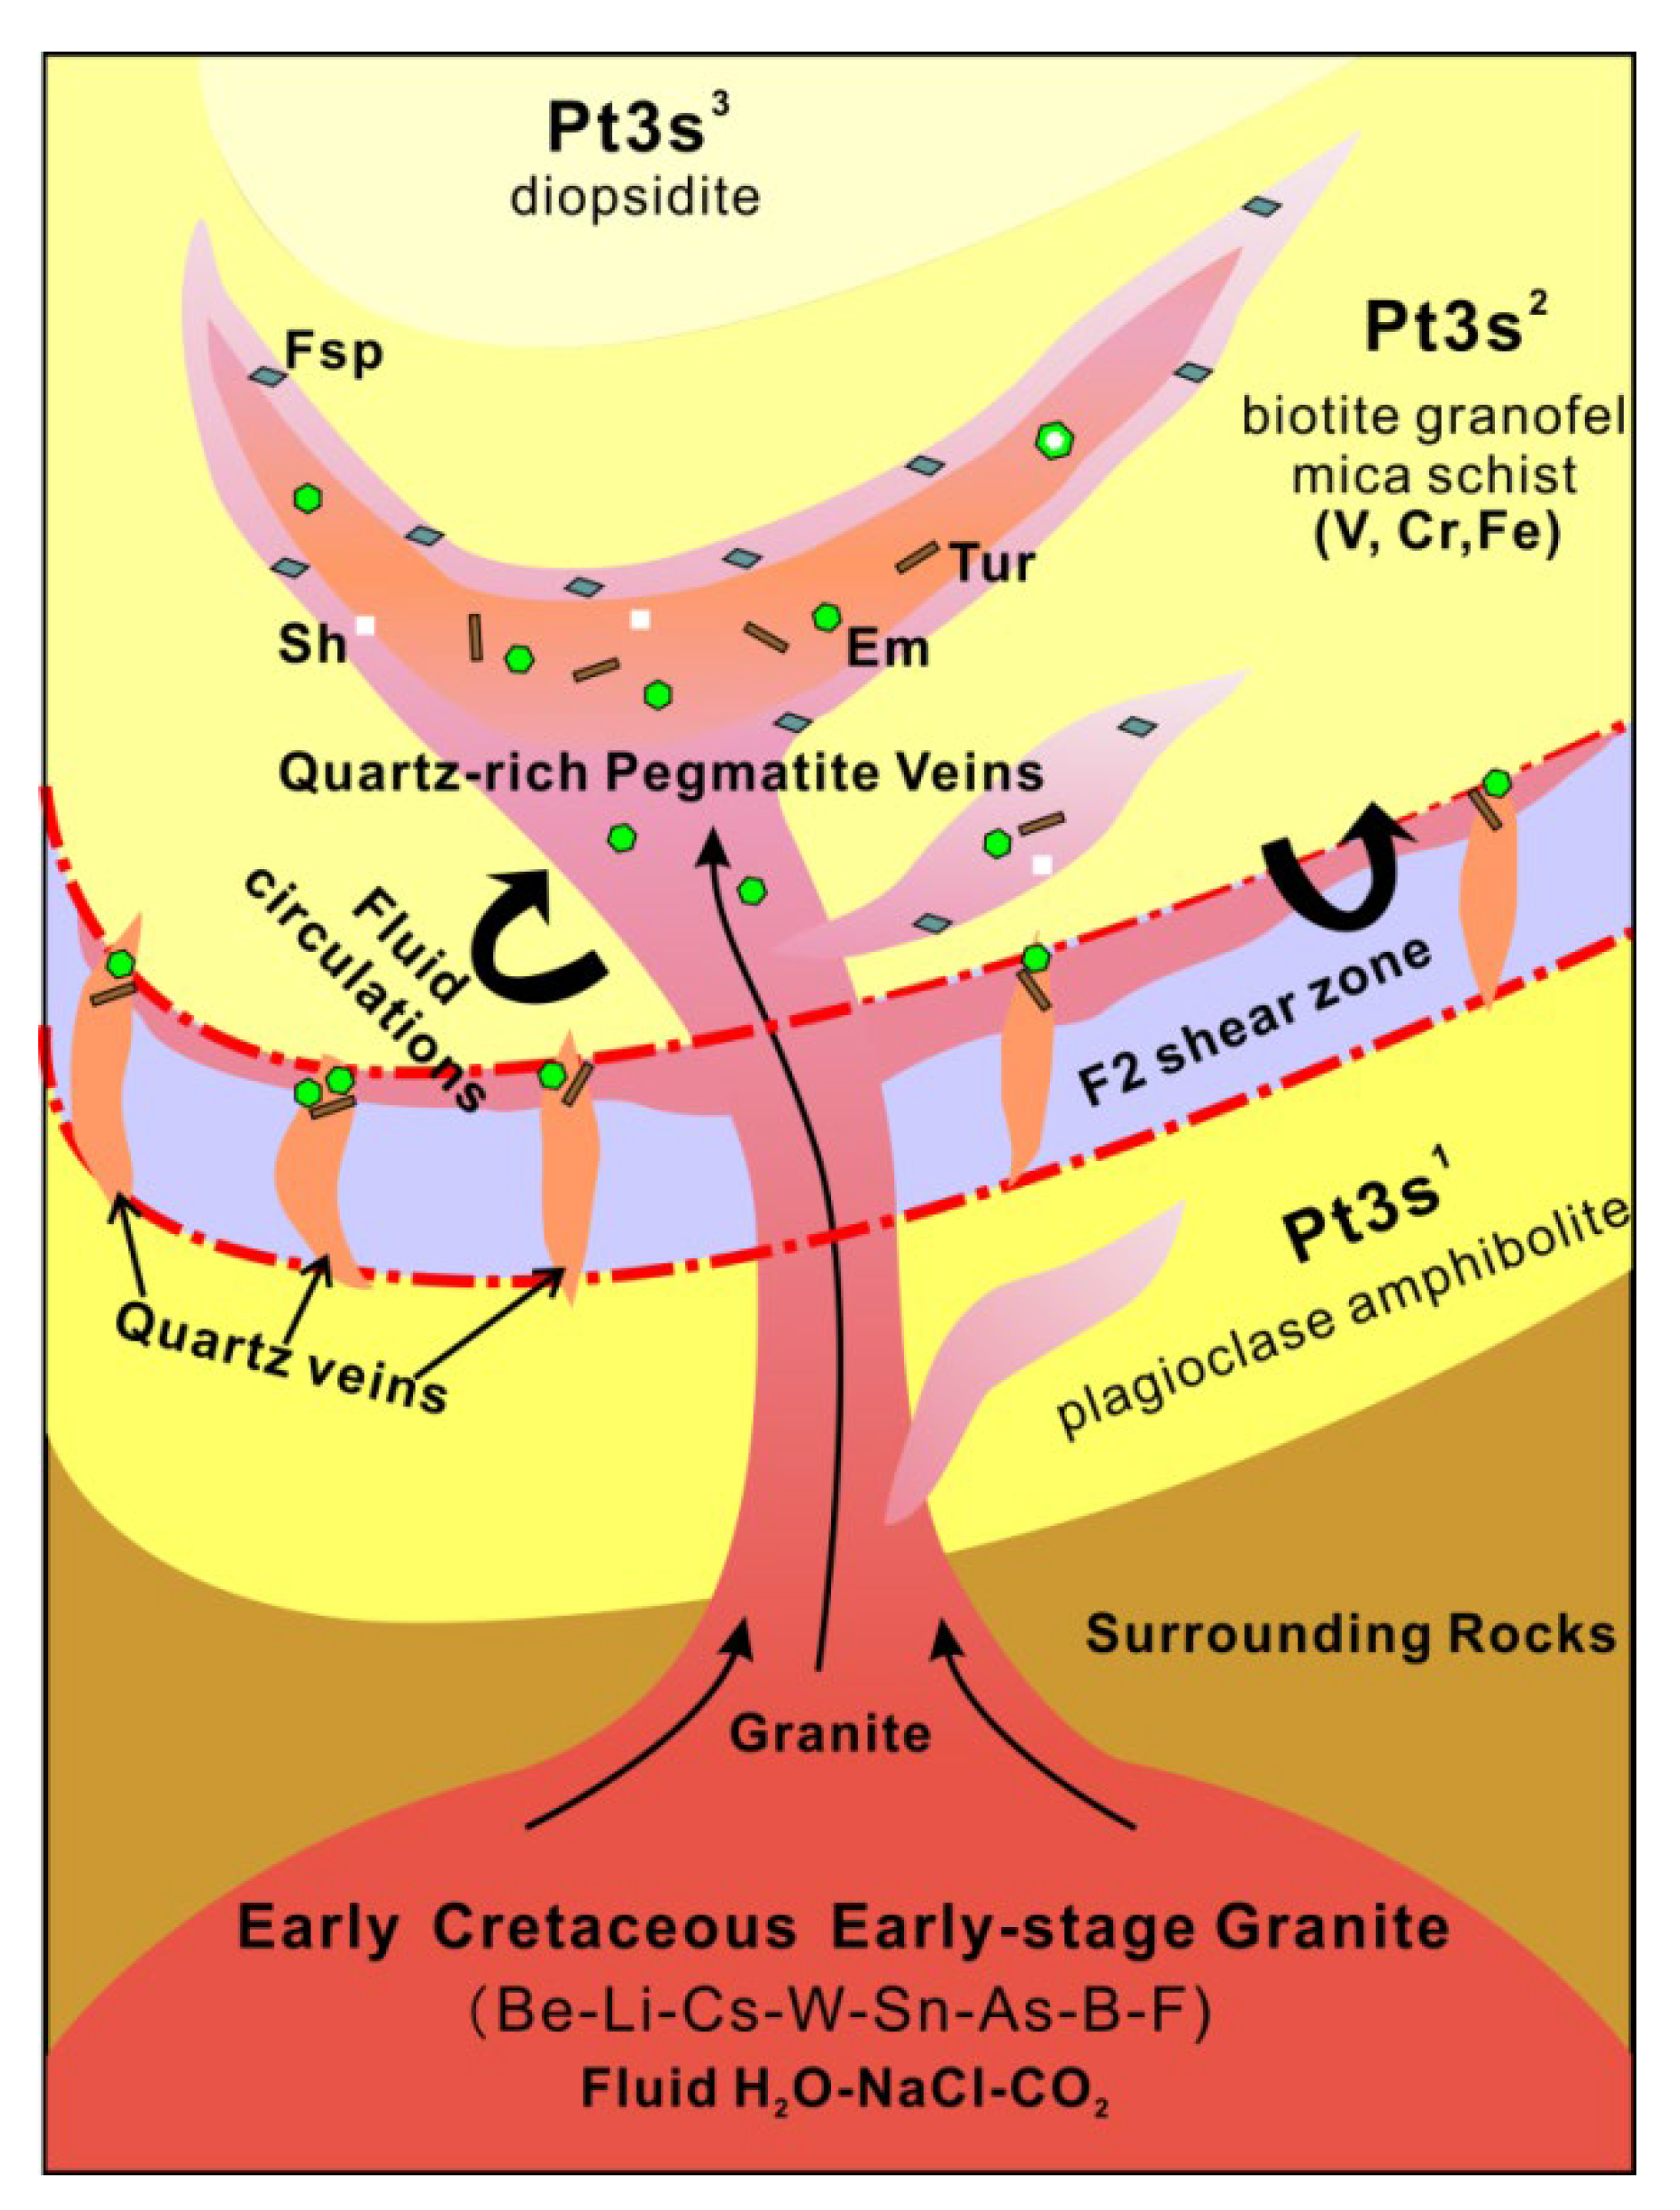
An idealized mineralization model for the Dayakou deposit is shown in Figure 14. The deposit is genetically linked to the Early Cretaceous early-stage granite intruding into Neoproterozoic Saxi metamorphic unit. Geochemical evidence suggests that the magmatic-pegmatitic fluids enriched in elements such as Be, Li, Cs, W, Sn, As, B, and F while the granofel of Saxi Unit enriched in V [24,27]. The emerald formation was controlled by the availability of V in the granofels and Be present in the emerald-bearing pegmatite and quartz veins. Incompatible beryllium was transported as Cl and F complex in magmatic-hydrothermal environments [14,15,55]. The circulation and infiltration of magmatic-pegmatitic fluids were channeled by shear zones and structural fractures and released V from V-rich granofels by the metasomatism. The first generation of emerald precipitation occurred in the early-stage pegmatite and quartz veins. The second generation of emerald was precipitated in the more evolved pegmatitic-hydrothermal fluids that might be mixed by the local metamorphic fluids.
5.2. Geographic Origin Determination
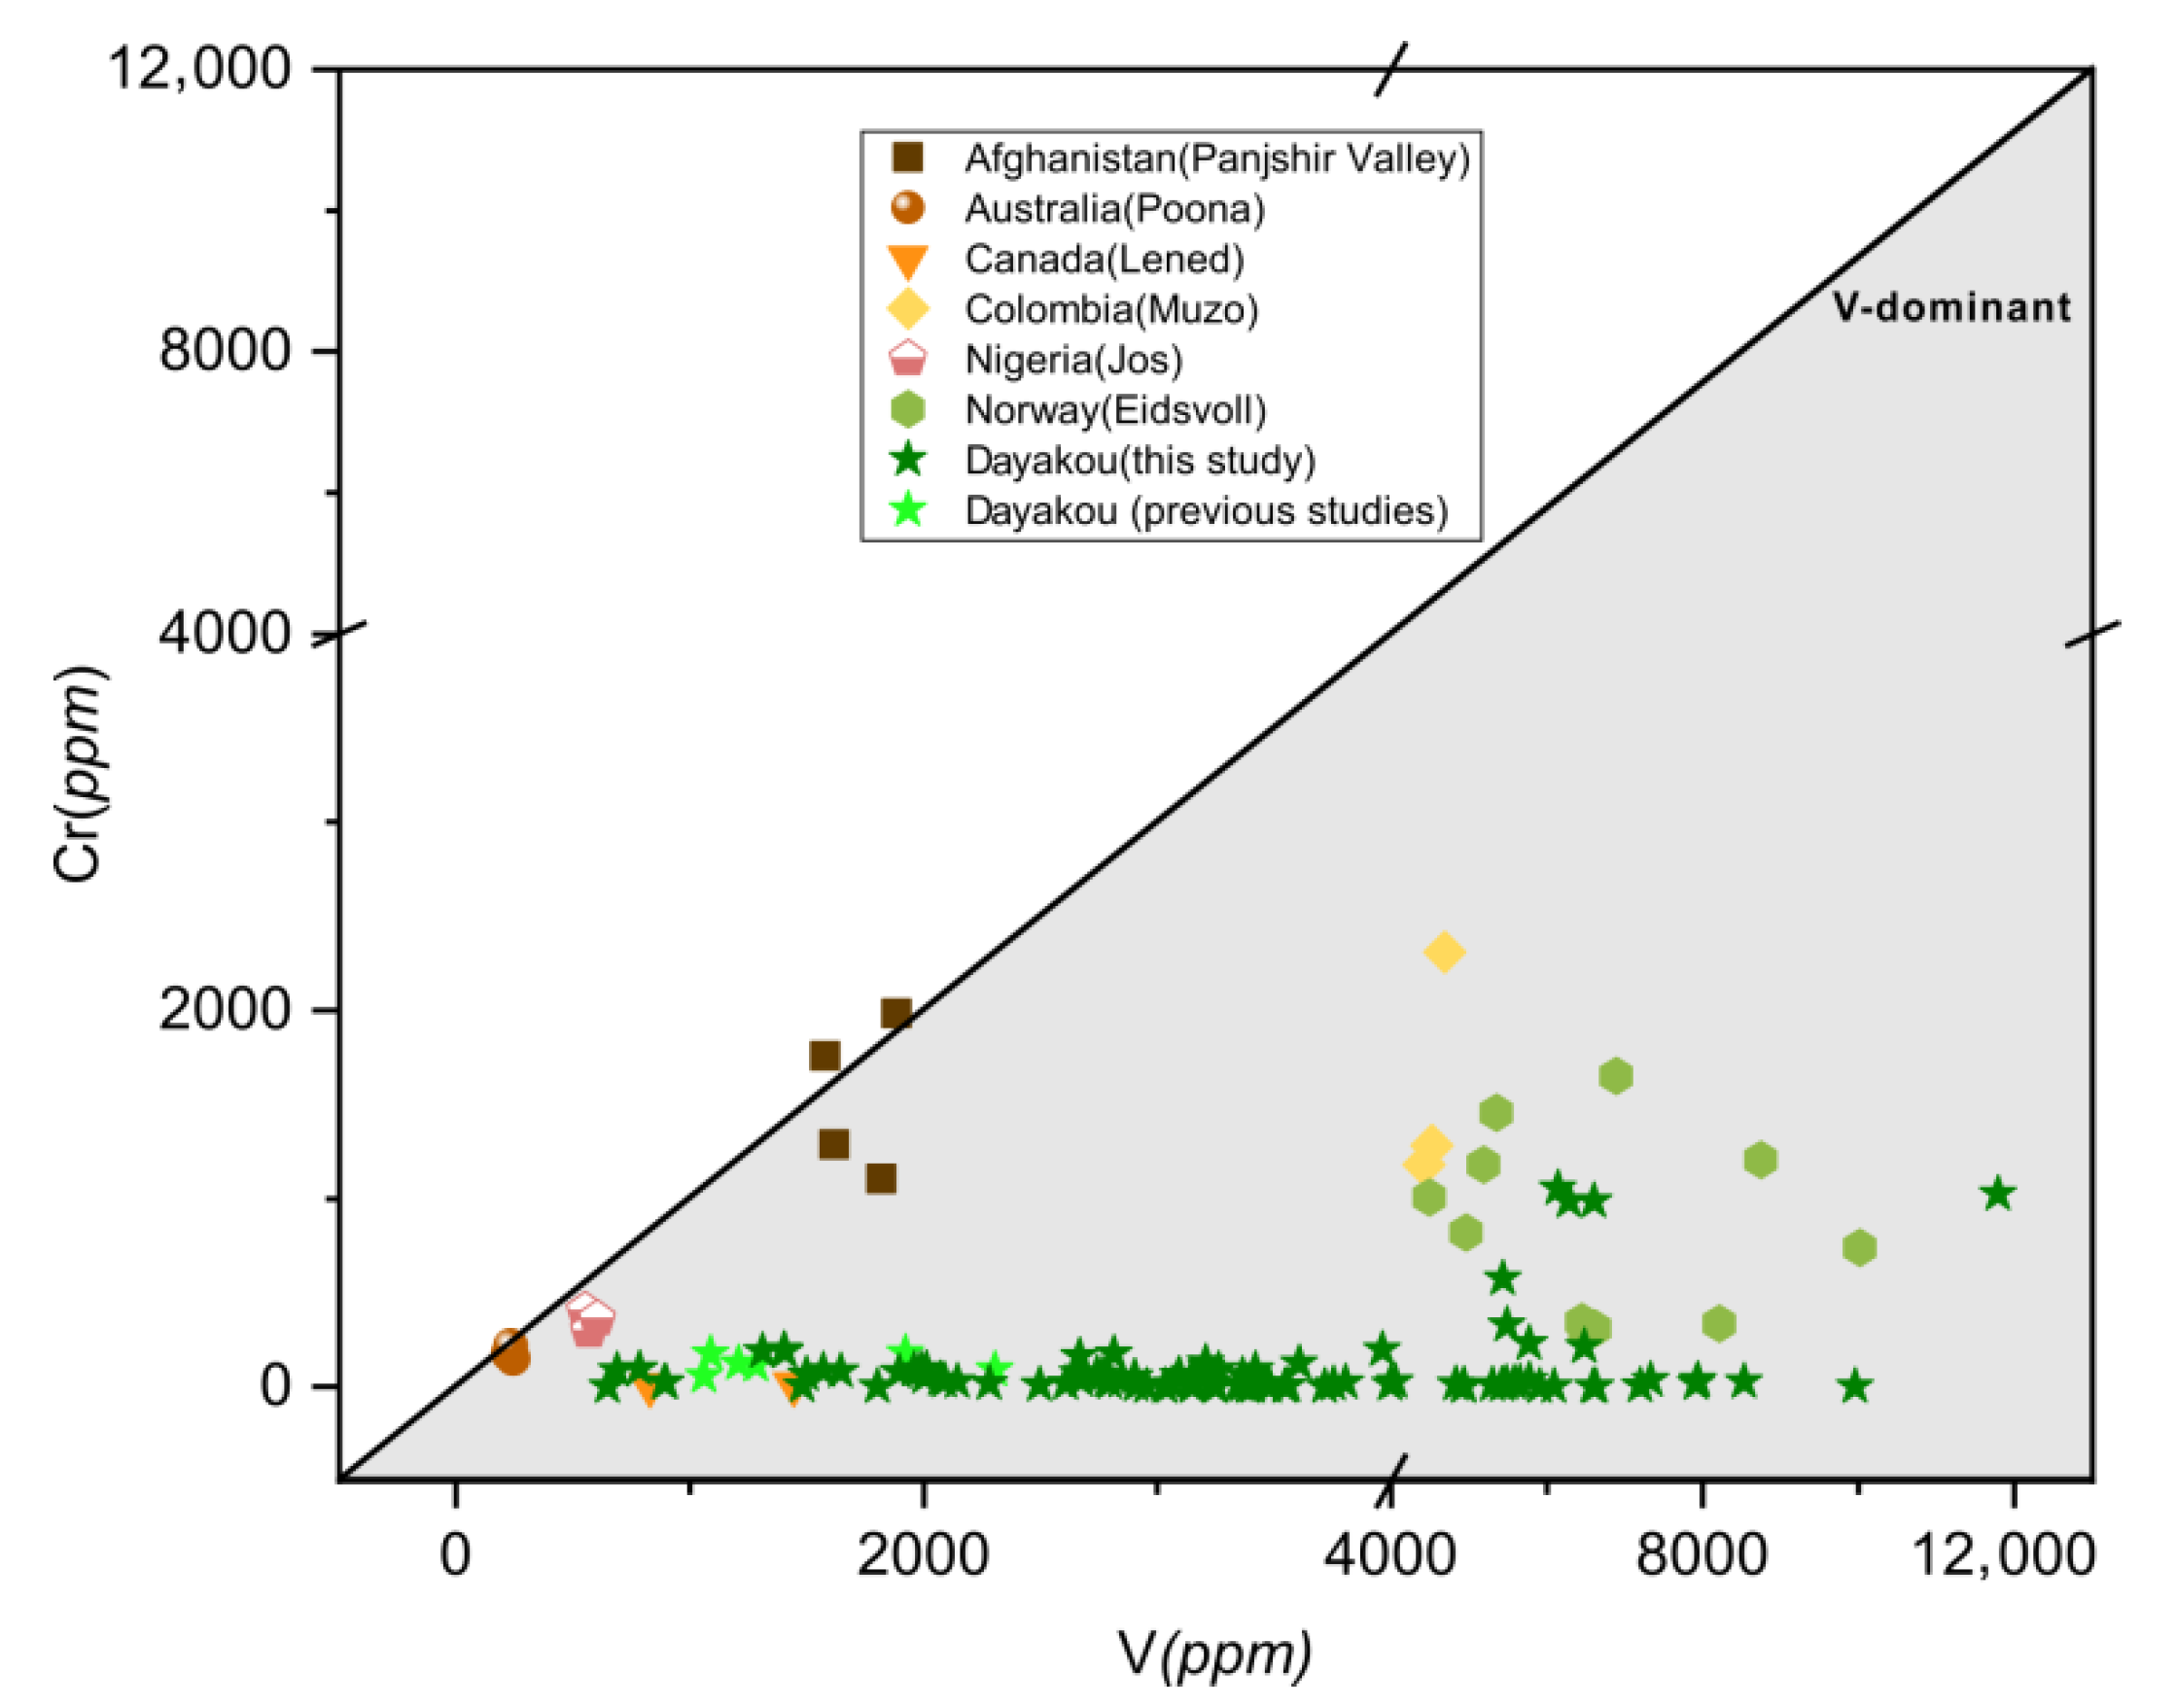
It is obvious that almost all points of those V-dominant deposits fall into the V-dominant area in Figure 15, but partial points of Poona, Muzo, Panjshir Valley and Jos do not fall into the gray area in Figure 3. This difference can be explained by the low contents and the high precision of data expressed in ppm from LA-ICP-MS or SIMS analysis. Based on Figure 3 and Figure 15, the Dayakou (China), Lened (Canada), Muzo (Colombia), Mohmand (Pakistan), and Eidsvoll (Norway) deposits are defined as completely V-dominant emerald deposits, as the majority of emeralds from those deposits shows the predominance of V among chromophores. The Jos (Nigeria), Panjshir Valley (Afghanistan), and Poona (Australia) deposits are defined as partially V-dominant emerald deposits, as only partial samples show V-dominance. Various binary diagrams generated from the trace element data highlight peculiar differences inside these V-dominant emerald deposits and show great potential in differentiating the provenance.
The Dayakou emerald is characterized by significant concentration in W, Sn, and As. V/Cr ratios of some samples are greater than 110. The highest Li, Cs, and LILE contents indicate a magmatic origin of fluid for emerald mineralization which is comparable to the Lened in Canada and Eidsvoll in Norway [14,43]. The Lened emerald shows a similarly high concentration of Cs but depletes in Rb (below the detection limit). However, the Eidsvoll emerald unconventionally are depleted in Li, Cs, and LILE, but are enriched in Al and CTE. Samples from Eidsvoll show a high V/Cr ratio (4 to 25) and a great concentration of V, as the source of vanadium is black shale. The Muzo emerald is characterized by the enrichment of Mg and negligible LILE content, especially for Rb and Cs, which is related to the high salinity brines from evaporates that are poor in Rb and Cs [10]. Those Muzo samples hosted in V-bearing black shale also display a V/Cr ratio of 2 to 4 and high CTE content. The Jos emerald displays a low CTE, Li, and Sc content and low V/Cr ratio, but the concentration of Fe is extremely high, as the Fe-rich metasomatic fluids related to emerald mineralization are produced by the emplacement of younger granites [10,56]. The Panjshir Valley emerald shows a low V/Cr ratio (<2) and high CTE content, indicating the similar content of Cr and V in surrounding metamorphic schists [10]. Furthermore, the enrichment of Sc in the Panjshir Valley emerald is a definitive criterion for identification. The Poona emerald shows a low CTE content and V/Cr ratios, but displays a relatively high concentration of Li, Rb, and Cs, which is likely to suggest that the precipitation of these emerald samples occurred during syn-tectonic pegmatite emplacement [18]. The Mohmand V-dominant emerald is not discussed due to the lack of data.
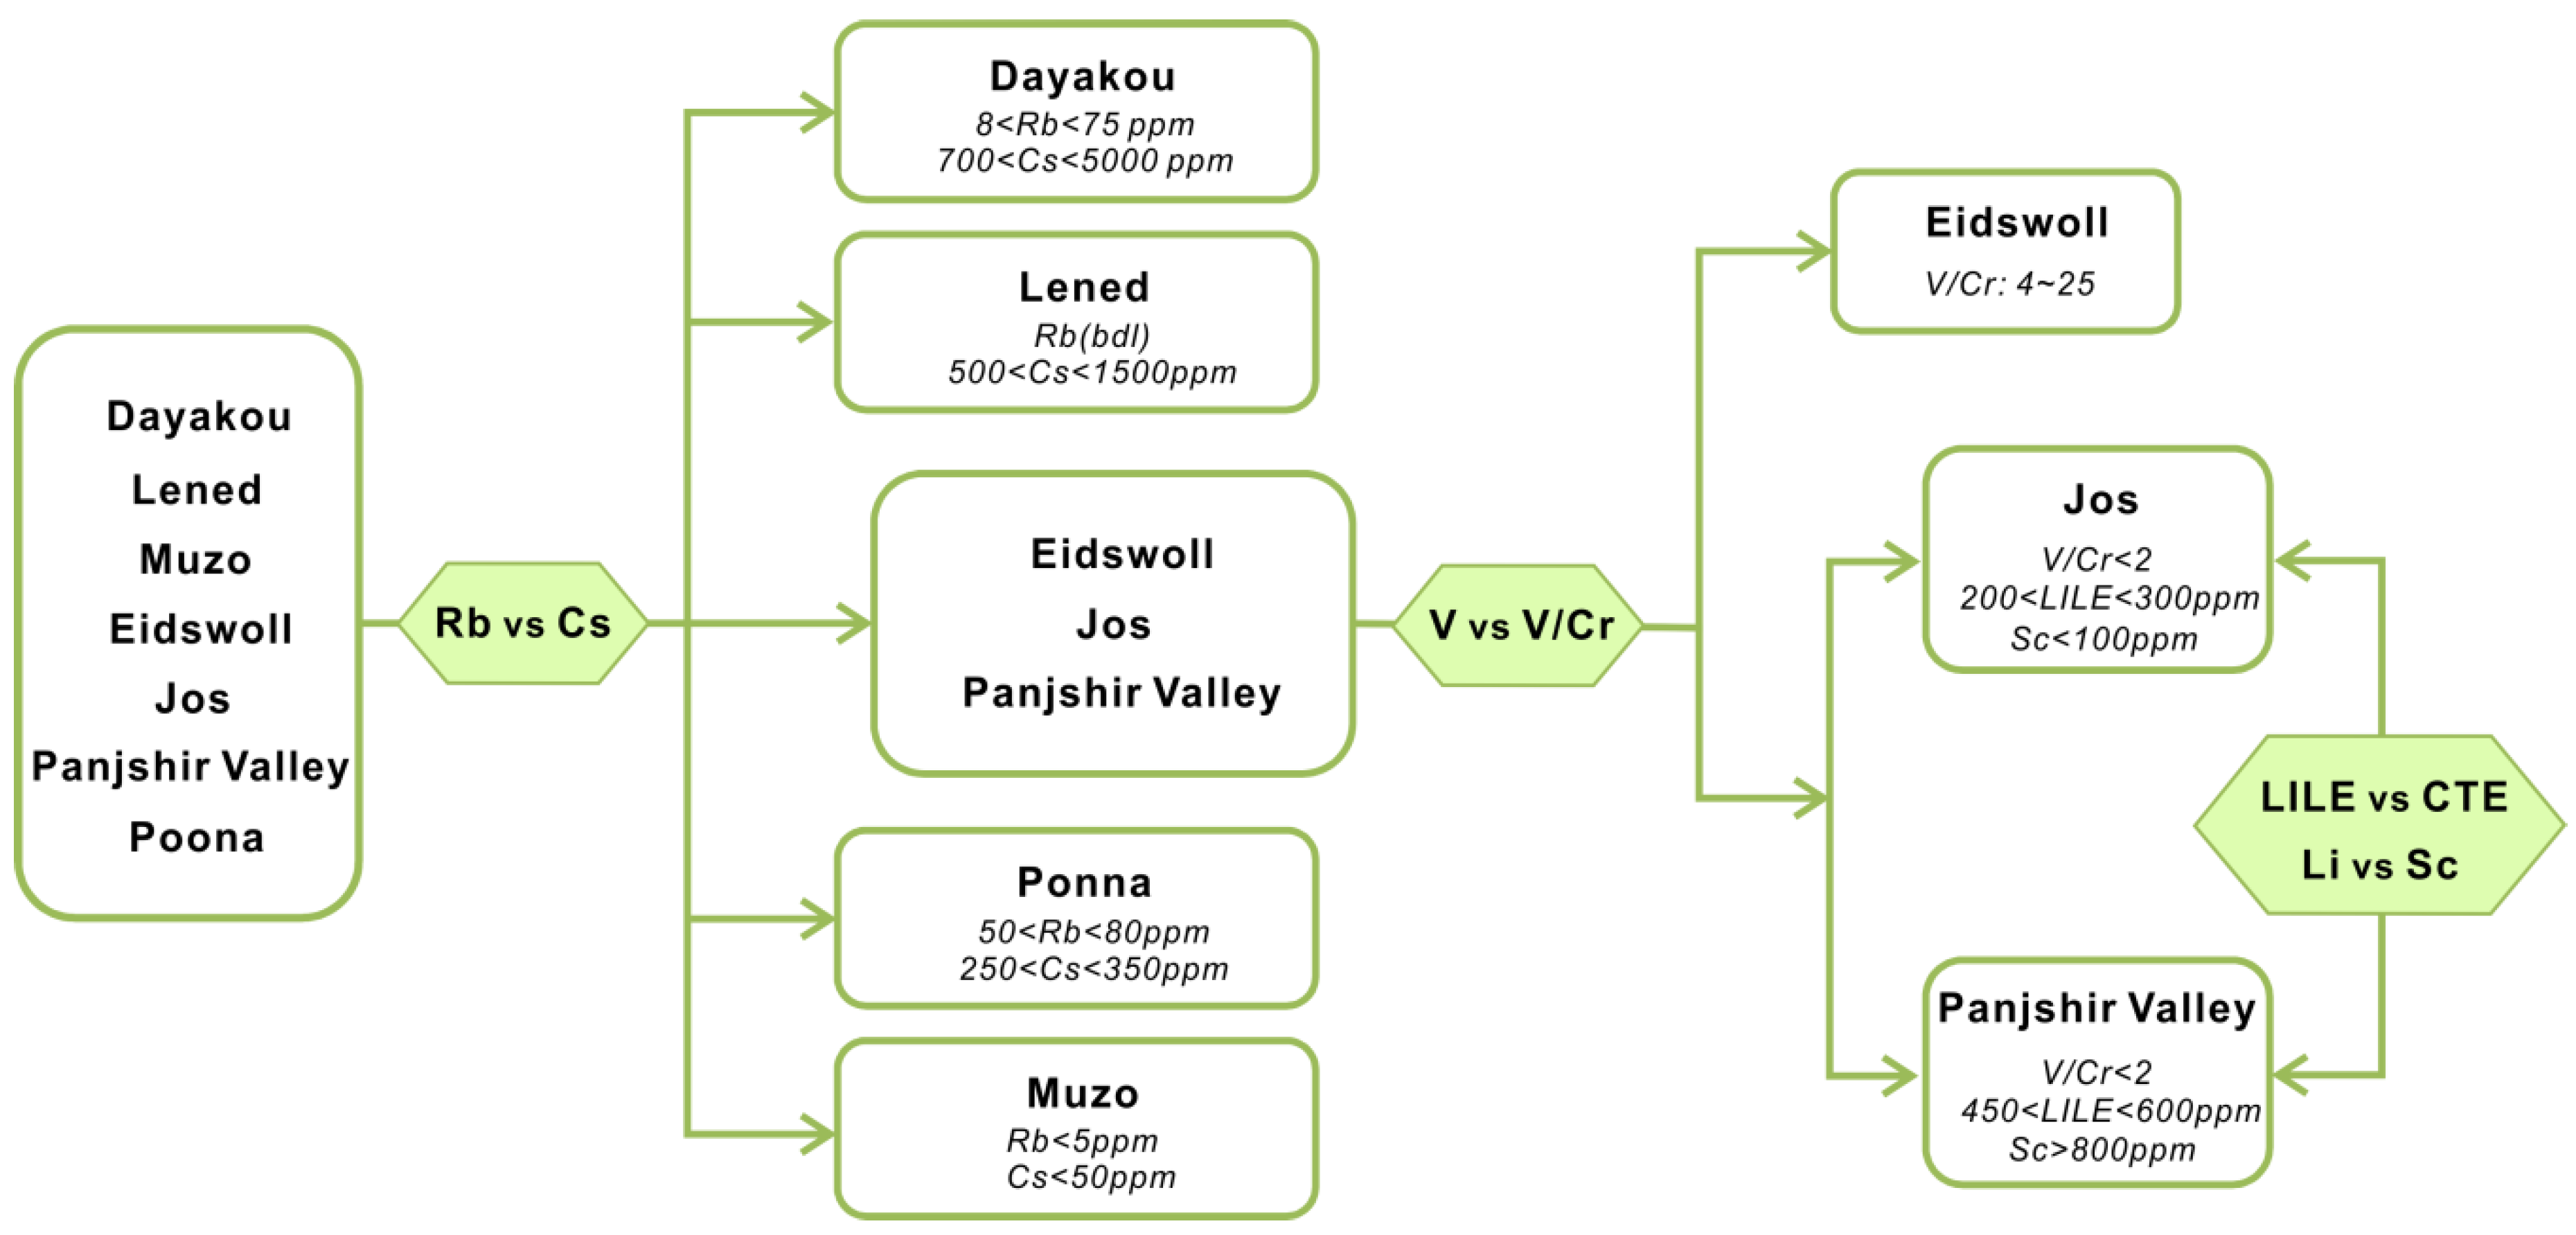
One of the feasible schemes to discriminate the origin of V-dominant emerald deposits is proposed in Figure 16. The plot of Rb vs. Cs (Figure 8) displays five distinct clusters which allow discriminating four deposits (Dayakou, Lened, Poona, and Muzo). The other indiscriminate cluster includes the Eidsvoll, Jos, and Panjshir Valley deposits. The plot of V vs. V/Cr (Figure 9) helps distinguish the Eidsvoll deposits from the other two. Plots of LILE vs. CTE (Figure 10) and Li vs. Sc (Figure 11) can easily differentiate the Jos and Panjshir Valley deposits.
6. Conclusions
The major and trace element compositions of the Dayakou emerald were investigated using electron microprobe and LA-ICP-MS. Results are compared with the characteristics of emeralds from seven typical V-dominant deposits worldwide. The results demonstrate that:
- (1)
- The Dayakou emerald is characterized by the enrichment of Cs, W, Sn, and As, with high ratios of V/Cr.
- (2)
- Eight deposits are defined as V-dominant emerald deposits by the content of Cr and V. They can be discriminated by a series of plots such as Rb vs. Cs, V vs. V/Cr, LILE vs. CTE, and Li vs. Sc.
- (3)
- The parental fluid of Dayakou emeralds is considered to be an Early Cretaceous early-stage granitic fluid associated with Laojunshan granite. Two generations of emerald precipitation are proposed: (i) Emeralds crystallized in early-stage pegmatitic fluid; (ii) Emeralds crystallized in more evolved late-stage pegmatitic-hydrothermal fluid that might be mixed by the local metamorphic fluids.
Author Contributions
Conceptualization, Y.Z. and X.Y.; Data curation, Y.Z. and H.G.; Formal analysis, Y.Z.; Funding acquisition, X.Y.; Methodology, Y.Z. and H.G.; Supervision, X.Y.; Writing–original draft, Y.Z.; Writing–review & editing, X.Y.
Funding
This research was supported by the Fundamental Research Funds for the Central Universities, grant number 59-53200759514.
Conflicts of Interest
The authors declare no conflict of interest.
References
- Aurisicchio, C.; Conte, A.M.; De Vito, C.; Ottolini, L. Beryl from Miarolitic Pockets of Granitic Pegmatites, Elba, Italy: Characterization of Crystal Chemistry by Means of Emp and Sims Analyses. Can. Miner. 2012, 50, 1467–1488. [Google Scholar] [CrossRef]
- Groat, L.A.; Giuliani, G.; Marshall, D.D.; Turner, D. Emerald deposits and occurrences: A review. Ore Geol. Rev. 2008, 34, 87–112. [Google Scholar] [CrossRef]
- Cerny, P. Mineralogy of beryllium in granitic pegmatites. Rev. Miner. Geochem. 2002, 50, 405–444. [Google Scholar] [CrossRef]
- Sardi, F.G.; Heimann, A. Pegmatitic Beryl as Indicator of Melt Evolution: Example from the Velasco District, Pampeana Pegmatite Province, Argentina, and Review of Worldwide Occurrences. Can. Miner. 2014, 52, 809–836. [Google Scholar] [CrossRef]
- Přikryl, J.; Novák, M.; Filip, J.; Gadas, P.; Galiová, M.V. Iron+ Magnesium-bearing beryl from granitic pegmatites: An EMPA, LA-ICP-MS, Mössbauer spectroscopy, and powder XRD study. Can. Miner. 2014, 52, 271–284. [Google Scholar] [CrossRef]
- Łodziński, M.; Sitarz, M.; Stec, K.; Kozanecki, M.; Fojud, Z.; Jurga, S. ICP, IR, Raman, NMR investigations of beryls from pegmatites of the Sudety Mts. J. Mol. Struct. 2005, 744–747, 1005–1015. [Google Scholar] [CrossRef]
- Fukuda, J.; Shinoda, K. Coordination of water molecules with Na+ cations in a beryl channel as determined by polarized IR spectroscopy. Phys. Chem. Miner. 2008, 35, 347–357. [Google Scholar] [CrossRef]
- Yu, X.Y.; Hu, D.Y.; Niu, X.W.; Kang, W.R. Infrared Spectroscopic Characteristics and Ionic Occupations in Crystalline Tunneling System of Yellow Beryl. JOM 2017, 69, 704–712. [Google Scholar] [CrossRef]
- Mashkovtsev, R.I.; Thomas, V.G.; Fursenko, D.A.; Zhukova, E.S.; Uskov, V.V.; Gorshunov, B.P. FTIR spectroscopy of D2O and HDO molecules in thec-axis channels of synthetic beryl. Am. Miner. 2016, 101, 175–180. [Google Scholar] [CrossRef]
- Giuliani, G.; Groat, L.A.; Marshall, D.; Fallick, A.E.; Branquet, Y. Emerald Deposits: A Review and Enhanced Classification. Minerals 2019, 9, 105. [Google Scholar] [CrossRef] [Green Version]
- Aurisicchio, C.; Grubessi, O.; Zecchini, P. Infrared-Spectroscopy and Crystal-Chemistry of the Beryl Group. Can. Miner. 1994, 32, 55–68. [Google Scholar]
- Wood, D.L.; Nassau, K. Characterization of beryl and ememrald by visible and infrared absorption spectroscopy. Am. Miner. 1968, 53, 777–800. [Google Scholar]
- Groat, L.A.; Marshall, D.D.; Giuliani, G.; Murphy, D.C.; Piercey, S.J.; Jambor, J.L.; Mortensen, J.K.; Ercit, T.S.; Gault, R.A.; Mattey, D.P.; et al. Mineralogical and Geochemical Study of the Regal Ridge Emerald Showing, Southeastern Yukon. Can. Miner. 2002, 40, 1313–1338. [Google Scholar] [CrossRef]
- Lake, D.J.; Groat, L.A.; Falck, H.; Mulja, T.; Cempírek, J.; Kontak, D.; Marshall, D.; Giuliani, G.; Fayek, M. Genesis of Emerald-Bearing Quartz Veins Associated with the Lened W-Skarn Mineralization, Northwest Territories, Canada. Can. Miner. 2017, 55, 561–593. [Google Scholar] [CrossRef]
- Andrianjakavah, P.R.; Salvi, S.; Béziat, D.; Rakotondrazafy, M.; Giuliani, G. Proximal and distal styles of pegmatite-related metasomatic emerald mineralization at Ianapera, southern Madagascar. Miner. Depos. 2009, 44, 817–835. [Google Scholar] [CrossRef]
- Aurisicchio, C.; Conte, A.M.; Medeghini, L.; Ottolini, L.; De Vito, C. Major and trace element geochemistry of emerald from several deposits: Implications for genetic models and classification schemes. Ore Geol. Rev. 2018, 94, 351–366. [Google Scholar] [CrossRef]
- Loughrey, L.; Marshall, D.; Jones, P.; Millsteed, P.; Main, A. Pressure-temperature-fluid constraints for the Emmaville-Torrington emerald deposit, New South Wales, Australia: Fluid inclusion and stable isotope studies. Open Geosci. 2012, 4, 287–299. [Google Scholar] [CrossRef]
- Marshall, D.; Downes, P.; Ellis, S.; Greene, R.; Loughrey, L.; Jones, P. Pressure–Temperature–Fluid Constraints for the Poona Emerald Deposits, Western Australia: Fluid Inclusion and Stable Isotope Studies. Minerals 2016, 6, 130. [Google Scholar] [CrossRef] [Green Version]
- Santiago, J.S.; Souza, V.D.S.; Filgueiras, B.D.C.; Jiménez, F.A.C. Emerald from the Fazenda Bonfim Deposit, northeastern Brazil: Chemical, fluid inclusions and oxygen isotope data. Braz. J. Geol. 2018, 48, 457–472. [Google Scholar] [CrossRef]
- Bai, F.; Pan, H.H.; Li, X.M. Replacement degree of Al3+ and Cr/V ratio in high-V emeralds from Malipo, Yunnan, China. Arab. J. Geosci. 2019, 12. [Google Scholar] [CrossRef]
- Saeseaw, S.; Pardieu, V.; Sangsawong, S. Three-Phase Inclusions in Emerald and Their Impact on Origin Determination. Gems Gemol. 2014, 50, 114–132. [Google Scholar] [CrossRef] [Green Version]
- Neiva, A.M.R.; Neiva, J.M.C. Beryl from the granitic pegmatite at Namivo, Alto Ligonha, Mozambique. Neues Jahrb. Min. Abh. 2005, 181, 173–182. [Google Scholar] [CrossRef] [PubMed]
- Michallik, R.M.; Wagner, T.; Fusswinkel, T.; Heinonen, J.S.; Heikkilä, P. Chemical evolution and origin of the Luumäki gem beryl pegmatite: Constraints from mineral trace element chemistry and fractionation modeling. Lithos 2017, 274–275, 147–168. [Google Scholar] [CrossRef]
- Xue, G.; Marshall, D.; Zhang, S.; Ullrich, T.D.; Bishop, T.; Groat, L.A.; Thorkelson, D.J.; Giuliani, G.; Fallick, A.E. Conditions for Early Cretaceous Emerald Formation at Dyakou, China: Fluid Inclusion, Ar-Ar, and Stable Isotope Studies. Econ. Geol. 2010, 105, 339–349. [Google Scholar] [CrossRef]
- Feng, M.G.; Lu, W.; Zhang, X.G.; Chen, G.F.; Zhang, S.T. Regional Geologic Mapping at 1:50,000 (Malipo and Dulong Sheet): Yunnan, China; Yunnan Geological Survey Report F48E006011; Yunnan Bureau of Geology and Exploration: Dali, China, 1998; p. 198. (In Chinese) [Google Scholar]
- Feng, M.G.; Zhang, S.T.; Lu, W. Geological characters of the Chinese emerald deposit. Yunnan Geol. 2000, 19, 37–42. (In Chinese) [Google Scholar]
- Hu, R.R. Geological Background and Formation Model Study on the Malipo Emerald Deposit in Yunnan Province, China. Master’s Thesis, Kunming University of Science and Technology, Kunming, China, March 2008. (In Chinese with English abstract). [Google Scholar]
- Zhang, S.T.; Feng, M.G.; Lu, W. Analysis of the Nanwenhe metamorphic core complex in southeastern Yunnan. Reg. Geol. China 1998, 17, 390–397. (In Chinese) [Google Scholar]
- Que, C.Y.; Zhang, D.; Di, Y.J.; Bi, M.F.; Huang, K.W.; Xu, J.Z. Ore-controlling characteristics of tungsten deposits in the Nanwenhe-Saxi area and deep prospecting breakthrough. Earth Sci. Front. 2014, 21, 286–300, (In Chinese with English abstract). [Google Scholar] [CrossRef]
- Xu, B.; Jiang, S.-Y.; Hofmann, A.W.; Wang, R.; Yang, S.-Y.; Zhao, K.-D. Geochronology and geochemical constraints on petrogenesis of Early Paleozoic granites from the Laojunshan district in Yunnan Province of South China. Gondwana Res. 2016, 29, 248–263. [Google Scholar] [CrossRef]
- Liu, Y.B.; Mo, X.X.; Zhang, D.; Que, C.Y.; Di, Y.J.; Pu, X.M.; Cheng, G.S.; Ma, H.H. Petrogenesis of the Late Cretaceous granite discovered in the Laojunshan region, southeastern Yunnan Province. Acta Petrol. Sin. 2014, 30, 3271–3286. [Google Scholar]
- Feng, J.R.; Mao, J.W.; Pei, R.F. Ages and geochemistry of Laojunshan granites in southeastern Yunnan, China: Implications for W-Sn polymetallic ore deposits. Min. Petrol. 2013, 107, 573–589. [Google Scholar] [CrossRef]
- Lan, J.B.; Liu, Y.P.; Ye, L.; Zhang, Q.; Wang, D.P.; Su, H. Geochemistry and age spectrum of Late Yanshanian granites from Laojunshan area, southeastern Yunnan Province, China. Acta Miner. Sin. 2016, 36, 441–454. [Google Scholar] [CrossRef]
- Huang, W.Q. Mineralogical and fluid inclusion study on the Malipo emerald deposit in Yunnan Province, China. Master’s Thesis, Nanjing University, Nanjing, China, May 2014. (In Chinese with English abstract). [Google Scholar]
- Zhang, S.T.; Feng, M.G.; Wang, H.Q.; Lu, W.; Yang, M. Geological features and genesis of emerald deposits in the Malipo County of Yunan Province, China. Geol. Sci. Technol. Inf. 1999, 18, 50–54. (In Chinese) [Google Scholar]
- Reed, S.J.B. Recent Advances in Electron-Microprobe Analysis. Inst. Phys. Conf. Ser. 1993, 130, 67–74. [Google Scholar]
- Yavuz, F.; Karakaya, N.; Yıldırım, D.K.; Karakaya, M.Ç.; Kumral, M. A Windows program for calculation and classification of tourmaline-supergroup (IMA-2011). Comput. Geosci. 2014, 63, 70–87. [Google Scholar] [CrossRef]
- Li, C.; Zhou, L.M.; Zhao, Z.; Zhang, Z.Y.; Zhao, H.; Li, X.W.; Qu, W.J. In-situ Sr isotopic measurement of scheelite using fs-LA-MC-ICPMS. J. Asian Earth Sci. 2018, 160, 38–47. [Google Scholar] [CrossRef] [Green Version]
- Liu, Y.S.; Hu, Z.C.; Gao, S.; Günther, D.; Xu, J.; Gao, C.G.; Chen, H.H. In situ analysis of major and trace elements of anhydrous minerals by LA-ICP-MS without applying an internal standard. Chem. Geol. 2008, 257, 34–43. [Google Scholar] [CrossRef]
- Zwaan, J.C.; Kanis, J.; Neto, M.T.O.C.; Häger, T.; Jacob, D.E. Emeralds from the Fazenda Bonfim Region, Rio Grande do Norte, Brazil. Gems Gemol. 2012, 48, 2–17. [Google Scholar] [CrossRef]
- Marshall, D.; Pardieu, V.; Loughrey, L.; Jones, P.; Xue, G. Conditions for emerald formation at Davdar, China: Fluid inclusion, trace element and stable isotope studies. Miner. Mag. 2018, 76, 213–226. [Google Scholar] [CrossRef]
- Rondeau, B.; Fritsch, E.; Peucat, J.J.; Nordrum, F.S.; Groat, L. Characterization of emeralds from a historical deposit: Byrud (Eidsvoll), Norway. Gems Gemol. 2008, 44, 108–122. [Google Scholar] [CrossRef]
- Loughrey, L.; Marshall, D.; Ihlen, P.; Jones, P. Boiling as a mechanism for colour zonations observed at the Byrud emerald deposit, Eidsvoll, Norway: Fluid inclusion, stable isotope and Ar-Ar studies. Geofluids 2013, 13, 542–558. [Google Scholar] [CrossRef]
- Xu, C. Study on the Gemological and Mineralogical Characteristic of Vanadium Rich Emeralds from Malipo, Yunnan. Master’s Degree Thesis, China University of Geosciences Beijing, Beijing, China, May 2016. (In Chinese with English abstract). [Google Scholar]
- Rudnick, R.L.; Gao, S. Composition of the Continental Crust. In Treatise on Geochemistry, 2nd ed.; Elsevier: Amsterdam, The Netherlands, 2014; pp. 1–51. [Google Scholar] [CrossRef]
- Marshall, D.D.; Groat, L.A.; Falck, H.; Giuliani, G.; Neufeld, H. The Lened emerald prospect, Northwest Territories, Canada: Insights from fluid inclusions and stable isotopes, with implications for northern Cordilleran emerald. Can. Miner. 2004, 42, 1523–1539. [Google Scholar] [CrossRef]
- Mcdonough, W.F.; Sun, S.S. The Composition of the Earth. Chem. Geol. 1995, 120, 223–253. [Google Scholar] [CrossRef]
- Watenphul, A.; Burgdorf, M.; Schlüter, J.; Horn, I.; Malcherek, T.; Mihailova, B. Exploring the potential of Raman spectroscopy for crystallochemical analyses of complex hydrous silicates: II. Tourmalines. Am. Miner. 2016, 101, 970–985. [Google Scholar] [CrossRef]
- Watenphul, A.; Malcherek, T.; Wilke, F.D.H.; Schlüter, J.; Mihailova, B. Composition–thermal expandability relations and oxidation processes in tourmaline studied by in situ Raman spectroscopy. Phys. Chem. Miner. 2017, 44, 735–748. [Google Scholar] [CrossRef]
- Henry, D.J.; Novak, M.; Hawthorne, F.C.; Ertl, A.; Dutrow, B.L.; Uher, P.; Pezzotta, F. Nomenclature of the tourmaline-supergroup minerals. Am. Miner. 2011, 96, 895–913. [Google Scholar] [CrossRef]
- Liu, Y.; Deng, J.; Shi, G.H.; Sun, X.; Yang, L.Q. Genesis of the Xuebaoding W-Sn-Be Crystal Deposits in Southwest China: Evidence from Fluid Inclusions, Stable Isotopes and Ore Elements. Resour. Geol. 2012, 62, 159–173. [Google Scholar] [CrossRef]
- Yu, X.Y.; Niu, X.W.; Zhao, L.H. Characterization and Origin of Zonal Sapphire from Shandong Province, China. JOM 2015, 67, 391–397. [Google Scholar] [CrossRef]
- Jiang, X.; Yu, X.Y.; Guo, B.J.; Xu, C. A study of mineral inclusions in emeralds from Malipo, Yunnan Province, China. Acta Petrol. Mineral. 2019, 38, 279–286, (In Chinese with English abstract). [Google Scholar]
- Trumbull, R.B.; Krienitz, M.-S.; Grundmann, G.; Wiedenbeck, M. Tourmaline geochemistry and δ11B variations as a guide to fluid–rock interaction in the Habachtal emerald deposit, Tauern Window, Austria. Contrib. Miner. Petrol. 2008, 157, 411–427. [Google Scholar] [CrossRef] [Green Version]
- Wood, S.A. Theoretical prediction of speciation and solubility of beryllium in hydrothermal solution to 300 C at saturated vapor pressure: Application to bertrandite/phenakite deposits. Ore Geol. Rev. 1992, 7, 249–278. [Google Scholar] [CrossRef]
- Kinnaird, J.A. Hydrothermal Alteration and Mineralization of the Alkaline Anorogenic Ring Complexes of Nigeria. J. Afr. Earth Sci. 1985, 3, 229. [Google Scholar] [CrossRef]
Figure 1.
Simplified regional geologic map of Dayakou emerald occurrence modified after [24,29]. The structural profile map (A to B) indicates the tectonic layering in the area.

Figure 2.
Boxplots of the concentrations of major and trace elements in Dayakou emerald, expressed in apfu (a) and ppm (b), respectively. The box marks the upper (25%) and lower (75%) quartile of the data, and the outer brackets mark 1.5 times the upper and lower quartile. Vertical lines inside the boxes indicate the median (50%). The black square symbols and circle symbols show the mean values and outlier, respectively. Value around the box presents the mean value. Ytot = total atoms of Y site occupants; Ysub = total atoms of Y site substitutions; RD = replace degree of Y site; OR2+ = atoms of octahedral (Y site) divalent cations; CA+ = atoms of Channel monovalent alkali cations.

Figure 3.
Ternary FeO-Cr2O3-V2O3 (wt.%) plots of emerald compositions. (a) Plot of 54 Dayakou emerald compositions superimposed on 480 worldwide emerald compositions from literature. (b) Plot of emerald compositions from V-dominant deposits. The number of analyses per country is given in brackets in the legend. Data are normalized from wt.% microprobe analyses, with all Fe as FeO. Gray triangular area indicates that the content of V2O3 is greater than Cr2O3. Sources of data: [2,10,14,15,16,17,19,20,40,41,42,43,44].

Figure 4.
Al versus the sum of its substituents in Y site, in atoms per formula unit (apfu). (a) Plot of 54 Dayakou emerald compositions superimposed on 480 worldwide emerald compositions from literature. (b) Plot of emerald compositions from V-dominant deposits. Dotted rectangle area (R) indicates the Al occupancy is more than 75%. IL = ideal line defined by Al (Y site) = 2 apfu to Σ substituents = 1 apfu. Sources of data are the same as in Figure 3.

Figure 5.
Plots of R2+ (divalent cations in octahedral site) versus A+ (monovalent alkali cations in channel). (a) Plot of 54 Dayakou emerald compositions superimposed on 480 worldwide emerald compositions from literature. (b) Plot of emerald compositions from V-dominant deposits. Data are normalized from wt.% microprobe analyses, with all Fe as FeO. Colored areas indicate discriminated clusters. They are clusters of Eidsvoll (yellow), Poona (gray), Dayakou + Muzo + Lened + Panjshir Valley (light red), and Mohmand (dark gray). Sources of data are the same as in Figure 3.

Figure 6.
(a) Ternary FeO-MgO-Cr2O3 (wt.%) plot of 54 Dayakou emerald compositions superimposed on 480 worldwide emerald compositions from literature. (b) Ternary FeO-MgO-V2O3 (wt.%) plot of emerald compositions from V-dominant deposits. Data are normalized from wt.% microprobe analyses, with all Fe as FeO. Colored areas indicate discriminated clusters. They are clusters of Muzo (light blue), Dayakou + Lened (gray), Poona (dark gray), and Eidsvoll (light red). Sources of data are the same as in Figure 3.

Figure 7.
The bulk continental crust normalized [45] multi-element spider diagram of 34 Dayakou emerald samples (98 analyses) in this study compared to emeralds of other V-dominant deposits from literature. Data are expressed in ppm. Sources of data: [16,42].

Figure 8.
Plot of rubidium (Rb) versus cesium (Cs) concentrations in emeralds from seven vanadium-dominant deposits. Data are expressed in ppm. Dotted rectangle highlight clusters of the distinctive deposits. Sources of data: [16,21,42,46].

Figure 9.
Plot of vanadium (V) concentrations versus vanadium/chromium (V/Cr) ratio in emeralds from seven vanadium-dominant deposits. Data are expressed in ppm. Sources of data are the same as in Figure 8.
Figure 9.
Plot of vanadium (V) concentrations versus vanadium/chromium (V/Cr) ratio in emeralds from seven vanadium-dominant deposits. Data are expressed in ppm. Sources of data are the same as in Figure 8.

Figure 10.
Plot of large ion lithophile element (LILE) versus transition and chromophore elements (CTE) concentrations in emeralds from six vanadium-dominant deposits. Data are expressed in ppm. Dotted rectangle highlight clusters of the distinctive deposits. Sources of data: [16,21,42] (average of 3 analyses).

Figure 11.
Plot of lithium (Li) versus scandium (Sc) concentrations in emeralds from six vanadium-dominant deposits. Data are expressed in ppm. Dotted rectangle highlight clusters of the distinctive deposits. Sources of data are the same as Figure 10.
Figure 11.
Plot of lithium (Li) versus scandium (Sc) concentrations in emeralds from six vanadium-dominant deposits. Data are expressed in ppm. Dotted rectangle highlight clusters of the distinctive deposits. Sources of data are the same as Figure 10.

Figure 12.
Representative chondrite-normalized rare earth element patterns of emeralds from Dayakou deposit. Normalization values after [47].
Figure 12.
Representative chondrite-normalized rare earth element patterns of emeralds from Dayakou deposit. Normalization values after [47].

Figure 13.
(a) Representative photomicrograph of color zoned emerald crystal YE-6 with a greenish-white core and a medium-green rim. The red circles indicate the positions of analysis points corresponding to analyses YE-6-1 to YE-6-8. (b) Representative photomicrograph in plane polarized light showing the typical tourmaline (Tur) inclusions in the medium-green rim zone of emerald (Em) sample YE-6. The tourmaline crystals show cross sections of convex triangles and variable orientations. (c) LA-ICP-MS data for selected trace elements of analyses from YE-6-1 to YE-6-8. Log plots of chromium (Cr), rubidium (Rb), and gallium (Ga) were used to highlight the composition variation. In (c), the solid symbol corresponds to the left axis scale, and the hollow symbol the right axis scale.

Figure 14.
Idealized mineralization model for the tectonic magmatic-related Dayakou emerald deposit. Quartz-rich pegmatite and quartz veins derived from the Be-Li-Cs-W-Sn-As-B-rich (beryllium-Be, lithium-Li, caesium-Cs, wolfram-W, stannum-Sn, arsenic-As, and boron-B) Early Cretaceous early-stage granite intrude Saxi metamorphic rocks (Pt3s1-Saxi unit Section 1, Pt3s2-Saxi unit Section 2, Pt3s3-Saxi unit Section 3). Pegmatite veins appear in structural fractures produced by the granite emplacement and quartz veins appear in F2 shear zones. The fluid circulations from the pegmatite or quartz veins into the Saxi metamorphic rocks transport Be, V, and Cr (vanadium-V, chromium-Cr) to the deposition site. Emerald (Em) can precipitate in the pegmatite and quartz veins and their adjacent metamorphic rocks. Some pegmatites show a local zoning with an outer zone enriched in feldspars (Fsp), an intermediate zone of scheelite-(Sh) emerald-bearing quartz vein, and an inner zone of emerald-tourmaline-bearing (tourmaline-Tur) quartz vein.

Figure 15.
Plot of vanadium (V) versus chromium (Cr) concentrations (expressed in ppm) in emeralds from seven V-dominant deposits. Gray triangular area indicates the V-dominance. Sources of data: [46] (average of five analyses), [16,42] (average of three analyses).

Figure 16.
The feasible scheme to discriminate the provenance of vanadium-dominant emerald deposits. Rubidium-Rb; caesium-Cs; vanadium-V; chromium-Cr; lithium-Li; scandium-Sc; large ion lithophile element-LILE; chromophoric transition elements–CTE; bdl = below detection limit.
Figure 16.
The feasible scheme to discriminate the provenance of vanadium-dominant emerald deposits. Rubidium-Rb; caesium-Cs; vanadium-V; chromium-Cr; lithium-Li; scandium-Sc; large ion lithophile element-LILE; chromophoric transition elements–CTE; bdl = below detection limit.


Table 1.
Chemical compositions with the structural formulas of emeralds and tourmalines from Dayakou occurrence analyzed by EMPA (in wt.%).
Table 1.
Chemical compositions with the structural formulas of emeralds and tourmalines from Dayakou occurrence analyzed by EMPA (in wt.%).
| Sample | Dayakou Emerald (YE) | |||||||||||||||||
|---|---|---|---|---|---|---|---|---|---|---|---|---|---|---|---|---|---|---|
| 4-1 | 4-2 | 4-3 | 5-1 | 5-2 | 5-3 | 5-4 | 5-5 | 7-1 | 7-2 | 7-3 | 7-4 | 8-1 | 8-2 | 8-3 | 8-4.1 | 9-1 | 9-2 | |
| SiO2 | 65.83 | 65.49 | 65.92 | 65.63 | 65.86 | 66.02 | 66.18 | 66.82 | 67.29 | 66.95 | 67.02 | 67.52 | 66.07 | 65.99 | 66.53 | 66.12 | 66.22 | 66.65 |
| TiO2 | 0.04 | bdl | 0.04 | 0.06 | 0.06 | bdl | bdl | 0.01 | 0.01 | bdl | 0.11 | 0.06 | bdl | 0.06 | 0.04 | 0.07 | 0.02 | 0.09 |
| Al2O3 | 15.32 | 15.59 | 15.74 | 14.89 | 15.69 | 16.13 | 15.95 | 16.19 | 17.18 | 17.19 | 17.00 | 17.61 | 16.05 | 16.71 | 16.37 | 15.87 | 16.80 | 16.54 |
| Sc2O3 | bdl | 0.03 | 0.02 | bdl | 0.01 | bdl | bdl | 0.01 | bdl | bdl | 0.01 | bdl | 0.02 | bdl | 0.03 | bdl | bdl | 0.01 |
| V2O3 | 1.78 | 1.59 | 1.15 | 1.04 | 1.41 | 1.04 | 0.96 | 1.34 | 0.58 | 0.47 | 0.46 | 0.52 | 0.27 | 0.23 | 1.31 | 1.51 | 0.24 | 0.54 |
| Cr2O3 | 0.01 | 0.04 | 0.02 | 0.02 | 0.05 | 0.03 | 0.02 | 0.01 | 0.04 | 0.04 | 0.04 | 0.03 | 0.05 | 0.01 | 0.03 | 0.08 | bdl | bdl |
| BeO | 13.61 | 13.54 | 13.62 | 13.55 | 13.60 | 13.63 | 13.66 | 13.80 | 13.91 | 13.84 | 13.85 | 13.96 | 13.64 | 13.62 | 13.73 | 13.65 | 13.60 | 13.69 |
| MgO a | 1.29 | 1.29 | 1.29 | 1.18 | 1.18 | 1.18 | 1.18 | 1.18 | 0.76 | 0.76 | 0.76 | 0.76 | 1.22 | 1.22 | 1.22 | 1.22 | 1.18 | 1.18 |
| CaO | bdl | 0.03 | 0.03 | 0.09 | bdl | bdl | 0.02 | 0.01 | bdl | bdl | 0.01 | 0.02 | 0.01 | 0.01 | 0.02 | 0.01 | 0.03 | 0.01 |
| MnO | bdl | 0.02 | bdl | bdl | 0.03 | 0.01 | 0.01 | bdl | 0.01 | bdl | bdl | 0.06 | 0.01 | 0.01 | 0.02 | bdl | bdl | 0.03 |
| FeO | 0.49 | 0.46 | 0.59 | 0.80 | 0.50 | 0.43 | 0.49 | 0.39 | 0.31 | 0.32 | 0.44 | 0.30 | 0.31 | 0.37 | 0.42 | 0.44 | 0.32 | 0.36 |
| NiO | bdl | bdl | 0.03 | 0.02 | bdl | bdl | 0.05 | 0.04 | 0.04 | bdl | bdl | bdl | 0.02 | 0.04 | bdl | bdl | 0.01 | 0.04 |
| CoO | bdl | 0.01 | bdl | bdl | bdl | 0.03 | 0.09 | 0.04 | bdl | bdl | bdl | 0.04 | 0.03 | bdl | 0.01 | bdl | 0.07 | 0.07 |
| Na2O | 0.81 | 0.79 | 0.80 | 1.19 | 0.80 | 0.77 | 0.82 | 0.91 | 0.77 | 0.70 | 0.90 | 0.62 | 0.90 | 1.03 | 0.87 | 1.07 | 0.82 | 0.80 |
| K2O | 0.02 | 0.04 | 0.06 | 0.04 | 0.03 | 0.03 | 0.01 | 0.02 | bdl | 0.02 | 0.01 | 0.03 | 0.03 | 0.04 | bdl | 0.03 | 0.01 | 0.02 |
| Li2O a | 0.06 | 0.06 | 0.06 | 0.07 | 0.07 | 0.07 | 0.07 | 0.07 | 0.06 | 0.06 | 0.06 | 0.06 | 0.07 | 0.07 | 0.07 | 0.07 | 0.11 | 0.11 |
| Cs2O | 0.23 | 0.11 | 0.18 | 0.32 | 0.21 | 0.18 | 0.21 | 0.20 | 0.10 | 0.18 | 0.21 | 0.21 | 0.16 | 0.11 | 0.16 | 0.16 | 0.10 | 0.12 |
| H2O b | 2.07 | 2.06 | 2.07 | 2.28 | 2.07 | 2.05 | 2.08 | 2.13 | 2.04 | 1.99 | 2.13 | 1.93 | 2.13 | 2.20 | 2.11 | 2.22 | 2.08 | 2.07 |
| Total | 99.49 | 99.09 | 99.55 | 98.90 | 99.50 | 99.55 | 99.72 | 101.04 | 101.06 | 100.53 | 100.88 | 101.80 | 98.86 | 99.52 | 100.83 | 100.30 | 99.53 | 100.26 |
| Sample | Dayakou Emerald (YE) | |||||||||||||||||
| 4-1 | 4-2 | 4-3 | 5-1 | 5-2 | 5-3 | 5-4 | 5-5 | 7-1 | 7-2 | 7-3 | 7-4 | 8-1 | 8-2 | 8-3 | 8-4.1 | 9-1 | 9-2 | |
| apfu | ||||||||||||||||||
| Si4+ | 6.000 | 6.000 | 6.000 | 6.000 | 6.000 | 6.000 | 6.000 | 6.000 | 6.000 | 6.000 | 6.000 | 6.000 | 6.000 | 6.000 | 6.000 | 6.000 | 6.000 | 6.000 |
| Al3+ | 1.646 | 1.683 | 1.688 | 1.604 | 1.685 | 1.728 | 1.704 | 1.713 | 1.805 | 1.816 | 1.794 | 1.844 | 1.718 | 1.791 | 1.740 | 1.697 | 1.794 | 1.755 |
| Ti4+ | 0.003 | bdl | 0.003 | 0.004 | 0.004 | bdl | bdl | 0.001 | 0.001 | bdl | 0.007 | 0.004 | bdl | 0.004 | 0.003 | 0.005 | 0.001 | 0.006 |
| Sc3+ | bdl | 0.002 | 0.002 | bdl | 0.001 | bdl | bdl | 0.001 | bdl | bdl | 0.001 | bdl | 0.002 | bdl | 0.002 | bdl | bdl | 0.001 |
| V3+ | 0.130 | 0.117 | 0.084 | 0.076 | 0.103 | 0.076 | 0.070 | 0.096 | 0.041 | 0.034 | 0.033 | 0.037 | 0.020 | 0.017 | 0.095 | 0.110 | 0.017 | 0.039 |
| Cr3+ | 0.001 | 0.003 | 0.001 | 0.001 | 0.004 | 0.002 | 0.001 | 0.001 | 0.003 | 0.003 | 0.003 | 0.002 | 0.004 | 0.001 | 0.002 | 0.006 | bdl | bdl |
| Mg2+ | 0.175 | 0.176 | 0.175 | 0.161 | 0.160 | 0.160 | 0.159 | 0.158 | 0.101 | 0.102 | 0.101 | 0.101 | 0.165 | 0.165 | 0.164 | 0.165 | 0.159 | 0.158 |
| Mn2+ | bdl | 0.002 | bdl | bdl | 0.002 | 0.001 | 0.001 | bdl | 0.001 | bdl | bdl | 0.005 | 0.001 | 0.001 | 0.002 | bdl | bdl | 0.002 |
| Fe2+ | 0.037 | 0.035 | 0.045 | 0.061 | 0.038 | 0.033 | 0.037 | 0.029 | 0.023 | 0.024 | 0.033 | 0.022 | 0.024 | 0.028 | 0.032 | 0.033 | 0.024 | 0.027 |
| Ni2+ | bdl | bdl | 0.002 | 0.001 | bdl | bdl | 0.004 | 0.003 | 0.003 | bdl | bdl | bdl | 0.001 | 0.003 | bdl | bdl | 0.001 | 0.003 |
| Co2+ | bdl | 0.001 | bdl | bdl | bdl | 0.002 | 0.007 | 0.003 | bdl | bdl | bdl | 0.003 | 0.002 | bdl | 0.001 | bdl | 0.005 | 0.005 |
| Y tot | 1.992 | 2.019 | 2.000 | 1.908 | 1.997 | 2.002 | 1.983 | 2.005 | 1.978 | 1.979 | 1.972 | 2.018 | 1.937 | 2.010 | 2.041 | 2.016 | 2.001 | 1.996 |
| Y sub | 0.346 | 0.336 | 0.312 | 0.304 | 0.312 | 0.274 | 0.279 | 0.292 | 0.173 | 0.163 | 0.178 | 0.174 | 0.219 | 0.219 | 0.301 | 0.319 | 0.207 | 0.241 |
| RD | 17.40% | 16.60% | 15.60% | 15.90% | 15.60% | 13.70% | 14.10% | 14.60% | 8.80% | 8.20% | 9.00% | 8.60% | 11.30% | 10.90% | 14.80% | 15.80% | 10.30% | 12.10% |
| OR2+ | 0.212 | 0.214 | 0.222 | 0.223 | 0.200 | 0.196 | 0.208 | 0.193 | 0.128 | 0.126 | 0.134 | 0.131 | 0.193 | 0.197 | 0.199 | 0.198 | 0.189 | 0.195 |
| Be2+ | 2.978 | 2.978 | 2.978 | 2.974 | 2.974 | 2.974 | 2.974 | 2.975 | 2.978 | 2.978 | 2.978 | 2.979 | 2.974 | 2.974 | 2.975 | 2.974 | 2.960 | 2.960 |
| Ca2+ | bdl | 0.003 | 0.003 | 0.009 | bdl | bdl | 0.002 | 0.001 | bdl | bdl | 0.001 | 0.002 | 0.001 | 0.001 | 0.002 | 0.001 | 0.003 | 0.001 |
| Na+ | 0.143 | 0.140 | 0.141 | 0.211 | 0.141 | 0.136 | 0.144 | 0.158 | 0.133 | 0.122 | 0.156 | 0.107 | 0.158 | 0.182 | 0.152 | 0.188 | 0.144 | 0.140 |
| K+ | 0.002 | 0.005 | 0.007 | 0.005 | 0.003 | 0.003 | 0.001 | 0.002 | bdl | 0.002 | 0.001 | 0.003 | 0.003 | 0.005 | bdl | 0.003 | 0.001 | 0.002 |
| Cs+ | 0.009 | 0.004 | 0.007 | 0.012 | 0.008 | 0.007 | 0.008 | 0.008 | 0.004 | 0.007 | 0.008 | 0.008 | 0.006 | 0.004 | 0.006 | 0.006 | 0.004 | 0.005 |
| CA+ | 0.176 | 0.171 | 0.177 | 0.254 | 0.178 | 0.172 | 0.179 | 0.193 | 0.159 | 0.153 | 0.187 | 0.139 | 0.193 | 0.217 | 0.183 | 0.223 | 0.189 | 0.187 |
| Sample | Dayakou Emerald (YE) | |||||||||||||||||
| 10-1 | 10-2 | 11-1 | 11-2 | 12-1 | 12-2 | 13-1 | 13-2 | 15-1 | 15-2 | 16-1 | 16-2 | 19-1 | 19-2 | 21-2 | 22-1 | 22-2 | 24-1 | |
| SiO2(wt.%) | 66.26 | 65.63 | 67.66 | 66.64 | 65.90 | 66.94 | 66.13 | 66.40 | 66.16 | 65.25 | 65.07 | 64.31 | 67.29 | 66.30 | 67.17 | 66.51 | 66.11 | 67.09 |
| TiO2 | bdl | bdl | 0.04 | bdl | 0.06 | 0.04 | bdl | 0.01 | bdl | 0.05 | bdl | 0.04 | 0.12 | bdl | 0.01 | bdl | bdl | 0.04 |
| Al2O3 | 15.45 | 15.50 | 17.01 | 16.04 | 15.17 | 15.23 | 16.34 | 16.17 | 15.35 | 14.92 | 16.06 | 13.87 | 16.76 | 15.44 | 16.47 | 16.35 | 16.24 | 15.99 |
| Sc2O3 | 0.02 | bdl | bdl | 0.01 | bdl | 0.01 | 0.03 | 0.05 | 0.02 | bdl | bdl | bdl | 0.01 | bdl | bdl | bdl | bdl | bdl |
| V2O3 | 1.07 | 1.40 | 0.73 | 1.13 | 0.60 | 0.74 | 0.57 | 0.63 | 1.21 | 0.79 | 0.61 | 1.39 | 0.88 | 0.88 | 0.20 | 0.12 | 0.12 | 0.44 |
| Cr2O3 | bdl | 0.05 | 0.04 | 0.02 | 0.06 | 0.05 | 0.02 | 0.06 | 0.04 | 0.05 | 0.01 | 0.01 | bdl | 0.05 | bdl | bdl | bdl | bdl |
| BeO | 13.65 | 13.51 | 13.94 | 13.72 | 13.55 | 13.77 | 13.65 | 13.71 | 13.59 | 13.40 | 13.46 | 13.31 | 13.88 | 13.67 | 13.87 | 13.66 | 13.58 | 13.85 |
| MgO a | 1.08 | 1.08 | 1.19 | 1.19 | 1.03 | 1.03 | 1.58 | 1.58 | 0.95 | 0.95 | 1.22 | 1.22 | 1.47 | 1.47 | 1.49 | 1.19 | 1.19 | 1.05 |
| CaO | 0.01 | bdl | bdl | 0.03 | 0.01 | bdl | 0.04 | bdl | bdl | 0.04 | bdl | 0.04 | bdl | 0.03 | 0.03 | bdl | bdl | 0.03 |
| MnO | bdl | bdl | bdl | bdl | bdl | 0.03 | 0.02 | 0.04 | bdl | bdl | bdl | bdl | bdl | bdl | 0.04 | bdl | 0.03 | 0.02 |
| FeO | 0.49 | 0.50 | 0.30 | 0.42 | 0.51 | 0.46 | 0.47 | 0.47 | 0.42 | 0.52 | 0.28 | 0.85 | 0.39 | 0.53 | 0.26 | 0.16 | 0.12 | 0.47 |
| NiO | bdl | bdl | bdl | bdl | 0.07 | bdl | 0.03 | 0.01 | bdl | 0.10 | 0.02 | bdl | bdl | bdl | bdl | bdl | bdl | 0.04 |
| CoO | 0.04 | 0.03 | 0.01 | 0.01 | 0.01 | 0.05 | bdl | bdl | 0.03 | bdl | bdl | bdl | bdl | 0.05 | bdl | 0.08 | bdl | bdl |
| Na2O | 0.55 | 0.56 | 0.70 | 0.98 | 1.68 | 1.71 | 1.00 | 1.01 | 0.93 | 1.22 | 0.93 | 1.03 | 0.78 | 0.99 | 0.82 | 0.41 | 0.49 | 1.46 |
| K2O | 0.03 | 0.02 | 0.02 | 0.01 | 0.03 | 0.03 | 0.03 | 0.02 | bdl | 0.07 | 0.03 | 0.05 | 0.02 | 0.04 | 0.02 | 0.02 | 0.01 | 0.05 |
| Li2O a | 0.09 | 0.09 | 0.09 | 0.09 | 0.10 | 0.10 | 0.07 | 0.07 | 0.11 | 0.11 | 0.05 | 0.05 | 0.08 | 0.08 | 0.07 | 0.11 | 0.11 | 0.07 |
| Cs2O | 0.18 | 0.10 | 0.12 | 0.23 | 0.26 | 0.20 | 0.12 | 0.22 | 0.16 | 0.20 | 0.06 | 0.29 | 0.13 | 0.30 | 0.07 | 0.05 | 0.07 | 0.10 |
| H2O b | 1.87 | 1.88 | 2.00 | 2.18 | 2.47 | 2.48 | 2.19 | 2.19 | 2.15 | 2.30 | 2.15 | 2.20 | 2.05 | 2.18 | 2.08 | 1.70 | 1.80 | 2.39 |
| Total | 98.92 | 98.47 | 101.85 | 100.52 | 99.04 | 100.39 | 100.10 | 100.45 | 98.97 | 97.67 | 97.80 | 96.46 | 101.81 | 99.83 | 100.52 | 98.66 | 98.07 | 100.70 |
| Sample | Dayakou Emerald (YE) | |||||||||||||||||
| 10-1 | 10-2 | 11-1 | 11-2 | 12-1 | 12-2 | 13-1 | 13-2 | 15-1 | 15-2 | 16-1 | 16-2 | 19-1 | 19-2 | 21-2 | 22-1 | 22-2 | 24-1 | |
| apfu | ||||||||||||||||||
| Si4+ | 6.000 | 6.000 | 6.000 | 6.000 | 6.000 | 6.000 | 6.000 | 6.000 | 6.000 | 6.000 | 6.000 | 6.000 | 6.000 | 6.000 | 6.000 | 6.000 | 6.000 | 6.000 |
| Al3+ | 1.649 | 1.670 | 1.778 | 1.702 | 1.628 | 1.609 | 1.747 | 1.722 | 1.641 | 1.617 | 1.745 | 1.525 | 1.761 | 1.647 | 1.734 | 1.738 | 1.737 | 1.685 |
| Ti4+ | bdl | bdl | 0.003 | bdl | 0.004 | 0.003 | bdl | 0.001 | bdl | 0.003 | bdl | 0.003 | 0.008 | bdl | 0.001 | bdl | bdl | 0.003 |
| Sc3+ | 0.002 | bdl | bdl | 0.001 | bdl | 0.001 | 0.002 | 0.004 | 0.002 | bdl | bdl | bdl | 0.001 | bdl | bdl | bdl | bdl | bdl |
| V3+ | 0.078 | 0.103 | 0.052 | 0.082 | 0.044 | 0.053 | 0.041 | 0.046 | 0.088 | 0.058 | 0.045 | 0.104 | 0.063 | 0.064 | 0.014 | 0.009 | 0.009 | 0.032 |
| Cr3+ | bdl | 0.004 | 0.003 | 0.001 | 0.004 | 0.004 | 0.001 | 0.004 | 0.003 | 0.004 | 0.001 | 0.001 | bdl | 0.004 | bdl | bdl | bdl | bdl |
| Mg2+ | 0.146 | 0.147 | 0.157 | 0.160 | 0.140 | 0.138 | 0.214 | 0.213 | 0.128 | 0.130 | 0.168 | 0.170 | 0.195 | 0.198 | 0.198 | 0.160 | 0.161 | 0.140 |
| Mn2+ | bdl | bdl | bdl | bdl | bdl | 0.002 | 0.002 | 0.003 | bdl | bdl | bdl | bdl | bdl | bdl | 0.003 | bdl | 0.002 | 0.002 |
| Fe2+ | 0.037 | 0.038 | 0.022 | 0.032 | 0.039 | 0.034 | 0.036 | 0.036 | 0.032 | 0.040 | 0.022 | 0.066 | 0.029 | 0.040 | 0.019 | 0.012 | 0.009 | 0.035 |
| Ni2+ | bdl | bdl | bdl | bdl | 0.005 | bdl | 0.002 | 0.001 | bdl | 0.007 | 0.001 | bdl | bdl | bdl | bdl | bdl | bdl | 0.003 |
| Co2+ | 0.003 | 0.002 | 0.001 | 0.001 | 0.001 | 0.004 | bdl | bdl | 0.002 | bdl | bdl | bdl | bdl | 0.004 | bdl | 0.006 | bdl | bdl |
| Y tot | 1.915 | 1.964 | 2.016 | 1.979 | 1.865 | 1.848 | 2.045 | 2.030 | 1.896 | 1.859 | 1.982 | 1.869 | 2.057 | 1.957 | 1.969 | 1.925 | 1.918 | 1.900 |
| Y sub | 0.266 | 0.294 | 0.238 | 0.277 | 0.237 | 0.239 | 0.298 | 0.308 | 0.255 | 0.242 | 0.237 | 0.344 | 0.296 | 0.310 | 0.235 | 0.187 | 0.181 | 0.215 |
| RD | 13.90% | 15.00% | 11.80% | 14.00% | 12.70% | 12.90% | 14.60% | 15.20% | 13.50% | 13.00% | 12.00% | 18.40% | 14.40% | 15.80% | 11.90% | 9.70% | 9.40% | 11.30% |
| OR2+ | 0.186 | 0.187 | 0.180 | 0.193 | 0.185 | 0.178 | 0.254 | 0.253 | 0.162 | 0.177 | 0.191 | 0.236 | 0.224 | 0.242 | 0.220 | 0.178 | 0.172 | 0.180 |
| Be2+ | 2.967 | 2.967 | 2.968 | 2.967 | 2.963 | 2.964 | 2.974 | 2.975 | 2.960 | 2.959 | 2.981 | 2.981 | 2.971 | 2.971 | 2.975 | 2.960 | 2.960 | 2.975 |
| Ca2+ | 0.001 | bdl | bdl | 0.003 | 0.001 | bdl | 0.004 | bdl | bdl | 0.004 | bdl | 0.004 | bdl | 0.003 | 0.003 | bdl | bdl | 0.003 |
| Na+ | 0.097 | 0.099 | 0.120 | 0.171 | 0.297 | 0.297 | 0.176 | 0.177 | 0.164 | 0.218 | 0.166 | 0.186 | 0.135 | 0.174 | 0.142 | 0.072 | 0.086 | 0.253 |
| K+ | 0.003 | 0.002 | 0.002 | 0.001 | 0.003 | 0.003 | 0.003 | 0.002 | bdl | 0.008 | 0.004 | 0.006 | 0.002 | 0.005 | 0.002 | 0.002 | 0.001 | 0.006 |
| Cs+ | 0.007 | 0.004 | 0.005 | 0.009 | 0.010 | 0.008 | 0.005 | 0.008 | 0.006 | 0.008 | 0.002 | 0.012 | 0.005 | 0.012 | 0.003 | 0.002 | 0.003 | 0.004 |
| CA+ | 0.140 | 0.138 | 0.159 | 0.214 | 0.347 | 0.344 | 0.210 | 0.212 | 0.210 | 0.275 | 0.191 | 0.223 | 0.171 | 0.220 | 0.172 | 0.116 | 0.130 | 0.288 |
| Sample | Dayakou Emerald (YE) | Color Zonation of YE-6 | Tourmalines in YE-6 | |||||||||||||||
| 24-2 | 26-1 | 26-2 | 29-1 | 29-2 | 6-1 | 6-2 | 6-3 | 6-4 | 6-5 | 6-6 | 6-7 | 6-8 | T-1 | T-2 | T-3 | T-4 | ||
| SiO2 (wt.%) | 67.44 | 66.53 | 66.38 | 64.13 | 66.14 | 66.14 | 66.83 | 67.22 | 66.94 | 66.85 | 66.82 | 67.43 | 67.04 | SiO2(wt.%) | 38.23 | 37.58 | 37.90 | 37.46 |
| TiO2 | bdl | bdl | bdl | 0.06 | bdl | 0.06 | 0.04 | bdl | bdl | bdl | bdl | 0.06 | bdl | TiO2 | 0.00 | 0.09 | 0.09 | 0.06 |
| Al2O3 | 16.39 | 16.95 | 16.61 | 15.75 | 16.17 | 15.04 | 15.86 | 16.51 | 16.94 | 16.92 | 16.84 | 16.13 | 14.88 | Al2O3 | 31.19 | 28.48 | 29.41 | 27.61 |
| Sc2O3 | 0.01 | 0.02 | 0.01 | 0.02 | bdl | bdl | bdl | 0.04 | 0.01 | bdl | 0.01 | 0.02 | bdl | Sc2O3 | 0.00 | 0.00 | 0.00 | 0.00 |
| V2O3 | 0.37 | 0.43 | 0.19 | 0.74 | 0.74 | 0.84 | 1.31 | 0.80 | 0.22 | 0.27 | 0.24 | 1.02 | 0.93 | V2O3 | 3.38 | 3.55 | 2.92 | 3.87 |
| Cr2O3 | 0.02 | 0.01 | 0.01 | 0.01 | bdl | 0.02 | 0.07 | 0.01 | bdl | bdl | 0.01 | 0.03 | 0.03 | Cr2O3 | 0.06 | 0.09 | 0.03 | 0.11 |
| BeO | 13.92 | 13.73 | 13.70 | 13.24 | 13.65 | 13.65 | 13.83 | 13.85 | 13.80 | 13.75 | 13.76 | 13.94 | 13.96 | MgO | 5.39 | 1.51 | 1.49 | 6.78 |
| MgO a | 1.05 | 0.98 | 0.98 | 0.81 | 0.81 | 0.64 | 0.75 | 0.78 | 0.78 | 0.72 | 0.66 | 0.65 | nd | CaO | 0.31 | 1.18 | 0.89 | 1.32 |
| CaO | bdl | 0.01 | 0.03 | 0.02 | 0.02 | 0.03 | bdl | bdl | 0.01 | bdl | bdl | bdl | 0.04 | MnO | 0.08 | 0.03 | 0.07 | 0.10 |
| MnO | bdl | bdl | 0.02 | bdl | 0.03 | bdl | bdl | bdl | bdl | 0.03 | bdl | bdl | bdl | FeO | 7.33 | 7.13 | 6.75 | 7.36 |
| FeO | 0.39 | 0.30 | 0.25 | 0.38 | 0.46 | 0.69 | 0.43 | 0.45 | 0.30 | 0.28 | 0.27 | 0.45 | 0.64 | NiO | 0.04 | 0.02 | 0.02 | 0.03 |
| NiO | 0.03 | 0.01 | 0.04 | 0.04 | bdl | bdl | bdl | 0.01 | bdl | bdl | bdl | 0.01 | 0.04 | CoO | 0.02 | 0.05 | 0.00 | 0.03 |
| CoO | 0.01 | bdl | 0.05 | bdl | bdl | bdl | bdl | 0.03 | bdl | 0.02 | 0.06 | bdl | bdl | Na2O | 2.08 | 2.34 | 2.60 | 2.33 |
| Na2O | 1.35 | 0.77 | 1.18 | 0.83 | 0.91 | 0.95 | 0.82 | 0.83 | 0.83 | 0.78 | 0.76 | 0.68 | 0.76 | K2O | 0.02 | 0.05 | 0.06 | 0.23 |
| K2O | 0.02 | bdl | 0.03 | 0.02 | 0.02 | 0.04 | 0.03 | 0.01 | 0.03 | 0.01 | 0.02 | 0.03 | 0.02 | Cs2O | 0.01 | 0.00 | 0.00 | 0.00 |
| Li2O a | 0.07 | 0.07 | 0.07 | 0.07 | 0.07 | 0.07 | 0.05 | 0.09 | 0.08 | 0.10 | 0.09 | 0.06 | nd | |||||
| Cs2O | 0.13 | 0.15 | 0.15 | 0.25 | 0.24 | 0.40 | 0.20 | 0.15 | 0.07 | 0.11 | 0.12 | 0.22 | 0.31 | H2Oc | 2.99 | 2.91 | 2.93 | 3.14 |
| H2O b | 2.35 | 2.05 | 2.28 | 2.08 | 2.13 | 2.16 | 2.08 | 2.08 | 2.08 | 2.06 | 2.04 | 1.97 | 2.04 | B2O3c | 10.94 | 10.75 | 10.84 | 10.72 |
| Total | 101.20 | 99.96 | 99.70 | 96.37 | 99.26 | 98.57 | 100.22 | 100.78 | 100.01 | 99.84 | 99.66 | 100.73 | 98.65 | Total | 102.07 | 95.76 | 96.00 | 101.15 |
| Sample | Dayakou Emerald (YE) | Color Zonation of YE-6 | Tourmalines in YE-6 | |||||||||||||||
| 24-2 | 26-1 | 26-2 | 29-1 | 29-2 | 6-1 | 6-2 | 6-3 | 6-4 | 6-5 | 6-6 | 6-7 | 6-8 | T-1 | T-2 | T-3 | T-4 | ||
| apfu | apfu | |||||||||||||||||
| Si4+ | 6.000 | 6.000 | 6.000 | 6.000 | 6.000 | 6.000 | 6.000 | 6.000 | 6.000 | 6.000 | 6.000 | 6.000 | 6.000 | B3+ | 2.965 | 2.869 | 2.867 | 2.959 |
| Al3+ | 1.719 | 1.802 | 1.769 | 1.737 | 1.729 | 1.608 | 1.678 | 1.737 | 1.790 | 1.790 | 1.782 | 1.692 | 1.570 | TSi4+ | 6.000 | 6.000 | 6.000 | 6.000 |
| Ti4+ | bdl | bdl | bdl | 0.004 | bdl | 0.004 | 0.003 | bdl | bdl | bdl | bdl | 0.004 | bdl | ZAl3+ | 5.770 | 5.359 | 5.487 | 5.213 |
| Sc3+ | 0.001 | 0.002 | 0.001 | 0.002 | bdl | bdl | bdl | 0.003 | 0.001 | bdl | 0.001 | 0.002 | bdl | ZV3+ | 0.222 | 0.455 | 0.371 | 0.497 |
| V3+ | 0.026 | 0.031 | 0.014 | 0.056 | 0.054 | 0.061 | 0.094 | 0.057 | 0.016 | 0.019 | 0.017 | 0.073 | 0.067 | ZCr3+ | 0.008 | 0.011 | 0.004 | 0.014 |
| Cr3+ | 0.001 | 0.001 | 0.001 | 0.001 | bdl | 0.001 | 0.005 | 0.001 | bdl | bdl | 0.001 | 0.002 | 0.002 | ZMg2+ | 0.000 | 0.175 | 0.137 | 0.277 |
| Mg2+ | 0.139 | 0.132 | 0.132 | 0.113 | 0.110 | 0.087 | 0.100 | 0.104 | 0.104 | 0.096 | 0.088 | 0.086 | bdl | YAl3+ | 0.000 | 0.000 | 0.000 | 0.000 |
| Mn2+ | bdl | bdl | 0.002 | bdl | 0.002 | bdl | bdl | bdl | bdl | 0.002 | bdl | bdl | bdl | YTi4+ | 0.000 | 0.011 | 0.011 | 0.007 |
| Fe2+ | 0.029 | 0.023 | 0.019 | 0.030 | 0.035 | 0.052 | 0.032 | 0.034 | 0.022 | 0.021 | 0.020 | 0.033 | 0.048 | YV3+ | 0.203 | 0.000 | 0.000 | 0.000 |
| Ni2+ | 0.002 | 0.001 | 0.003 | 0.003 | bdl | bdl | bdl | 0.001 | bdl | bdl | bdl | 0.001 | 0.003 | YCr3+ | 0.000 | 0.000 | 0.000 | 0.000 |
| Co2+ | 0.001 | bdl | 0.004 | bdl | bdl | bdl | bdl | 0.002 | bdl | 0.001 | 0.004 | bdl | bdl | YMg2+ | 1.262 | 0.184 | 0.215 | 1.342 |
| Y tot | 1.918 | 1.992 | 1.945 | 1.946 | 1.930 | 1.814 | 1.912 | 1.939 | 1.933 | 1.929 | 1.913 | 1.893 | 1.690 | YMn2+ | 0.010 | 0.004 | 0.009 | 0.014 |
| Y sub | 0.199 | 0.190 | 0.176 | 0.209 | 0.201 | 0.206 | 0.234 | 0.202 | 0.143 | 0.139 | 0.131 | 0.201 | 0.120 | YFe2+ | 0.962 | 0.952 | 0.894 | 0.986 |
| R D | 10.40% | 9.50% | 9.10% | 10.70% | 10.40% | 11.40% | 12.20% | 10.40% | 7.40% | 7.20% | 6.90% | 10.60% | 7.10% | YNi2+ | 0.005 | 0.003 | 0.002 | 0.004 |
| OR2+ | 0.171 | 0.156 | 0.160 | 0.146 | 0.147 | 0.139 | 0.132 | 0.141 | 0.126 | 0.120 | 0.112 | 0.120 | 0.051 | YCo2+ | 0.002 | 0.006 | 0.000 | 0.004 |
| XCa2+ | 0.052 | 0.202 | 0.150 | 0.226 | ||||||||||||||
| Be2+ | 2.975 | 2.975 | 2.975 | 2.974 | 2.974 | 2.975 | 2.982 | 2.968 | 2.971 | 2.964 | 2.967 | 2.979 | 3.000 | XNa+ | 0.634 | 0.725 | 0.798 | 0.723 |
| Ca2+ | bdl | 0.001 | 0.003 | 0.002 | 0.002 | 0.003 | bdl | bdl | 0.001 | bdl | bdl | bdl | 0.004 | XK+ | 0.005 | 0.009 | 0.012 | 0.047 |
| Na+ | 0.233 | 0.135 | 0.207 | 0.151 | 0.160 | 0.167 | 0.143 | 0.144 | 0.144 | 0.136 | 0.132 | 0.117 | 0.132 | VOH | 3.000 | 3.000 | 3.000 | 3.000 |
| K+ | 0.002 | bdl | 0.003 | 0.002 | 0.002 | 0.005 | 0.003 | 0.001 | 0.003 | 0.001 | 0.002 | 0.003 | 0.002 | WOH | 0.136 | 0.097 | 0.091 | 0.353 |
| Cs+ | 0.005 | 0.006 | 0.006 | 0.010 | 0.009 | 0.016 | 0.008 | 0.006 | 0.003 | 0.004 | 0.005 | 0.008 | 0.012 | WO | 0.864 | 0.903 | 0.909 | 0.647 |
| CA+ | 0.265 | 0.166 | 0.241 | 0.189 | 0.197 | 0.213 | 0.172 | 0.183 | 0.179 | 0.177 | 0.172 | 0.149 | 0.146 | |||||
Compositions of emeralds were recalculated on the basis of Si = 6 and Be = 3 − Li. nd = not determined; apfu = atoms per formula units; Y tot = total atoms of Ysite; Ysub = total atoms of Ysite substitutions; RD = replace degree of Y site; OR2+ = atoms of octahedral (Y site) divalent cations; CA+ = atoms of Channel monovalent alkali cations. Compositions of tourmalines were recalculated on the basis of Si = 6. a Oxides recalculated from LA-ICP-MS data. b Calculated using H2O = 0.5401 ln Na2O + 2.1867 [18]. c Stoichiometric estimation of H2O (wt.%) and B2O3 (wt.%) for tourmalines. bdl = below detection limit.
Table 2.
Trace element compositions of emerald samples from Dayakou occurrence analyzed by LA-ICP-MS (in ppm).
Table 2.
Trace element compositions of emerald samples from Dayakou occurrence analyzed by LA-ICP-MS (in ppm).
| Sample | Dayakou Emerald (YE) | ||||||||||||||||||||
|---|---|---|---|---|---|---|---|---|---|---|---|---|---|---|---|---|---|---|---|---|---|
| YE-1 | YE-2 | YE-3 | YE-4 | YE-5 | YE-6 | YE-7 | YE-8 | YE-9 | YE-10 | YE-11 | YE-12 | YE-13 | YE-14 | YE-15 | YE-16 | YE-17 | YE-18 | YE-19 | YE-20 | YE-21 | |
| Li | 432 | 325 | 268 | 263 | 318 | 359 | 270 | 332 | 505 | 431 | 409 | 446 | 324 | 531 | 508 | 224 | 374 | 376 | 390 | 287 | 315 |
| B | 6.8 | 6.0 | 2.4 | 5.5 | 5.4 | 38.8 | bdl | 5.0 | 10.1 | 16.8 | 15.0 | 3.7 | bdl | 4.7 | 35.4 | 5.4 | bdl | 4.7 | 199.6 | bdl | 3.2 |
| Na | 7894 | 6398 | 6351 | 9558 | 9079 | 10,278 | 6585 | 9092 | 9173 | 9822 | 10,289 | 9816 | 11,345 | 8397 | 7877 | 9228 | 7049 | 7423 | 11,281 | 9358 | 10,403 |
| Mg | 5705 | 4799 | 4696 | 7781 | 7131 | 8465 | 4603 | 7380 | 7126 | 6510 | 7182 | 6186 | 9495 | 5655 | 5739 | 7382 | 4372 | 5256 | 8882 | 6847 | 9000 |
| P | 43.2 | 196 | 94.1 | 87.6 | 113 | 75.2 | 89.0 | 106 | 211 | 107 | 125 | 70.9 | 234 | 81.7 | 105 | 47.1 | 105 | 135 | 93.8 | 68.2 | 119 |
| K | bdl | 119 | 321 | 198 | 426 | 307 | 307 | 418 | 478 | 350 | 425 | 356 | 77.5 | 199 | 109 | 144 | 756 | 227 | 89.1 | 34.4 | 107 |
| Ca | bdl | 5410 | 396 | 194 | 4519 | 354 | bdl | 1618 | 542 | 13424 | bdl | 1256 | 331 | 2014 | 209 | bdl | 5647 | 688 | bdl | bdl | bdl |
| Sc | 61.6 | 50.9 | 40.0 | 79.2 | 46.0 | 9.3 | 31.9 | 45.1 | 63.4 | 54.2 | 58.8 | 64.2 | 34.7 | 64.9 | 67.8 | 42.9 | 77.2 | 58.9 | 15.6 | 159 | 13.8 |
| Ti | 38.1 | 56.6 | 46.9 | 56.6 | 90.2 | 58.0 | 66.9 | 210 | 91.1 | 103 | 65.7 | 117 | 26.7 | bdl | 44.3 | 52.5 | bdl | 32.7 | 54.8 | 22.3 | 45.6 |
| V | 894 | 708 | 2785 | 5884 | 6265 | 3505 | 2769 | 5023 | 5566 | 4499 | 5283 | 3902 | 3285 | 2190 | 5198 | 6933 | 3242 | 3452 | 3437 | 6345 | 3045 |
| Cr | 21.2 | 60.3 | 15.2 | 2.7 | 16.3 | bdl | 32.1 | 89.5 | 18.8 | 58.4 | 20.7 | 21.5 | 71.9 | 98.5 | 153 | bdl | 85.5 | 2.5 | 4.6 | 1008 | bdl |
| Mn | 74.1 | 143 | 132 | 70.9 | 66.9 | 65.7 | 55.1 | 89.7 | 81.7 | 73.9 | 98.1 | 51.8 | 78.3 | 50.2 | 108 | 80.4 | 57.4 | 58.2 | 62.2 | 71.3 | 66.4 |
| Fe | 2568 | 2590 | 7861 | 3998 | 3809 | 3595 | 2561 | 4329 | 4594 | 4192 | 3581 | 2987 | 4081 | 4406 | 7649 | 3829 | 3011 | 2814 | 3115 | 2928 | 2961 |
| Zn | 16.5 | 27.1 | 281 | 50.7 | 111 | 98.2 | 53.8 | 163 | 245 | 176 | 241 | 84.2 | 92.2 | 96.1 | 482 | 90.2 | 68.5 | 69.2 | 55.0 | 36.4 | 31.8 |
| Ga | 7.6 | 9.3 | 12.6 | 10.1 | 11.5 | 8.0 | 12.2 | 11.2 | 10.9 | 9.1 | 11.3 | 11.0 | 7.4 | 10.4 | 11.4 | 12.7 | 13.8 | 14.0 | 6.5 | 10.6 | 6.5 |
| As | bdl | bdl | 909 | 26.4 | 49.2 | 31.4 | 6.5 | 48.1 | 157 | 175 | 33.9 | 48.3 | 217 | 234 | 623 | 7.6 | 12.5 | 25.8 | bdl | 6.7 | bdl |
| Rb | 9.9 | 17.1 | 22.1 | 27.5 | 32.3 | 22.4 | 21.5 | 39.4 | 17.8 | 18.2 | 29.5 | 16.2 | 29.5 | 16.0 | 18.3 | 56.3 | 16.7 | 18.7 | 24.4 | 25.8 | 23.1 |
| Sr | bdl | 4.2 | 7.1 | 1.5 | 5.2 | 1.6 | bdl | 3.2 | 5.1 | 7.4 | 2.3 | 4.2 | 1.3 | 2.7 | 3.2 | bdl | 8.1 | 1.5 | 3.2 | bdl | bdl |
| Y | 72.07 | 0.35 | 11.46 | 0.49 | 0.95 | 0.51 | bdl | 0.73 | 2.46 | 1.90 | 0.61 | 1.09 | 2.10 | 3.53 | 6.66 | 0.06 | 4.27 | 0.30 | bdl | 1.04 | 0.32 |
| Zr | bdl | bdl | bdl | 0.144 | 0.155 | bdl | bdl | 0.705 | 0.566 | bdl | bdl | bdl | bdl | bdl | bdl | bdl | bdl | 0.685 | bdl | bdl | bdl |
| Sn | 0.86 | 2.40 | 5.05 | 3.50 | 11.76 | 5.32 | 1.64 | 12.42 | 14.24 | 19.22 | 11.31 | 11.05 | 5.71 | 7.66 | 6.26 | 12.98 | 2.63 | 3.39 | 2.08 | 1.39 | 2.60 |
| Cs | 1164 | 1311 | 1533 | 2056 | 2594 | 1969 | 1527 | 2315 | 1497 | 1268 | 2163 | 1100 | 1939 | 971 | 1831 | 3936 | 1568 | 1520 | 2218 | 1766 | 2423 |
| Ba | bdl | 2.6 | 31.1 | 16.9 | 28.5 | 32.5 | 0.7 | 12.3 | 39.9 | 76.4 | 8.0 | 56.1 | 9.3 | 21.3 | 11.0 | bdl | 205.9 | bdl | 1.5 | bdl | 2.7 |
| Hf | bdl | 0.206 | bdl | bdl | bdl | bdl | bdl | bdl | bdl | 0.118 | bdl | bdl | bdl | 0.085 | bdl | bdl | bdl | bdl | bdl | bdl | bdl |
| W | 2.8 | 7.5 | 112 | 15.4 | 27.6 | 35.8 | 0.2 | 39.1 | 245 | 510 | 104 | 277 | 65.0 | 213 | 809 | 0.3 | 77.0 | 7.0 | 2.9 | 2.4 | 5.1 |
| Bi | bdl | bdl | 1.55 | 0.21 | 0.29 | 0.19 | bdl | 0.26 | 2.09 | 2.03 | 0.80 | 0.31 | 0.51 | 0.55 | 12.20 | bdl | bdl | bdl | bdl | 0.36 | bdl |
| Pb | 1.2 | 0.5 | 22.4 | 7.1 | 8.5 | 4.3 | 0.2 | 5.5 | 22.5 | 24.0 | 19.0 | 12.4 | 30.4 | 16.9 | 56.7 | bdl | 3.6 | 1.4 | 1.4 | 0.6 | 0.9 |
| Th | bdl | bdl | bdl | bdl | bdl | bdl | bdl | bdl | 0.133 | 0.184 | 0.092 | 0.119 | 0.020 | 0.061 | 0.057 | bdl | 0.063 | bdl | bdl | bdl | bdl |
| U | 0.389 | 0.077 | 5.291 | 0.374 | 0.499 | 0.177 | bdl | 0.310 | 3.287 | 0.703 | 0.394 | 0.602 | 0.536 | 3.061 | 3.309 | bdl | 0.319 | 0.066 | 0.072 | bdl | bdl |
| Sample | Dayakou Emerald (YE) | Color Zonation of YE-6 | |||||||||||||||||||
| YE-22 | YE-23 | YE-24 | YE-25 | YE-26 | YE-27 | YE-28 | YE-29 | YE-30 | YE-31 | YE-32 | YE-33 | YE-34 | YE-6-1 | YE-6-2 | YE-6-3 | YE-6-4 | YE-6-5 | YE-6-6 | YE-6-7 | ||
| Li | 504 | 255 | 347 | 278 | 303 | 333 | 307 | 338 | 432 | 295 | 296 | 302 | 364 | 306 | 237 | 426 | 394 | 471 | 410 | 268 | |
| B | 4.9 | bdl | 2.6 | bdl | 1.1 | 2.6 | bdl | 2.5 | 1.2 | 1.0 | bdl | bdl | 2.9 | 2.9 | 9.6 | 5.7 | 4.3 | 5.9 | 9.1 | bdl | |
| Na | 11,172 | 7015 | 9732 | 10,906 | 7169 | 6385 | 6438 | 7203 | 9157 | 5776 | 5710 | 5602 | 9764 | 6998 | 7067 | 8544 | 8021 | 7928 | 7474 | 6737 | |
| Mg | 7155 | 5916 | 6333 | 8819 | 5881 | 4366 | 4557 | 4894 | 6527 | 4039 | 4066 | 4054 | 7723 | 3850 | 4504 | 4672 | 4714 | 4321 | 3949 | 3917 | |
| P | 97.5 | bdl | 116 | 197 | 57.6 | 111 | 78.8 | 68.9 | 87.6 | 74.2 | 81.4 | 87.9 | 84.0 | 68.0 | 90.0 | 68.0 | 61.0 | 67.0 | 80.0 | 118 | |
| K | 230 | bdl | 202 | 50.7 | bdl | 178 | bdl | 89.3 | 55.9 | bdl | bdl | 23.2 | 39.1 | 26.6 | 42.3 | bdl | 15.8 | 22.4 | 11.9 | bdl | |
| Ca | 308 | bdl | 500 | bdl | bdl | 274 | bdl | bdl | bdl | bdl | bdl | bdl | 281 | bdl | bdl | bdl | bdl | bdl | bdl | bdl | |
| Sc | 27.3 | 51.3 | 98.8 | 9.6 | 70.7 | 97.0 | 35.0 | 92.3 | 97.4 | 106 | 23.2 | 40.9 | 56.5 | 147 | 100 | 31.9 | 15.8 | 32.1 | 52.4 | 70.9 | |
| Ti | 47.1 | bdl | 72.0 | 34.3 | 19.1 | 49.7 | 32.3 | 74.7 | 82.3 | 56.5 | 111 | 24.5 | 36.3 | 55.6 | 54.8 | 52.9 | 56.4 | 46.2 | 44.3 | 122 | |
| V | 2387 | 2951 | 6564 | 3031 | 2102 | 3071 | 2969 | 3693 | 1571 | 1986 | 1374 | 3074 | 7570 | 8960 | 10,077 | 1810 | 970 | 2104 | 2696 | 3243 | |
| Cr | 10.1 | 36.6 | 97.9 | 9.6 | 31.6 | 96.7 | 51.1 | 51.5 | 77.9 | 90.3 | 191 | 59.6 | 641 | 13.0 | 2.2 | 6.2 | 5.8 | 5.3 | 9.8 | 4.7 | |
| Mn | 51.5 | 50.5 | 68.6 | 66.4 | 71.0 | 55.1 | 58.8 | 52.8 | 92.1 | 50.3 | 53.1 | 51.1 | 55.5 | 55.7 | 59.5 | 25.2 | 24.0 | 29.9 | 32.6 | 55.6 | |
| Fe | 5124 | 2625 | 3919 | 3408 | 2554 | 3308 | 2356 | 2254 | 2518 | 2586 | 2167 | 2381 | 2595 | 2043 | 2069 | 1425 | 1376 | 1481 | 1401 | 2199 | |
| Zn | 794 | bdl | 164 | 47.1 | 37.1 | 53.3 | 72.1 | 44.4 | 25.4 | 47.7 | 40.3 | 48.8 | 102 | 104 | 51.1 | 38.7 | 48.2 | 60.3 | 67.9 | 56.3 | |
| Ga | 10.1 | 6.9 | 11.8 | 5.7 | 10.5 | 10.7 | 11.5 | 12.9 | 9.9 | 14.1 | 12.3 | 12.4 | 9.0 | 14.7 | 11.3 | 5.2 | 4.0 | 6.3 | 11.3 | 11.5 | |
| As | 22.6 | bdl | 275 | bdl | bdl | 46.2 | 18.7 | bdl | bdl | 6.2 | bdl | 24.7 | bdl | 19.8 | bdl | bdl | 19.7 | 3.8 | 5.3 | bdl | |
| Rb | 21.1 | bdl | 24.1 | 23.8 | 24.0 | 21.6 | 21.6 | 22.9 | 18.1 | 21.2 | 21.4 | 19.0 | 16.3 | 24.1 | 26.2 | 10.3 | 9.6 | 12.2 | 12.9 | 27.4 | |
| Sr | 2.0 | bdl | 7.4 | 0.6 | bdl | 1.2 | bdl | 0.3 | 0.8 | 0.6 | bdl | bdl | 1.3 | bdl | 0.4 | 0.1 | 0.3 | 0.5 | 1.3 | bdl | |
| Y | 0.83 | bdl | 6.67 | bdl | 0.10 | 0.66 | 0.22 | 0.12 | 17.98 | 0.11 | 0.11 | 0.17 | 0.40 | bdl | bdl | bdl | bdl | bdl | bdl | bdl | |
| Zr | bdl | bdl | 0.362 | bdl | bdl | bdl | bdl | bdl | bdl | bdl | bdl | bdl | bdl | 0.091 | 0.052 | 0.158 | 0.124 | 0.190 | bdl | 0.648 | |
| Sn | 16.45 | bdl | 7.20 | 1.04 | 0.57 | 7.49 | bdl | 2.97 | 0.73 | 4.42 | bdl | 1.76 | 1.79 | 2.63 | 1.04 | 0.12 | 1.63 | 0.41 | 1.40 | 1.96 | |
| Cs | 1866 | 1261 | 1968 | 1919 | 1778 | 1843 | 1480 | 1866 | 1220 | 1694 | 1567 | 1211 | 1108 | 3108 | 2190 | 647 | 535 | 664 | 653 | 1392 | |
| Ba | 5.9 | 27.9 | 14.6 | bdl | bdl | bdl | 2.3 | bdl | bdl | 2.5 | bdl | 1.7 | 11.5 | 0.9 | bdl | bdl | bdl | bdl | 3.1 | 1.0 | |
| Hf | bdl | bdl | bdl | bdl | bdl | bdl | 0.161 | bdl | bdl | bdl | bdl | 0.060 | bdl | 0.084 | bdl | 0.055 | bdl | 0.024 | bdl | 0.078 | |
| W | 43.7 | 96.5 | 158 | 2.0 | 1.6 | 44.0 | 2.4 | 0.1 | 1.1 | 2.0 | 0.7 | 2.4 | 1.8 | 2.0 | 0.1 | 0.1 | 1.6 | 0.2 | bdl | bdl | |
| Bi | 0.47 | bdl | 1.67 | bdl | bdl | 0.21 | bdl | bdl | 0.11 | 0.07 | bdl | 0.18 | 0.05 | 0.32 | bdl | 0.01 | 0.15 | 0.09 | bdl | bdl | |
| Pb | 7.9 | 2.2 | 18.2 | 1.5 | 0.1 | 9.7 | 1.4 | 0.2 | 0.7 | 1.5 | bdl | 2.0 | 0.4 | 2.4 | 0.2 | 0.1 | 10.1 | 0.3 | 0.7 | 0.4 | |
| Th | bdl | bdl | 0.076 | bdl | bdl | bdl | bdl | bdl | bdl | bdl | bdl | bdl | bdl | bdl | bdl | bdl | bdl | bdl | bdl | bdl | |
| U | 0.171 | 0.123 | 0.634 | bdl | bdl | 0.120 | 0.106 | bdl | 0.061 | 0.055 | bdl | 0.082 | 0.050 | 0.075 | bdl | bdl | 0.071 | 0.009 | 0.022 | bdl | |
Every datapoint is the average of three analyses; bdl = below detection limit.
Table 3.
Representative REE compositions of emerald samples from Dayakou occurrence analyzed by LA-ICP-MS (in ppm).
Table 3.
Representative REE compositions of emerald samples from Dayakou occurrence analyzed by LA-ICP-MS (in ppm).
| Element | YE-1-2 | YE-5-2 | YE-9 a | YE-15-2 |
|---|---|---|---|---|
| La | 2.41 | 6.00 | 1.39 | 12.05 |
| Ce | 2.85 | 2.05 | 0.48 | 2.21 |
| Pr | 4.37 | 0.54 | 0.19 | 1.88 |
| Nd | 9.54 | 3.24 | 1.22 | 14.21 |
| Sm | 2.97 | 0.53 | 0.18 | 1.93 |
| Eu | 0.86 | 0.10 | 0.03 | 0.30 |
| Gd | 4.43 | 1.55 | 0.25 | 2.29 |
| Tb | 1.47 | 0.20 | 0.13 | 0.32 |
| Dy | 6.54 | 0.37 | 0.41 | 2.34 |
| Ho | 1.07 | 0.13 | 0.12 | 0.50 |
| Er | 2.42 | 0.38 | 0.25 | 1.18 |
| Tm | 0.43 | 0.05 | 0.08 | 0.18 |
| Yb | 4.76 | 0.32 | 0.18 | 0.67 |
| Lu | 0.71 | 0.08 | 0.11 | 0.14 |
| TREE | 44.84 | 15.52 | 5.03 | 40.20 |
| LREE | 23.00 | 12.45 | 3.50 | 32.59 |
| HREE | 21.84 | 3.07 | 1.53 | 7.61 |
| ∑Ce/∑Y | 1.05 | 4.06 | 2.28 | 4.28 |
| (La/Yb)N b | 0.34 | 12.92 | 5.20 | 12.17 |
| σEu c | 0.72 | 0.33 | 0.43 | 0.44 |
| σCe c | 0.70 | 0.14 | 0.16 | 0.17 |
a The REE data of YE-9 is the average of three analyses. b Normalized by C1-Chondrite values from [47]. c Eu anomaly (σEu) defined as σEu = Eu/ Eu* = EuN/(SmN × GdN)1/2; Ce anomaly (σCe) defined as σCe = Ce/Ce* = CeN/(LaN × PrN)1/2.
© 2019 by the authors. Licensee MDPI, Basel, Switzerland. This article is an open access article distributed under the terms and conditions of the Creative Commons Attribution (CC BY) license (http://creativecommons.org/licenses/by/4.0/).
Share and Cite
MDPI and ACS Style
Zheng, Y.; Yu, X.; Guo, H. Major and Trace Element Geochemistry of Dayakou Vanadium-Dominant Emerald from Malipo (Yunnan, China): Genetic Model and Geographic Origin Determination. Minerals 2019, 9, 777. https://doi.org/10.3390/min9120777
AMA Style
Zheng Y, Yu X, Guo H. Major and Trace Element Geochemistry of Dayakou Vanadium-Dominant Emerald from Malipo (Yunnan, China): Genetic Model and Geographic Origin Determination. Minerals. 2019; 9(12):777. https://doi.org/10.3390/min9120777
Chicago/Turabian StyleZheng, Yuyu, Xiaoyan Yu, and Hongshu Guo. 2019. "Major and Trace Element Geochemistry of Dayakou Vanadium-Dominant Emerald from Malipo (Yunnan, China): Genetic Model and Geographic Origin Determination" Minerals 9, no. 12: 777. https://doi.org/10.3390/min9120777
Note that from the first issue of 2016, this journal uses article numbers instead of page numbers. See further details here.