Lithochemical Stream Sediments of the Dukat Gold–Silver Ore-Forming System (North–East of Russia)


A.P. Vinogradov Institute of Geochemistry, Siberian Branch of the Russian Academy of Sciences, Favorskiy str 1A, 664033 Irkutsk, Russia
*
Author to whom correspondence should be addressed.
Minerals 2019, 9(12), 789; https://doi.org/10.3390/min9120789
Submission received: 11 October 2019
/
Revised: 4 December 2019
/
Accepted: 10 December 2019
/
Published: 14 December 2019
(This article belongs to the Section Mineral Geochemistry and Geochronology)
Abstract
:The composition, structure and formation features of the exogenous anomalous geochemical fields (AGFs) identified by lithochemical stream sediments (LSSs) are considered using the examples of the Dukat gold–silver ore-forming system and the deposit with the same name. The research was carried out in the Balygychan–Sugoy trough (Magadan region, north–east of Russia). Areal geochemical surveys on the 1:200,000 and 1:50,000 scales were conducted. Exogenous AGFs of basic element indicators of all known mineralization types were studied. It is shown that the surveys on the 1:200,000 scale are characterized by simplicity, relative depth and the possibility to obtain information operatively about the metallogeny of the area as a whole. At the same time, the anomalies were revealed as a result of surveys often making a relatively poor component composition and low contrast compared with ores. The violation of quantitative and sometimes qualitative relationships can be seen between elements, especially those related to gold–silver mineralization. In this situation, the most informative are surveys of LSSs on the 1:50,000 scale. The AGFs were revealed as a result of their performance to have a richer component composition and high contrast, conforming to different ore types. It is shown that, while prospecting for gold–silver mineralization with LSSs in cryolithogenesis zone conditions, the binding forms study of mineralization element indicators is effective. In watercourse heads, where alluvium is practically absent, mosses are proposed for sampling, as they hold the sandy silt material firmly. The obtained results are recommended for use at all stages of prospecting, not only in the north–east of Russia but also in other similar climatic regions.
1. Introduction
The Dukat gold–silver ore-forming system (OFS) is located in the north–east of Russian territory in the central part of the Balygychan–Sugoy trough (Omsukchan ore district, Magadan region). There are also unique silver reserves of the Dukat gold–silver deposit here as well as a number of smaller gold–silver (Au–Ag), silver–polymetallic (Ag–Pb) and tin–silver (Sn–Ag) deposits. The Omsukchan ore district is one of the largest in the Magadan region by the number of Au and Ag deposits, occupying the third position in gold reserves and the fourth place for silver among the Russian regions [1,2]. Only one Dukat deposit contains about 17 thousand tons of silver [3]. However, despite the fact that the Magadan region’s reserves of gold and silver occupy leading positions, the mineral raw material demand for the extraction of these noble metals is growing every year, and the number of easily discovered deposits in this territory is constantly decreasing. The problem of revaluating old deposits and identifying new ones is becoming real.
The growth in the world price for gold and silver is causing increased interest not only in large and medium-sized but also in small deposits. The main prospecting objects for mining and processing enterprises today are either relatively small deposits on the periphery of the already-known developed objects or deposits that are difficult to access, located in hard-to-reach areas and as a rule not outcropping [4,5,6,7,8]. Prospecting for such objects following traditional methods bears significant financial and labour costs and is often impossible.
A reliable basis for solving this problem is a complex of applied and fundamental research, including geochemical searching methods. It should be emphasized that the widespread use of geochemical methods in prospecting and exploring practice has led to the discovery of a significant number of deposits in recent decades. Accordingly, an important role in the prospecting for ore mineralization, in our case gold and silver deposits, is given to the study of exogenous anomalous geochemical fields (AGFs) identified during area surveys of lithochemical stream sediments (LSSs).
The first results of small-scale area surveys of stream sediments in the former USSR were published in [9,10,11]. Great contributions to the study of actual watercourses’ loose sediments (river stream sediments) and the development of a geochemical prospecting method based on LSSs in the USSR were made by major scientists such as A.P. Solovov and V.V. Polikarpochkin [12,13,14,15,16]. Further research continued with the work of their disciples and followers, for example [17,18,19,20,21,22,23,24,25,26,27,28,29,30]. Books of foreign scientists translated into Russian are very popular [31,32]. Their early publications on the study of stream sediments for the purpose of ore deposit prospecting can be referred to, for example, in [33,34,35,36,37,38,39,40,41,42] and, more recently, in [43,44,45,46,47,48,49,50,51,52,53,54,55].
During ore mineralization prospecting, traditional geochemical surveys of LSSs are almost a basic method, which allows the evaluation of considerable territories. The experience of such surveys performed in the Omsukchan district area—one of the Magadan region’s largest Au–Ag ore areas—has shown that, in periglacial areas in mountainous relief conditions, there are certain difficulties involved in lithochemical sampling. In cryogenesis zone conditions, in which the main process forming LSSs is physical weathering, river and stream heads are mainly made of highly washed coarse clastic sediments. Alluvial sediments are either absent or formed with a sharp deficit of sandy silt material, which is the concentrator of most ore elements. As a consequence, the negative traits of exogenous AGFs identified through LSSs are relatively poor component composition, low contrast and violation of the quantitative and sometimes qualitative relations between the elements [25,28,29,56]. As a result, it is difficult to typify the anomalies and, as a consequence, the relation to a certain type of mineralization and zonality identification—the main indicator in assessing the level of the ore zone’s erosion profile. It becomes obvious that LSSs formed in the conditions of cryolithogenesis zones need to be studied more thoroughly to develop new methods for effective ore mineralization prospecting, primarily for Au–Ag. This is especially true for well-studied territories where a significant amount of prospecting and appraisal works have already been undertaken. The central part of the Balygychan–Sugoy trough is just such a territory in the north–east of Russia, where the research was performed within the framework of the Dukat Au–Ag OFS and associated areas.
2. Study Areas: Geology, Ore Mineralization, Geography and Climate
2.1. Geological Setting
Structurally, the research area is located in the Okhotsk–Chukotka volcanic belt (OCVB) (Figure 1), which is the East Asian system’s largest element of marginal continental volcanoplutonic belts. The beginning of the belt development corresponds to the lower and middle Albian boundary. The upper age limit refers to the upper Cretaceous–Santonian or possibly to the Campanian beginning. The duration of the formation was approximately 25 million years [57,58,59]. According to V.F. Belyi [57], the flank and the inner and outer zones are distinguished in their composition. The most significant in size and length is the belt’s outer zone. Regarding its metallogenic aspect, it is categorized as an Au–Ag zone and divided into four sectors—Okhotsk, Penzhina, Anadyr and Central Chukotka. One of the largest linear structures of this zone in the Okhotsk sector is the Balygychan–Sugoy trough. It is confined to the large Omsukchan (Balygychan) deep fault. The trough’s construction involves a number of large volcano-tectonic structures (depressions), to which the regional ore systems are confined. The largest one here is the Dukat Au–Ag OFS. The OCVB and the Balygychan–Sugoy trough’s detailed structural, geological and metallogenic characteristics have been considered in several works, for example [3,57,58,59,60,61,62,63,64,65,66,67,68,69,70].
The Dukat Au–Ag OFS, located in the central part of the Balygychan–Sugoy trough, is a long-lived early Cretaceous volcano-tectonic depression [3]. Its folded base is composed of Upper Yana complex Triassic terrigenous rocks. The depression is made up of lower Cretaceous vulcanites of Askold suite rhyolite formation, which flank the coal-bearing lower Cretaceous molasse of the Omsukchan suite. The early Cretaceous rhyolite formation is represented mainly by ultra-acid effusive rocks with very high potassium alkalinity (rhyolites and rhyolitic ignimbrites) lying with a sharp angular unconformity on the rocks of the Upper Yana complex. The Omsukchan suite is represented by siltstone series, coal-bearing argillites, sandstones, gravelites and conglomerates and includes layers and lenses of coals. Late Cretaceous sediments (the overlaid part) are formed by effusive rocks of the Kakhovka lower–upper Cretaceous and Shorokh upper Cretaceous suites. Kakhovka suite vulcanites are represented by andesites and dacites. They rest with stratigraphic unconformity on the rocks of the Omsukchan suite. Shorokh suite vulcanites are represented by rhyolites and rhyolitic ignimbrites. Among the intrusive formations are early Cretaceous diorite porphyrites and subvolcanic rhyolites; late Cretaceous granites, granodiorites, diorites, quartz diorites, diorite porphyrites and gabbro; and late Cretaceous subvolcanic rhyolites, nevadites, felsites, andesites, diorite porphyritess and diorites (Figure 2).
2.2. Ore Mineralization
The zonal mineralization distribution is typical of the Dukat Au–Ag OFS. The central part is represented mainly by Au–Ag deposits and prospects, then Ag–Pb and, on the periphery, Sn–Ag. Outside the OFS, there is widely manifested tin (Sn), less tin–rare metal (Sn–W) and rare metal (Mo–W) mineralization (see Figure 2) [3,56,72,73,74,75,76,77,78].
Tin mineralization is not typical of the Dukat Au–Ag OFS; the Sn–W and Mo–W mineralization over its area is poorly developed. Spatially and genetically, it is closely related to the Dukat granitoid massif, namely the formation of skarns, greisens and stockwork zones that have been uncovered by boreholes at a depth of 900–1000 m in zones of the massif endo- and exocontact. The main vein- and rock-forming minerals are quartz, feldspar, and muscovite. Less common ones are biotite, fluorite, apatite, carbonates and very rarely, chlorites, amphiboles, pyroxenes, beryl and tourmaline. As for ore minerals, scheelite, wolframite, molybdenite, pyrrhotite, cassiterite, arsenopyrite and chalcopyrite are observed. Pyrite, galena and magnetite can be found [56,74]. The Sn–W and Mo–W mineralization is diverse in its geochemical composition. Relatively high contents are typical of Mo, As, Sn and Bi; fewer high contents are typical of W and Zn and low contents of Ag, Cu, and Pb.
The formation of hydrothermal mineralization originated in several stages. The earliest is unprofitable polymetallic sulphide (Pb–Zn) mineralization. It is related to diverse composition zones of disseminated sulphide mineralization (ZDSM), widely manifested throughout the area [56]. As for ore minerals, pyrite, pyrrhotite, galena, sphalerite, chalcopyrite, and arsenopyrite are present. Zn and Pb form higher concentrations and Cu, As, Bi, Sn and Ag low ones.
Later hydrothermal mineralization within the Dukat Au–Ag OFS is represented by a number of Sn–Ag, Ag–Pb and Au–Ag deposits and prospects [3,56,72,73,74,75,76,77,78,79,80]. Sn–Ag mineralization is widely observable in the deposits of Maly Ken and Novo-Dzhagyn and in the prospects of Razny, Finalny, Severny, Shorokh and Tovarishch. This type of mineralization is also evident in the developing areas of Ag–Pb and Au–Ag mineralization but much less frequently. The main vein minerals are quartz, chlorite, feldspar, sericite, calcite, and ankerite. The main ore minerals are argentite, stannite, cassiterite, chalcopyrite, sphalerite and galena, and the rare ones are pyrite, arsenopyrite and fahlores. The elemental composition is diverse. High concentrations are typical of As, Sn, Ag, Sb, Zn and Bi and lower concentrations of Pb and Cu. As for the uprising of ore zones, the geochemical zonality ranged series is as follows: Pb, Zn, Cu → As, Sn, Ag, Bi → Sb.
Ag–Pb mineralization is widely manifested in the deposits of Mechta and Tidid and in the prospects of Nachalny, Struya, Yasnaya Polyana and Fakel. In addition, this type of mineralization is identified in the Dukat deposit, mainly in its low ore horizons and flanks. The ore bodies have quartz–sericite–chlorite–hydromica composition. Deeper veins of sulphide–carbonate (calcite)–quartz composition appear. As for ore minerals, the most prevalent ones are galena, sphalerite, arsenopyrite, chalcopyrite and silver minerals (argentite, freibergite, pyrargyrite and stephanite). Less common are pyrite, pyrrhotite, boulangerite, marcasite and stannite. Ag, As, Pb and Sb form high concentrations, Hg, Zn and Sn fewer high concentrations and Cu and Bi low concentrations. The zonality is distinctly manifested in the distribution of ore elements. The series of vertical geochemical zonality (on the ore zones’ rising) is as follows: Sn, Bi → Zn, Cu → Bi, Pb → Ag → As → Sb, Hg. The occurrence of Sn and Bi at depth is related to Sn–Ag mineralization, which is usually spatially joined with Ag–Pb.
In the final phases of the hydrothermal stage, Au–Ag and predominantly Ag ores are formed. “Primary” volcanogenic Au–Ag ores have survived only as relics. Most of the Au–Ag ores were rejuvenated under the influence of embedded granitoid intrusions and have a complex composition. Au–Ag and Ag ores are widely developed on the largest silver reserves of the Dukat Au–Ag deposit and to a much lesser extent are manifested in the prospects of Krasin, Barguzin and Zharok. The silver reserves in the Dukat deposit amount to 17 thousand tons, and the gold reserves consist of 40 tons, with average contents of 1 ppm Au and 500 ppm Ag. This deposit has a long and complex development history. The ore bodies here consist mainly of a series of converged veined and mineralized zones. Predominantly Ag ores are represented mainly by quartz–pyrolusite and quartz–rhodonite veins and Au–Ag ores by quartz–rhodonite–feldspar, quartz–feldspar and quartz–feldspar–sulphide ones. The vein minerals are quartz, feldspar (adularia), rhodonite, chlorite, calcite, rhodochrosite, hydromica and sericite. The main ore minerals are argentite (acanthite), native Ag, electrum, kustelite, proustite, pyrargyrite, galena, sphalerite and chalcopyrite. In the circum ore metasomatic rocks, quartz, sericite, hydromica, chlorite, carbonate and epidote are widely developed, and of the ore minerals, only pyrite is present [56,74,76,80,81,82,83,84]. Typical volcanogenic Au–Ag ores are characterized by the simplicity of the basic ore elemental composition. Ag, Sb and Au are specified by high concentrations, while Pb, As, Zn and Hg exhibit medium concentrations. The elements’ concentration level related to Ag and rejuvenated Au–Ag ores increases significantly. The ore element composition becomes complicated. Along with the elements listed above (Ag, Au, Sb, As, Hg, Pb and Zn), Cu and Bi appear. On the rising of the ore zones, the generalized series of geochemical zonality for Ag and Au–Ag ores is as follows: Bi → Zn, Cu → Pb → Au → Ag → As → Sb → Hg.
2.3. Geography and Climate
The main mountain structure of the research area is the Omsukchan ridge, located within the Balygychan–Sugoy interfluve (right tributaries of the Kolyma river). The relief is close to the Alpine type. The absolute peak levels are 1000–1600 m, and the relative excess is 400–600 m. The mountain slopes are steep (25–30°). The mountains’ peaks and slopes are covered with large-block eluvial–deluvial sediments with a capacity of up to 3–5 m. Their bottom is over covered with thick deluvial–colluvial sediments. The surface is swampy, and the exposure is poor [72,73].
The climate of the region is sharply continental. Winters are long and cold, and summers are short and hot. Atmospheric precipitates are distributed unevenly throughout the year. Most of them fall in the summer in the form of rain. Solid snow cover is established in late September–early October and finally disappears in late May and early June. The region is characterized by widespread permafrost development.
The hydro network of the research area belongs to the Kolyma and Viliga river basins. The main watercourses are the Omsukchan, Kakhovka, Dzhagyn, and Chapchik rivers. The valleys of the smaller rivers and streams flowing into them have a V-shaped transverse profile in the upper reaches. The width of these valleys reaches 100 m and that of the riverbeds 5 m at depths of 0.4–1.6 m. In the middle course, the valley profile is trapezoidal. The width of the valleys reaches 600–1000 m and that of the watercourses 30 m at a depth of 0.6 m. Most of the side streams (watercourses of the first-order) are temporary. The water temperature in summer rarely exceeds 4 °C, and in winter, the streams freeze at the bottom. The flora is typical of the mountain forest–tundra zone of the central Kolyma. Daurian larch forests grow in the valleys. The mountain slopes are covered with thickets of cedar elfin. At their peaks, the vegetation typical of areas of alpine tundra dominates. Mosses and lichens are widespread everywhere.
3. Research Methods
3.1. Methods of Geochemical Research
All the areal geochemical surveys of LSSs were performed according to standard techniques [16,85]. Systematic lithochemical point sampling was carried out from loose alluvial sediments of actual watercourses (Figure 3).
A survey on the 1:200,000 scale was performed by the Central Geochemical Expedition (Aleksandrov, Russia) under the leadership of G.I. Khorin and V.A. Lasman as part of the contract work with the production geological organization “Sevvostokgeologiya” (PGO “Sevvostokgeologiya”, Magadan, Russia). The survey on the 1:50,000 scale and scientific and methodological works were carried out by the A.P. Vinogradov Institute of Geochemistry SB RAS (IGC SB RAS, Irkutsk, Russia) under the leadership of R.G. Kravtsova in the course of the research of IGC SB RAS and contracts with PGO “Sevvostokgeologiya”. Since 2000, work on detailing, generalizing and comparing all the previously obtained data from the 1980s has been undertaken. Mineralogical and geochemical studies of the alluvium material composition and the mineral and non-mineral binding forms of the main element indicators of mineralization of different types, primarily Au–Ag, were continued. For the purpose of increasing the efficiency of ore prospecting through LSSs in cryolithogenesis zone conditions, bryolithochemical research was performed. The processing of all the previously and currently obtained data, their generalization and interpretation, the plotting of mono- and polyelement geochemical maps and detailed mineralogical and geochemical research were implemented by the authors.
In the areal geochemical surveys of LSSs at the 1:200,000 scale, the routes started at 50–100 m above the sampled watercourse mouths of senior-orders and ended in the stream mouths of the second-order, and in rare cases, the first-order, with the selected endpoints of the double samples located 20–30 m from one another. The distance between the selection points of ordinary samples was 500 m, the average distance between the sampled riverbeds was 2 km and the sampling density was 1 sample/km2. The location of the alluvium samples in the LSS survey on the 1:200,000 scale is shown in Figure 4a. In the areal geochemical survey of LSSs on the 1:50,000 scale, the routes started at 50–100 m above the sampled watercourse mouths of senior-orders and ended (whenever the material could be sampled) in the stream heads of the first-order. The sampling step was 200–250 m, the average distance between the sampled riverbeds was 0.5–0.7 km and the sampling density was 6–10 samples/km2. The location of the alluvium samples in the survey of LSSs on the 1:50,000 scale is shown in Figure 4b. In all cases, samples were taken from the bed’s dry part surface of a temporary or permanent watercourse. Depending on the predominant material granulometric fraction, whether sand–gravel or sand (rarely sandy silt), alluvium fractions were sampled. The alluvium sample weight was 200–300 g. All the samples were thoroughly dried and sieved through a sieve with a 1 mm mesh. Abrasion was performed mechanically in steel cups on a vibrating grinder to the state of powder (~200 mesh).
During the scientific methodical work, bryolithochemical research was implemented and the material composition of alluvial sediments from watercourses draining Au–Ag ore zones was explicitly studied. The bryolithochemical method is based on the sampling of aquatic and semiaquatic mosses growing on the banks and beds of the watercourse heads, together with the silt and sandy silt material that is firmly held by the moss cushion. All the selected bryolithochemical samples were first burnt to ashes in a muffle furnace and then (to purify them finally from the sandy fraction) were additionally sieved through a sieve with a 0.1 mm mesh and further analyzed for a wide range of elements. When performing the detailed investigation of the distribution and binding forms of mineralization element indicators in the watercourses’ loose sediments, bulk alluvium mineralogical–geochemical samples weighing up to 6 kg were taken, sieved into different fractions (+2 mm, −2 mm ÷ +1 mm, −1.0 ÷ +0.25 mm, and −0.25 mm) and mounted in briquette polished sections. Further investigation of this material was carried out using the polarizing light microscope POLAR 3 (Micromed, Saint Petersburg, Russia) and the JXA-8200 SuperProbe electron probe microanalyzer (JEOL, Tokyo, Japan).
3.2. Analysis Methods
The analysis of the geochemical samples obtained while performing the areal LSS surveys on the 1:200,000 and 1:50,000 scales and scientific–methodical works was carried out in different years in the analytical laboratories of the Central Geochemical Expedition (Aleksandrov, Russia) and IGC SB RAS (Irkutsk, Russia).
All the samples underwent spectral semiquantitative analysis (SSQA) for a wide range of elements according to the techniques in [16,86,87]. The method of sample spilling was used on spectrographs: the STE-1 (LOMO, Saint Petersburg, Russia) and DFS-8 (Kazan Optical and Mechanical Plant, Kazan, Russia) with an attachment of USA-5 (Kazan Optical and Mechanical Plant, Kazan, Russia) and DFS-458S (Kazan Optical and Mechanical Plant, Kazan, Russia) with a multichannel analyzer of atomic emission spectra MAES (VMK-Optoelektronika, Novosibirsk, Russia) with photodiode lines.
Gold was determined through atomic absorption spectrometry with preliminary sample decomposition using an acid mixture and metal extraction using an organic sulphide solution [88,89]. The contents were measured using atomic absorption spectrometers M-303, M-403 and AAnalyst-800 (Perkin-Elmer, Waltham, MA, USA) with detection limits (ppm) of 0.004, 0.002 and 0.002, respectively. The method of atomic absorption spectrometry in its electro-thermal option with a graphite furnace atomizer HGA-72 (Perkin-Elmer, Waltham, MA, USA) was used for the determination of low Au contents (detailed investigations). Measurements were carried out using the spectrometer M-503 (Perkin-Elmer, Waltham, MA, USA). This method’s detection limit of Au is 0.0002 ppm.
Mercury, while conducting areal LSS surveys on the 1:200,000 scale, was analyzed through the traditional method of SSQA. We used a sample-spilling method on the spectrograph STE-1 with USA-5 attachment, and this element’s detection limit was 1 ppm. Later, during areal LSS surveys on the 1:50,000 scale and detailed research, the atomic absorption method with acid decomposition was used with the techniques in [90,91]. The measurements were carried out on an atomic absorption spectrophotometer RAF-1M (Kazgeofizpribor, Kazan, Russia) and afterwards the mercury analyzer RA-915+ with the attachment RP-91S (Lumex, Saint Petersburg, Russia), the element detection limit in both cases being 0.005 ppm. Low Hg contents were analyzed using the atomic fluorescence method [92]. An atomic fluorescence spectrometer PSA 10.003 (P.S. Analytical, Orpington, UK) with a hydride generator was used for the measurements. The Hg detection limit was 0.0002 ppm.
Substance composition determination was performed through local analysis methods using electron probe microanalysis (EPMA) on the JXA-8200 SuperProbe (JEOL Ltd., Tokyo, Japan) microanalyzer in accordance with the available techniques [93,94,95,96]. Grain surfaces were examined through a scanning electron microscope JXA-8200 SuperProbe (JEOL Ltd., Tokyo, Japan) with backscattered and secondary electrons to detect inclusions containing ore elements. With the help of an energy dispersive spectrometer EX-84055MU (JEOL Ltd., Tokyo, Japan), the inclusion compositions found were identified. The elements’ content change on the surface was studied on the distribution maps of the elements’ X-ray radiation obtained using wave spectrometers. The chemical composition of the inclusions found was determined by the survey monitoring and recalculating the recorded relative intensities in the concentration using the JXA-8200 SuperProbe microanalyzer software (Version 01.42, JEOL Ltd., Tokyo, Japan). In determining the composition of finely dispersed gold inclusions with a size smaller than the locality of the EPMA method, matrix effects were taken into account following the method of content trends [95,96].
3.3. Methods of Information Mathematical Processing
To process a large amount of analytical data, mathematical methods were widely used. To obtain preliminary information on the distribution of chemical elements, as well as to obtain different mathematical data (statistics, pair correlation, etc.), the Golden Software Surfer (Version 11.2.848, Golden Software, Llc, Golden, CO, USA) and Microsoft Office Excel 2003 software (Version 11.8169.8172) were used.
In the study of the exogenous AGF composition and structure identified by LSSs, the plotting of mono- and polyelement geochemical maps was executed using the multidimensional field method [97,98]. The main operations in the analysis of AGFs and geochemical map plotting were automated. To divide the analytical data sets into a system of homogeneous quantities, an automatic classification was developed, which helped to identify the most common combinations of ore elements in the samples at their close quantitative values. Monoelement geochemical fields were plotted and chemical element combinations (classes) were sought. The class separation (element association) is based on the percentage of the contrast ratio (CR) with regard to the dispersion measures and the dependence between the CRs of various elements (CR = Ci/Cb, where Ci is the element content and Cb the background). Then, the multidimensional field was plotted. The final result is presented in the form of mono- and polyelement AGF maps. The multidimensional field method has a number of advantages. It allows one to make a series of geochemical maps with a solution that is common to all elements; has a separate classification (selecting the group of elements that are typomorphic for this type of ores, this phase or this stage); shows only genetically homogeneous associations; contains mappings, in which we used the main (leading) elements; and so on.
During the study of exogenous AGFs identified through LSSs, an important role was given to the Cb selection. The Cb that we accepted for the main element indicators of mineralization considered in this work are shown in Table 1 (column 1) and, in general, are comparable with the average contents calculated for rocks of average and acidic composition for the earth’s crust (see Table 1, columns 2–6). The same Cb values were accepted for endogenous geochemical fields. The aim is to have the possibility to compare exogenous and endogenous AGFs, which is of great importance in the plotting and interpretation of geochemical maps.
4. Results and Discussion
From 1981 to the present time, within the framework of the IGC SB RAS scientific research in close cooperation with industrial organizations of the Magadan region (north–east of Russia), complex scientific research has been conducted. A significant amount of informative material from the areal geochemical surveys of LSSs on the 1:200,000 and 1:50,000 scales has been summarized. The exogenous AGF composition and structure identified by LSSs have been studied. They have been compared with the composition of primary ores and endogenous geochemical fields. The main factors that affect the LSS formation in cryolithogenesis zone conditions have been revealed. The sampling technique of the watercourse heads, where there are no alluvial deposits in the territories of subarctic landscapes, has been developed. Additional mineralogical and geochemical criteria for the prediction, prospecting, and evaluation of ore mineralization for such territories have been proposed.
4.1. Lithochemical Stream Sediments in the AGF Study of the Dukat Gold–Silver Ore-Forming System and Associated Areas—Regional Forecast
The exogenous AGF study of the Dukat Au–Ag OFS identified by LSSs was based on regional survey data on the 1:200,000 scale, executed in the area within the two state sheets—the lower sheet part is P-56-XII and the upper sheet part is P-56-XVIII. This area covers the central part of the Balygychan–Sugoy trough, including the Dukat Au–Ag OFS (see Figure 1 and Figure 2). The number of samples taken was more than 2500. See Figure 4a (Section 3.1) for the samples’ location.
Exogenous AGFs of Au, Ag, As, Pb, Zn, Cu, Mo, W, Sn, and Bi were identified throughout the studied area. The main elements forming these fields are Ag, As, Pb, Zn, W, Sn and Bi. Weakly manifested are Cu, Mo and especially Au. With regard to such elements as Hg and Sb, when surveying LSSs on the 1:200,000 scale, no anomalies were revealed. Hg and Sb are elements for which the contents are difficult to detect through the traditional SSQA method. This is due to this method’s insufficient limit for their detection—1 ppm for Hg and 20 ppm for Sb. Only a few points with content of 1 ppm (CR = 200) Hg and 20 ppm (CR = 100) Sb were observed. Based on such data, it is impossible to talk about any regularities in the distribution of these elements in LSSs.
Directly within the Dukat OFS, high-contrast exogenous AGFs form As (up to 2500/1250*), Pb (up to 3000/300), Ag (up to 30/300) and Bi (up to 25/250). Medium-contrast AGFs are characteristic of Sn (up to 100/50) and Zn (up to 1500/30). Cu (up to 100/10), Mo (up to 10/10) and W (up to 20/10) are manifested as low-contrast fields. When conducting surveys on the 1:200,000 scale, the anomalies of such a main element for Au–Ag mineralization as Au (up to 0.03/6) are manifested very poorly.
*Here and later in the text, in the numerator, the average element contents (ppm) are given and in the denominator the average values of their contrast ratios (see Section 3.3).
Gold in alluvial sediments of LSSs is practically not manifested in the considered territory (Figure 5). Sporadic AGFs of low contrast (0.01–0.03 ppm, CR = 2–6) are observed. Attention should be paid to the fact that the Au anomaly of such a large Au–Ag deposit as the Dukat deposit is not especially different from those that form unprofitable Au–Ag prospects and objects that are in no way related to this type of mineralization.
Silver is the most widely manifested element in the entire studied area (Figure 6). This supports the unique metallogenic specialization of the considered territory as well as all of the OCVB outer zone for silver. Au–Ag, Ag–Pb and Sn–Ag ore objects located within the boundaries of the Dukat Au–Ag OFS and beyond this distinctly fix AGFs of high (10–30 ppm, CR = 100–300) and medium (1–10 ppm, CR = 10–100) Ag contrast. The maximum content of this element in the exogenous AGFs identified through LSSs is 5–30 ppm (CR = 50–300). These fields are related to the largest of the silver Au–Ag reserves in the Dukat deposit. Anomalies with content of 1–5 ppm (CR = 10–50) were identified in a circumferential direction of this deposit and in the areas of Au–Ag (Zharok), Ag–Pb (Fakel) and Sn–Ag (Shorokh and Finalny) prospects as well as the Ag–Pb deposits (Mechta and Tidid). Outside the Dukat OFS, such fields fix a number of Au–Ag and Sn–Ag prospects. They are partly manifested in the development area of the Sn ore objects. Low-contrast (0.3–1 ppm, CR = 3–10) Ag AGFs have the widest development.
Arsenic, as well as Ag, is widely manifested over the entire area (Figure 7), although its detection limit using the SSQA method is no better than 30 ppm. Directly within the Dukat Au–Ag OFS, the maximum As concentrations reach 200–2500 ppm, and the contrast is 100–1250. These high-contrast fields are confined to the Mechta and Tidid Ag–Pb deposits. AGFs with a concentration of 100–200 ppm and CR = 50–100 are fixed by the LSSs of the Maly Ken and Novo-Dzhagyn Sn–Ag deposits and the Finalny Sn–Ag prospect as well as in the areas in which the ore objects were not identified. AGFs with lower contents (30–100 ppm) and lower contrast (CR = 15–50) are developed more significantly. Specifically, for the Dukat Au–Ag deposit, the As AGFs are typical, with contents not exceeding 50–100 ppm and CR = 25–50. The same fields are characteristic of a number of Au–Ag, Ag–Pb and Sn–Ag prospects. The central part of the Dukat OFS, as well as some Ag–Pb (Struya and Yasnaya Polyana) and Sn–Ag (Shorokh) prospects, is distinguished by fields with the lowest contents of this element (<30 ppm, CR < 15).
To the east of the Dukat OFS, the development area of the As AGFs increases significantly. Here, the As fields are related mainly to Sn, Sn–W and Mo–W and rarely to Sn–Ag objects. The contents of this element vary in the range of 30–500 ppm, and the contrast is 15–250. Moreover, AGFs with the maximum content of As (100–500 ppm) and contrast (CR = 50–250) are most often associated with development areas of prospects but with minimal content (30–100 ppm) and contrast (CR = 15–50) with deposits.
In general, it can be seen that the As fields’ contrast in LSSs of deposits, prospects, and “ore-free” areas varies widely. The main factors affecting the As distribution, most probably, are the morphology of ore bodies and differences in their mineral composition. For example, exogenous AGFs of Au–Ag deposits and prospects, especially of such a giant as the Dukat Au–Ag deposit, are characterized by relatively low As contents. Ores belong to the vein type. Arsenic minerals are represented in them in a small quantity, mostly by sulphoarsenides (proustite and tennantite). These minerals are extremely unstable in hypergene environments. Entering watercourses, they are destroyed, part of the As transits into mobile water-soluble forms and is transported relatively short distances and the high-contrast fields are not formed.
The highest-contrast As anomalies are related to Ag–Pb, Sn–Ag and Sn deposits and prospects, in which one of the main minerals of As is arsenopyrite. Here, the area’s arsenopyritization processes are widely manifested, related to the ore as well as the “ore-free” areas. In hypergene environments, the arsenopyrite is also unstable. It is fully oxidized and converted into mineral pitticite, soluble with difficulty and inactive in an aqueous medium, the development area of which in LSSs is comparable with the size of the areal arsenopyritization. Thus, high-contrast As anomalies are not related to Au–Ag deposits not only in the Dukat OFS but also beyond it. In addition, a significant part of such anomalies has no relation to profitable ore mineralization at all.
Lead in the studied area is most manifested in the LSSs of the Dukat OFS and in the south-east near its borders (Figure 8). High-contrast AGFs with concentrations of 1000–3000 ppm (CR = 100–300) are related to the Tidid Ag–Pb deposit and the Dukat Au–Ag deposit. These fields were also identified in the Dukat flanks and in the Au–Ag prospects. Fields of less contrast (250–1000 ppm, CR = 25–100) are confined to such prospects as Au–Ag Zharok, Ag–Pb Fakel, Sn–Ag Finalny, Shorokh, and Severny. Outside the Dukat OFS, such contrast AGFs are almost not manifested. AGFs with Pb 100–250 ppm (CR = 10–25) are fixed by other ore objects, including the Mechta Ag–Pb deposit and the Nachalny and Yasnaya Polyana Ag–Pb prospects, Krasin and Barguzin Au–Ag prospects, Razny Sn–Ag prospect and, much less so, Sn objects. The low-contrast AGFs (30–100 ppm, CR = 3–10) are developed much more widely than the others. Within the Dukat OFS, they are mainly related to Sn–Ag deposits and prospects, beyond the Dukat OFS, with Sn mineralization. The main part of low-contrast Pb anomalies is associated with unprofitable ZDSM, which is manifested throughout the area.
Attention should be paid to the fact that the contrast of the fields related to some Au–Ag, Ag–Pb and even Sn–Ag prospects is higher than in the Mechta Ag–Pb deposit. This situation can be caused by a number of factors, such as the branching of the drainage system, the ore bodies’ morphology, their position in relation to the draining streams and the sod cover of the watercourse heads (a barrier to the material transfer). In addition, the low contents, to some extent, reflect the level of the ore zones’ erosion profile. For example, the upper ore intervals of Ag–Pb mineralization are not characteristic of high Pb content. In general, it can be seen that fields with Pb contents greater than 100 ppm (CR > 10) are confined to Au–Ag and Ag–Pb and rarely occur with Sn–Ag deposits and prospects. The relationship of contrast (CR = 10–100) and high-contrast (CR = 100–300) Pb AGFs with different ore objects is due to the fact that, in the series of vertical endogenous geochemical zonality, Ag–Pb mineralization takes an intermediate place between Au–Ag and Sn–Ag mineralization [56]. During the erosion of low ore horizons of Au–Ag ore objects and upper ore horizons of Sn–Ag ore objects by watercourses, the Ag–Pb ores will inevitably be affected.
Zinc is widely manifested throughout the study area (Figure 9). Medium-contrast fields with contents of 500–1500 ppm (CR = 10–30) are developed, mainly in the southern part of the Dukat OFS and along the periphery to the north–east and south-east of it. Within the Dukat OFS, such fields tend to be attracted to Au–Ag (Dukat, Barguzin and Zharok) and Ag–Pb (Tidid and Fakel) deposits and prospects. Outside the system, exogenous Zn AGFs are related to a number of Au–Ag, Sn–Ag, and Sn prospects. Low-contrast fields with concentrations of 150–500 ppm and CR = 3–10 have maximum prevalence. They are identified both within the Dukat OFS and beyond it. Such AGFs are related to different ore objects. Most parts of the low-contrast Zn anomalies, as well as Pb, have no relation to deposits and prospects but are associated with unprofitable ZDSM.
Copper is manifested in the form of low-contrast AGFs throughout the territory (30–100 ppm, CR = 3–10), and medium-contrast AGFs are rarer (100–200 ppm, CR = 10–20) (Figure 10). Their main part is concentrated in the east of the Dukat OFS and is confined to the development areas of Sn, Sn–W and Mo–W mineralization. Within the Dukat OFS, anomalies with Cu content of 50–100 ppm (CR = 5–10) are attracted to its eastern edge. They are related to the Dukat Au–Ag deposit, to its flanks and to the Finalny Sn–Ag prospect. Lower-contrast fields (30–50 ppm, CR = 3–5) are developed much more widely. They are confined to the Au–Ag (Zharok prospect), Ag–Pb (Fakel prospect), and Sn–Ag (Maly Ken and Novo-Dzhagyn deposits and Razny and Severny prospects) objects.
Molybdenum in the considered area forms rare local fields of medium contrast (10–30 ppm, CR = 10–30) and wide low-contrast AGFs (3–10 ppm, CR = 3–10) (Figure 11). Anomalies of medium contrast are manifested only outside the Dukat OFS and attract to Sn, Sn–W and Mo–W objects. Low-contrast AGFs are identified both within the Dukat OFS and outside it in the eastern part of the area. Such fields attract objects of all known types of mineralization.
Tungsten in LSSs is spread mainly outside the Dukat OFS (Figure 12). The most significant fields (10–200 ppm, CR = 5–100) of W anomalous concentrations in terms of size and contrast are attracted to the area located to the east of the Dukat Au–Ag OFS. They are related here to numerous Sn, Sn–W and Mo–W deposits and prospects. The Dukat OFS is characterized by low-contrast W AGFs. These element concentrations do not exceed 10 ppm (CR<5) and were identified in the watercourse alluvium draining different ore objects—Au–Ag (Dukat and Zharok), Ag–Pb (Mechta) and Sn–Ag (Maly Ken, Novo-Dzhagyn and Razny). W anomalies’ contrast increases slightly (10–20 ppm, CR = 5–10) only towards the north–eastern border of the Dukat OFS, where the Finalny Sn–Ag prospect is located.
Tin in the considered territory is characterized by quite wide development of AGFs (Figure 13). The exogenous Sn AGFs with the most contrast (50–200 ppm, CR = 25–100), as well as those for W, are observed outside the Dukat OFS. Such anomalies clearly fix Sn–Ag, Sn, Sn–W and Mo–W ore objects. Here, lower-contrast anomalies (<50 ppm, CR < 25) are the most developed. Within the Dukat Au–Ag OFS, the Sn contents reach 50–100 ppm (CR = 25–50) only in single anomalies. Such anomalous concentration fields are confined to the Severny Sn–Ag prospect and to the eastern flank of the Dukat Au–Ag deposit. Fields of less contrast (20–50 ppm, CR = 10–25) are revealed by the watercourse LSSs draining mainly Sn–Ag objects (Maly Ken and Novo-Dzhagyn deposits and Razny, Finalny and Shorokh prospects). To a lesser extent, such fields are manifested in Au–Ag (Dukat) and Ag–Pb (Fakel) deposits and prospects and on the flanks of the Dukat, where Sn–Ag mineralization was also observed. In general, for exogenous Sn AGFs within the Dukat Au–Ag OFS, the low contrast (6–20 ppm, CR = 3–10) is characteristic.
Bismuth forms exogenous AGFs (Figure 14) that are significant in size and contrast. Low-contrast Bi fields (CR < 10) are not considered here due to the poor Bi detection limit of the SSQA method (1 ppm). The highest-contrast Bi AGFs (5–25 ppm, CR = 50–250) in the area of the Dukat Au–Ag OFS are located near the north–eastern border. They are confined mainly to the Sn–Ag objects—the Novo-Dzhagyn deposit and the Razny and Finalny prospects. In addition, fields of such contrast were identified in sites where ore objects are not known. Sn–Ag objects of the Dukat OFS’s western part (Maly Ken deposit and Tovarishch, Severny and Shorokh prospects) are characterized by significantly lower-contrast Bi fields (<2.5 ppm, CR < 25). The same fields are related to Au–Ag and Ag–Pb objects. The only exception is the Mechta Ag–Pb deposit, in which the Bi concentrations in LSSs reach 10 ppm (CR = 100). Outside the Dukat OFS, the Bi fields of anomalous concentrations are widely developed and confined to Sn, Sn–W, Mo–W and (in the south) Sn–Ag objects. The maximum anomalous fields with the content of 5–25 ppm (CR = 50–250) are more prevalent here than within the Dukat OFS.
Attention should be paid to the fact that the Bi AGFs of similar ore object mineralization types are manifested in some cases and not in others. For example, for the Mechta and Tidid Ag–Pb deposits, this can be explained by the level of their erosion profile (see Figure 14). High concentrations of Bi in the AGFs of the Mechta deposit testify that watercourses drain the lower ore intervals, which are characterized by high Bi content in ores. Weakly manifested Bi anomalies or the lack of them at the Tidid deposit indicate that the watercourses in this area drain the upper horizons, which are characterized by low contents of Bi in the ores. This corresponds to the previously identified endogenous geochemical zonality of these objects [56].
When identifying the typomorphic composition of exogenous AGFs (element associations) and the patterns of their distribution in space (zonality), multiple correlation is effective. Graphically, this correlation can be seen on a polyelement geochemical map plotted using the multidimensional field method (Figure 15, Table 2).
For exogenous AGFs of the Dukat Au–Ag OFSs and the ore objects related to it, the polymetallity and zonal construction are characteristic. In the process of the Dukat OFS’s erosion, from the central part to the periphery, Ag geochemical associations are replaced by Ag–Pb then Sn–Ag. Predominantly, Ag element associations have local development and are manifested only at the Dukat Au–Ag deposit. The maximum contents here are typical of Ag and to a lesser extent of Pb and As. Such elements as Bi, Zn, Cu and Sn are weakly manifested. There is practically no Au, which does not allow the allocation of Au–Ag element associations that are characteristic of the deposit primary ores. The absence of Au and the strong appearance of Pb and Sn are not characteristic of typical epithermal Au–Ag mineralization. The unusually high Pb and Sn that occur can be explained by the fact that the sampled watercourses drain the middle-lower ore horizons of the deposit, where mainly Ag–Pb ores are manifested and Sn–Ag mineralization appears [56,102].
Ag–Pb and Sn–Ag associations are widely manifested throughout the studied area. Ag–Pb associations have an areal character of development. The highest concentrations of the main typomorphic elements (Ag, Pb and As) are confined to the flanks of the Dukat Au–Ag deposit and to the Ag–Pb objects on the periphery of the OFS with the same name. Such elements as Bi and Zn are manifested less, and even smaller amounts of Sn and Cu are evident. Sn–Ag associations are less developed, both on the periphery of the Dukat OFS and beyond it. Such associations are confined mainly to Sn–Ag objects. The highest contents are typical of As, Bi and Sn, relatively high for Pb and Ag and less high for Zn and Cu.
Outside the Dukat Au–Ag OFS, at the most eroded site compared with the depression area with the same name, Mo–W, Sn–W and Sn associations are widely manifested. They are confined mainly to Mo–W, Sn–W and Sn ore objects. For Mo–W and Sn–W associations, the main ones are Bi, Sn, As, W, and Mo. Pb and Zn are manifested to a lesser extent and Cu and Ag even less. For Sn element associations, high contents are characteristic of Sn, Bi and As. W, Zn, Cu, Mo and Pb are weakly manifested. It should be noted here that Sn mineralization is quite often accompanied by rare metal mineralization [78].
In addition to the aforementioned associations related to ore mineralization, low-contrast element associations, mainly As, Bi, Ag, Zn, and Pb, related to ZDSM, are widespread throughout the area.
Summarizing the results of the small-scale geochemical survey of LSSs on the 1:200,000 scale on the territory of the Dukat Au–Ag OFS and associated areas, it can be argued that such surveys are the main method for the regional forecasting of minerals in actively denudating mountain-folded subarctic regions in the north-east of Russia. They are the best way to solve the problem of projected evaluation of large-scale areas in a relatively short time and at a minimal cost. They are characterized by simplicity, relative depth and the possibility to obtain information operatively about the geochemical peculiarities and metallogeny of the region as a whole. Ore elements associations, their typomorphic composition and the regional exogenous geochemical zonality revealed by the multidimensional field method reflect primarily the geochemical peculiarities of the studied area and the ore mineralization distribution pattern here. As can be seen from the survey results of LSSs on the 1:200,000 scale, the metallogenic specialization in the studied area is clearly manifested only in Ag, Pb and Sn. The situation is ambiguous for Au AGFs, the main element indicator, which is of main interest for the Au–Ag mineralization type. Metallogenic specialization for this element is not manifested.
Despite the positive aspects, surveys of LSSs on the 1:200,000 scale have significant drawbacks. The exogenous AGFs identified through them have a relatively poor component composition and low contrast. Not only quantitative but also qualitative relations are often violated. First of all, this situation is typical of anomalies related to Au–Ag deposits and prospects. Table 3 shows the overall assessment of the quality and quantity relations in a conjugated system of endogenous AGFs–exogenous AGFs—ore + primary halo → secondary halo → stream sediments—for ore objects of the Dukat Au–Ag OFS. It can be seen clearly that the main typomorphic element composition is simplified and that alien elements, not peculiar to a particular type of mineralization, appear and the contrast reduces, especially that of Au–Ag AGFs. It is most probable that all these features are due to erosion by watercourses of deposits and prospects at various-level horizons, which in turn leads to mixing and concentrating of ore material of different types of mineralization in alluvial sediments.
All of the disadvantages listed above greatly complicate the study of the composition, structure and development scale of exogenous AGFs: their typification becomes difficult and, as a consequence, there is an unclear relationship with a specific type of mineralization as well as zonality identification—the main indicator used to assess the level of an area’s erosion profile. It is obvious that it is necessary to carry out a more detailed LSS study.
As further research, performed in the area of the Dukat Au–Ag deposit and its flanks, has shown, the low contrast and poor component composition of the exogenous AGFs are related mainly to the watercourse sampling character. It is established that the most informative are the watercourse heads (streams of the first and second orders), which, in the surveying of LSSs on the 1:200,000 scale, are practically not sampled (see Section 3.1). In such situations, for the prospecting and evaluation of ore mineralization, primarily Au–Ag, in the conditions of cryolithogenesis zones, it is effective to perform surveys of LSSs on the 1:50,000 scale, in which all watercourses, including streams of the first-order, are sampled.
4.2. Lithochemical Stream Sediments in the AGF Study of the Dukat Gold–Silver Deposit—Prospecting and Evaluation
The study of exogenous AGFs identified by LSSs for the purpose of the prospecting and evaluation of Au–Ag mineralization was carried out on the basis of geochemical survey data at the 1:50,000 scale. This area covers the southern part of the Dukat Au–Ag OFS, including the Au–Ag deposit of the same name, as well as the associated area (see Figure 2, Section 2.2). The number of samples taken was more than 600. See Figure 4b (Section 3.1) for the samples’ location.
The exogenous AGFs of all the element indicators typical of ore mineralization in the Dukat Au–Ag OFS are distinctly manifested [56,102].
Gold is the most intensively manifested in LSSs directly related to the Dukat Au–Ag deposit (Figure 16). The contour line, combining the concentrations of 0.1–0.45 ppm (CR = 20–90), almost delineates the central part of the deposit (right tributaries of the streams Smely and Iskra) as having the richest content of this element. AGFs with a concentration of 0.02–0.1 ppm (CR = 4–20) are fixed on the flanks of the deposit (streams Smely, Levaya Brekchiya and Iskra). Outside the deposit, the content of this element usually does not exceed 0.02 ppm (CR ≤ 4).
Silver at the considered site forms a very contrasting and quite large AGF development area (Figure 17). High-contrast Ag fields with contents of 10–100 ppm (CR = 100–1000) are clearly fixed within the unique Dukat Au–Ag deposit in the reserves of this metal as well as on its flanks. In addition, AGFs of such contrast are identified in the watershed of the Yagelny and Neponyatny streams. It should be noted that no ore objects have been identified on this watershed to date. The site may be promising in terms of silver mineralization detection. Exogenous fields of medium contrast with Ag content of 1–10 ppm (CR = 10–100) form smaller objects—the Nachalny and Fakel Ag–Pb prospects. Moving in the direction from the known ore objects, the contents in the LSSs gradually decrease and outside them usually do not exceed 1 ppm (CR < 10), which corresponds to low-contrast and near-background geochemical fields. Thus, higher levels of Ag concentrations in channel sediments of the area, as a rule, fix ore mineralization and depend directly on the scale of its occurrence.
Mercury, like Ag, is quite widely manifested in the studied area (Figure 18). High-contrast AGFs (0.5–1.5 ppm, CR = 100–300) are related directly to the Dukat Au–Ag deposit. Fields with lower contents (0.05–0.5 ppm) and medium contrast (CR = 10–100) were identified everywhere, including in the deposit, its flanks and ore-free areas. In LSSs of the Nachalny and Fakel Ag–Pb prospects with contents of 0.25–0.5 ppm, the field contrast does not exceed 50–100. Such a wide distribution of Hg anomalies in the LSSs of the area under consideration is probably due to the occurrence of non-mineral forms of this element. There is all the more reason for this as Hg’s own mineral forms at the Dukat deposit were detected neither in ores [56,81] nor in LSSs [29]. The extremely high mobility of Hg is well known. In the areas of an active tectonomagmatic process, it easily penetrates into the near-surface horizons along the fault zones and is sorbed by many minerals—ore and non-metallic ones. Hg is also fixed in ore minerals as an impurity, including the Dukat deposit [29,56]. Based on all of the above, it can be argued that Hg can be transited far away by watercourses and that not all anomalies can be associated with ore mineralization.
Antimony has an insufficient detection limit if determined through the SSQA method, so only high-contrast AGFs (30–80 ppm, CR = 150–400), were revealed in the studied area. These anomalous fields were identified with the streams draining the zones of Ag–Pb mineralization (the Nachalny Ag–Pb prospect and the watershed of the Yagelny and Neponyatny streams) (Figure 19).
Arsenic is manifested mainly as AGFs with concentrations up to 50 ppm and contrast up to 25 (Figure 20). High-contrast AGFs with As concentrations of 200–1000 ppm (CR = 100–500) are fixed on the flanks of the Dukat deposit—on tributaries of the Levaya Brekchiya stream and the watershed of the Iskra and Ersh streams. These anomalies can also be related to Ag–Pb mineralization. The highest-contrast fields are identified in the watershed between the Yagelny and the Neponyatny stream, where the silver-bearing (possibly Ag–Pb) ore mineralization is assumed to be detectable. Here the As contents in LSSs reach very high values—1000–3000 ppm (CR = 500–1500). Lower-contrast As AGFs identified through LSSs (100–200 ppm, CR = 50–100) are related to Ag–Pb mineralization of the Nachalny and Fakel prospects. Arsenic is least manifested in LSSs of the Dukat Au–Ag deposit (20–50 ppm, CR = 10–25). As already mentioned, the arsenic minerals in the deposit are mainly represented by sulphoarsenides, which are highly unstable in hypergene environments (see Section 4.1). Occurring in ores in small quantities and passing into watercourses in mobile forms, As does not form high-contrast fields.
Lead forms a very high contrast and very wide development area of AGFs (Figure 21). The fields of high contrast (1000–5000 ppm, CR = 100–500) are related to the Dukat Au–Ag deposit and Fakel Ag–Pb prospect. They are also identified along the watershed between the Yagelny and the Neponyatny stream, where concentration peaks of Ag and As are observed too. The fields of less contrast (500–1000 ppm, CR = 50–100) are identified in LSSs of the Nachalny Ag–Pb prospect, along the tributaries of the Svetly, Smely and Pravaya Brekchiya streams. Due to the high levels of Ag and Pb in LSSs, this area may be considered promising for the identification of indigenous Ag–Pb mineralization.
Zinc in comparison with Pb is manifested less in the LSSs of the considered area (Figure 22). The most contrasting Zn AGFs with concentrations of 1000–10000 ppm (CR = 20–200) have a local distribution and are fixed mainly within the central part of the Au–Ag Dukat deposit. Fields with contents up to 500–1000 ppm (CR = 10–20) have the largest development area. They are identified in the Ag–Pb Nachalny and Fakel prospects, the Dukat deposit flanks and in the watershed between the Yagelny and the Neponyatny stream.
Copper forms AGFs in their contrast, configuration and confinement to watercourses, similar to Zn AGFs (Figure 23). The fields with the most contrast (500–1000 ppm, CR = 50–100) are related to the central part of the Dukat Au–Ag deposit. Less contrast, with content of 200–500 ppm (CR = 20–50), are established both in the central part of the deposit and on its flanks as well as along the watershed between the Yagelny and the Neponyatny stream. The Nachalny and Fakel Ag–Pb prospects are characterized by Cu AGFs with contents not exceeding 100–200 ppm (CR = 10–20). Low-contrast AGFs (<100 ppm, CR < 10) are manifested throughout the area and are characteristic of all types of ore mineralization.
Molybdenum and tungsten are the main typomorphic elements for Sn–W and Mo–W mineralization. Within the Dukat Au–Ag OFS, the tin–rare metal and rare metal mineralization is uncovered, basically, only at a great depth by boreholes in the endo- and exocontact zones of the granitoid massif with the same name and does not outcrop. In this regard, W is not manifested in alluvial sediments. These element concentrations in LSSs are near-background and do not exceed 6 ppm at CR < 3. Mo forms only low-contrast AGFs (3–10 ppm, CR = 3–10) (Figure 24). Its anomalies with a content of 3–5 ppm (CR = 3–5) are developed almost everywhere. The content and contrast increase slightly only in relatively small AGF areas (5–10 ppm, CR = 5–10). They were identified within the Nachalny and Fakel Ag–Pb prospects and on the flanks of the Dukat Au–Ag deposit: in the north—in the watersheds of Iskra and Ersh—and in the east—in the watershed at the head of the Yagelny and Neponyatny streams.
Tin, after Ag, is the second main element indicator of the Sn–Ag mineralization type, which is manifested only in the deep horizons and flanks of the Dukat Au–Ag deposit in the investigation area. Much more rarely, Sn occurs in Ag–Pb ores, mainly at depth, where it has relatively low concentrations. In this regard, Sn in LSSs is also weakly manifested, mainly in the form of low-contrast AGFs (6–20 ppm, CR = 3–10) (Figure 25). The anomalies of low contrast are revealed in watercourses draining both the Nachalny and Fakel Ag–Pb prospects and the Dukat Au–Ag deposit and its flanks to the east. Medium-contrast Sn AGFs with concentrations of 20–100 ppm (CR = 10–50) have the local propagation and are identified in the stream Brekchiya to the east of the field, which is related, apparently, to the Sn–Ag mineralization outcropping on its flanks.
Bismuth, like Sn, is more typical of Sn–Ag ores than of Au–Ag and Ag–Pb. Bi is poorly manifested in alluvial sediments in the entire investigation area. It forms mainly low-contrast AGF with contents of 0.3–1 ppm (CR = 3–10) (Figure 26). Concentrations increasing to 1–2 ppm (CR = 10–20) were observed locally. They were identified only in LSSs of streams draining the Nachalny Ag–Pb prospect and in LSSs of the Brekchiya stream to the east of the Dukat deposit, which is related, apparently, as well as to Sn, to the Sn–Ag mineralization outcropping on its flanks.
As can be seen from the results of the survey of LSSs on the 1:50,000 scale, performed on the territory of the Dukat Au–Ag OFS’s southern part, including the deposit with the same name, AGFs of Ag, Sb, As, Pb, Zn, Cu and, most importantly, Au and Hg have the maximum contrast and the largest area of development. All of the above elements are typomorphic of the Au–Ag and Ag–Pb mineralization types that are widely manifested here. The maximum anomalous concentrations are fixed in the alluvial sediments of the first- and second-order watercourses directly draining the ore zones. AGFs of Sn, Bi, Mo and W, characteristic of tin ore and rare-metal mineralization, which are practically absent in this area, are not manifested.
Sampling the watercourse heads in conditions of cryolithogenesis zones when performing a geochemical survey of LSSs on the 1:50,000 scale is more effective than taking only double samples at the stream mouths of the second-order, rarer than the first-order, as recommended for surveys on the 1:200,000 scale (see Section 3.1). Au and Hg are illustrative examples. In their concentration distribution in the alluvial sediments of the streams draining the Dukat deposit Au–Ag zones, clear patterns were identified. When passing from the first-order watercourse to the watercourse of each subsequent order, the content of these elements in the samples is sharply reduced (Table 4). The highest concentrations of Au (maximum—0.45 ppm; average—0.078 ppm) and Hg (maximum—1.5 ppm; average—0.28 ppm) were found in the alluvium of the first-order watercourses directly eroding the Au–Ag ore zones. When these streams enter larger watercourses of the second-order, noticeable flow dilution and content decrease occur. The maximum (0.23 ppm) and average (0.041 ppm) Au contents reduce twice. For Hg, these values are even higher: the maximum contents (0.33 ppm) reduce by almost five times and the average (0.10 ppm) by almost three times. When considering the streams of the third-order, there is already a more significant fivefold reduction in both the maximum (0.090 ppm) and the average (0.017 ppm) Au concentrations with regard to the first-order watercourses. The maximum Hg contents (0.12 ppm) decrease by more than twelve times and the average (0.034 ppm) by eight times with regard to the first-order watercourses.
Histograms, as seen in Figure 27, provide a more visual representation of the Au and Hg content distribution depending on the order of the watercourse. It can clearly be seen in them that the maximum anomalous contents of Au > 0.05 ppm (CR > 10) and Hg > 0.1 ppm (CR > 20) are most often fixed in samples taken from watercourses of the first-order (frequency of a given content interval for Au—47%; for Hg—61%). Such contents exist more rarely in the alluvium of second-order watercourses (frequency for Au—30%; for Hg—48%) and extremely rarely in third-order watercourses (frequency for Au—7%; for Hg—8%). It should be noted that concentrations of Au > 0.1 ppm (CR > 20) and Hg > 0.2 ppm (CR > 40) in third-order watercourse sediments were not identified at all. The sampling efficiency of first-order watercourses in the conditions of cryolithogenesis zones for Au and Hg anomalies is revealing, and, as a consequence, a more reliable determination of AGFs belonging to a particular type of mineralization is obvious. Other researchers, when studying the Au stream sediments of Russian auriferous deposits also formed under the conditions of cryolithogenesis zones in the territories of the North Priamurye [20,103] and Pre Kolyma regions [104], have reached the same conclusion.
The typomorphic composition of exogenous AGFs (element associations) and their distribution patterns in space in the Dukat Au–Ag deposit and the associated area are shown in the polyelement geochemical map (Figure 28, Table 5).
Predominantly Ag and Au–Ag element associations are distinctly fixed in the LSSs of the Dukat deposit. Spatially, they are combined with Ag–Pb and have a complex composition, which is related to the draining by watercourses not only in Au–Ag but also manifested here in Ag–Pb mineralization zones. Au–Ag associations with the maximum contents of the main typomorphic elements fix the most gold-rich central part of the deposit. High contents are typical of Ag and Pb and less high contents of Hg, Au, Zn and Cu. Such elements as As and Bi are almost not manifested. The main element contents are gradually reduced to the periphery with a simultaneous increase in the AGF development area. In their qualitative and quantitative composition, they are close to the Ag–Pb associations: the main typomorphic elements for the Ag–Pb mineralization type emerge in the first place. The concentrations of Ag, Pb, Cu, Hg, Au and Zn decrease. The concentrations of As, on the contrary, increase, and those of Bi remain almost unchanged. It is necessary to remember here that, for such an element indicator as Sb, due to the use of the SSQA method, it is not possible to detect concentrations of less than 30 ppm. Very few points were observed with contents of 30 ppm. They are confined to the contrast Au–Ag AGFs. Even such sporadic contents are very high for Sb (CR = 150), which confirms its existence in Au–Ag associations in one line with the main typomorphic elements.
From the centre to the periphery, Au–Ag element associations are replaced by Ag–Pb associations, which are widely manifested throughout the area. They are identified on the flanks of the Dukat deposit and in the area of Fakel and Nachalny Ag–Pb prospects. The associations with the highest element indicator concentrations of the Ag–Pb ore mineralization were identified in the watershed of the Yagelny and Neponyatny streams. This may be due to the unidentified latent Ag–Pb mineralization here. The highest concentrations are observed for As, Pb, Sb and Ag and elevated concentrations for Cu, Zn and Hg. Such elements as Bi and Sn are almost not manifested. The AGFs of the Fakel prospect are characterized by associations with lower contents of the above-mentioned elements. In the Nachalny Ag–Pb prospect, the Sb, Pb, Ag, As, Zn and Cu form the maximum concentrations in the associations. To lower degrees, Bi, Sn, and Hg are manifested.
The Ag–Pb element associations in the area’s eastern part are changed by Sn–Ag. Due to the weakly manifested Sn–Ag mineralization type in the investigation area, these associations have local development, a small size and relatively low element contents. The maximum anomalous contents here are typical of basic typomorphic elements, such as Ag, Sn, As, Cu, Pb, Zn and Bi.
All the element associations related to ore mineralization are manifested against the background of the ZDSM. As can be seen from the polyelement geochemical maps, all the associations of ore elements detected within the considered area (predominantly Ag and Au–Ag, Ag–Pb and Sn–Ag) were identified more reliably when surveying LSSs on the 1:50,000 scale.
It is important that, along with the predominant Ag, Au–Ag AGFs were not detected when surveying LSSs on the 1:200,000 scale. Distinctly, from the centre to the periphery, a sequence of lateral geochemical zonality was observed, expressed in the alternation of different types of polyelement AGFs (element associations): Ag and Au–Ag → Ag–Pb → Sn–Ag. This sequence is a reflection of the previously identified primary vertical geochemical zonality in the Au–Ag Dukat deposit [56,80,102,105]. It may be argued that the element composition of the exogenous AGFs, identified through LSSs when conducting the survey on the 1:50,000 scale, unlike the surveys on the 1:200,000 scale, is fully consistent with the composition and structure of drained and eroded ore zones.
Despite the number of the above advantages, there is an important circumstance that makes it difficult to perform surveys of LSSs on the 1:50,000 scale for ore mineralization prospecting. It is impossible to take alluvial samples from the watercourse heads, where, in cryolithogenesis conditions, the loose sediments are poorly formed and often non-existent. This may be due to the sod cover of watercourses’ heads, their temporary nature, the effects of freezing temperatures on the mechanical and, especially, chemical weathering processes as well as the river material transfer. As a result, watercourses of the first-order are often made of coarse-grained sediments with rare manifestations of large, poorly rounded pebbles. The alluvial sediments required for sampling are fragmentary, absent or formed with a severe shortage of the sandy silt material that concentrates most of the ore elements. All this is especially true in cryolithogenesis zones, where the main process that forms LSSs is considered to be physical weathering. It is obvious that, in such situations, it becomes necessary to carry out detailed research to develop additional methods that are able to eliminate the above disadvantages. We have carried out this work. We have established that, when sampling the first-order watercourses, it is effective to carry out bryolithochemical research and study the binding forms (BFs) of element indicators in LSSs and in ores with their subsequent comparison.
4.3. Bryolithochemical Research When Prospecting for Gold–Silver Mineralization Based on the Stream Sediments
G.P. Lapaev began to use aquatic mosses in the ore deposits for the first time when prospecting along watercourses in the USSR [106]. The essence of his method was to study the distribution of trace elements in surface fresh waters by selecting the aquatic mosses growing in them, carefully washing from them the sandy silt fraction. Later, aquatic mosses were also used by V.A. Zagoskin [107]. In contrast with G.P. Lapaev’s method, the element concentration determination is performed not with the ash of purified aquatic mosses but with the moisture obtained from pressing them. All the proposed methods have been named bryogeochemical ones and are, in fact, a kind of hydrogeochemical method. Foreign researchers have also used mosses to search for minerals [108,109,110]. Their proposed methods are similar to those used by G.P. Lapaev.
The complexity of all the above bryogeochemical methods [106,107,108,109,110] stems from the necessity of searching for aquatic mosses. Their existence requires an aquatic environment, which is practically absent in temporary watercourses of the first-order. In addition, the ash microelement composition of aquatic mosses reflects not so much the biogeochemical stream’s sediment composition but the river water’s mineral composition. The chemical element content in the mosses supplying the water is significantly lower than that of the material of river sediments. Among other things, the burning of pure moss significantly reduces the ash content percentage, which, in turn, requires the initial sample selection to be sufficiently large by weight. One more serious drawback of the previously proposed methods is the operational complexity of separating the alluvium from the moss cushion. Our version of bryolithochemical method [111] is free from these disadvantages.
Special bryolithochemical research was carried out for the development of this procedure. It was conducted at the Chaika site of the Dukat Au–Ag deposit along the first-order watercourses draining the Au–Ag ore zones (see Figure 2, Section 2.2, and Figure 29). The choice of just this site can be explained by the fact that there was an opportunity here to sample both the mosses together with the silt and sandy silt material that is firmly held by the moss cushion (Figure 30), and the traditional lithochemical material. This is necessary for further comparing the element contents in bryolithochemical stream sediments (BSSs) and LSSs. The whole sampled material was divided into two samples—lithochemical and bryolithochemical samples. In the first sample, silt–sand material was separated from the moss cushion. The second sample was a moss with mostly silt material that was difficult to separate. To compare the element contents in all the samples, at sites where alluvium was formed fragmentarily, a lithochemical sample consisting mainly of sandy material was taken in the traditional way.
The main attention was paid to Au and Ag, which are the main element indicators for the Au–Ag mineralization type. Their concentration levels in bryolithochemical samples significantly exceed those that were identified in the lithochemical material, taken both from the moss cushion and in the traditional way. The Au concentrations in the bryolithochemical samples reach 0.802 ppm, which is much higher than the content of this element in the lithochemical material selected from the moss cushion (0.205 ppm and less). Even lower contents of this element were identified in lithochemical samples taken using the traditional method (0.085 ppm and less). The Ag distribution is characterized by the same peculiar properties. The maximum concentrations of Ag were identified in bryolithochemical samples and reach 100 ppm. This element’s contents in all the lithochemical samples do not exceed 20 ppm.
The initial data obtained regarding the material composition of bryolithochemical samples by EPMA are of considerable interest. A large number of non-metallic mineral fragments (quartz and feldspar) and Fe and Mn hydroxides were detected in such samples. Ore minerals are represented by finely dispersed electrum particles (<10 μm), silver mineral relics and strongly destroyed small grains of pyrite, sphalerite, and galena. According to the preliminary data, Au (up to 0.61 wt %) constantly presents in small particles of arsenic pyrite in the form of an impurity. The particles, consisting of Au and Ag, do not often exceed 1–2 μm. They tend to connect in aggregates, the size of which reaches 50 μm (Figure 31). Inside these aggregates, the particles are distributed very unevenly. They are represented, as in ores, by electrum and the severely destroyed silver sulphosalts.
Based on the research carried out, we can conclude that the concentration levels of ore elements, primarily Au and Ag, in bryolithochemical samples significantly exceed those identified in lithochemical samples. Moss cushions are an effective natural trap extracting finely dispersed lithoparticles from the water suspension of present watercourses, even temporary ones. Along with the main vein minerals (quartz and feldspar), these particles are represented by electrum, silver mineral relics and strongly destroyed grains of simple sulphides, which largely reflect the peculiar properties of the primary ore’s material composition.
4.4. The Binding Forms of Element Indicators of Gold–Silver Mineralization in Lithochemical Stream Sediments
A detailed study of the distribution peculiarities and BFs of mineralization element indicators in LSSs, like bryolithochemical research, was carried out at the Chaika site of the Dukat Au–Ag deposit (see Figure 2, Section 2.2, and Figure 29, Section 4.3) [23,24,29]. Ores, relative to typical epithermal Au–Ag mineralization, are preserved best here [56]. The study of the alluvium material composition of the watercourses draining these ores was initiated by means of a polarizing light microscope. Quartz, feldspar, Fe oxides and hydroxides are the most prevalent. As for alluvium secondary minerals, anglesite, cerussite, chalcocite, covellite, manganese hydroxides and oxides occur more rarely. Preserved close to the primary minerals, they are seldom present. Poorly destroyed minerals, oxidizing to varying degrees magnetite and rarely galena, were well diagnosed. Individual galena grains can be found either in the rim of cerussite–anglesite or in a relic form. Fragments of other sulphides are even more rare. These are pyrite, chalcopyrite and sphalerite. Small grains (0.01–0.005 mm), with a high reflective index, which we could not identify with an optical microscope, are presumably attributable to silver-containing formations. In the course of the work, it became obvious that the study of ore element BFs in loose alluvial sediments of watercourses is ineffective using traditional mineralogical methods. The successful solution of such types of tasks is directly related to the determination of the substance composition in micron inclusions and only through local methods, such as EPMA [93,94,95,96]. The binding forms of Au, Ag, Hg, Sb, As, Pb and Zn, the basic element indicators for the Au–Ag mineralization type, were investigated.
Gold in alluvial sediments, as well as in ores, is represented by electrum micro- and fine-dispersed particles, which are heterogeneous in composition and reduced in fineness (330–480‰). Electrum submicron inclusions of the same fineness were identified in pyrite. Pyrite is a main concentrator of Au in ores and a carrier in halo zones, including loose sediments of LSSs. In this sulphide, 90% or more is shared with the “invisible” Au. A high content of admixed Au (up to 0.41 wt %) was detected in arsenic pyrite, which is still lower than in pyrite of bryolithochemical samples (see Section 4.3). In addition to pyrite, the mineral concentrators of “invisible” Au include Fe hydroxides (up to 0.91 wt %) and silver minerals—destroyed acanthite grains (up to 0.73 wt %) and sternbergite (up to 0.70 wt %). Gold, bound with Fe hydroxides and sulphide minerals, after their destruction and oxidation, is easily leached by conventional natural acids, passes into a mobile form and has a significant impact on the LSS formation of this element, even in the conditions of cryolithogenesis zones. Contrary to the traditional view that the main role in the LSS formation in permafrost regions is played by physical weathering, it can be argued that no less important role belongs to the processes of chemical weathering (dissolution, oxidation, sorption, and chemisorption). This refers not only to Au but also to other element indicators of Au–Ag mineralization, which are discussed below.
Silver in LSSs, as well as in ores, is the most prevalent. Its mineral BFs are represented mainly by acanthite, the grains of which are corroded and oxidized to varying degrees. A significant part of them has a hypergene appearance. As impurities in acanthite, Pb, Cu and Se are observed (Figure 32, Table 6). Native silver, kustelite and sternbergite are much rarer. Native silver, as well as Au, is represented by finely dispersed particles (<10 μm). Hypergene segregation of native Ag and sternbergite was often observed during the decomposition of silver-containing base-metal minerals. Relic segregation of acanthite–sternbergite was identified in the Fe hydroxides. Among the Ag sulphosalts, pyrargyrite and proustite were observed—minerals that are characteristic only of the supra-ore and upper-ore horizons of the Dukat deposit and that, with a sufficient degree of probability, can speak in favor of the positive prediction of deep mineralization.
Mercury is one of the important element indicators accompanying Au–Ag mineralization. It is typical of supra-ore and upper-ore horizons. This element’s main BFs in ores are adsorbed and isomorphous ones. The major mineral concentrators are sphalerite, galena, Ag sulphosalts, argentite, native Ag, kustelite and electrum. The Hg sulphide form, cinnabar, observed in other Au–Ag deposits in the north–east of Russia, was identified neither in ores nor in the halos of the Dukat deposit’s Au–Ag zones [56,102]. In the alluvial sediments of watercourses draining Au–Ag ores, along with relics of primary minerals containing Hg up to 1 wt %, secondary minerals are widely prevalent. These are Fe oxides and hydroxides containing up to 0.5 wt % Hg and secondary formations of Ag, Pb and Zn containing up to 0.2 wt % Hg. Mercury’s admixture is often associated with corroded grains of acanthite and sternbergite and more rarely with kustelite and native silver.
Antimony and arsenic, as well as Hg, are typical of the supra-ore and upper-ore horizons of Au–Ag ore zones [56,102]. Despite the fact that, in the area of the Dukat deposit, these elements form a very contrasting LSS, their own mineral forms in alluvium are extremely rare, mainly appearing as pyrargyrite. Sb and As were identified as impurities in pyrite, chalcopyrite and Ag sulphides. These elements’ adsorbed forms are widely prevalent in Fe hydroxides. In addition, grains corresponding to pitticite composition were detected; this in turn is a product of arsenopyrite destruction, forming in hypergene environments in poorly soluble forms. Arsenopyrite, which is not typical of volcanogenic Au–Ag ores, has a fairly wide distribution in the Dukat deposit, mainly in the hosting rocks in the development zones of areal sulphide mineralization. Its appearance in the stream sediments indicates the influence of the hosting rocks on their formation and explains the wide manifestation of As AGFs throughout the entire deposit area. It can also explain the fact that a significant part of the As anomalies detected in the territory of the Dukat OFS are related not only to Au–Ag but in general to profitable ore mineralization.
Lead in loose alluvial sediments of LSSs is rarely manifested as individual grains, mainly either in the rim of cerussite–anglesite or in relic form. The association of anglesite with acanthite is observed (see Table 6). Fe hydroxides are often found, forming joint rims around galena and sometimes creating thin concentric zonal and looped structures. Galena needles are met, developing in largely corroded magnetite. In some cases, these segregations are developed quite intensively and almost completely replace the entire grain of magnetite.
Zinc, against the background of relatively low contents in LSSs, is represented most often by an admixture, mainly in Fe hydroxides and in pyrite. It is extremely rare for its own mineral forms to be observed and to varying degrees, oxidized and corroded single crystals of sphalerite or intermetallic compounds of Zn with Cu. Similar compounds have been found in primary ores [112]. Most often sphalerite is in the rim of Ag-containing minerals.
Comparing the BFs of Au, Ag and their accompanying elements (Hg, Sb, As, Pb and Zn) in LSS loose alluvial sediments of the Dukat deposit’s Au–Ag zones, we can see that their material composition is closely related to the Au–Ag ores’ composition (see Section 2.2). In watercourses’ alluvial sediments and in the ores, the finely dispersed native Au (electrum), “invisible” Au in sulphides, native Ag, kustelite, silver sulphides (acanthite and sternbergite) and silver sulphosalts (pyrargyrite), pyrite, galena, and sphalerite are the main ones.
5. Conclusions
Surveys of LSSs on the 1:200,000 scale in the conditions of cryolithogenesis zones in the mountainous regions of the north-east of Russia are the most effective in poorly studied territories, where information about the geochemical features and metallogeny of the region as a whole is absent. A regional survey of LSSs allows basic information about the metallogeny of the entire region to be obtained in a relatively short time. Metallogenic specialization in the studied Au–Ag area is distinctly manifested only in respect of Ag, Pb and Sn. Small-scale surveys of LSSs allow to establish the regional geochemical zonality: less eroded areas in the west (the Dukat Au–Ag OFS) are characterized by Ag, Ag–Pb and Sn–Ag AGFs and more eroded areas in the east (associated with Dukat Au–Ag OFS areas) by Sn, Sn–W and Mo–W AGFs.
However, there are significant drawbacks. Exogenous AGFs detected from such surveys have lower contrast. A decrease in the fields’ natural contrast was identified, resulting in the simplification of their main component composition in the direction of the primary halo → secondary halo → stream sediments. In some cases, violation of the qualitative and quantitative functional relationships happens between the elements. All this complicates the study of the composition, construction and AGF development scope. In other words, the exogenous AGF typification and zonality identification become difficult—the main indicator used to assess the level of ore zones’ erosive profile, the assessment of the mineralization type and, as a consequence, the estimation of their profitable value become less efficient.
The survey of LSSs on the 1:50,000 scale carried out within the Dukat Au–Ag deposit and associated area showed that, in the interpretation of such anomalies at the stage of prospecting and evaluation, the sampling of first-order watercourses is effective. Alluvial sediments of watercourse heads are characterized by the highest element concentrations, primarily Au. As a result, the number of anomalies revealed increases significantly, and increased concentrations of elements in channel sediments, in most cases, are directly dependent on the presence and type of drained ore mineralization. Besides, the AGFs revealed during the survey of LSSs on the 1:50,000 scale are fully consistent with the composition and construction of eroded and drained ore objects, and the identified exogenous geochemical zonality is a reflection of the endogenous one.
However, there is an important circumstance, which makes such survey difficult to carry out. The alluvial sediments of the first-order watercourses required for sampling are fragmentary, absent or formed with a sharp deficit of sandy silt material concentrating most of the ore elements. Discontinuity and extremely uneven distribution of mineralization element indicators while transporting material are typical of LSSs. This is especially true for cryolithogenesis zones, where physical weathering is considered to be the main process forming LSSs.
In such situations, a positive result can be obtained using the bryolithochemical method that we developed. It not only allows researchers to carry out sampling in watercourse heads, where alluvial sediments are poorly or not at all formed, but also makes it possible to obtain more reliable information about the anomalies’ presence or absence. In the example of the behavior of Au and Ag in bryolithochemical stream sediments, which are the main element indicators of the Au–Ag mineralization type, it was found that their concentration in bryolithochemical samples is considerably higher than in lithochemical ones.
It was shown that the element indicator BFs in BSSs and LSSs can be used as an effective additional criterion for the interpretation and evaluation of the identified anomalies. It was established that these BFs, generally agree with these elements’ BFs in ores, and sufficiently reflect the peculiarities of their mineral and geochemical composition. It was shown that moss cushions are an effective natural trap for finely dispersed fractions of alluvium. They extract not only small but also finely dispersed particles of minerals, up to submicron ones, from the water suspension of actual watercourses, even temporary ones.
The implemented investigations have shown that the revealed regularities can be applied successfully at all stages of the geochemical study of ore-bearing areas, from expectation assessment in poorly studied territories to detailed work on already-known ore objects. The proposed methods for exogenous AGFs’ identification and the criteria developed for their evaluation are quite simple and effective. They may also be used at all stages of prediction and prospecting for ore mineralization, primarily Au–Ag, not only in the north–east of Russia but also in other regions where the LSS formation occurs in cryolithogenesis zones.
Author Contributions
Conceptualization, R.G.K.; methodology, A.S.M. and R.G.K.; formal analysis, A.S.M. and V.V.T.; investigation, R.G.K., A.S.M. and V.V.T.; writing–original draft preparation, A.S.M.; writing–review and editing, R.G.K.; visualization, A.S.M. and R.G.K.
Funding
This study was performed within the framework of the State Assignment Project No. IX.130.3.1. (0350-2019-0010), with support from the Russian Federation President Foundation (Grant No. MK-2645.2019.5) and the Russian Foundation for Basic Research (Grant No. 18-33-00369). We used the scientific equipment of the “Isotope-Geochemical Research” Center for Common Use of IGC SB RAS, Irkutsk, Russia.
Acknowledgments
The authors are grateful to the staff of IGC SB RAS (Irkutsk) for their assistance in analytical studies: I.E. Vasileva, E.V. Shabanova, S.S. Vorobyeva, N.E. Smolyanskaya, N.L. Chumakova (spectral analysis); S.Ts. Rinchinova, L.D. Andrulaitis, P.T. Dolgikh, V.N. Vlasova, T.S. Krasnoshchekova, O.S. Ryazantseva, E.V. Matveeva (atomic absorption analysis); and L.A. Pavlova (EPMA). The authors would like to express special thanks to the leadership of the PGO “Sevvostokgeologiya” (Magadan) for providing geological documentation and survey material on the 1:200,000 scale. The authors are also sincerely grateful to all the geological services of the Dukat geological exploration enterprise (Magadan) for their comprehensive assistance in performing fieldwork and their technical support.
Conflicts of Interest
The authors declare no conflict of interest.
References
- NEDRADV. Russian Resources. Gold of Russia. 2017. Available online: https://nedradv.ru/nedradv/ru/resources/?obj=ab05b068239ede80d3dd35cf40638bd2 (accessed on 4 December 2019). (In Russian).
- NEDRADV. Russian Resources. Silver of Russia. 2017. Available online: https://nedradv.ru/nedradv/ru/resources/?obj=ab05b068239ede80d3dd35cf4069b0ca (accessed on 4 December 2019). (In Russian).
- Struzhkov, S.F.; Konstantinov, M.M. The Metallogeny of Gold and Silver in the Okhotsk–Chuckchee Volcanogenic Belt; Nauchny Mir: Moscow, Russia, 2005; p. 320. (In Russian) [Google Scholar]
- Benevolsky, B.I.; Vartanyan, S.S.; Volchkov, A.G.; Kurbanov, N.K.; Novikov, V.P.; Struzhkov, S.S. The status, problems and development ways of noble metals’ mineral resource base. Rudy Met. 2009, 1, 14–18. (In Russian) [Google Scholar]
- Mikhailov, B.K.; Benevolsky, B.I.; Vartanyan, S.S.; Volchkov, A.G.; Migachev, I.F. The status and development ways of Russia noble and nonferrous metals’ mineral resource base. Razved. Okhrana Nedr 2012, 9, 76–83. (In Russian) [Google Scholar]
- Mikhailov, B.K.; Ivanov, A.I.; Vartanyan, S.S.; Benevolsky, B.I. Problems of the Russian gold mineral resource base. Rudy Met. 2015, 1, 93–99. (In Russian) [Google Scholar]
- Ivanov, A.I.; Vartanyan, S.S.; Chernykh, A.I.; Benevolskiy, B.I.; Golubev, Y.K. The status and development prospects of Russian diamonds and gold mineral resource base. Razved. Okhrana Nedr 2016, 9, 95–100. (In Russian) [Google Scholar]
- Ivanov, A.I.; Chernykh, A.I.; Vartanyan, S.S. The status, development and exploration prospects of the gold mineral resource base in the Russian Federation. Otechestvennaya Geol. 2018, 1, 18–28. (In Russian) [Google Scholar]
- Kvashnevskaya, N.V. Prospecting for ore deposits on stream sediments. In Geochemical Prospecting for Ore Deposits in the USSR; Gosgeoltekhizdat: Moscow, Russia, 1957; pp. 146–157. (In Russian) [Google Scholar]
- Bogolyubov, A.N.; Sochevanov, N.N. Small-scale metallometric searches for polymetals on halos and stream sediments. Razved. Okhrana Nedr 1959, 10, 9–12. (In Russian) [Google Scholar]
- Krasnikov, V.I. Rational Method Fundamentals of Ore Deposit Prospecting; Gosgeoltekhizdat: Moscow, Russia, 1959; p. 412. (In Russian) [Google Scholar]
- Polikarpochkin, V.V. Geochemical methods for ore deposit prospecting on stream sediments. Sov. Geol. 1963, 4, 63–76. (In Russian) [Google Scholar]
- Polikarpochkin, V.V. Secondary Halos and Stream Sediments; Nauka: Novosibirsk, Russia, 1976; p. 408. (In Russian) [Google Scholar]
- Solovov, A.P. Actual situation and development perspectives of geochemical methods for ore deposit prospecting. Vestn. Mosk. Univ. Seriya Geol. 1978, 2, 3–28. (In Russian) [Google Scholar]
- Solovov, A.P. Geochemical Methods for Mineral Deposit Prospecting; Nedra: Moscow, Russia, 1985; p. 294. (In Russian) [Google Scholar]
- Solovov, A.P.; Arkhipov, A.Y.; Bugrov, V.A.; Vorobyev, S.A.; Gershman, D.M.; Grigoryan, S.V.; Kvyatkovsky, E.M.; Matveev, A.A.; Milyaev, S.A.; Nikolaev, V.A.; et al. Handbook of Geochemical Prospecting for Minerals; Nedra: Moscow, Russia, 1990; p. 335. (In Russian) [Google Scholar]
- Abisalov, E.G. Advanced lithochemical searches on stream sediments. Razved. Okhrana Nedr 1977, 9, 20–24. (In Russian) [Google Scholar]
- Pitul’ko, V.M.; Kritsuk, I.N. Data Interpretation Basics of Prospecting Geochemistry; Nedra: Leningrad, Russia, 1990; p. 336. (In Russian) [Google Scholar]
- Kravtsova, R.G.; Zakharov, M.N.; Ivanov, O.P. Combined geochemical investigations of the Pestrinsk silver-bearing field (Northeast Russia). Geol. Ore Depos. 1996, 38, 378–389. [Google Scholar]
- Sokolov, S.V. Structures of Anomalous Geochemical Fields and Mineralization Forecasting; Nauka: Saint Petersburg, Russia, 1998; p. 154. (In Russian) [Google Scholar]
- Domchak, V.V. Some features of ore substance scattering in mountain river alluvium of Stanovoy ridge. Razved. Okhrana Nedr 2008, 4–5, 99–103. (In Russian) [Google Scholar]
- Romanov, V.A. Stream sediments: Theory, methodology and practice. Ways of further development. Otechestvennaya Geol. 2008, 1, 78–82. (In Russian) [Google Scholar]
- Kravtsova, R.G.; Pavlova, L.A.; Rogozina, Y.I. Modes of Ag occurrence in the loose deposits of dispersal trains at Au–Ag mineral deposits. Geochem. Int. 2010, 48, 731–736. [Google Scholar] [CrossRef]
- Kravtsova, R.G.; Pavlova, L.A.; Rogozina, Y.I.; Makshakov, A.S. First data on forms of gold occurrence in lithochemical sedimental streams of the gold-silver Dukat deposit (Northeastern Russia). Dokl. Earth Sci. 2010, 434, 1184–1191. [Google Scholar] [CrossRef]
- Kravtsova, R.G.; Makshakov, A.S. Stream sediments of gold–silver ore-forming systems (Balygychan–Sugoisk depression, Northeast of Russia). In Gold of the North Pacific Rim, Proceedings of the Geology & Mining Conference and II International Geology & Mining Forum dedicated to Yu. A. Bilibin’s 110th anniversary, Magadan, Russia, 3–5 September 2011; Goryachev, N.A., Ed.; NEISRI FEB RAS: Magadan, Russia, 2011; pp. 249–250. [Google Scholar]
- Matveev, A.A.; Solovov, A.P. Geochemical Methods for Mineral Deposit Prospecting; KDU: Moscow, Russia, 2011; p. 564. (In Russian) [Google Scholar]
- Romanov, V.A. The method of geochemical search for and quantification of mineralization in stream sediments. Rudy Met. 2011, 3–4, 144–145. (In Russian) [Google Scholar]
- Kravtsova, R.; Makshakov, A. Anomalous geochemical fields of Au–Ag ore-forming systems of the Northern Priokhotje (Russia). In Geoanalysis 2012, Proceedings of the 8th International Conference on the Analysis of Geological and Environmental Materials, Buzios, Brazil, 16–20 September 2012; International Association of Geonalysts: Buzios, Brazil, 2012; Abstract PT.62; p. 123. [Google Scholar]
- Kravtsova, R.G.; Tarasova, Y.I.; Makshakov, A.S.; Pavlova, L.A. Distribution and modes of occurrence of Au, Ag, and associated elements in the sediment streams of Au–Ag zones at the Dukat deposit (Northeastern Russia). Russ. Geol. Geophys. 2016, 57, 529–548. [Google Scholar] [CrossRef]
- Kitaev, N.A.; Spiridonov, A.M.; Zorina, L.D. Gold-Bearing Formations of Eastern Transbaikalia and Amur Region: Ore Genesis Conditions, Composition and Structure of Geochemical Fields; Academic Publishing House “Geo”: Novosibirsk, Russia, 2018; p. 228. (In Russian) [Google Scholar]
- Hawkes, H.E.; Webb, J.S. Geochemistry in Mineral Exploration; Mir: Moscow, Russia, 1964; p. 488. (In Russian) [Google Scholar]
- Levinson, A. Introduction to Exploration Geochemistry; Mir: Moscow, Russia, 1976; p. 449. (In Russian) [Google Scholar]
- Brown, B.W. Error in lead anomalous stream sediments. Econ. Geol. 1970, 65, 514–515. [Google Scholar] [CrossRef]
- Bradshaw, P.M.D.; Clews, D.R.; Walker, J.L. Exploration Geochemistry; Barringer Research Ltd.: Rexdale, ON, Canada, 1972; p. 304. [Google Scholar]
- Hawkes, H.E. The downstream dilution of stream sediment anomalies. J. Geochem. Explor. 1976, 6, 345–358. [Google Scholar] [CrossRef]
- Levinson, A.A. Introduction to Exploration Geochemistry, 2nd ed.; Applied Publishing: Wilmette, IL, USA, 1980; p. 924. [Google Scholar]
- Chork, C.Y.; Cruikshank, B.I. Statistical map analysis of regional stream-sediment data from Australia. J. Geochem. Explor. 1984, 21, 405–419. [Google Scholar] [CrossRef]
- Day, S.J.; Fletcher, W.K. Effects of valley and local channel morphology on the distribution of gold in stream sediments from Harris Creek, British Columbia, Canada. J. Geochem. Explor. 1989, 32, 1–16. [Google Scholar] [CrossRef]
- Siegel, F.R. Exploration for Mississippi-Valley type stratabound Zn ores with stream suspensates and stream sediments, Virginia, U.S.A. J. Geochem. Explor. 1990, 38, 265–283. [Google Scholar] [CrossRef]
- Fletcher, W.K.; Loh, C.H. Transport equivalence of cassiterite and its application to stream sediment surveys for heavy minerals. J. Geochem. Explor. 1996, 56, 47–57. [Google Scholar] [CrossRef]
- Xie, X.; Mu, X.; Ren, T. Geochemical mapping in China. J. Geochem. Explor. 1997, 60, 99–113. [Google Scholar]
- Melo, G.; Fletcher, W.K. Dispersion of gold and associated elements in stream sediments under semi-arid conditions, northeast Brazil. J. Geochem. Explor. 1999, 67, 235–243. [Google Scholar] [CrossRef]
- Naseem, S.; Sheikh, S.A.; Qadeeruddin, M.; Shirin, K. Geochemical stream sediment survey in Winder Valley, Balochistan, Pakistan. J. Geochem. Explor. 2002, 76, 1–12. [Google Scholar] [CrossRef]
- Ohta, A.; Imai, N.; Terashima, S.; Tachibana, Y. Influence of surface geology and mineral deposits on the spatial distributions of elements concentrations in the stream sediments of Hokkaido, Japan. J. Geochem. Explor. 2005, 86, 86–103. [Google Scholar] [CrossRef]
- Macdonald, E.H. Handbook of Gold Exploration and Evaluation; Woodhead Publishing Limited: Cambridge, UK, 2007; p. 647. [Google Scholar]
- Carranza, E.J.M. Analysis and mapping of geochemical anomalies using logratio-transformed stream sediment data with censored values. J. Geochem. Explor. 2011, 110, 167–185. [Google Scholar] [CrossRef]
- Yousefi, M.; Carranza, E.J.M.; Kamkar-Rouhani, A. Weighted drainage catchment basin mapping of geochemical anomalies using stream sediment data for mineral potential modeling. J. Geochem. Explor. 2013, 128, 88–96. [Google Scholar] [CrossRef]
- Ali, L.; Williamson, B.J.; Moon, C.J.; Shah, M.T.; Khattak, S.A. Distribution of gold in different size fractions of stream sediments as a guide to bedrock gold mineralisation along the Shyok Suture Zone and adjacent areas of the Kohistan Island Arc, Pakistan. Arabian J. Geosci. 2015, 8, 2227–2235. [Google Scholar] [CrossRef]
- Yilmaz, H.; Sonmez, F.N.; Carranza, E.J.M. Discovery of Au–Ag mineralization by stream sediment and soil geochemical exploration in metamorphic terrain in western Turkey. J. Geochem. Explor. 2015, 158, 55–73. [Google Scholar] [CrossRef]
- Chen, X.; Zheng, Y.; Xu, R.; Wang, H.; Jiang, X.; Yan, H.; Cai, P.; Guo, X. Application of classical statistics and multifractals to delineate Au mineralization-related geochemical anomalies from stream sediment data: A case study in Xinghai-Zeku, Qinghai, China. Geochem. Explor. Environ. Anal. 2016, 16, 253–264. [Google Scholar] [CrossRef]
- Xiao, F.; Chen, J.; Hou, W.; Wang, Z.; Zhou, Y.; Erten, O. A spatially weighted singularity mapping method applied to identify epithermal Ag and Pb–Zn polymetallic mineralization associated geochemical anomaly in Northwest Zhejiang, China. J. Geochem. Explor. 2018, 189, 122–137. [Google Scholar] [CrossRef]
- Chen, D.; Wei, J.; Wang, W.; Shi, W.; Li, H.; Zhan, X. Comparison of methods for determining the thresholds of geochemical anomalies and the prospecting direction—A case of gold deposits in the Gouli exploration area, Qinghai Province. Minerals 2019, 9, 368. [Google Scholar] [CrossRef] [Green Version]
- Shahrestani, S.; Mokhtari, A.R.; Carranza, E.J.M.; Hosseini-Dinani, H. Comparison of efficiency of techniques for delineating uni-element anomalies from stream sediment geochemical landscapes. J. Geochem. Explor. 2019, 197, 184–198. [Google Scholar] [CrossRef]
- Yu, X.; Xiao, F.; Zhou, Y.; Wang, Y.; Wang, K. Application of hierarchical clustering, singularity mapping, and Kohonen neural network to identify Ag–Au–Pb–Zn polymetallic mineralization associated geochemical anomaly in Pangxidong district. J. Geochem. Explor. 2019, 203, 87–95. [Google Scholar] [CrossRef]
- Zomorrodian, M.; Shayestehfar, M.R. Indicator ratios and additive composite halos in stream sediment samples as a geochemical indicator for identifying promising epithermal gold deposit in the north of Kashmar. Arabian J. Geosci. 2019, 12, 331. [Google Scholar] [CrossRef]
- Kravtsova, R.G. Geochemistry and Forming Conditions of Gold–Silver Ore-Forming Systems, Northern Pre Okhotsk Region; Academic Publishing House “Geo”: Novosibirsk, Russia, 2010; p. 292. (In Russian) [Google Scholar]
- Belyi, V.F. Geology of the Okhotsk Chukotsk Volcanogenic Belt; NEISRI FEB RAS: Magadan, Russia, 1994; p. 76. (In Russian) [Google Scholar]
- Belyi, V.F. Problems of geological and isotopic age of the Okhotsk–Chukotsk Volcanogenic Belt (OCVB). Stratigr. Geol. Correl. 2008, 16, 639–649. [Google Scholar] [CrossRef]
- Sidorov, A.A.; Volkov, A.V.; Alekseev, V.Y.; Belyi, V.F.; Kolova, E.E. The gold–silver Okhotsk–Chukotka volcanic belt. Geol. Ore Depos. 2009, 51, 441–455. [Google Scholar] [CrossRef]
- Belyi, V.F. Stratigraphy and Structures of the Okhotsk–Chukotsk Volcanogenic Belt; Nauka: Moscow, Russia, 1977; p. 171. (In Russian) [Google Scholar]
- Goncharov, V.I.; Alshevsky, A.V.; Vortsepnev, V.V. Geology and Minerals of North–East Asia; Nauka: Vladivostok, Russia, 1984; p. 128. (In Russian) [Google Scholar]
- Umitbaev, R.B. Okhotsk–Chaun Metallogenic Province; Nauka: Moscow, Russia, 1986; p. 286. (In Russian) [Google Scholar]
- Bogdanov, N.A.; Til’man, S.M. Tectonics and Geodynamics of North–East Asia: Explanatory Note to Tectonic Map of North-East Asia, 1:5,000,000 Scale; Institute of Lithosphere RAS: Moscow, Russia, 1992; p. 54. (In Russian) [Google Scholar]
- Bogdanov, N.A.; Til’man, S.M. North–East Asia Tectonic Map of 1:5,000,000 Scale; Pushcharovsky, Y.M., Ed.; Committee on Geodesy and Cartography of the Russian Federation: Moscow, Russia, 1992; 1 sheet. (In Russian) [Google Scholar]
- Kotlyar, I.N.; Rusakova, T.B. Cretaceous Magmatism and Ore-Bearing Capacity of the Okhotsk–Chukotsk Region: Geological–Geochronological Correlation; Neisri Feb Ras: Magadan, Russia, 2004; p. 152. (In Russian) [Google Scholar]
- Akinin, V.V.; Khanchuk, A.I. The Okhotsk–Chukotka volcanogenic belt: Age revision based on new 40Ar/39Ar and U-Pb isotope data. Dokl. Earth Sci. 2005, 405, 1131–1135. [Google Scholar]
- Kuznetsov, V.M.; Livach, A.E. Construction and metallogenic zoning of the Balygychan–Sugoy trough. In Problems of Metallogeny of Ore Regions in North–East of Russia: Proceedings; Goncharov, V.I., Kuznetsov, V.M., Eds.; NEISRI FEB RAS: Magadan, Russia, 2005; pp. 156–177. (In Russian) [Google Scholar]
- Volkov, A.V. Gold and silver metallogeny in the Okhotsk–Chukotka volcanic belt. Geol. Ore Depos. 2007, 49, 238–240. [Google Scholar] [CrossRef]
- Sidorov, A.A.; Chekhov, A.D.; Volkov, A.V.; Alekseev, V.Y. Metallogeny of the inner and outer zones of the Okhotsk–Chukotsk volcanogenic belt. Dokl. Earth Sci. 2011, 439, 949–954. [Google Scholar] [CrossRef]
- Ganelin, A.V.; Vatruchkina, E.V.; Luchitskaya, M.V. New data on the volcanism of the Central Chukotka segment of Okhotsk–Chukotka volcanogenic belt. Dokl. Earth Sci. 2019, 485, 252–256. [Google Scholar] [CrossRef]
- Tsopanov, O.K. Metallogenic Map of Magadan Region and Adjacent Territories. Scale 1:1,500,000; Tsopanov, O.K., Ed.; VSEGEI: Saint Petersburg, Russia, 1994; 1 sheet. (In Russian) [Google Scholar]
- Filatov, S.I. USSR Geological Map of 1:200,000 Scale. Sheet P-56-XVIII. Explanatory Note; Nedra: Moscow, Russia, 1965; p. 52. (In Russian) [Google Scholar]
- Filatov, S.I. USSR Geological Map of 1:200,000 Scale. Sheet P-56-XII. Explanatory Note; Nedra: Moscow, Russia, 1979; p. 48. (In Russian) [Google Scholar]
- Konstantinov, M.M.; Natalenko, V.E.; Kalinin, A.I.; Strujkov, S.F. Dukat Gold–Silver Deposit; Nedra: Moscow, Russia, 1998; p. 203. (In Russian) [Google Scholar]
- Plyashkevich, A.A. Mineralogy and Geochemistry of North–East Russian Tin–Silver Polymetallic Deposits; NEISRI FEB RAS: Magadan, Russia, 2002; p. 72. (In Russian) [Google Scholar]
- Konstantinov, M.M.; Kostin, A.V.; Sidorov, A.A. The Geology of Silver Ore Deposits; SUE NPPC “Sakhapolygraphizdat”: Yakutsk, Russia, 2003; p. 282. (In Russian) [Google Scholar]
- Pristavko, V.A.; Plyashkevich, A.A. Complex mineralization of the Dukat ore region northern part: Mineralogical–geochemical aspect. In Problems of Metallogeny of Ore Regions in the North–East of Russia: Proceedings; Goncharov, V.I., Kuznetsov, V.M., Eds.; NEISRI FEB RAS: Magadan, Russia, 2005; pp. 234–250. (In Russian) [Google Scholar]
- Savva, N.Y. Metallogeny peculiarities of continental rift in the example of the Dukat ore region. In Problems of Metallogeny of Ore Regions in the North–East of Russia: Proceedings; Goncharov, V.I., Kuznetsov, V.M., Eds.; NEISRI FEB RAS: Magadan, Russia, 2005; pp. 196–219. (In Russian) [Google Scholar]
- Kalinin, A.I.; Yarantseva, L.M.; Natalenko, V.E.; Kanishchev, V.K. Silver–polymetallic mineralization geology of the Novo-Dzhagyn intrusive–dome structure. Kolyma 1984, 1, 29–31. (In Russian) [Google Scholar]
- Kravtsova, R.G.; Borovikov, A.A.; Borisenko, A.S.; Prokof’ev, V.Y. Formation conditions of gold–silver deposits in the northern Okhotsk region, Russia. Geol. Ore Depos. 2003, 45, 395–415. [Google Scholar]
- Raevskaya, I.S.; Kalinin, A.I.; Natalenko, V.E. About staging and phasing of mineral formation on gold–silver deposit. In Materials on Geology and Mineral Resources of North–East USSR; Book Publishing House: Magadan, Russia, 1977; Issue 23, pp. 149–155. (In Russian) [Google Scholar]
- Natalenko, V.E.; Kalinin, A.I.; Raevskaya, I.S.; Tolstikhin, Y.V.; Khalkhalov, Y.A.; Bel’kov, E.V. Geological setting of Dukat deposit. In Materials on Geology and Mineral Resources of North–East USSR; Book Publishing House: Magadan, Russia, 1980; Issue 25, pp. 61–73. (In Russian) [Google Scholar]
- Sidorov, A.A.; Konstantinov, M.M.; Eremin, R.A.; Savva, N.E.; Kopytin, V.I.; Safronov, D.N.; Naiborodin, V.I.; Goncharov, V.I. Silver: Geology, Mineralogy, Genesis, and Deposits’ Localization Regularities; Nauka: Moscow, Russia, 1989; p. 240. (In Russian) [Google Scholar]
- Konstantinov, M.M.; Strujkov, S.F. Application of indicator halos (signs of ore remobilization) in exploration for blind gold and silver deposits. J. Geochem. Explor. 1995, 54, 1–17. [Google Scholar] [CrossRef]
- Grigoryan, S.V.; Solovov, A.P.; Kuzin, M.F. Instruction on Geochemical Prospecting for Ore Deposits; Ovchinnikov, L.N., Ed.; Nedra: Moscow, Russia, 1983; p. 191. (In Russian) [Google Scholar]
- Taskanova, M.I.; Narutdinova, V.I. Semi-Quantitative Spectral Analysis of Geological Samples by the Scanning Sieve Method on the STE-1 Device: Instruction; TsL SVPGO “Sevvostokgeologiya”: Magadan, Russia, 1980; p. 12. (In Russian) [Google Scholar]
- Vasileva, I.E.; Shabanova, E.V. Arc atomic-emission analysis in geochemical research. Zavod. Lab. Diagn. Mater. 2012, 78, 14–24. (In Russian) [Google Scholar]
- Torgov, V.G.; Khlebnikova, A.A. Atomic-absorption determination of gold in a flame and by means of a flameless graphite atomizer after preliminary extraction separation with petroleum sulfides. J. Anal. Chem. 1977, 32, 753–757. [Google Scholar]
- Rogozhin, A.A. Gold Determination in Rocks, Ores and Their Processed Products by Extraction–Atomic–Absorption Method with Organic Sulphides.; VIMS: Moscow, Russia, 2016; NSAM No 231-S; p. 18. (In Russian) [Google Scholar]
- Novikov, V.M.; Rosinskaya, E.S.; Goldapel, S.Y. The high-sensitive atom-absorptive method for mercury identification in rocks and minerals. In Yearbook 1970. Institute of Geochemistry; Tauson, L.V., Ed.; Institute of Geochemistry: Irkutsk, Russia, 1971; pp. 412–416. (In Russian) [Google Scholar]
- Pogarev, S.E. Measuring Implementation Procedure of Total Mercury Mass Fraction in Samples of Soils, Grounds and Sediments on the Mercury Analyzer RA-915+ with an Attachment RP-91S. Environmental Regulations Federal 16.1:2:23-2000; RPC “Lumex”: Moscow, Russia, 2005; p. 13. (In Russian) [Google Scholar]
- Yorkshire Water. Methods of Analysis, 5th ed.; Yorkshire Water: Leeds, UK, 1989; p. 56. [Google Scholar]
- Pavlova, L.A.; Kravtsova, R.G. Determination of silver binding forms in lithochemical stream sediments by EPMA method (Dukat gold–silver deposit). Metod. Obekty Khimicheskogo Anal. 2006, 1, 132–140. (In Russian) [Google Scholar]
- Pavlova, L. Dependence of determination quality on performance capacity of researching technique, exemplified by the electron probe X-ray microanalysis. In Modern Approaches to Quality Control; Eldin, A.B., Ed.; IntechOpen: London, UK, 2011; pp. 477–504. [Google Scholar]
- Tatarinov, V.V.; Finkelshtein, A.L.; Kravtsova, R.G.; Pavlova, L.A. Determination of the gold-containing micro particles composition in the sulfide mineral matrix using electron probe microanalysis. Anal. Kontrol 2017, 21, 208–215. (In Russian) [Google Scholar] [CrossRef] [Green Version]
- Finkelshtein, A.L.; Tatarinov, V.V.; Finkelstein, E.A.; Pavlova, L.A.; Kravtsova, R.G. About the assessment of gold concentrations in tiny inclusions within sulfide mineral matrix: An electron microprobe study. X Ray Spectrom. 2018, 47, 423–431. [Google Scholar] [CrossRef]
- Evdokimova, V.N. Automated processing system of geological–geochemical information with the multidimensional field method. In Geochemical Prospecting of Ore Deposits in Siberia and the Far East; Polikarpochkin, V.V., Ed.; Nauka: Novosibirsk, Russia, 1978; pp. 3–26. (In Russian) [Google Scholar]
- Kitaev, N.A. Multidimensional Analysis of Geochemical Fields; Nauka: Novosibirsk, Russia, 1990; p. 120. (In Russian) [Google Scholar]
- Vinogradov, A.P. An average chemical elements content in main types of igneous crust rocks. Geokhimiya 1962, 7, 555–571. (In Russian) [Google Scholar]
- Clarke, F.W.; Washington, H.S. The Composition of the Earth’s Crust; U.S. geological survey: Preston, VA, USA, 1924; pp. 127–140.
- Taylor, S.R. Trace element abundances and the chondritic Earth model. Geochim. Cosmochim. Acta 1964, 28, 1989–1998. [Google Scholar] [CrossRef]
- Kravtsova, R.G.; Zakharov, M.N. Geochemical concentration fields of Dukat gold–silver bearing ore magmatic system (North–East Russia). Geol. Geofiz. 1996, 37, 28–38. (In Russian) [Google Scholar]
- Vyunov, D.L.; Stepanov, V.A. Geochemical fields of the Upper Priamurye. Tikhookeanskaya Geol. 2004, 23, 116–124. (In Russian) [Google Scholar]
- Milyaev, S.A.; Chekvaidze, V.B.; Isakovich, I.Z. Conjugated systems: Ore body+primary halo—Secondary halo—Stream sediments on the Natalkinskoe ore field example, North–East Russia. Otechestvennaya Geol. 2010, 1, 47–54. (In Russian) [Google Scholar]
- Kravtsova, R. Generation conditions of ore-forming systems of epithermal gold–silver deposits (northeastern Russia). In Geochemistry & Ore Deposits Division: Au–Ag–Te–Se Deposits, Proceedings of the 2006 Field Workshop, Izmir, Turkey, 24–29 September 2006; Cook, N.J., Özgenç, I., Oyman, T., Eds.; Dokuz Eylül University: Izmir, Turkey, 2006; pp. 103–110. [Google Scholar]
- Lapaev, G.P. Bryogeochemical prospecting method for mineral deposits. In Peculiarities of Geochemical Halos in Cryogenesis Zone. Gas–Saline Halos; Makarov, V.N., Ed.; Permafrost Institute: Yakutsk, Russia, 1979; pp. 44–46. (In Russian) [Google Scholar]
- Zagoskin, V.A. Highly Effective Technologies for Geochemical Prospecting of Minerals and Placers in Taiga and Subarctic Landscapes; Probel: Moscow, Russia, 2003; Volume 1, p. 544. (In Russian) [Google Scholar]
- Erdman, J.A.; Modreski, P.J. Copper and cobalt in aquatic mosses and stream sediments from the Idaho Cobalt Belt. J. Geochem. Explor. 1984, 20, 75–84. [Google Scholar] [CrossRef]
- Shacklette, H.T. The use of aquatic bryophytes in prospecting. J. Geochem. Explor. 1984, 21, 89–93. [Google Scholar] [CrossRef]
- Smith, S.C. Base metals and mercury in bryophytes and stream sediments from a geochemical reconnaissance survey of Chandalar Quadrangle, Alaska. J. Geochem. Explor. 1986, 25, 345–365. [Google Scholar] [CrossRef]
- Makshakov, A.S.; Kravtsova, R.G. Bryolithochemical studies in the search for and evaluation of gold–silver mineralization based on stream sediments (Northeastern Russia). Russ. Geol. Geophys. 2018, 59, 1836–1851. [Google Scholar] [CrossRef]
- Filimonova, L.G.; Trubkin, N.V.; Chugaev, A.V. The scattered mineralization peculiarities of Dukat ore region (North East Russia). Zap. Ross. Mineral. Obshch. 2006, 135, 12–34. (In Russian) [Google Scholar]
Figure 1.
The OCVB tectonic and metallogenic zoning scheme (1–4). Constructed by the authors of the present paper using the data from [3,57,71]. 1 and 2—inner zone and subzones: 1—inherited (gold–silver–copper–porphyry) and 2—newly formed (gold–silver–copper–molybdenum– porphyry); 3—outer zone (gold–silver), sectors: O—Okhotsk, P—Penzhina, A—Anadyr and CC—Central Chukotka; 4—flank zones: WO—West Okhotsk (gold–porphyry), EC—East Chukotka (gold–silver and gold–porphyry); 5—Siberian platform; 6—Preriphean median arrays (Okh—Okhotsk, Om—Omolon and E—Eskimo); 7—Upper Yana–Chukotka folded area (Mesozoic); 8—Koryak–Kamchatka folded area (Cenozoic); 9—sector boundaries of the OCVB outer zones; and 10—the Dukat Au–Ag ore-forming system (OFS).

Figure 2.
Schematic geological map of the Balygychan–Sugoy trough’s central part. Constructed by the authors of the present paper using the data from [72,73] with additions by [3] and materials of the Dukat geological exploration enterprise. 1—Quaternary sediments; 2—upper Cretaceous rhyolites, ignimbrites and rhyolitic tuffs (Shorokh suite); 3—lower–upper Cretaceous andesites, andesite–basalts, their tuffs and tuffaceous lavas, dacites, rhyolites, tuffaceous conglomerates and tuffaceous aleurolites (Kakhovka suite); 4—lower Cretaceous sandstones, aleurolites, argillites, conglomerates and coal seams (Omsukchan suite); 5—lower Cretaceous rhyolites, tuffaceous lavas and tuffs of rhyolites, felsites, andesites, dacites, tuffaceous conglomerates, sandstones, aleurolites and argillites (Askold suite); 6—Jurassic aleurolites, argillites, sandstones, tuffaceous sandstones, sandy argillites, tuffaceous gravelites and ash tuffs; 7—Triassic argillites, aleurolites, sandstones, sandy mudstones, tuffs, calcareous sandstones and coquinas; 8–11—late Cretaceous intrusions: 8—granites, 9—granodiorites, 10—diorites, quartz diorites and diorite porphyrites and 11—gabbro; 12—early Cretaceous diorite porphyrites; 13 and 14—subvolcanic formations: 13—late Cretaceous rhyolites, nevadites, felsites, andesites, diorite porphyrites and diorites and 14—early Cretaceous rhyolites; 15—faults: a—reliable, b—estimated; 16—the boundaries of the Dukat Au–Ag OFS; 17–21—deposits (a) and prospects (b): 17—gold–silver (1—Dukat, 2—Krasin, 3—Barguzin and 4—Zharok), 18—silver–polymetallic (5—Mechta, 6—Tidid, 7—Nachalny, 8—Struya, 9—Yasnaya Polyana and 10—Fakel), 19—tin–silver (11—Maly Ken, 12—Novo-Dzhagyn, 13—Razny, 14—Finalny, 15—Severny, 16—Shorokh and 17—Tovarishch), 20—tin (18—Upper Bastoy, 19—Chuzhoye, 20—Vengerka, 21—Khataren, 22—Industrialnoye and 23—Nimfa), 21—tin–rare metal and rare metal; 22—area of geochemical survey of lithochemical stream sediments of 1:50,000 scale (a); Chaika site, where the detailed work was carried out, including bryolithochemical research, and the alluvium material composition study (b).

Figure 3.
A theoretical sampling scheme of 1:200,000 (a) and 1:50,000 (b) scale lithochemical stream sediments (LSS) surveys shown on a conventional map of the drainage system. 1—watercourses (blue lines), their order (Roman numerals) and their runoff direction (arrows); 2—sampling points (a—double; b—ordinary); and 3—the main river. Note: The actual alluvium sampling places of the LSS surveys on the 1:200,000 and 1:50,000 scales discussed in the present paper are shown in Figure 4.

Figure 4.
The alluvium samples’ location (red points) in the survey of LSSs on the 1:200,000 (a) and 1:50,000 (b) scales.
Figure 4.
The alluvium samples’ location (red points) in the survey of LSSs on the 1:200,000 (a) and 1:50,000 (b) scales.

Figure 5.
The Dukat Au–Ag OFS and associated areas. Exogenous Au anomalous geochemical fields (AGFs) identified through LSSs (survey on the 1:200,000 scale). For the legend to Figure 5, Figure 6, Figure 7, Figure 8, Figure 9, Figure 10, Figure 11, Figure 12, Figure 13 and Figure 14 see Figure 2 (Section 2.2).

Figure 6.
The Dukat Au–Ag OFS and associated areas. Exogenous Ag AGFs identified through LSSs (survey on the 1:200,000 scale).
Figure 6.
The Dukat Au–Ag OFS and associated areas. Exogenous Ag AGFs identified through LSSs (survey on the 1:200,000 scale).

Figure 7.
The Dukat Au–Ag OFS and associated areas. Exogenous As AGFs identified through LSSs (survey on the 1:200,000 scale).
Figure 7.
The Dukat Au–Ag OFS and associated areas. Exogenous As AGFs identified through LSSs (survey on the 1:200,000 scale).

Figure 8.
The Dukat Au–Ag OFS and associated areas. Exogenous Pb AGFs identified through LSSs (survey on the 1:200,000 scale).
Figure 8.
The Dukat Au–Ag OFS and associated areas. Exogenous Pb AGFs identified through LSSs (survey on the 1:200,000 scale).

Figure 9.
The Dukat Au–Ag OFS and associated areas. Exogenous Zn AGFs identified through LSSs (survey on the 1:200,000 scale).
Figure 9.
The Dukat Au–Ag OFS and associated areas. Exogenous Zn AGFs identified through LSSs (survey on the 1:200,000 scale).

Figure 10.
The Dukat Au–Ag OFS and associated areas. Exogenous Cu AGFs identified through LSSs (survey on the 1:200,000 scale).
Figure 10.
The Dukat Au–Ag OFS and associated areas. Exogenous Cu AGFs identified through LSSs (survey on the 1:200,000 scale).

Figure 11.
The Dukat Au–Ag OFS and associated areas. Exogenous Mo AGFs identified through LSSs (survey on the 1:200,000 scale).
Figure 11.
The Dukat Au–Ag OFS and associated areas. Exogenous Mo AGFs identified through LSSs (survey on the 1:200,000 scale).

Figure 12.
The Dukat Au–Ag OFS and associated areas. Exogenous W AGFs identified through LSSs (survey on the 1:200,000 scale).
Figure 12.
The Dukat Au–Ag OFS and associated areas. Exogenous W AGFs identified through LSSs (survey on the 1:200,000 scale).

Figure 13.
The Dukat Au–Ag OFS and associated areas. Exogenous Sn AGFs identified through LSSs (survey on the 1:200,000 scale).
Figure 13.
The Dukat Au–Ag OFS and associated areas. Exogenous Sn AGFs identified through LSSs (survey on the 1:200,000 scale).

Figure 14.
The Dukat Au–Ag OFS and associated areas. Exogenous Bi AGFs identified through LSSs (survey on the 1:200,000 scale).
Figure 14.
The Dukat Au–Ag OFS and associated areas. Exogenous Bi AGFs identified through LSSs (survey on the 1:200,000 scale).

Figure 15.
The Dukat Au–Ag OFS and associated areas. Exogenous polyelement AGFs identified through LSSs (survey on the 1:200,000 scale). 1–14—geochemical associations of ore elements (see Table 2): 1 and 2—predominantly Ag; 3–5—Ag–Pb; 6 and 7—Sn–Ag; 8 and 9—Mo–W and Sn–W; 10–12—Sn; and 13 and 14—Pb–Zn in ZDSM. For the legend to Figure 15 see Figure 2 (Section 2.2).

Figure 16.
The Dukat Au–Ag deposit and associated area. Exogenous Au AGFs identified through LSSs (survey on the 1:50,000 scale). For the legend to Figure 16, Figure 17, Figure 18, Figure 19, Figure 20, Figure 21, Figure 22, Figure 23, Figure 24, Figure 25, Figure 26 and Figure 28 see Figure 2 (Section 2.2).

Figure 17.
The Dukat Au–Ag deposit and associated area. Exogenous Ag AGFs identified through LSSs (survey on the 1:50,000 scale).
Figure 17.
The Dukat Au–Ag deposit and associated area. Exogenous Ag AGFs identified through LSSs (survey on the 1:50,000 scale).

Figure 18.
The Dukat Au–Ag deposit and associated area. Exogenous Hg AGFs identified through LSSs (survey on the 1:50,000 scale).
Figure 18.
The Dukat Au–Ag deposit and associated area. Exogenous Hg AGFs identified through LSSs (survey on the 1:50,000 scale).

Figure 19.
The Dukat Au–Ag deposit and associated area. Exogenous Sb AGFs identified through LSSs (survey on the 1:50,000 scale).
Figure 19.
The Dukat Au–Ag deposit and associated area. Exogenous Sb AGFs identified through LSSs (survey on the 1:50,000 scale).

Figure 20.
The Dukat Au–Ag deposit and associated area. Exogenous As AGFs identified through LSSs (survey on the 1:50,000 scale).
Figure 20.
The Dukat Au–Ag deposit and associated area. Exogenous As AGFs identified through LSSs (survey on the 1:50,000 scale).

Figure 21.
The Dukat Au–Ag deposit and associated area. Exogenous Pb AGFs identified through LSSs (survey on the 1:50,000 scale).
Figure 21.
The Dukat Au–Ag deposit and associated area. Exogenous Pb AGFs identified through LSSs (survey on the 1:50,000 scale).

Figure 22.
The Dukat Au–Ag deposit and associated area. Exogenous Zn AGFs identified through LSSs (survey on the 1:50,000 scale).
Figure 22.
The Dukat Au–Ag deposit and associated area. Exogenous Zn AGFs identified through LSSs (survey on the 1:50,000 scale).

Figure 23.
The Dukat Au–Ag deposit and associated area. Exogenous Cu AGFs identified through LSSs (survey on the 1:50,000 scale).
Figure 23.
The Dukat Au–Ag deposit and associated area. Exogenous Cu AGFs identified through LSSs (survey on the 1:50,000 scale).

Figure 24.
The Dukat Au–Ag deposit and associated area. Exogenous Mo AGFs identified through LSSs (survey on the 1:50,000 scale).
Figure 24.
The Dukat Au–Ag deposit and associated area. Exogenous Mo AGFs identified through LSSs (survey on the 1:50,000 scale).

Figure 25.
The Dukat Au–Ag deposit and associated area. Exogenous Sn AGFs identified through LSSs (survey on the 1:50,000 scale).
Figure 25.
The Dukat Au–Ag deposit and associated area. Exogenous Sn AGFs identified through LSSs (survey on the 1:50,000 scale).

Figure 26.
The Dukat Au–Ag deposit and associated area. Exogenous Bi AGFs identified through LSSs (survey on the 1:50,000 scale).
Figure 26.
The Dukat Au–Ag deposit and associated area. Exogenous Bi AGFs identified through LSSs (survey on the 1:50,000 scale).

Figure 27.
Frequency histograms of Au (a) and Hg (b) contents in alluvial sediments depending on the order of watercourses draining the Dukat Au–Ag deposit (survey of LSSs on the 1:50,000 scale).
Figure 27.
Frequency histograms of Au (a) and Hg (b) contents in alluvial sediments depending on the order of watercourses draining the Dukat Au–Ag deposit (survey of LSSs on the 1:50,000 scale).

Figure 28.
The Dukat Au–Ag deposit and associated area. Exogenous polyelement AGFs identified through LSSs (survey on the 1:50,000 scale). 1–12—geochemical associations of ore elements (see Table 5): 1–4—predominantly Ag and Au–Ag; 5–9—Ag–Pb; 10 and 11—Sn–Ag; and 12—Pb–Zn in the ZDSM.
Figure 28.
The Dukat Au–Ag deposit and associated area. Exogenous polyelement AGFs identified through LSSs (survey on the 1:50,000 scale). 1–12—geochemical associations of ore elements (see Table 5): 1–4—predominantly Ag and Au–Ag; 5–9—Ag–Pb; 10 and 11—Sn–Ag; and 12—Pb–Zn in the ZDSM.

Figure 29.
The Dukat Au–Ag deposit at the Chaika site. The scheme of bryolithochemical and lithochemical sampling of first-order watercourses. 1—ore bodies; 2—sampling points.
Figure 29.
The Dukat Au–Ag deposit at the Chaika site. The scheme of bryolithochemical and lithochemical sampling of first-order watercourses. 1—ore bodies; 2—sampling points.

Figure 30.
Sandy silt material in moss cushions growing on the banks and beds of watercourse heads.

Figure 31.
Particles of electrum and silver sulphosalts in the bryolithochemical sample. Images are given: (a)—in backscattered electrons; (b,c)—in X-rays.
Figure 31.
Particles of electrum and silver sulphosalts in the bryolithochemical sample. Images are given: (a)—in backscattered electrons; (b,c)—in X-rays.

Figure 32.
Corroded and oxidized acanthite grains in loose sediments of watercourses draining the Au–Ag zones of the Dukat deposit. The images are presented: (a,d)—in backscattered electrons; (b,c,e,f)—in X-rays. In Figure 32 (a,d): 1–20—the identification points of the element contents indicated in Table 6.


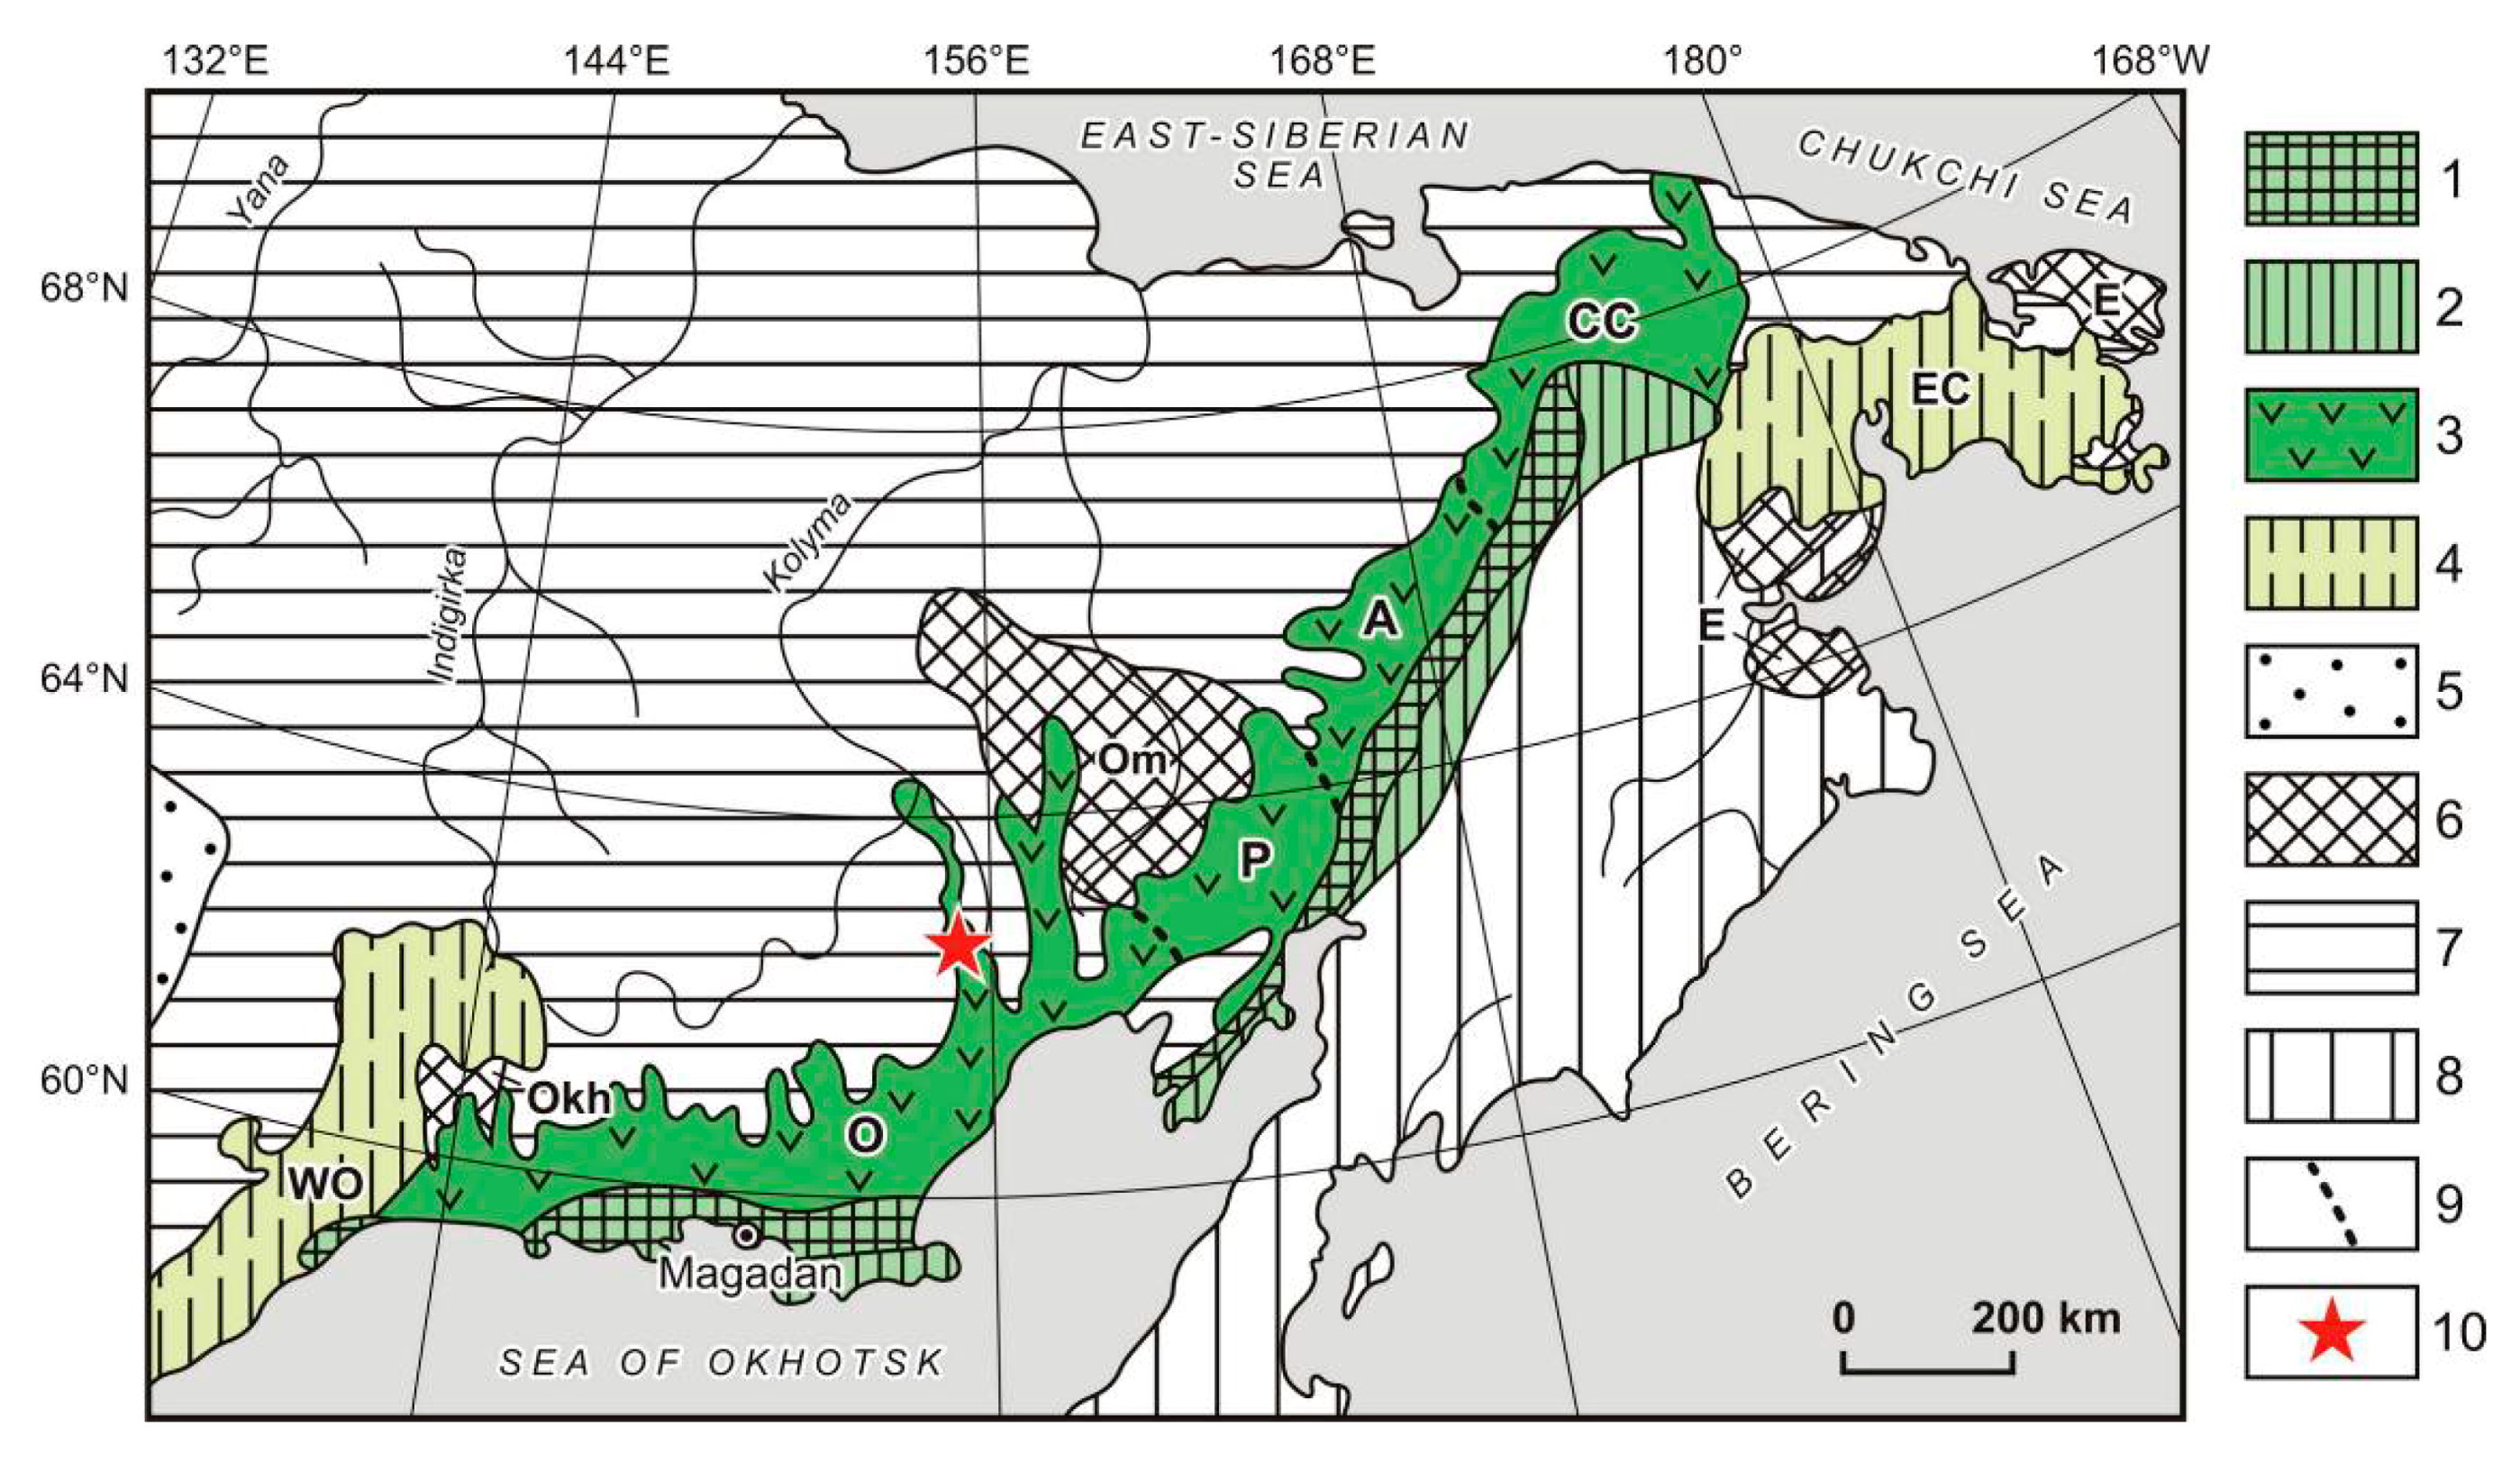
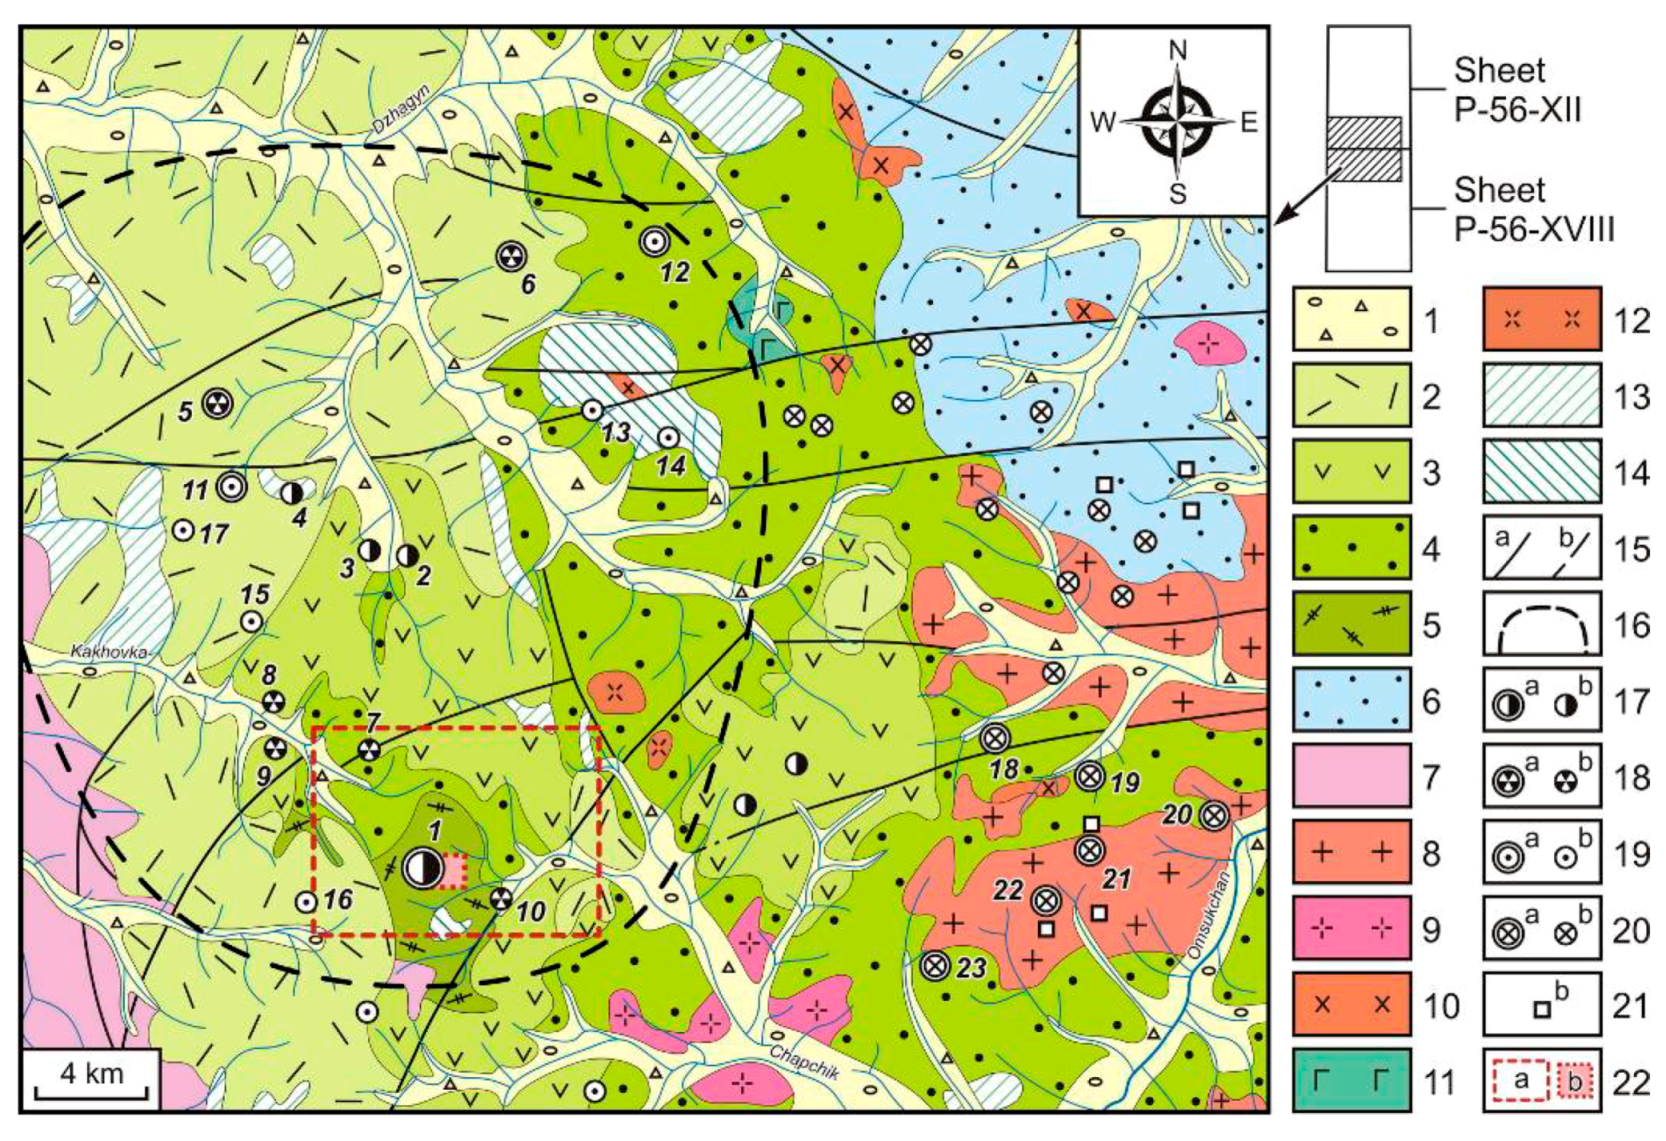
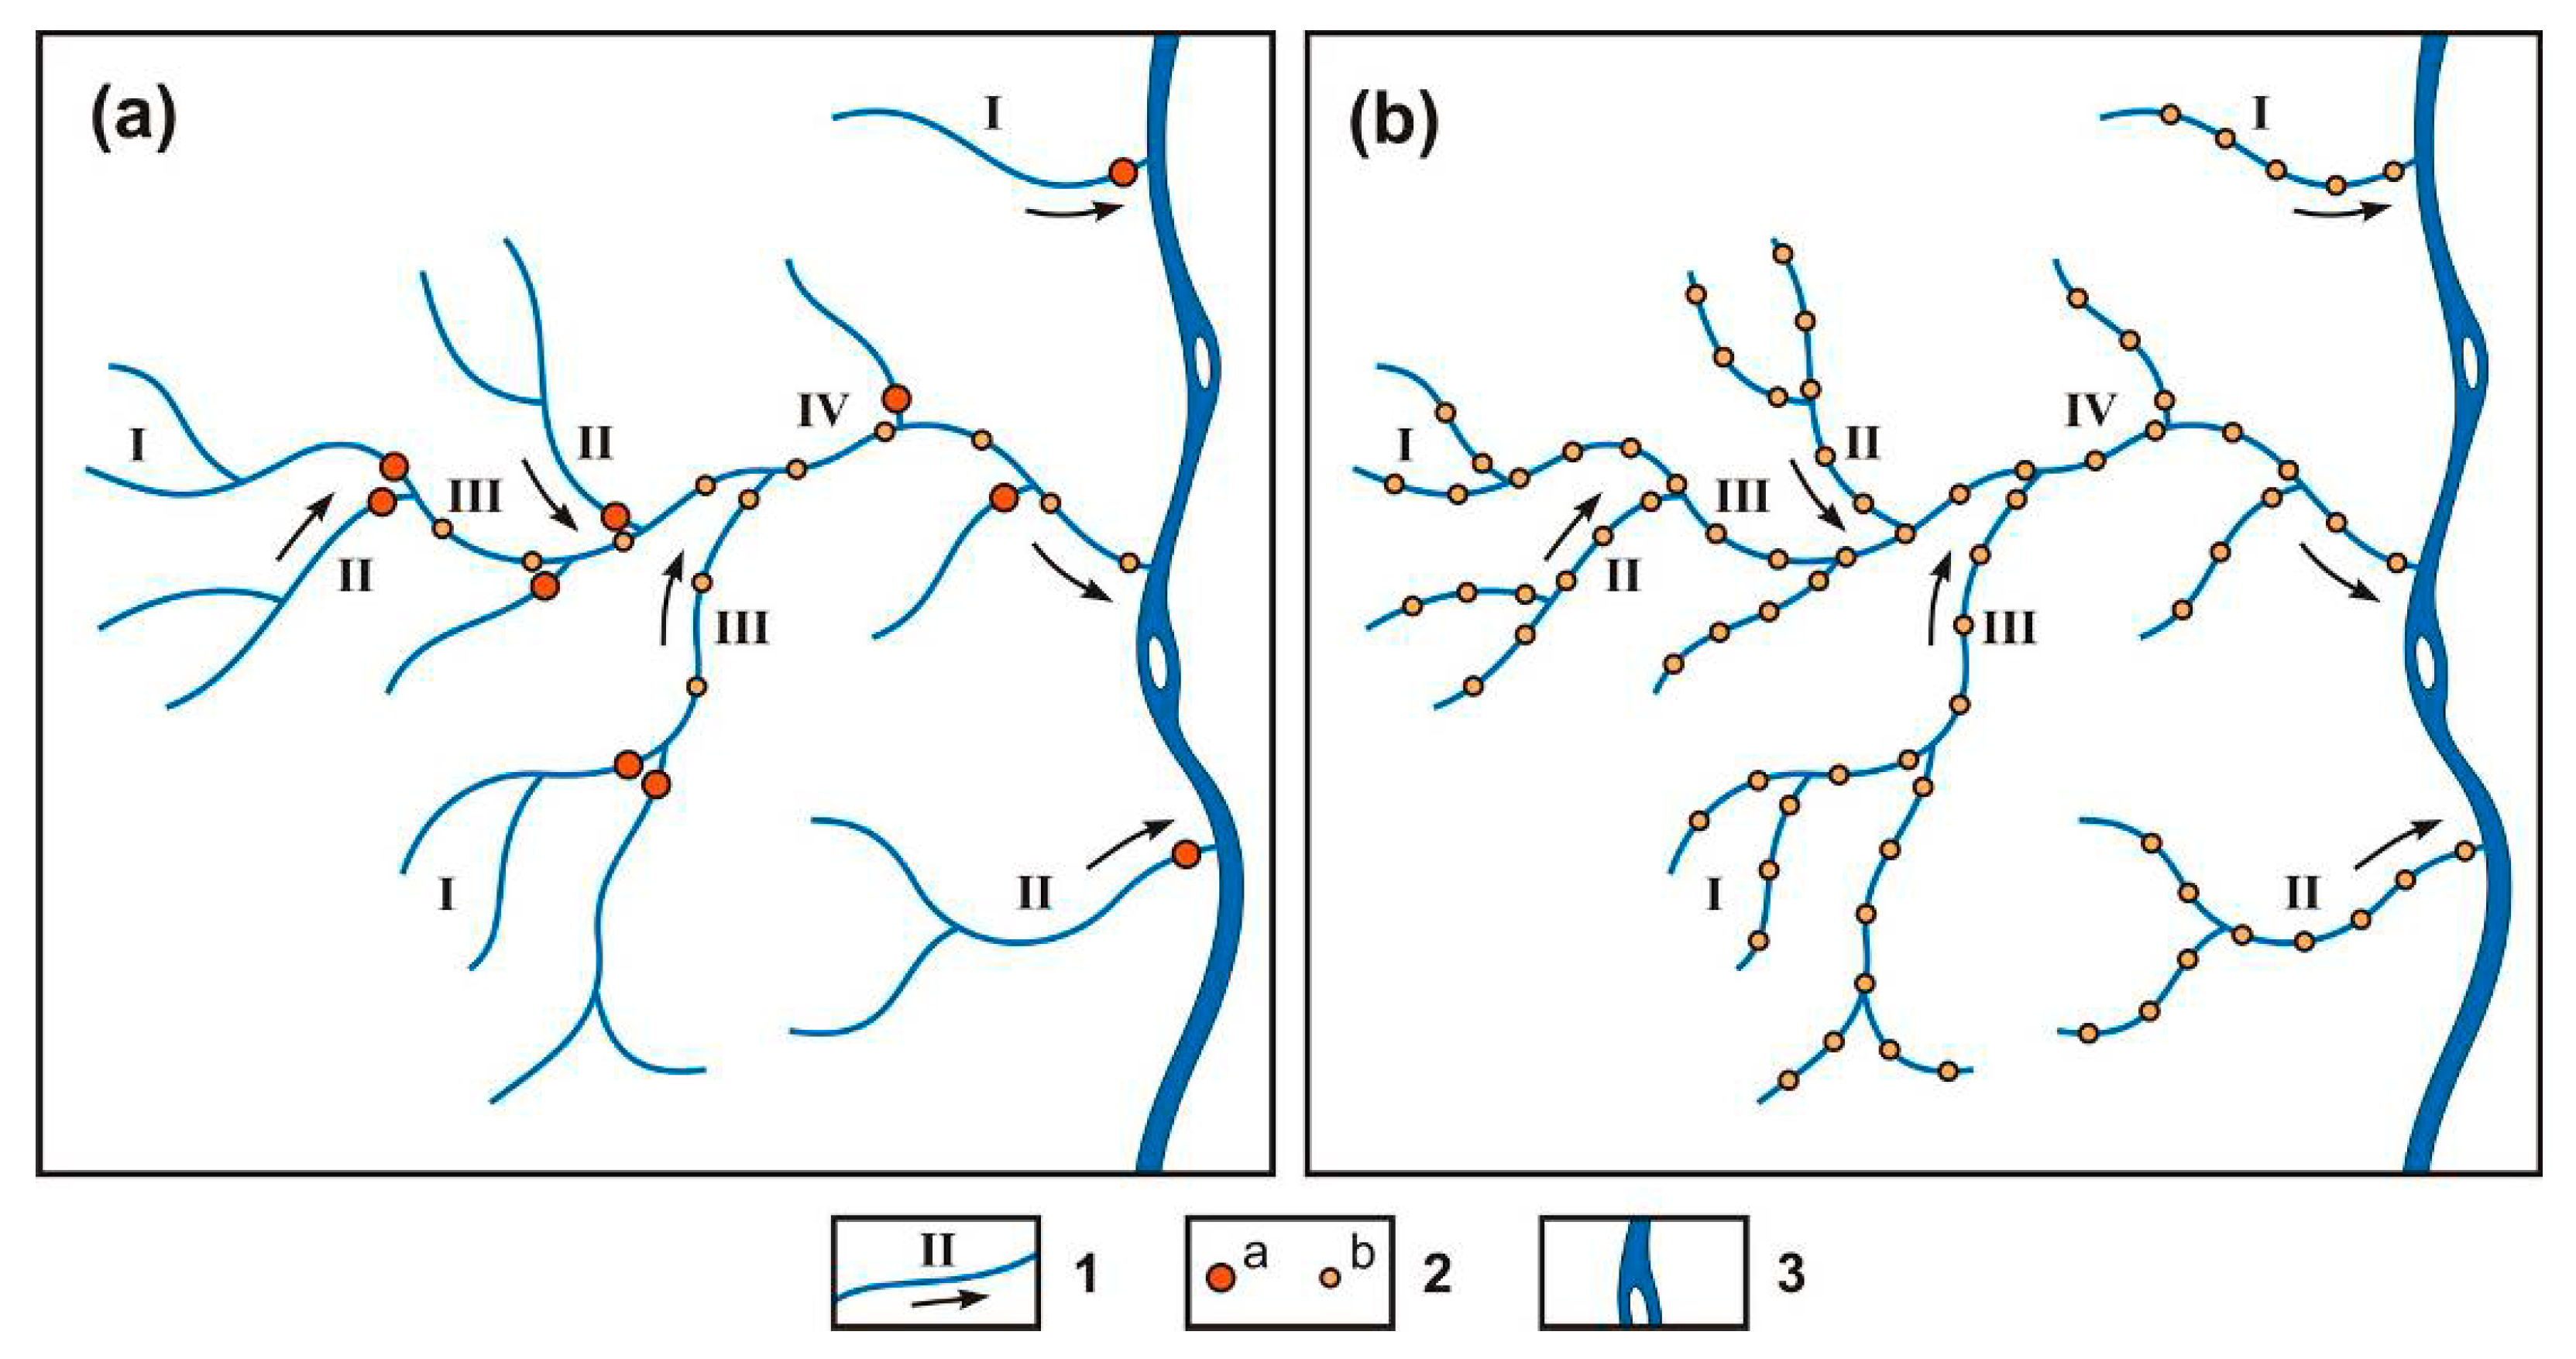
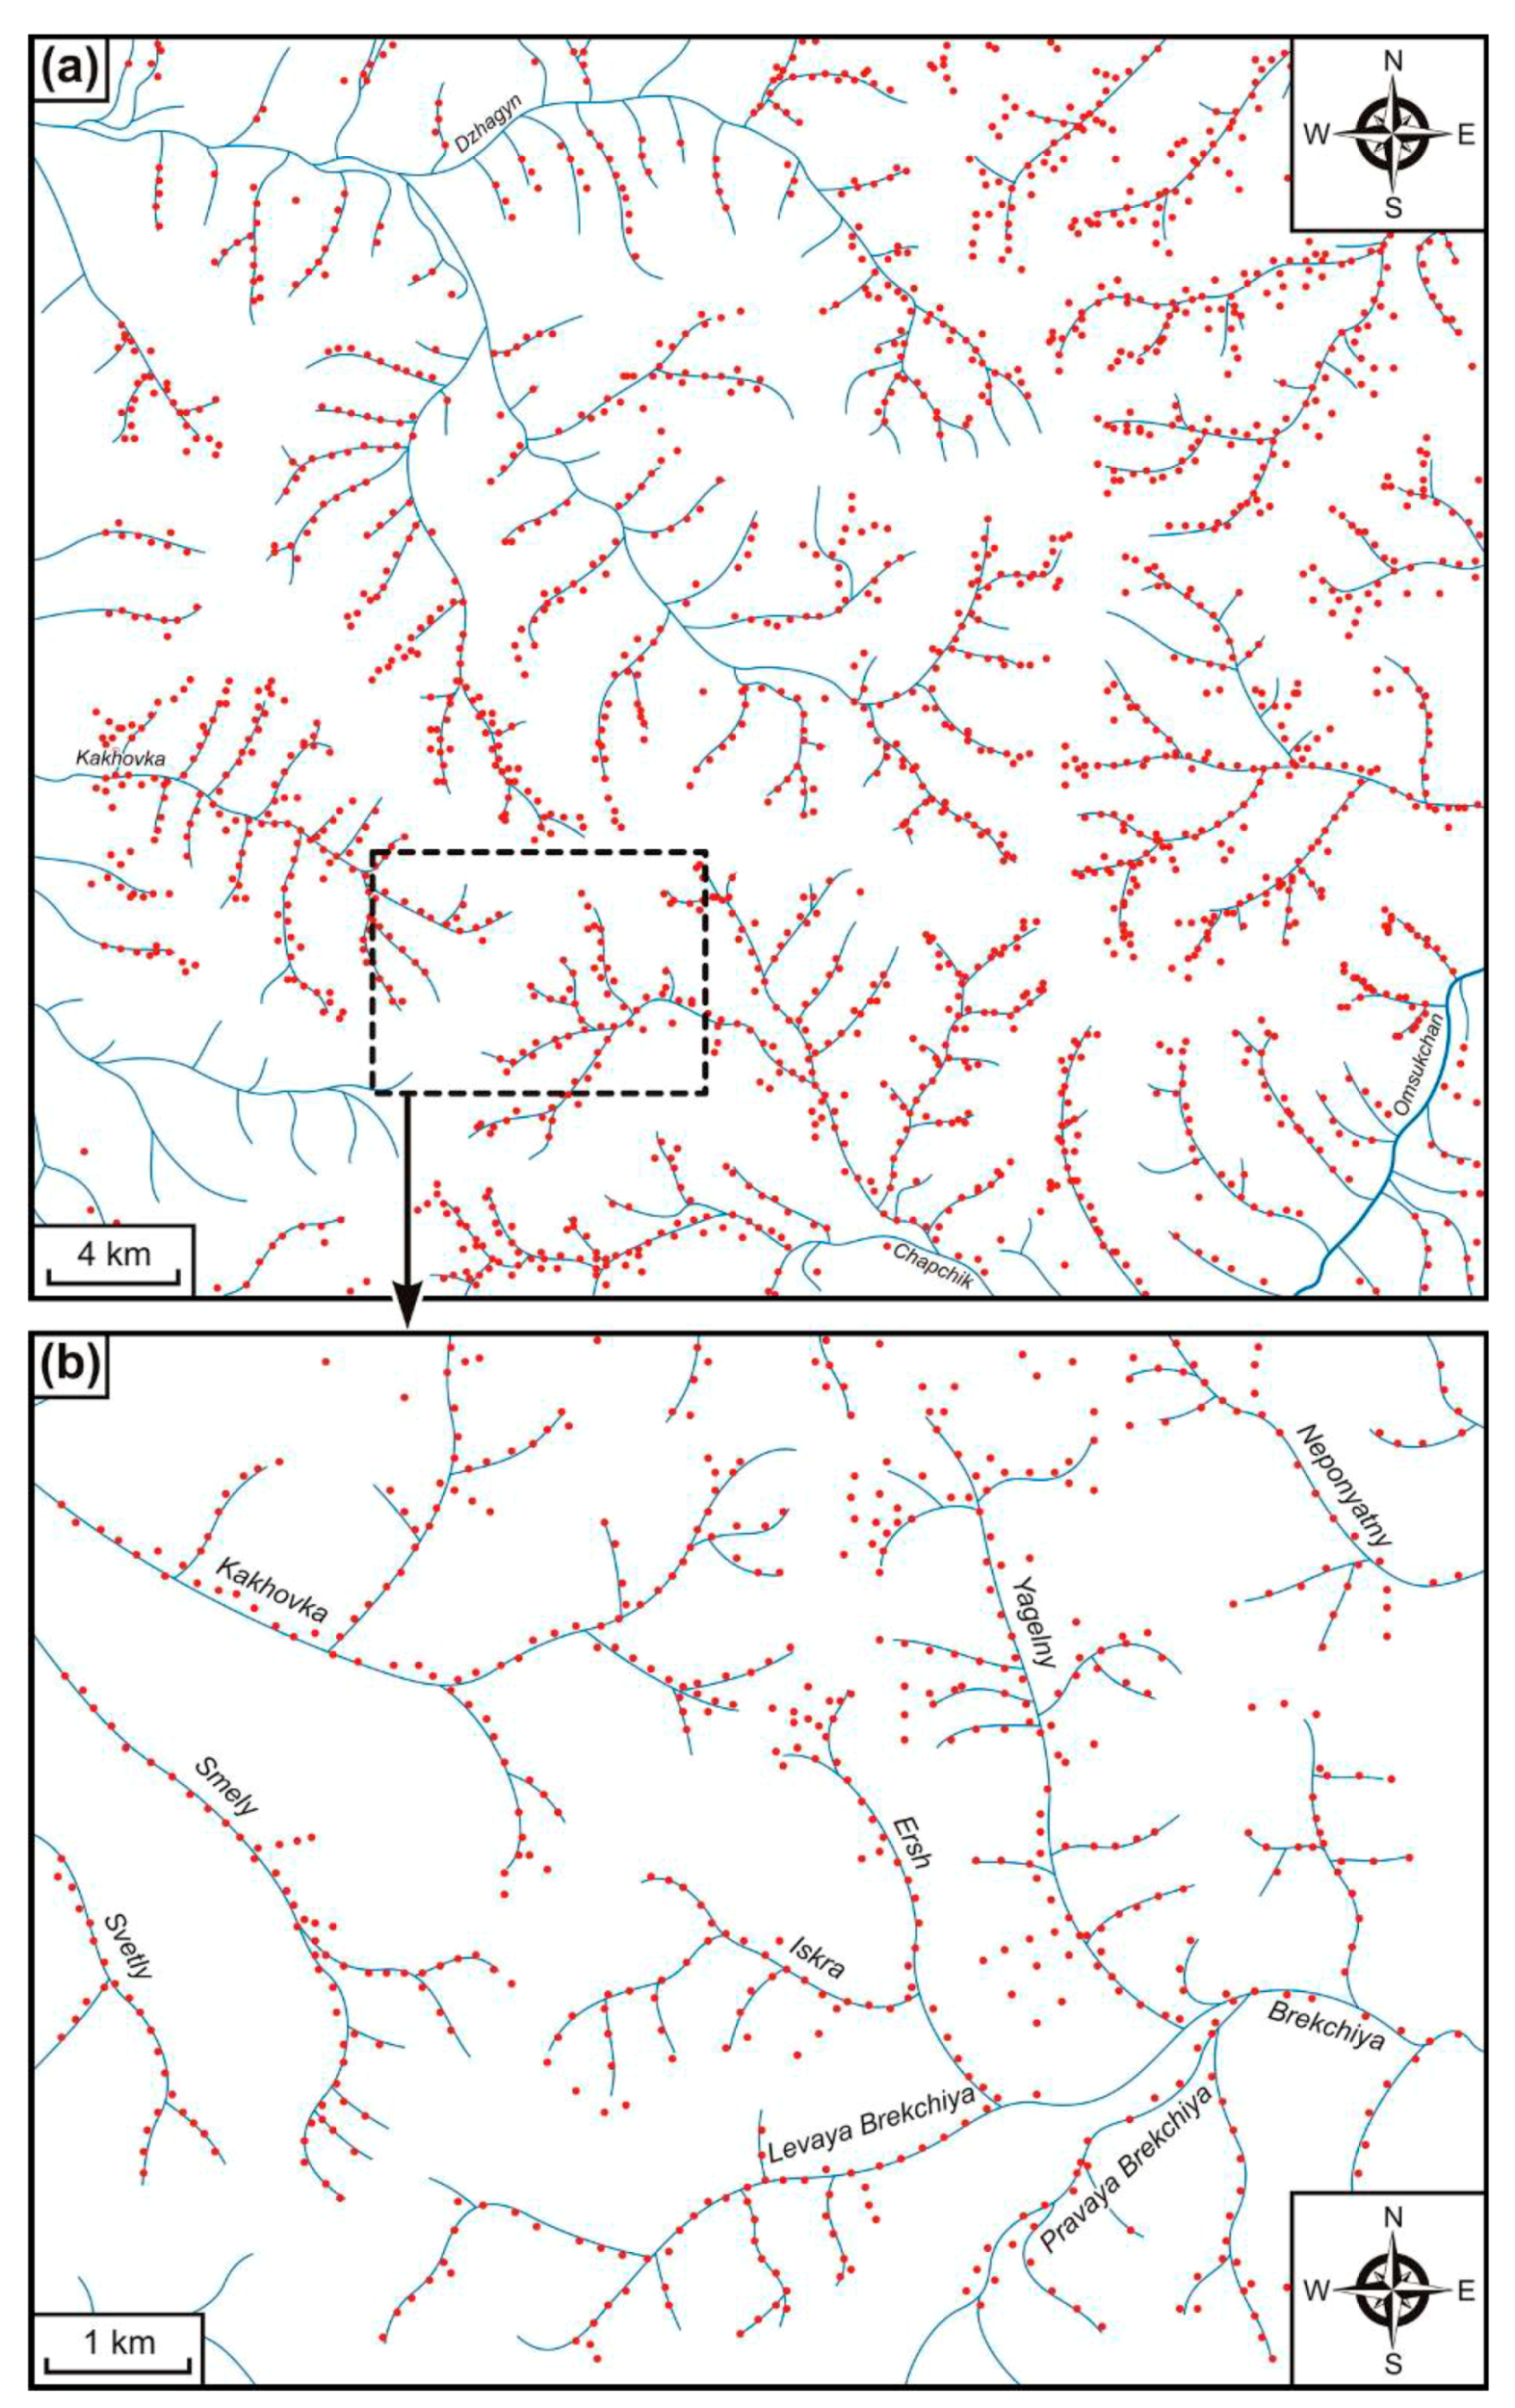
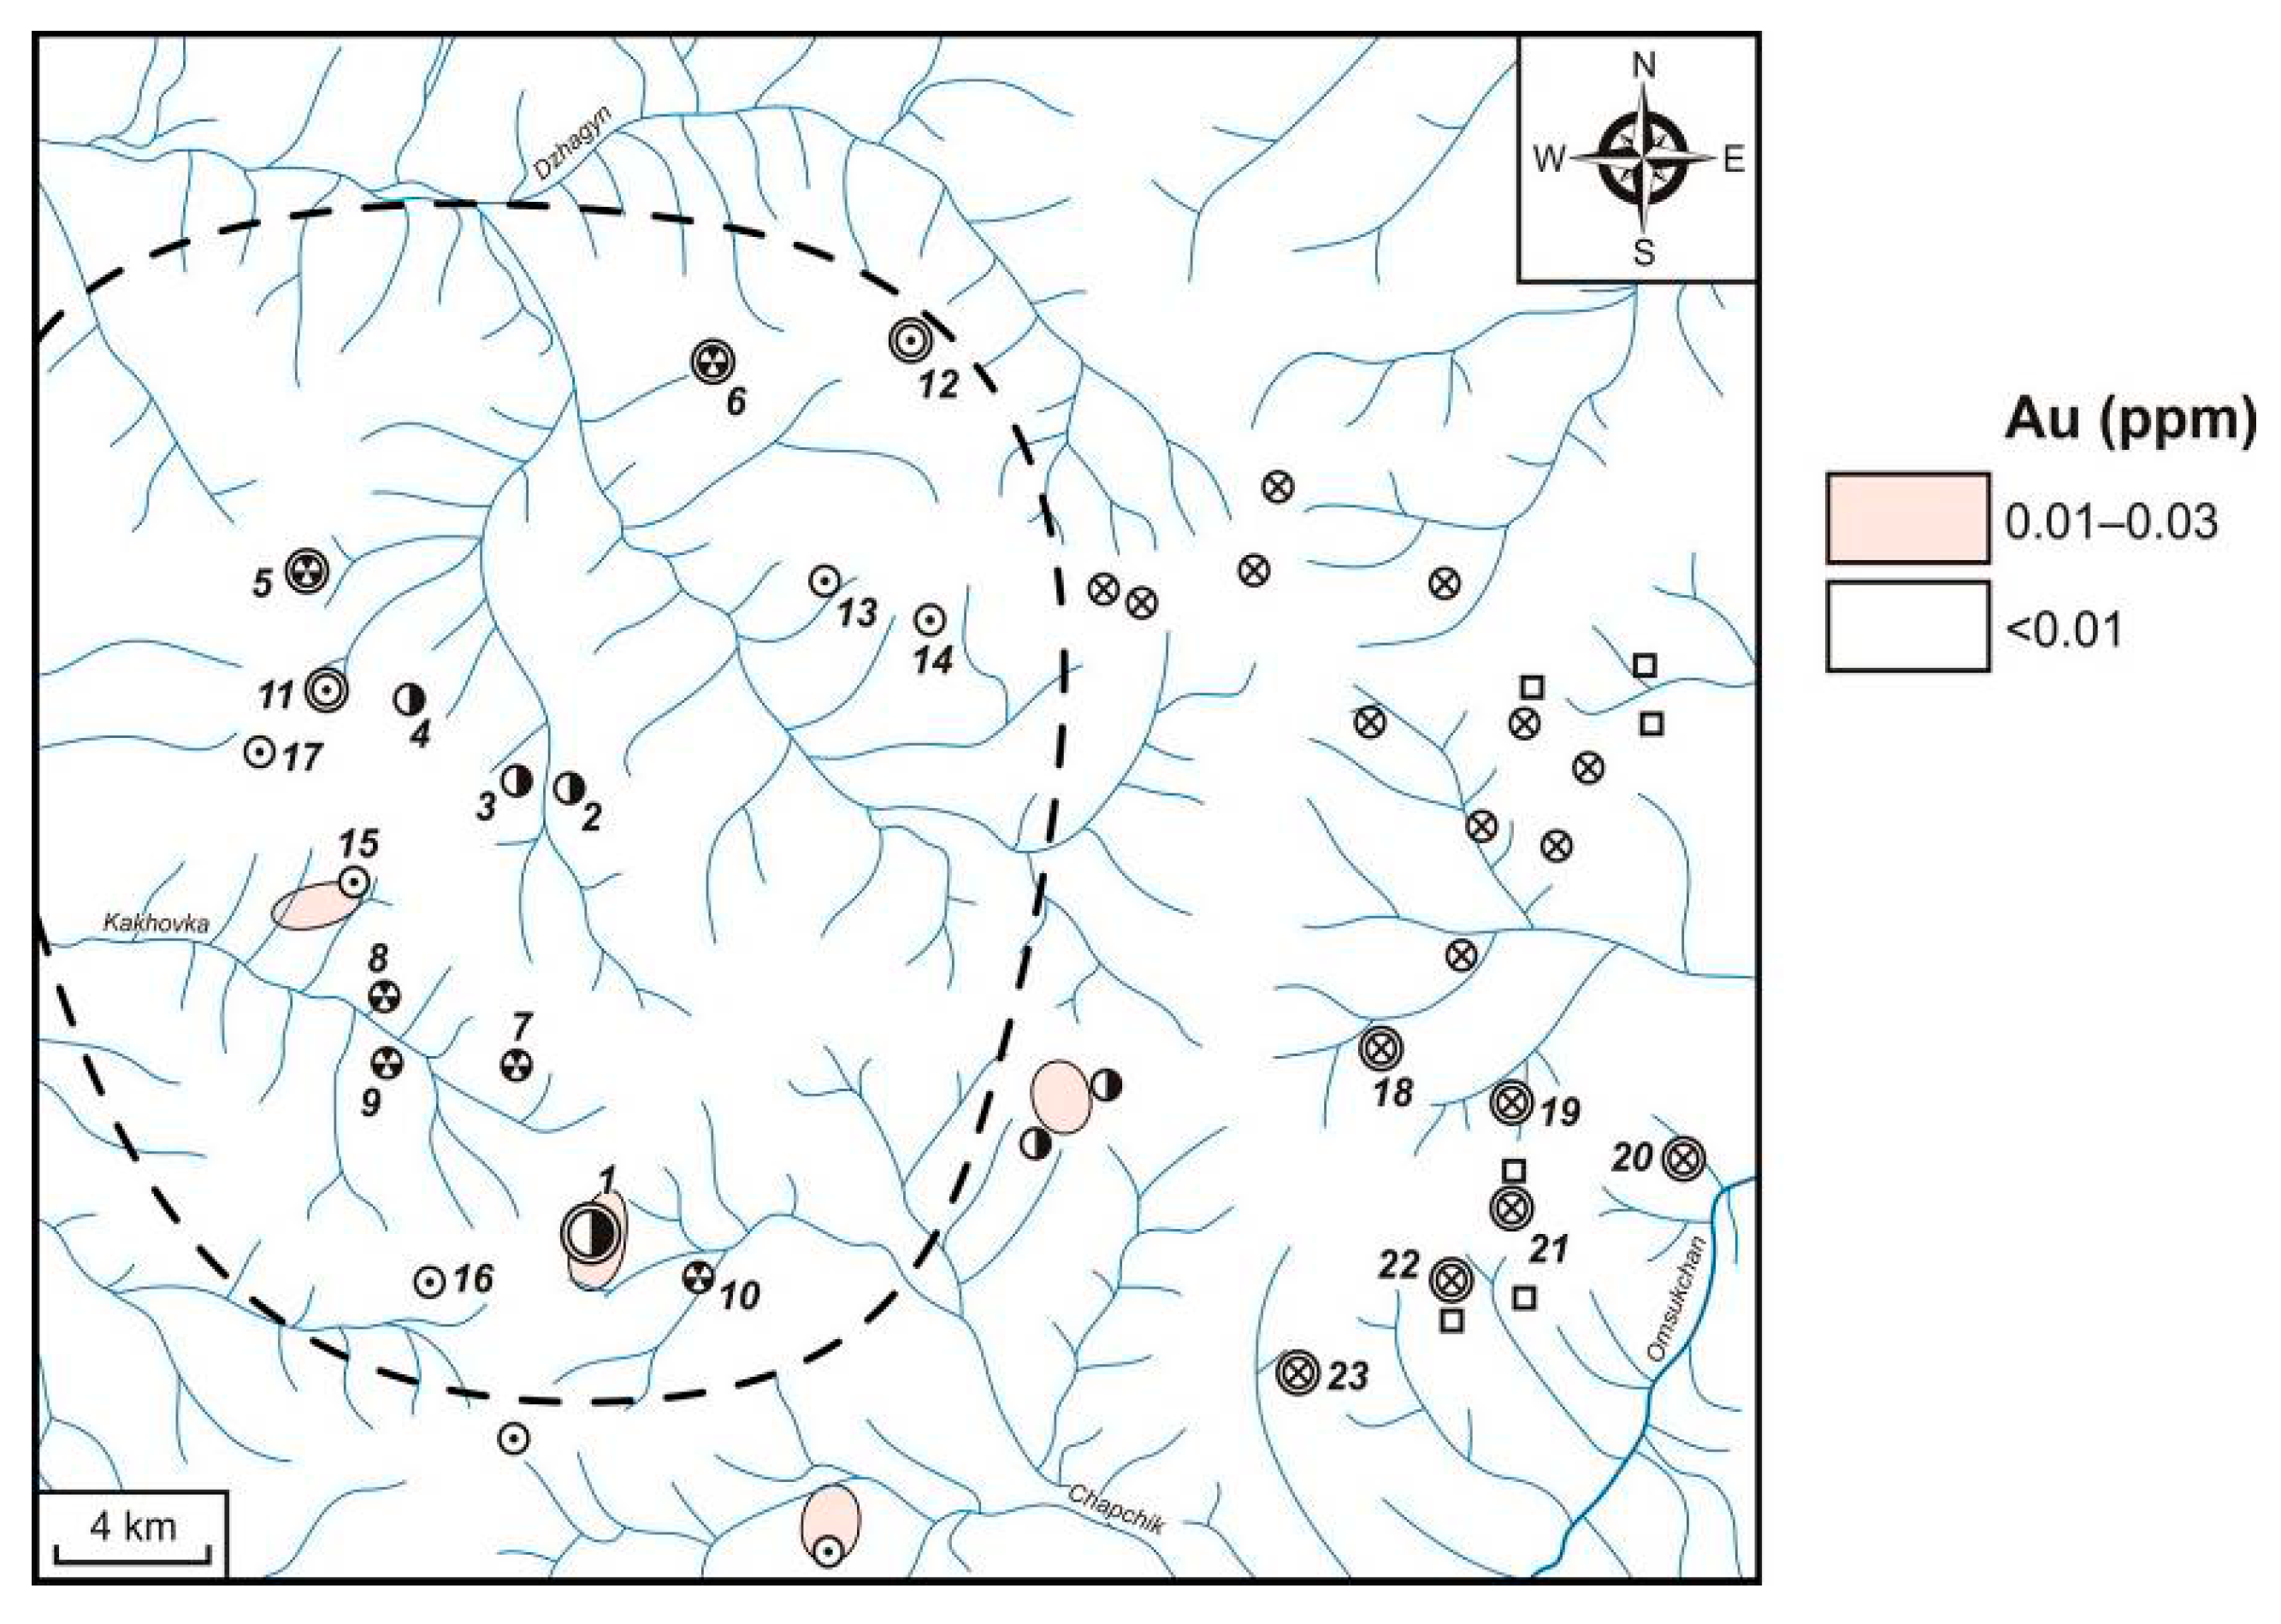
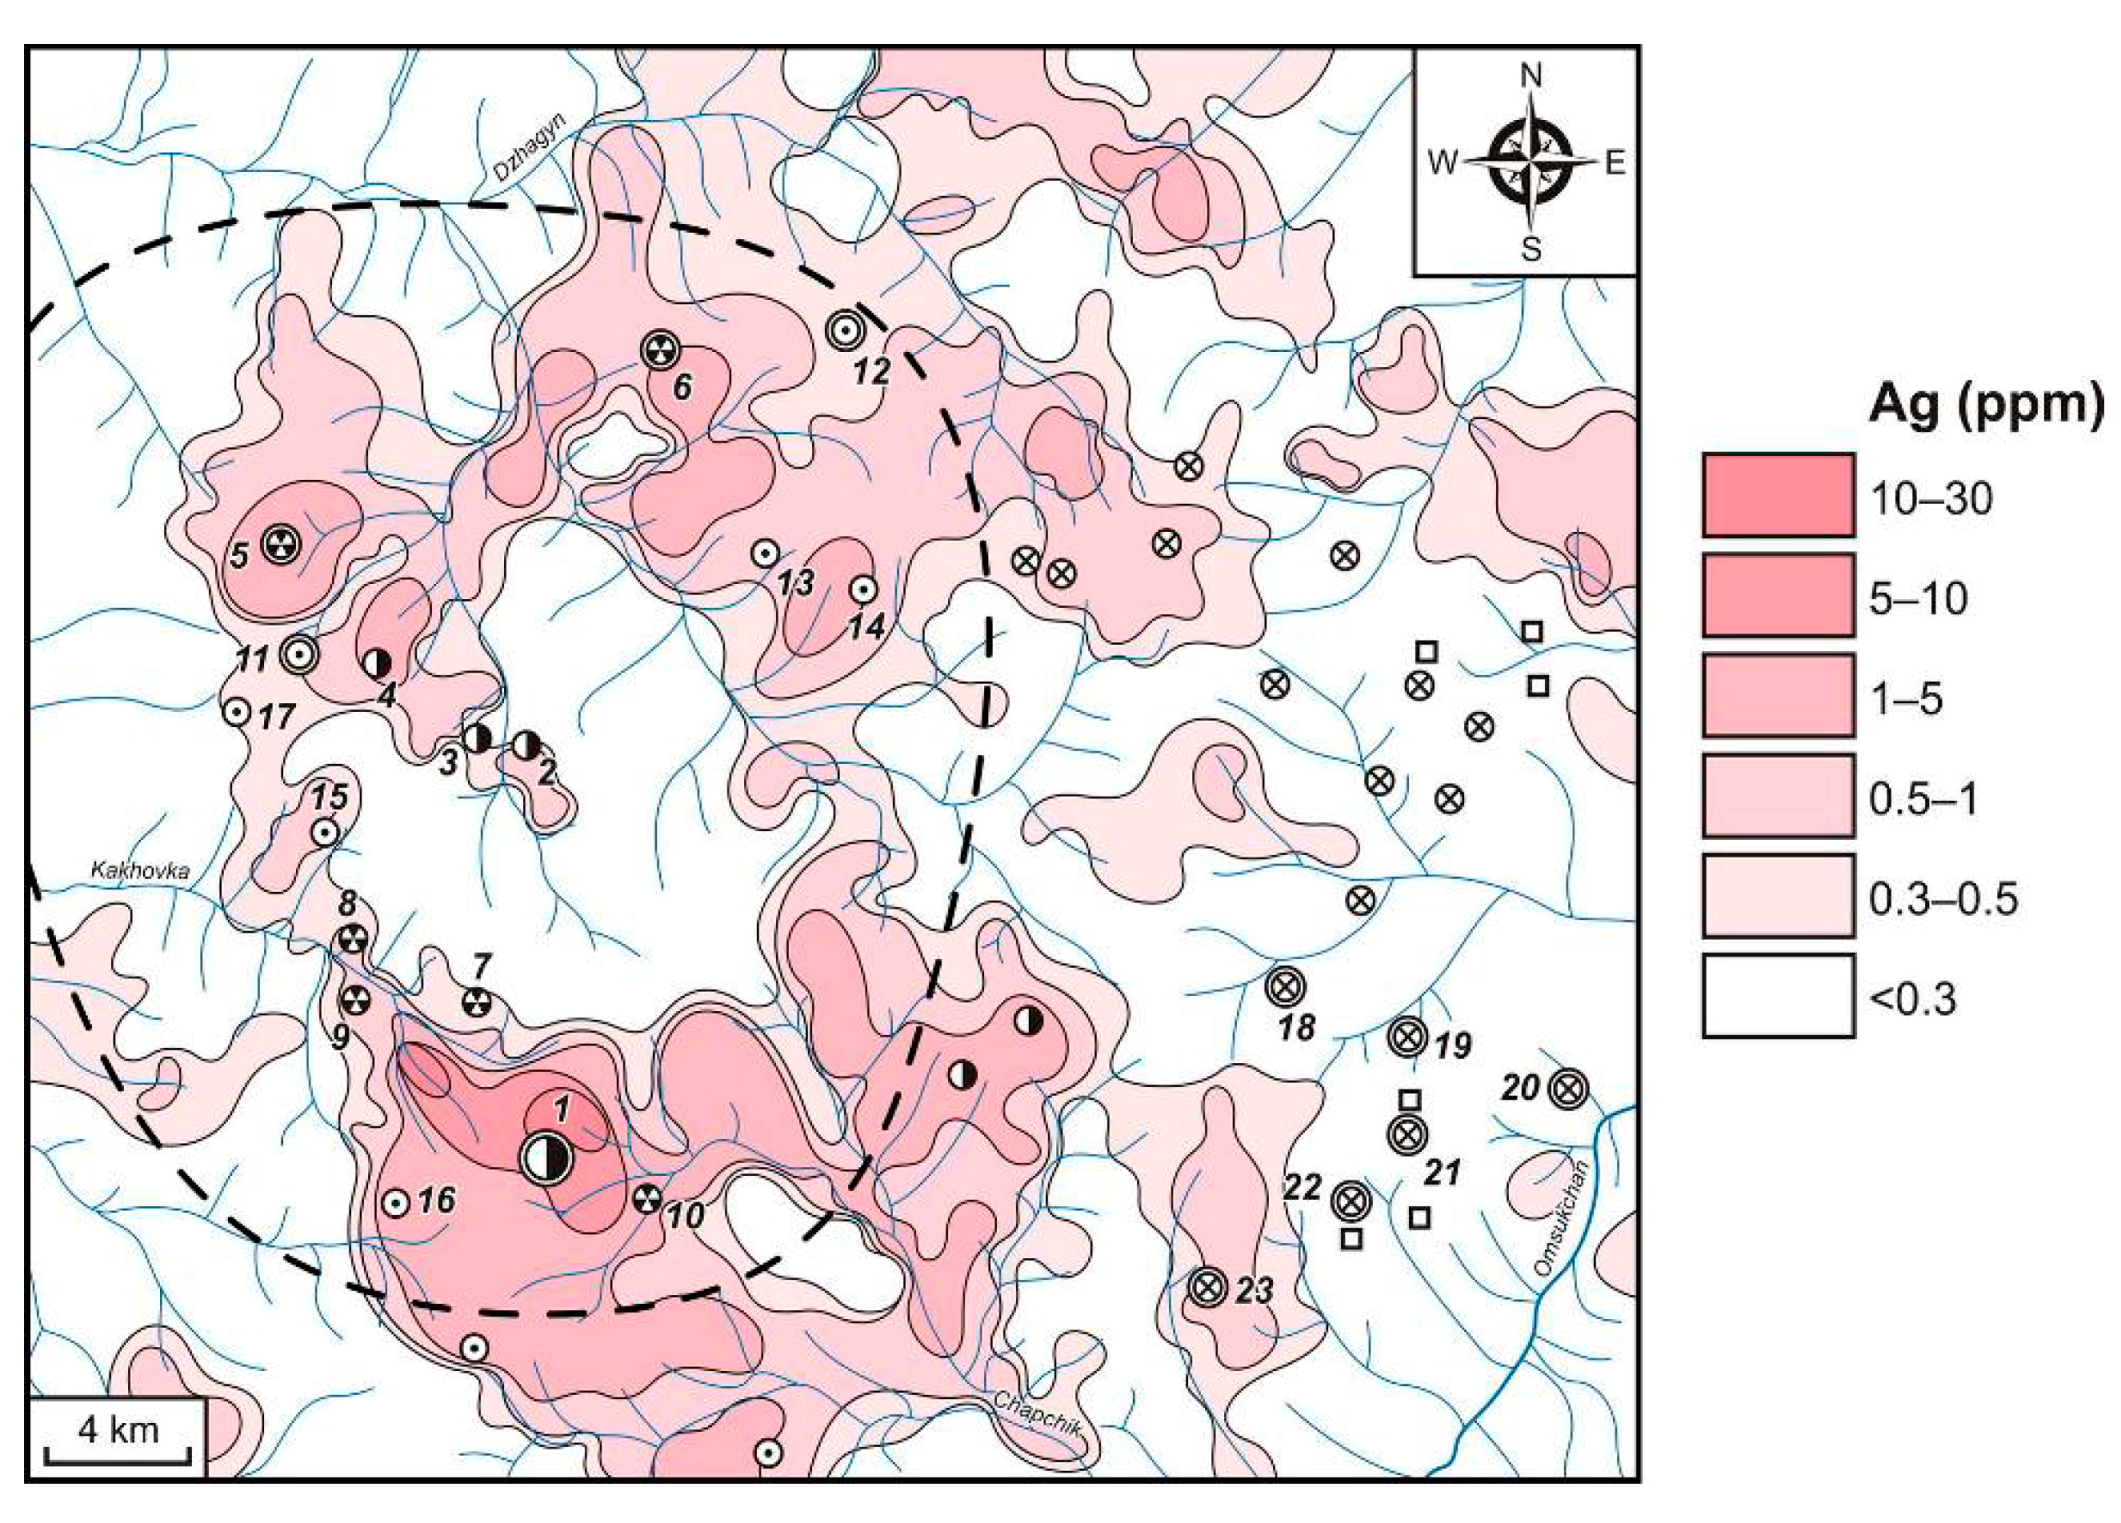
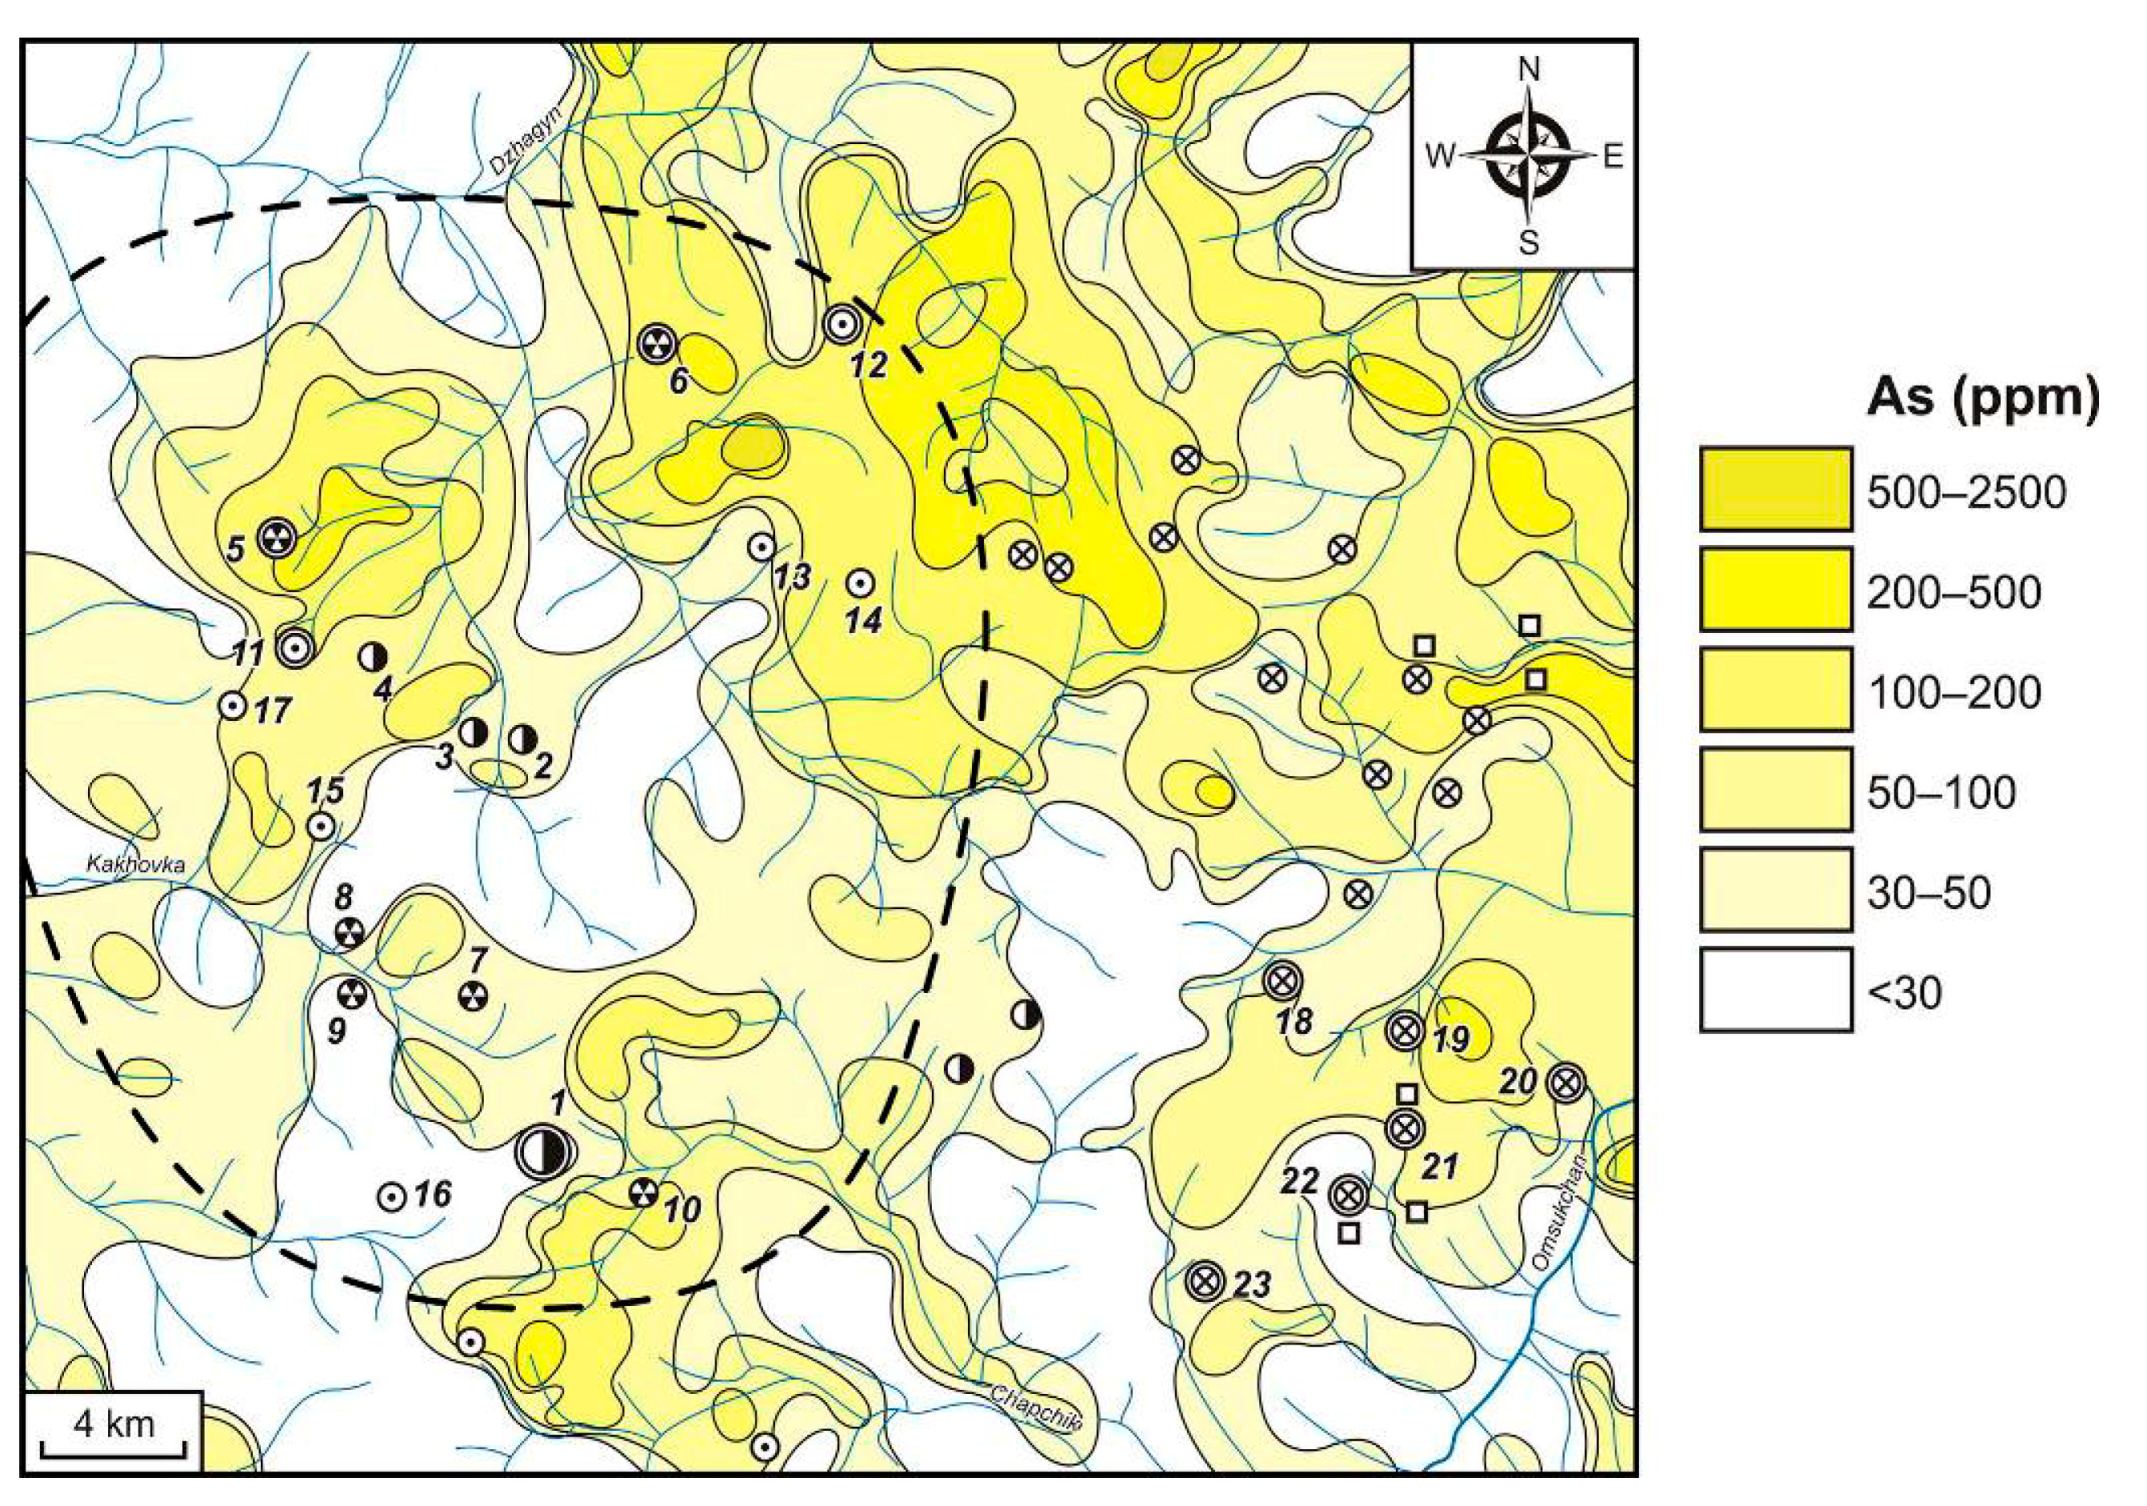
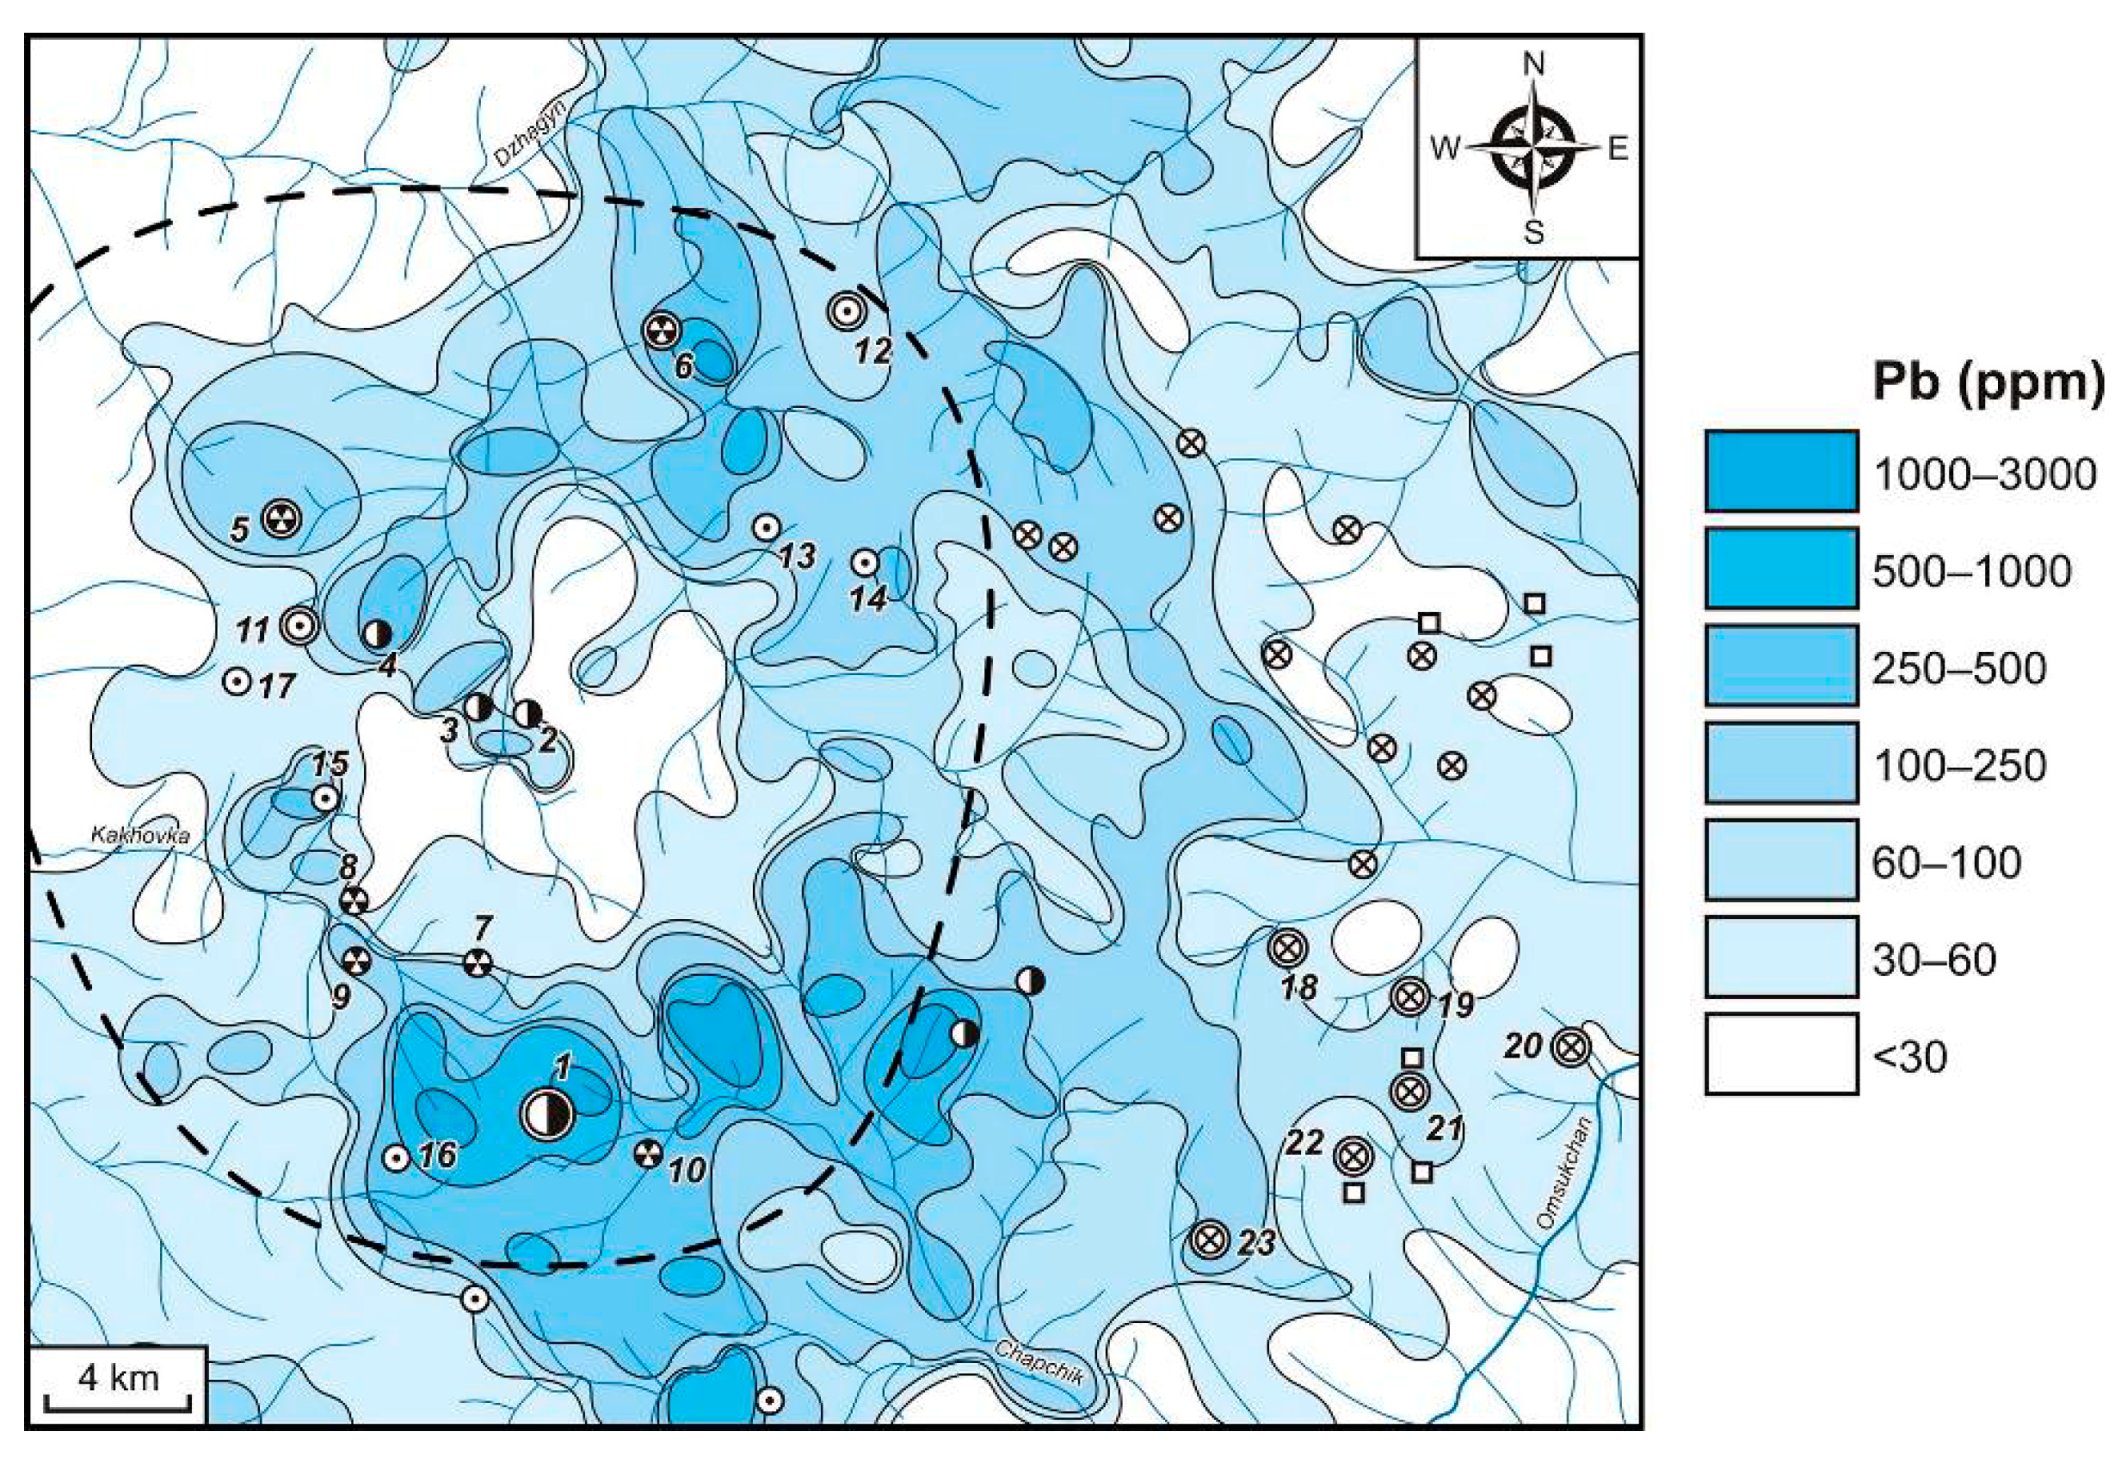
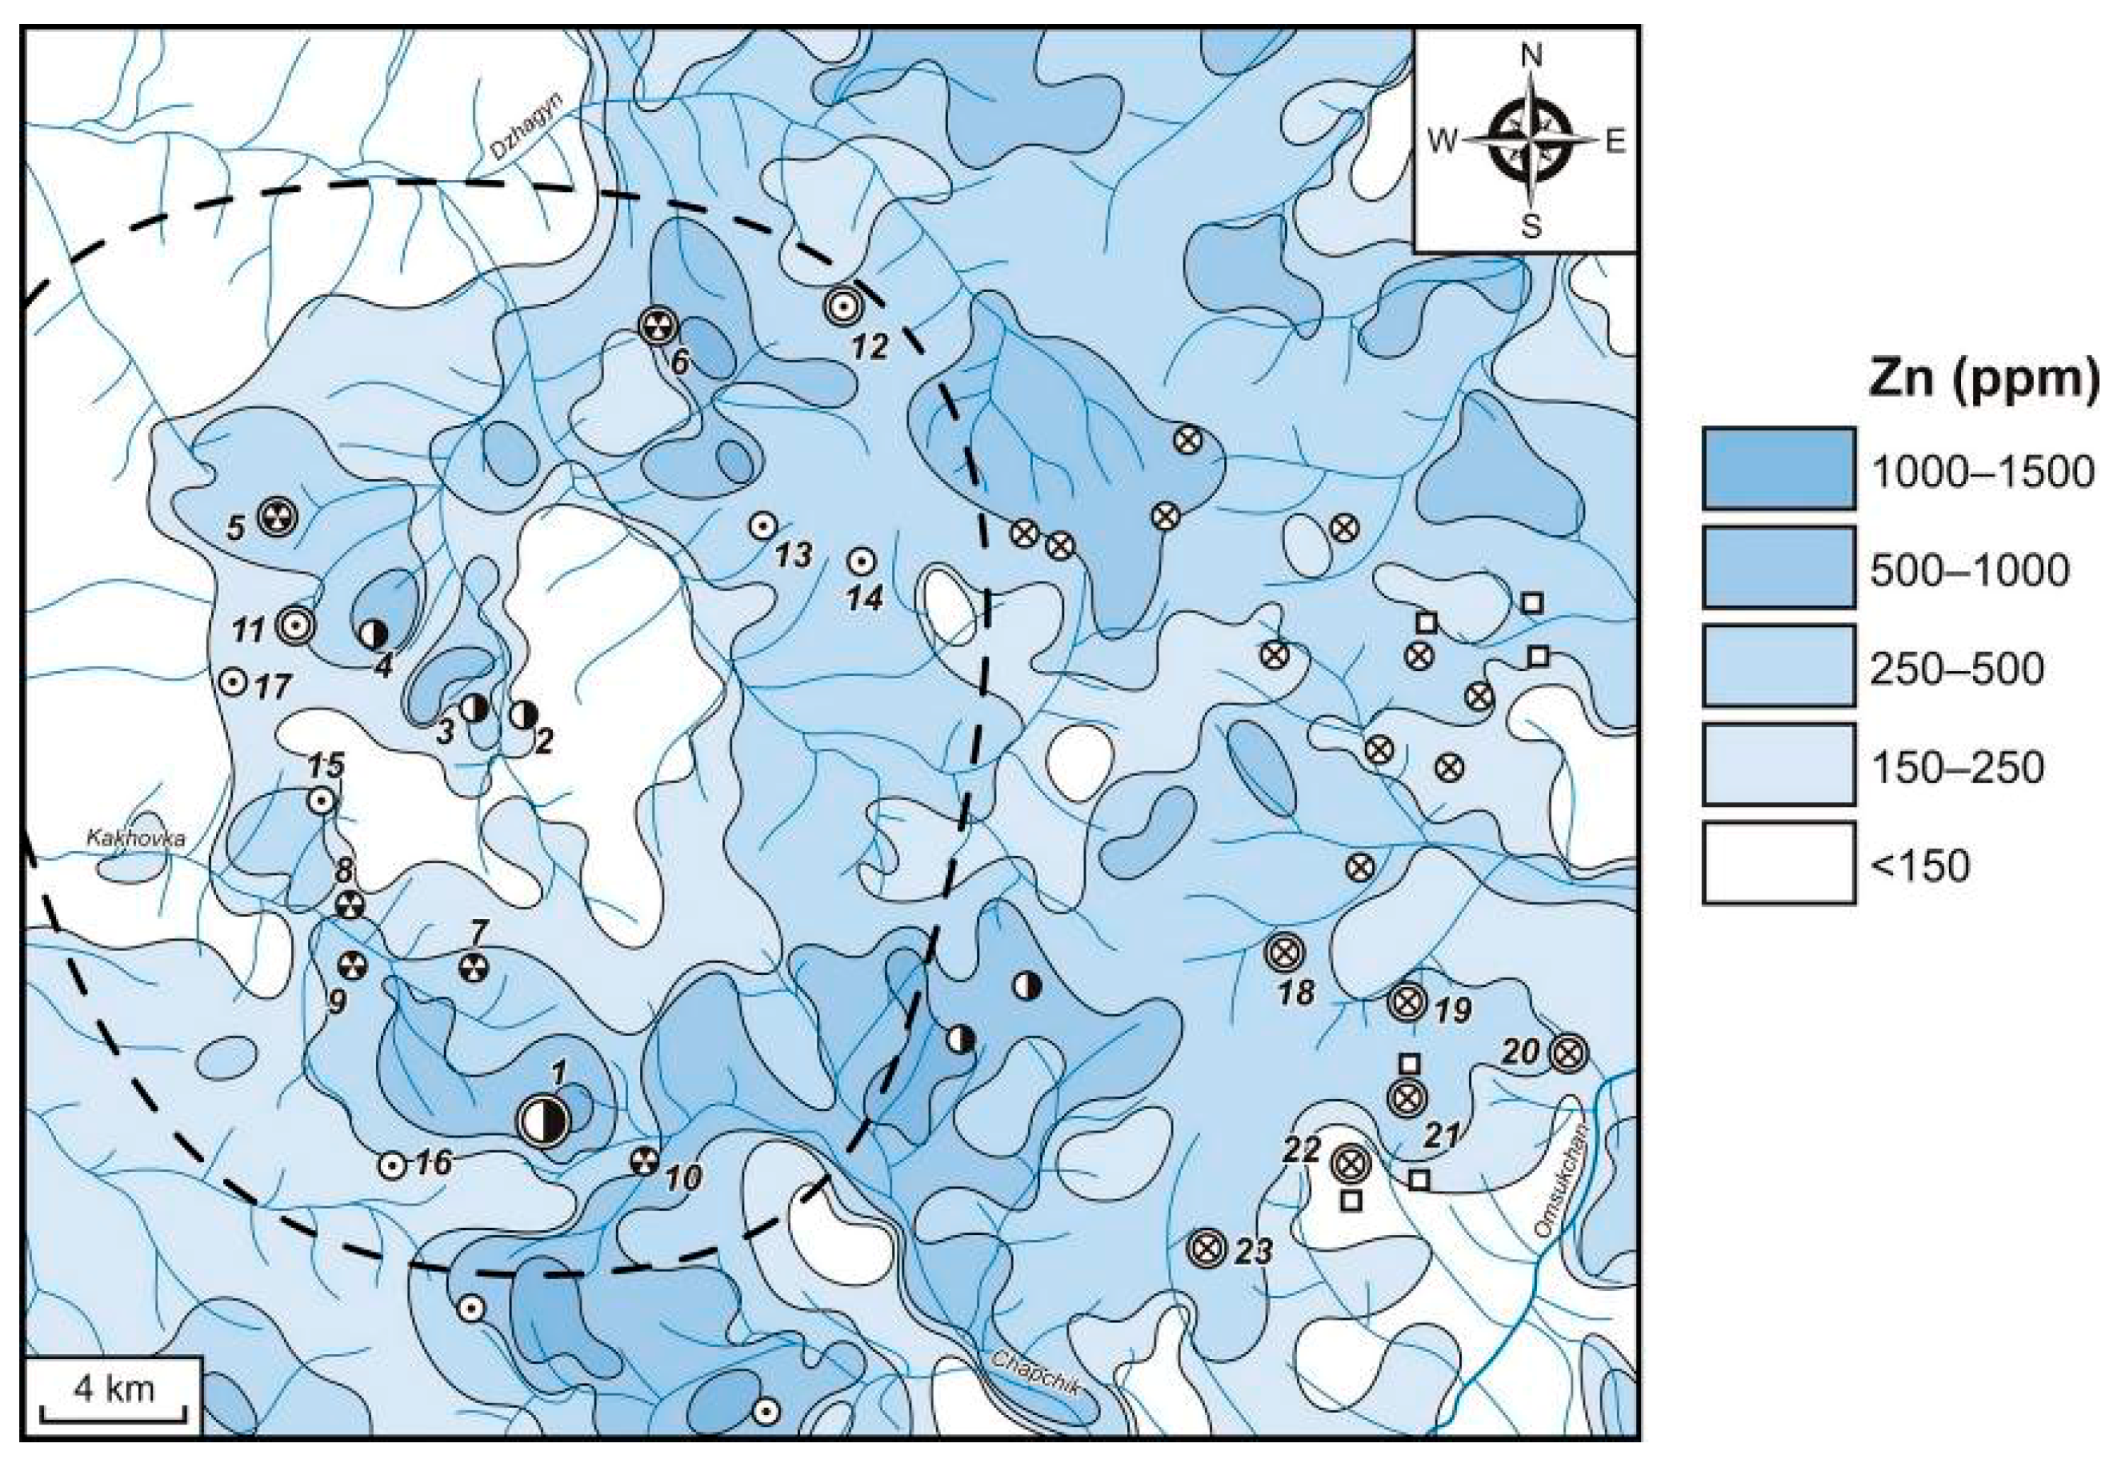
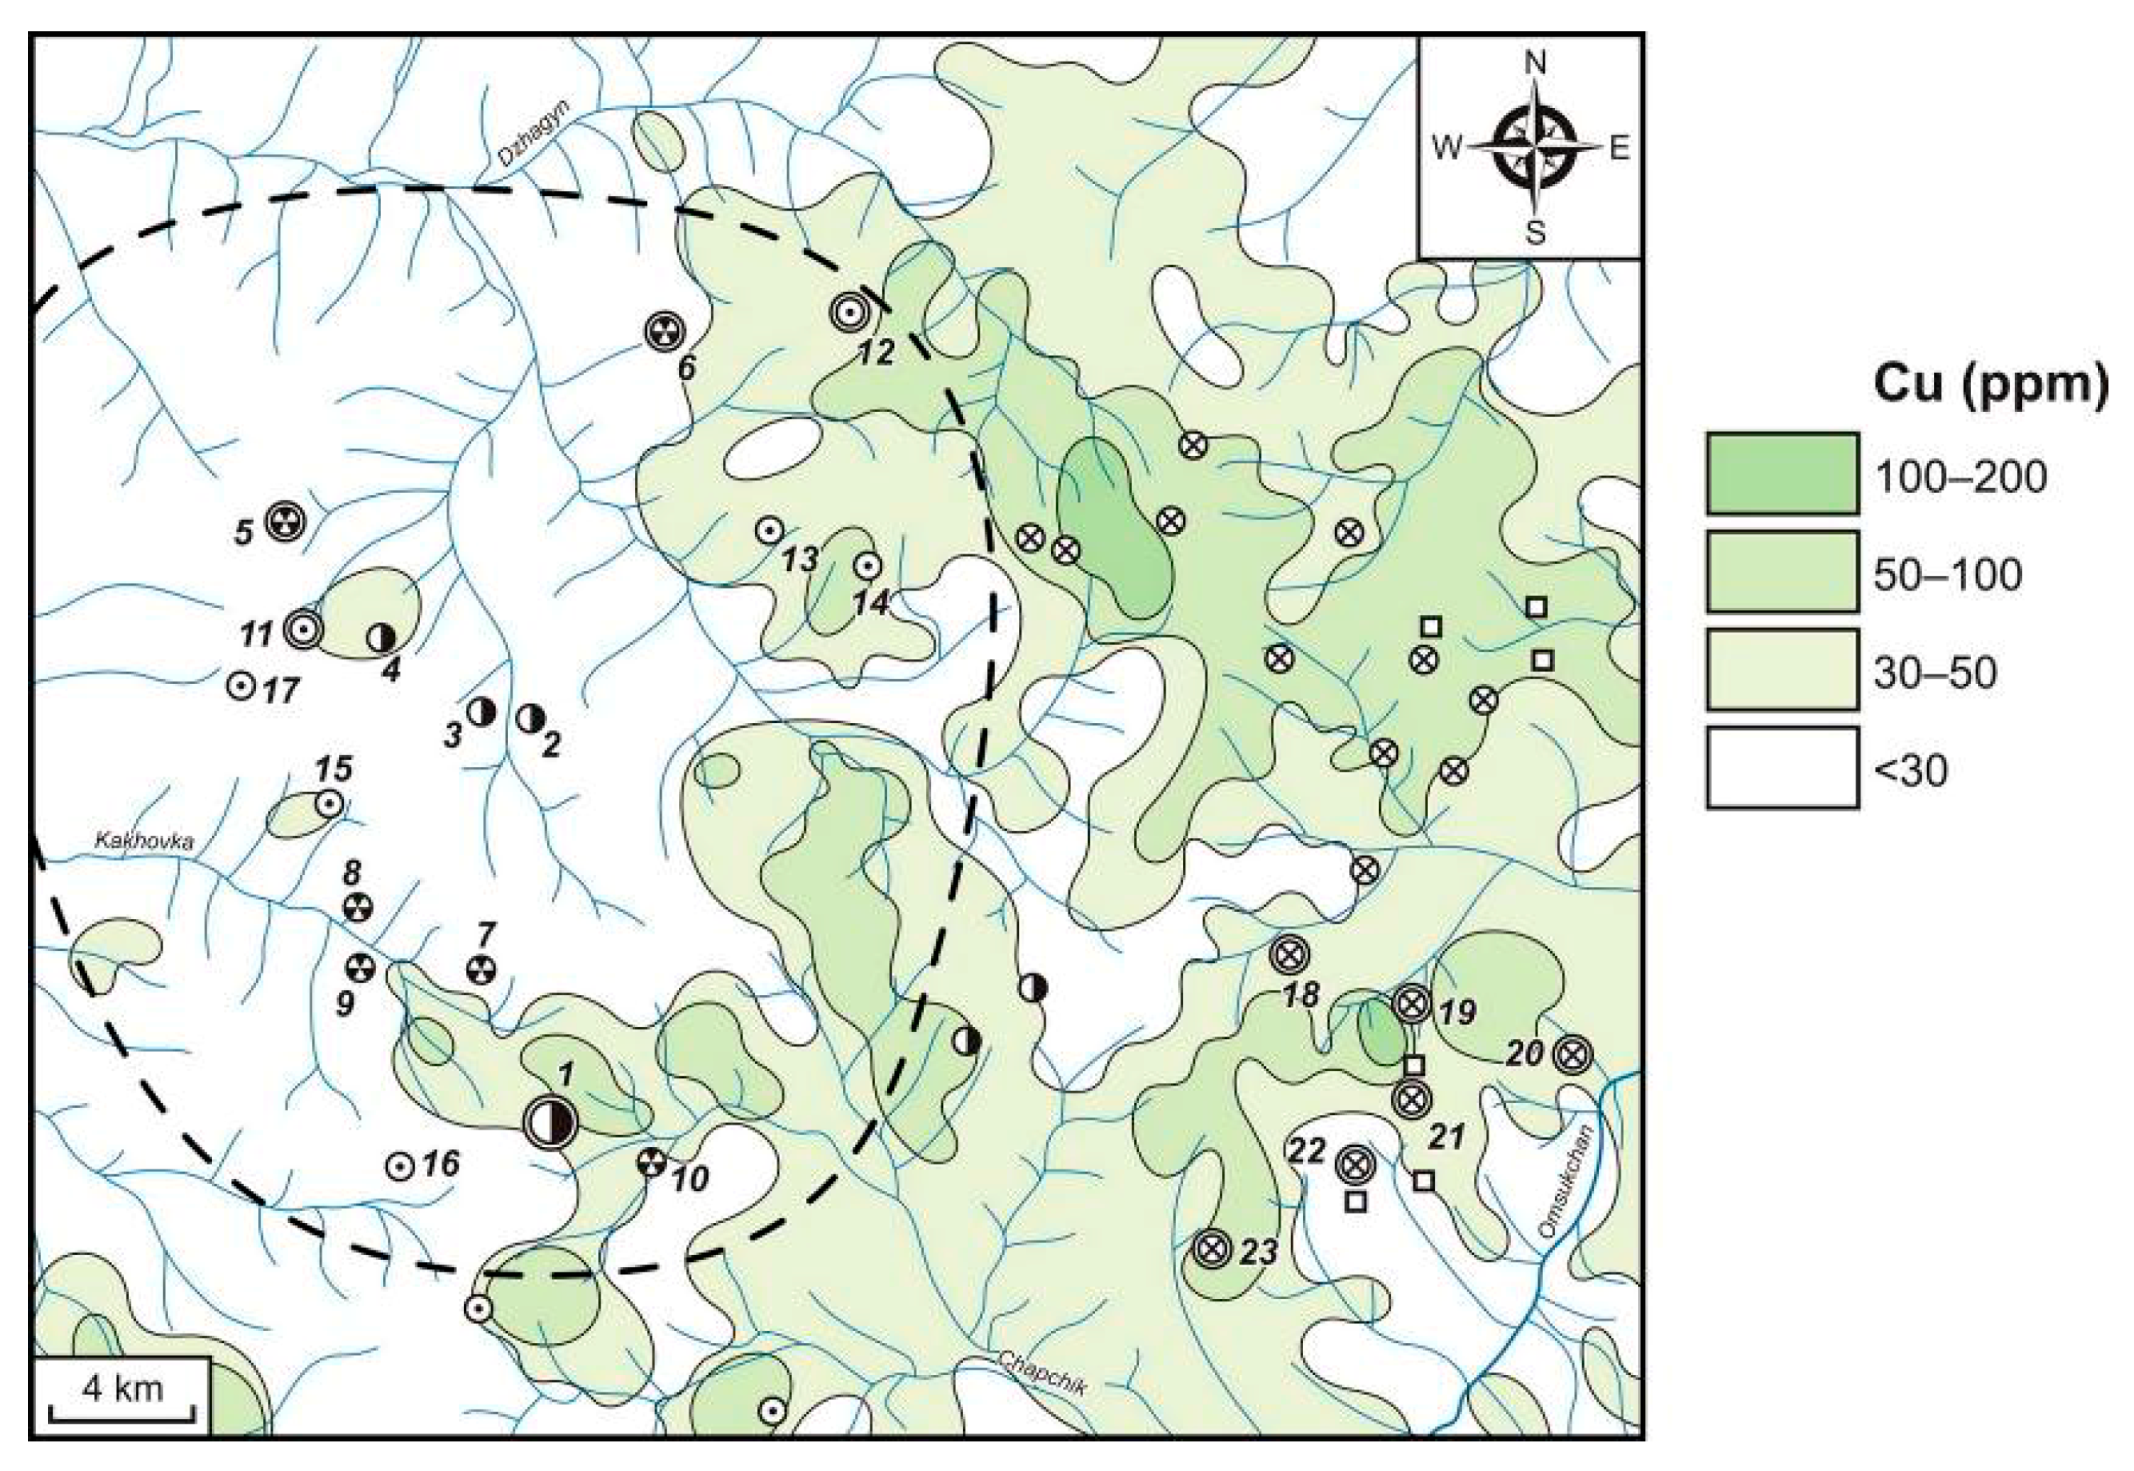
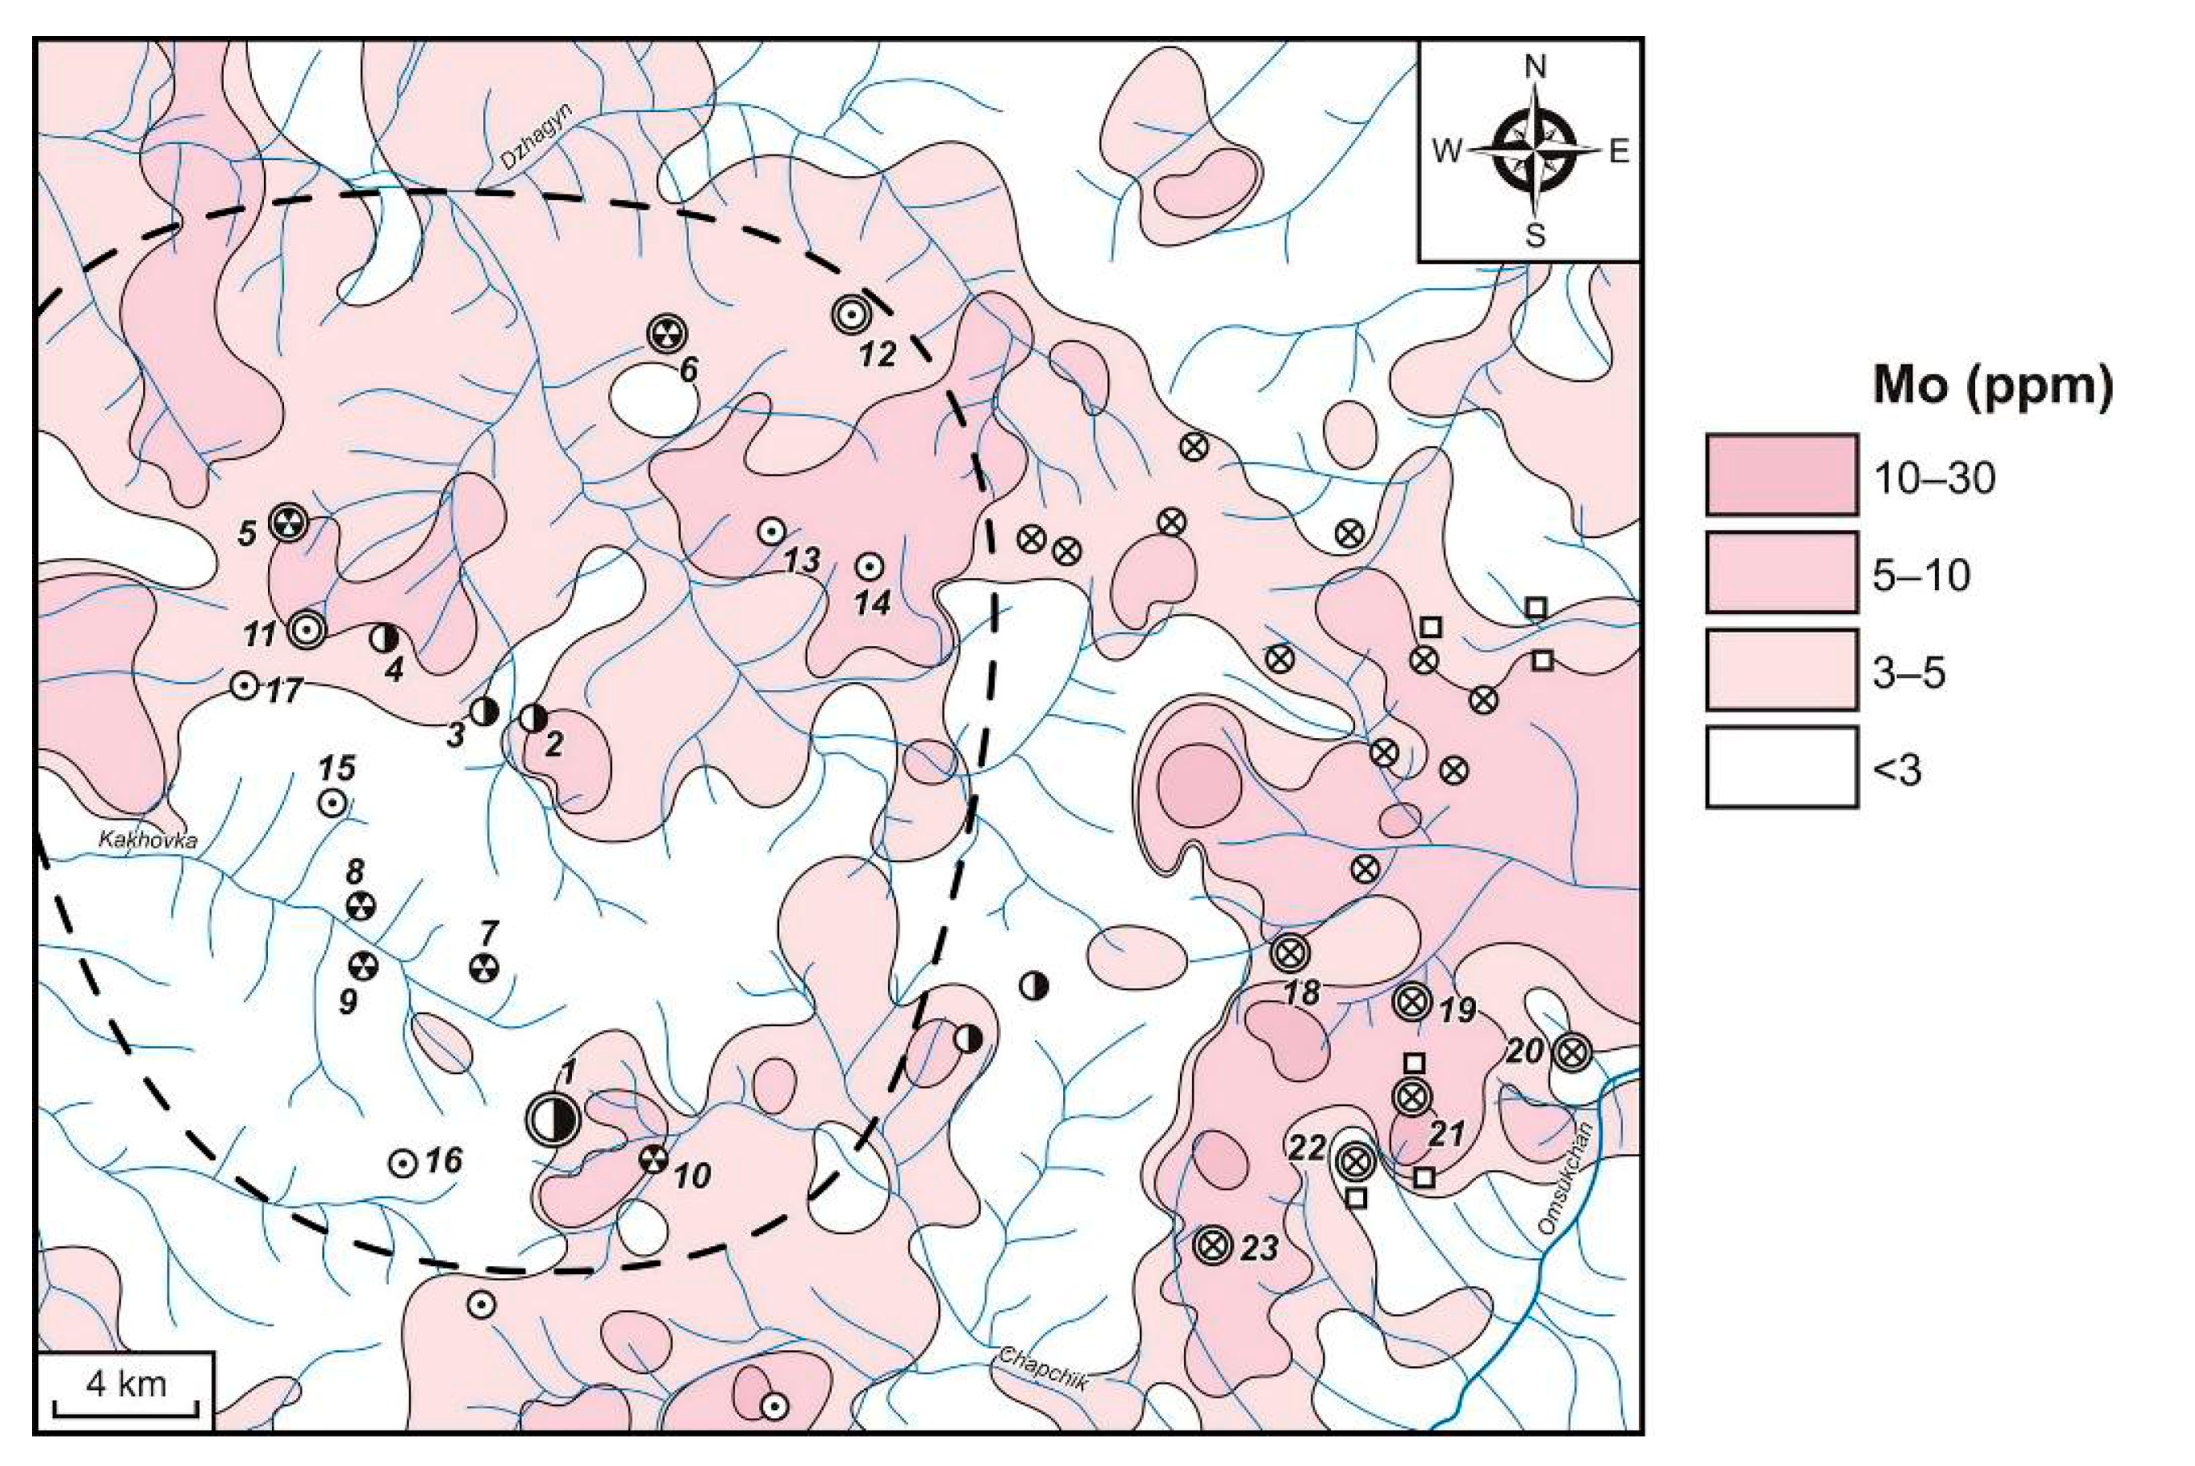
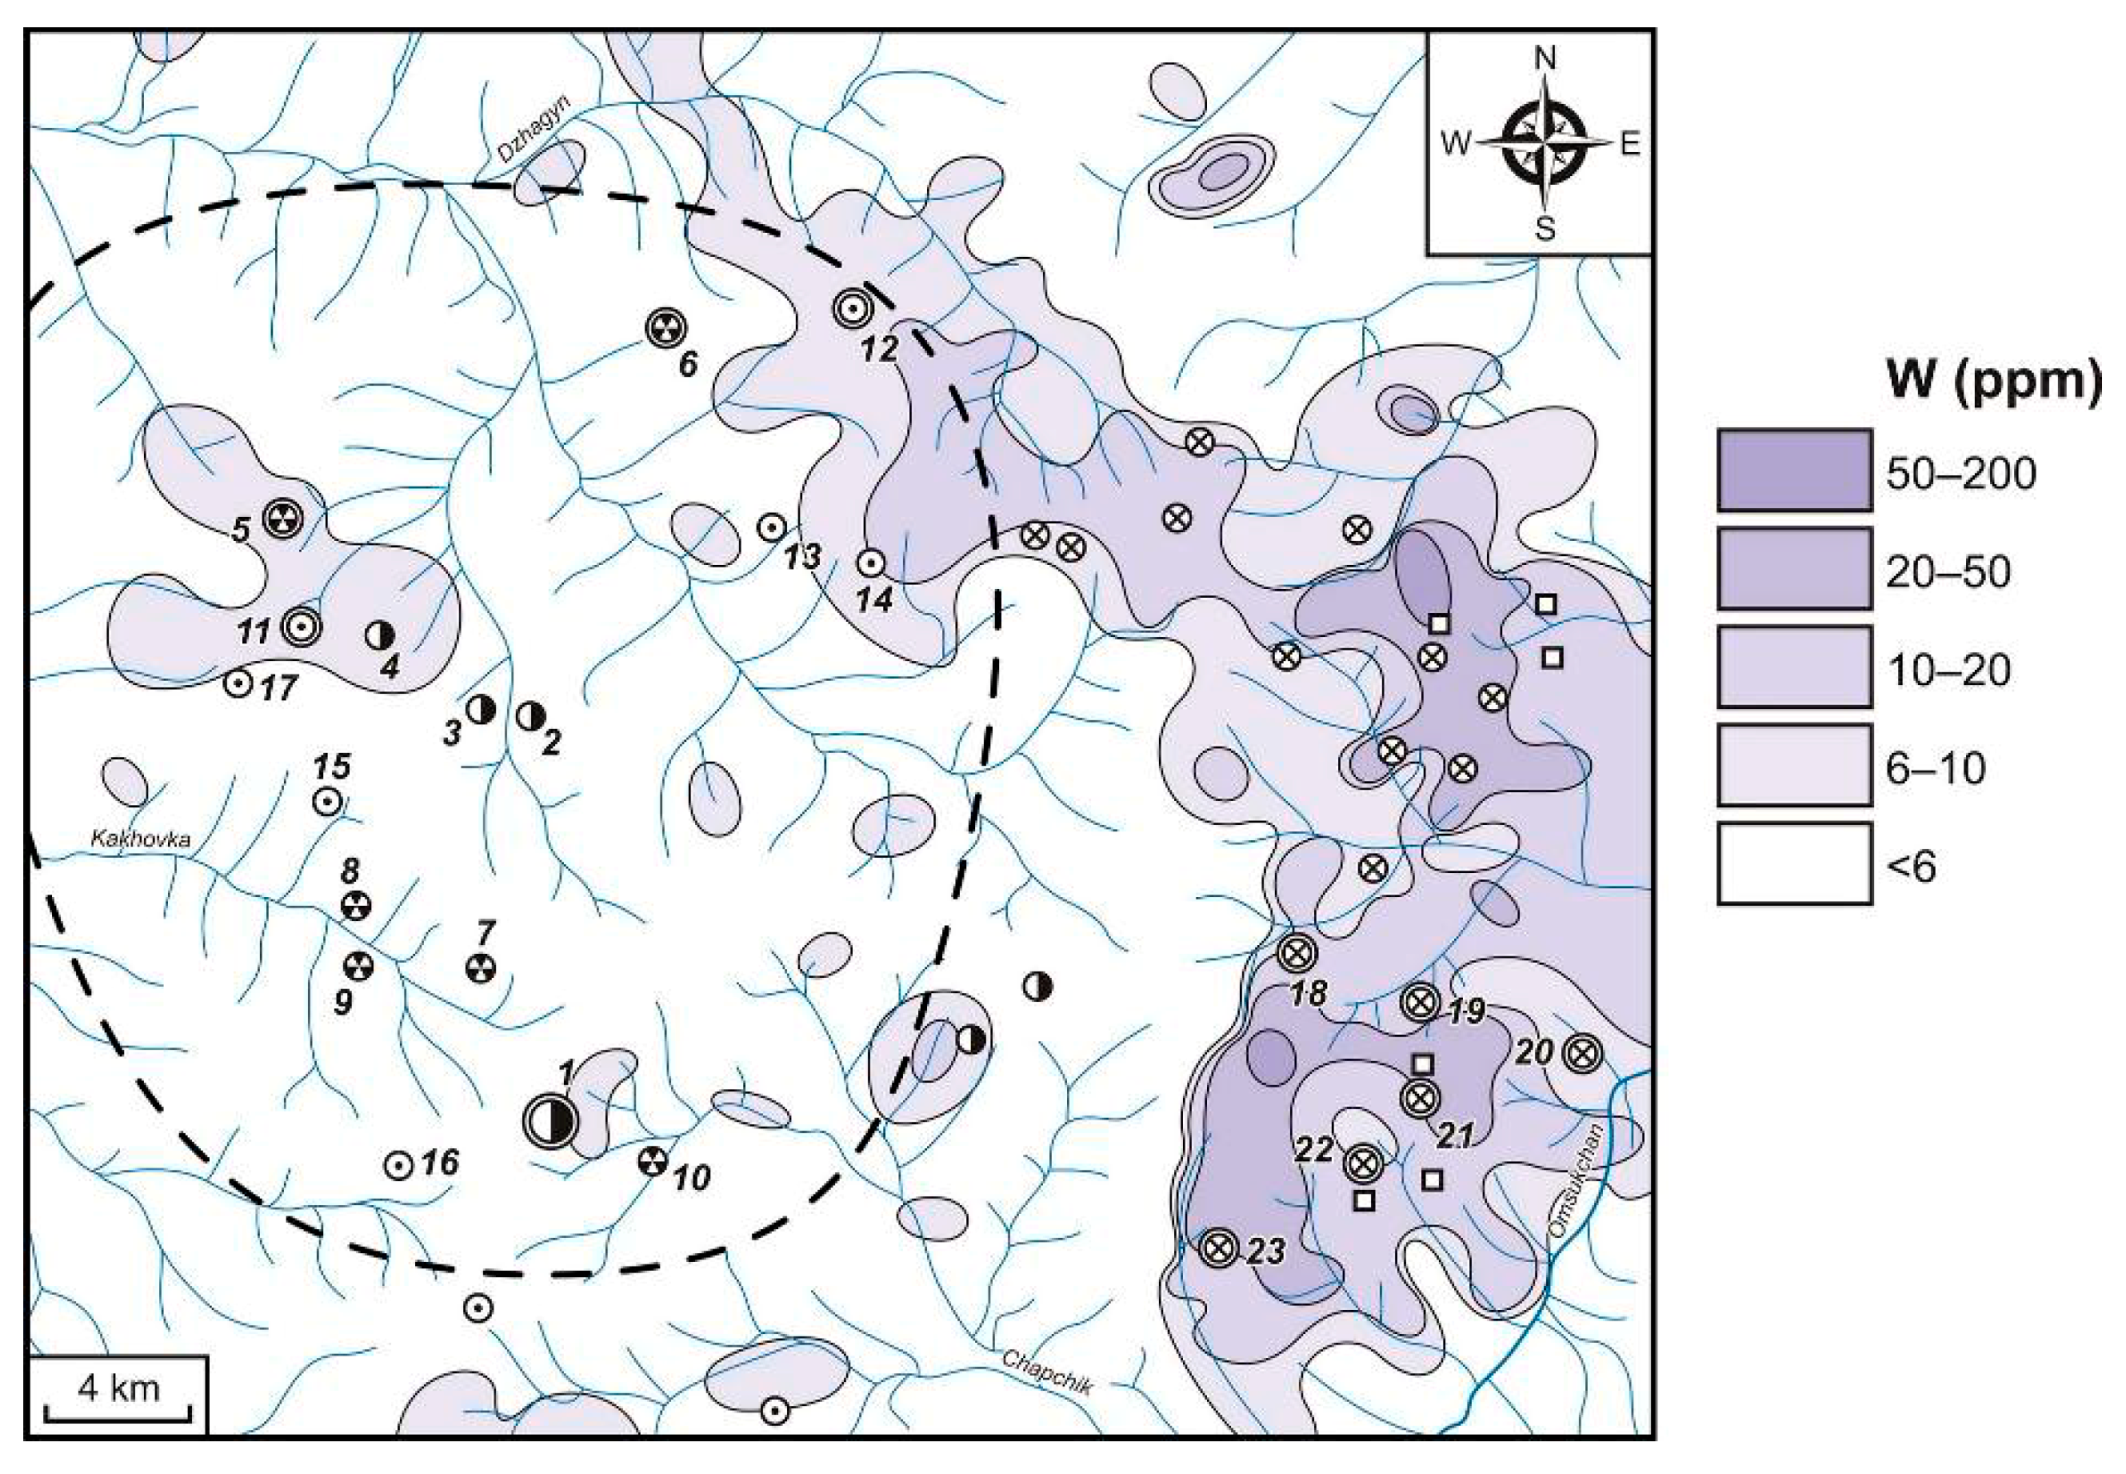
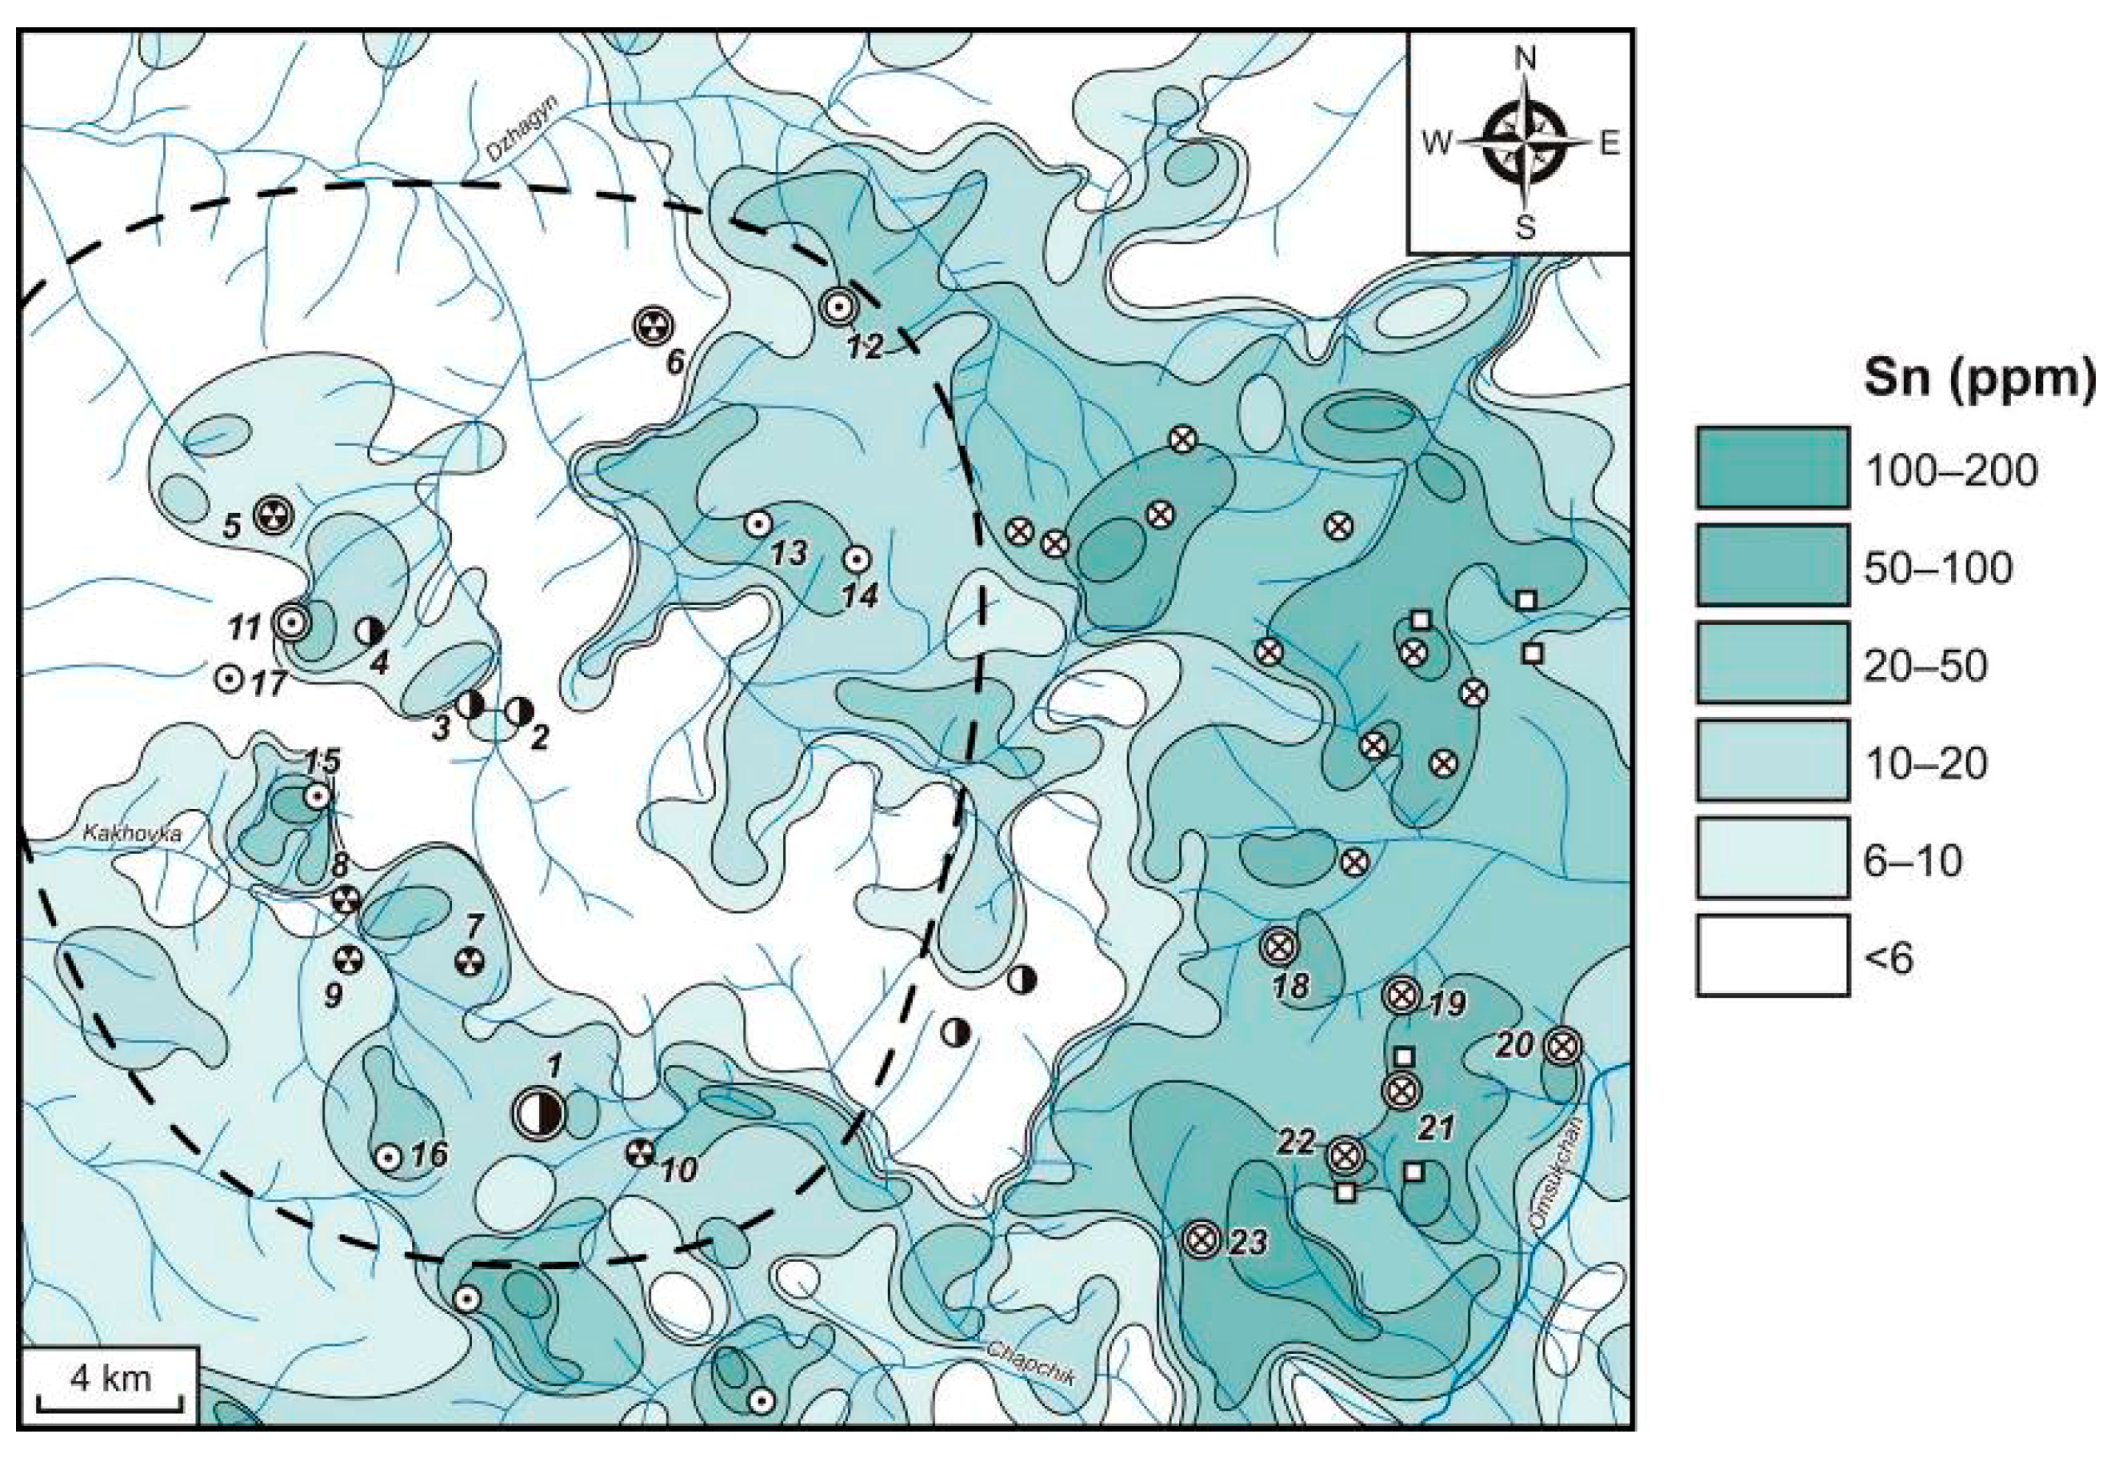
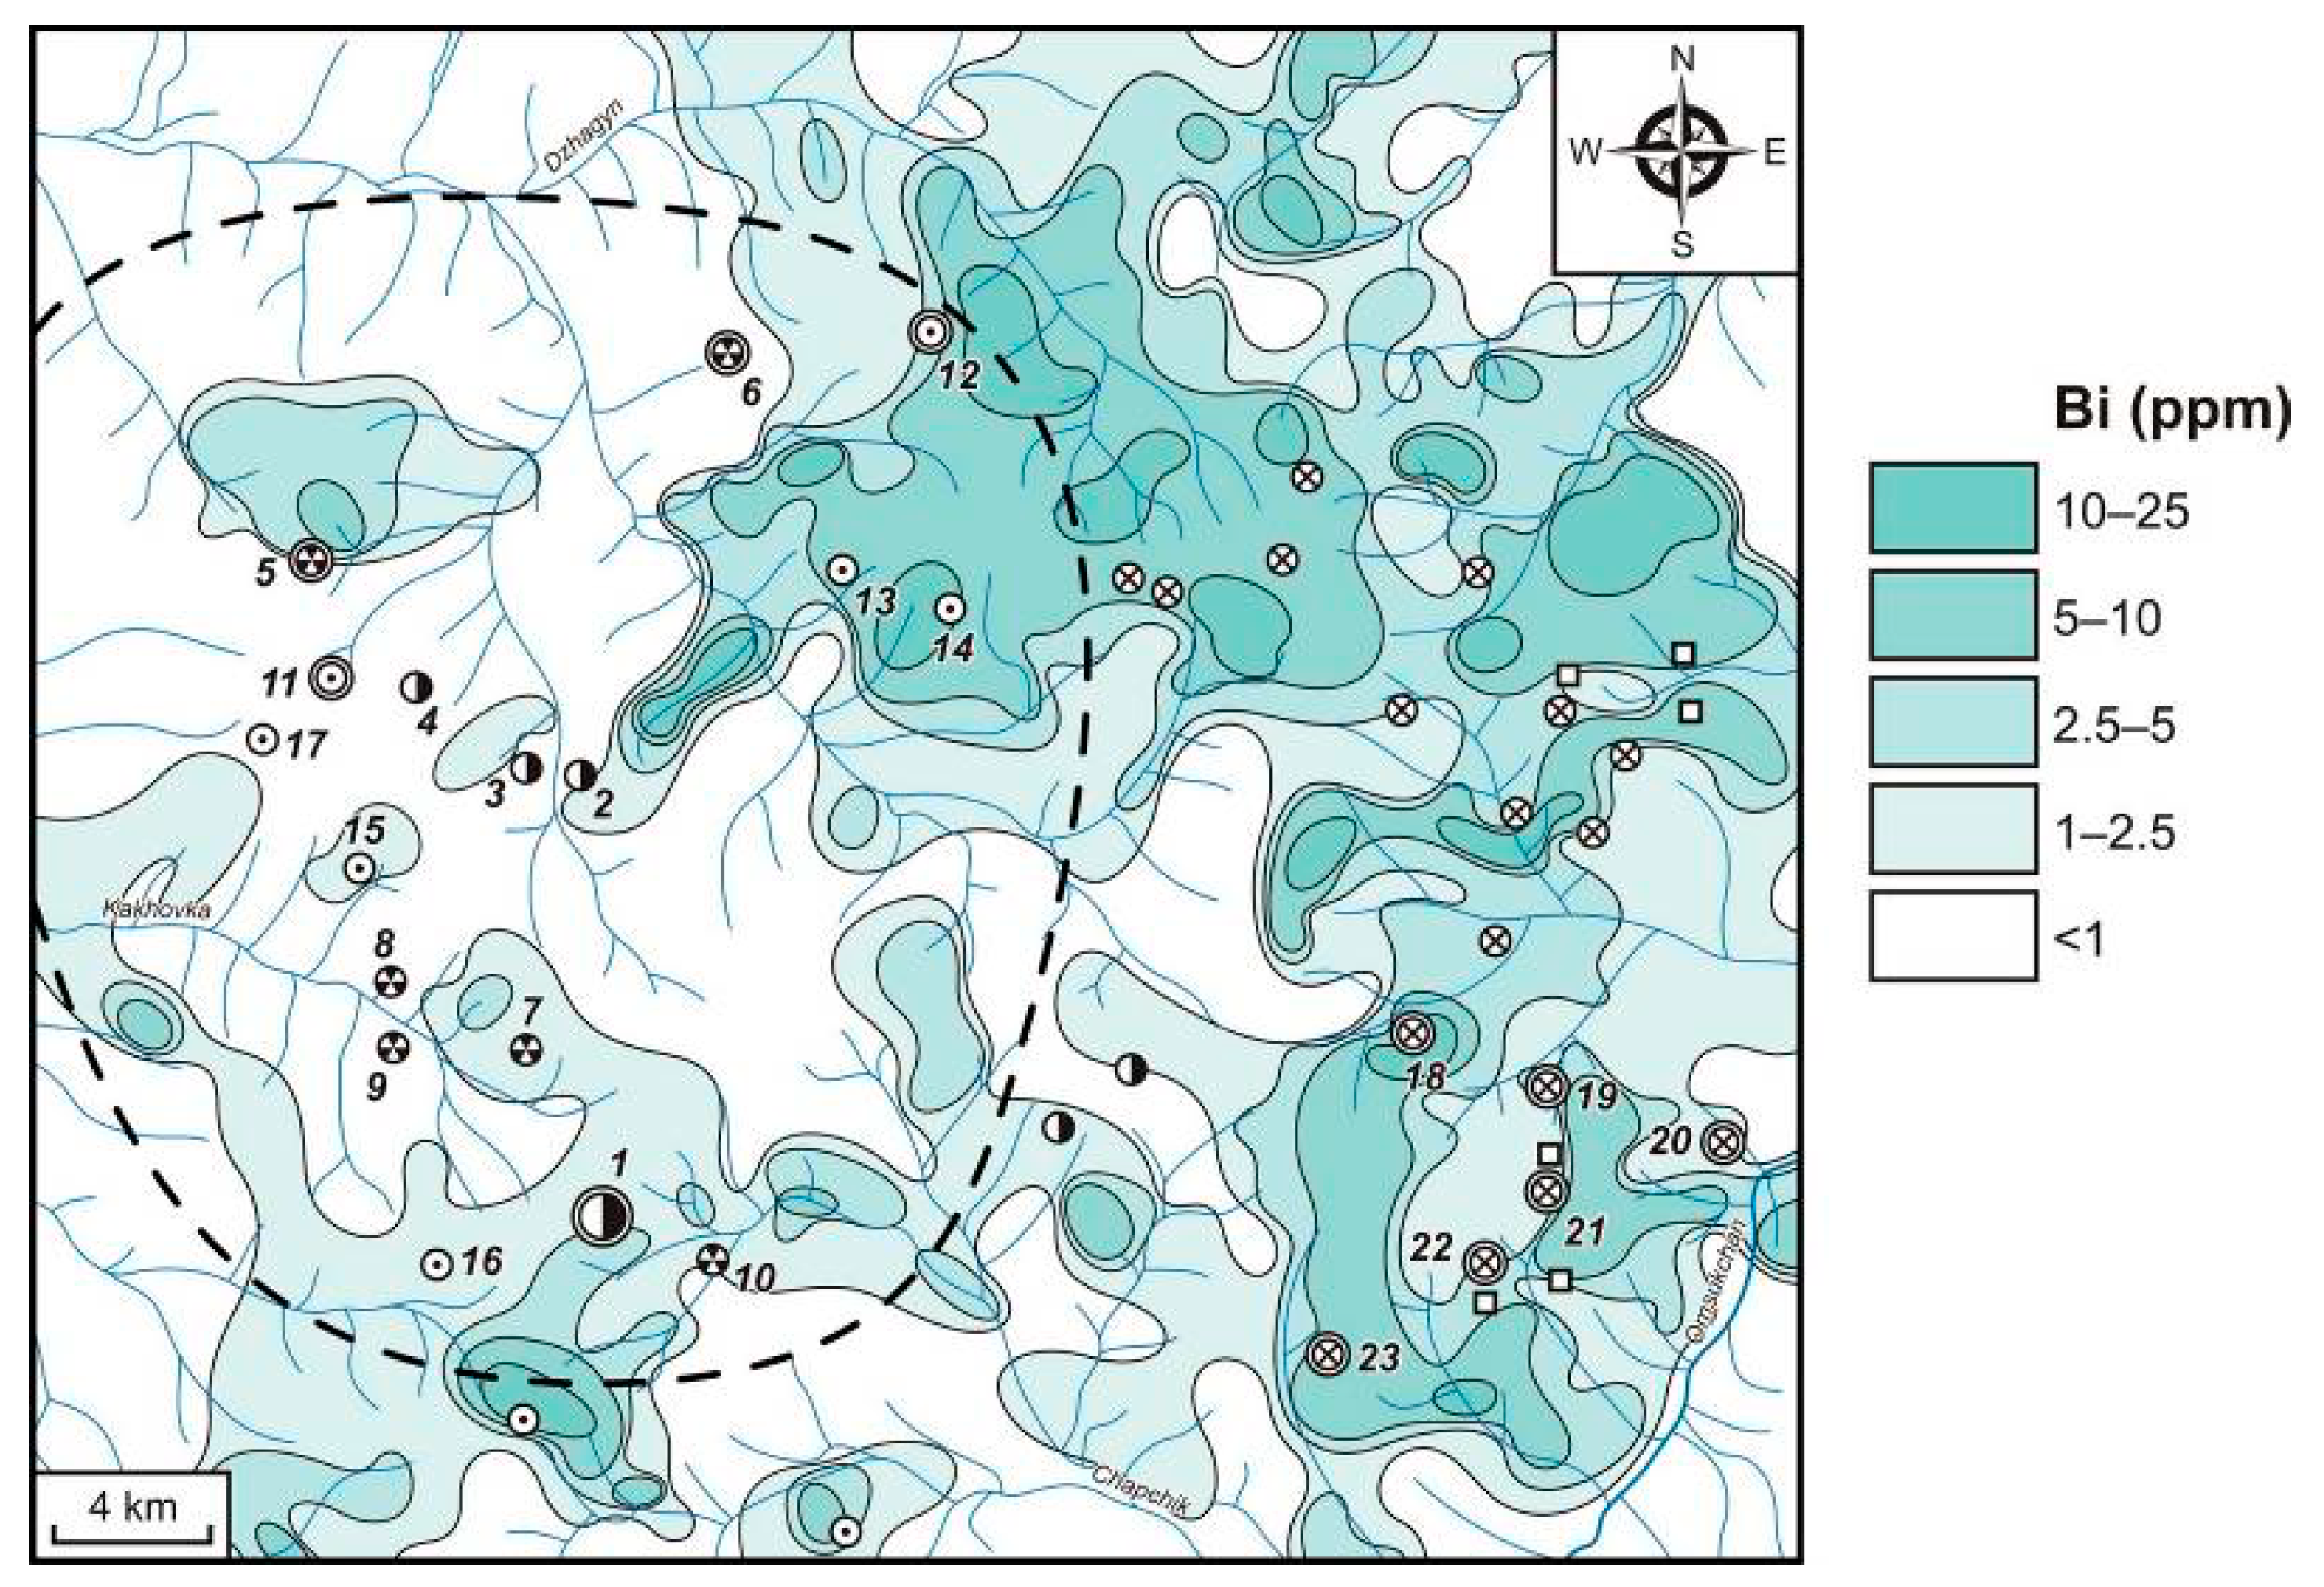
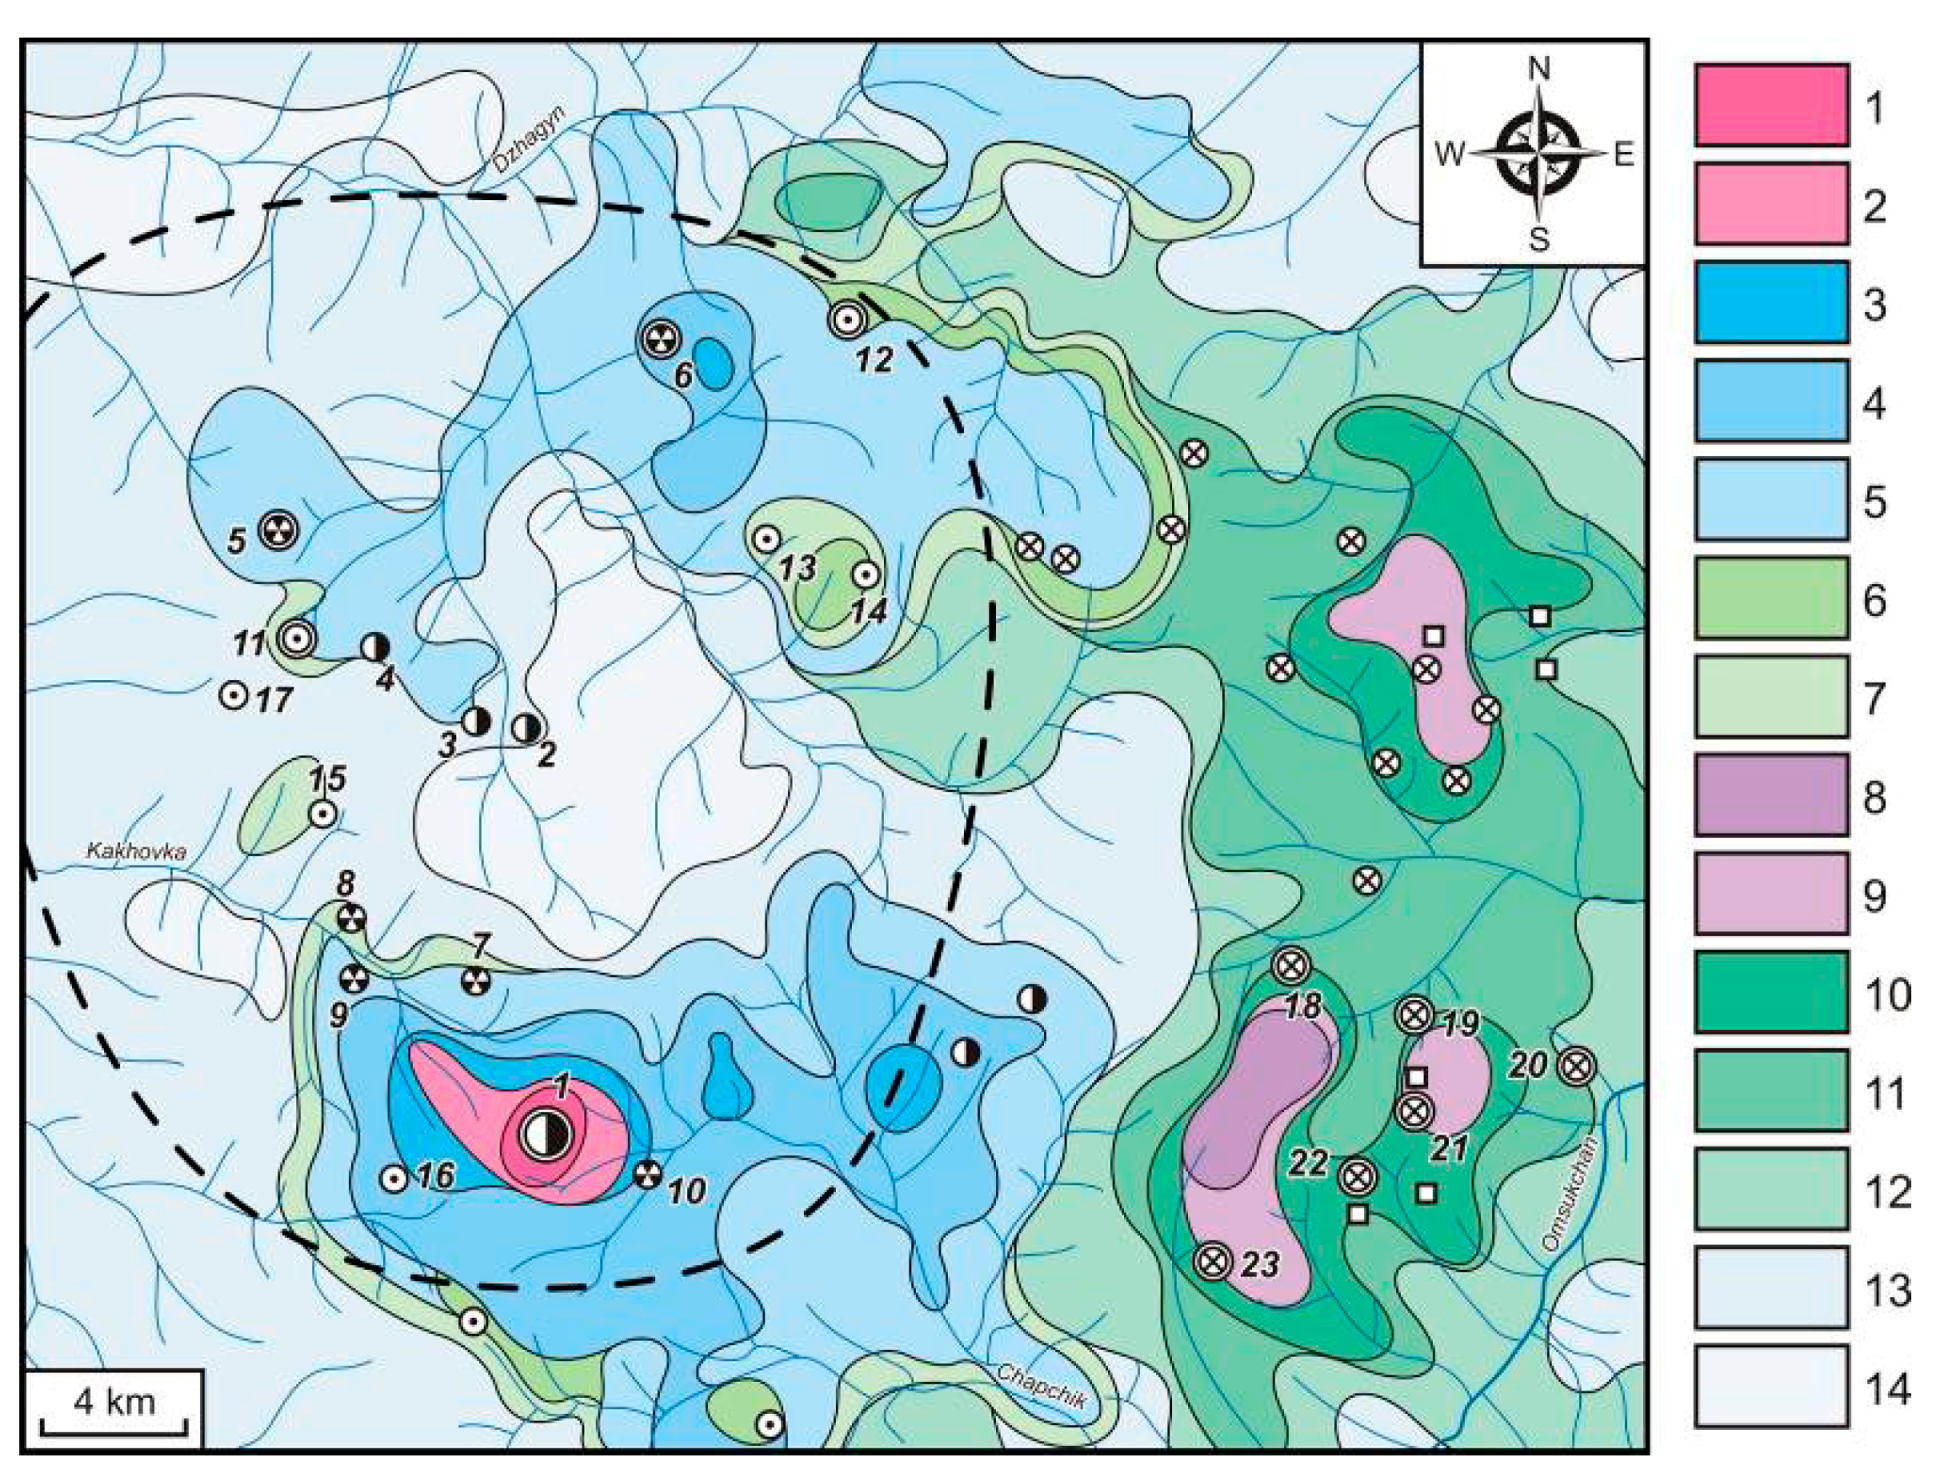
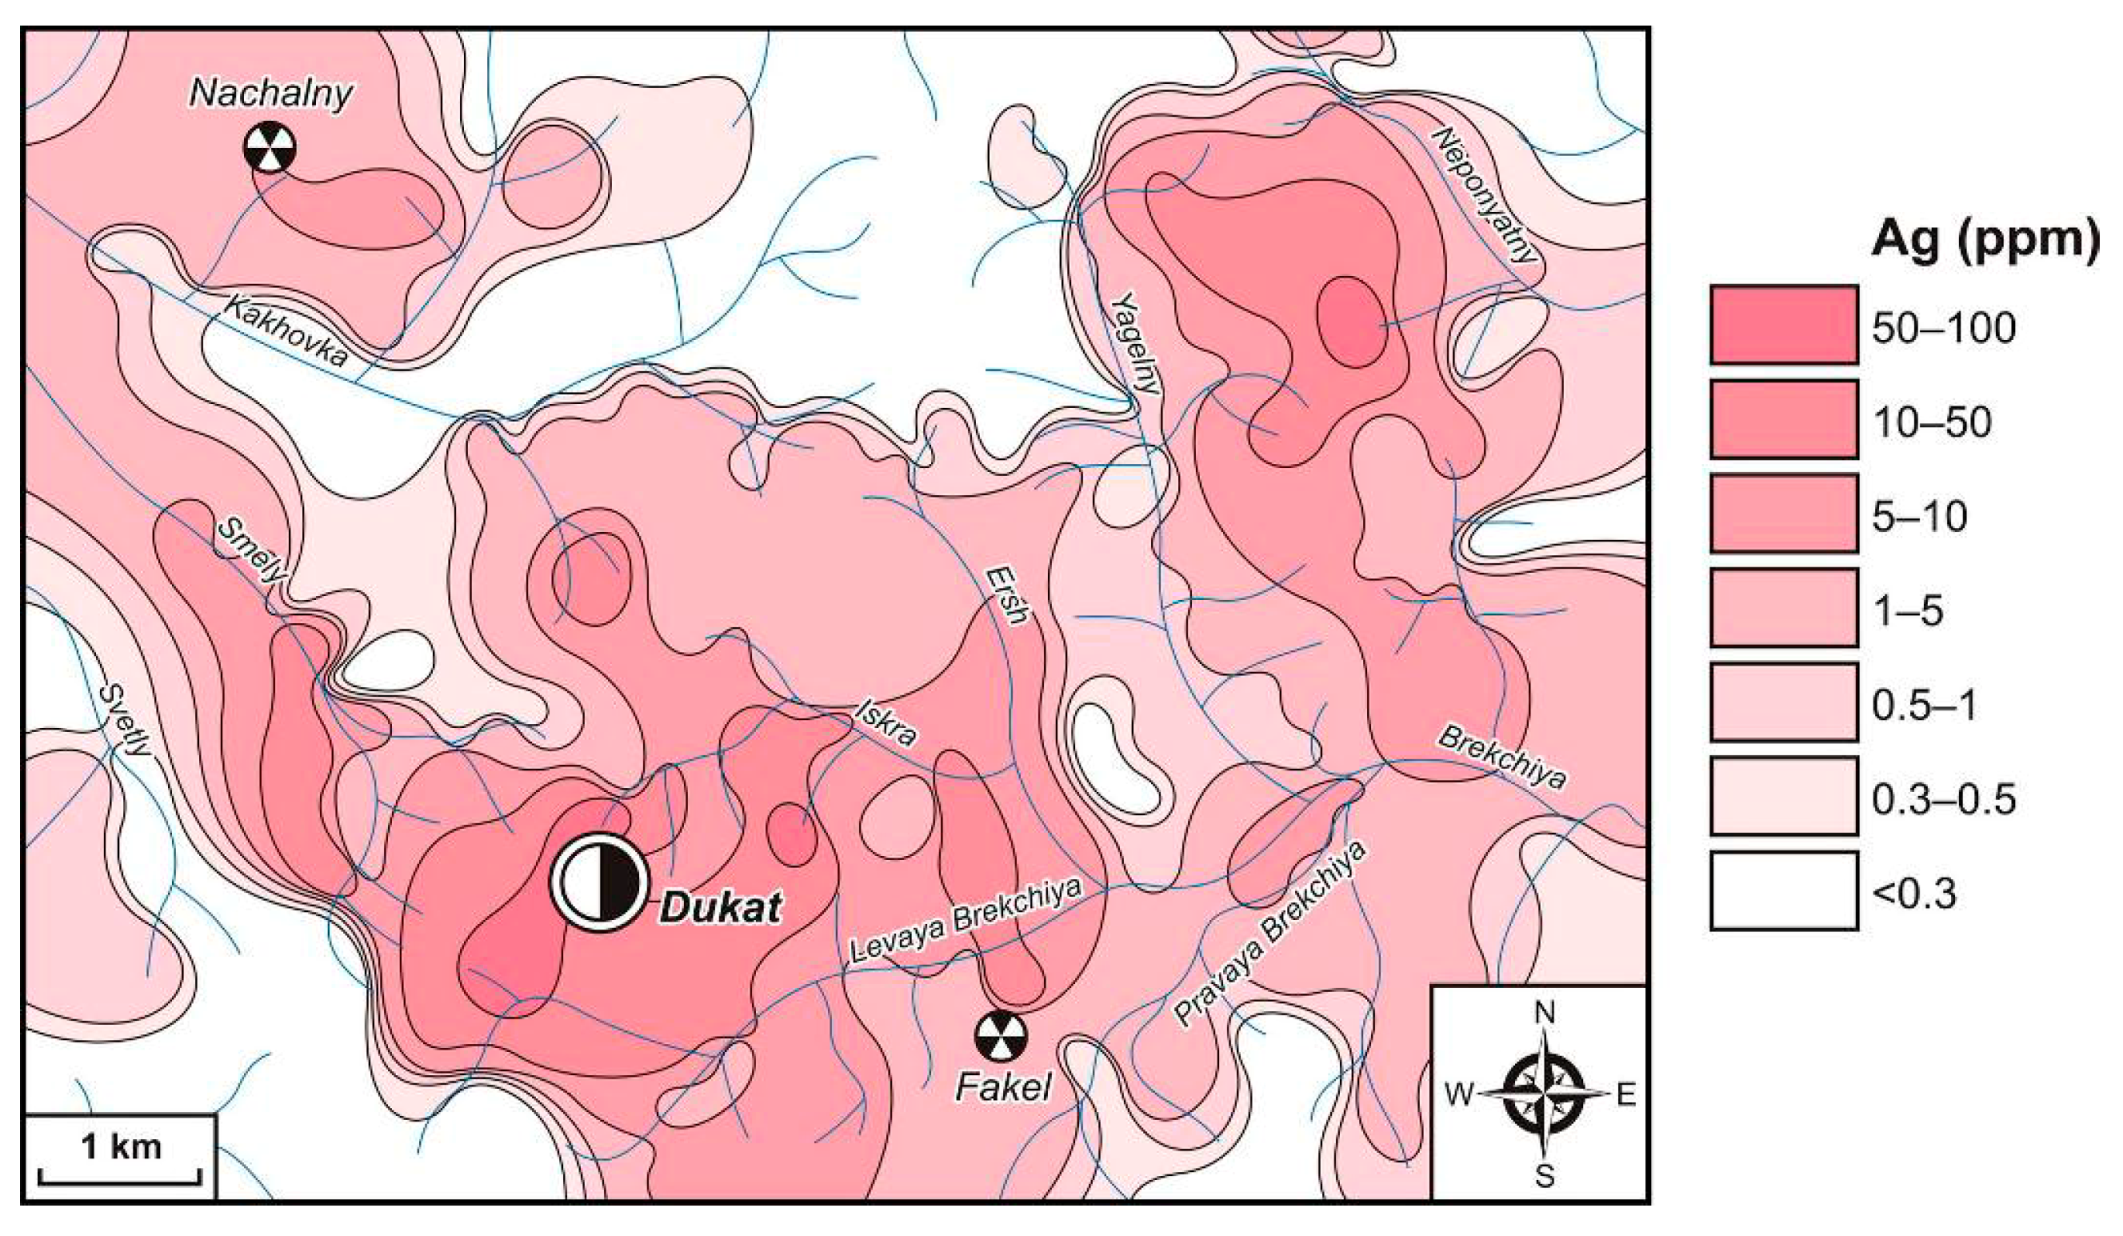
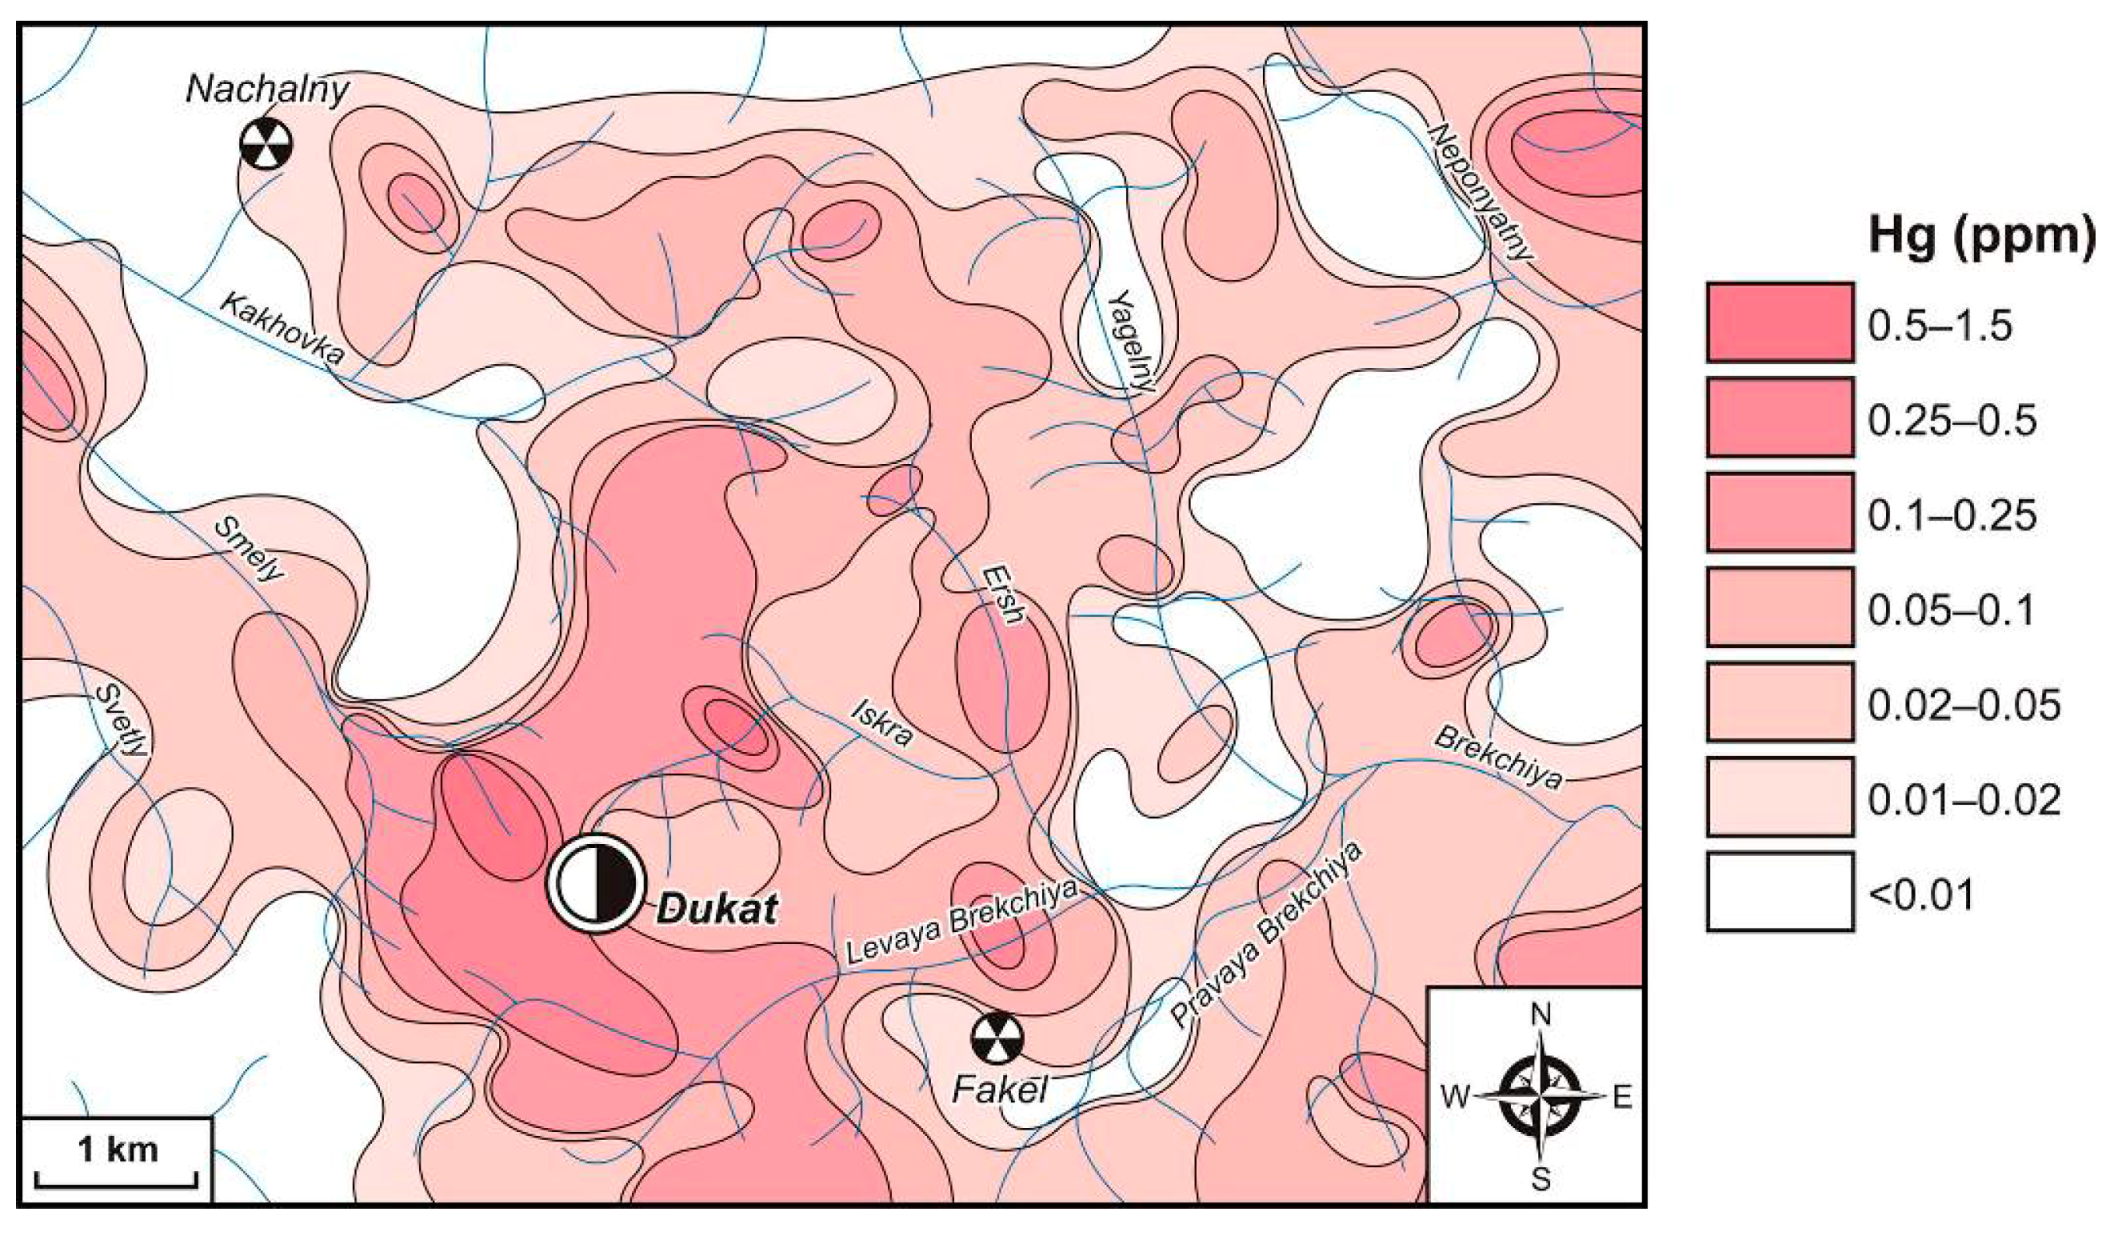
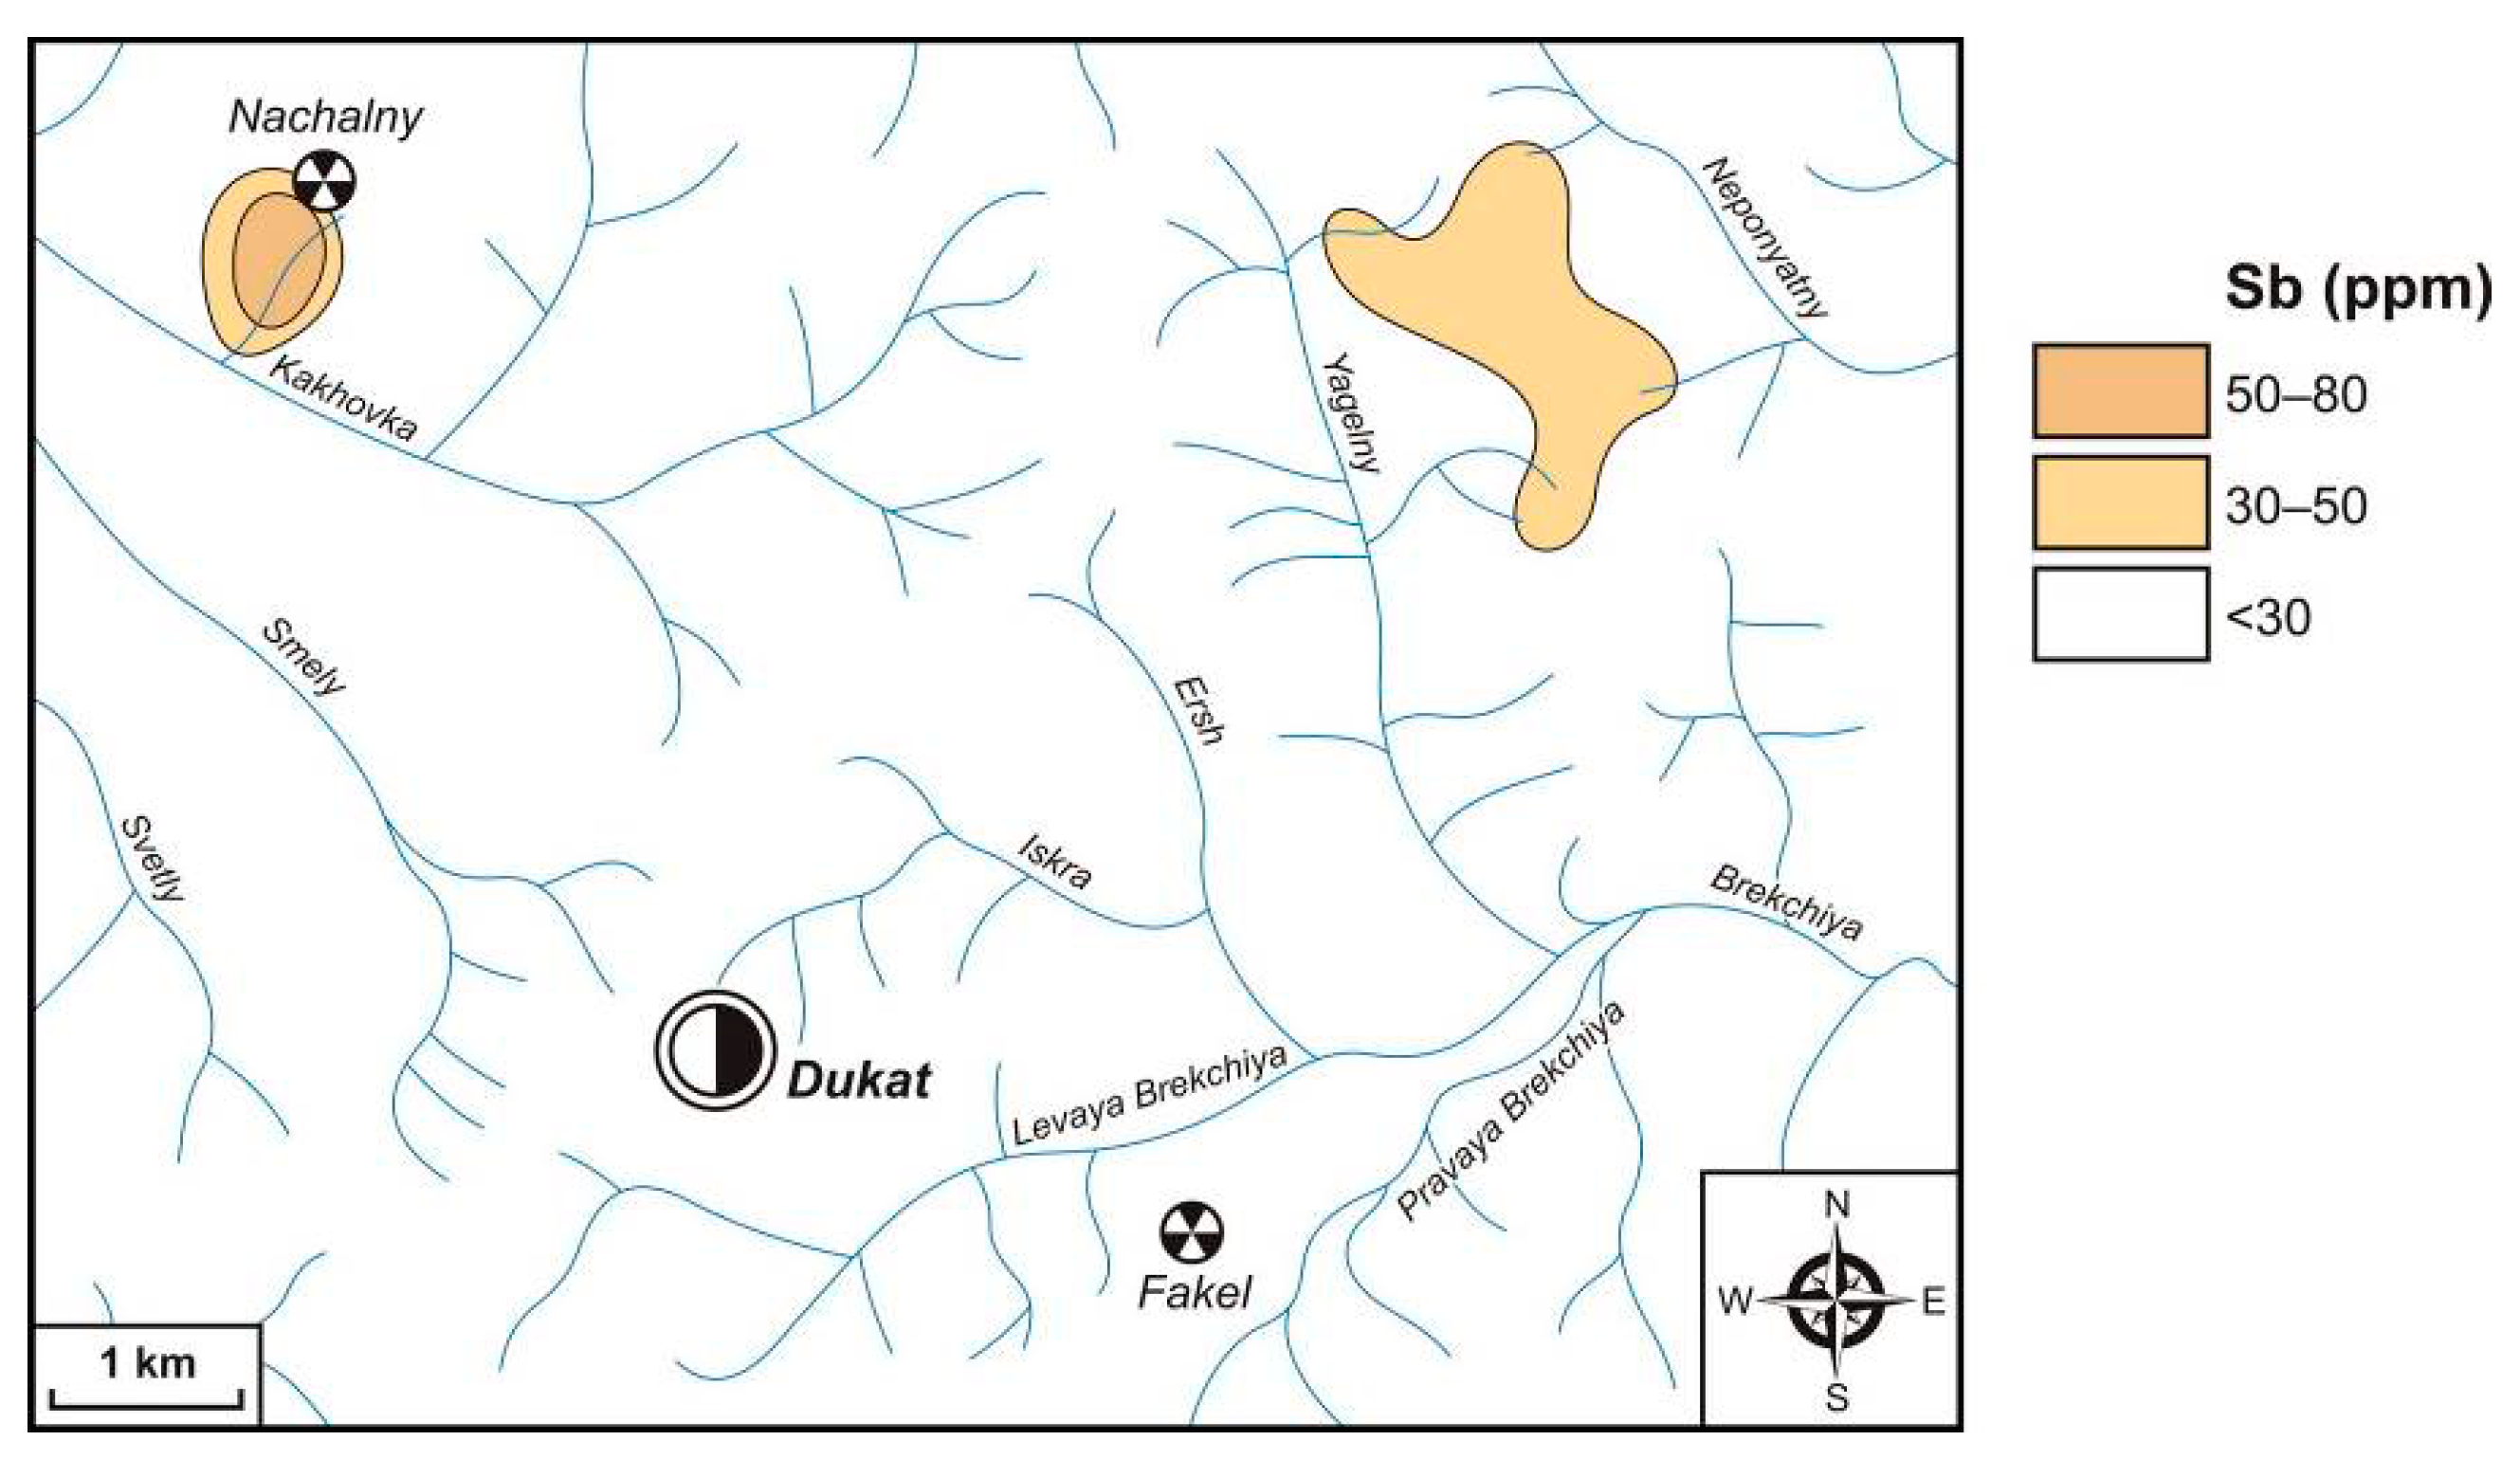
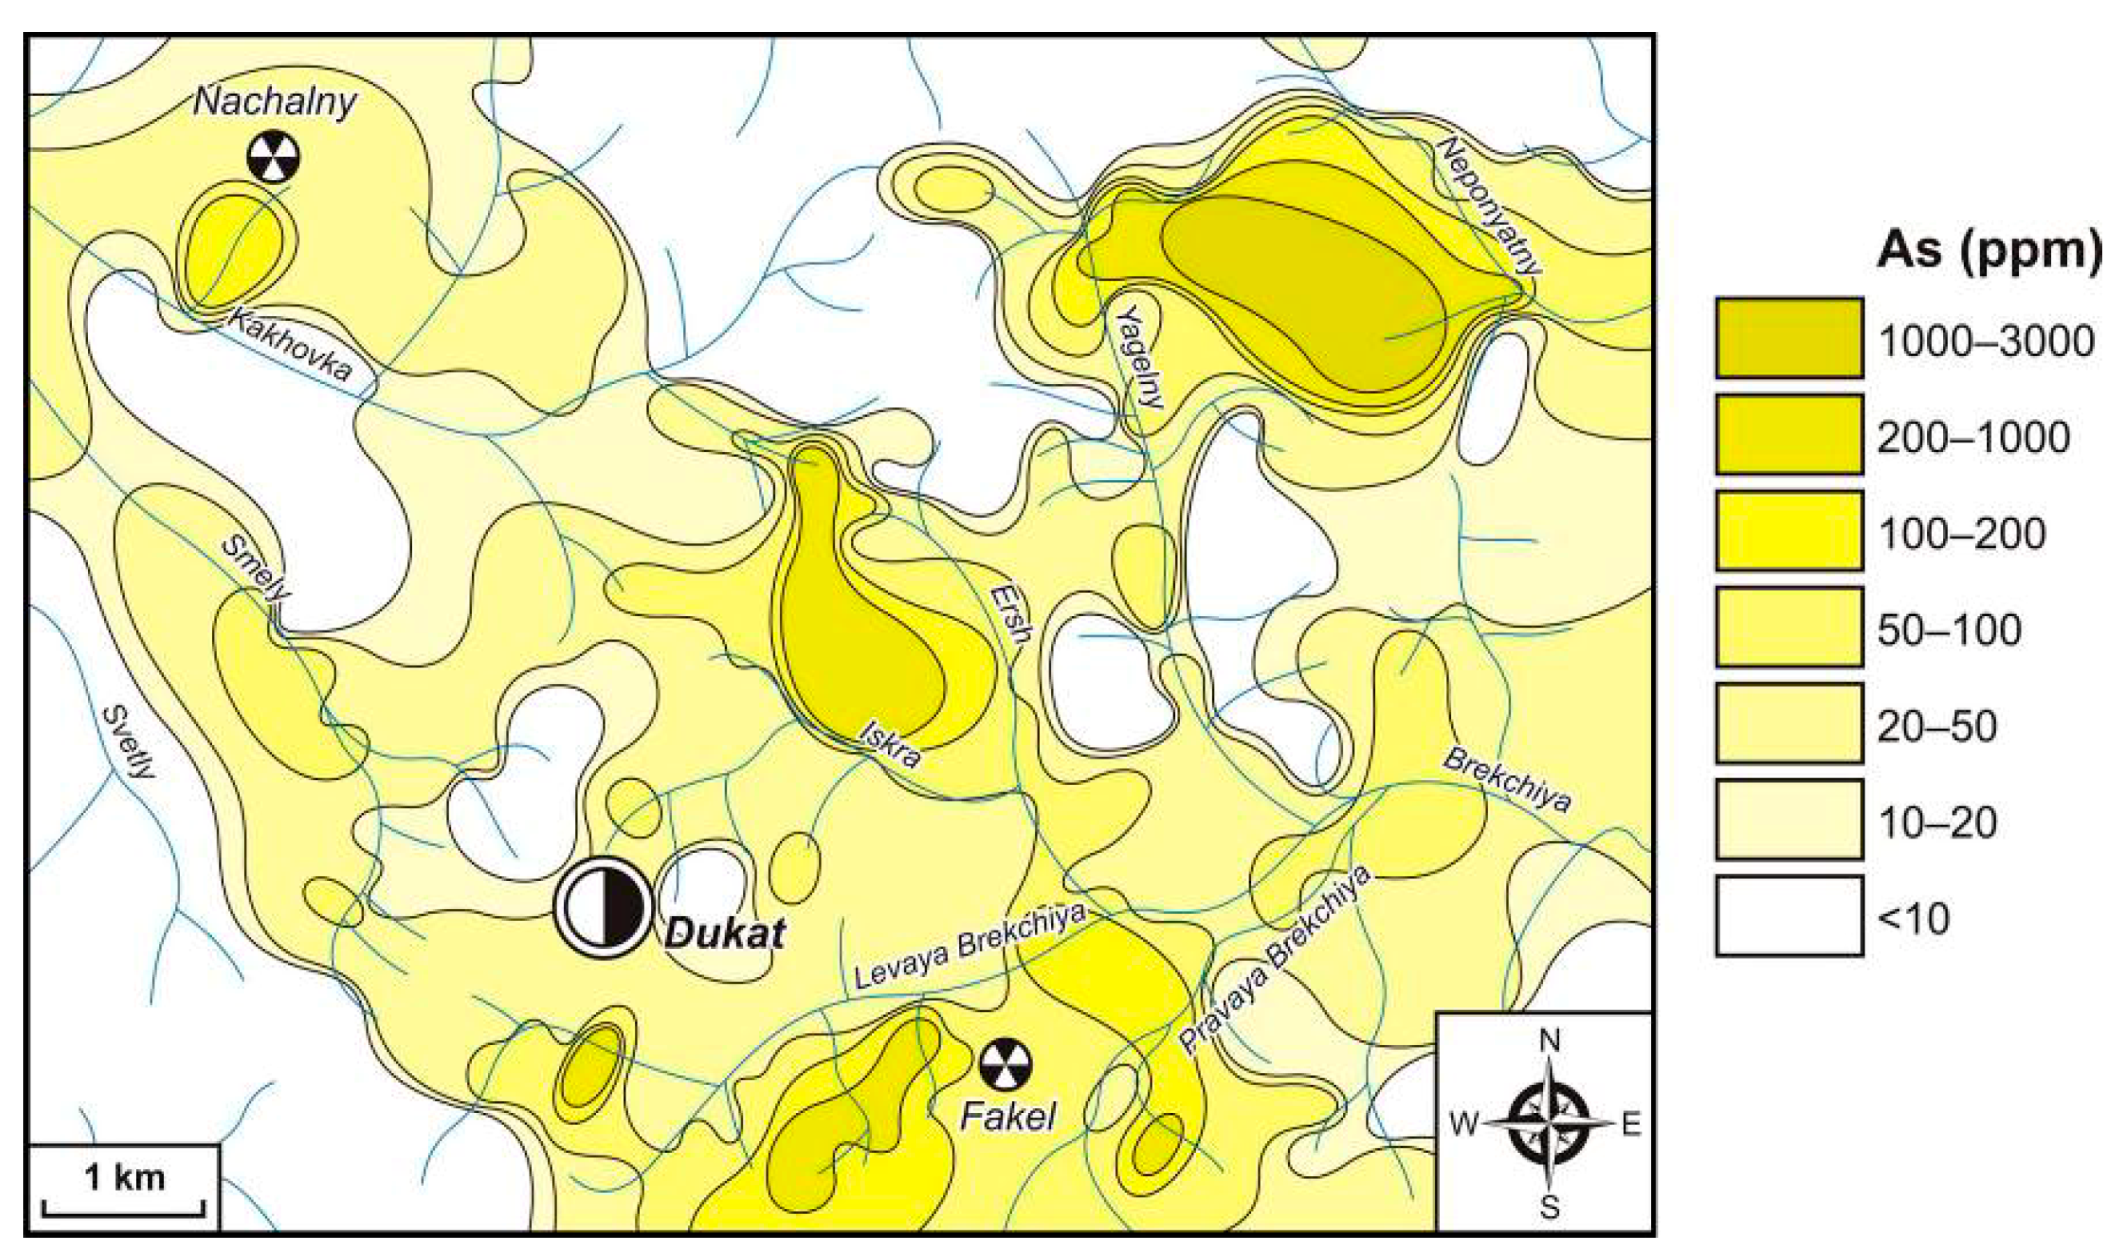
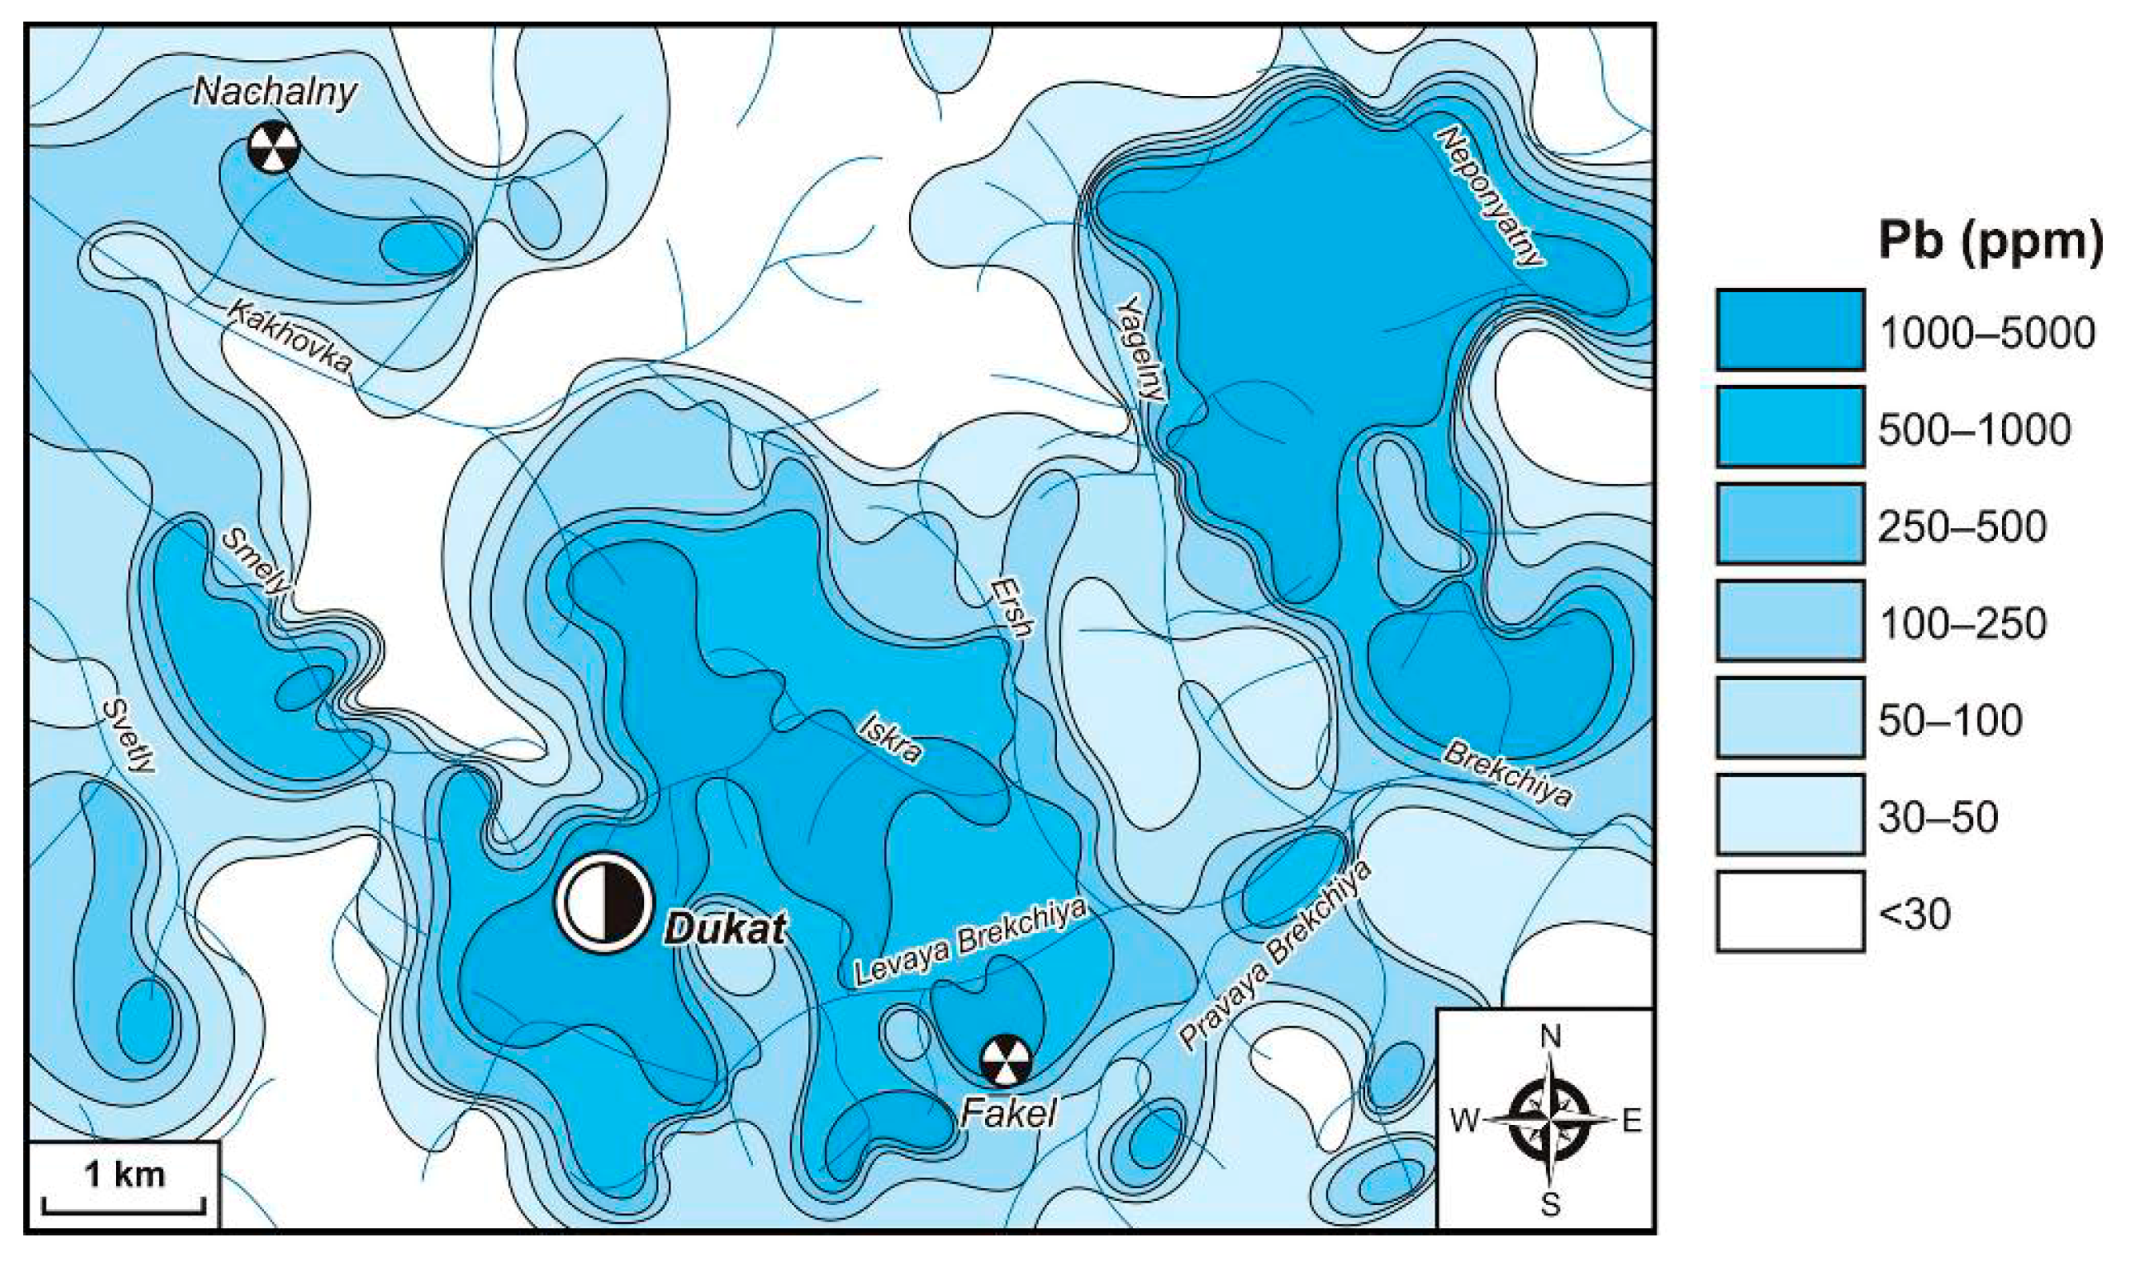
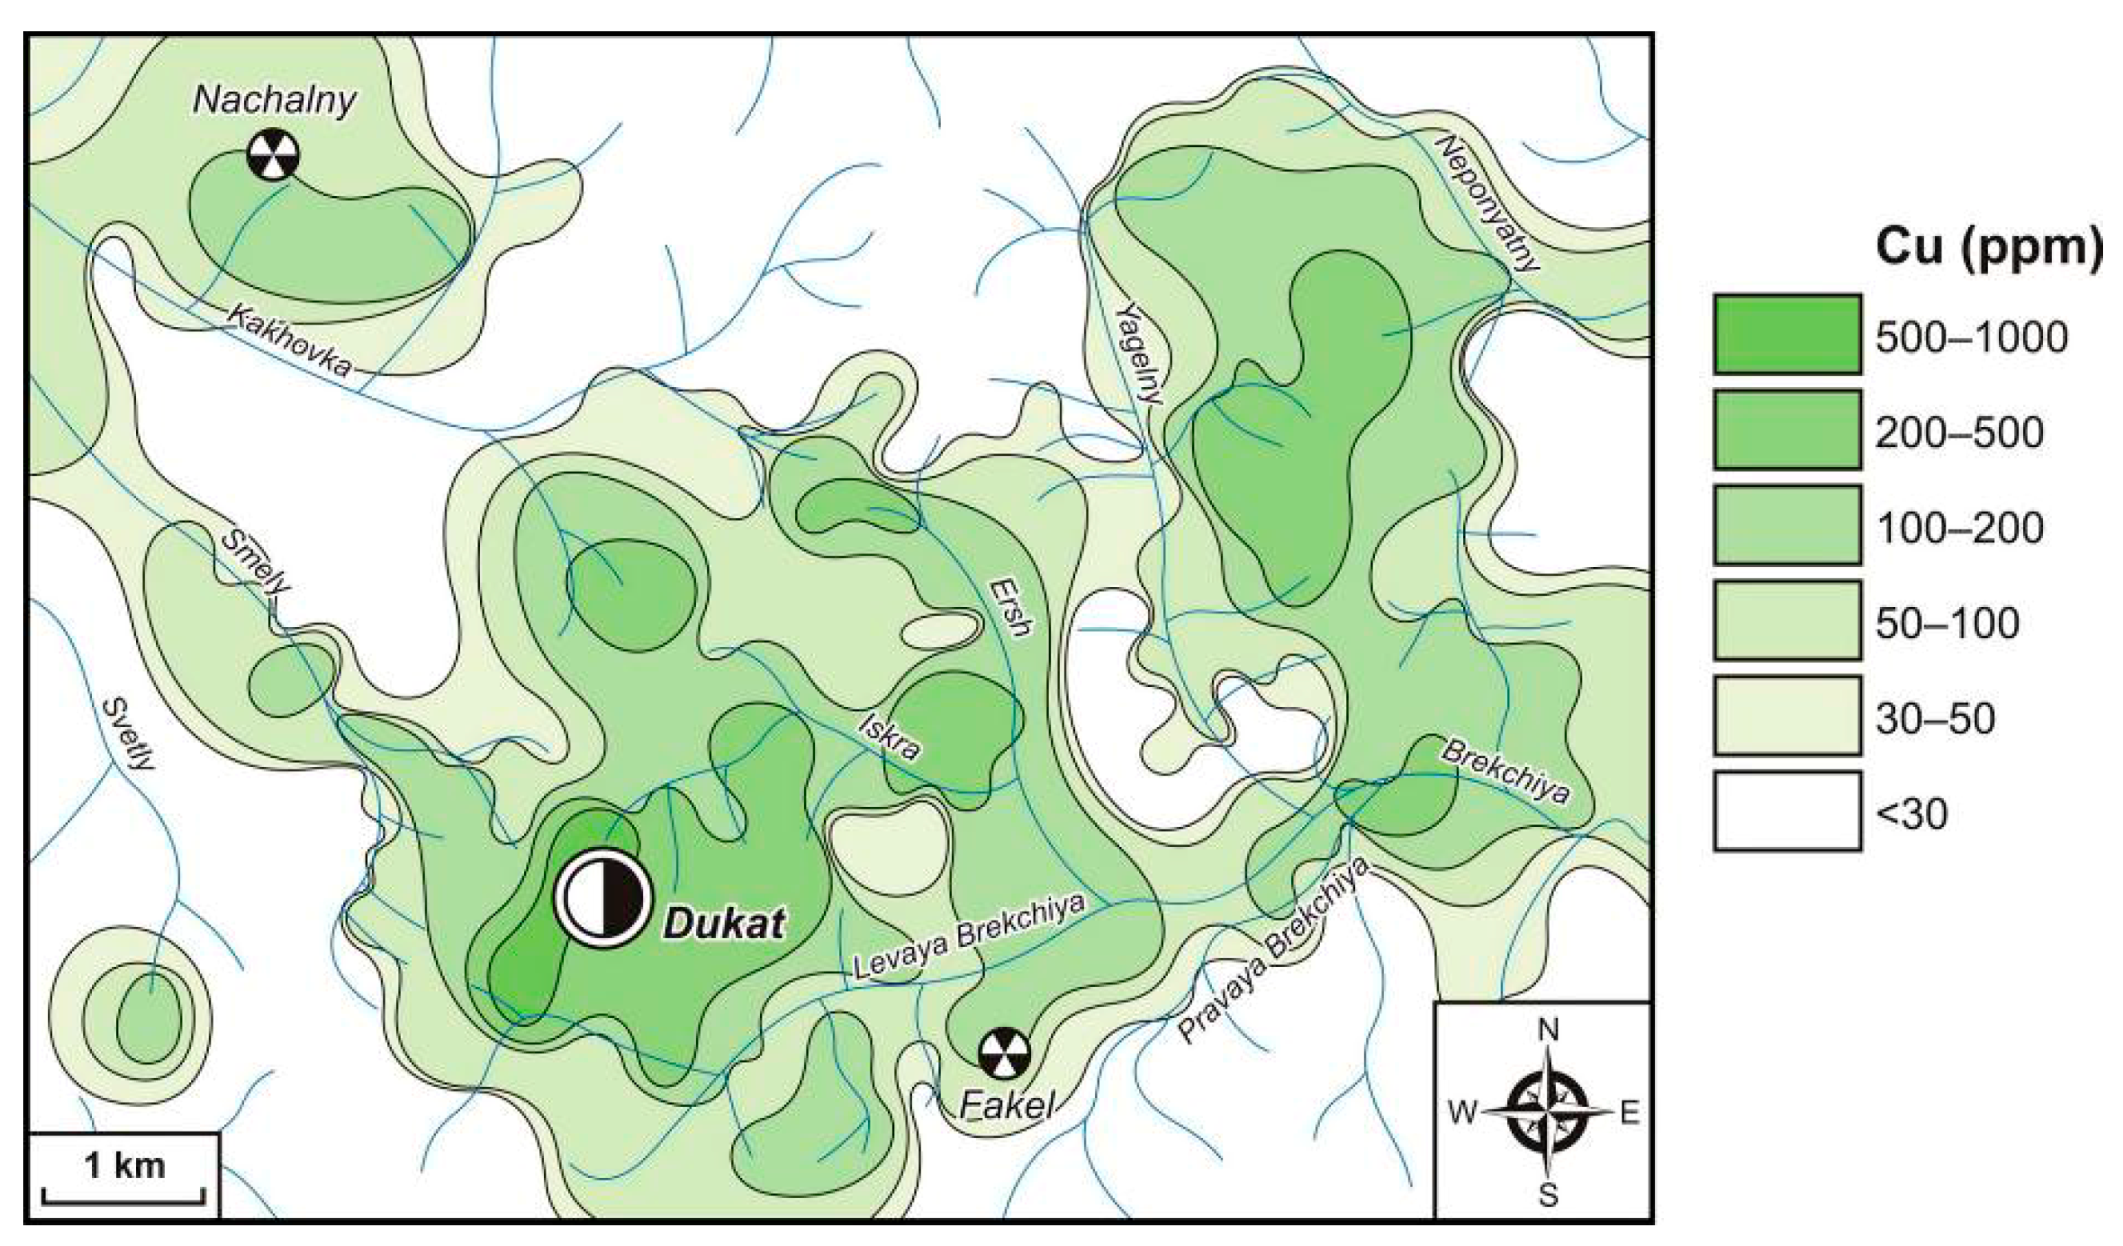
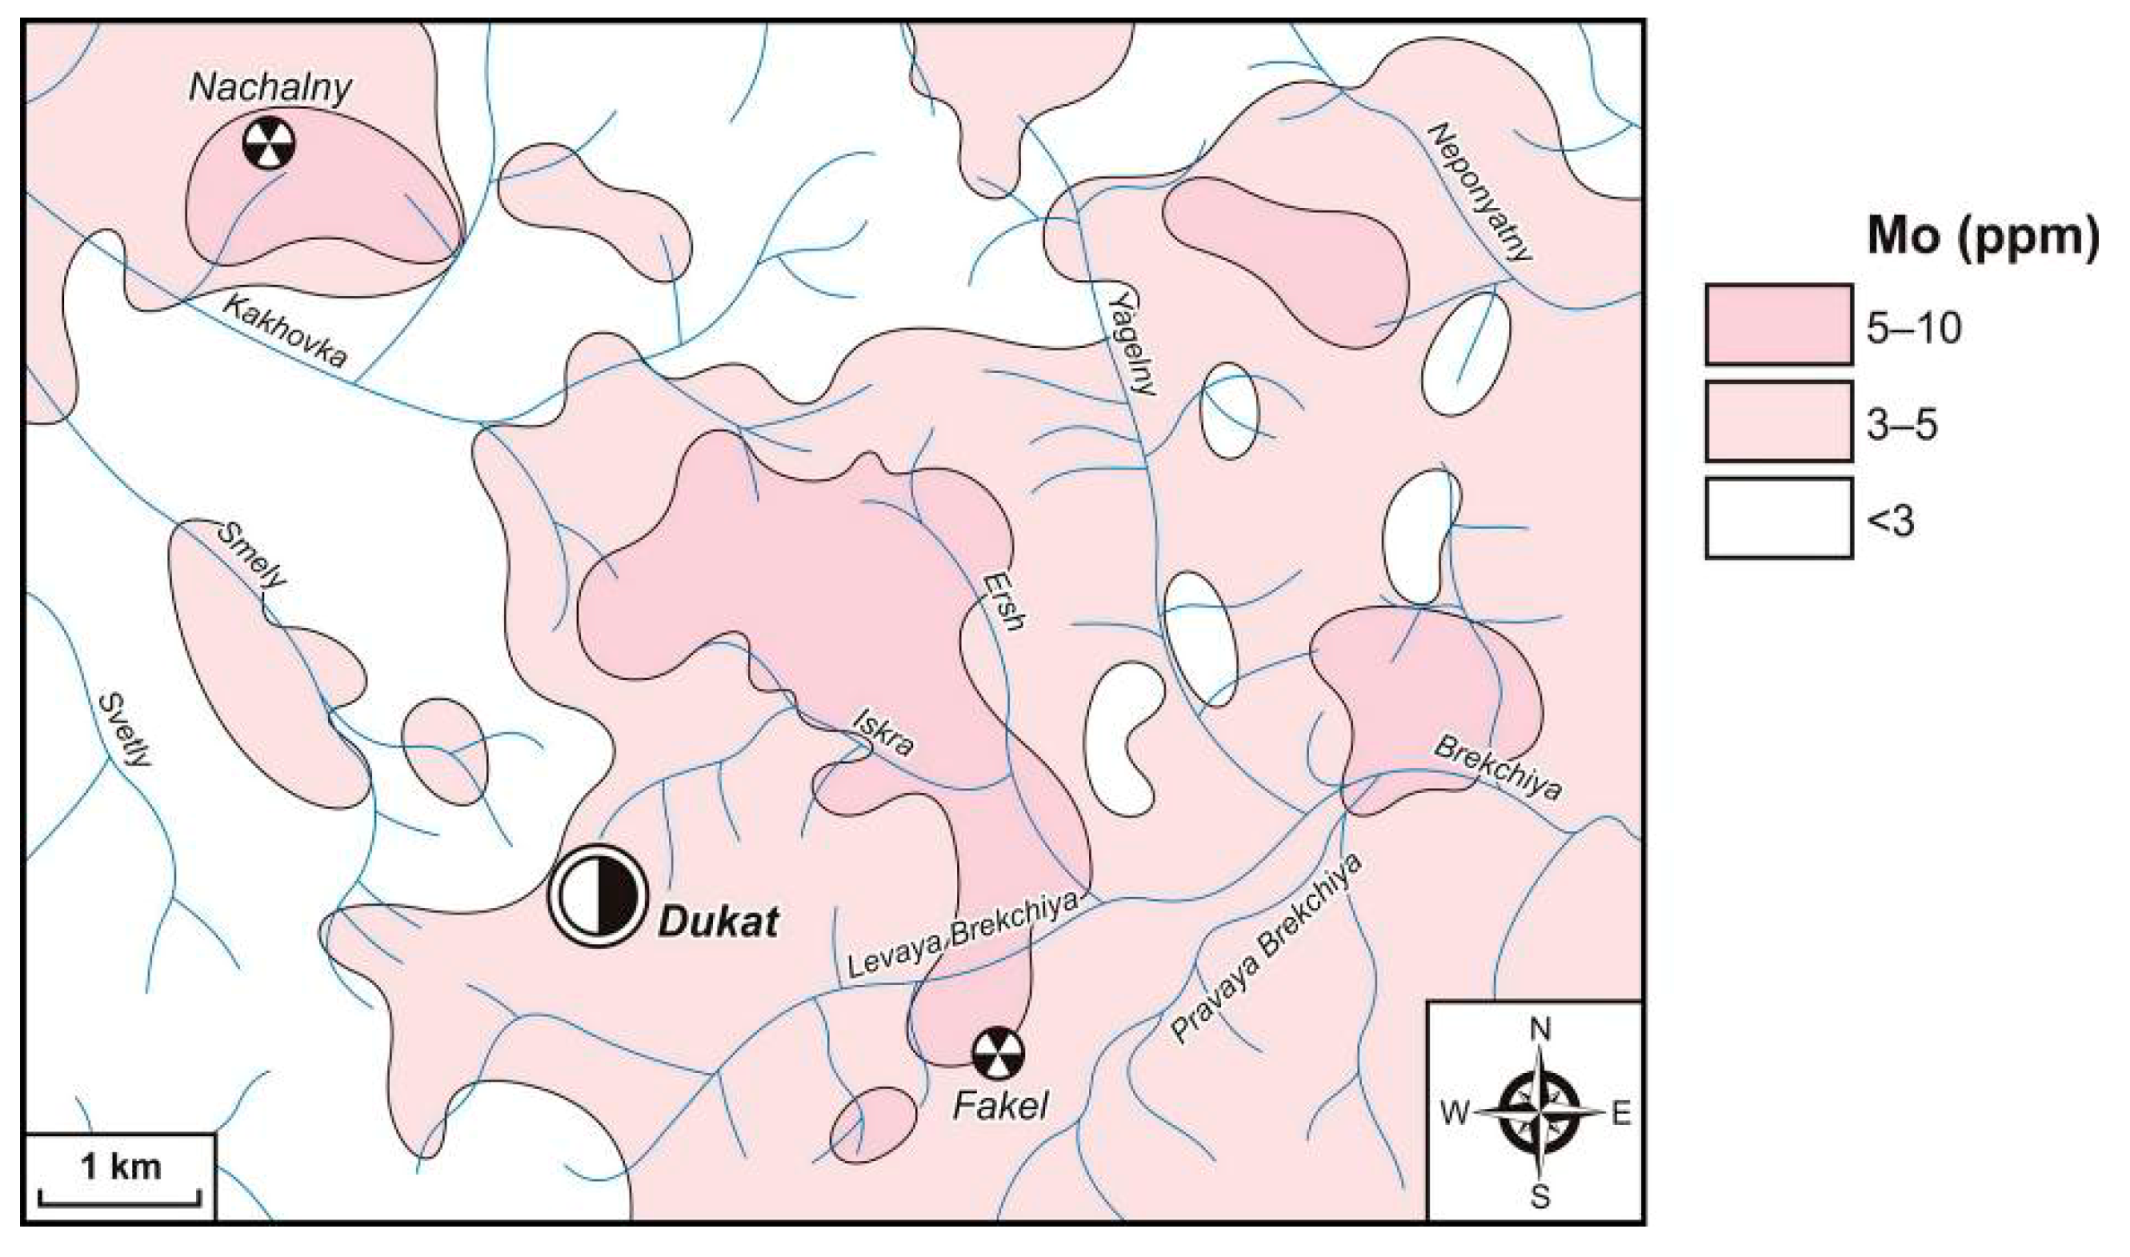
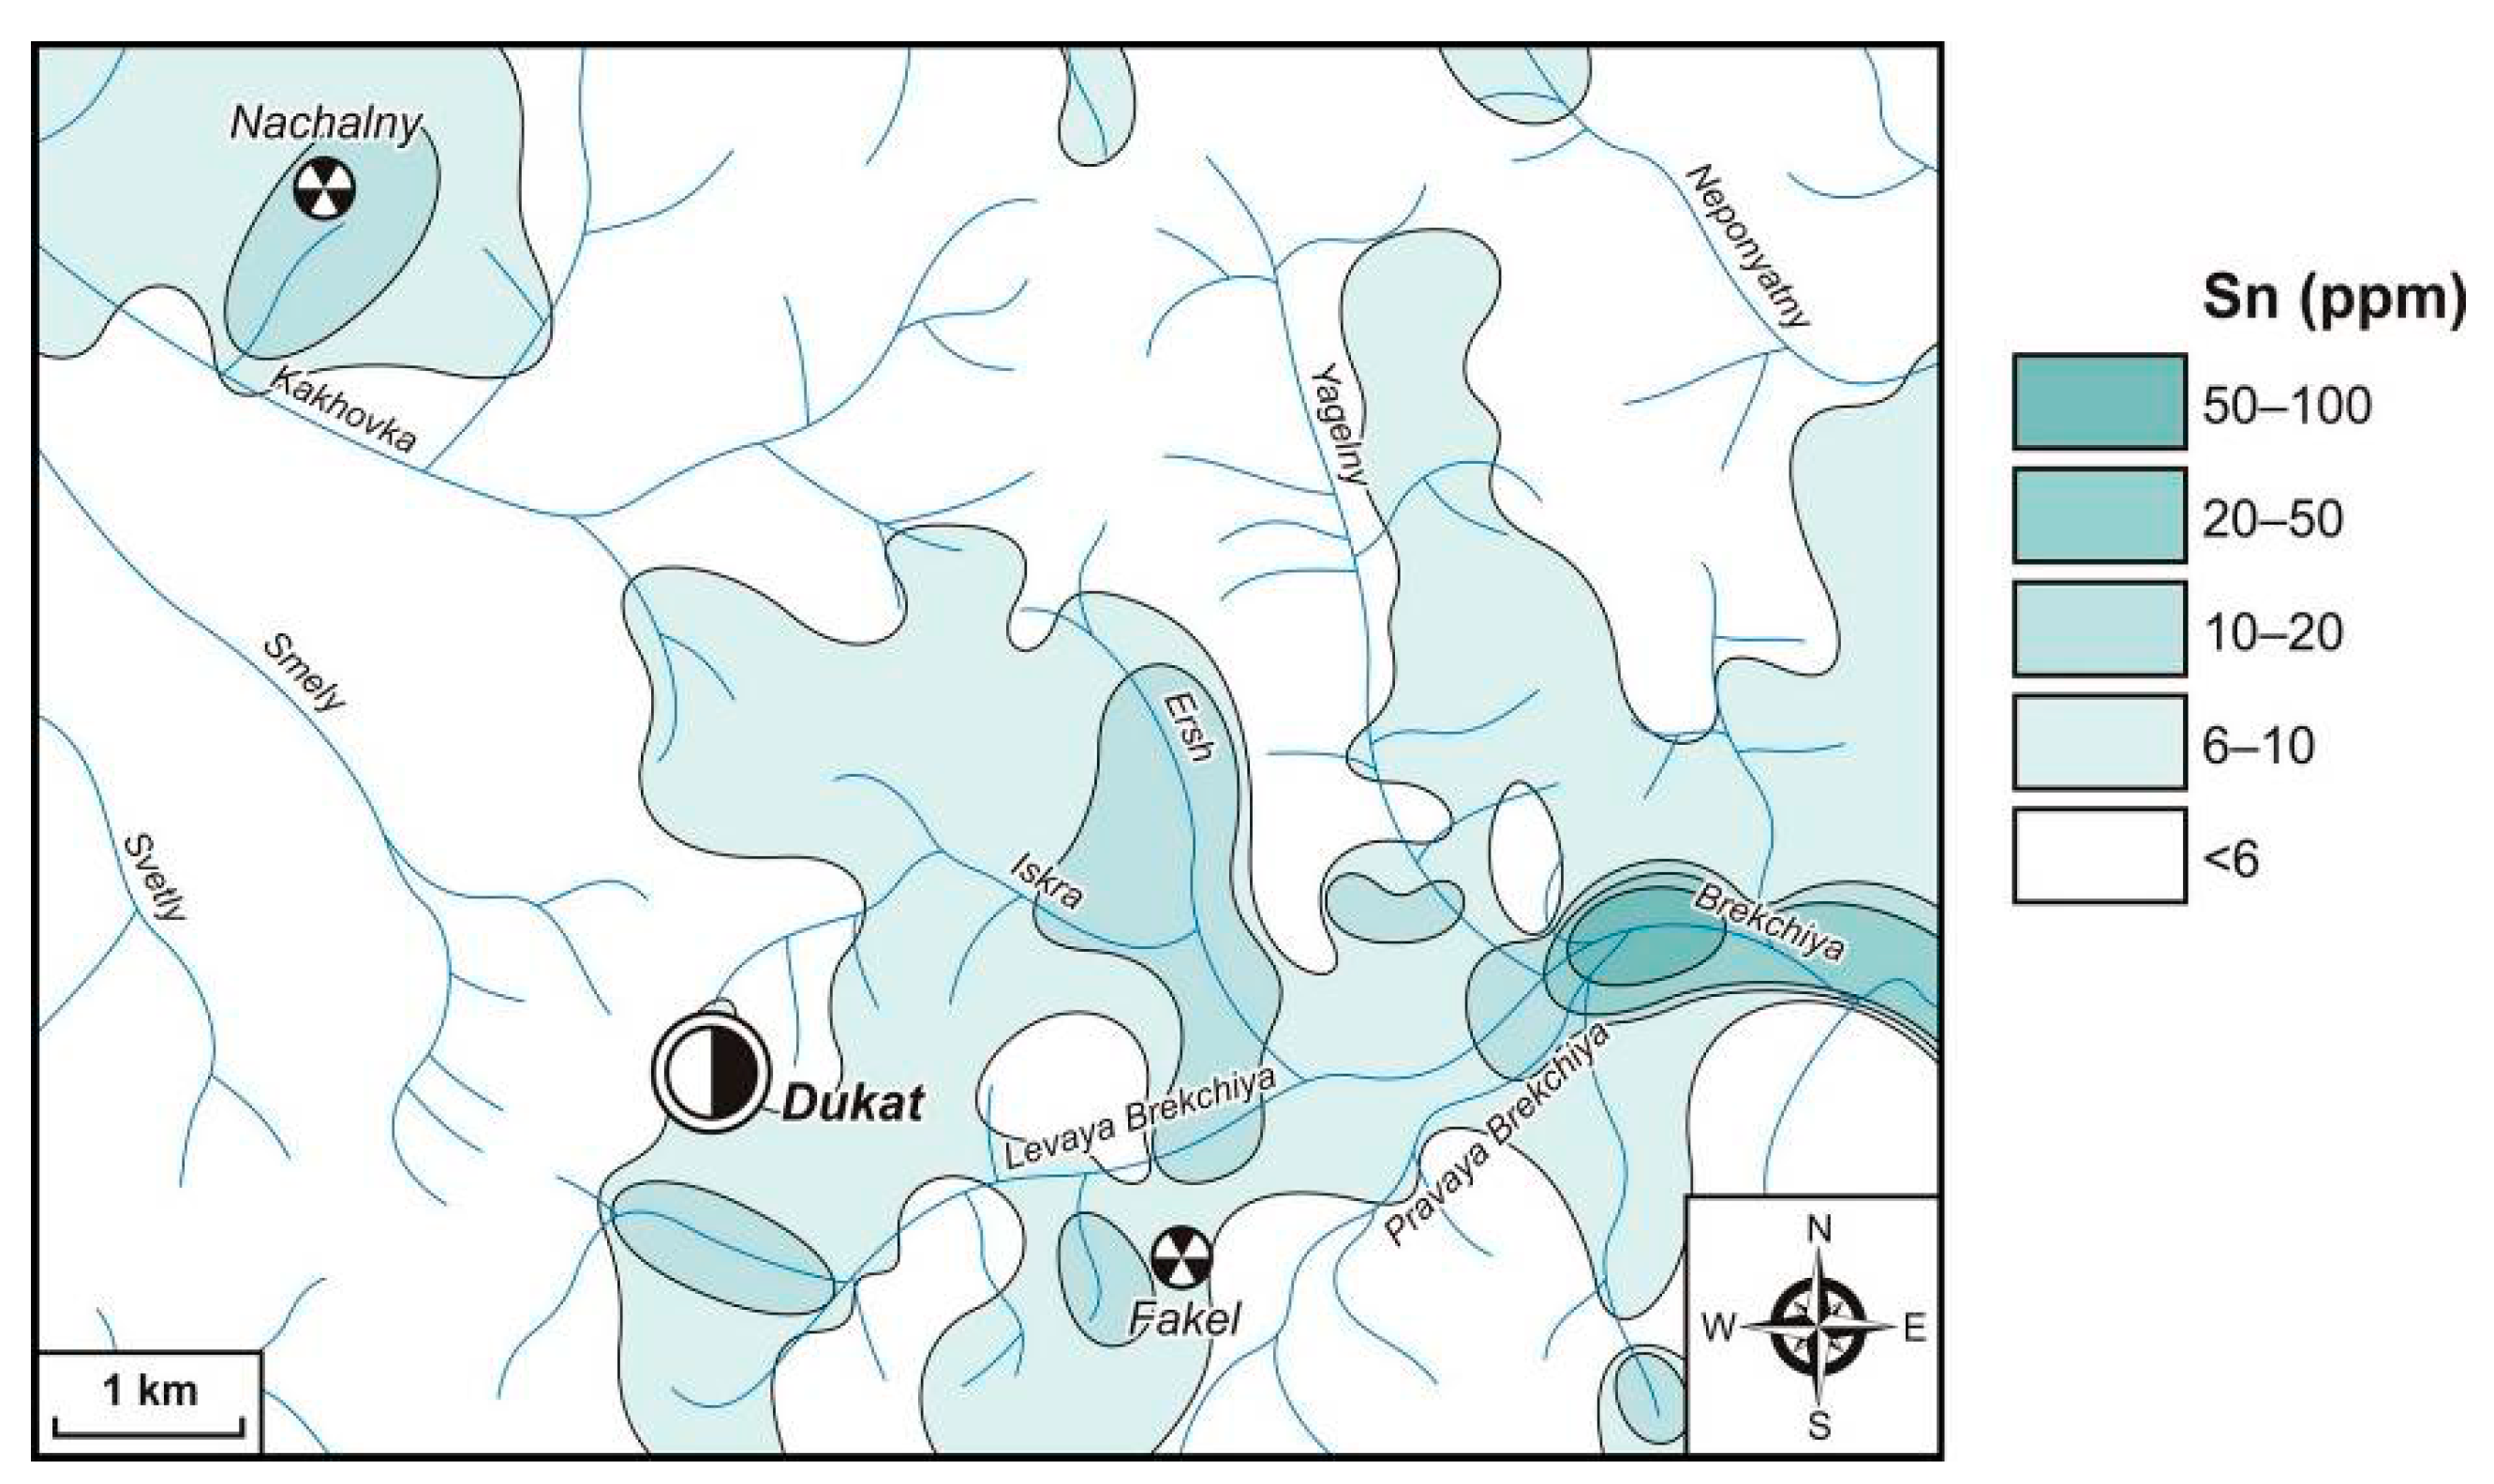
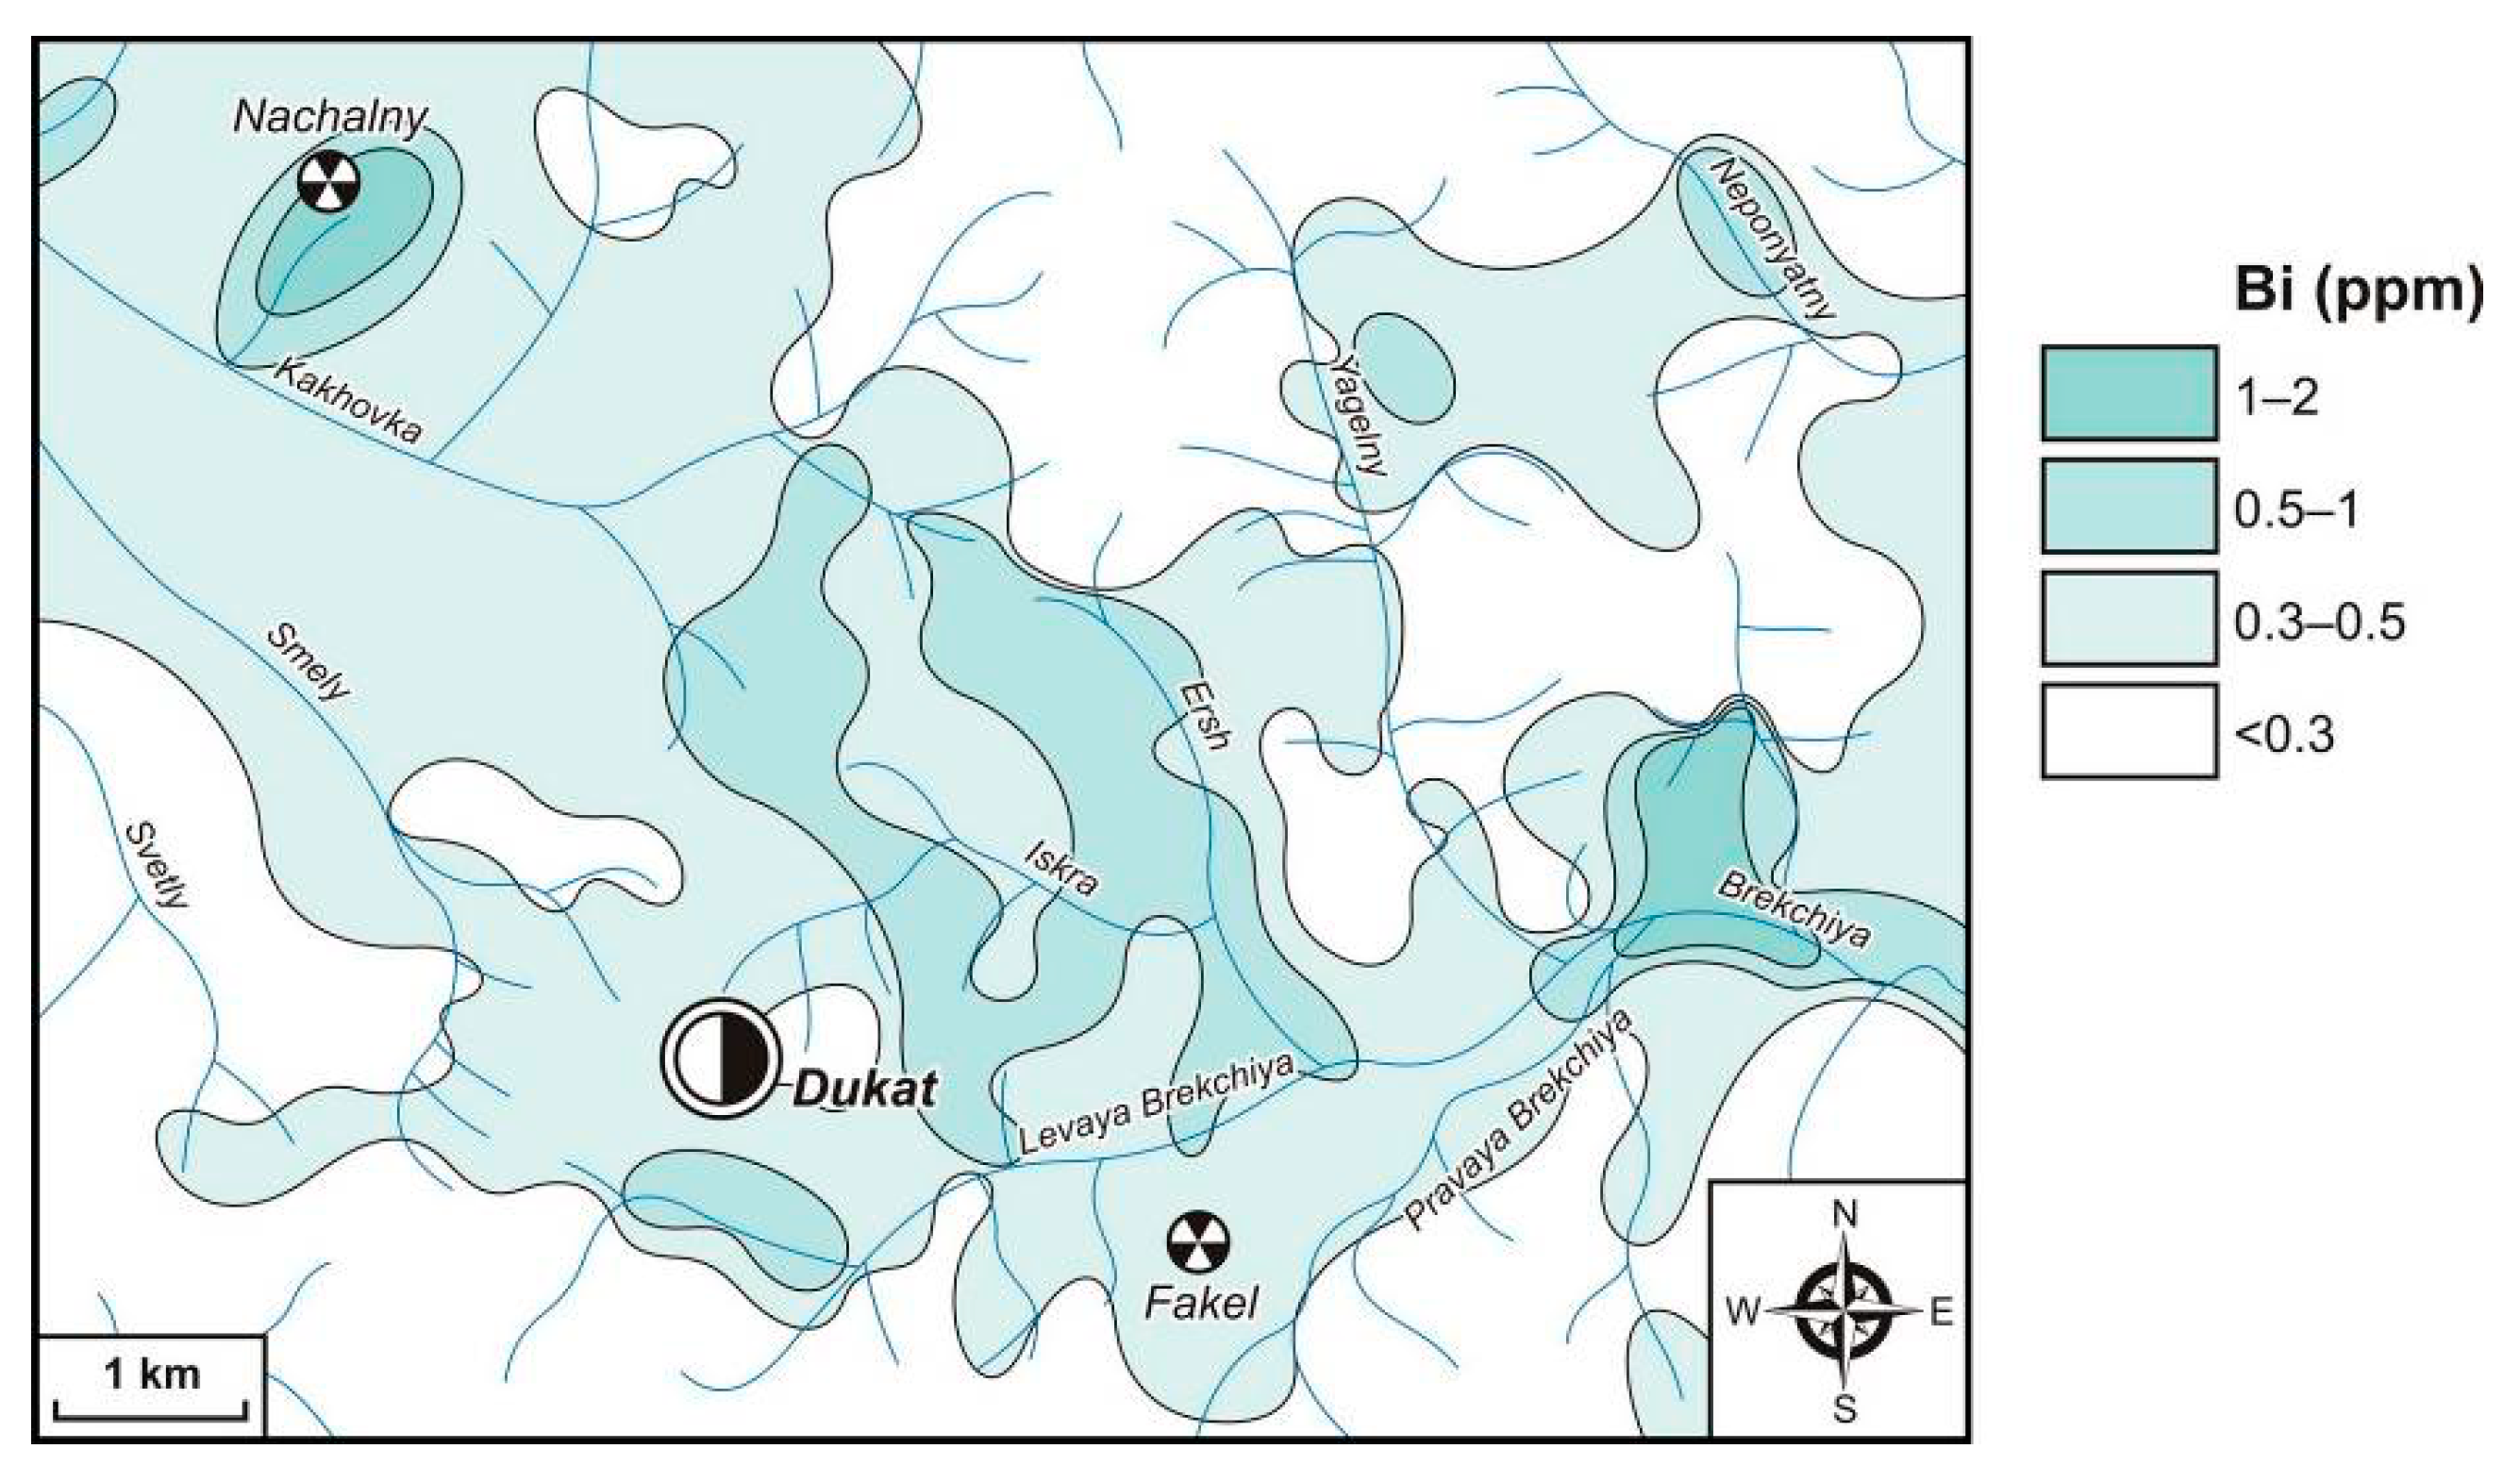
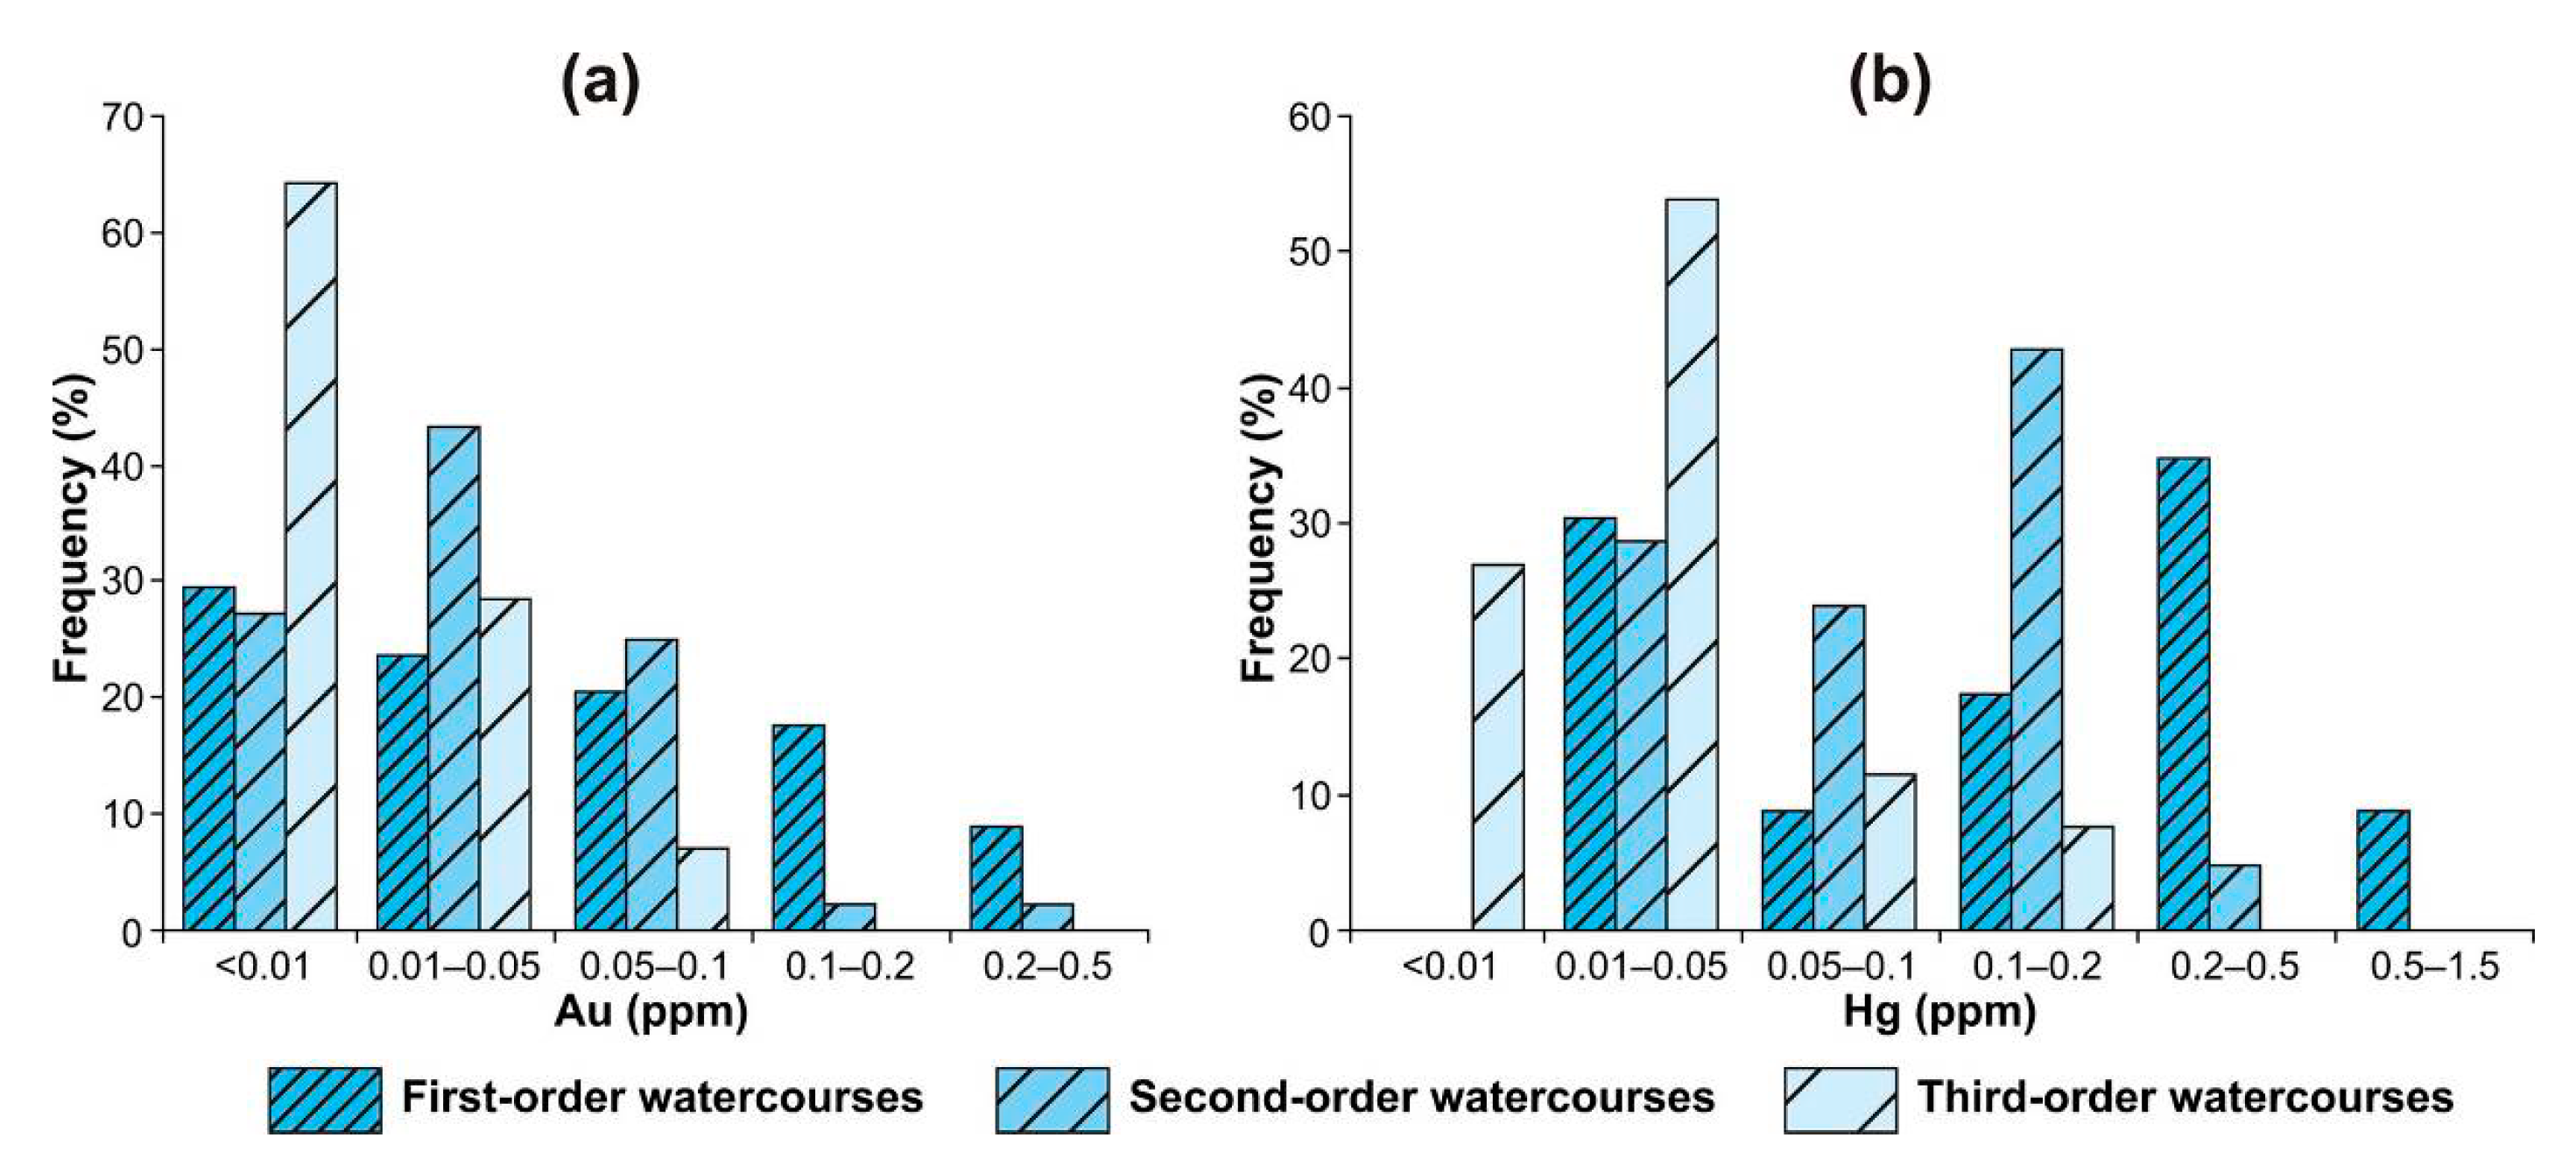
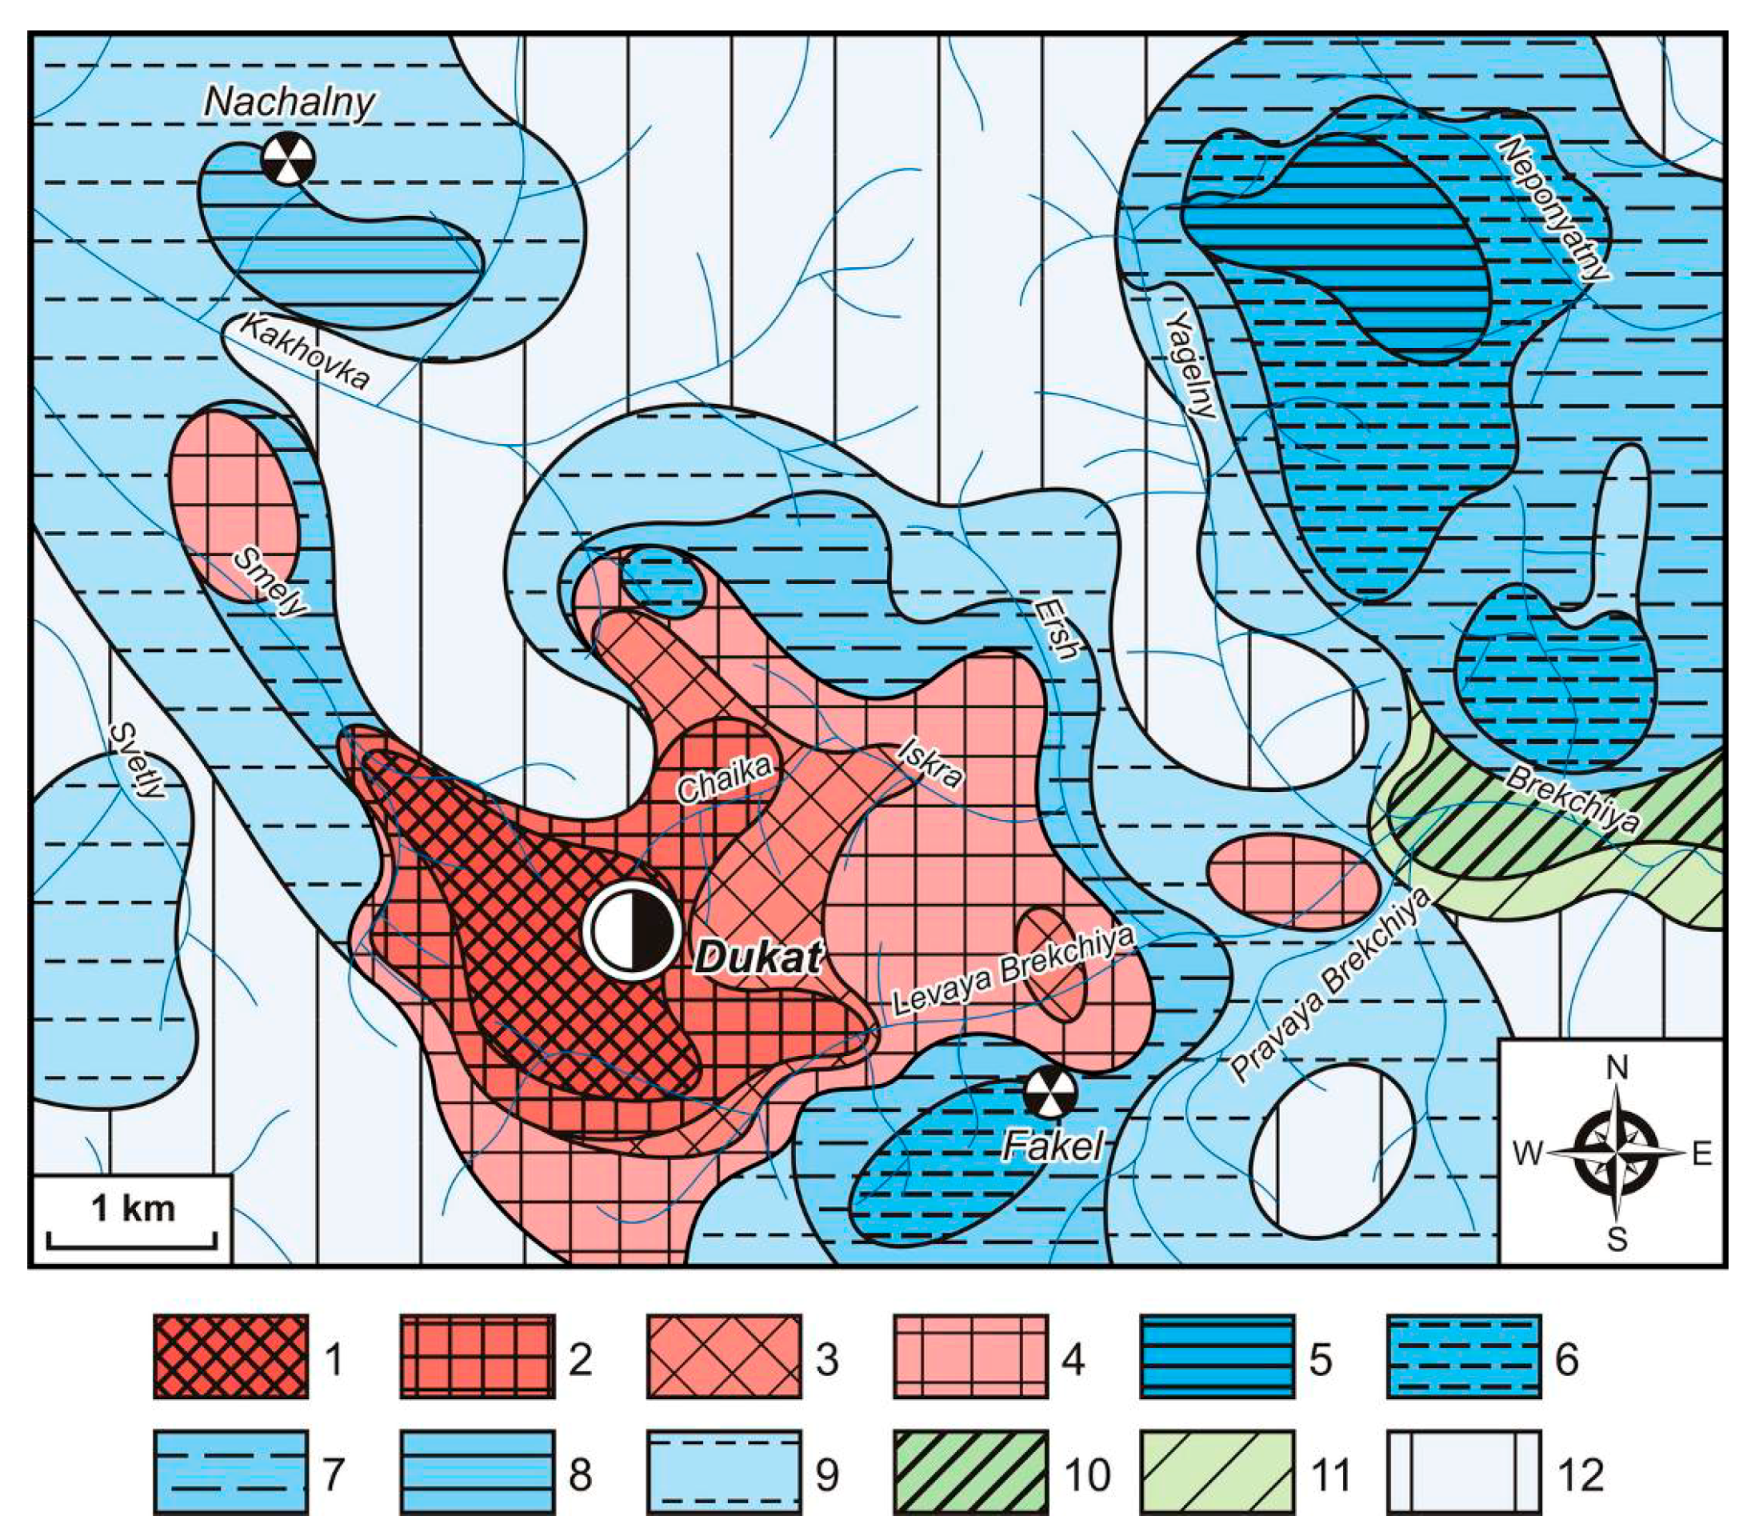
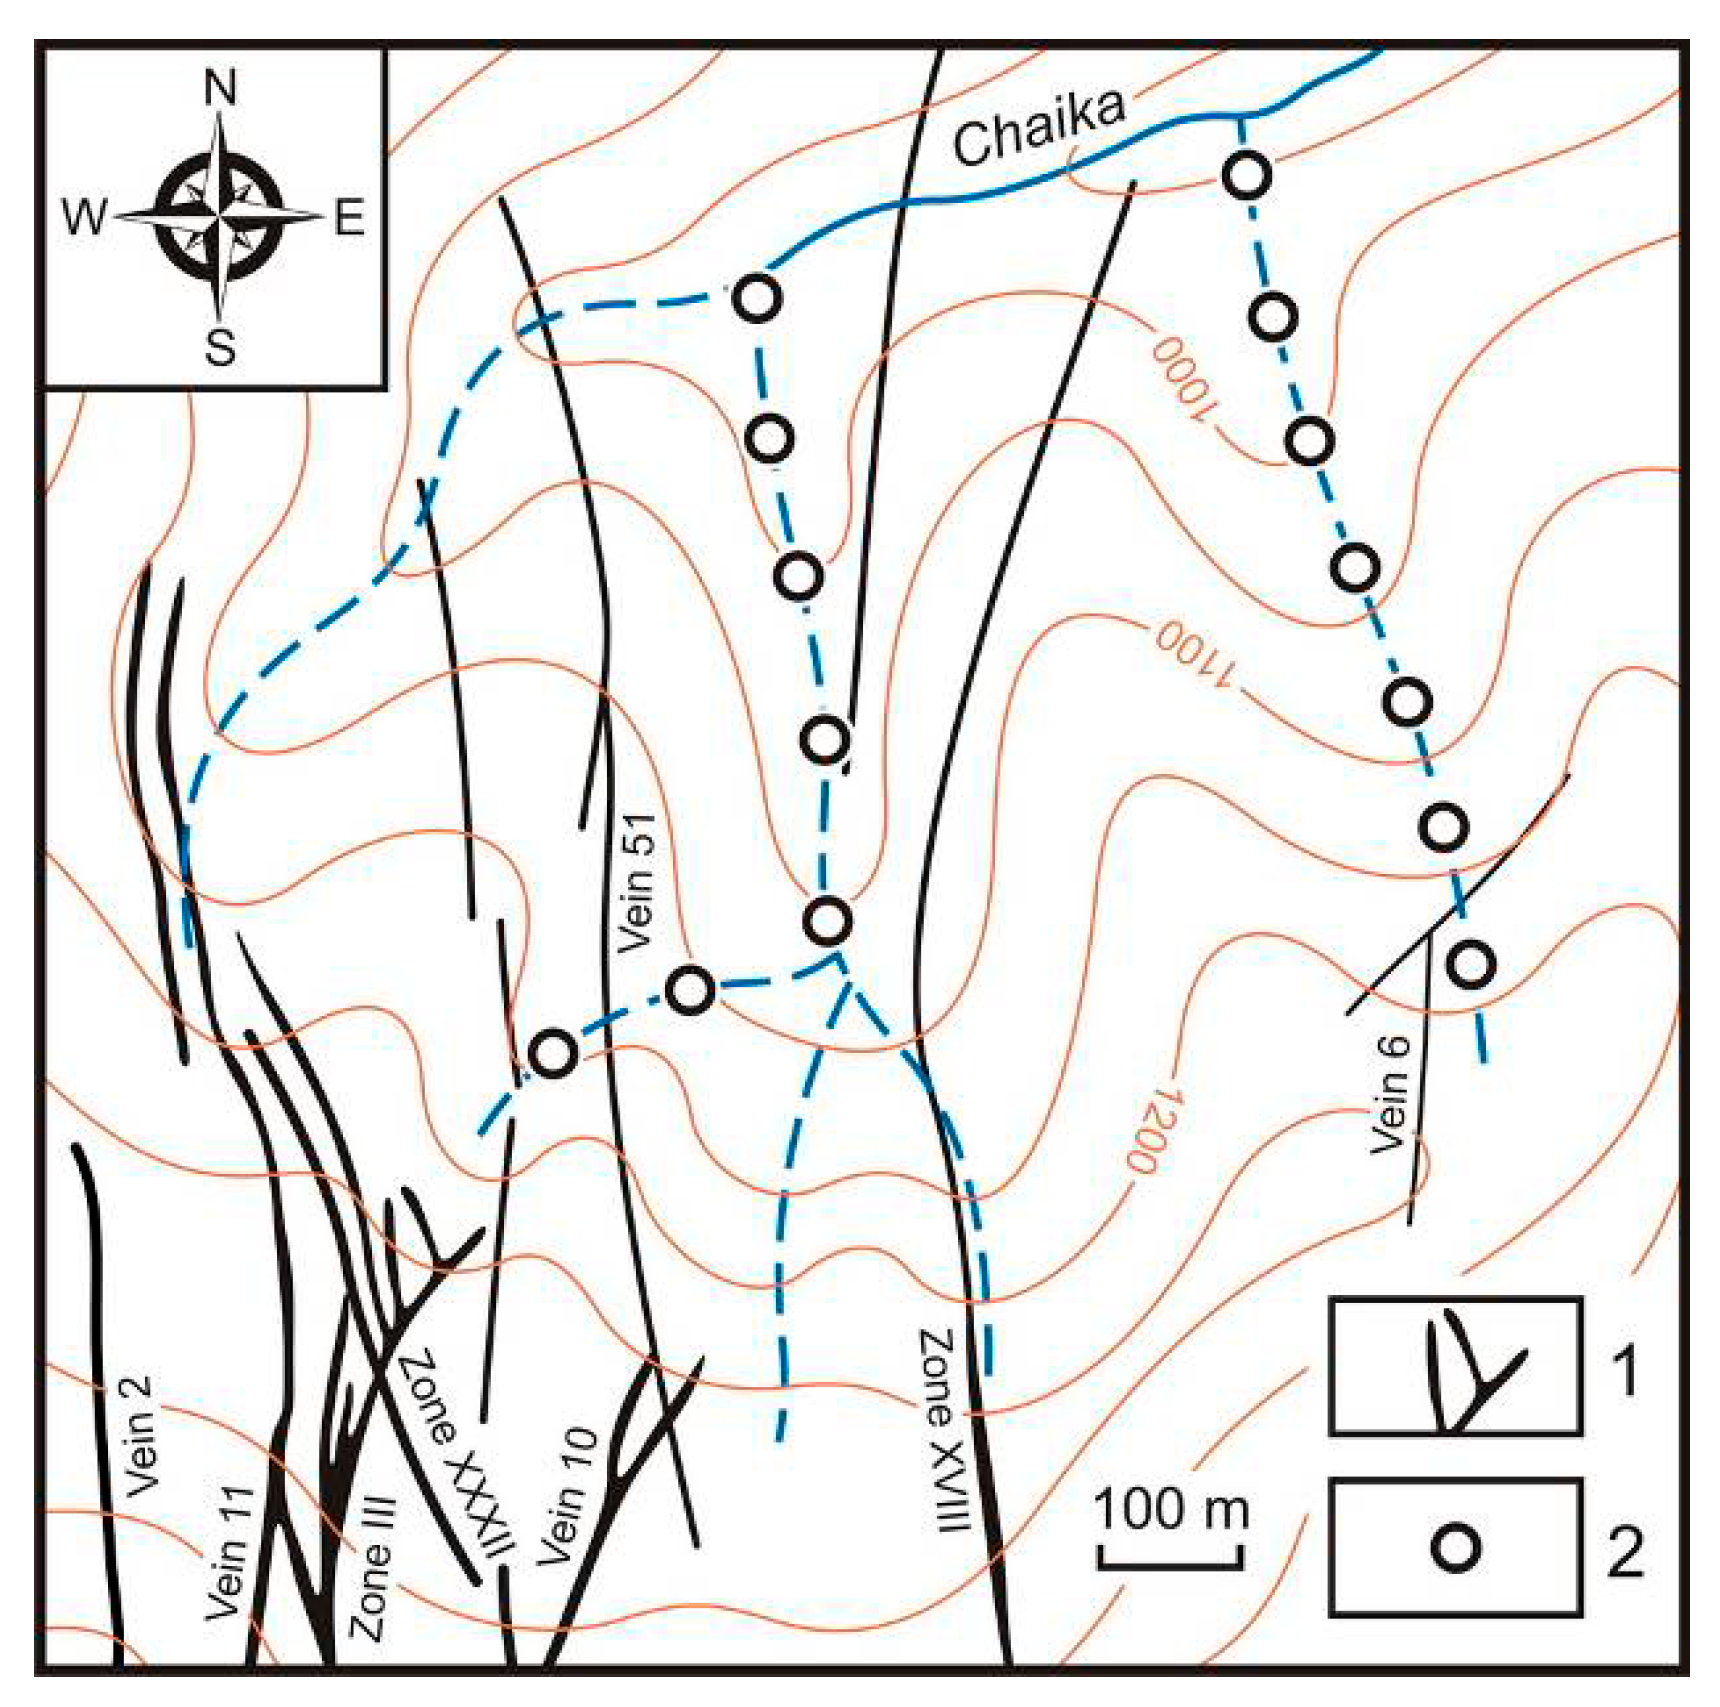
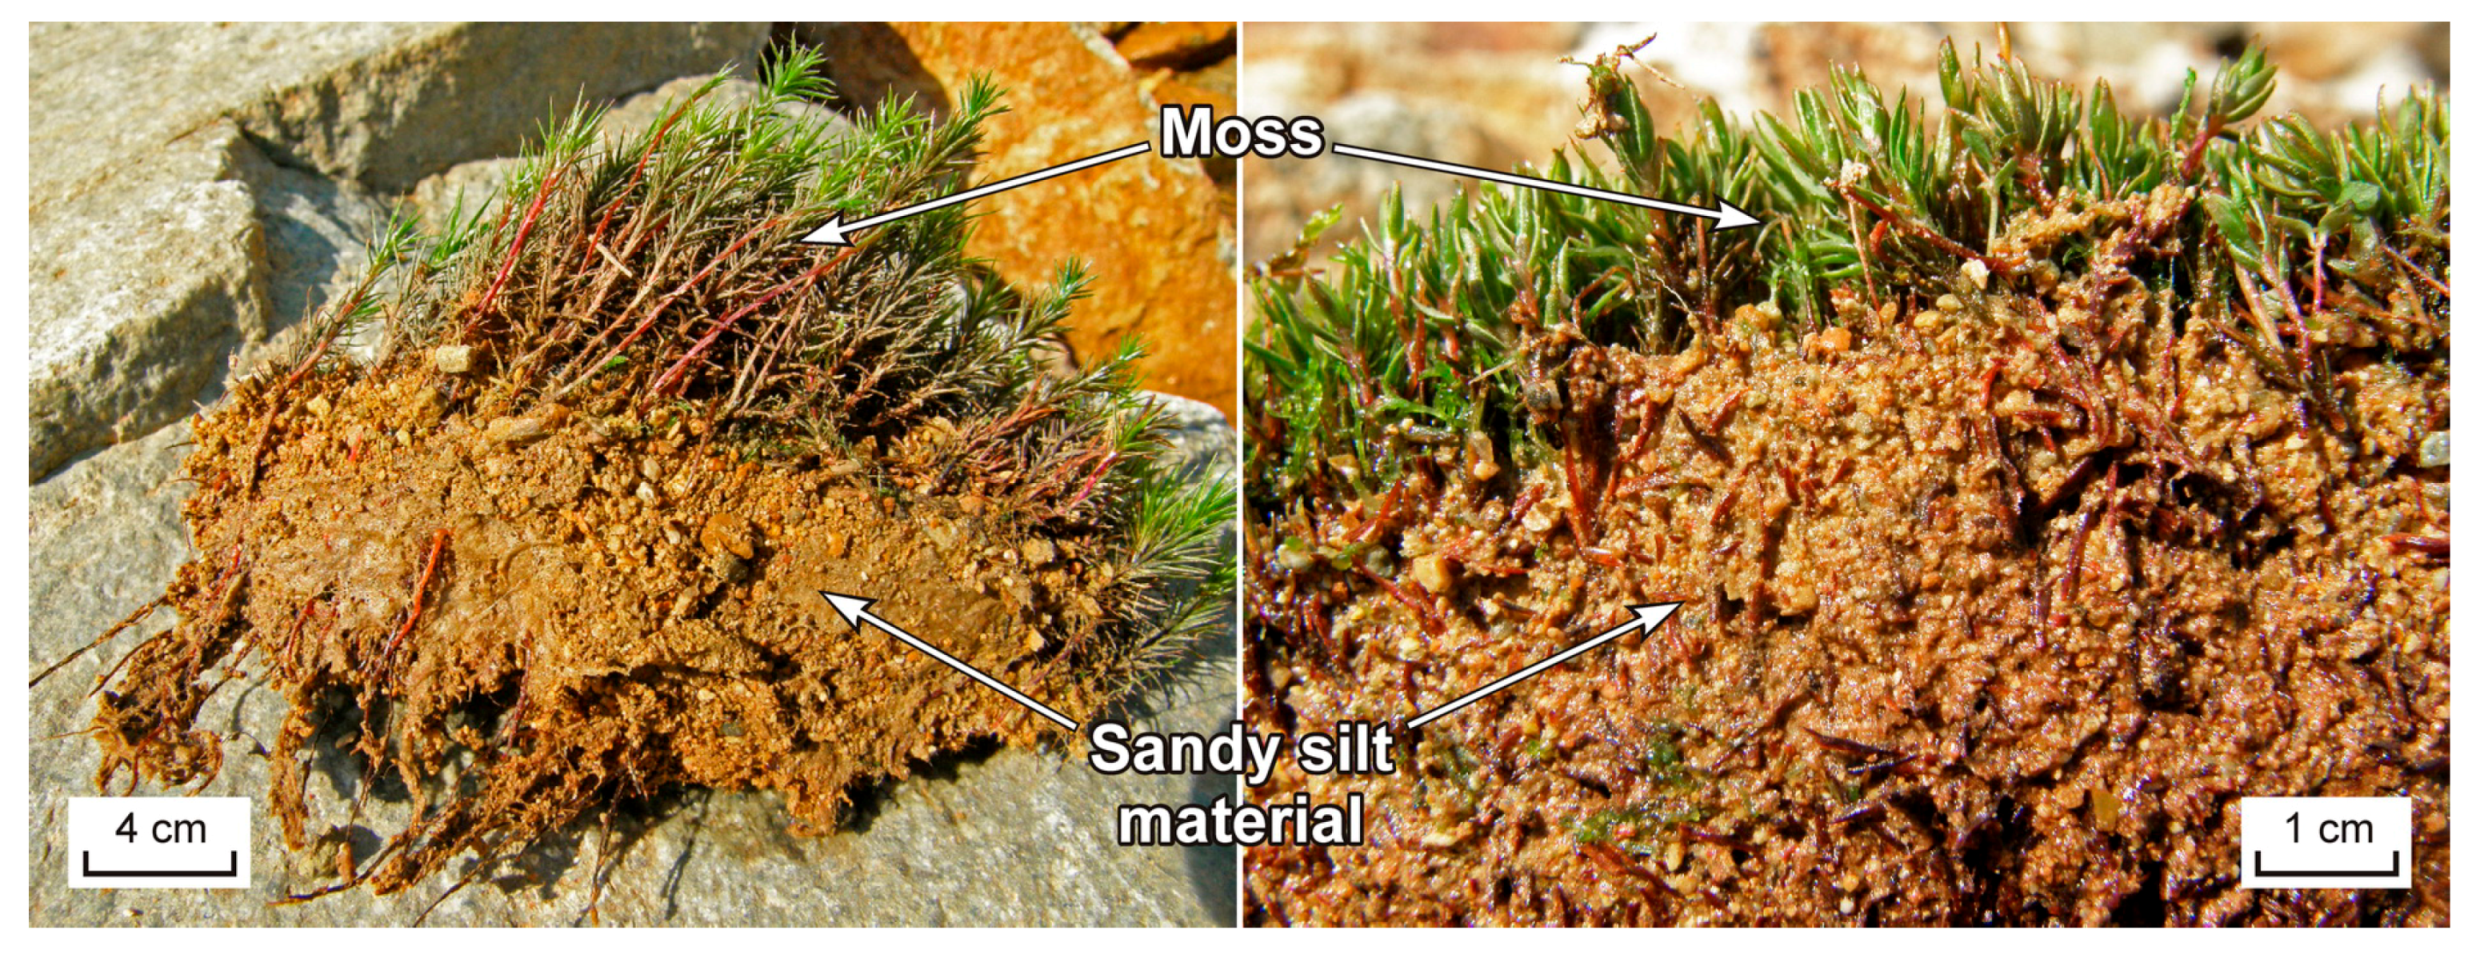
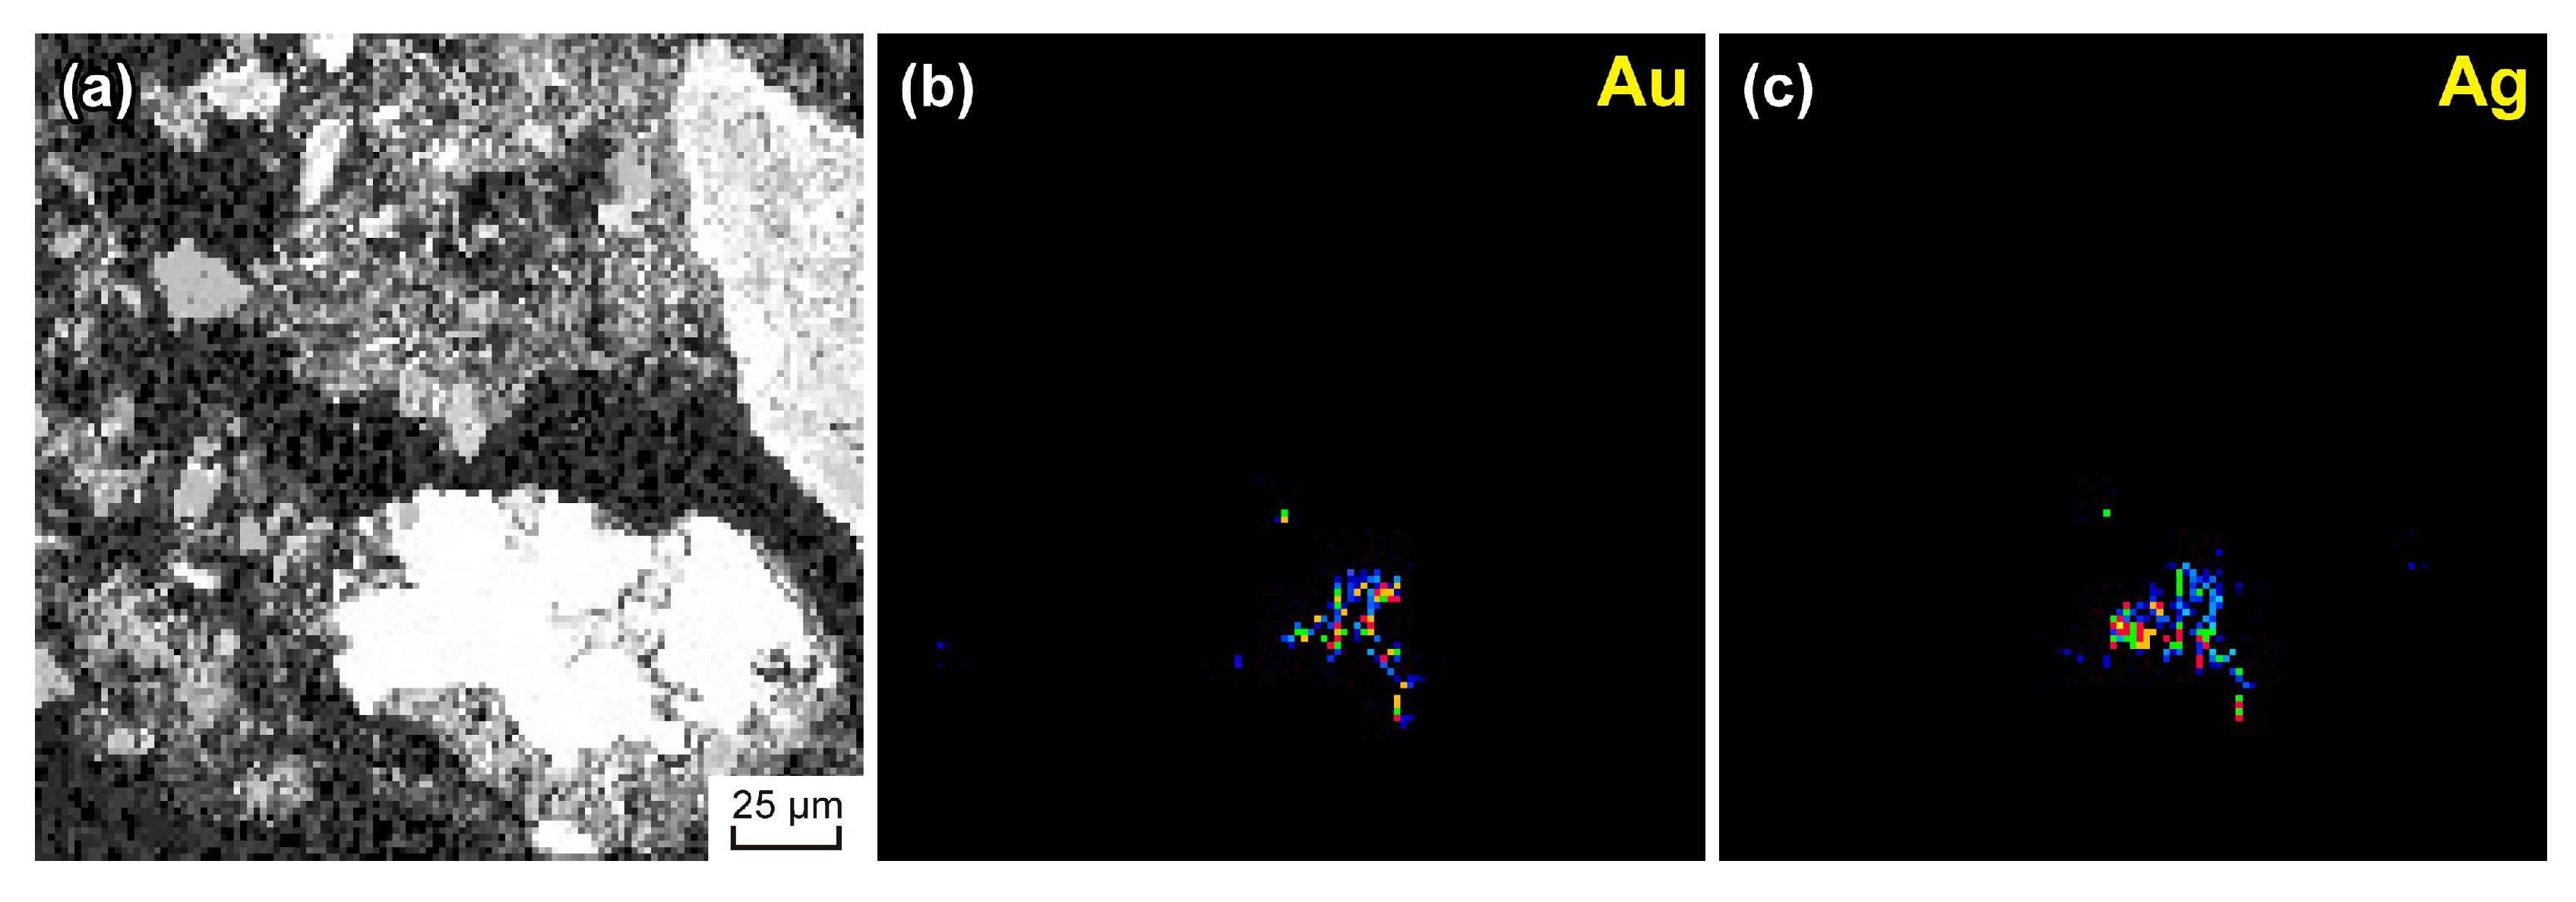
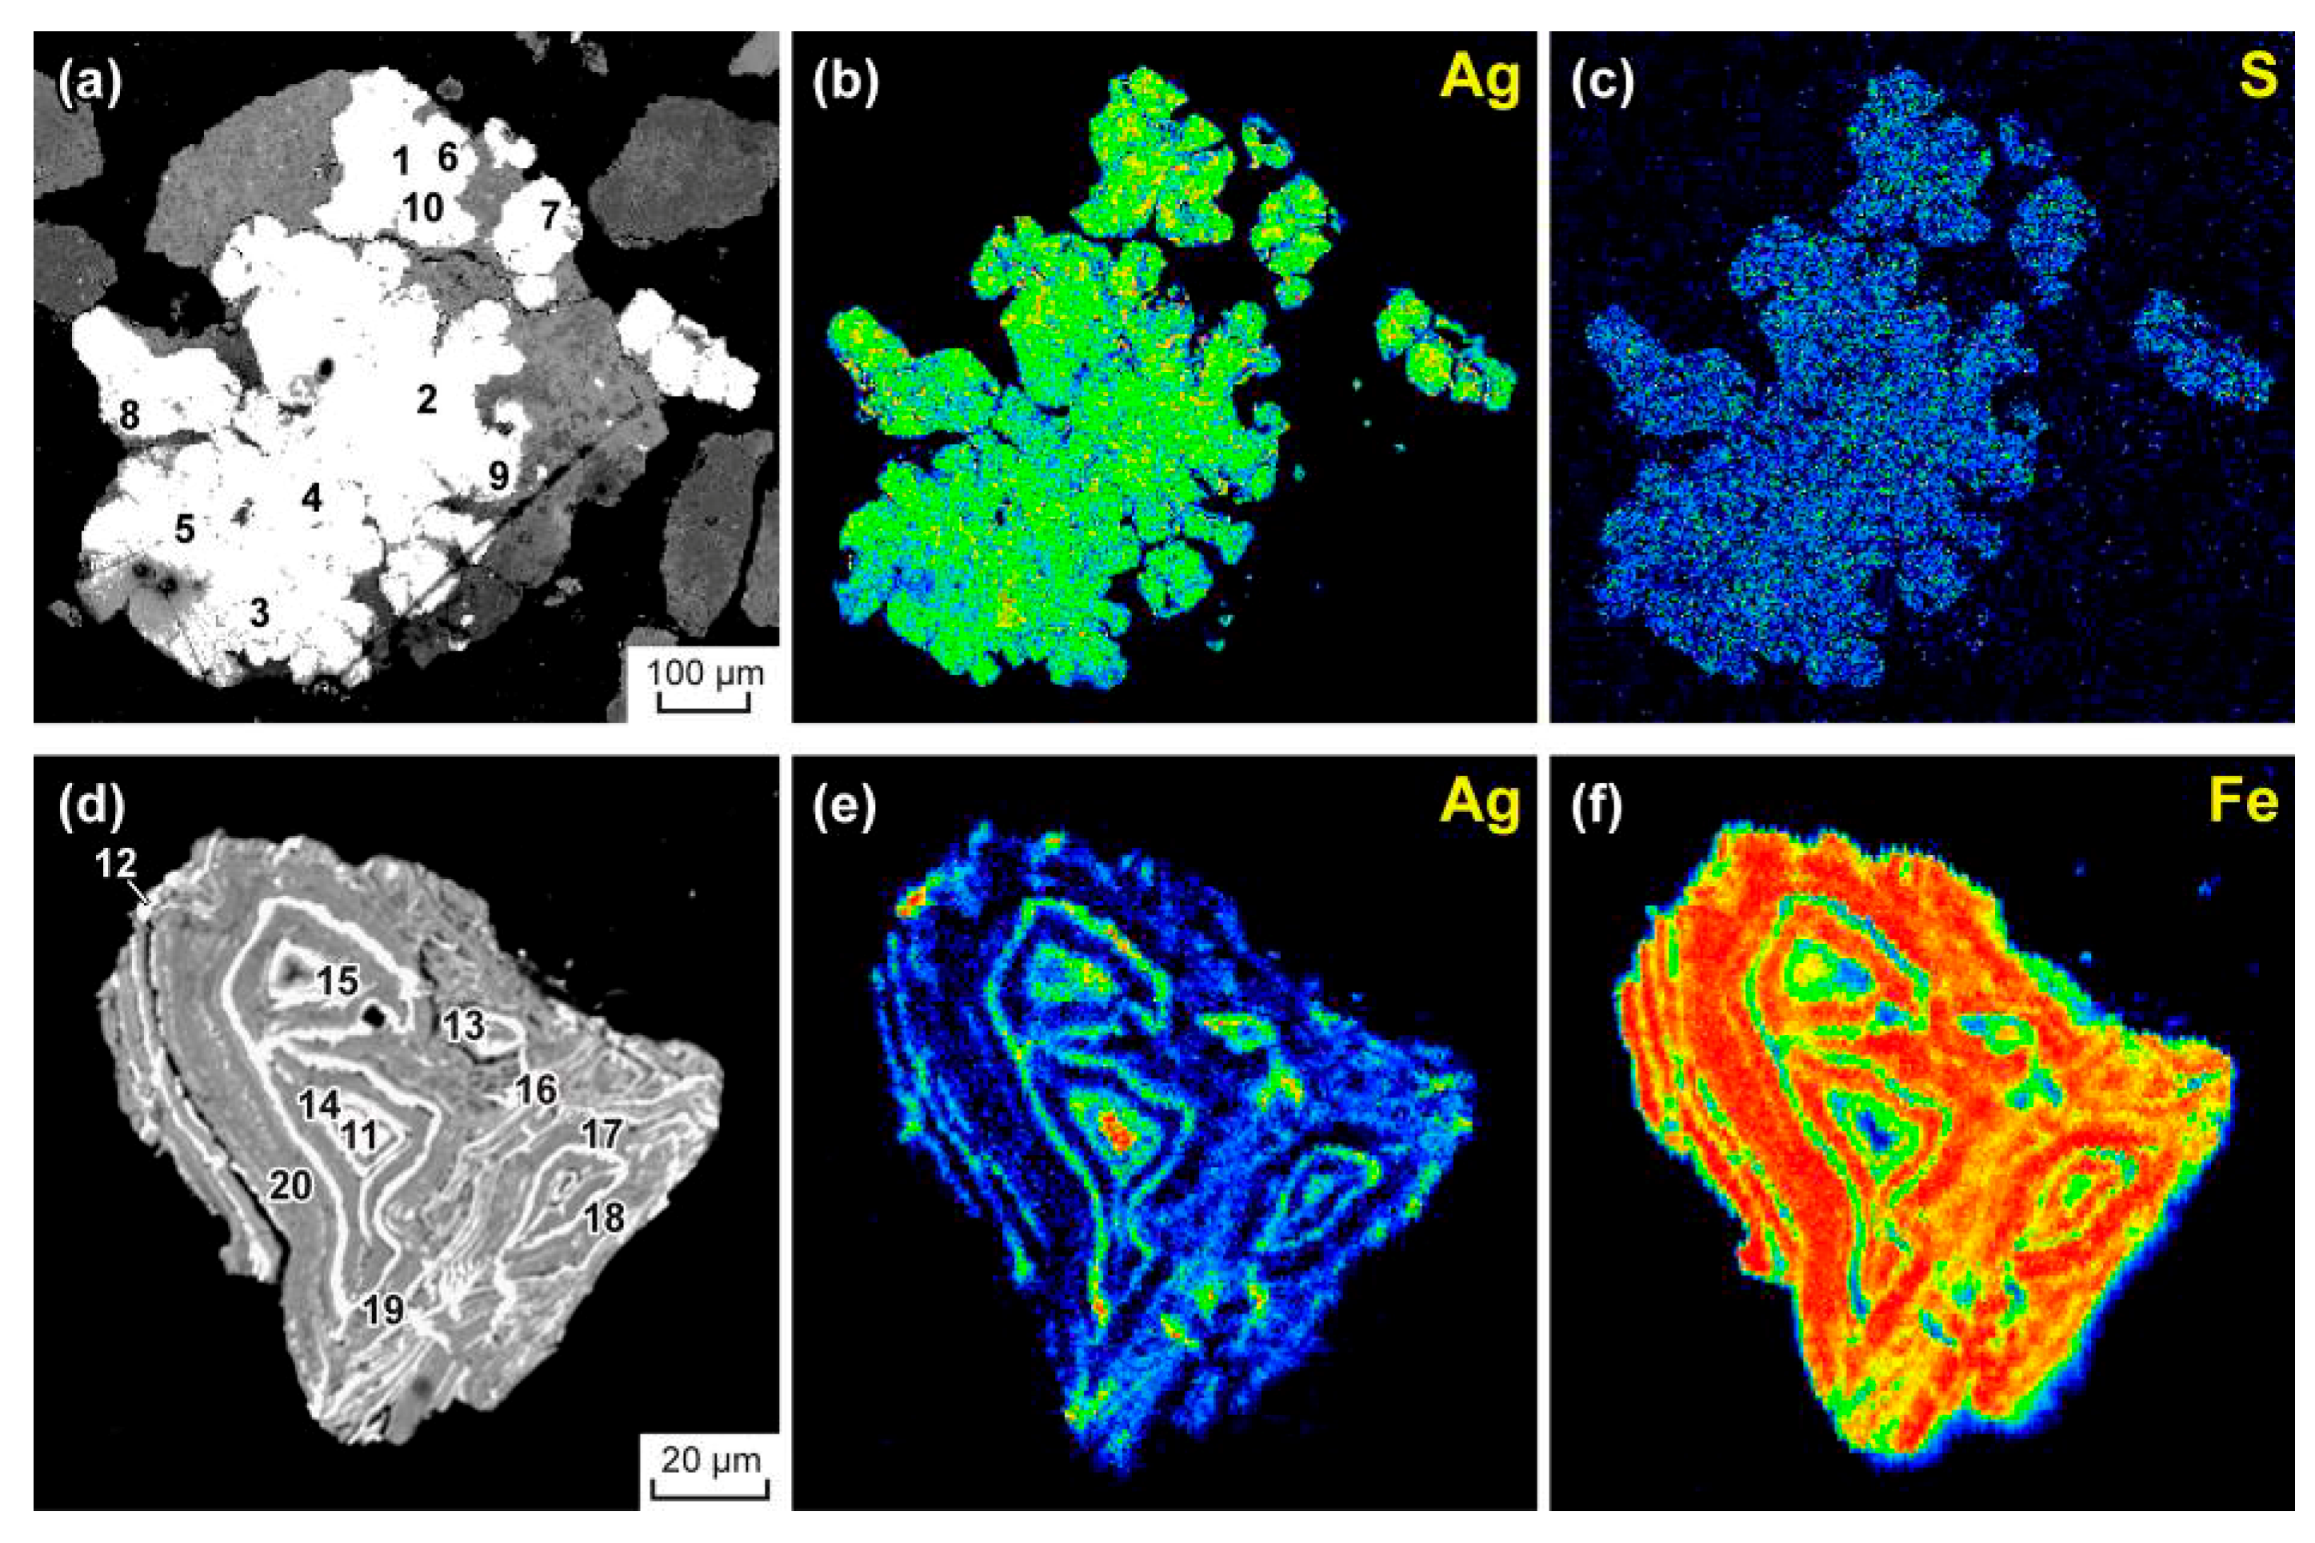
Table 1.
Average element contents (ppm).
| Element | Сb | In Average Rocks | In Acidic Rocks | In the Crust | ||
|---|---|---|---|---|---|---|
| 1 | 2 | 3 | 4 | 5 | 6 | |
| Au | 0.005 | - | 0.0045 | 0.0043 | 0.00n | 0.004 |
| Ag | 0.1 | 0.07 | 0.05 | 0.07 | 0.0n | 0.07 |
| Hg | 0.005 | - | 0.08 | 0.083 | 0.n | 0.08 |
| Sb | 0.2 | 0.2 | 0.26 | 0.5 | 0.n | 0.2 |
| As | 2 | 2.4 | 1.5 | 1.7 | n | 1.8 |
| Pb | 10 | 15 | 20 | 16 | 20 | 12.5 |
| Zn | 50 | 72 | 60 | 83 | 40 | 70 |
| Cu | 10 | 35 | 20 | 47 | 100 | 55 |
| Mo | 1 | 0.9 | 1 | 1.1 | n | 1.5 |
| W | 2 | 1 | 1.5 | 1.3 | 50 | 1.5 |
| Sn | 2 | - | 3 | 2.5 | n | 2 |
| Bi | 0.1 | 0.01 | 0.01 | 0.009 | 0.0n | 0.17 |
Table 2.
The Dukat Au–Ag OFS and associated areas. Geochemical associations of ore elements (survey of LSSs on the 1:200,000 scale).
Table 2.
The Dukat Au–Ag OFS and associated areas. Geochemical associations of ore elements (survey of LSSs on the 1:200,000 scale).
| No. | Associations of Ore Elements |
|---|---|
| Predominantly Ag | |
| 1 | Ag(20/200) Pb(590/59) As(30/15) Bi(1.4/14) Zn(650/13) Cu(60/6) Sn(12/6) Au(0.01/2) |
| 2 | Ag(8.6/86) Pb(260/26) As(40/20) Bi(1.1/11) Zn(350/7) Sn(10/5) Cu(40/4) |
| Ag–Pb | |
| 3 | Pb(850/85) As(110/55) Ag(3.0/30) Zn(800/16) Bi(1.5/15) Sn(14/7) Cu(50/5) |
| 4 | As(150/75) Pb(450/45) Bi(3.5/35) Zn(600/12) Ag(1.0/10) Sn(18/9) Cu(40/4) |
| 5 | As(130/65) Bi(3.5/35) Pb(300/30) Zn(450/9) Ag(0.8/8) Sn(10/5) Cu(30/3) |
| Sn–Ag | |
| 6 | As(190/95) Bi(6.3/63) Sn(44/22) Pb(180/18) Ag(1.7/17) Zn(500/10) Cu(70/7) |
| 7 | As(110/55) Bi(3.3/33) Sn(20/10) Pb(100/10) Zn(400/8) Ag(0.6/6) Cu(40/4) |
| Mo–W and Sn–W | |
| 8 | Bi(5.2/52) As(90/45) W(60/30) Mo(20/20) Sn(36/18) Pb(70/7) Zn(300/6) Cu(50/5) Ag(0.4/4) |
| 9 | Sn(100/50) Bi(4.2/42) As(80/40) W(40/20) Mo(8/8) Pb(50/5) Zn(200/4) Cu(30/3) |
| Sn | |
| 10 | Sn(130/65) Bi(5.9/59) As(90/45) W(16/8) Zn(300/6) Cu(60/6) Mo(5/5) Pb(50/5) |
| 11 | As(90/45) Bi(3.9/39) Sn(42/21) Zn(300/6) W(10/5) Mo(5/5) Cu(50/5) Pb(50/5) |
| 12 | As(80/40) Bi(3.5/35) Sn(16/8) Zn(250/5) Pb(40/4) W(6/3) Mo(3/3) Cu(30/3) |
| Pb–Zn in ZDSM | |
| 13 | As(30/15) Bi(0.8/8) Sn(12/6) Zn(250/5) Pb(40/4) Cu(30/3) Ag(0.3/3) |
| 14 | Pb(30/3) Zn(150/3) Cu(20/2) Ag(0.2/2) |
Note: The Sb contents in all the element associations are below the detection limit of the SSQA method (<20 ppm).
Table 3.
General characteristics of qualitative and quantitative functional relations in a sequence of endogenous AGF → exogenous AGF for ore objects of the Dukat Au–Ag OFS.
Table 3.
General characteristics of qualitative and quantitative functional relations in a sequence of endogenous AGF → exogenous AGF for ore objects of the Dukat Au–Ag OFS.
| Minera- Lization Types | AGF Types | ||
|---|---|---|---|
| Endogenous (Ore + Primary Halo) | Exogenous (Secondary Halo) | Exogenous (Stream Sediments) | |
| Ag, Au–Ag | (Zn, Cu, Bi) | (Bi, Zn, Sn, Cu, Au) | |
| Ag–Pb | (Sn, Cu, Bi) | (Bi, Sn, Cu) | |
| Sn–Ag | |||
Note: The denominator below the element shows the CR average values in the maximum anomalous geochemical fields. The elements given in parentheses were not observed constantly. Bold indicates the main typomorphic elements for each type of mineralization. In the column for the stream sediments, Sb is absent (due to the insufficient detection limit of the SSQA method).
Table 4.
Distribution of Au and Hg contents (ppm) in alluvial sediments depending on the watercourse order draining the Au–Ag zones of the Dukat deposit (survey of LSSs on the 1:50,000 scale).
Table 4.
Distribution of Au and Hg contents (ppm) in alluvial sediments depending on the watercourse order draining the Au–Ag zones of the Dukat deposit (survey of LSSs on the 1:50,000 scale).
| Watercourse Orders | I | II | III | |||
|---|---|---|---|---|---|---|
| Elements | Au | Hg | Au | Hg | Au | Hg |
| Minimum content | <0.006 | 0.017 | <0.006 | 0.022 | <0.006 | 0.005 |
| Maximum content | 0.45 | 1.5 | 0.23 | 0.33 | 0.090 | 0.12 |
| Average content | 0.078 | 0.28 | 0.041 | 0.10 | 0.017 | 0.034 |
| Number of samples | 34 | 23 | 44 | 21 | 42 | 26 |
Table 5.
The Dukat Au–Ag deposit and associated area. Geochemical associations of ore elements (survey of LSSs on the 1:50,000 scale).
Table 5.
The Dukat Au–Ag deposit and associated area. Geochemical associations of ore elements (survey of LSSs on the 1:50,000 scale).
| Nos. | Ore Element Associations |
|---|---|
| Predominantly Ag and Au–Ag | |
| 1 | Ag(27/270) Pb(1800/180) Hg(0.3/60) Au(0.2/40) Zn(2000/40) Cu(350/35) As(20/10) Bi(0.4/4) |
| 2 | Ag(14/140) Pb(1000/100) Hg(0.26/52) Au(0.1/20) As(40/20) Cu(190/19) Zn(900/18) Bi(0.4/4) |
| 3 | Ag(11/110) Pb(800/80) As(60/30) Hg(0.12/24) Cu(210/21) Au(0.055/11) Zn(500/10) Bi(0.4/4) |
| 4 | Ag(6/60) Pb(500/50) As(80/40) Cu(180/18) Hg(0.05/10) Au(0.03/6) Zn(250/5) Bi(0.5/5) |
| Ag–Pb | |
| 5 | As(1350/675) Pb(2800/280) Sb(40/200) Ag(19.5/195) Cu(170/17) Zn(600/12) Hg(0.06/12) Bi(0.3/3) Sn(6/3) |
| 6 | Pb(1500/150) As(160/80) Ag(6/60) Cu(200/20) Zn(550/11) Hg(0.05/10) Bi(0.4/4) Sn(6/3) |
| 7 | Pb(600/60) Ag(5/50) As(80/40) Cu(180/18) Zn(400/8) Hg(0.04/8) Bi(0.6/6) Sn(8/4) |
| 8 | Sb(45/225) Pb(480/48) Ag(4.6/46) As(70/35) Zn(800/16) Cu(150/15) Bi(1/10) Sn(16/8) Hg(0.02/4) |
| 9 | Ag(2/20) As(30/15) Pb(100/10) Cu(50/5) Zn(200/4) Bi(0.3/3) |
| Sn–Ag | |
| 10 | Ag(5.2/52) Sn(70/35) As(60/30) Cu(200/20) Pb(190/19) Zn(800/16) Bi(1.5/15) |
| 11 | Ag(2.2/22) As(34/17) Sn(30/15) Cu(90/9) Pb(80/8) Zn(300/6) Bi(0.6/6) |
| Pb–Zn in ZDSM | |
| 12 | As(10/5) Ag(0.3/3) Bi(0.3/3) Pb(30/3) Zn(100/2) Cu(20/2) |
Note: For Sb, only contents > 30 ppm (CR > 150) are shown in element associations, above the detection limit of the SSQA method.
Table 6.
Element composition (wt %) of corroded and oxidized acanthite grains in loose sediments of watercourses draining the Dukat deposit’s Au–Ag zones.
Table 6.
Element composition (wt %) of corroded and oxidized acanthite grains in loose sediments of watercourses draining the Dukat deposit’s Au–Ag zones.
| No. | Ag | Fe | Pb | Cu | Se | S | Total |
|---|---|---|---|---|---|---|---|
| Acanthite | |||||||
| 1 | 84.87 | 0.53 | <0.30 | <0.30 | <0.20 | 14.05 | 99.45 |
| 2 | 85.95 | 0.42 | < | < | 0.29 | 14.05 | 100.71 |
| 3 | 88.39 | 0.35 | < | < | <0.20 | 12.70 | 101.44 |
| 4 | 83.29 | 0.31 | < | < | 0.49 | 12.45 | 96.54 |
| 5 | 84.79 | 0.42 | < | < | 1.64 | 13.46 | 100.31 |
| Weakly corroded part of acanthite grain | |||||||
| 6 | 78.85 | 6.59 | < | < | 0.51 | 12.64 | 98.59 |
| 7 | 72.79 | 10.25 | < | < | <0.20 | 12.54 | 95.58 |
| 8 | 72.27 | 11.13 | < | < | < | 13.12 | 96.52 |
| 9 | 70.47 | 11.74 | < | < | < | 13.99 | 96.20 |
| 10 | 68.86 | 12.11 | < | < | < | 13.62 | 94.59 |
| Acanthite | |||||||
| 11 | 81.08 | 3.59 | < | 0.55 | < | 13.49 | 98.71 |
| 12 | 79.25 | 5.38 | < | 0.37 | < | 13.87 | 98.87 |
| Acanthite + Fe hydroxides | |||||||
| 13 | 42.25 | 26.47 | 0.39 | 1.14 | < | 9.79 | 80.04 |
| 14 | 53.79 | 20.68 | 0.52 | 1.40 | < | 9.43 | 85.82 |
| 15 | 46.74 | 19.41 | 0.92 | 1.45 | < | 9.39 | 77.91 |
| 16 | 46.97 | 25.09 | <0.30 | 0.99 | < | 8.06 | 81.11 |
| Fe hydroxides + acanthite | |||||||
| 17 | 4.97 | 54.44 | 2.23 | 0.38 | < | 0.82 | 62.84 |
| 18 | 5.58 | 54.73 | 1.82 | 0.36 | < | 1.25 | 63.74 |
| 19 | 3.92 | 55.50 | 2.24 | 0.35 | < | 0.66 | 62.67 |
| 20 | 7.81 | 53.43 | 2.02 | 0.31 | < | 1.48 | 65.05 |
Note: The elements Au, Hg, Sb, As, Zn, Ni, Co, W, Mo, Sn, Bi, Ge, Te and Mn were not detected. For the point location of the composition determination, see Figure 32a,d.
© 2019 by the authors. Licensee MDPI, Basel, Switzerland. This article is an open access article distributed under the terms and conditions of the Creative Commons Attribution (CC BY) license (http://creativecommons.org/licenses/by/4.0/).
Share and Cite
MDPI and ACS Style
Makshakov, A.S.; Kravtsova, R.G.; Tatarinov, V.V. Lithochemical Stream Sediments of the Dukat Gold–Silver Ore-Forming System (North–East of Russia). Minerals 2019, 9, 789. https://doi.org/10.3390/min9120789
AMA Style
Makshakov AS, Kravtsova RG, Tatarinov VV. Lithochemical Stream Sediments of the Dukat Gold–Silver Ore-Forming System (North–East of Russia). Minerals. 2019; 9(12):789. https://doi.org/10.3390/min9120789
Chicago/Turabian StyleMakshakov, Artem S., Raisa G. Kravtsova, and Vasiliy V. Tatarinov. 2019. "Lithochemical Stream Sediments of the Dukat Gold–Silver Ore-Forming System (North–East of Russia)" Minerals 9, no. 12: 789. https://doi.org/10.3390/min9120789
Note that from the first issue of 2016, this journal uses article numbers instead of page numbers. See further details here.