Article

Quantitative Data Extraction from Orthopyroxene Trace Element Maps and Its Potential to Examine the Formation of the UG2 Unit, Bushveld Complex

1
Irish Centre for Research in Applied Geosciences, Department of Geology, Trinity College Dublin, The University of Dublin, Dublin 2 D02 PN40, Ireland
2
Isotope Geochemistry, Department of Geosciences, Eberhard-Karls University of Tuebingen, 72074 Tübingen, Germany
3
School of Earth and Environmental Sciences, The University of Queensland, St Lucia, QLD 4072, Australia
4
Department of Geology, University of Johannesburg, Auckland Park 2006, South Africa
5
School of Earth, Environmental and Biological Sciences, Queensland University of Technology, Brisbane City, QLD 4000, Australia
*
Author to whom correspondence should be addressed.
Minerals 2019, 9(2), 73; https://doi.org/10.3390/min9020073
Submission received: 11 December 2018 / Revised: 16 January 2019 / Accepted: 21 January 2019 / Published: 27 January 2019
(This article belongs to the Special Issue Igneous Rocks: Minerals, Geochemistry and Ore Potential)

Abstract

:
We present a mineral chemical stratigraphy across the UG2 Unit, situated in the Upper Critical Zone of the Bushveld Complex. The magmatic evolution of the rocks hosting this world-class ore deposit for chromium and platinum group elements (PGEs) is still under debate. Orthopyroxene is a common phase across the magmatic stratigraphy of the unit. It hosts trace metals, whose relative contents can record information about magmatic processes. This study determined laser ablation inductively-coupled plasma mass spectrometry (LA-ICP-MS) trace element data for orthopyroxene and spot LA multi-collector ICP-MS Sr-isotope data for plagioclase. Mapping of trace element distributions revealed internal zoning in Cr, V, Y, and Th. Unlike in conventional spot analysis, quantitative trace element concentrations were extracted post-analysis from two-dimensional LA-ICP-MS maps. This approach offered advantages over spot analysis. The maps revealed internal complexities (e.g., inclusions, exsolved phases, zonations and diffusion halos) that could be avoided with suitable thresholds for chemical filter elements (i.e., 100 ppm < Cr < 4000 ppm, Y < 6 ppm), permitting fast, automated extraction of pure orthopyroxene data pixels from elemental maps covering noritic, troctolitic, anorthositic and chromititic mineral assemblages. Diffusive equilibration in orthopyroxene was evaluated by comparing zonations in elements with different known diffusivities. Magnesium and Ni are homogenously distributed, indicative of rapid diffusive processes, while Cr and V show zonations, interpreted to largely reflect primary distribution. Thorium and Y apparently diffused along discrete pathways, indicated by concentration anomalies following orthopyroxene lamellae. A systematic study of the trace element inventory of orthopyroxene across the succession of the UG2 Unit, complemented with Sr isotope signatures of plagioclase, revealed clear evidence for open-system processes: compatible elements (Cr, Ni) are decoupled from Mg# variations in orthopyroxene from specific UG2 subunits; distinct Mg# peaks coincide with negative V excursions in orthopyroxene from chromite-bearing subunits; towards the top of the unit, plagioclase shows a distinct 87Sr/86Srinitial peak and orthopyroxene shows Cr-depleted and Th-enriched rims. These chemical features cannot be explained by crystal mixing alone and argue for the involvement of at least two chemically distinct melts in the formation of the studied UG2 section.

1. Introduction

The recent advent and rapid development of micro-analytical techniques, such as LA-ICP-MS, allow in situ determination of the trace element geochemistry on single minerals [1,2,3,4]. There are a few reasons why this technique is advantageous over whole rock or mineral separate analysis: whole rock data can be influenced by changes in modal abundance, and even the most carefully picked mineral separates often contain mineral, fluid and melt inclusions, which can significantly modify the trace element signature of the analysed material [5]. In addition, weathering and alteration along crystal boundaries can adversely affect geochemistry. Trace element mapping by LA-ICP-MS is additionally capable of resolving internal mineral complexities, previously undetectable with major element or whole rock analysis [6,7]. Therefore, this approach delivers unprecedented insights into the formation of studied mineral phases and thus provides information on evolution of magmatic systems, i.e., partial melting, crystallisation, magma mixing, melt extraction and transportation [8,9,10].
Two dimensional mapping involves a less than 3 µm deep ablation [11] that is less destructive than conventional LA-ICP-MS spot analysis, drilling tens of microns into the sample. The mapping approach thus enables improved monitoring of the ablated material. Data extraction from LA-ICP-MS maps with the interrogation tool ‘Monocle’ [11] allows pooling of data from an entire region of interest (e.g., crystal). By combining thousands of pixels into one data point, this approach yields statistically robust data and for crystals that are zoned in trace elements, data can be extracted for each zone separately. Most importantly, the data are obtained after visualising the zoning in the map, avoiding the risk of missing relevant compositional variability via spot analysis, informed by traditional microscopic observations alone. ‘Monocle’ further enables data extraction with chemical thresholds. This approach is beneficial to obtain single mineral data from multiphase mineral assemblages (e.g., avoidance of inclusions/exsolutions).
The trace element inventory of pyroxene can serve as a record for magmatic processes. In clinopyroxene, LA-ICP-MS maps of Cr, Ni, Sc and incompatible elements provide a protracted record of magma history [7,12]. In many mafic layered intrusions, orthopyroxene (or low-Ca pyroxene) is a common mineral constituent. Chromium in orthopyroxene is considered the archetypal strongly compatible trace element [5,13,14]. By contrast, Y and Th are assumed to behave as incompatible elements in gabbroic rocks [15]. During magmatic differentiation from a primitive melt, progressive depletion of compatible Cr, and enrichment in incompatible Y-Th are expected across the orthopyroxene core-to-rim profile. Therefore, orthopyroxene LA-ICP-MS trace element maps have the potential to serve petrogenetic investigations in layered intrusions. Due to the slow cooling of very large intrusions [16], the intensity of diffusive modification needs to be evaluated. For exploration for magmatic ore deposits, understanding variations in the trace element inventory of single minerals in a cumulate pile may also hold promise, because they can potentially record magma injections that may trigger chromite or sulphide deposition [17].
In this study, we aim to develop a systematic methodology to obtain orthopyroxene data from 2-dimensional LA-ICP-MS maps in gabbroic mineral assemblages and to discover if this mineral might preserve trace element compositional variability with stratigraphy. If present, chemical variabilities together with complementary information, such as radiogenic isotope stratigraphy, might help to elucidate the magmatic processes forming layered intrusion hosted ore deposits. We focus on the layered sequence that constitutes the UG2 Unit in the Eastern limb of the Bushveld Complex. The UG2 chromitite is a world-class ore deposit for platinum group elements (PGEs) and chromium. Its formation has been, and still is, discussed controversially in the literature (e.g., [18,19,20,21,22,23,24,25,26,27,28,29]). A major topic of this debate is whether crystallisation of chromite occurred within, or outside the Bushveld magma chamber. As the predominant mineral phase in the succession of the UG2 Unit, orthopyroxene can serve as a tracer mineral for magmatic processes and is anticipated to be sensitive to earlier or coeval chromite crystallisation.

2. Geological Setting

The Bushveld Complex in South Africa is the largest mafic-ultramafic layered intrusion on Earth, and hosts the Rustenburg Layered Suite (Figure 1). This layered series crops out as discrete limbs arranged in a circular fashion. The two major exposures, with a length of approximately 200 km, are the Western and the Eastern limbs. While the Northern limb is fully exposed, the Far Western and Southeastern limbs are partially eroded or covered with younger rocks. The Rustenburg Layered Suite underlies an area of about 65,000 km2 and approaches a vertical thickness of 7–9 km [30], making up a large igneous province (LIP). This ultramafic-mafic layered series is divided into five major zones. From the base upwards these are the Marginal Zone, Lower Zone, Critical Zone, Main Zone and Upper Zone; (Figure 1). Divisions are predominantly based on the appearance/disappearance of cumulus minerals, e.g., the first occurrence of cumulus plagioclase defines the base of the Upper Critical Zone, while cumulus magnetite marks the base of the Upper Zone [31].
The Bushveld Complex hosts the world’s largest ore reserves of PGEs, Cr and V [32], contributing approximately 75%, 50% and 25% of global production, respectively [33]. The economically relevant deposits of chromite and PGEs are hosted within the Critical Zone. According to their stratigraphic position within the Critical Zone, units and their chromitite layer(s) are allocated to the Lower (LG), Middle (MG) and Upper (UG) Group. Units are numbered from the base upwards, e.g., UG1, UG2 and UG3. The target of this study is the UG2 Unit in the Eastern Bushveld limb. The UG2 Unit comprises the UG2 chromitite, which is of vast economic interest as a world-class ore deposit for PGEs and chromium.

3. Materials and Methods

3.1. Materials

Samples were extracted from drill core BH8039 at the Two Rivers Platinum Mine (see sample list, Table S1). This mine is situated southwest of Steelpoort in the Eastern limb of the Bushveld Complex (Figure 1). Following the definition of the UG2 cyclic unit from Voordouw and Beukes [34], the UG2 Unit is ca. 7 m thick and consists of seven subunits in the sampled core, which in stratigraphic order are: Lower Pegmatoid, Main Seam with the intercalated irregular Lower Split, Upper Split, Leader Seam, Upper Pegmatoid and Upper Distal (Figure 2; [34]). With the exception of the two chromitite seams (Main Seam, Leader Seam), the remaining subunits mainly consist of silicates of noritic, troctolitic, melanoritic to pyroxenitic composition. The two economically important chromitite seams add up to a total thickness of about 1.5 m. The UG2 Unit is stratigraphically enclosed by a footwall norite (FW Norite) and a hangingwall anorthosite (HW Anorthosite).
Representative areas of each lithological subunit of the UG2 and major transition zones were sampled (n = 12) at decimetre to meter scale. Thin sections of 35 to 40 µm thickness, prepared at the University of Tübingen, were studied with transmitted light microscopy to characterise the mineral assemblages (see detailed petrography in Sample Descriptions in the supplementary materials). Mineral modes were determined by point counting, with a minimum of 500 counts per thin section.

3.2. Major Element Analysis (SEM-EDS and Electron Microprobe)

Major element analyses on orthopyroxene from nine thin sections were determined in the iCRAG lab at Trinity College Dublin, using a Tescan Mira field emission gun scanning electron microscope (FEG-SEM, TESCAN, Brno, Czech Republic), equipped with an Oxford Instruments X-MaxN 80 mm2 energy dispersive spectrometer (EDS, Oxford Instruments, Abingdon, UK). Data were obtained with the INCA X-ray microanalysis software (Oxford Instruments, Abingdon, UK). Major element concentrations were calibrated with a set of Smithsonian microbeam standards [35]: augite (USNM122142), pyrope (USNM122142), anorthoclase (NMNH133868) and microcline (NMNH143966). Carbon coated samples (15 nm of C) were analysed with an acceleration voltage of 20 kV and a beam current of 320 pA. At a constant acquisition time of 30 s, more than 300,000 counts were accumulated per analysis. At least five spots were analysed per orthopyroxene crystal. Stoichiometrically accurate data with totals ranging from 97 to 103 wt. % can be obtained with this method (e.g., [36]).
In three of the thin sections, the major element composition of orthopyroxene had previously been analysed at the Petrology Group Laboratories, University of Tübingen, using a JEOL SuperProbe JXA-8900RL (JEOL, Ltd., Akishima, Japan), equipped with a wavelength dispersive spectrometer. A focused beam with a current of 20 nA was operated at an accelerating voltage of 15 kV. Standardisation was performed using mineral standards from Astimex Scientific Limited. Analysis conditions are summarised in Table S2. Spot analyses were performed on carbon coated (7 nm of C) thin sections and screened using stoichiometry and totals (99–101 wt. %).

3.3. Trace Element Analysis (LA-ICP-MS)

A suite of trace elements of variable compatibility in orthopyroxene (Cr, Ni, V, Y, La, Th) was analysed by LA-ICP-MS at the iCRAG Labs at Trinity College Dublin. The setup couples a Teledyne Photon Machines G2 (Teledyne Technologies, Inc., Thousand Oaks, CA, USA) 193 nm excimer Ar-F laser to a ThermoFisher Scientific iCAP-Qc quadrupole mass spectrometer (MS, Thermo Fisher Scientific, Waltham, MA, USA). The laser system is equipped with a HelEx ll active 2-volume ablation cell (Teledyne Cetac Technologies, Omaha, NE, USA). Typical gas flows were: He flow into the cell 0.05 L/min, He flow into the sampling cup 0.35 L/min, make-up gas Ar 0.65 L/min, cool flow Ar 14 L/min, and auxiliary flow Ar 0.7 L/min. A small flow (ca. 13 mL/min) of N2 make-up gas inhibited oxide formation and enhanced signal sensitivity. The laser was operated with Chromium 2.1 software (Teledyne Photon Machines, Inc., Thousand Oaks, CA, USA) and data acquisition was executed with Qtegra (version 2.2, ThermoFisher Scientific, Waltham, MA, USA) in time resolved analysis mode. Tuning was accomplished by line scanning NIST612 reference standard material [37], aiming to get strong responses across the mass range at low ThO+/Th+ (< 0.2%) and uniform response to Th and U (Th/U = 1.00 ± 0.05).
Trace element distribution maps were generated by ablating sets of horizontal lines of equal length [7]. A dynamic aperture provided square-shaped laser spots, and the scanning speed and repetition rate were chosen to allow overlap between the spots. These lines were aligned parallel to the gas flow trajectories [6], which reduced the possibility of resampling ablated material. The number of analytes was restricted to a minimum, to allow maximum dwell time for each of the elements and maximise x-resolution, following: x-resolution [µm] = scanning speed [µm/s] × total dwell time [s]. The beam size (y-resolution) was chosen slightly bigger than the calculated x-resolution. It was found that 51V, 53Cr, 60Ni, 89Y, 139La and 232Th were the most interesting analytes for orthopyroxene, avoiding mass interferences. 29Si was analysed as the internal standard, as it was homogenously distributed throughout all orthopyroxene crystals (Si concentration from SEM-EDS and EMPA results was 25.6 ± 0.4 wt. %; n = 193). Individual dwell times of the analytes were defined according to relative abundances, recorded by running test lines on the samples and on NIST612 [37]. Each map was bracketed by 2 × 2 NIST612 glass (external standard) and 2 × 2 BCR-2G ([38]; quality control standard) line scans with identical laser parameters as the map.
The laser and the mass spectrometer were connected by a tubing system that involved an in-house developed variable volume device, which allowed adjustable signal smoothing between the laser and the mass spectrometer. Over the course of the analyses, a new, small diameter tubing system, the ‘Aerosol Rapid Introduction System’ (ARIS, Teledyne Photon Machines, Inc., Thousand Oaks, CA, USA; Van Acker et al. (2016) [39]), replaced the in-house device. Applying this low volume polytetrafluoroethylene tube (1.3 mm inner diameter, 372 mm in length) afforded much faster signal washout. This accelerated transfer of aerosol to the mass spectrometer enabled faster stage travel speeds, which, along with higher repetition rates, allowed faster mapping. Washout periods between lines were shortened by a factor of eight. Lanthanum was found to add little information and was therefore not analysed in the experiments conducted with the ARIS system. Map sizes varied between 0.5 mm2 and 45 mm2 and experiments lasted between 30 min and 3 h. Mapping parameters are summarised in Tables S3 and S4.
Data reduction was undertaken with the software package Iolite 3.4 (The University of Melbourne, VIC, Australia) [40], implemented in Igor Pro 6.37 (WaveMetrics Inc, Portland, OR, USA) [41]. After loading the raw data as time-resolved waves into Iolite, baseline intervals were defined, involving a 2 SD outlier rejection. These intervals were reviewed and, if necessary, manually adjusted for all available element channels. An appropriate spline type across all baselines integrations was chosen to be later subtracted from samples and reference materials. The laser log file was synchronised with the MS data file to define integration intervals for standard materials and samples, including a 3 SD outlier rejection. Standard integrations were manually selected and interpolated using appropriate spline types. Concentration data were obtained by applying the data reduction scheme ‘Trace-Elements’ [42] in ‘Semi-Quantitative’ mode. Maps were generated using the ‘Image From Selections’ module and the commonly used ‘ColdWarm’ colour scheme [4,6,7]. Concentration limits were selected to highlight internal inhomogeneity for each analysed element.
To extract quantitative data from the 2D trace element maps, the flexible map interrogation tool ‘Monocle’ [11] was used. In this Iolite add-on, regions of interest (ROI) were produced by applying chemical criteria on semi-quantitative maps, to extract trace element data of orthopyroxene only: Cr 100–4000 ppm, Y < 6 ppm (see Results section). After extraction, fully quantitative concentrations were calculated applying the internal standardisation method [6,43] to the data contained within the ROI. Internal 2SE errors of the ROI integrations for the analysed trace elements are listed in Table S6. These errors represent the precision as a function of counting statistics (see [11] for a full assessment of the accuracy, precision and detection limits of this approach as a function of the number of ROI pixels). Petrus et al. [11] showed that as few as 5 pixels are sufficient to achieve acceptable precision and accuracy on BHVO-2G glass [44]. In the present work, the number of pixels per ROI was always higher than 100, with an average of 7000 pixels per ROI.
Repeat interleaved analyses of BCR-2G were conducted as accuracy control and the results were found to be within the published ±2 SD uncertainty (GeoREM Dec09, Table S5). The internal precision was better than ±7% for all the analysed trace elements. Because BCR-2G is not a perfectly homogeneous standard at the scale it was sampled, the true error on the target samples is probably smaller than the reported uncertainty. Using the same LA-ICP-MS facilities, Ubide et al. [7] demonstrated the excellent reproducibility of the mapping approach with repeated experiments of the same crystal.

3.4. Sr Isotope Analysis (Laser Ablation Multi-Collector Inductively Coupled Mass Spectrometry (LA-MC-ICP-MS))

Strontium isotope signatures of plagioclase were determined at the isotope geochemistry facilities of the University of Tübingen. These data were acquired by spot laser ablation multi-collector inductively coupled mass spectrometry (LA-MC-ICP-MS). The setup coupled a Resonetics RESOlution M-50 193 nm excimer laser to a ThermoFisher Scientific NeptunePlus (Thermo Fisher Scientific, Waltham, MA, USA) MC-ICP-MS. Samples were fixed on a carrier and loaded into a two volume sample cell. Typical gas flows were: He flow into the sample cell 0.65 L/min, make-up gas Ar 1 L/min, cool flow Ar 15 L/min, auxiliary flow Ar 0.7 L/min, N2 flow 2 mL/min. The laser was operated with the RESOlution control software ‘GeoStar’ (Norris Software). In static ablation mode, the laser parameters were: laser pulse frequency of 6 Hz, beam diameter of 90 µm, beam energy density of 2.6 J/cm2.
The following masses were analysed: 84Sr–Kr, 85Rb, 86Sr–Kr, 87Rb–Sr, 88Sr. Prior to every 60 s lasting ablation, the background signal was analysed for 30 s, enabling to correct for the isobaric interference of 86Kr on 86Sr and of 84Kr on 84Sr. Instrumental mass fractionation was corrected using exponential law and a 88Sr/86Sr ratio of 8.375209. The correction of the isobaric interference of 87Rb on 87Sr was based on the 85Rb signal and a 87Rb/85Rb ratio of 0.385617 [45]. Radiogenic ingrowth was calculated via the determined 87Rb/86Sr ratio and a decay constant for 87Rb of 1.393 × 10⁻¹¹y−1 [46]. An age of 2055 Ma was assumed for all samples [47]. As a quality control, the 87Sr/86Sr isotope signature of plagioclase standard Mir a [48] was determined at the start and end of every sample set analysis. The obtained average 87Sr/86Sr ratio of 0.70311 ± 0.00006 (2SD) mirrored the 87Sr/86Sr ratio by Rankenburg et al. [48] of 0.70310 ± 0.00010 (2SD), obtained through TIMS analyses and the value of 0.70310 ± 0.00002 (2SD) by Yang et al. [49] derived by LA-ICPMS. Single analyses were rejected when the total Sr signal was below 0.6 V, or the 87Rb/86Sr ratio was higher than 0.01. Finally, a 2SD filter was applied to all 87Sr/86Sr isotope signatures.

4. Results

4.1. Petrography

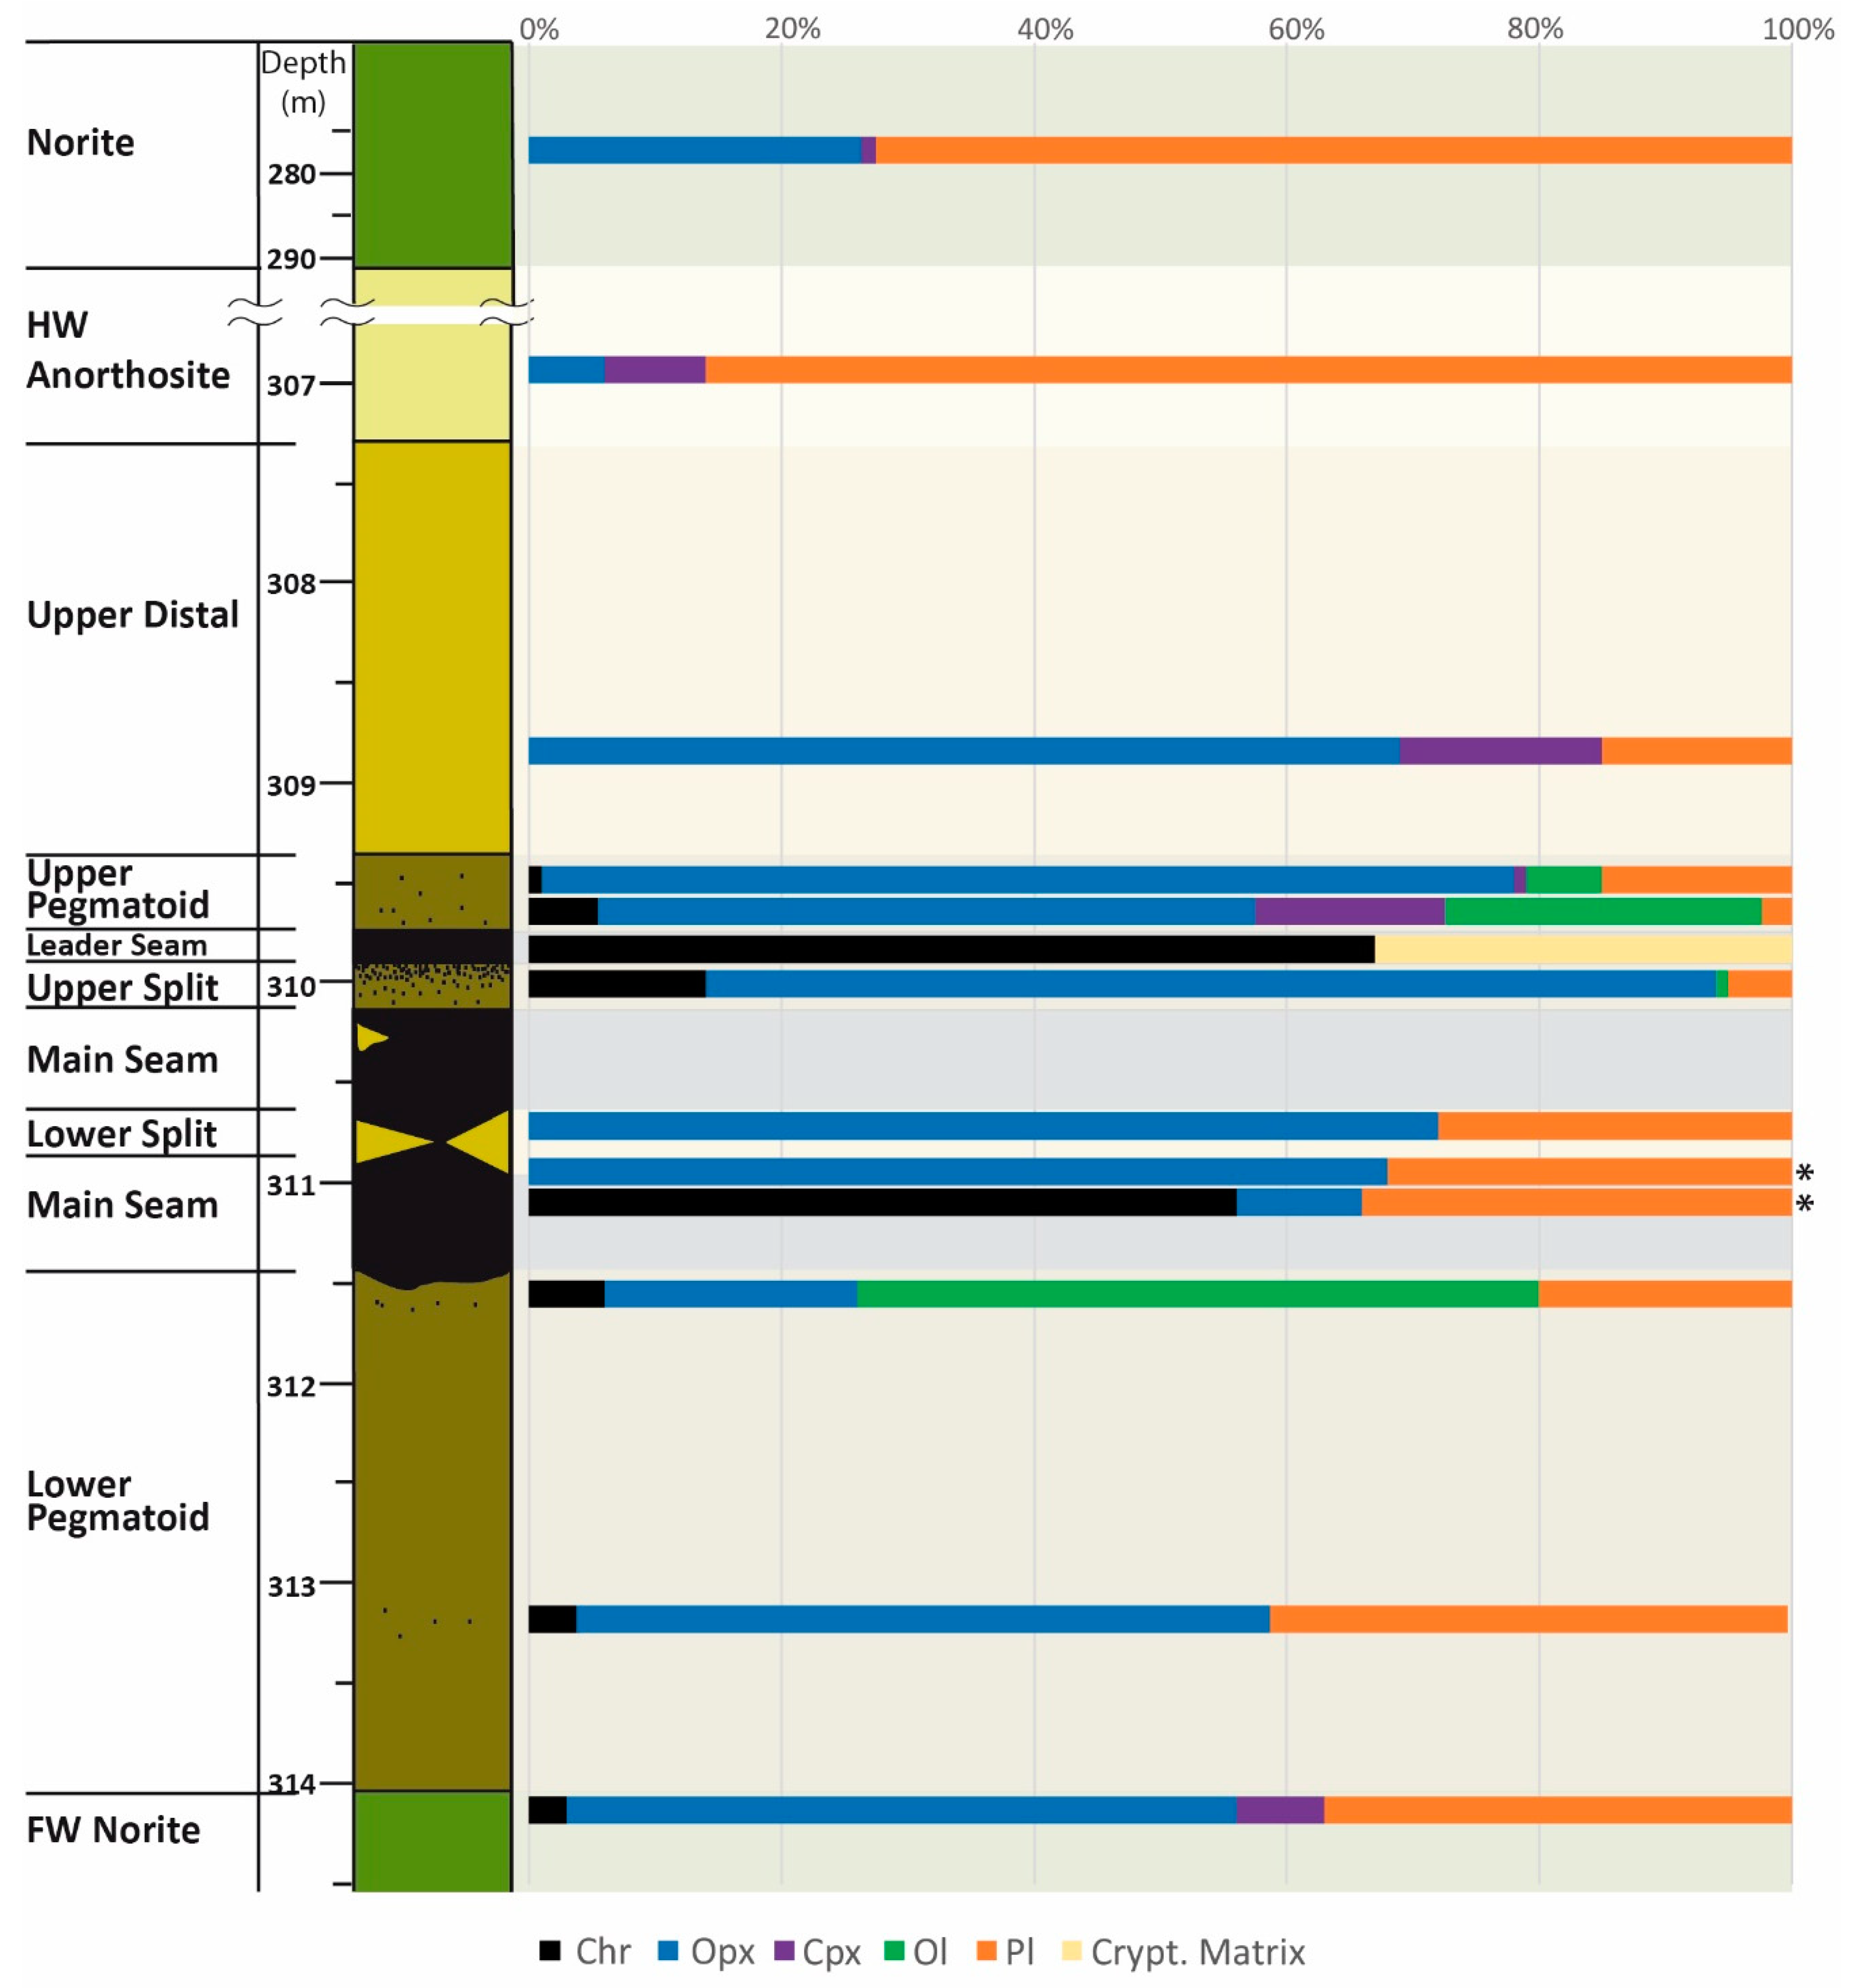
4.1.1. Modal Abundance

Orthopyroxene is the most abundant mineral phase in the studied succession, generally exceeding modal abundances of 50% (Figure 3). Apart from the Leader Seam, it is ubiquitous. It commonly forms the main cumulus phase, with the exception of the HW Anorthosite, the Main Seam and the Lower Pegmatoid, where modal proportions are below 20%. Plagioclase is the second-most abundant mineral phase (mostly 20–40 modal %), present in each of the silicate UG2 subunits and in the Main Seam. It is commonly intercumulus, except in the HW Anorthosite (> 80 modal %) and in the overlying norite where it is a cumulus phase, associated with intercumulus orthopyroxene and clinopyroxene. Chromite is densely accumulated in the Main Seam and the Leader Seam (> 50 modal %), very abundant in the Upper Split (17 modal %) and has modal proportions < 10% in the two Pegmatoid layers, and the FW Norite. The occurrence of olivine is restricted to the two Pegmatoid layers and the Upper Split. It is very abundant in the Lower Pegmatoid (~60 modal %) and common in the Upper Pegmatoid (~25 modal %). Olivine and chromite are cumulus phases throughout the succession. Intercumulus clinopyroxene is most abundant in the Upper Distal and Upper Pegmatoid, followed by the FW Norite, HW Anorthosite (16, 15, 8 and 7 modal % respectively). In the Leader Seam, chromite is associated with an interstitial cryptocrystalline matrix that presumably consists of various alteration products of its primary mineral assemblage.

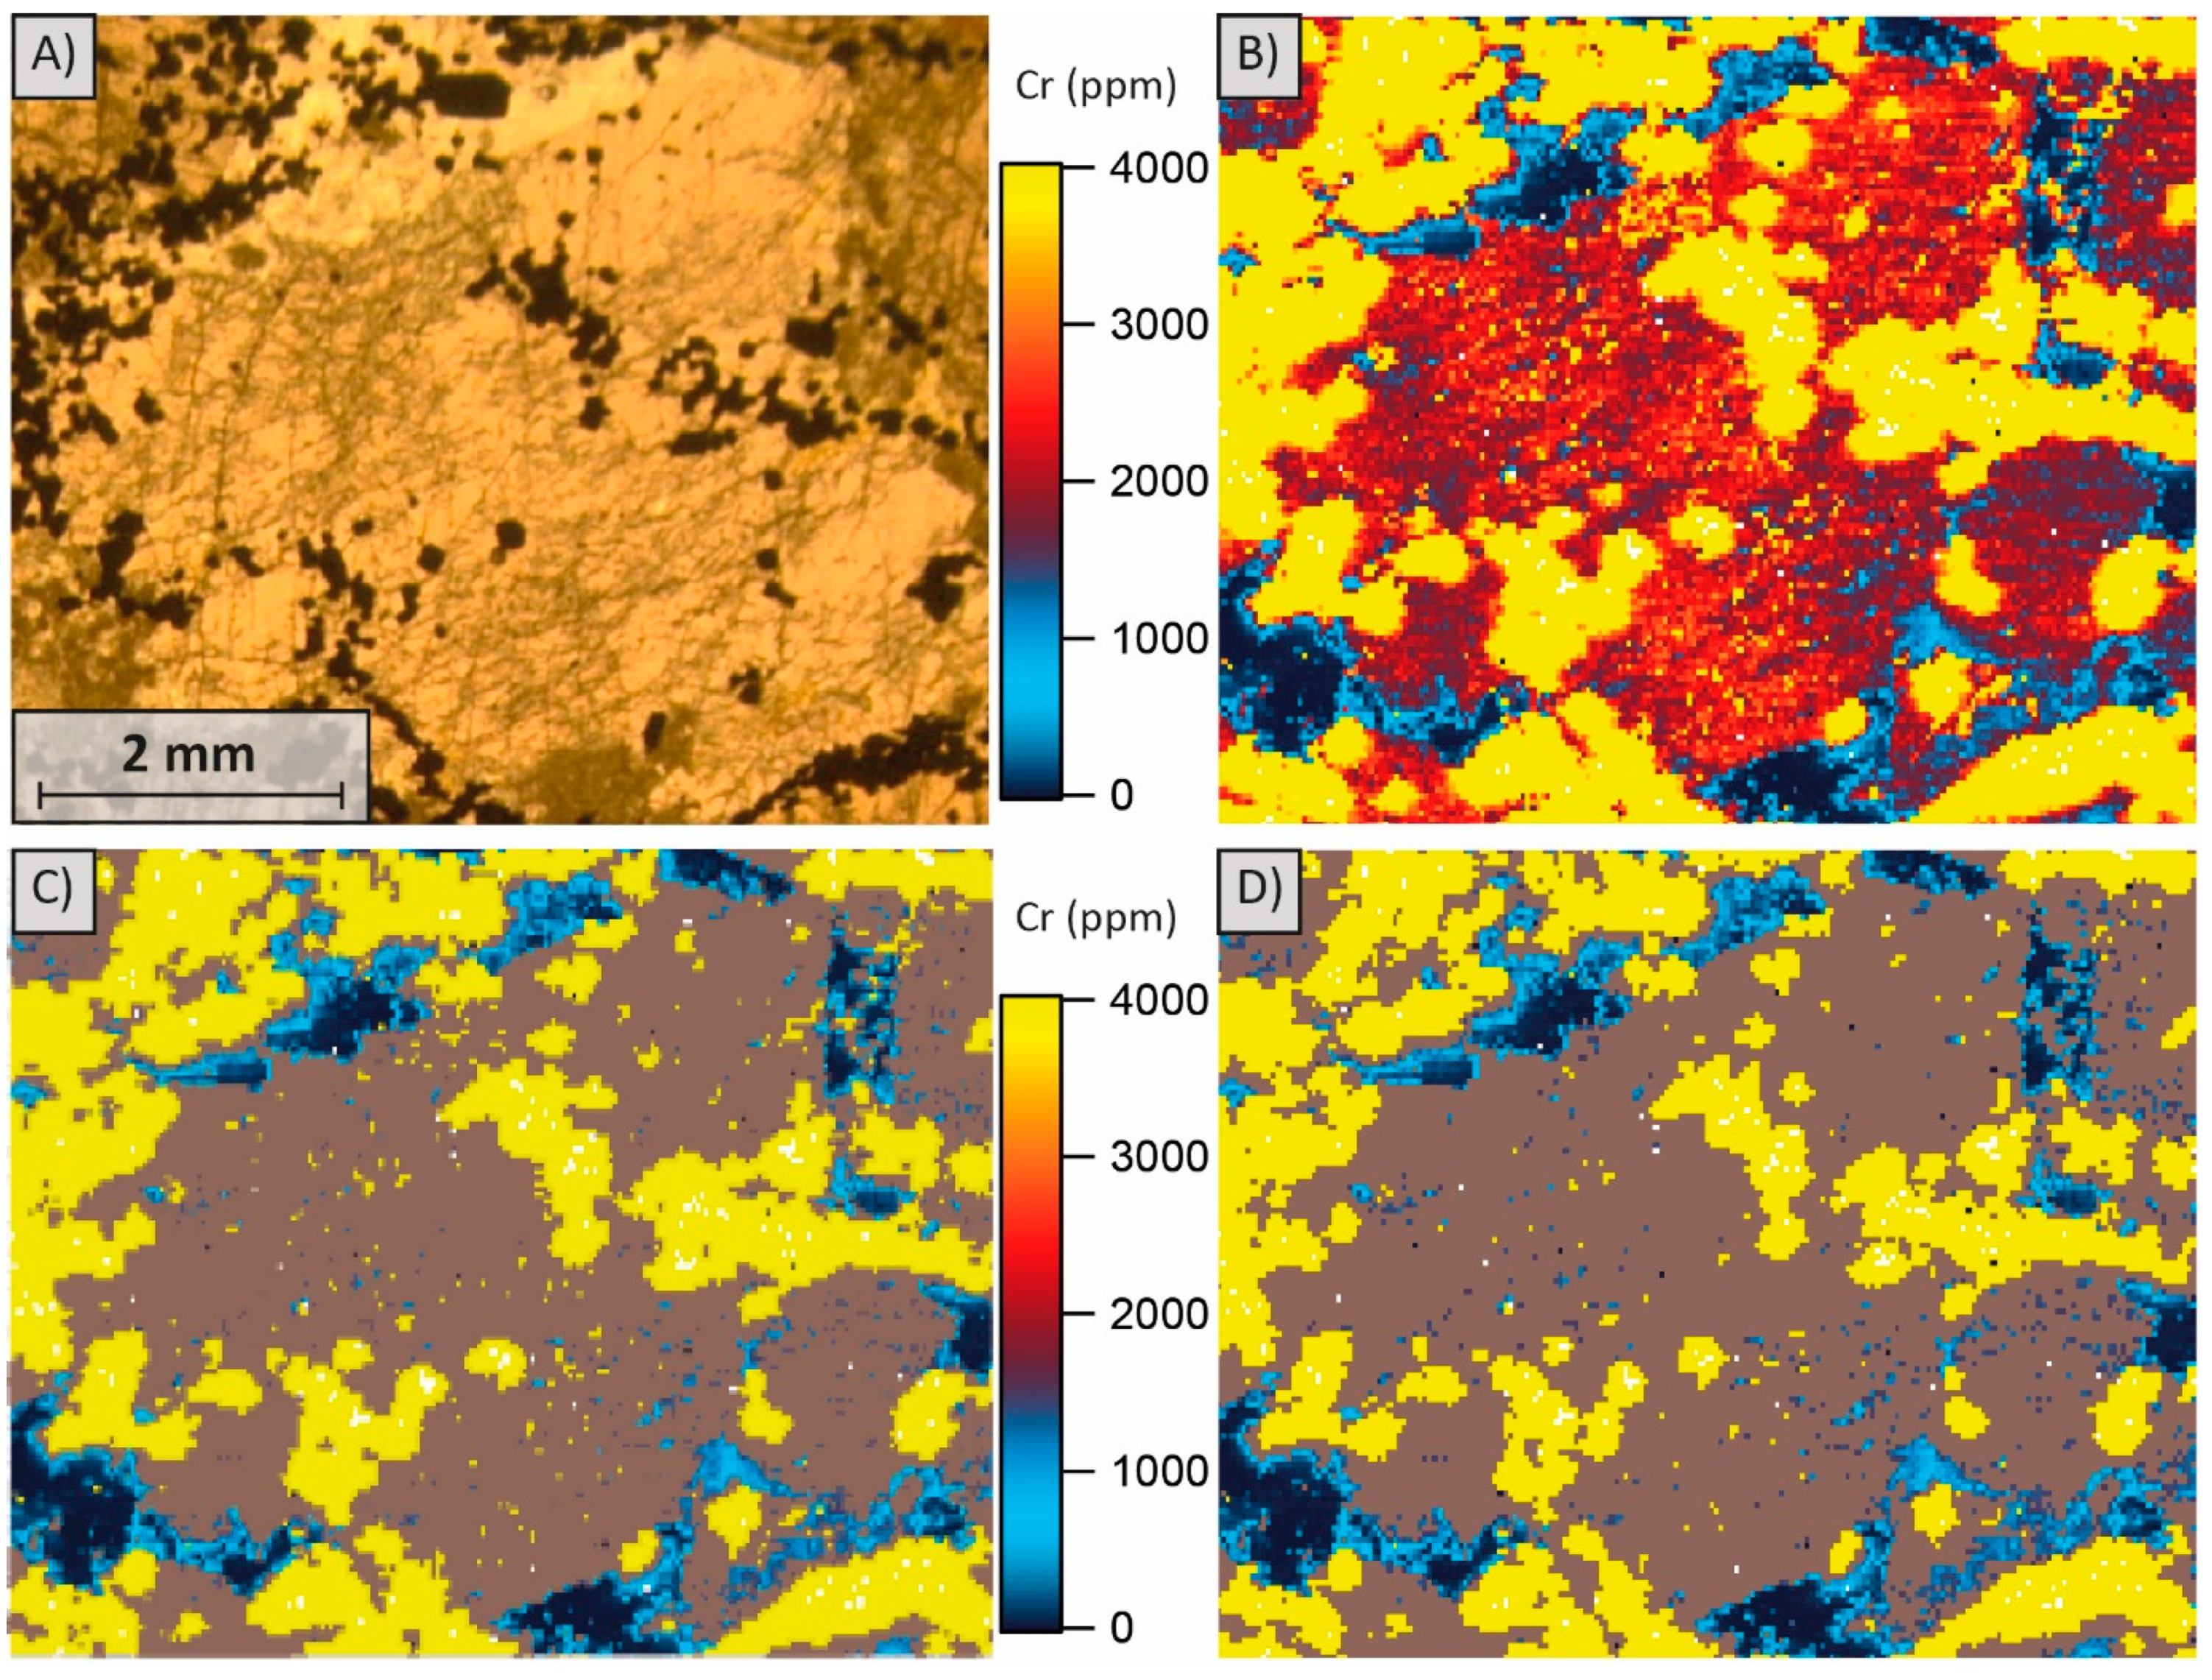
4.1.2. Chromite-rich UG2 Subunits

The two chromitite layers differ in two petrographic aspects: mineralogy and contact relationships with their hosting silicate UG2 subunits. The Main Seam has sharp contacts with the underlying Lower Pegmatoid subunit (Figure 4A), as well as with the interleaved Lower Split (Figure 4B,C). The basal contact with the Lower Pegmatoid and the contact with an upper Lower Split fraction are undulating and rather erosive (Figure 4A,B), while the contact with the major Lower Split fraction is subhorizontal (Figure 4C). The basal contact of the Leader Seam with the Upper Split is gradational (Figure 4D). This is highlighted in the Upper Split sample (Figure 4D2), where the abundance of disseminated chromite increases towards the top. In this sample, chromite crystals occur preferentially along grain boundaries of orthopyroxene and locally within orthopyroxene crystals.
The two chromitite seams differ in their intercumulus mineral assemblage, chromite content and chromite crystal size. The Main Seam chromitite has poikilitic texture (Figure 5A), where chromite crystals are dominantly enclosed in coarse intercumulus plagioclase- and subordinate orthopyroxene oikocrysts. Chromite grain sizes vary between 80 µm and 500 µm, with the majority being ~150 µm in size. The chromite content is ~55%. In contrast, the Leader Seam chromitite is mainly composed of chromite crystals (~70%) that show a bimodal size distribution of ~100 and ~700 µm (Figure 5B,C). The coarse chromite fraction occurs as densely packed accumulations, where interstices are virtually absent. The finer fraction is associated with an interstitial cryptocrystalline matrix (Figure 5B). Petrography indicates that this matrix is most likely made up of alteration products of plagioclase, clinopyroxene and possibly orthopyroxene. Unaltered clinopyroxene and plagioclase crystals are only trace constituents.

4.2. Geochemical Results of Orthopyroxene

Most of the investigated orthopyroxene crystals are internally zoned in trace elements (Cr, V, Y and Th), whereas corresponding zoning is not apparent in BSE images, SEM-EDX major element maps (see example in Figure 6), or major element point analyses, which are remarkably homogeneous (MgO: 29.5 ± 1.6 wt. %, SiO2: 54.8 ± 0.9 wt. % and FeO: 11.2 ± 2.0 wt. %; n = 193).

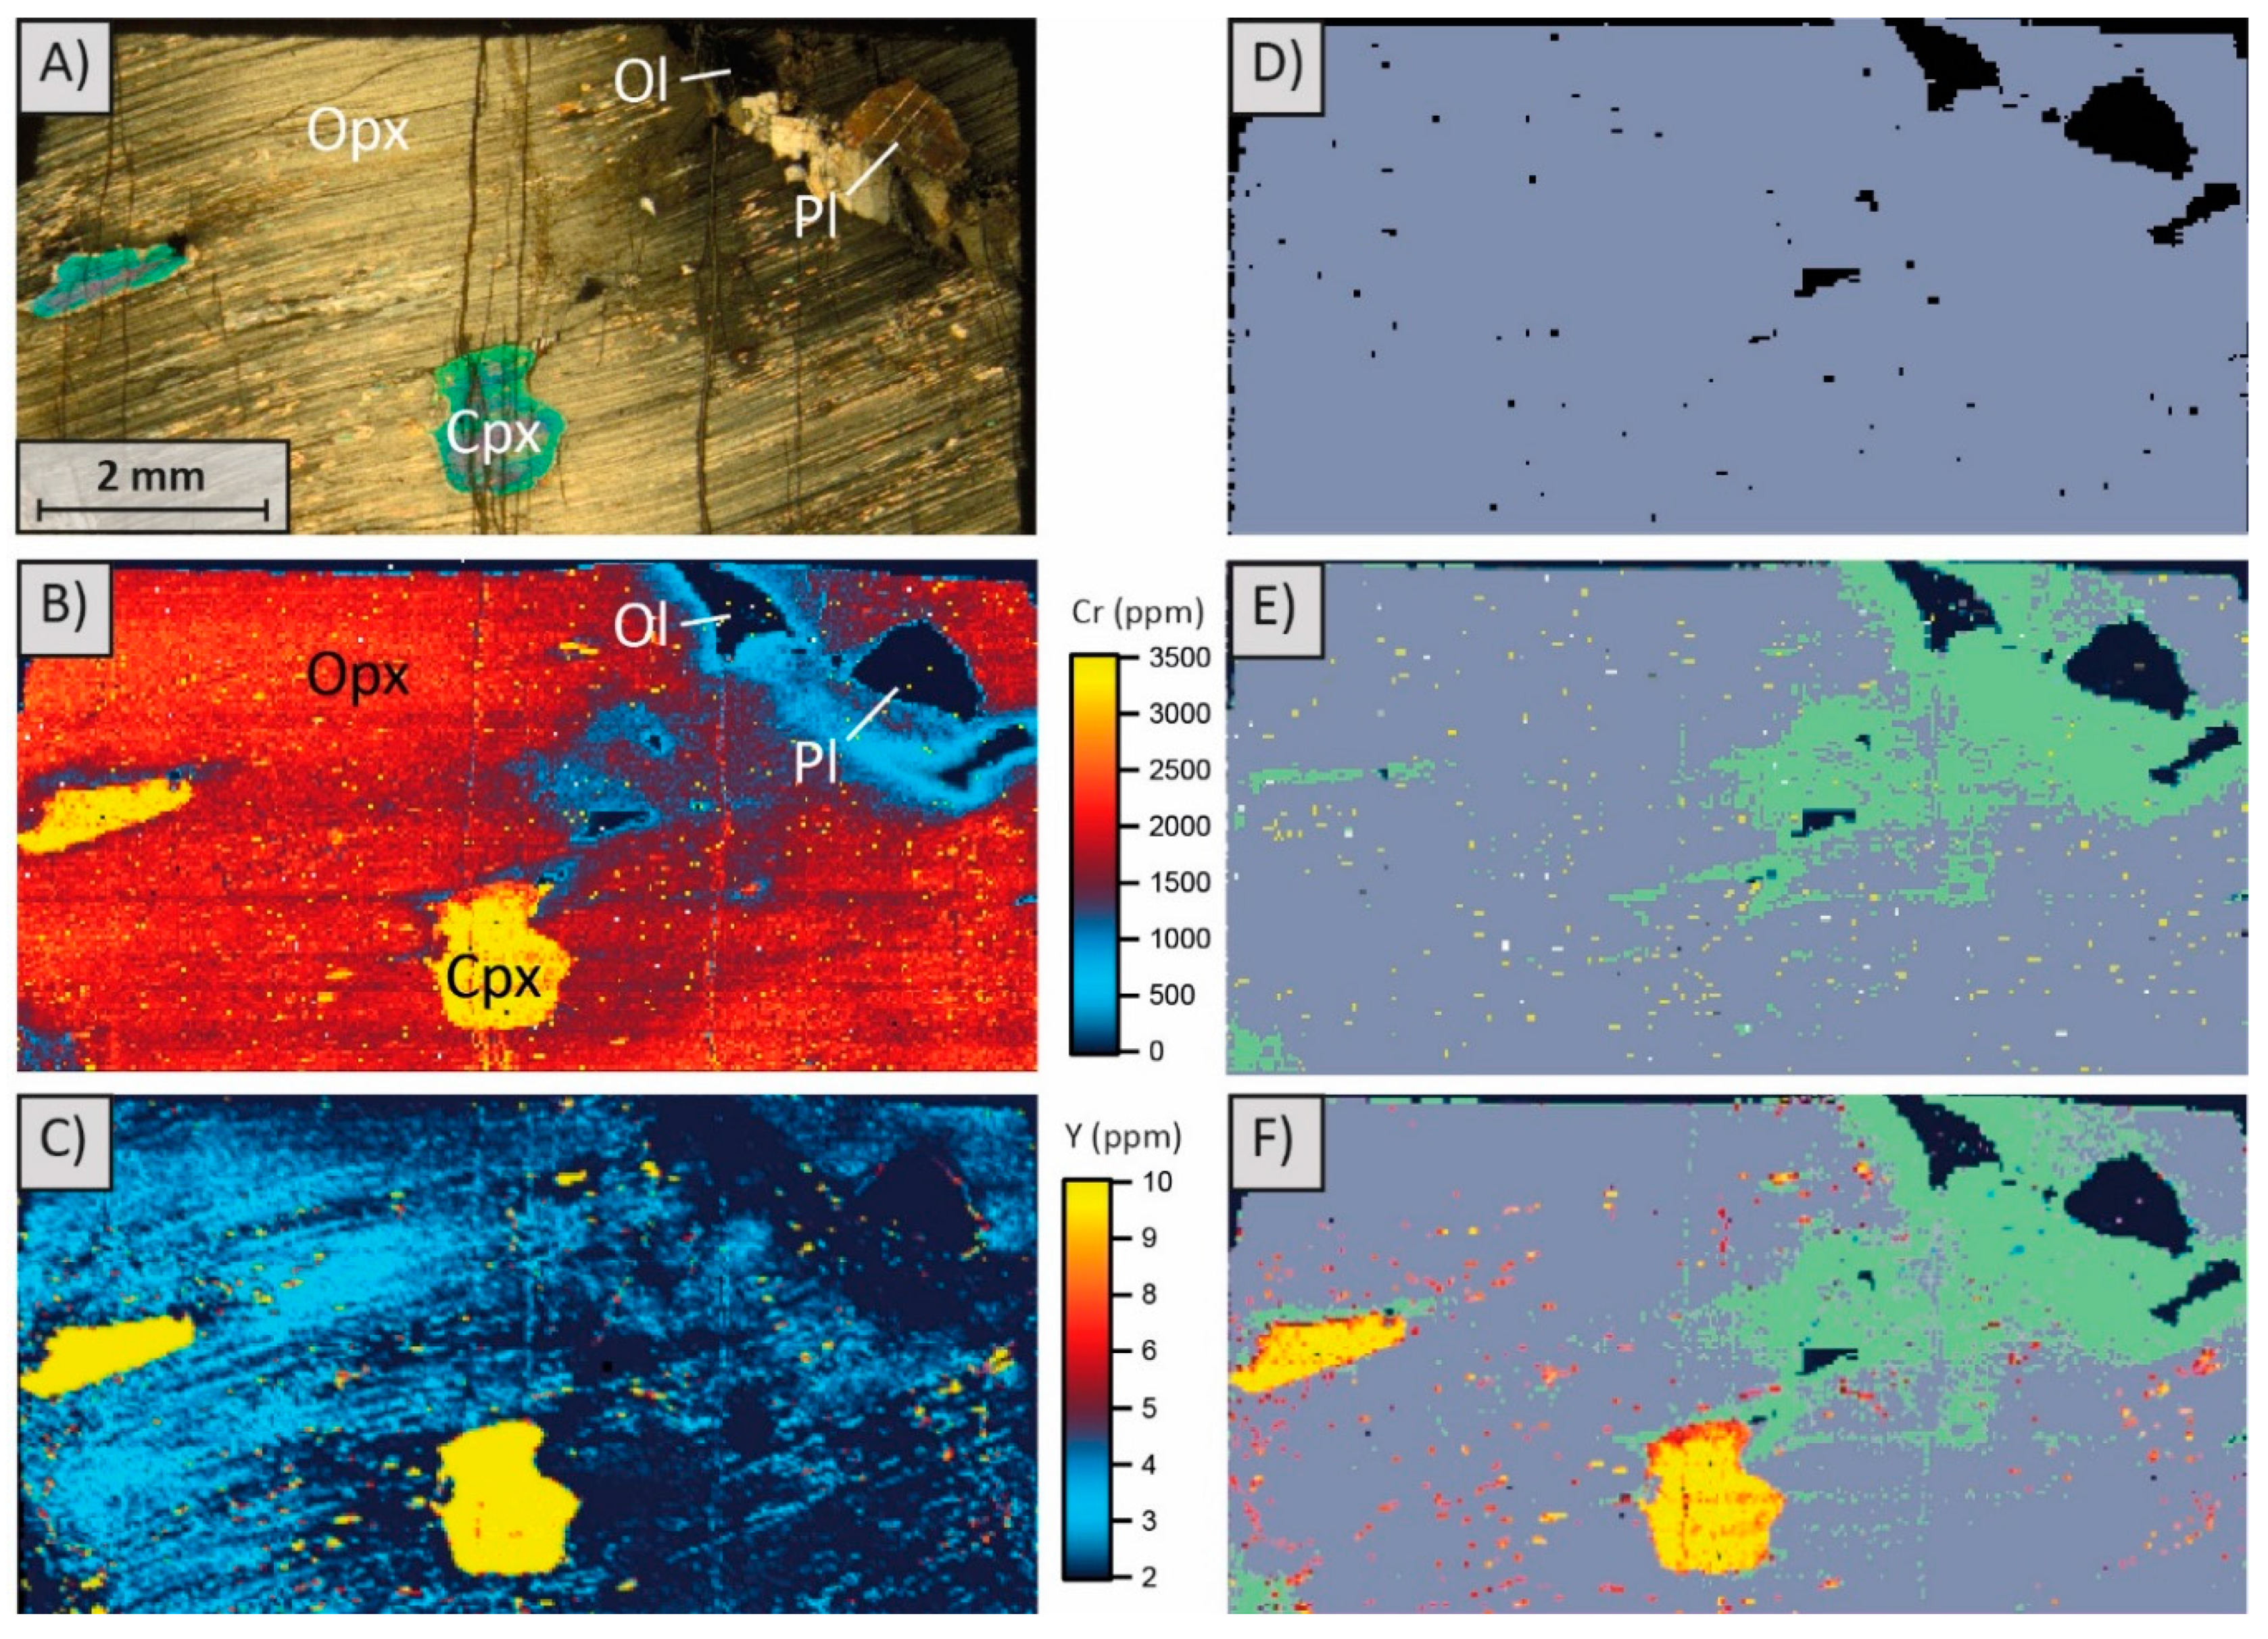
4.2.1. Selection of Orthopyroxene ‘Regions of Interest’ (ROI)

Data extraction with ‘Monocle’ creates ROI in a number of ways. The most objective approach is to set a selection of chemical thresholds to extract all pixels that meet the criteria, into a single ROI. The areal extent of the ROI can be visualised as an overlay on the trace element map. Considering the mineralogy of the mapped areas, primarily made up by orthopyroxene, plagioclase, olivine, clinopyroxene and chromite, we found that the following chemical criteria were the most suitable to ensure that only orthopyroxene crystals were taken into account in the ROI: 100 ppm < Cr < 4000 ppm and Y < 6 ppm.
The choice of these criteria is explained by means of a few examples. The mapped area in Map2_309.75b (Figure 7A,B) contains the four phases orthopyroxene, plagioclase, olivine, clino-pyroxene. As Cr is considered to be least susceptible to diffusion [5], it was applied as a primary filter element. In Figure 7D it is shown that a ROI with Cr > 100 ppm excludes plagioclase and olivine. Chromium concentration was further applied to separate the orthopyroxene core areas (‘core’) from transitional zones (‘trans’) to adjacent crystals of lower Cr concentration. A Cr concentration boundary of 1500 ppm was defined to separate ‘core’ regions that seemed to be least affected from secondary processes, from ‘trans’ regions (Figure 7E). In combination with transmitted light microscopic observations, this limit was found to fit best across all of the semi-quantitative orthopyroxene maps.
An upper Cr boundary was defined to exclude chromite crystals from orthopyroxene ROI. The best limit was found to be 4000 ppm on semi-quantitative maps. It might be expected that the upper boundary should be set higher because chromite crystals typically contain tens of wt. % of Cr (e.g., [50]). However, we identified transitional halos between chromite and orthopyroxene of high Cr concentration (>4000 ppm, Figure 8B). These could arise from re-ablating chromite ejecta from the previously ablated line and/or could form by limited, micron-scale Cr diffusion. Because they are found equally distributed around chromite, regardless of the stage travel direction, solid-state-diffusion into orthopyroxene seems the more plausible explanation. Regardless, pixels from these areas must not be included in the orthopyroxene ROI, explaining the upper orthopyroxene ROI threshold of 4000 ppm Cr.
Clinopyroxene occurs as exsolution lamellae (Figure S1) and micrometer-sized inclusions in orthopyroxene, and as intercumulus mineral. The micrometer-sized-inclusions (yellow in Figure 7C) show the necessity of the use of chemical criteria to exclude clinopyroxene from orthopyroxene ROI. An upper boundary of 4000 ppm Cr also excludes most of the clinopyroxene crystals, however, in some of our samples, clinopyroxene crystals yield lower Cr concentrations and must therefore be excluded via an additional filter. Possible filter elements are V, Ni and Y. Yttrium was found to be most effective, since the concentration contrast is highest (Figure 9; Table 1). An upper orthopyroxene Y concentration of 6 ppm was found appropriate to avoid clinopyroxene data without losing orthopyroxene pixels (see Figure S2).

4.2.2. Quantitative Orthopyroxene Chemistry

Orthopyroxene core compositions (see Tables S7 and S8) are presented across the UG2 stratigraphy in Figure 10. Total Mg# numbers (100 × Mg/(Mg + Fe)) range between 65 and 83, agreeing with previously reported data from the Upper Critical Zone by Schurmann [51], and Maier and Eales [20]. Mg# numbers are highest in the Main Seam, followed by the Main Seam-Lower Split Transition and the Upper Split, while lowest Mg#s are found in the Upper Distal and the HW Anorthosite (see Figure 10). Chromium concentrations in orthopyroxene cores are mostly between 2500 and 3000 ppm, similar to published data for the Upper Critical Zone [21,50,51,52]. Only in the Main Seam and the Lower Split Transition, orthopyroxene Cr concentrations exceed 3500 ppm. The stratigraphic trend of Cr roughly follows that of Mg#. Highest Cr concentrations occur in the Main Seam and in the Lower Split Transition. However, in the Upper Split, Cr concentrations are not as high as expected from Mg#s. In Ni concentration, there is a notable upward increase from the FW Norite to the Upper Pegmatoid, followed by a sudden drop in the Upper Distal. Low Ni concentrations persist in the HW Anorthosite and the overlying norite. Vanadium seems to anti-correlate with Mg# over the whole stratigraphy of the UG2 Unit. Yttrium and Th tend to correlate with each other, except for clinopyroxene bearing UG2 subunits, where Y is relatively lowered. Highest Y concentrations occur in the Lower Pegmatoid and in the Lower Split-Main Seam Transition, while highest Th contents are present in the Lower Pegmatoid and in the FW Norite.

4.2.3. Correlation of Elemental Patterns

Magnesium number (Mg#) in orthopyroxene is the archetypical indicator to assess the evolution of parental magmas. Typically, early crystallising orthopyroxene is Mg-rich, while more Fe-rich orthopyroxene crystallises from more evolved liquids [53]. In the following, it was tested to which extent the trace element characteristics follow the evolutionary trend, indicated by Mg#s. Average Cr content in orthopyroxene correlates well with Mg# in 9 of 12 samples (Figure 11A). This is expected from the partition behaviour of Cr (e.g., determined by Barnes [13] KDCrOpx/liq = 5–6) for the Upper Critical Zone, indicating the highly compatible behaviour of Cr in orthopyroxene. The Main Seam and the coarse grained Lower Split/Main Seam Transition represent outliers in the Cr versus Mg# plot, as their Cr/Mg# ratio is higher than in the remaining UG2 subunits. The Upper Split shows a slight negative deviation in Cr/Mg# ratio from the trend line. Nickel correlates well with Mg#s for the majority of UG2 subunits (10 out of 12), pointing towards a clearly compatible behaviour in orthopyroxene. This observation is supported by Beattie et al. [54], who showed a linear correlation between KDNiOpx/liq and KDMgOpx/liq. The Upper Pegmatoid is an outlier in the Ni versus Mg# plot as it shows a higher Ni/Mg# ratio than the trend line. A second outlier in this plot is the Main Seam, showing a somewhat lower Ni/Mg# ratio. Average V concentrations slightly anti-correlate with average Mg#s, revealing a rather incompatible behaviour of V in orthopyroxene. However, the scatter of data around the trend line is large, suggesting limited petrological significance. The relative variability in mean Y and Th concentrations in orthopyroxene is substantial, but there is no anti-correlation with Mg#s. Both elements are incompatible in orthopyroxene (as suggested by Gao et al. [55] for Y in gabbroic rocks and by Arnd et al. [15] for Th in pyroxenite and norite from the Upper Critical Zone). The lack of anti-correlation between Mg# and incompatible elements suggests open system behaviour, such as crystal mixing [52], magma mixing, or melt percolation [47].

4.2.4. Orthopyroxene ROI ‘Trans’/‘Core’ Ratios

An important finding of this study is that in several UG2 subunits, orthopyroxene has Cr-depleted rims. We analytically separated Cr-rich orthopyroxene (‘core’) ROI from transitional rim ROI (‘trans’) and extracted the areal extent of the contained pixels to calculate the ratio. This was done to assess whether this parameter could hold petrological potential. Figure 12 illustrates that the extent of Cr depleted ‘trans’ ROI in relation to the Cr rich ‘core’ ROI is very low for the lowermost four UG2 subunits, but increases in the Upper Split and Upper Pegmatoid. A distinct peak is reached in the Upper Distal, where the ratio becomes larger than one, showing that the areal extent of ‘trans’ ROI exceeds that of ‘core’ ROI data.

4.3. Plagioclase Sr-Isotope Data

Average 87Sr/86Srinitial ratios are within a range (0.70607 to 0.70765), similar to the data presented by Yang et al. [49] (0.7061 to 0.70751) for the Upper Critical Zone of the Western limb of the Bushveld Complex, and more importantly within the range of the data presented by Kinnaird et al. [22], including unpublished data of T. Richardson for the UG2 from the Eastern limb (0.7061–0.7075). 87Sr/86Srinitial plagioclase ratios presented by Kinnaird et al. [22] for the UG2 were highest in the chromitites, or in silicate lithologies beneath the chromitite with a significant proportion of chromite and returned to less radiogenic signatures above the chromitite. In contrast, we see a steady upward increase in average 87Sr/86Srinitial ratios from the Lower Pegmatoid (0.70607), over the Main Seam, Lower Split, Upper Split and Upper Pegmatoid that culminates in the highest 87Sr/86Srinitial ratios in the Upper Distal (0.70765), before returning to less radiogenic 87Sr/86Srinitial ratios in the HW Anorthosite (0.70645; Table 2, Figure 12). According to Seabrook et al. [52], our less radiogenic Sr istotope signatures are typical for the Critical zone (0.7060 to 0.7068), while the more radiogenic ratios in the Upper Split are of Main Zone character (> 0.7075). A notable feature of the Sr-isotope data is the variability within each sample. Some of the variability can be attributed to the analytical method, but as noted by Karykowski et al. [47], there is excess variability that reflects true isotopic heterogeneity of initial Sr-isotope ratios in Bushveld plagioclase, particularly in the Critical and Upper Zones.

5. Discussion

5.1. Diffusion

Diffusion occurs when igneous crystals aim to reach equilibrium across zones, or with adjacent minerals, melts or fluids. This process is dependent on temperature, time, concentration gradient, minerals, diffusive pathways, fO2, and SiO2 activity [56,57]. A widely accepted rule is that elements with larger radii [58] and higher charge diffuse slower, while smaller, low-charged ions diffuse more rapidly [59]. Ionic radius and charge also dictate the site into which trace elements substitute. For orthopyroxene, V (V3+ = 0.64 Å), Cr (Cr3+ = 0.615 Å) and Ni (Ni2+ = 0.69 Å) have a preference to substitute on the octahedral M1 site [60], whereas Y (Y3+ = 0.9 Å) and Th (Th4+ = 0.94 Å), due to their larger size, probably substitute into the larger M2 site.
Although the time span of emplacement of the Bushveld Complex intrusions is still debated, with estimates ranging from 75 ka [16] and less than 1 Ma [61] to > 5 Ma [62], it can safely be postulated that crystals within the complex had ample opportunity to diffusively equilibrate. The enormous volume of > 106 km3 and high emplacement temperature of 1200–1300 °C [16] entailed a prolonged cooling period, promoting diffusive equilibration. In a study of the Bellevue Core, northern limb of the Bushveld Complex, Tanner et al. [5] argued that mature cumulates in any layered intrusion are likely to be chemically re-equilibrated. These authors, however, also showed that Cr in both ortho- and clinopyroxene is able to preserve some of its primary distribution through sub-solidus processes. Their preferred evidence for slow diffusion is the observed decoupling of Cr concentration from Mg# in pyroxene and An% in plagioclase. Our maps (e.g., Figure 6) visualise the decoupling of Cr and MgO with a notable Cr depleted rim, while the MgO distribution is very homogenous. This likely reflects diffusive equilibration of Mg, while Cr largely preserved its primary magmatic distribution pattern. This interpretation is supported by experimental data [5], which shows that Mg–Fe inter-diffusion in silicates occurred on the timescales relevant to the Bushveld Complex.
From the observations in our maps we can infer that among the suite of analysed trace elements, Ni is the fastest diffusing element. Nickel has a strongly compatible behaviour in the studied setting (Figure 11B), however there are no transitional zones at the orthopyroxene crystal boundaries (Figure 13D) as expected from Cr zonations, suggesting diffusive resetting of Ni. Furthermore, Figure 14B illustrates evidence for diffusive Ni enrichment of orthopyroxene from adjacent olivine. This leads to a Ni enrichment of the defined orthopyroxene ROI. This pattern occurs repeatedly in the olivine-rich Upper Pegmatoid samples, which explains why the Upper Pegmatoid plots above the trend line in the average Ni versus Mg# plot in Figure 11.
In contrast to Ni, zonations are ubiquitous in all of the other trace element distribution maps, particularly for Y (e.g., Figure 6D) and Th (e.g., Figure 13). The distribution patterns of these incompatible elements are more complex than those of Cr and illustrate the importance of preferential element transport pathways. For example, in Figure 14C elevated Th concentrations can be seen along orthopyroxene lamellae, suggesting that the lamellae, or boundaries between them, act as fast diffusion pathways. Another interesting phenomenon is seen in Figure 14D, where an orthopyroxene halo area surrounding an enclosed clinopyroxene is depleted in Y in relation to other orthopyroxene regions. The most depleted zones seem to also follow the orientation of the orthopyroxene lamellae. These observations collectively support the findings of Qian et al. [63], who showed (albeit for olivine) that diffusion coefficients of cations do not simply follow the rule of ionic charge and radius, but are additionally controlled by the availability of diffusion pathways. Similarly, Villa et al. [64] argue on Ar diffusion studies in hornblende that planar defects enhance channelled diffusion.
In summary, for the studied UG2 succession, we conclude that among the suite of analysed trace elements, Ni is most prone to diffusive modification. This is rationalised by Ni2+ being the only divalent ion among the suite of analytes. With the exception of the 309.75b Upper Pegmatoid sample, Ni diffusion seems to have been restricted to intra-granular diffusion. Therefore, quantitative Ni data can still be used to infer magmatic processes if Ni distribution maps are observed carefully and inter-granular diffusion can be ruled out. Thorium and Y might be subject to inter-granular diffusive processes when suitable diffusive pathways and a strong concentration gradient (i.e., in contact with clinopyroxene) are present. This is likely the reason why these HFSEs do not anti-correlate with Mg#s, and conceal their incompatible behaviour. Vanadium distribution maps show little evidence for diffusive processes and Cr seems to be only affected by diffusion where concentration potentials are enormous, e.g., between chromite and orthopyroxene.

5.2. Tracing of Magmatic Processes

5.2.1. The UG2 Unit—Indications for Open Magmatic System Behaviour

The UG2 Unit belongs to the Upper Critical Zone, which is composed of eight cyclic units that constitute partial or complete sequences of chromitite-harzburgite-pyroxenite-norite-anorthosite [30]. Notwithstanding the cyclicity, it is highly unlikely that the UG2 formed as a closed magmatic system. Many previous studies have identified evidence against closed-system behaviour, in which cyclic units would have resulted from progressive crystallisation of single magma batches. This evidence includes: significant Sr-isotope variations within the UG2 Unit at Klipfontein [22] and within a succession of a cyclic unit in the UG1 footwall [65]; orthopyroxene evolving from Mg- to Fe-rich varieties with stratigraphic height in the Merensky Unit, without a matching evolution of plagioclase from calcic to more sodic compositions [66,67]; significant variations in plagioclase abundance in the Merensky Unit in different sectors of the Bushveld Complex; and an external process introducing chromite into the UG2 Unit, for example by injection of a magma to mix with the resident magma [17] or the intrusion of a chromite crystal slurry [26].
Despite these complexities, the fact remains that orthopyroxene is a relatively early crystallising phase, sensitive to the compatible element content of the magma from which it crystallises. It is, therefore, genetically more closely related to the economically important chromite than the main Sr carrier plagioclase, which is widely used as a petrogenetic tool in the Bushveld Complex (e.g., [22,24,47,52,68,69,70,71]). The chemical composition of orthopyroxene is linked to processes in the magma reservoir, including the initial filling, magma recharge, magma mixing, magma convection, flow segregation, and crystal settling [30]. In a cooling body of magma, early crystallising cumulates will deplete the residual magma in the generally highly compatible elements they incorporate, while enriching the residual liquid in the incompatible elements. As chromite and olivine are early crystallising phases in the cyclic units, these two minerals have great potential to influence the composition of consecutively crystallising orthopyroxene. Potentially, the compatible element concentration of orthopyroxene could be sensitive to the mass of chromite and olivine that was removed earlier and thereby serve as an exploration vector.
By contrast to orthopyroxene, compatible elements are not significantly taken up by plagioclase and the petrological significance of plagioclase trace element and Sr-isotope geochemistry maybe less sensitive to the crystallisation of chromite. Differences in Sr-isotope compositions of co-existing plagioclase and orthopyroxene in the Critical Zone [70] clearly argue for an open-system, requiring either mixing of magma and/or crystals from different portions of the magma chamber [52], or percolation of an isotopically different liquid through a stagnant crystal mush [47]. Combining trace element patterns of orthopyroxene and the Sr isotope signatures of plagioclase across the UG2 subunits, we also find ample evidence against in situ crystallisation of UG2 subunits from a common magma pulse. The following discussion highlights the complexity of magmatic systems, even at the small scale of the UG2 interval.
In Figure 11A,B the highly compatible behaviour of Cr and Ni in orthopyroxene is demonstrated by the majority of data defining the correlation trend lines. Disturbance of this behaviour is recorded in the Main Seam and the Main Seam/Lower Split Transition showing elevated Cr/Mg# ratios, and the Upper Split showing decreased Cr/Mg# ratios in Figure 11A. Additionally, the Ni/Mg# plot in Figure 11B reveals two outliers: the Upper Pegmatoid being elevated, and the Main Seam being low in Ni/Mg# ratios. The Upper Pegmatoid most likely recorded diffusive Ni enrichment from olivine as previously discussed. The remaining outlier cannot be explained by closed-system crystallisation in an isolated chamber, and the decoupling of Cr and Ni from Mg strongly suggests an open magmatic system. Open-system behaviour is also supported by the relatively Cr-poor rims that are most prevalent in the Upper Distal orthopyroxenes. This clear evidence for an external influence into the system is supported by the Sr-isotope excursion in the Upper Distal subunit (Figure 12), where 87Sr/86Srinitial ratios are distinctly higher than in the remaining UG2 subunits. This does not support the proposal of Voordouw and Beukes [34], stating that the Upper Distal, the Upper Pegmatoid, the Upper Split and the Lower Pegmatoid formed from the same parental magma.
The coincidence of radiogenic Sr-isotope ratios in plagioclase and Cr-poor orthopyroxene rims could have resulted in several ways. One scenario could be percolation of a compatible-element depleted and incompatible element-enriched melt of crustal isotopic affinity through a stagnant chromite-olivine-orthopyroxene mush, displacing the resident melt. Alternatively, the Upper Distal Subunit could have witnessed the downward incursion of a Transition Zone magma with a significant cargo of plagioclase. We found Th-enriched rims uniquely on orthopyroxene from the Upper Distal (Figure 13). This observation argues against strict crystal mush mixing [52] as the continued growth of significantly sized orthopyroxene rims indicates the presence of a chemically distinct liquid. Plagioclase, being intercumulus in the Upper Distal (see ‘Sample Descriptions’ in the supplementary materials), additionally argues against crystal mixing and in favour of melt addition to a crystal mush.

5.2.2. Implications for the Formation of Chromite Rich Subunits

A detailed interpretation of the origin of the chromitites is not warranted because in the Leader Seam sample, orthopyroxene is altered to cryptocrystalline material, unsuitable for trace element analysis and plagioclase crystals are too small to be analysed by spot LA-MC-ICP-MS. Nonetheless, it is obvious (Figure 10) that orthopyroxene in the chromite-bearing Upper Split (~17 modal % chromite) and the Main Seam chromitite is highest in Mg# and lowest in V. Average V concentrations slightly anti-correlate with average Mg#s, suggesting a rather incompatible behaviour of V in orthopyroxene. The formation of orthopyroxene in these two subunits is potentially related to a liquid that was more primitive (high Mg#) in character than the resident magma and/or orthopyroxene crystals could have been transported together with chromite from a different area in the magma chamber where the prevailing liquid was more primitive.
The Upper Split deviates from the trend line in Figure 11A, showing a decreased Cr/Mg# ratio in orthopyroxene. The low Cr/Mg# ratio in orthopyroxene most plausibly reflects co-crystallisation of orthopyroxene and chromite, which is also supported by petrographic observations. Co-crystallisation can also explain the lowest V content in Upper Split orthopyroxene because it was e.g., shown by Canil [60] that both V3+ and Cr3+ strongly partition into spinel in a silicate melt, coexisting with orthopyroxene and spinel. By contrast, the Main Seam and the Main Seam/Lower Split Transition Zone display highly elevated Cr/Mg# ratios. In the Main Seam, poikilitic orthopyroxene is surrounding chromite crystals, strongly suggesting that there, chromite crystallised prior to orthopyroxene. The fact that orthopyroxene in the Main Seam is not similarly depleted in Cr as in the Upper Split, but highly enriched, leads to the proposal that in the Main Seam and its transition zone, orthopyroxene did not crystallise from the same liquid as associated chromite crystals. Thus, the low V contents in Main Seam orthopyroxene cannot be explained by depletion of the melt through chromite crystallisation. The Main Seam shows another unique characteristic in being the only subunit that plots below the orthopyroxene Ni/Mg# trend line in Figure 11B, suggesting that the liquid from which orthopyroxene formed in the Main Seam had experienced Ni depletion, potentially via earlier olivine crystallisation. This further implies that orthopyroxene in the Upper Split and in the Main Seam formed in different petrological contexts.

6. Conclusions

For the current sample set, obtaining quantitative data from trace element maps was found advantageous over spot analyses. Selecting the ‘ROI from chemical criteria’ option in ‘Monocle’ enables the gathering of statistically significant data when criteria are selected with the aid of detailed microscopy and/or SEM characterisation of samples. For the examined suite of mafic-ultramafic rocks, containing variable proportions of orthopyroxene, olivine, chromite, clinopyroxene or plagioclase; the following chemical thresholds were regarded suitable to filter orthopyroxene data from semi-quantitative maps:
  • A lower Cr limit (e.g., Cr > 100 ppm) to exclude plagioclase and olivine;
  • An upper Cr limit (e.g., Cr < 4000 ppm) to exclude chromite plus associated halos;
  • An upper Y limit (e.g., Y < 6 ppm) to exclude clinopyroxene.
These limits might vary for other geological settings and mineral assemblages, and might not be applicable if further accessory phases are present. Therefore, a careful pre-characterisation of the mineral assemblages is vital.
The homogenous Mg distribution in orthopyroxene in the studied sample set seems to be the result of rapid diffusive equilibration. Nickel appears to be the fastest diffusing trace element, although inter-granular diffusion is rare. Chromium and V largely tend to retain their primary distribution. Interestingly, elements of high charge and radius (Th and Y) seem able to diffuse in the presence of suitable diffusive pathways, indicated by concentration anomalies along orthopyroxene lamellae.
Multiple lines of evidence argue in favour of the UG2 Unit representing a fossil open magmatic system. The most critical observations include:
  • Decoupling of the compatible elements (Cr and Ni) from Mg# variations in orthopyroxene from some UG2 subunits;
  • Distinct Mg# peaks along with negative V deviations in orthopyroxene from chromite-bearing subunits (Main Seam and Upper Split);
  • A clear 87Sr/86Srinitial excursion in Upper Distal plagioclase to more radiogenic ratios, coinciding with extensive Cr-depleted and Th-enriched rims of orthopyroxene.
The open system nature of the studied UG2 section cannot be explained by mixing of minerals alone, but must have involved at least two, but more likely three batches of melt. One batch was dominant and possibly resident. This produced the coherent array of orthopyroxenes that define the strong linear trend in Mg# versus Cr concentration. A second batch was Cr rich and shows evidence for Ni depletion, potentially via earlier olivine crystallisation. A final batch of magma may have displaced the remaining resident melt and led to the formation of Th-enriched, Cr-poor orthopyroxene rims and intercumulus plagioclase with more radiogenic 87Sr/86Srinitial ratios in the Upper Distal subunit.

Supplementary Materials

The following are available online at https://www.mdpi.com/2075-163X/9/2/73/s1, Figure S1: Clinopyroxene exsolution lamellae in orthopyroxene (sample 310.90a). Figure S2: Semi-quantitative Y distribution maps of Map area 2 on sample 309.75b with various lower Y limits and an upper Y limit of 7 ppm. Table S1: Sample list. Table S2: Conditions of the microprobe pyroxene analysis. Table S3: Characteristic parameters for LA-ICP-MS mapping experiments. Table S4: Typical laser parameters of the experiments for different LA-MS connection devices and maps sizes. ARIS (Aerosol Rapid Introduction System, Van Acker, Van Malderen, Van Heerden, McDuffie, Cuyckens and Vanhaecke [39]). Table S5: Comparison of BCR-2G reference standard material analyses and preferred values (GeoRem). Table S6: Internal errors and LODs of analysed trace elements. Table S7: Trace element data for orthopyroxene ‘core’ ROI. Table S8: Major element concentrations of orthopyroxene, En (enstatite), Fs (ferrosilite), and Wo (wollastonite) components. Sample Descriptions: Detailed petrographic descriptions of analysed samples.

Author Contributions

I.C.K. and R.S. did the sampling, B.S.K., M.B. and I.C.K. largely conceived and designed the experiments, M.B. performed the experiments, M.B., T.U., B.S.K. and I.C.K. analysed the data. M.B., T.U. and B.S.K. contributed to the writing, and all authors to the revising of the manuscript.

Funding

This research was partly supported by the Science Foundation Ireland (SFI; Grant Number 13/RC/2092) and co-funded under the European Regional Development Fund and by iCRAG industry partners.

Acknowledgments

We thank Cora A. McKenna (Trinity College Dublin, Ireland) for her continued support in LA-ICP-MS mapping and for constructive technical discussions. We are very grateful for access to the EMPA facilities at the University of Tübingen and want to thank Thomas Wenzel for his guidance and support. Kerstin Drost is thanked for the help with the LA-MC-ICP-MS analysis. I.C.K. and R.S. would like to thank African Rainbow Minerals (ARM) for allowing access to drill core BH8039 during a University of Tübingen sampling campaign and are grateful to Juan Coetzee and Jabulani Khumalo for the support during sample selection. Finally, we would like to thank Alexey Ivanov for the editorial handling and the three anonymous referees for their helpful reviews, which improved the quality of the manuscript.

Conflicts of Interest

The authors declare no conflict of interest.

References

  1. Fryer, B.J.; Jackson, S.E.; Longerich, H.P. The design, operation and role of the laser-ablation microprobe coupled with an inductively coupled plasma; mass spectrometer (LAM-ICP-MS) in the earth sciences. Can. Mineral. 1995, 33, 303–312. [Google Scholar]
  2. Günther, D.; Hattendorf, B. Solid sample analysis using laser ablation inductively coupled plasma mass spectrometry. TrAC Trends Anal. Chem. 2005, 24, 255–265. [Google Scholar] [CrossRef]
  3. Kamber, B.S. Geochemical fingerprinting: 40 years of analytical development and real world applications. Appl. Geochem. 2009, 24, 1074–1086. [Google Scholar] [CrossRef]
  4. Cook, N.; Ciobanu, C.L.; George, L.; Zhu, Z.-Y.; Wade, B.; Ehrig, K. Trace element analysis of minerals in magmatic-hydrothermal ores by laser ablation inductively-coupled plasma mass spectrometry: Approaches and opportunities. Minerals 2016, 6, 111. [Google Scholar] [CrossRef]
  5. Tanner, D.; Mavrogenes, J.A.; Arculus, R.J.; Jenner, F.E. Trace element stratigraphy of the Bellevue Core, Northern Bushveld: Multiple magma injections obscured by diffusive processes. J. Petrol. 2014, 55, 859–882. [Google Scholar] [CrossRef]
  6. Ulrich, T.; Kamber, B.S.; Jugo, P.J.; Tinkham, D.K. Imaging element-distribution patterns in minerals by laser ablation–inductively coupled plasma–mass spectrometry (LA–ICP–MS). Can. Mineral. 2009, 47, 1001–1012. [Google Scholar] [CrossRef]
  7. Ubide, T.; McKenna, C.A.; Chew, D.M.; Kamber, B.S. High-resolution LA-ICP-MS trace element mapping of igneous minerals: In search of magma histories. Chem. Geol. 2015, 409, 157–168. [Google Scholar] [CrossRef]
  8. Griffin, W.L.; Smith, D.; Ryan, C.G.; O’Reilly, S.Y.; Win, T.T. Trace-element zoning in mantle minerals; metasomatism and thermal events in the upper mantle. Can. Mineral. 1996, 34, 1179–1193. [Google Scholar]
  9. Van Orman, J.A.; Grove, T.L.; Shimizu, N. Diffusive fractionation of trace elements during production and transport of melt in Earth’s upper mantle. Earth Planet. Sci. Lett. 2002, 198, 93–112. [Google Scholar] [CrossRef]
  10. Blundy, J.; Wood, B. Partitioning of trace elements between crystals and melts. Earth Planet. Sci. Lett. 2003, 210, 383–397. [Google Scholar] [CrossRef]
  11. Petrus, J.; Chew, D.; Leybourne, M.; Kamber, B. A new approach to laser-ablation inductively-coupled-plasma mass-spectrometry (LA-ICP-MS) using the flexible map interrogation tool ‘Monocle’. Chem. Geol. 2017, 463, 76–93. [Google Scholar] [CrossRef]
  12. Ubide, T.; Kamber, B.S. Volcanic crystals as time capsules of eruption history. Nat. Commun. 2018, 9, 326. [Google Scholar] [CrossRef] [PubMed] [Green Version]
  13. Barnes, S.J. The distribution of chromium among orthopyroxene, spinel and silicate liquid at atmospheric pressure. Geochim. Cosmochim. Acta 1986, 50, 1889–1909. [Google Scholar] [CrossRef]
  14. Cawthorn, R.G. Cr and Sr: Keys to parental magmas and processes in the Bushveld Complex, South Africa. Lithos 2007, 95, 381–398. [Google Scholar] [CrossRef]
  15. Arndt, N.; Jenner, G.; Ohnenstetter, M.; Deloule, E.; Wilson, A.H. Trace elements in the Merensky Reef and adjacent norites Bushveld complex South Africa. Mineralium Deposita 2005, 40, 550–575. [Google Scholar] [CrossRef]
  16. Cawthorn, R.G.; Walraven, F. Emplacement and crystallization time for the Bushveld Complex. J. Petrol. 1998, 39, 1669–1687. [Google Scholar] [CrossRef]
  17. Irvine, T. Origin of chromitite layers in the Muskox intrusion and other stratiform intrusions: A new interpretation. Geology 1977, 5, 273–277. [Google Scholar] [CrossRef]
  18. Irvine, T. Crystallization sequences in the Muskox intrusion and other layered intrusions—II. Origin of chromitite layers and similar deposits of other magmatic ores. Geochim. Cosmochim. Acta 1975, 39, 991–1020. [Google Scholar] [CrossRef]
  19. Scoon, R.N.; Teigler, B. Platinum-group element mineralization in the critical zone of the western Bushveld Complex; I, Sulfide poor-chromitites below the UG-2. Econ. Geol. 1994, 89, 1094–1121. [Google Scholar] [CrossRef]
  20. Maier, W.; Eales, H. Facies model for interval between UG 2 and Merensky Reef, Western Bushveld Complex, South Africa. Trans. Inst. Min. Metall. Sect. B Appl. Earth Sci. 1994, 103, B22–B30. [Google Scholar]
  21. Eales, H. Implications of the chromium budget of the Western Limb of the Bushveld Complex. S. Afr. J. Geol. 2000, 103, 141–150. [Google Scholar] [CrossRef]
  22. Kinnaird, J.; Kruger, F.; Nex, P.; Cawthorn, R. Chromitite formation—A key to understanding processes of platinum enrichment. Appl. Earth Sci. 2002, 111, 23–35. [Google Scholar] [CrossRef]
  23. Mathez, E.; Mey, J. Character of the UG2 chromitite and host rocks and petrogenesis of its pegmatoidal footwall, northeastern Bushveld Complex. Econ. Geol. 2005, 100, 1617–1630. [Google Scholar] [CrossRef]
  24. Mondal, S.K.; Mathez, E.A. Origin of the UG2 chromitite layer, Bushveld Complex. J. Petrol. 2007, 48, 495–510. [Google Scholar] [CrossRef]
  25. Maier, W.; Barnes, S.-J. Platinum-group elements in the UG1 and UG2 chromitites, and the Bastard reef, at Impala platinum mine, western Bushveld Complex, South Africa: Evidence for late magmatic cumulate instability and reef constitution. S. Afr. J. Geol. 2008, 111, 159–176. [Google Scholar] [CrossRef] [Green Version]
  26. Voordouw, R.; Gutzmer, J.; Beukes, N.J. Intrusive origin for upper group (UG1, UG2) stratiform chromitite seams in the Dwars River area, Bushveld Complex, South Africa. Mineral. Petrol. 2009, 97, 75–94. [Google Scholar] [CrossRef]
  27. Cawthorn, R. Geological interpretations from the PGE distribution in the Bushveld Merensky and UG2 chromitite reefs. J. South. Afr. Inst. Min. Metall. 2011, 111, 67–79. [Google Scholar]
  28. Naldrett, A.; Wilson, A.; Kinnaird, J.; Yudovskaya, M.; Chunnett, G. The origin of chromitites and related PGE mineralization in the Bushveld Complex: New mineralogical and petrological constraints. Mineralium Deposita 2012, 47, 209–232. [Google Scholar] [CrossRef]
  29. Junge, M.; Oberthür, T.; Melcher, F. Cryptic variation of chromite chemistry, platinum group element and platinum group mineral distribution in the UG-2 chromitite: An example from the Karee Mine, western Bushveld Complex, South Africa. Econ. Geol. 2014, 109, 795–810. [Google Scholar] [CrossRef]
  30. Eales, H.; Cawthorn, R. The Bushveld Complex. In Layered Intrusions; Cawthorn, R., Ed.; Elsevier: Amsterdam, The Netherlands, 1996; Volume 15, pp. 181–229. [Google Scholar]
  31. Cawthorn, R.G. The Bushveld Complex. In Geology of South Africa; Johnsson, M.R., Anhaeusser, C.R., Thomas, R.J., Eds.; Geological Society of South Africa: Johannesburg, South Africa, 2006; pp. 261–281. [Google Scholar]
  32. Willemse, J. The geology of the Bushveld Igneous Complex, the largest repository of magmatic ore deposits in the world. Econ. Geol. Monogr. 1969, 4, 1–22. [Google Scholar]
  33. Zientek, M.L.; Causey, J.D.; Parks, H.L.; Miller, R.J. Platinum-Group Elements in Southern Africa: Mineral Inventory and an Assessment of Undiscovered Mineral Resources: Chapter Q in Global Mineral Resource Assessment; 2328-0328; US Geological Survey: Reston, VA, USA, 2014.
  34. Voordouw, R.; Beukes, N. Alteration and metasomatism of the UG2 melanorite and its stratiform pegmatoids, Bushveld Complex, South Africa; characteristics, timing and origins. S. Afr. J. Geol. 2009, 112, 47–64. [Google Scholar] [CrossRef]
  35. Jarosewich, E. Smithsonian microbeam standards. J. Res. Natl. Inst. Stand. Technol. 2002, 107, 681–685. [Google Scholar] [CrossRef] [PubMed]
  36. Tomlinson, E.L.; Kamber, B.S.; Hoare, B.C.; Stead, C.V.; Ildefonse, B. An exsolution origin for Archean mantle garnet. Geology 2017, 46, 123–126. [Google Scholar] [CrossRef]
  37. Jochum, K.P.; Weis, U.; Stoll, B.; Kuzmin, D.; Yang, Q.; Raczek, I.; Jacob, D.E.; Stracke, A.; Birbaum, K.; Frick, D.A. Determination of reference values for NIST SRM 610–617 glasses following ISO guidelines. Geostand. Geoanal. Res. 2011, 35, 397–429. [Google Scholar] [CrossRef]
  38. Wilson, S. The Collection, Preparation and Testing of USGS Reference Material BCR-2, Columbia River Basalt: US Geol; Survey Open-File Report; US Geological Survey: Reston, VA, USA, 1997.
  39. Van Acker, T.; Van Malderen, S.J.; Van Heerden, M.; McDuffie, J.E.; Cuyckens, F.; Vanhaecke, F. High-resolution laser ablation-inductively coupled plasma-mass spectrometry imaging of cisplatin-induced nephrotoxic side effects. Anal. Chim. Acta 2016, 945, 23–30. [Google Scholar] [CrossRef] [PubMed] [Green Version]
  40. Paton, C.; Hellstrom, J.; Paul, B.; Woodhead, J.; Hergt, J. Iolite: Freeware for the visualisation and processing of mass spectrometric data. J. Anal. Atom. Spectrom. 2011, 26, 2508–2518. [Google Scholar] [CrossRef]
  41. WaveMetrics. Igor Pro. Available online: http://www.wavemetrics.com/Products/IGORPro (accessed on 1 April 2016).
  42. Woodhead, J.D.; Hellstrom, J.; Hergt, J.M.; Greig, A.; Maas, R. Isotopic and elemental imaging of geological materials by laser ablation inductively coupled plasma-mass spectrometry. Geostand. Geoanal. Res. 2007, 31, 331–343. [Google Scholar] [CrossRef]
  43. Ulrich, T.; Long, D.; Kamber, B.; Whitehouse, M. In situ trace element and sulfur isotope analysis of pyrite in a paleoproterozoic gold placer deposit, Pardo and Clement Townships, Ontario, Canada. Econ. Geol. 2011, 106, 667–686. [Google Scholar] [CrossRef]
  44. Gao, S.; Liu, X.; Yuan, H.; Hattendorf, B.; Günther, D.; Chen, L.; Hu, S. Determination of forty two major and trace elements in USGS and NIST SRM glasses by laser ablation-inductively coupled plasma-mass spectrometry. Geostand. Geoanal. Res. 2002, 26, 181–196. [Google Scholar] [CrossRef]
  45. De Laeter, J.R.; Böhlke, J.K.; De Bièvre, P.; Hidaka, H.; Peiser, H.; Rosman, K.; Taylor, P. Atomic weights of the elements. Review 2000 (IUPAC Technical Report). Pure Appl. Chem. 2003, 75, 683–800. [Google Scholar] [CrossRef] [Green Version]
  46. Nebel, O.; Scherer, E.E.; Mezger, K. Evaluation of the 87Rb decay constant by age comparison against the U–Pb system. Earth Planet. Sci. Lett. 2011, 301, 1–8. [Google Scholar] [CrossRef] [Green Version]
  47. Karykowski, B.T.; Yang, S.-H.; Maier, W.D.; Lahaye, Y.; Lissenberg, C.J.; O’Brien, H. In situ Sr isotope compositions of plagioclase from a complete stratigraphic profile of the Bushveld Complex, South Africa: Evidence for extensive magma mixing and percolation. J. Petrol. 2017, 58, 2285–2308. [Google Scholar] [CrossRef]
  48. Rankenburg, K.; Lassiter, J.; Brey, G. Origin of megacrysts in volcanic rocks of the Cameroon volcanic chain–constraints on magma genesis and crustal contamination. Contrib. Mineral. Petrol. 2004, 147, 129–144. [Google Scholar] [CrossRef]
  49. Yang, S.-H.; Maier, W.D.; Lahaye, Y.; O’Brien, H. Strontium isotope disequilibrium of plagioclase in the Upper Critical Zone of the Bushveld Complex: Evidence for mixing of crystal slurries. Contrib. Mineral. Petrol. 2013, 166, 959–974. [Google Scholar] [CrossRef]
  50. Cameron, E.N. The upper critical zone of the eastern Bushveld Complex; precursor of the Merensky Reef. Econ. Geol. 1982, 77, 1307–1327. [Google Scholar] [CrossRef]
  51. Schurmann, L. The Geochemistry and Petrology of the Upper Critical Zone in the Boshoek Section, of the Western Bushveld Complex; Bulletin; Geological Survey of South Africa: Johannesburg, South Africa, 1993; Volume 113, p. 88. [Google Scholar]
  52. Seabrook, C.L.; Cawthorn, R.G.; Kruger, F.J. The Merensky Reef, Bushveld Complex: Mixing of minerals not mixing of magmas. Econ. Geol. 2005, 100, 1191–1206. [Google Scholar] [CrossRef]
  53. Poldervaart, A.; Hess, H.H. Pyroxenes in the crystallization of basaltic magma. J. Geol. 1951, 59, 472–489. [Google Scholar] [CrossRef]
  54. Beattie, P.; Ford, C.; Russell, D. Partition coefficients for olivine-melt and orthopyroxene-melt systems. Contrib. Mineral. Petrol. 1991, 109, 212–224. [Google Scholar] [CrossRef]
  55. Gao, Y.; Hoefs, J.; Hellebrand, E.; von der Handt, A.; Snow, J.E. Trace element zoning in pyroxenes from ODP Hole 735B gabbros: Diffusive exchange or synkinematic crystal fractionation? Contrib. Mineral. Petrol. 2007, 153, 429–442. [Google Scholar] [CrossRef]
  56. Costa, F.; Dohmen, R.; Chakraborty, S. Time scales of magmatic processes from modeling the zoning patterns of crystals. Rev. Mineral. Geochem. 2008, 69, 545–594. [Google Scholar] [CrossRef]
  57. Chakraborty, S. Diffusion in solid silicates: A tool to track timescales of processes comes of age. Annu. Rev. Earth Planet. Sci. 2008, 36, 153–190. [Google Scholar] [CrossRef]
  58. Shannon, R.t. Revised effective ionic radii and systematic studies of interatomic distances in halides and chalcogenides. Acta Crystallogr. Sect. A Cryst. Phys. Diffr. Theor. Gen. Crystallogr. 1976, 32, 751–767. [Google Scholar] [CrossRef] [Green Version]
  59. Brady, J.B.; Cherniak, D.J. Diffusion in minerals: An overview of published experimental diffusion data. Rev. Mineral. Geochem. 2010, 72, 899–920. [Google Scholar] [CrossRef]
  60. Canil, D. Vanadium partitioning between orthopyroxene, spinel and silicate melt and the redox states of mantle source regions for primary magmas. Geochim. Cosmochim. Acta 1999, 63, 557–572. [Google Scholar] [CrossRef]
  61. Zeh, A.; Ovtcharova, M.; Wilson, A.H.; Schaltegger, U. The Bushveld Complex was emplaced and cooled in less than one million years—Results of zirconology, and geotectonic implications. Earth Planet. Sci. Lett. 2015, 418, 103–114. [Google Scholar] [CrossRef]
  62. Scoates, J.S.; Friedman, R.M. Precise age of the platiniferous Merensky Reef, Bushveld Complex, South Africa, by the U-Pb zircon chemical abrasion ID-TIMS technique. Econ. Geol. 2008, 103, 465–471. [Google Scholar] [CrossRef]
  63. Qian, Q.; O’Neill, H.S.C.; Hermann, J. Comparative diffusion coefficients of major and trace elements in olivine at ∼950°C from a xenocryst included in dioritic magma. Geology 2010, 38, 331–334. [Google Scholar] [CrossRef]
  64. Villa, I.M.; Grobéty, B.; Kelley, S.; Trigila, R.; Wieler, R. Assessing Ar transport paths and mechanisms in the McClure Mountains hornblende. Contrib. Mineral. Petrol. 1996, 126, 67–80. [Google Scholar] [CrossRef]
  65. Eales, H.; De Klerk, W.; Butcher, A.; Kruger, F. The cyclic unit beneath the UG1 chromitite (UG1FW unit) at RPM union section platinum mine—Rosetta stone of the Bushveld upper critical zone. Mineral. Mag. 1990, 54, 23–43. [Google Scholar] [CrossRef]
  66. Naldrett, A.J.; Gasparrini, E.; Barnes, S.J.; Von Gruenewaldt, G.; Sharpe, M. The Upper Critical Zone of the Bushveld Complex and the origin of Merensky-type ores. Econ. Geol. 1986, 81, 1105–1117. [Google Scholar] [CrossRef]
  67. Eales, H.; Botha, W.; Hattingh, P.; De Klerk, W.; Maier, W.; Odgers, A. The mafic rocks of the Bushveld Complex: A review of emplacement and crystallization history, and mineralization, in the light of recent data. J. Afr. Earth Sci. (Middle East) 1993, 16, 121–142. [Google Scholar] [CrossRef]
  68. Kruger, F.; Marsh, J. Significance of 87Sr/86Sr ratios in the Merensky cyclic unit of the Bushveld Complex. Nature 1982, 298, 53–55. [Google Scholar] [CrossRef]
  69. Cawthorn, R.G.; Ashwal, L.D. Origin of anorthosite and magnetitite layers in the Bushveld Complex, constrained by major element compositions of plagioclase. J. Petrol. 2009, 50, 1607–1637. [Google Scholar] [CrossRef]
  70. Chutas, N.; Bates, E.; Prevec, S.; Coleman, D.; Boudreau, A. Sr and Pb isotopic disequilibrium between coexisting plagioclase and orthopyroxene in the Bushveld Complex, South Africa: Microdrilling and progressive leaching evidence for sub-liquidus contamination within a crystal mush. Contrib. Mineral. Petrol. 2012, 163, 653–668. [Google Scholar] [CrossRef]
  71. Wilson, A.H.; Zeh, A.; Gerdes, A. In situ Sr isotopes in plagioclase and trace element systematics in the lowest part of the Eastern Bushveld Complex: Dynamic processes in an evolving magma Chamber. J. Petrol. 2017, 58, 327–360. [Google Scholar] [CrossRef]
Figure 1. (A) Location map of the Bushveld Complex (BC) in South Africa. (B) Geological map that shows the distribution of the Rustenburg Layered Suite along with felsic units (Lebowa, Rashoop and Rooiberg) within the Bushveld Complex. (C) Geological map of the Eastern limb of the Bushveld Complex. The red box indicates the location of the sampling site at the Two Rivers Platinum (TRP) Mine. Modified after Voordouw and Beukes [34].
Minerals 09 00073 g001
Figure 2. (A) Stratigraphic column of the Rustenburg Layered Suite. The colour scheme corresponds to Figure 1C. (B) Stratigraphic column of the Upper Critical Zone at the Two Rivers Platinum Mine (based on thicknesses given by [31]). The stratigraphy from the UG2 upwards, marked by an attached depth scale, is adapted on the basis of the core log from drill core BH8039, provided by African Rainbow Minerals. (C) Detailed schematic stratigraphy of the subunits of the UG2, as given by the core log from drill core BH8039 and named following the study of Voordouw and Beukes [34]. The indicated depth scales correspond to the actual depth of the drill core BH8039 below surface. Modified after Voordouw and Beukes [34].
Minerals 09 00073 g002
Figure 3. Modal abundance of primary mineral phases and cryptocrystalline matrix in the UG2 subunits, determined by point counting on thin section samples. For sample 310.90a, which contains the contact zone of the Main Seam and the Lower Split (Figure 4C), the mode was determined for each of the two subunits individually (marked by two asterisks). Chromite (Chr), orthopyroxene (Opx), clinopyroxene (Cpx), olivine (Ol), plagioclase (Pl), cryptocrystalline matrix (Crypt. Matrix).
Minerals 09 00073 g003
Figure 4. Drill core and related cross-polarised (xpl) thin section images of chromitite layers and associated silicate UG2 subunit contact zones. Scale bar in (A) applies to (BD); scale bar in (C1) applies to (D1) and (D2). High interference colours result from thin section thicknesses > 35 µm. (A) Main Seam–Lower Pegmatoid transition; (B), (C) Main Seam–Lower Split contact; (C1) xpl thin section image of Main Seam–Lower Split contact, sample 310.90a; (D) Leader Seam–Upper Split transition; (D1) xpl thin section image of Leader Seam, sample 310.00a; (D2) xpl thin section image of Leader Seam–Upper Split transition, sample 310.00b.
Minerals 09 00073 g004
Figure 5. Cross-polarised photomicrographs of (A) Poikilitic Main Seam chromitite, sample 310.90a; plagioclase oikocrysts enclosing chromite crystals. (B) Leader Seam chromitite, sample 310.00a; a fine chromite fraction is associated with an interstitial cryptocrystalline matrix. (C) Leader Seam chromitite, sample 310.00a; densely packed accumulations of relatively coarse chromite crystals.
Minerals 09 00073 g005
Figure 6. (A) Backscattered electron image of Upper Pegmatoid, sample 309.75a. Chr (chromite), Opx (orthopyroxene), Ol (olivine), Alt (secondary alteration phases); (B) Semi-quantitative Cr distribution map, obtained by LA-ICP-MS; (C) Magnesium distribution map obtained by SEM-EDX. White numbers represent MgO wt. % concentration in orthopyroxene; (D) Semi-quantitative Y distribution map, obtained by (LA-ICP-MS).
Minerals 09 00073 g006
Figure 7. (A) Cross polarised microscope image, sample 309.75b, Upper Pegmatoid, Opx (orthopyroxene), Ol (olivine), Pl (plagioclase), Cpx (clinopyroxene); (B) semi-quantitative Cr distribution map; (C) semi-quantitative Y distribution map; (D) grey ROI with criterion: Cr > 100 ppm superimposed on map (B); (E) green ROI ‘rim’ with criterion: 100 ppm < Cr < 1500 ppm and grey ROI ‘core’ with criterion: Cr > 1500 ppm superimposed on map (B); (F) green regions of interest (ROI) with criterion: 100 ppm < Cr < 1500 ppm and grey ROI with Criteria: Cr > 1500 ppm, Y < 6 ppm superimposed on map (B).
Minerals 09 00073 g007
Figure 8. (A) Plane polarised microscope image of area 1 on sample 310.00b, Upper Split; (B) Semi-quantitative Cr distribution map of area 1 on sample 310.00b; (C) grey ROI with criteria: 1500 ppm < Cr < 4000 ppm; (D) grey ROI with criteria: 1500 ppm < Cr < 6000 ppm.
Minerals 09 00073 g008
Figure 9. Semi-quantitative trace element maps of sample 309.75b, Upper Pegmatoid. (A) Cr-, (B) V-, (C) Ni- and (D) Y distribution maps. The upper boundaries of the concentration intervals were adapted to bring either orthopyroxene or clinopyroxene in the blue (lower) concentration interval and compare the colours of the second pyroxene mineral across different element maps. Thereby relative concentration differences are illustrated. The contrast in relative concentration between orthopyroxene and clinopyroxene is highest in Y compared to V and Cr (relative difference Y > V > Cr > Ni; see composition of circular ROI defined in (D) on Table 1), therefore Y is the best choice to exclude clinopyroxene from orthopyroxene.
Minerals 09 00073 g009
Figure 10. Chemostratigraphy of trace element concentrations extracted from orthopyroxene ‘core’ ROI, along with Mg#s and modal mineral abundances across the UG2 Unit, as well as its footwall and hangingwall in the studied drill core. Internal 2SE errors are within the symbol size. There are no chemical data for the Leader Seam because of the lack of orthopyroxene. Chr (chromite), Opx (orthopyroxene), Pl (plagioclase), Ol (olivine), Cpx (clinopyroxene), Crypt. Matrix (crypto-crystalline matrix).
Minerals 09 00073 g010
Figure 11. Average trace element concentrations of orthopyroxene ‘core’ ROI versus average Mg#s for each sampled depth interval. Outliers, which were rejected in the trend line fit, are highlighted in red. (A) Chromium/Mg# plot; (B) Nickel/Mg# plot; (C) Vanadium/Mg# plot; (D) Yttrium/Mg# plot; (E) Thorium/Mg# plot.
Minerals 09 00073 g011
Figure 12. Ratios of the areas defined as ‘trans’ and ‘core’ orthopyroxene ROI (left). 87Sr/86Srinitial ratios of plagioclase (right); the indicated 2SD error (±0.00006) is valid for all 87Sr/86Srinitial ratios and was obtained through repeated analysis of plagioclase standard MIR a (n = 84).
Minerals 09 00073 g012
Figure 13. (A) Plane polarised photomicrograph of sample 308.90, Upper Distal; Pl (plagioclase), Opx (orthopyroxene); (B) Semi-quantitative Cr distribution map; (C) Semi-quantitative V distribution map; (D) Semi-quantitative Ni distribution map; (E) Semi-quantitative Y distribution map; (F) Semi-quantitative Th distribution map; With the exception of Ni, zonation patterns are present in all trace element distribution maps.
Minerals 09 00073 g013
Figure 14. (A) Cross polarised photomicrograph of sample 309.75b, Upper Pegmatoid; Opx (orthopyroxene), Cpx (clinopyroxene), Ol (olivine), Pl (plagioclase); (B) Semi-quantitative Ni distribution map. Ni diffusion occurs in proximity to olivine; (C) Semi-quantitative Th distribution map with Th diffusion along orthopyroxene lamellae; (D) Semi-quantitative Y distribution map with Y depletion in orthopyroxene in proximity to clinopyroxene.
Minerals 09 00073 g014
Table 1. Comparison of the trace element inventory between two circular ROI on clinopyroxene and orthopyroxene; locations indicated in Figure 9D). Relative concentration difference is greatest for Y compared to Cr, V and Ni.
Semi-QuantCr (ppm)±2SEV (ppm)±2SEY (ppm)±2SENi (ppm)±2SE
Cpx3316392383.111.30.163476.3
Opx1737151021.01.80.025975.6
Rel. Diff.1.91 2.33 6.28 0.58 (1.72)
Table 2. Mean 87Sr/86Srinitial ratios of plagioclase.
Sample IDSubunitMean 87Sr/86Srinitial ± 2SD
307.00HW Anorthosite0.70645 ± 0.00016
308.90Upper Distal0.70765 ± 0.00021
309.75bUpper Pegmatoid0.70661 ± 0.00020
310.00aLeader SeamN/A
310.00bUpper Split0.70637 ± 0.00028
310.90aLower Split0.70627 ± 0.00015
310.90aMain Seam0.70623 ± 0.00014
313.25Lower Pegmatoid0.70607 ± 0.00024
314.10bFW Norite0.70626 ± 0.00030

