Article

Determination of Au(III) and Ag(I) in Carbonaceous Shales and Pyrites by Stripping Voltammetry

1
Department of Chemical Engineering, Tomsk Polytechnic University, Tomsk 634050, Russia
2
Innovation and Technology Centre of Siberian Physical and Technical Institute, Tomsk State University, Tomsk 634050, Russia
*
Authors to whom correspondence should be addressed.
Minerals 2019, 9(2), 78; https://doi.org/10.3390/min9020078
Submission received: 22 December 2018 / Revised: 23 January 2019 / Accepted: 26 January 2019 / Published: 28 January 2019

Abstract

:
Techniques of stripping voltammetry (SV) determination of silver and gold in pyrites and carbonaceous matter are developed. The problem of quantitative transfer of the analytes into the solution is solved. For this purpose, the ore matrix of carbonaceous shales was decomposed by mineral acids in autoclaves at high pressures. The element to be determined from the sample matrix was separated by extraction. Ag(I) ions from the solutions were extracted in the form of a dithizonate complex in CCl4. Au(III) ions were extracted by diethyl ether. The extracts were decomposed thermally. The dry residue was dissolved in the background electrolyte, and the element was determined by the SV method. The graphite electrode (GE) impregnated with polyethylene was used as a working electrode in the SV determination of silver. The SV determination of gold was carried out using a GE modified by bismuth. The limits of detection (LOD) of Ag(I) and Au(III) contents were equal to 0.016 mg L−1 and 0.0086 mg L−1, respectively. The results of SV determination of gold and silver in standard samples, pyrites, and carbonaceous shales were presented. The silver content in the pyrite was 13.6 g t−1, and in carbon shale it was 0.34 g t−1. The concentration of gold in the pyrite of the Kirovsko–Kryklinskaya ore zone was 1.15 g t−1, while in carbonaceous shales it was 2.66 g t−1. The obtained data were consistent with the data of atomic emission spectroscopy (AES) and inductively-coupled plasma mass spectrometry (ICP–MS). The error of determination of elements by stripping voltammetry was calculated as ranging from 10 to 6 g t−1 (less than 12%) in pyrite and carbonaceous material when determining the silver content, and from 1 to 3 g t−1 (less than 22%) when determining the gold content in pyrite and carbonaceous matter.

1. Introduction

In recent years, complex noble metal deposits have been discovered in carbon-containing strata. They are considered a new promising source of silver, gold, and platinum metals. Carbonaceous shales are of genuine interest, due to the fact that in the fine-grained carbon fraction, the concentrations of precious metals exceed many times (15–16 times) the content of gold in the source (ore-hosting) rocks [1]. In the literature, there is information [2,3,4] on the discrepancy between the results of interlaboratory analyses of carbonaceous rocks by 1–2 or even more orders.
The complexity of the analysis of carbon–bearing raw materials is associated with the peculiarity of the forms of existence of metals, both in mineral (in the form of nuggets, sulfides, arsenides, etc.) and in carboniferous parts of the rock (from metalorganic competent complex compounds to graphitized formations), where platinum group metals (PGMs) may be located in the interplanar spacings of graphite, and are directly bound with several carbon atoms [2,3,4,5,6,7,8].
The presence of carbon and oxygen fundamentally distinguishes these microinclusions from traditional (native) forms of extracting gold and platinoids, causing their exceptional resistance to external affects (annealing, oxidation, acid decomposition), which creates difficulties [9]. A distinctive feature of carbon-containing ores is the uneven distribution of elements throughout the tested samples.
Usually, large samples are used to average the results of the analysis, as is done in the assay method. Methods of assay concentration cannot be used for the analysis of carbonaceous shales. Silver, gold and platinum group metals form carbon compounds that volatilize during the high-temperature autopsy of the sample [3].
Conducting geological prospecting and exploration for gold and silver in carbonaceous shales involves the use of analytical techniques that have limits of detection at the level of or below the average element content (10−4–10−7 wt %). According to the literature data, when determining gold and silver by any highly sensitive methods of analysis, the tested sample must be averaged. Averaging of the sample occurs at the expense of its dissolution and the separation of the determined elements from the sample matrix. Various methods are used for this purpose, including sorption [10,11], extraction [12,13], and others.
Stripping voltammetry (SV) has long been used to determine the concentrations of gold and silver in ores [14,15,16]. It is characterized by high sensitivity, uses cheap equipment, and allows the determination of the elements in a wide range of defined contents. When determining the gold content in mineral raw materials containing gold, silver, and platinum metals, a necessary stage in the analytical process is their separation from the sample matrix [17,18,19].
Electrochemical methods of analysis do not allow determination of the elements directly in an extract or on a sorbent. It is necessary to re-extract the determined admixture—as is done, for example, in [11,12]—or to thermally decompose the extractant [13].
Silver(I) [16] and gold(III) [20,21,22,23,24] ions were determined by SV using a graphite electrode (GE). The electrodeposition of silver on the surface of carbon-bearing electrodes was carried out with potentials between −0.4 and −0.7 V from the solutions of nitric, perchloric acids, potassium nitrates, ammonium nitrates, and other electrolytes [25,26]. According to the literature data, nitrate, chloride, and bromide media were recommended for the SV determination of gold(III) ions [20,21]. Gold in solutions is capable of aquation (interaction of ions with water molecules) and hydrolysis, and therefore only acidic backgrounds are used to determine gold by stripping voltammetry. Depending on the composition of the medium, electrooxidation of gold deposits was observed with potentials from 0.6 to 0.9 V.
Currently, graphite electrodes used for the determination of various elements are modified to reduce the limits of detection (LOD) and the systematic error of SV determination of the elements [27]. Various metals [28,29] and organic compounds [30,31,32,33] are used as modifiers. The influence of such modifiers as tosylate salt, caprolactam, and different base metals (Sb(II), Bi(III), Sn(IV), etc.) on the sensitivity when determining of gold(III) ions was studied. Based on the experimental data, the base metal of bismuth was chosen as a modifier of the GE surface. Further determination of gold(III) ions was carried out using bismuth(III).
The purpose of this study was to develop a technique for determining gold and silver in carbon ores and their technological redistribution, using both unmodified graphite electrodes and modified graphite electrodes by stripping voltammetry.

2. Materials and Methods

2.1. Apparatus and Electrolysis Procedure

The studies were undertaken by means of a voltammetry analyzer ТA–4 (TomAnalit LLC, Tomsk, Russia) and completed with a personal computer. Electrolysis was conducted in quartz glasses with a capacity of 20 mL at a conditioned room temperature.
The working cell contained three electrodes. The graphite electrode (GE) impregnated with polyethylene served as a working electrode [16]. Auxiliary and reference electrodes were saturated silver/silver chloride electrodes (0.222 V relative to the standard hydrogen electrode) filled with the 1 M KCl solution. To obtain the current voltage characteristics and the analytical signals of silver and gold, stripping voltammetry with a linear potential sweep was used.
Electrooxidation of the deposits was carried out at linear changes in the potential (v = 0.06 V s−1) window from −0.6 V to +1.0 V. The electrodeposition of deposit components on the surface of a GE was carried out in situ.
Electrochemical cleaning of the electrode surface was carried out for one minute, with a potential of 1.0 V in the medium electrolyte, or mechanically by grinding the electrode against the sandpaper and then against the filter paper. Mixing of the solution during electrolysis was carried out automatically by vibration of the working electrode, which was provided by the analyzers used.
To study the composition of rock-forming minerals in the sample by X-ray structural analysis, a powder diffractometer D2 PHASER produced by the Bruker company (Billerica, MA, USA) was used, which allowed detection of the presence of the mineral phase in the mixture under study at a level of 0.5%.
The elemental chemical composition of the rock was determined using the method of scanning the sample surface, by means of the S–3400N by Hitachi company (Yamaguchi, Japan) electron microscope, which was equipped with an energy-dispersive attachment made by Bruker.
The dissolution of the sample was carried out in hermetic autoclaves using a Mars-5 microwave system per one loading sequence, according to the following temperature–time modes: (1) 90 °С for 30 min and (2) 120 °С for 45 min. Two-stage heating was chosen to avoid the rapid formation of an excessive volume of gaseous products during the sample decomposition, because those gaseous products could lead to depressurization of the system.
In order to determine the total chemical composition of the initial sample, taking into account microinclusions, an inductively-coupled plasma (ICP) analysis was carried out by means of mass spectrometer, 7700x ICP MS by Agilent company (Santa Clara, CA, USA).

2.2. Reagents and Solutions

All reagents used in this study were of analytical reagent grade. The diluted solutions used in the work were prepared on the day of the tests. All the solutions were prepared using double-distilled water. Standard solutions were purchased from Merck (Darmstadt, Germany).
Standard solutions of Au(III) (c = 10.0 and 1.0 mg L−1) were prepared by sequential dilution of a certified solution of gold(III) in flasks with a capacity of 25.0 mL, and with a solution of 1 mol L−1 HCl.
Standard solutions of Ag(I) (c = 10.0 and 1.0 mg L−1) were prepared by sequential dilution of a certified solution of silver(I) in flasks with a capacity of 25.0 mL, and with a solution of 1 mol L−1 HNO3.
The standard solution of Bi(III) (c = 10.0 mg L−1) was prepared by sequential dilution of a certified solution of bismuth(III) in flasks with a capacity of 25.0 mL, and with a solution of 1 mol L−1 HNO3.
Solutions of 1% (w/v) tosylate diazonium, 1% (w/v) ε-Caprolactam (azepan-2-one), ethylenediaminetetraacetic acid (EDTA) (c = 0.25 mol L−1), NH3 (aq) (c = 3 mol L−1), HCl (c = 1 mol L−1; 6 mol L−1), HNO3 (c = 6 mol L−1), HClO4 (c = 6 mol L−1), and HF (c = 1 mol L−1, 6 mol L−1) were prepared by dilution with bi-distilled water. The 0.001% (w/v) dithizone solution was obtained by dilution with СCl4.

2.3. Sample Preparation

2.3.1. Preparation of Samples for the Determination of Ag(I) Ions

The technique of the ore matrix decomposition for the extraction of silver (I) ions consisted of dissolving the sample. To do this, a sample weighing 1 g was preliminary ashed, gradually increasing the temperature to 650 °C, and cooled to room temperature. Next, the sample was decomposed in a corundum crucible, with a mixture containing 10 mL of HNO3 (ρ = 1.40) and 10 mL of 10% HF. The solution was evaporated almost to dryness at a temperature of 100 °C. Then, 10 mL of HCIO4 (ρ = 1.68) and 10 mL of 40% HF were added to decompose the silicates and carbon–bearing substances. The residue, after cooling, was dissolved in hot water, cooled, and filtered through the “blue tape” filter. Then, 5 mL of a 0.25 mol L−1 solution of EDTA was added to the sample solution; the pH of the solution was adjusted to 6.8 by ammonia. The obtained solution was transferred to a separating funnel. There, a 0.001% dithizone solution was added, and the silver(I) dithizonate was extracted by the СCl4 solution. After separation of the phases, silver was re-extracted into two portions (10 mL each) by the 1 mol L−1 HCl + NH4OH (pH = 6.5) solution. Before the SV determination of silver, drops of dithizone in CCl4 were removed from the aqueous phase by evaporation. The sample was calcinated at a temperature of 220 °C; the media (1 mol L−1 HCl + NH4OH) was added and the content of silver(I) ions in the samples was determined by SV.

2.3.2. Preparation of Samples for Determination of Au(III) Ions

The sample weight of the ore weighing 1 g was preliminary ashed by stepped mode up to the temperature of 600 °С and then cooled to room temperature. To dissolve the sample, it was placed into the autoclave with the addition of 5 mL of aqua regia and 1 mL of hydrofluoric acid. The decomposition of nitric acid was carried out by boiling with water. After completing the decomposition procedure, the sample was cooled to room temperature and filtered through the “blue tape” filter. The gold(III) ions were extracted by 10 mL of diethyl ether from the obtained solution. The upper ether layer, rinsed with water, was evaporated up to the minimal deposit, whereupon 1 mL of 6 mol L−1 HCl was added to the sample, and the solution was boiled dry. The background electrolyte (1 mol L−1 HCl) was added, and gold(III) ions were determined in the presence of 10 mg L−1 of bismuth(III) ions (modifier) by SV.

3. Results and Discussion

3.1. Objects of Analysis

The research objects were mixed gold-bearing carbonaceous shales, pyrites of the Kirovsko–Kryklinskaya ore zone.
When analyzing the composition of rock-forming minerals in the ore by X-ray structural analysis using a D2 PHASER powder diffractometer (Bruker), it was established that clay minerals of the following types prevail in the sample composition: illite 2M1 (46.0%); illite 2M2 (11.5%); muscovite 2M1, hydrated to varying degrees (11.5%); muscovite 1M (4.5%); (sericite, hydrosericite); quartz (11.4%); kaolinite 1A (7.6%); and muscovite 1M (4.5%). Zeolite is present in trace amounts. By its chemical composition, this is aluminosilicate rock with a high content of potassium (3.2%), iron gross (3.1%), as well as sodium and sulfur gross (1.2%). The content of the carbonaceous matter is about 7%.
The microelement composition of the sample was investigated by electrothermal vaporization through inductively-coupled plasma mass spectrometry (ICP–MS). According to the analysis, the samples contained a high content of iron (30,134 g t−1), arsenic (948 g t−1), selenium (1 g t−1), antimony (58.9 g t−1), and tellurium (0.34 g t−1). As is well known, the mentioned elements are potential fixers of gold in the ore matrix [34]. The copper content was 160 g t−1.

3.2. Determination of Silver(I) ions by Stripping Voltammetry

The technique developed by the authors of [16], with some additions, was used for the SV determination of silver in gold-bearing carbonaceous shales of the Kirovsko–Kryklinskaya ore zone.
In this paper, silver was deposited onto the GE’s surface from a solution of 1 mol L−1 HCl (with the addition of NH4OH bringing the solution up to pH = 6.5), with a potential of −0.7 V, which corresponded to the current limit of silver electroconcentration. A peak of silver electrooxidation was observed with a potential of 0.1 V. In this work, a linear potential sweep was applied.
Figure 1 shows the current–voltage curves of the anodic electrooxidation of silver from the GE surface.
Since the analyzed samples contained increased quantities of copper(II) ions (160 g t−1) after the extraction of silver, the analyzed solutions could contain residual quantity of Cu(II) ions. The increased quantity of copper(II) ions exerts a harmful influence on the SV determination of silver(I) ions, by distorting the electrooxidation peaks of silver up to their complete overlapping.
Figure 2a,b shows the current–voltage curves and electrooxidation currents of deposits containing silver and copper.
In Figure 2b, it is evident that with an increase of the copper content in the silver deposit, the current of the silver anodic peak first increases and then decreases. With the concentration of copper(II) ions in the analyzed solution equal to 1.5 mg L−1, there is overlapping of the silver peak with the constant concentration of silver(I) ions, equal to 2 mg L−1. The increase in the peak height and a shift of the silver dissolution potential by 0.03 V to a less positive region are due to the formation of Ag–Cu solid solutions of variable composition on the electrode surface [35]. With the ratio of Cu(II) to Ag(I) ions in the solution equal to 5:20, the determination of silver by SV becomes impossible.
The interfering influence of copper(II) ions at the stage of silver(I) ion extraction was corrected by adding a higher concentration of EDTA (0.25 mol L−1), and by reducing the time of the solution extraction by dithizone (from 120 s to 60 s).
Figure 3 shows the dependence of the silver electrooxidation current on the concentration of silver(I) ions in the solution.
The limit of detection (LOD) of the silver content determined by SV was estimated according to the 3σ criterion, with the help of the equation given below [36]:
LOD = 3 × S bl tg θ   = 3 × 0.020 3.5   =   0.017   mg   L 1
where tgθ is the slope of the calibration line taken from the graph (Figure 3), and S bl is the standard deviation of the blank test. With a sample weight of 1 g, this will correspond to 0.017 g t−1. The limit of quantitation (LOQ) is 0.056 g t−1.
The correctness of the determination of silver by the developed technique was verified by comparing the results of the silver content in standard samples (SS) of copper and nickel sludge, determined by different methods (Table 1).
As can be seen from the above-mentioned data, the relative error of the SV determination of silver does not exceed 12%.
Table 2 presents the results of determining silver in the pyrite samples of the Kirovsko–Kryklinskaya ore zone. The silver content determined by electrothermal vaporization via inductively coupled plasma mass spectrometry was 13.6 g t−1.
The relative error in the determination of silver in the pyrite of the Kirovsko–Kryklinskaya ore zone by stripping voltammetry in comparison with the data obtained by the method of electrothermal vaporization via inductively coupled plasma mass spectrometry (ICP–MS) does not exceed 12%.

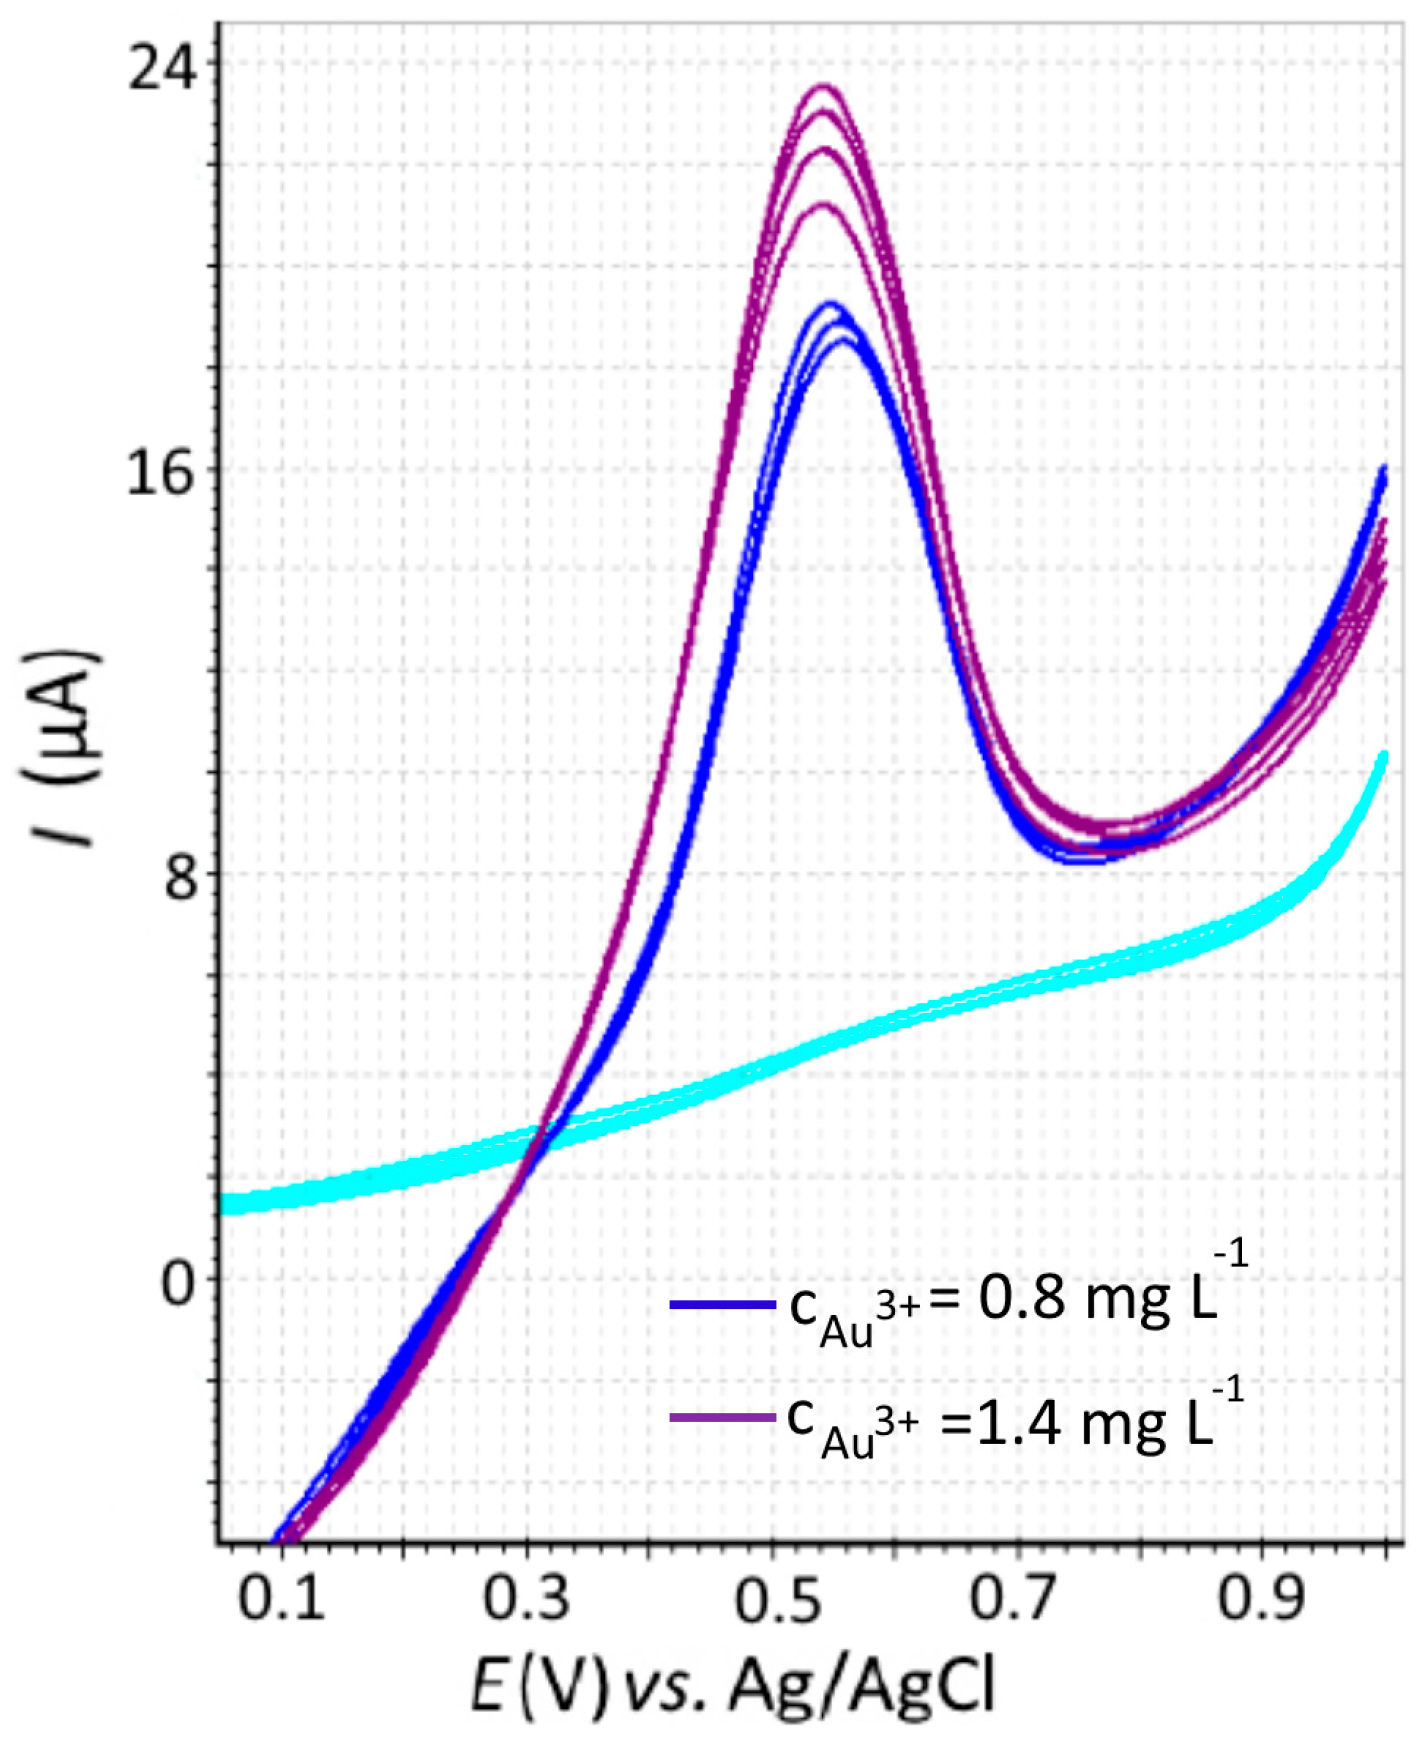
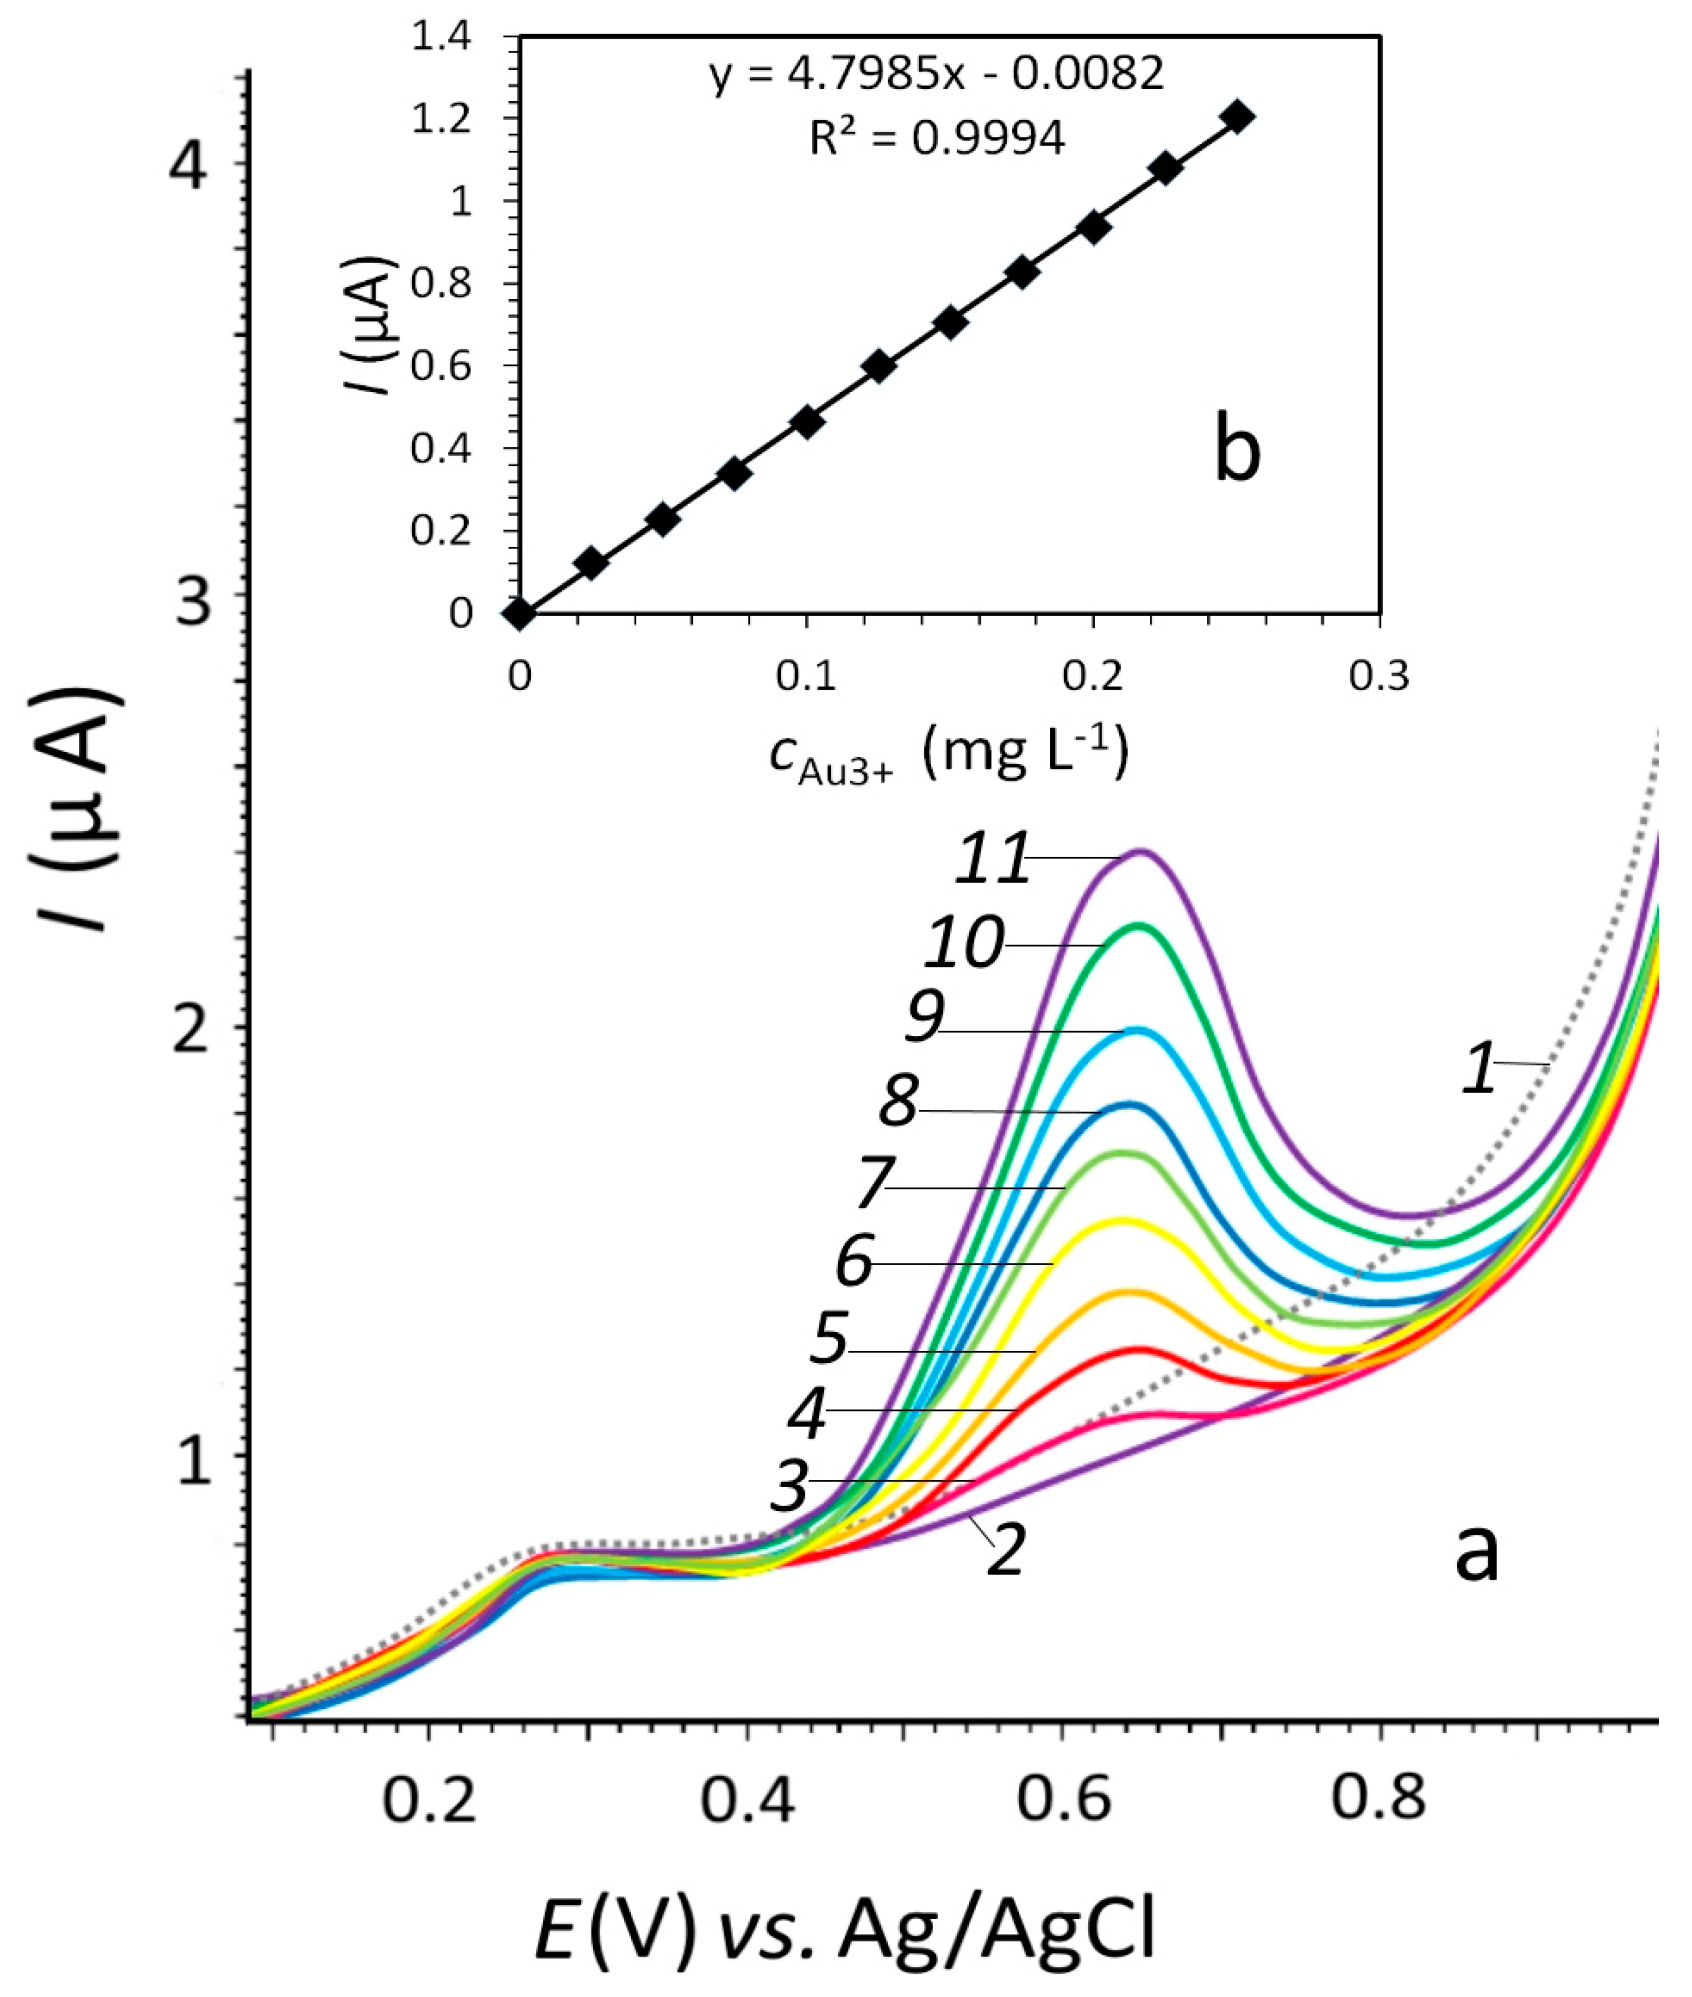
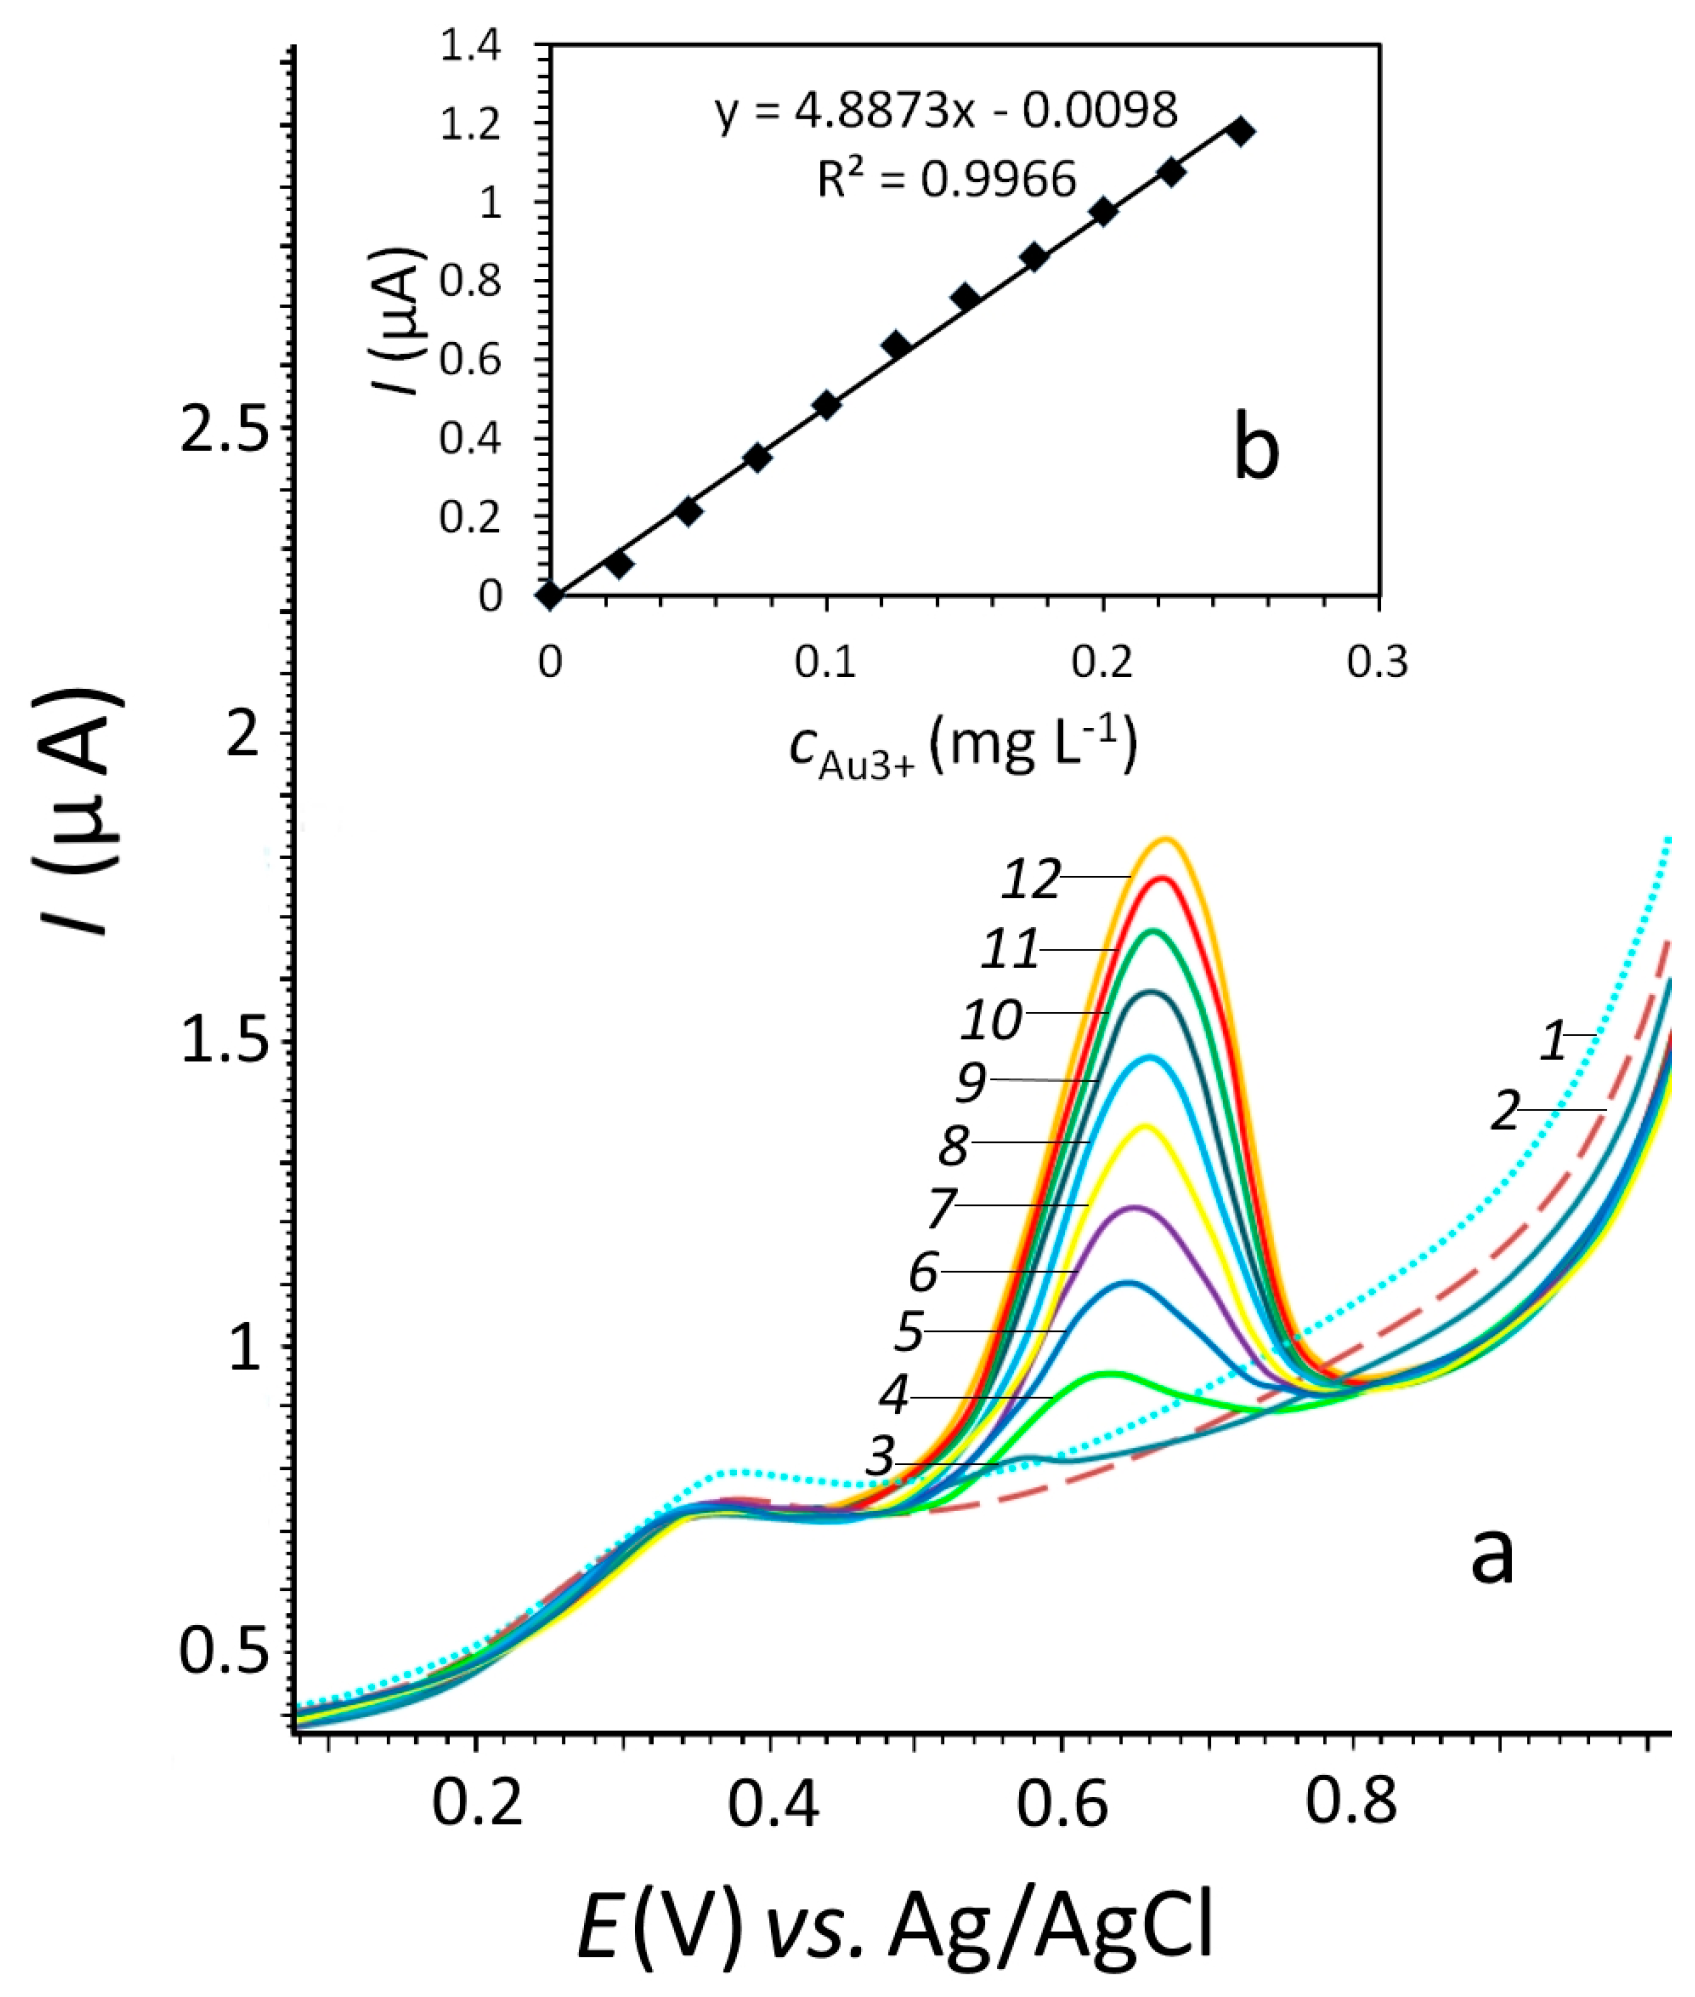
3.3. Determination of Gold(III) Ions by Stripping Voltammetry

The electroconcentration of gold(III) ions on the surface of carbon-bearing electrodes is carried out with potentials between −0.6 and −0.8 V [22]. A current limit can be observed with potentials that are more negative. To increase the selectivity of gold determination after the electroconcentration of deposit, Monieen [23] recommends conducting post-electrolysis with a positive potential. In this case, foreign base metals dissolve and gold remains on the electrode surface, and can be determined by the peak of its electrooxidation.
The author of [28] shows that gold can be determined on a GE impregnated by polyethylene in the presence of the following elements (maximum ratios of Au3+:M are given in parenthesis): Ag+(1:10), Tl3+(1:10), Zn2+(1:103), Cu2+(1:102), Pb2+(1:103), Sb3+(1:10), Co2+(1:102), Ni2+(1:103), Bi3+(1:10), As5+(1:102), or Cd2+(1:102).
Figure 4 shows the current–voltage curves for the electrooxidation of gold deposits from the graphite electrode (GE) surface.
The sensitivity of gold determination by the SV method can be significantly increased when modifying the GE surface by organic or inorganic modifiers, such as bismuth(III) [29], tosylate salts of aryldiazonium [30], polyethylene polyimine [31], acrylic polyelectrolyte [32], and ε-Caprolactam [33].
Modification of the GE surface is usually carried out in situ.
Figure 5a,b show the current–voltage curves and the calibration dependences of the electrooxidation currents of gold deposits taken from the surface of the unmodified GE.
Figure 6 and Figure 7a,b show the current–voltage curves and the calibration dependences of the electrooxidation currents of gold deposits taken from the surface of a GE modified by salts of 1% diazonium tosylate (Figure 6a,b) or by 1% (w/v) ε-Caprolactam (Figure 7a,b).
The data show that the sensitivity of gold determination on a GE modified by tosylate ions and ε-Caprolactam has increased insignificantly.
Figure 8 shows the current–voltage curves and the calibration dependences for SV–determination of gold on a GE modified by bismuth.
As can be seen in Figure 5, Figure 6, Figure 7 and Figure 8, the most sensitive method for the determination of gold(III) ions in chloride electrolytes is with the use of the polyethylene-impregnated GE modified by bismuth.
During the SV determination of gold in mineral raw materials, gold dithizonate extraction in CCl4 is often used, followed by the re-extraction of gold(III) ions with 20% KBr, the removal of CCl4 from the re-extraction by heating, and the determination of gold(III) ions by SV in the bromide solution [24,37].
When determining gold by the SV method in mineral raw materials, the simplest method is extraction of gold(III) ions by diethyl ether from muriatic solutions [29]. Diethyl ether volatilizes easily from the extract during heating. The solid deposit dissolves in the background electrolyte, and the gold is determined by SV.
To dissolve the ore with the view of determining the concentration of gold(III) ions, the technique developed by the authors was used [38]. The scheme of sample preparation for determining the content of gold(III) ions is given in Figure 9.
The LOD of the contents of gold(III) ions, determined by SV, was estimated by the 3σ criterion, according to Equation (1):
LOD = 3 × S bl tg θ   = 3 × 0.016 5.8   =   0.0083   mg   L 1
where tgθ is the slope of the calibration line taken from the graph (Figure 8b), and Sbl is the standard deviation of the blank test. With a sample weight of 1 g, this will correspond to 0.0083 mg L−1. The LOQ is 0.028 g t−1.
In Table 3 are the results of the determination of gold by the method of atomic emission spectroscopy (AES), SV, and ICP–MS in the standard samples (SS) of copper and nickel sludge.
Table 3 shows that the relative error of determination does not exceed 20%. In Table 4, the results of the determination of gold(III) in gold-bearing carbonaceous shales are given. The gold concentration in these samples, according to the data obtained by mass spectrometry analysis, was 2.66 g t−1.
The relative error in the determination of gold in the carbonaceous shales of the Kirovsko–Kryklinskaya ore zone by stripping voltammetry, in comparison with the data obtained by ICP–MS, did not exceed 18%.
Table 5 shows the results of determination of gold in gold-bearing samples. The average content of gold in such samples, determined by inductively-coupled plasma mass spectrometry, was 1.15 g t−1.
The relative error of gold determination in the pyrite of the Kirovsko–Kryklinskaya ore zone by stripping voltammetry, in comparison with the data obtained by ICP–MS, did not exceed 22%.

4. Conclusions

The techniques utilized in determining gold and silver in the extract are unified and allow the precipitating of precious metals from the solution, with their subsequent determination by stripping voltammetry. The process was conducted on real-world samples: pyrites and carbon-bearing ores. Carbon-bearing samples, such as gold- and silver-bearing objects of analysis, differ by quite a wide range of concentrations of the determined elements, as well as by a great variety of accompanying components.

Author Contributions

N.A.K. interpreted of data received, wrote and reviewed the manuscript. Z.K.S. carried out the experimental part, wrote and reviewed the manuscript. V.I.S. provided resources, project administration, reviewed and edited the manuscript. R.O.M., V.V.O. and R.A.N. obtained the characteristics of the objects of study, obtained experimental data by inductively-coupled plasma mass spectrometry.

Funding

The results were obtained within the framework of the state task of the Ministry of Education and Science of Russia, project No. 10.3031.2017/4.6, and with the support of the Tomsk State University Competitiveness Program.

Acknowledgments

The authors are grateful to the director of the Innovation Center “Gold and Platinum” Pshenichkin A.Y., for the provision of scientific equipment and support.

Conflicts of Interest

The authors declare no conflict of interest.

References

  1. Chernyshov, N.M. Noble–metal minerals in ores of the black–shale type in the Voronezh Crystalline Massif, central Russia. Geol. Ore Depos. 2009, 5, 684–697. [Google Scholar] [CrossRef]
  2. Alexandrova, T. Technological aspects of recovery of precious metals from carbonaceous ores. In Proceedings of the 28th International Mineral Processing Congress (IMPC 2016), Quebec City, QC, Canada, 11–15 September 2016. [Google Scholar]
  3. Vasilyeva, I.E.; Shabanova, E.V.; Razvozzhaeva, E.A. Noble metals in the insoluble carbonaceous substance of black shales and ores: Direct atomic emission data. Geochem. Int. 2012, 50, 771–776. [Google Scholar] [CrossRef]
  4. Varshal, G.M. Noble–metal accumulation by carbonaceous material. Geochem. Int. 1995, 32, 47–56. [Google Scholar]
  5. Zeng, X.; Cai, J.G. Relationship between mineral and organic matter in shales: The case of shahejie formation, Dongying Sag, China. Minerals 2018, 8, 222. [Google Scholar] [CrossRef]
  6. Dobrowolski, R.; Kuryło, M.; Otto, M.; Mróz, A. Determination of gold in geological materials by carbon slurry sampling graphite furnace atomic absorption spectrometry. Talanta 2012, 99, 750–757. [Google Scholar] [CrossRef]
  7. Sorokin, A.P.; Eirish, L.V.; Kuz’minykh, V.M. Noble metal mineralization in carbonaceous rocks: A synthesis of data on the Russian Far East. Russ. J. Pac. Geol. 2007, 1, 43–54. [Google Scholar] [CrossRef]
  8. Mitkin, V.N.; Galizky, A.A.; Korda, T.M. Some observations on the determination of gold and the platinum–group elements in black shales. Geostand. Newsl. 2000, 24, 227–240. Available online: https://onlinelibrary.wiley.com/doi/epdf/10.1111/j.1751-908X.2000.tb00774.x (accessed on 5 November 2018). [CrossRef]
  9. Berdnikov, N.; Balaram, V.; Cherepanov, A.; Avdeev, D.; Konovalova, N.; Sukharulidze, G. Some observations on the determination of platinum group elements and gold in black shales. Curr. Sci. 2010, 99, 518–521. [Google Scholar]
  10. Losev, V.N.; Buiko, E.V.; Elsuf’Ev, E.V.; Maznyak, N.V.; Trofimchuk, A.K. Silver(I) sorption by silica gels chemically modified with mercaptopropyl or dipropyl disulfide groups. Russ. J. Inorg. Chem. 2006, 51, 565–568. [Google Scholar] [CrossRef]
  11. Losev, V.N.; Borodina, E.V.; Buiko, O.V. Sorption-spectrometric determination of palladium and gold using silica chemically modified with dipropyl disulfide groups. J. Anal. Chem. 2014, 69, 413–419. [Google Scholar] [CrossRef]
  12. Tu, Z.; Lu, S.; Chang, X.; Li, Z.; Hu, Z.; Zhang, L.; Tian, H. Selective solid–phase extraction and separation of trace gold, palladium and platinum using activated carbon modified with ethyl-3-(2-aminoethylamino)-2-chrobut-2-enoate. Microchim. Acta 2011, 173, 231–239. [Google Scholar] [CrossRef]
  13. Torgov, V.G.; Kostin, G.A.; Us, T.V.; Korda, T.M.; Drapailo, A.B. Palladium and silver extraction with thiacalix[4]arenes and their acyclic analogs from carbonate and ammonia-carbonate solutions. Russ. J. Inorg. Chem. 2015, 60, 372–378. [Google Scholar] [CrossRef]
  14. Gevorgyan, A.M.; Vanyukov, V.V.; Vakhnenko, S.V. Determination of gold by stripping voltammetry using a modified carbon paste electrode. J. Anal. Chem. 2002, 57, 253–254. [Google Scholar] [CrossRef]
  15. Davies, T.J. Anodic stripping voltammetry with graphite felt electrodes for the trace analysis of silver. Analyst 2016, 141, 4742–4748. [Google Scholar] [CrossRef] [PubMed] [Green Version]
  16. Nghi, T.V.; Vydra, F. Stripping voltammetric determination of silver in non-–medium after extraction with dithizone. Collect. Czech. Chem. Commun. 1975, 40, 1485–1489. [Google Scholar] [CrossRef]
  17. Ustinova, E.M.; Gorchakov, E.V. Determination of platinum and palladium in the presence of other metals in the mineral raw materials. Key En. Mater. 2016, 712, 332–337. [Google Scholar] [CrossRef]
  18. Doronina, M.S.; Karpov, Y.A.; Baranovskaya, V.B. Combined methods of analysis of metal-containing raw material. J. Inorg. Mater. 2017, 53, 1411–1417. Available online: https://link.springer.com/content/pdf/10.1134%2FS0020168517140047.pdf (accessed on 6 November 2018). [CrossRef]
  19. Karpov, Y.A.; Baranovskaya, V.B. Problems of analytical control in the production of rare and precious metals. Russ. J. Non-Ferr Met. 2018, 59, 374–384. [Google Scholar] [CrossRef]
  20. Kosseva, M.R.; Kennedy, J.F. Analytical Voltammetry and Polarography. In Handbook of Analytical Techniques, 2nd ed.; Günzler, H., Williams, A., Eds.; WILEY–VCH Verlag GmbH: Weinheim, Germany, 2001; p. 1182. ISBN 3527301658. Available online: http://web.uni-plovdiv.bg/plamenpenchev/mag/books/anchem/Handbook%20of%20Analytical%20Techniques,%202%20Volume%20Set.pdf (accessed on 7 November 2018).
  21. Kavanoz, M.; Gulce, H.; Yildiz, A. Anodic stripping voltammetric determination of gold on a polyvinylferrocene coated glassy carbon electrode. Turk. J. Chem. 2004, 28, 287–297. [Google Scholar]
  22. Meepun, N.; Siriket, S.; Dejmanee, S.; Ratana-Ohpas, R. Stripping chronopotentiometry: An alternative method for the determination of gold in geological samples. Walailak J. Sci. Technol. 2010, 7, 61–67. Available online: https://www.researchgate.net/publication/242349648_53-72-1-PB (accessed on 7 November 2018).
  23. Monieen, H. Inverse voltammetric determination of small amounts of gold by peak potential measurements. J. Anal. Chem. 1968, 237, 409. [Google Scholar]
  24. Brainina, K.Z.; Gornostaeva, T.D.; Pronin, V.A. Preconcentration in polarographic analysis discharge–ionization of gold in bromide–chloride solutions. J. Anal. Chem. USSR 1979, 34, 831–836. [Google Scholar]
  25. Jahandari, S.; Taher, M.A.; Fazelirad, H.; Sheikhshoai, I. Anodic stripping voltammetry of silver(I) using a carbon paste electrode modified with multi-walled carbon nanotubes. Microchim. Acta 2013, 180, 347–354. [Google Scholar] [CrossRef]
  26. Tashkhourian, J.; Javadi, S.; Ana, F.N. Anodic stripping voltammetric determination of silver ion at a carbon paste electrode modified with carbon nanotubes. Microchim. Acta 2011, 173, 79–84. [Google Scholar] [CrossRef]
  27. Budnikov, G.K.; Maistrenko, V.N.; Murinov, Y.I. Voltammetry with Modified Electrodes; Science: Moscow, Russia, 1994; p. 236. ISBN 5-02-001842-2. [Google Scholar]
  28. Barón-Jaimez, J.; Joya, M.R.; Jose Barba Ortega, J. Anodic stripping voltammetry—ASV for determination of heavy metals. J. Phys. Conf. Ser. 2013, 466, 012023. Available online: http://iopscience.iop.org/article/10.1088/1742-6596/466/1/012023/pdf (accessed on 7 November 2018). [CrossRef]
  29. Dyachenko, E.N.; Kolpakova, N.A.; Oskina, Y.A. Determination of gold by stripping voltammetry in platinum gold ore mineral raw materials for grafite electrode modified by bismuth. Procedia Chem. 2014, 10, 47–50. [Google Scholar] [CrossRef]
  30. Postnikov, P.S.; Trusova, M.E.; Filimonov, V.D.; Slepchenko, G.B. The new method of covalent grafting of organic functional groups on the graphite/GC electrodes using arenediazonium tosylates. In Proceedings of the 15th European Conference on Composite Materials: Composites at Venice, ECCM 2012, Venice, Italy, 24–28 June 2012. [Google Scholar]
  31. Sladkov, V.E.; Osipova, E.A. Effect of polyethylenimine on the selectivity of determining silver(I) by stripping voltammetry in the presence of Copper(II). J. Anal. Chem. 2001, 56, 43–46. [Google Scholar] [CrossRef]
  32. Chooto, P. Modified electrodes for determining trace metal ions. In Applications of the Voltammetry; Stoytcheva, M., Zlatev, R., Eds.; IntechOpen: London, UK, 2017; ISBN 978-953-51-3216-5. Available online: https://www.intechopen.com/books/applications-of-the-voltammetry/modified-electrodes-for-determining-trace-metal-ions (accessed on 5 November 2018). [CrossRef]
  33. Qi, J.; Zhai, Y.; St-Pierre, J. Effects of Ethylene Glycol and Caprolactam on the ORR and HOR Performances of Pt/C Catalysts. J. Electrochem. Soc. 2016, 163, 618–626. [Google Scholar] [CrossRef]
  34. Oparin, V.N.; Sekisov, A.G.; Trubachev, A.I. Promising mining technologies for gold placers in transbaikalia. J. Min. Sci. 2017, 53, 489–496. [Google Scholar] [CrossRef]
  35. Bakanov, V.I.; Larina, N.V. Mathematical model of the surface of electrodeposited metals. In Proceedings of the Electrochemistry and Surface Technology: Abstracts Intern Conference, Moscow, Russia, 4–8 June 2001; p. 147. [Google Scholar]
  36. Borkhodoev, V.Y. Estimation of limits of detection and determination in X-ray fluorescence analysis by the dependence of the relative standard deviation on analyte concentration. J. Anal. Chem. 2016, 71, 872–877. [Google Scholar] [CrossRef]
  37. Pyrzyńska, K. Recent developments in the determination of gold by atomic spectrometry techniques. Spectrochim. Acta Part B At. Spectrosc. 2005, 60, 1316–1322. Available online: https://www.sciencedirect.com/science/article/pii/S0584854705002016 (accessed on 8 November 2018). [CrossRef]
  38. Kaplin, A.A.; Stromberg, A.G.; Pikula, N.P. Use of the method of polarography with accumulation (inversion voltamperometry) in the analysis of macro– and micro–objects. Ind. Lab. (USSR) 1977, 43, 463–480. [Google Scholar]
Figure 1. Current–voltage curves of Ag(I). Conditions of experiments: medium of 1 mol L−1 HCl + NH4OH, Ee = −0.7 V; τe =120 s; v = 0.06 V s−1
Minerals 09 00078 g001
Figure 2. Current–voltage curves (a) and electrooxidation currents (b) of deposits containing silver and copper. Experimental conditions: medium of 1 mol L−1 HCl + NH4OH, Ee = −0.7 V; τe = 120 s; v = 0.06 V s−1; cAg+ = 2 mg L−1; cCu2+, mg L−1; (1) 0, (2) 0.3, (3) 0.6, (4) 0.9, (5) 1.2, (6) 1.5, (7) 1.8, (8) 2.1, and (9) 2.4.
Minerals 09 00078 g002
Figure 3. The dependence of the peak current of silver electrooxidation on the concentration of silver(I) ions in the solution. Experimental conditions: medium of 1 mol L−1 HCl + NH4OH up to рН = 6.5, Ee = −0.7 V; τe = 120 s; v = 0.06 V s−1; and cAg+ = 0.5–4 mg L−1.
Minerals 09 00078 g003
Figure 4. Current–voltage curves of gold deposit electrooxidation from the graphite electrode (GE) surface. Experimental conditions: medium of 1 mol L−1 HCl, Ee = −0.7 V; τe = 120 s; v = 0.06 V s−1.
Minerals 09 00078 g004
Figure 5. Anodic current–voltage curves (a) and calibration dependences (b) of gold determination from the unmodified GE surface by SV. Experimental conditions: medium of 1 mol L−1 HCl, Ee = −0.7 V, te = 120 s, v = 0.06 V s−1; cAu3+ (mg L−1): (1) 0, (2) 0.025, (3) 0.05, (4) 0.075, (5) 0.1, (6) 0.125, (7) 0.15, (8) 0.175, (9) 0.2, (10) 0.225, and (11) 0.25.
Minerals 09 00078 g005
Figure 6. Anodic current–voltage curves (a) and calibration dependences (b) of gold determination from the surface of a GE modified by tosylate ions. Experimental conditions: medium of 1 mol L−1 HCl; Ee = −0.7 V, te = 120 s, v = 0.06 V s−1; cAu3+ (mg L−1): (1) blank, (2) 20 µL of 1% tosylate diazonium, (3) 0.025, (4) 0.05, (5) 0.075, (6) 0.1, (7) 0.125, (8) 0.15, (9) 0.175, (10) 0.2, (11) 0.225, and (12) 0.25.
Minerals 09 00078 g006
Figure 7. Anodic current–voltage curves (a) and calibration dependences (b) of gold determination from the surface of GE modified by ε-Caprolactam. Experimental conditions: medium of 1 mol L−1 HCl, Ee = −0.7 V, te = 120 s, v = 0.06 V s−1; cAu3+ (mg L−1): (1) blank, (2) 20 µL of 1% ε-Caprolactam, (3) 0.025, (4) 0.05, (5) 0.075, (6) 0.1, (7) 0.125, (8) 0.15, (9) 0.175, (10) 0.2, and (11) 0.225.
Minerals 09 00078 g007
Figure 8. Anodic current–voltage curves (a) and calibration dependences during electrooxidation of gold deposits from the surface of a GE modified by bismuth (b). Experimental conditions: medium of 1 mol L−1 HCl, Ee = −0.7 V, te = 120 s, v = 0.06 tV s−1, сBi3+ = 10 mg L−1; cAu3+ (mg L−1): (1) 0, (2) 0.025, (3) 0.05, (4) 0.075, (5) 0.1, (6) 0.125, (7) 0.15, (8) 0.175, (9) 0.2, and (10) 0.225.
Minerals 09 00078 g008
Figure 9. A scheme of sample preparation to determine gold(III) ions.
Minerals 09 00078 g009
Table 1. Results of stripping voltammetry (SV) determination of silver(I) in standard samples (SS) of copper and nickel sludge analyzed by different methods (n = 5, P = 0.95).
SSCertified Value, g t−1Ag Content, g t−1Relative Error (%)
AESICP–MSSV
Copper sludge6.385.85.55.6 ± 0.211.6
Nickel sludge0.190.20.190.2 ± 0.029.9
* AES: atomic emission spectroscopy. ICP–MS: inductively-coupled plasma mass spectrometry.
Table 2. Results of SV determination of silver in the pyrite of the Kirovsko–Kryklynskaya ore zone (n = 5, P = 0.95).
No. of ExperimentAg Content, g t−1C, g t−1
113.811.711.012.2 ± 1.6
29.517.99.0912.2 ± 3.8
36.116.313.712.0 ± 3.2
Table 3. Results of determination of gold in standard samples (SS) of copper and nickel sludge analyzed by different methods.
SSCertified value, g t−1Content of Au, g t−1Relative Error (%)
AESICP–MSSV (n = 5)
Copper sludge0.210.250.260.25 ± 0.0219.05
Nickel sludge0.0590.0600.0580.060 ± 0.021.69
*AES: atomic emission spectroscopy. ICP–MS: inductively-coupled plasma mass spectrometry.
Table 4. Results of the SV determination of gold in different samples of carbonaceous shales in the Kirovsko–Kryklinskaya ore zone (n = 3, P = 0.95).
No.Value of Gold Contents, g t−1Average Content of Au, g t−1
11.62.22.92.2 ± 0.6
21.81.92.62.6 ± 0.7
32.01.82.72.2 ± 0.3
Table 5. Results of determining the gold in solutions after precipitation of gold(III) ions from pyrite of the Kirovsko–Kryklinskaya ore zone (n = 3, P = 0.95).
No.Value of Gold Contents, g t−1Average Content of Au, g t−1
11.40.80.91.0 ± 0.2
21.20.70.80.9 ± 0.2
31.00.90.80.9 ± 0.1

