Article

Mine Backfilling in the Permafrost, Part I: Numerical Prediction of Thermal Curing Conditions within the Cemented Paste Backfill Matrix

1
Research Institute on Mining and Environment (RIME), Université du Québec en Abitibi-Témiscamingue, Rouyn-Noranda, QC J9X 5E4, Canada
2
Golder Associates, Val-d’Or, QC J9P 1P4, Canada
3
École Polytechnique de Montréal, Montréal, QC H3C 3A7, Canada
4
Agnico Eagle Mines Limited, Rouyn-Noranda, QC J0Y 1C0, Canada
*
Author to whom correspondence should be addressed.
Minerals 2019, 9(3), 165; https://doi.org/10.3390/min9030165
Submission received: 30 January 2019 / Revised: 3 March 2019 / Accepted: 4 March 2019 / Published: 8 March 2019
(This article belongs to the Special Issue Backfilling Materials for Underground Mining)

Abstract

:
The mechanical behavior of cemented paste backfill (CPB) in permafrost regions may depend on the thermal curing conditions. However, few experimental data are available for calibrating and validating numerical models used to predict these conditions. To fill this gap, a three-dimensional (3D) laboratory heat transfer test was conducted on CPB placed in an instrumented barrel and cured under a constant temperature of −11 °C. Results were used to calibrate and validate a numerical model built with COMSOL Multiphysics®. The model was then used to predict the evolution of the temperature field for CPB cured under the thermal boundary conditions for a backfilled mine stope in the permafrost (at −6 °C). Numerical results indicated that the CPB temperature gradually decreased with time such that the entire CPB mass was frozen about five years after stope backfilling. However, the permafrost equilibrium temperature of −6 °C was not reached throughout the entire CPB mass even after 20 years of curing. In addition, the evolution of the temperature field in the permafrost rock showed that the thickness of the thawed portion reached about 1 m within 120 days. Afterwards, the temperature continues to drop over time and the thawed portion of the permafrost refreezes after 365 days.

1. Introduction

Cemented paste backfill (CPB) is applied to provide ground support and local stability in cut-and-fill and long-hole sublevel mines, thereby allowing ore removal from nearby regions. Due to these benefits for mine production, CPB is increasingly used in underground hard rock mining operations. Extensive investigations have been conducted to understand the rheological behavior of fresh CPB and the mechanical properties of CPB that is cured in temperate and semiarid climates. CPB mixture designs to meet the required mechanical strength to ensure backfilled stope stability have received much attention [1,2,3,4,5,6,7,8,9,10,11,12]. Other predominant research topics are the optimization of the rheological properties of CPB mixtures to facilitate transport from surface paste backfill plants to underground stopes through reticulated pipelines [4,11,12,13,14,15,16,17,18,19,20], and understanding the hydro-mechanical [21,22,23,24,25] and geochemical [26,27,28] behaviors of CPB. In addition, because heat has a direct influence on strength development, heat transfer between the CPB mass and its surrounding rock has been investigated in temperate and semiarid climates [29,30]. For example, Wu et al. [30] developed a coupled thermal, hydraulic, and chemical (THC) numerical model to assess the distribution and evolution of temperature in CPB surrounded by rock at initial temperatures of 0 °C, 20 °C and 40 °C. Fall et al. [29] developed a numerical model to assess heat development and transfer in CPB in deep mine temperature conditions as well as the effect of high temperature (up to 50 °C) on key CPB properties.
Given the growing development of underground mines in the permafrost regions of northern Canada, uncemented frozen backfills have been proposed to replace more expensive cement-based backfills [31,32]. Bandopadhyay and Izaxon [31] suggested that thin backfill layers (usually tailings) could be placed successively, with each layer allowed to freeze before the next layer is placed. Ice acts as a binding agent between the solid particles in tailings, and cold air ventilation during the winter can be used to freeze the backfill. These authors developed a finite-difference model to analyze the effects of various parameters on the freezing of ice-cemented backfills. The air (ventilation) temperature and the thickness of the backfill layers were the two most influential variables on freezing time. For example, 13.2 days were required to freeze a 0.5 m backfill layer (under representative backfilling conditions). Accordingly, backfilling a 25 m high stope would require 660 days, which is unacceptable for actual mining operations. Cluff and Kazakidis [32] developed several frozen backfill formulations comprising rockfill, tailings, crushed ice, and water at different ratios. Along with other key parameters, this method was also affected by freezing time.
Among other key parameters, the lengthy freezing time for frozen uncemented backfill limits its applicability. The use of CPB in underground stopes located in permafrost regions is therefore a promising alternative to rapidly obtain the required compressive strength (generally within 28 days). The first major challenge is to design a CPB mix recipe to allow transport and placement in underground stopes without freezing, particularly when the CPB pipeline is partly on the surface at very low temperatures. The temperature field during the CPB flow in the distribution system (pipelines and sublevel boreholes) can be obtained from numerical models that account for the internal heat generated by wall friction and internal shearing, heat exchanges with the outside environment, and the thermal dependence of the rheological properties of the CPB. Kalonji [33] used the non-isothermal pipe flow module in COMSOL Multiphysics® 5.2 [34] to produce a numerical simulation of the temperature field (see also [35,36]). Knowing the temperature field along the distribution system provides the CPB temperature at deposition in the stope, which affects the curing temperature in the stope and the strength development.
The second major challenge is to design a CPB mix recipe that obtains the required strength development (generally within 28 days) under the curing conditions for CPB confined within permafrost walls. As the heat transfers from the CPB to the permafrost rock, the temperature within the CPB mass decreases and the temperature of the permafrost rock walls increases. This may lead to thawing and re-freezing in the rock. If the mechanical strength of the surrounding permafrost rock decreases with thawing, the stability of the backfilled stope may be affected. Very few studies have investigated heat transfer from the CPB to the permafrost rock. Ghoreishi-Madiseh et al. [37] used two-dimensional (2D) numerical models to investigate the effect of the initial temperature of mine filling material (MFM) (from 5 °C to 25 °C) on the thawing extent of the frozen rock mass having initial temperatures ranging from −25 to −5 °C. A 10 m high × 10 m wide stope was considered. Their numerical results showed that when the initial temperature of the MFM was higher, the extent of thawing rock grew larger, requiring more time for re-freezing. In their study, the cement and water contents of the MFM were 20% and 5% by weight, respectively. The resultant MFM had a solid content of Cw = 95.2% and a water-to-cement ratio of 0.3. The MFM investigated by Ghoreishi-Madiseh et al. [37] differed considerably from the CPB commonly used in mining operations in temperate and semiarid climates, where the cement content by weight (Bw) typically ranges from 2% to 8% by dry mass of tailings and water content typically ranges from 18 to 43%. This results in a solid content (Cw) typically in the range of 70 to 85% [1,5,26] and a water-to-cement ratio (w/c) in the range of 2 to 22 [1]. Because mining companies continuously seek to reduce the costs of binder, this type of MFM (Bw = 20%, Cw = 95.2%, and w/c = 0.3) is rarely used as mine backfill material.
The temperature distribution and evolution in CPB mass placed in permafrost stopes depend on the stope dimensions and the thermal properties (conductivity and capacity) of the CPB and the permafrost walls. The thermal properties of CPB are influenced by the unfrozen and frozen water contents, water salinity, and the mineralogical composition of the tailings. Pore water salinity (brine) can be naturally derived from permafrost ice [38,39] or from anthropogenic sources, such as ore de-icing salts. The effects of the CPB mixture ingredients, curing time, and temperature (above-zero °C) and the degree of water saturation on CPB thermal conductivity have been investigated previously [40,41,42,43]. Furthermore, Beya et al. [42] investigated the effects of water salinity (brine content) and sub-zero and above-zero (°C) curing temperatures on the thermal conductivity and capacity of uncemented paste tailings and cemented paste backfill materials. In all the above-mentioned studies, a KD2 Pro thermal properties analyzer (DECAGON DEVICES Inc., Pullman, WA, USA) was used. This portable device complies with ASTM D5334-08 [44]. Based on the hot wire method [45], it can be used in the laboratory or the field. For simultaneous measurement of thermal conductivity and volumetric heat capacity, the double needle SH-1 sensor was used (needles were 1.3 mm in diameter and 30 mm long with 6 mm spacing). This sensor is compatible with most solid granular materials. Results showed that the thermal properties of cementitious materials do not change significantly with curing time (up to 28 days) [40,41,42,43]. Freezing the CPB increased thermal conductivity and decreased thermal capacity [42]. Mixing water salinity (for salt concentrations ranging from 0 to 10 g/L) also showed a negligible effect on the thermal conductivity and thermal capacity of CPB, for frozen and unfrozen specimens [42]. Furthermore, the effect of less than 5% binder content on the thermal properties of CPB was found to be insignificant [40,41,42,43].
In feasibility studies of underground mines in permafrost regions, knowledge of the temperature field within the CPB mass confined by permafrost walls is critical for mixture proportioning of laboratory recipes designed to achieve the required compressive strength. Therefore, estimation of the in situ thermal curing conditions of CPBs provides knowledge of the appropriate thermal curing conditions for CPB samples prior to uniaxial compressive strength (UCS) testing in the laboratory. Furthermore, knowledge of the temperature field within the permafrost rock sidewalls allows estimating the thawed thickness. Because a full-sized underground backfilled stope cannot be reproduced in the laboratory, the use of calibrated and validated numerical models remains one of the most effective approaches for predicting the thermal behavior of backfilled stopes and sidewall rocks.
The objective of this study was to develop a numerical tool for predicting the temperature field within CPB confined by permafrost walls. For this purpose, the governing equations for heat transfer with phase changes, as briefly presented here, were implemented in the 3D Heat Transfer Module of COMSOL Multiphysics®. Experimental data gathered from a lab-scale physical model of 3D heat transfer in CPB materials were used for numerical model calibration (using estimated unknown model parameters from measured data) and validation (using comparison of model and measured data). The calibrated and validated model was then used to predict heat transfer within an idealized backfilled mine stope in permafrost rock. The evolution of the temperature field within the CPB mass and the thawing extent in the surrounding permafrost rock mass were also modeled.

2. Governing Equations for Heat Transfer

The simplified mathematical model for the heat transfer in porous media is given by the equation [34]
ρ C p T t + ρ C p u × T = × ( λ T ) + Q
where T is the temperature (°C/K), ρ is the material density (kg/m3), Cp is the material specific heat capacity at constant pressure (J/(kg∙K)), λ is the material thermal conductivity (W/(m∙K)), u is the Darcy flow velocity of the fluid (m/s), and Q is an internal or external heat source (W/m3).
If the drainage and self-weight consolidation of the CPB are ignored, the fluid velocity can be set at zero (u = 0 m/s). Equation (1) then becomes
ρ C p T t × ( λ T ) = Q
In the case of backfilled stopes in permafrost, the CPB can change from an unfrozen (phase 1) to a frozen (phase 2) state. To account for the phase change, a latent heat term is added to the thermal balance using a formulation based on the apparent heat capacity method [34]. This formulation has been applied and discussed by different authors [46,47]. It is assumed that the phase change of the CPB occurs at a temperature Tpc and that the transformation occurs during a temperature interval ΔT from Tpc ΔT/2 to Tpc + ΔT/2. In this interval, the CPB phase is modeled by a smoothed function θ representing the volume fraction (the volume of one phase divided by the volume occupied by both phases) of the frozen phase (phase 2) during the transition. Accordingly, θ = 1 when the CPB is completely frozen (for temperatures TTpc ΔT/2) and θ = 0 when the CPB is completely unfrozen (TTpc + ΔT/2). The volume fraction θ over the phase change interval can be approximated by a linear or an error function. The material density ρ and thermal properties λ and Cp in the transition phase can be computed with the equations [34]
ρ = θ ρ p h a s e 2 + ( 1 θ ) ρ p h a s e 1
λ = θ λ p h a s e 2 + ( 1 θ ) λ p h a s e 1
C p = 1 ρ ( θ ρ p h a s e 2 C p , p h a s e 2 + ( 1 θ ) ρ p h a s e 1 C p , p h a s e 1 ) + L d α m d T
where
α m = 1 2 ( 1 θ ) ρ p h a s e 2 θ ρ p h a s e 1 θ ρ p h a s e 1 + ( 1 θ ) ρ p h a s e 2
In Equation (6), αm is the mass fraction of the frozen to the unfrozen phase, which is used to model the material in the transition phase (αm = −1/2 for θ = 1 and αm = +1/2 for θ = 0), and dαm/dT is the Dirac pulse. L is the freezing latent heat (kJ/(kg∙K)) of the porous media (but not of water).
Solving Equation (1) or (2) requires prior knowledge of ρ, Cp, and λ for each phase (see Equations (3)–(5)) and L. In this study, ρ, Cp, and λ for unfrozen and frozen CPB were determined experimentally in the laboratory (see Section 3.3). For the freezing latent heat L of CPB, no data are available in the literature. However, typical values for the freezing latent heat of soils are available in the literature (e.g., [48,49]). In this study, L was obtained by adjusting the numerical results with data collected from the 3D physical model described in Section 3.3 (see details in Section 5.1).

3. Materials and Testing Methods

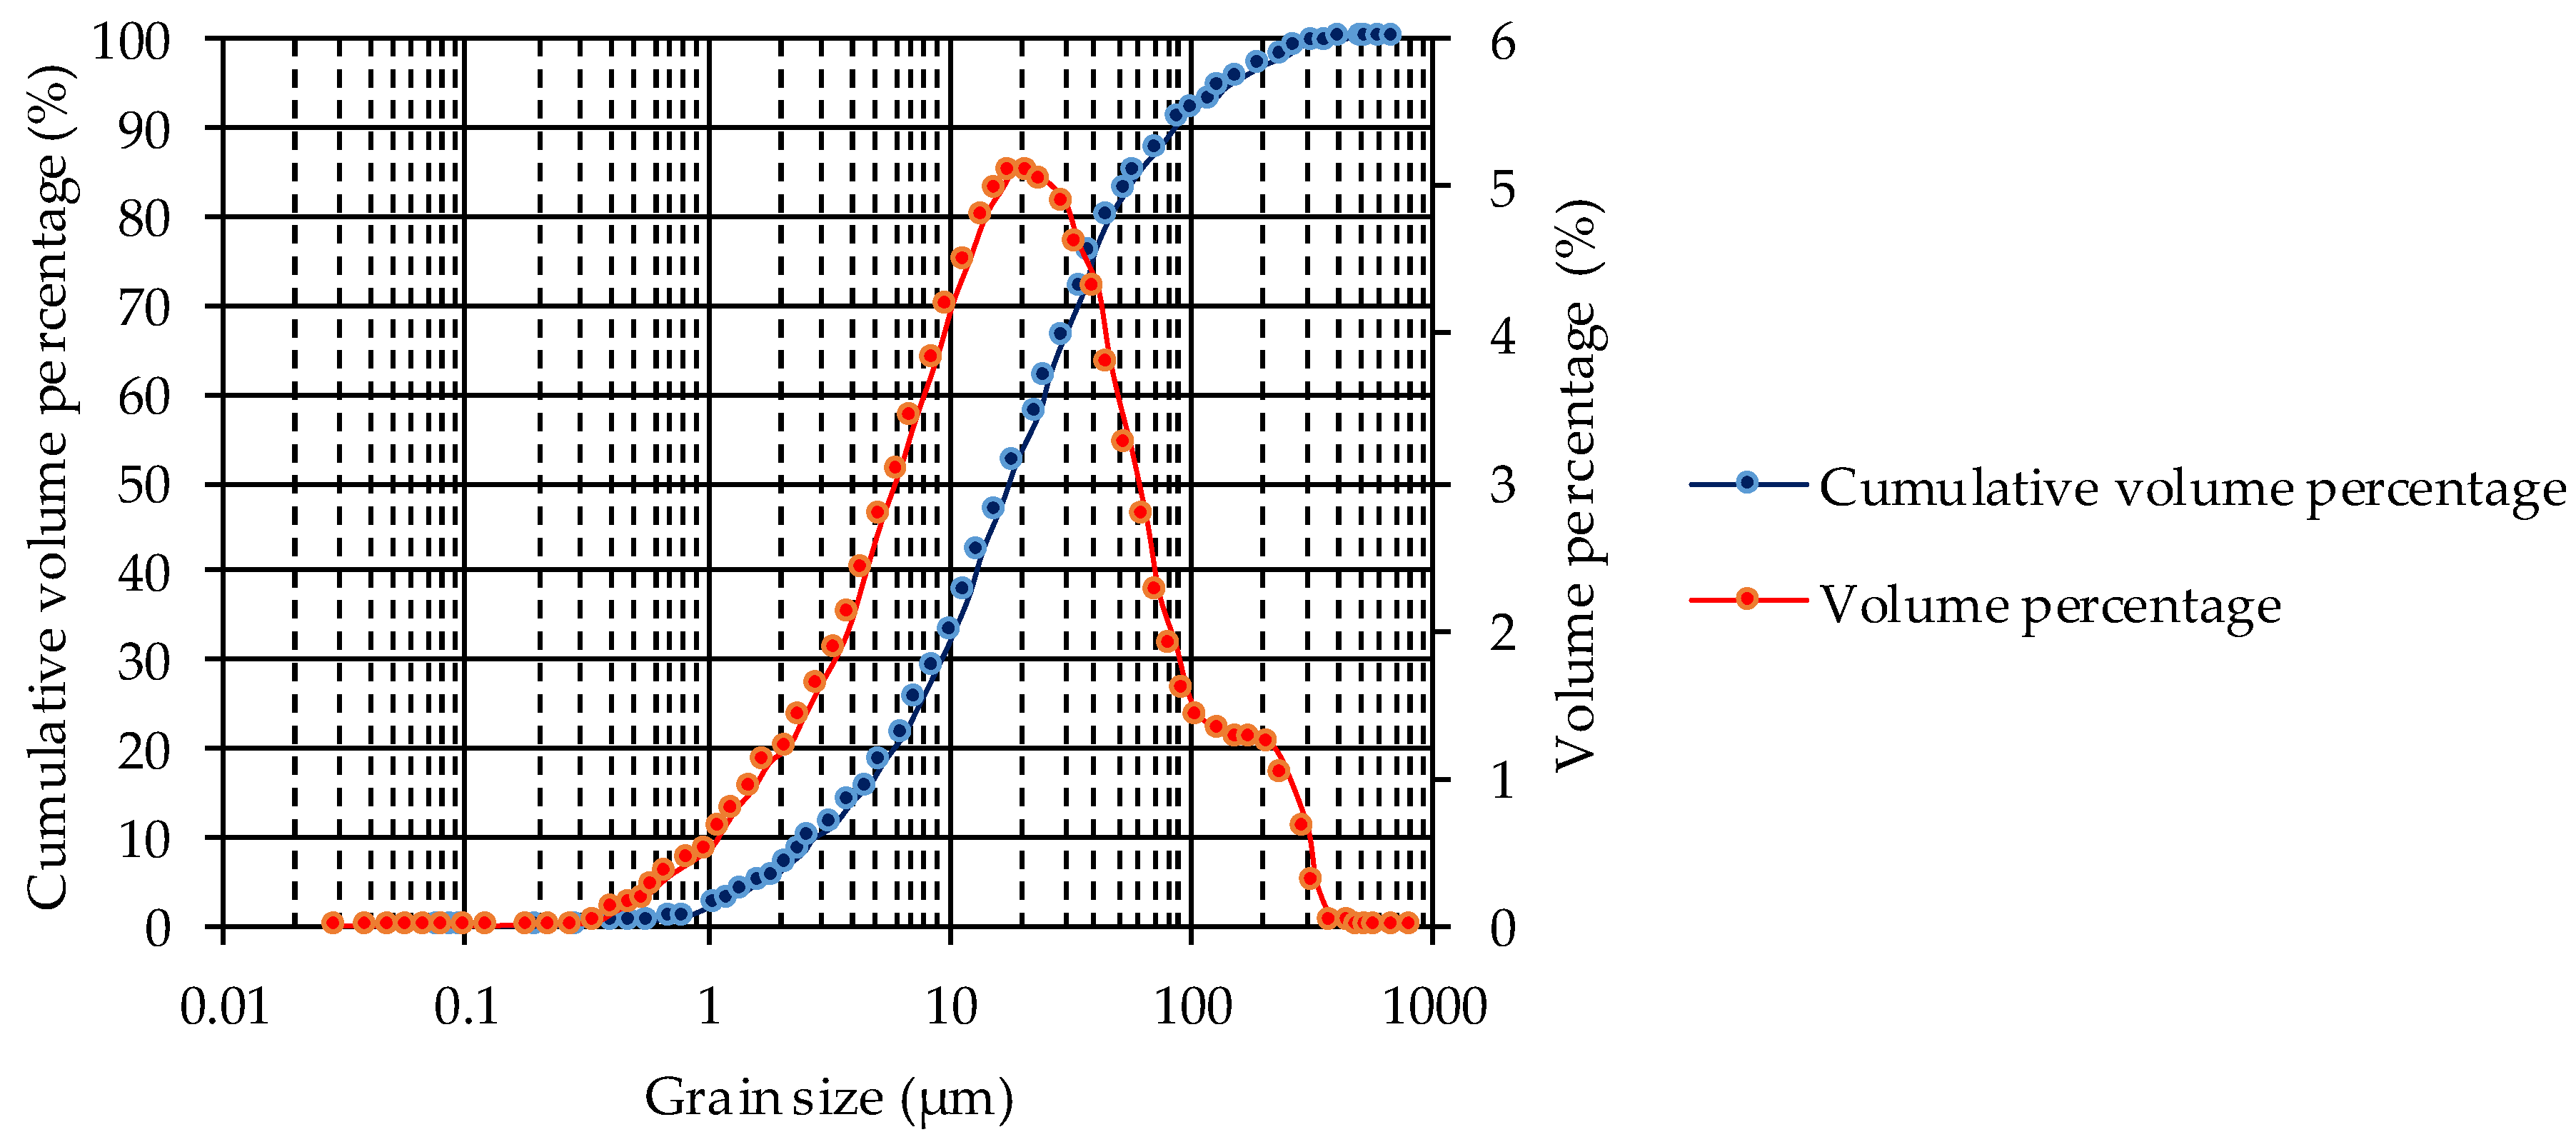
3.1. Characteristics of Tailings, Binder, and Mixing Water

The tailings used to prepare the CPB were obtained by grinding core samples from Mine A located in Nunavut Territory in northern Canada. The tailings sample was subjected to physical (grain-size distribution and specific gravity), chemical, and mineralogical characterization. The grain-size distribution (GSD) was determined using a Malvern Mastersizer laser granulometer. Several analyses were conducted, and the average cumulative GSD curve is shown in Figure 1.
Table 1 presents the main gradation parameters for the Mine A tailings. Dx is the size (diameter) at x% of grains passing on the cumulative GSD curve; P2, P20, and P80 are the percentages passing for grain diameters of 2 µm, 20 µm, and 80 µm, respectively; and CU and CC are the coefficients of uniformity and curvature, respectively. The ultrafine fraction indicated by P20 is 53%. According to the tailings classification system proposed by Landriault [5], the tailings class with 36% ≤ P20 ≤ 60% is defined as medium-sized, which is the case for the Mine A tailings used in this study.
The specific gravity of the Mine A tailings (GS) was determined using a Micromeritics helium pycnometer. The measured average GS was 2.9.
The mineralogical composition of the Mine A tailings was determined by X-ray diffraction (XRD). Results are presented in Table 2. Knowing the mineralogical composition allowed predicting the thermal properties of the tailings and comparing them with measured properties (see [42]).
The binder used for CPB preparation was High Early (HE) type Portland cement (formerly called Type III cement, according to ASTM C 150-07 [50]). This binder was selected for its early strength development, which is desirable for backfilling in the permafrost. According to the Portland Cement Association (PCA), the mean chemical composition of Type III cements consists of 20.6% SiO2, 4.9% Al2O3, 2.8% Fe2O3, 63.4% CaO, 2.2% MgO, 3.5% SO3, and 0.56% Alcali (Na2O eq.). The binder content (Bw = mass of cement/dry mass tailings) was fixed at 5% by the industrial partner.
Considering the possible water salinity of the mining project development in northern Canada (Nunavut Territory), mixing water containing 5 g/L salinity was proposed by the industrial partner. Saline mixing water was prepared by adding different prescribed proportions (see Table 3) of calcium chloride (CaCl2), potassium chloride (KCl), sodium chloride (NaCl), magnesium sulfate heptahydrate (MgSO4∙7H2O), magnesium chloride hexahydrate (MgCl2∙6H2O), sodium metabisulfite (Na2S2O5), and copper sulfate pentahydrate (CuSO4∙5H2O) to deionized water. Each salt concentration was provided by the industrial partner and is representative of the expected water composition at the backfill plant.

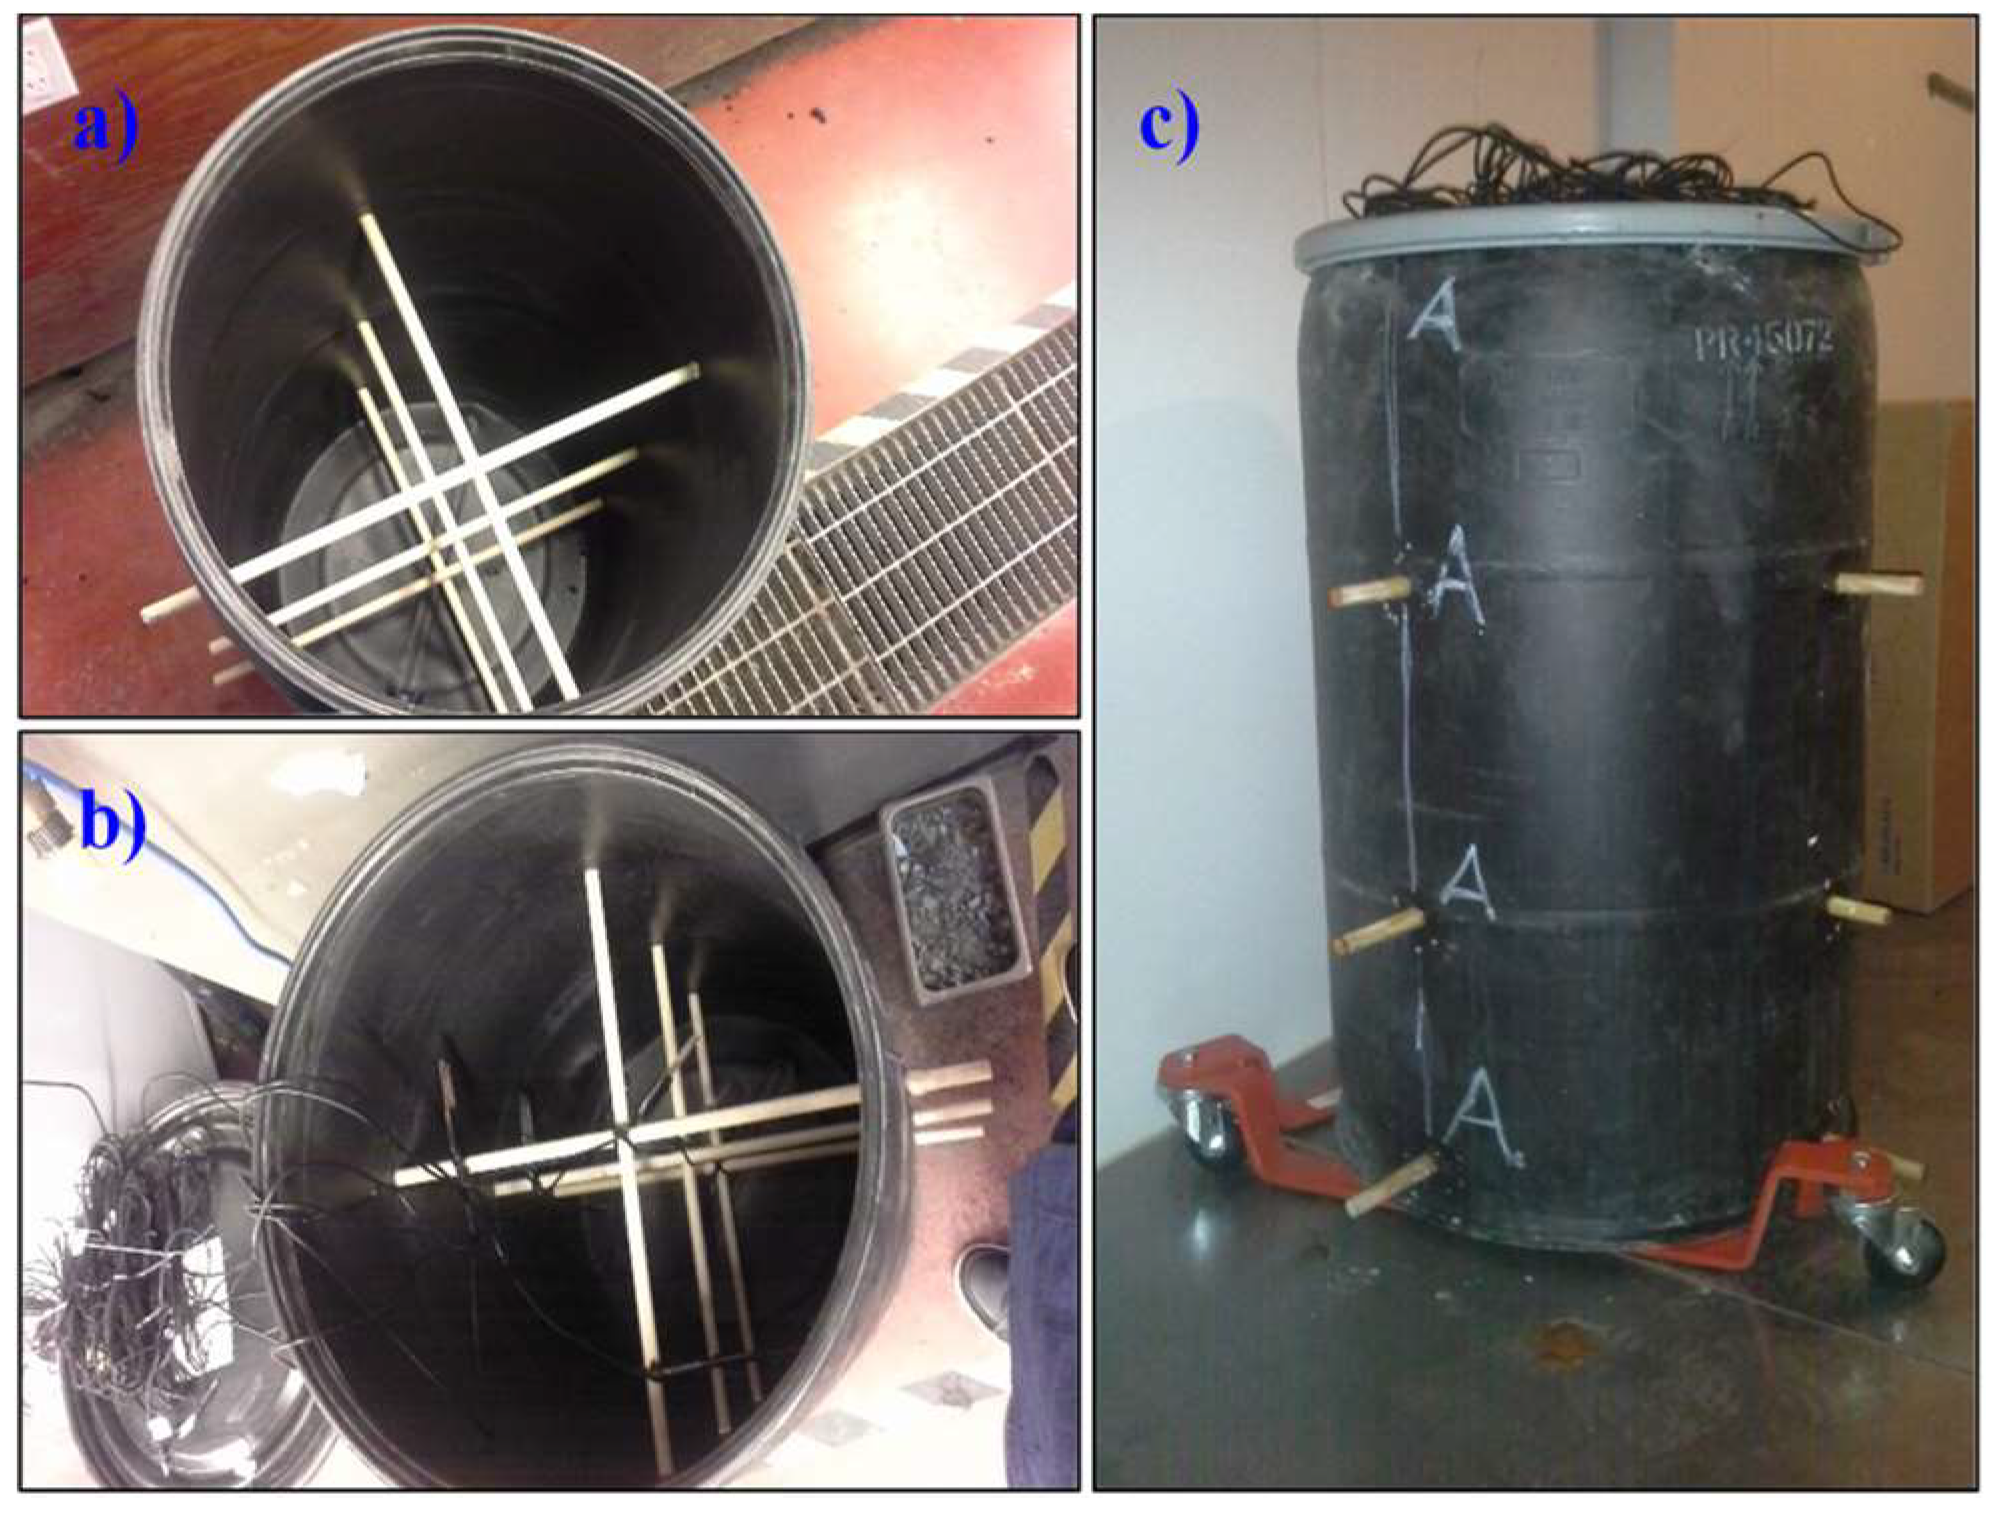
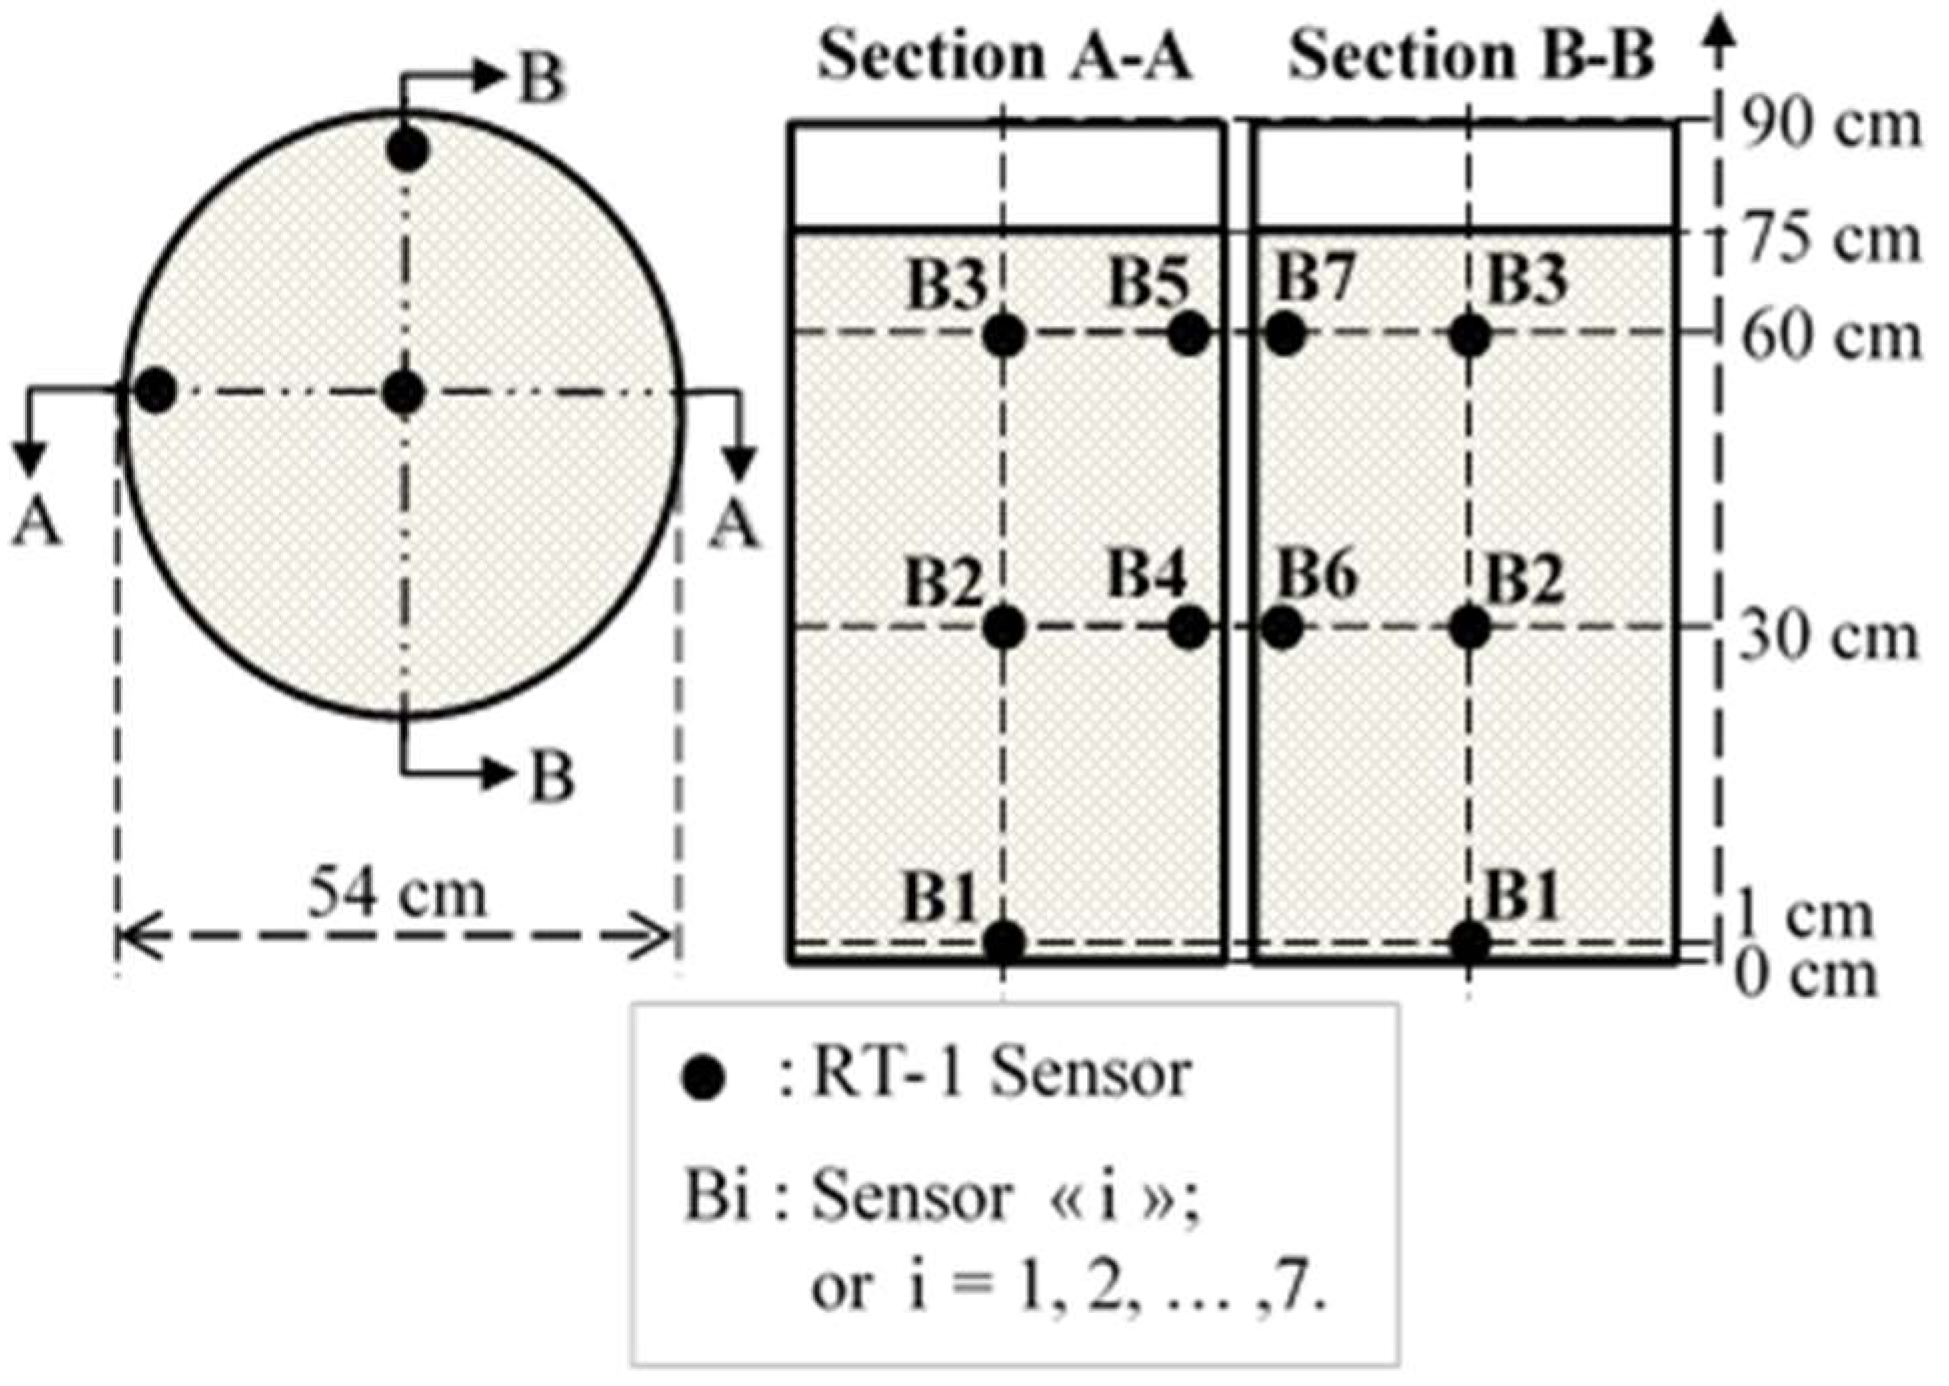
3.2. D Heat Transfer Tests on a Physical Model

CPB containing 5% of HE Portland cement was prepared at a consistency of 17.8 cm (7 inches) using the standard Abrams cone [51]. Previous studies have shown that slumps ranging from 152 mm to 254 mm (6 to 10 inches) are required to ensure adequate pipeline transport of CPB [52]. In this study, the solid mass (Cw) and water (w) contents of the prepared mixtures were 76.3% and 31.1%, respectively. The two CPB mixtures were prepared simultaneously in the laboratory using two 25-kg capacity Hobart mixers for a prescribed mixing time of 7 min according to laboratory practice.
To determine 3D heat transfer in CPB at a laboratory scale, a PVC barrel 54 cm in diameter and 90 cm high was used. The barrel was instrumented with seven RT-1 sensors arranged in two orthogonal vertical planes, as illustrated in Figure 2a. An RT-1 sensor was placed outside the barrel to measure the ambient temperature in the cold room. Wooden rods were used to support the sensors in the barrel, as shown in Figure 2b. Figure 3 shows the location of the RT-1 sensors in a plan view and two vertical section views. Approximately 410 kg of CPB were required to fill the barrel. The CPB mixtures were prepared simultaneously using two 50-kg capacity mixers for 8.5 rotations. The filled barrels were then capped with a lid (see Figure 2c) and placed in a temperature-controlled cold room where the CPB cured at about −11 °C (temperature imposed by other ongoing tests in the cold room). Data were recorded hourly for 18 days to monitor temperature changes.

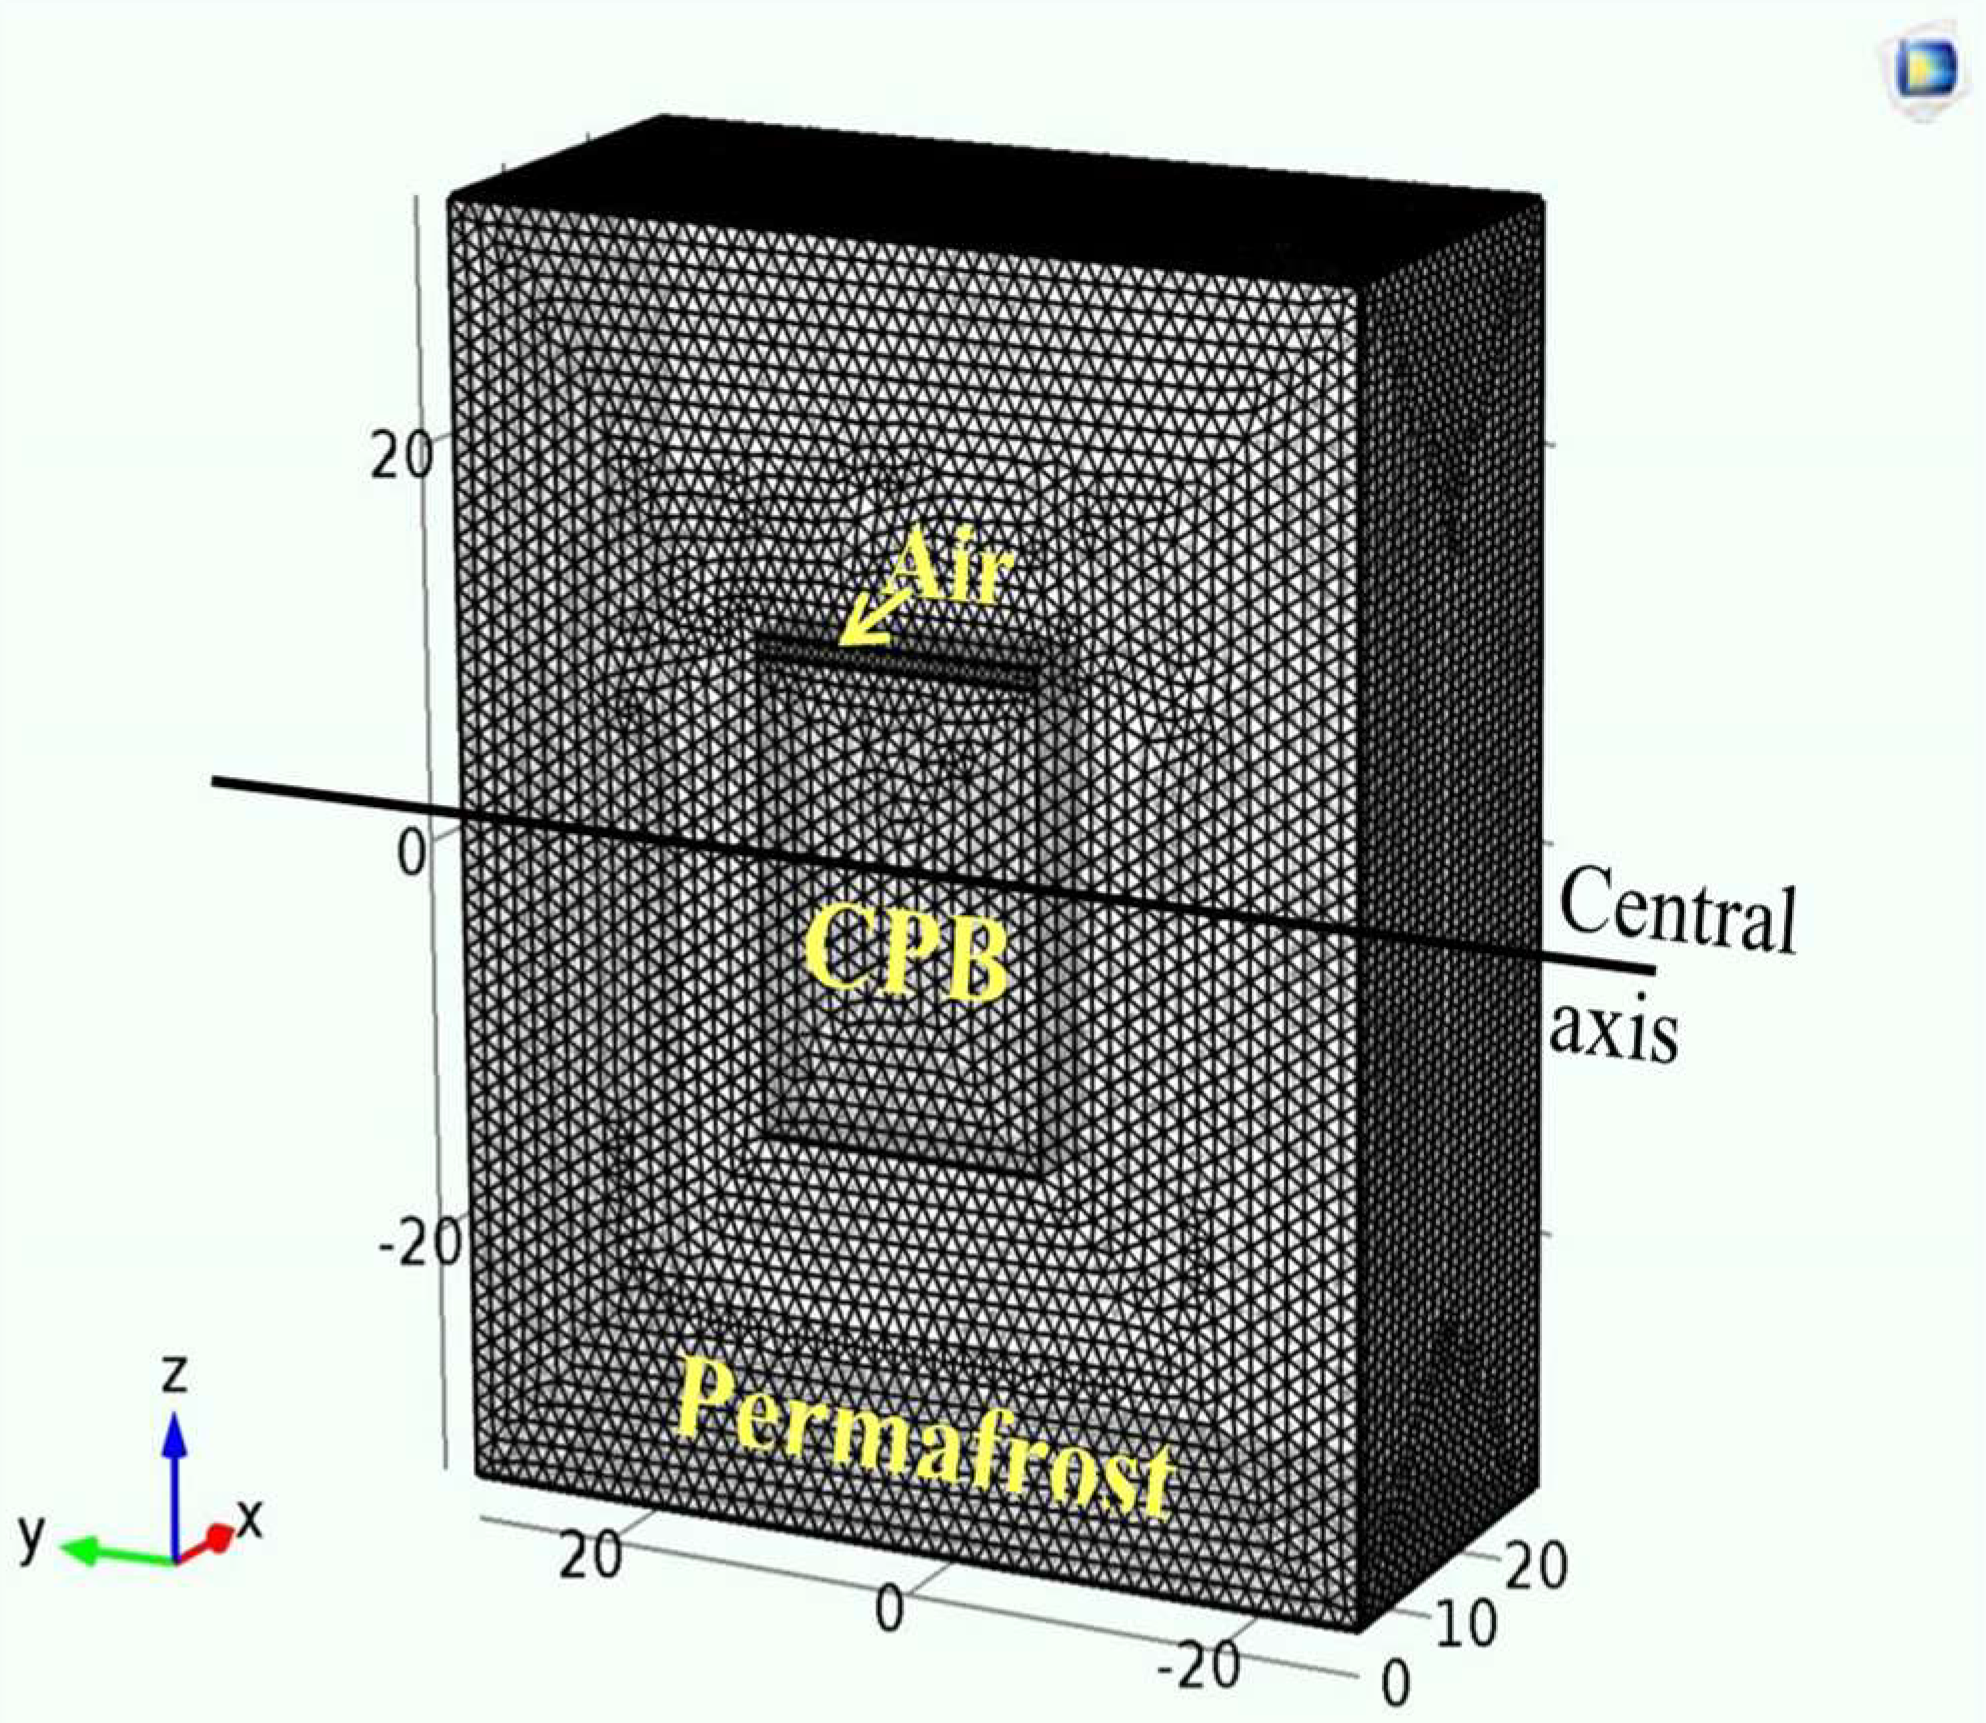
3.3. Numerical Models Using COMSOL Multiphysics®

All parameters required to solve Equation (1) were known (measured or taken from the literature; see details in Section 5.1), except for the latent heat L (see Equation (5)) of CPB materials (see details in Table 4).
Details on the measurement of thermal properties of frozen und unfrozen CPB using the KD2 Pro thermal properties analyzer are given in the introduction and in Beya et al. [42]. Data obtained from sensor B2 (chosen arbitrarily) located near the center of the barrel (see Figure 3) were used to calibrate the numerical model by adjusting the L value until a good match was obtained between the numerical and experimental results. The calibrated model with the obtained L value was further validated by comparing the temperature distribution and evolution measured elsewhere and predicted with the numerical model. This calibrated and validated numerical model was then used to simulate heat transfer in an idealized backfilled mine stope in a permafrost region.
For the numerical modeling, one 3D model was created for the barrel and another model for a typical open stope surrounded by a permafrost rock mass. The thermal properties of the different materials were assigned to each model geometry (see Table 4).
No source of internal heat (Q = 0 in Equations (1) and (2)) was incorporated in the numerical models, for two reasons: (1) no impact of heat generated by binder hydration in the CPB on temperature was observed during the column tests (not shown here); and (2) information on the hydration heat generated during CPB curing under low temperature was lacking. The hydromechanical behavior of CPB (i.e., drainage and self-weight consolidation) was not considered here, as mentioned above (u = 0 in Equation (1)). Appropriate boundary and initial conditions were applied (see details in Section 5.1 and Section 5.2). An extremely fine mesh was used to ensure accurate and stable numerical results. The numerical modeling was time-dependent.

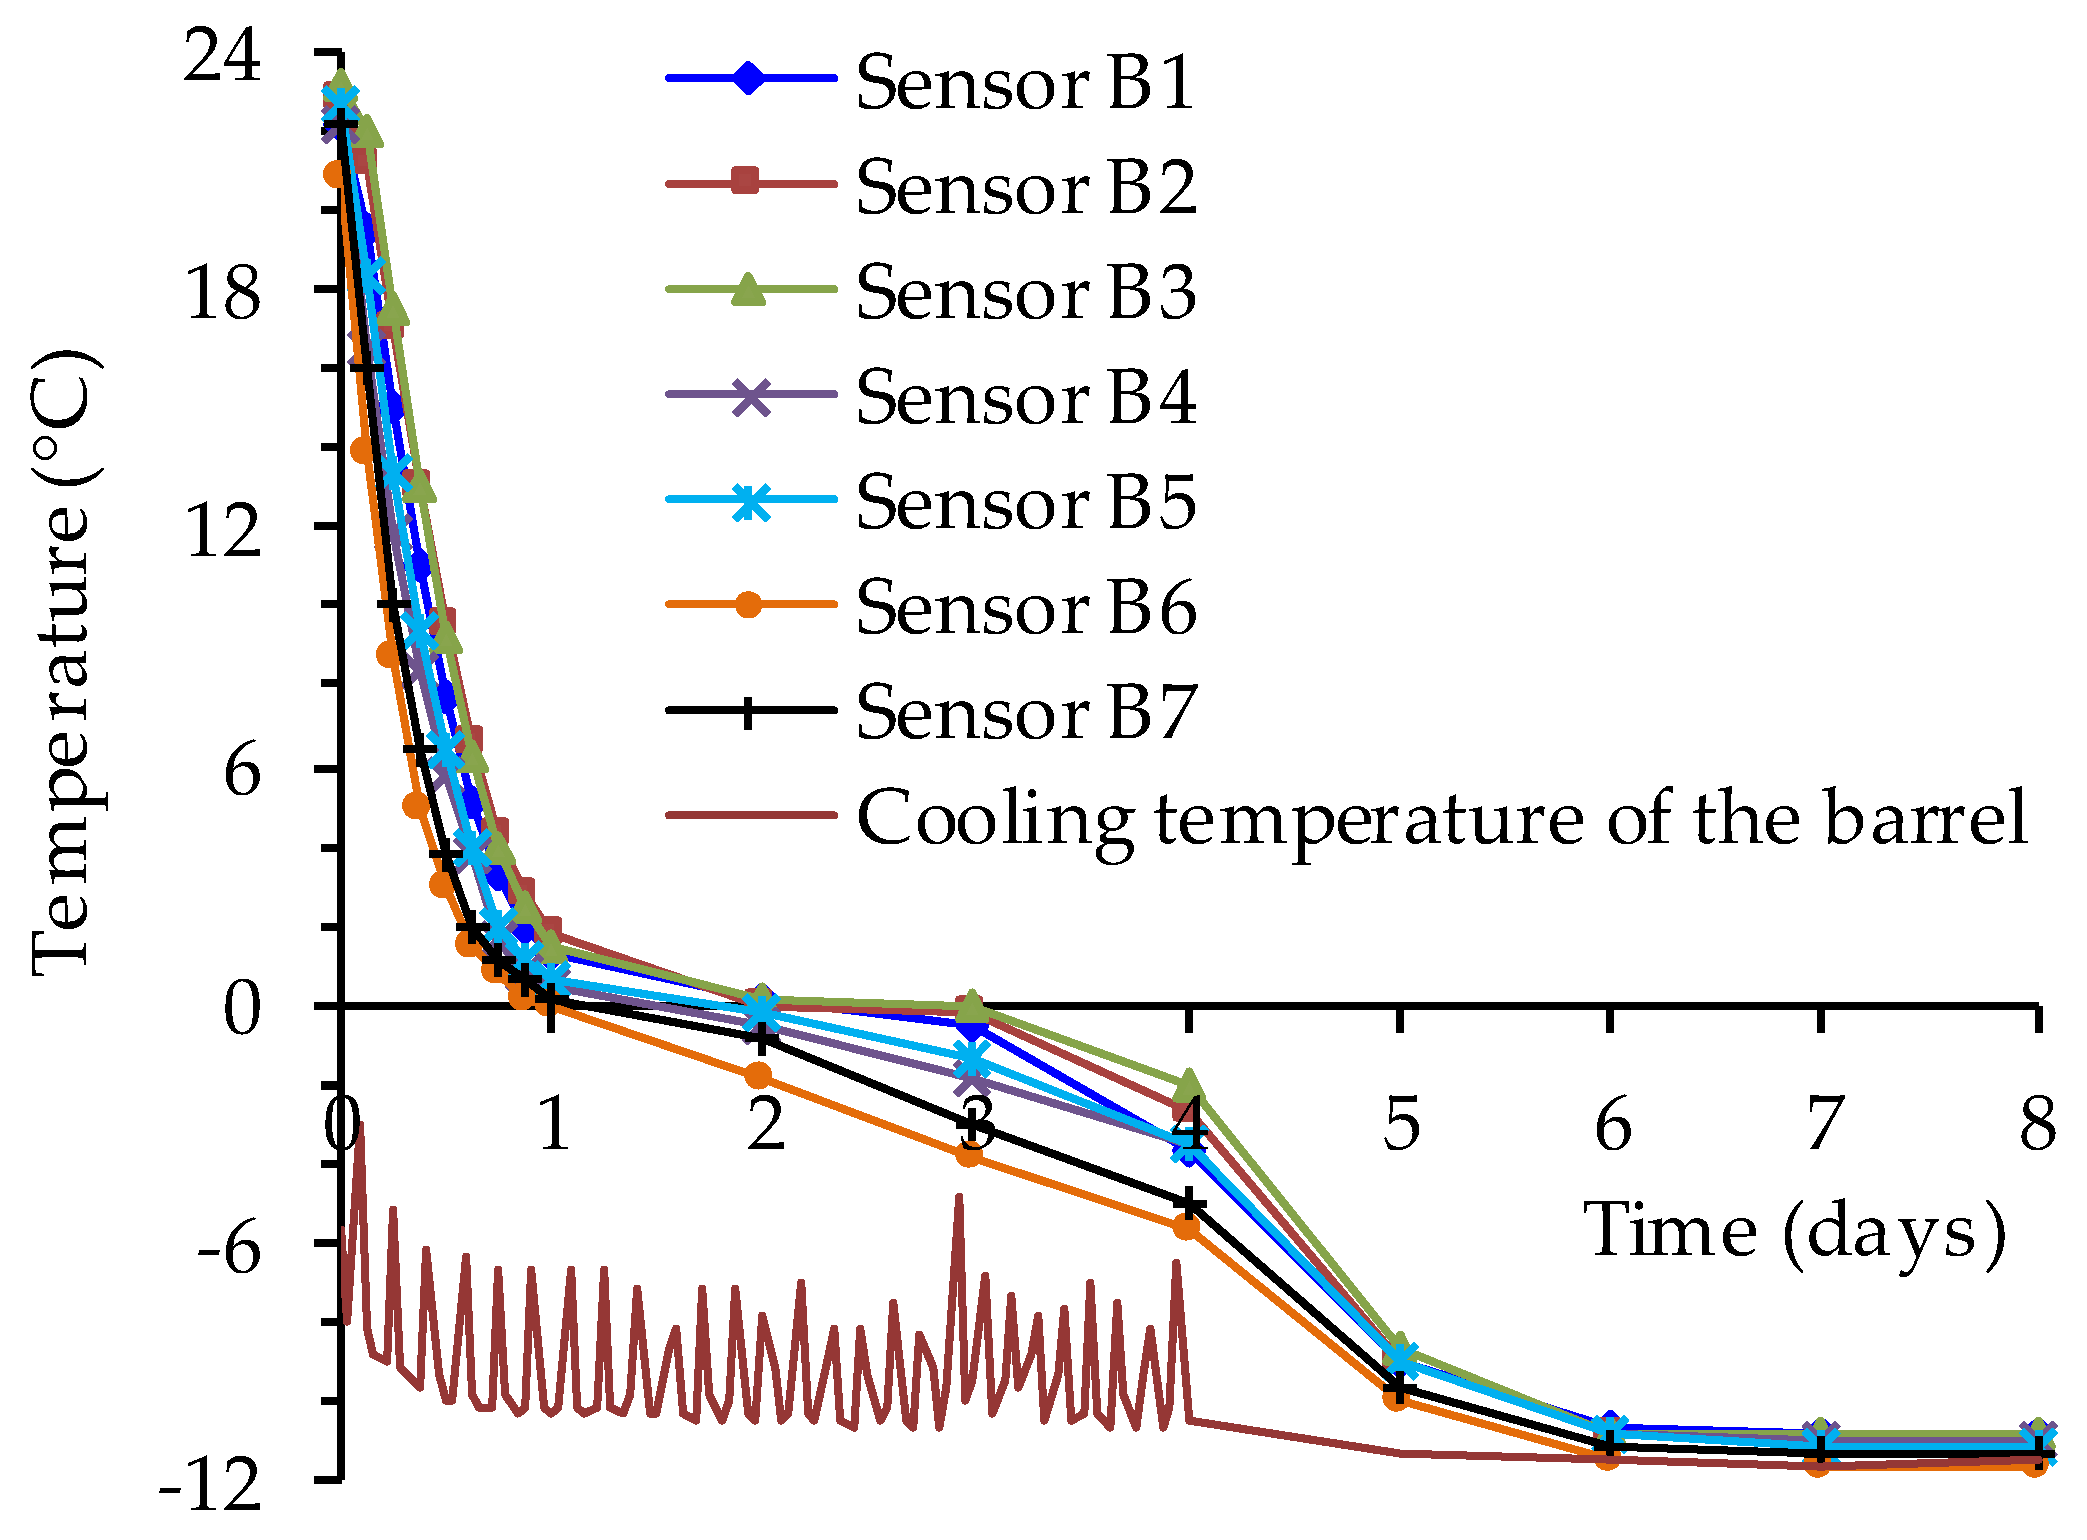
4. Laboratory Results for the 3D Heat Transfer Test

To determine 3D heat transfer, the PVC barrel (described in Section 3.2) was filled with CPB prepared with saline mixing water (5 g/L) at Cw = 76.3% and Bw = 5% (type HE Portland cement). The CPB was cured in a cold room at a controlled temperature of approximately −11 °C. Figure 4 shows the changes in temperature over time for the seven sensors (see the sensor configuration in Figure 3). Although the test lasted for 18 days, only the results for the first eight days are presented, because the temperature stabilized at around day six. Fluctuations in the freezing temperature were observed during the first four days due to malfunction of the cold room. Figure 4 shows a rapid temperature decrease during day one, as captured by all the sensors. After two days, the entire backfill reaches 0 °C. From day one to day four, the temperature decreases slightly, showing a transition plateau, probably due to the phase change from unfrozen to frozen CPB. The temperature decreases rapidly thereafter until around day six, when it stabilizes at the cooling temperature of −11 °C. Generally, temperatures are lower close to the barrel wall (sensors B4 to B7) than at the center of the CPB (sensors B1 to B3).

5. Numerical Modeling Results for Heat Transfer

5.1. Input Parameters and Initial and Boundary Conditions

The experimental data presented in Section 4 were used to calibrate and validate the numerical model created with the heat transfer module in COMSOL Multiphysics® 5.2. The heat transfer through solid (PVC barrel and permafrost rock), fluid (air in the void space above the backfill in the barrel, columns, and CPB in the stope), and porous media (PT and CPB) was modeled. The main input parameters for the simulations are given in Table 4, including the data sources. As described in Section 2, the latent heat of freezing L (see Equation (5)) was obtained by adjusting the numerical results with the data collected from sensor B2 in order to obtain matching results during the phase change period observed for the barrel (see Figure 5).

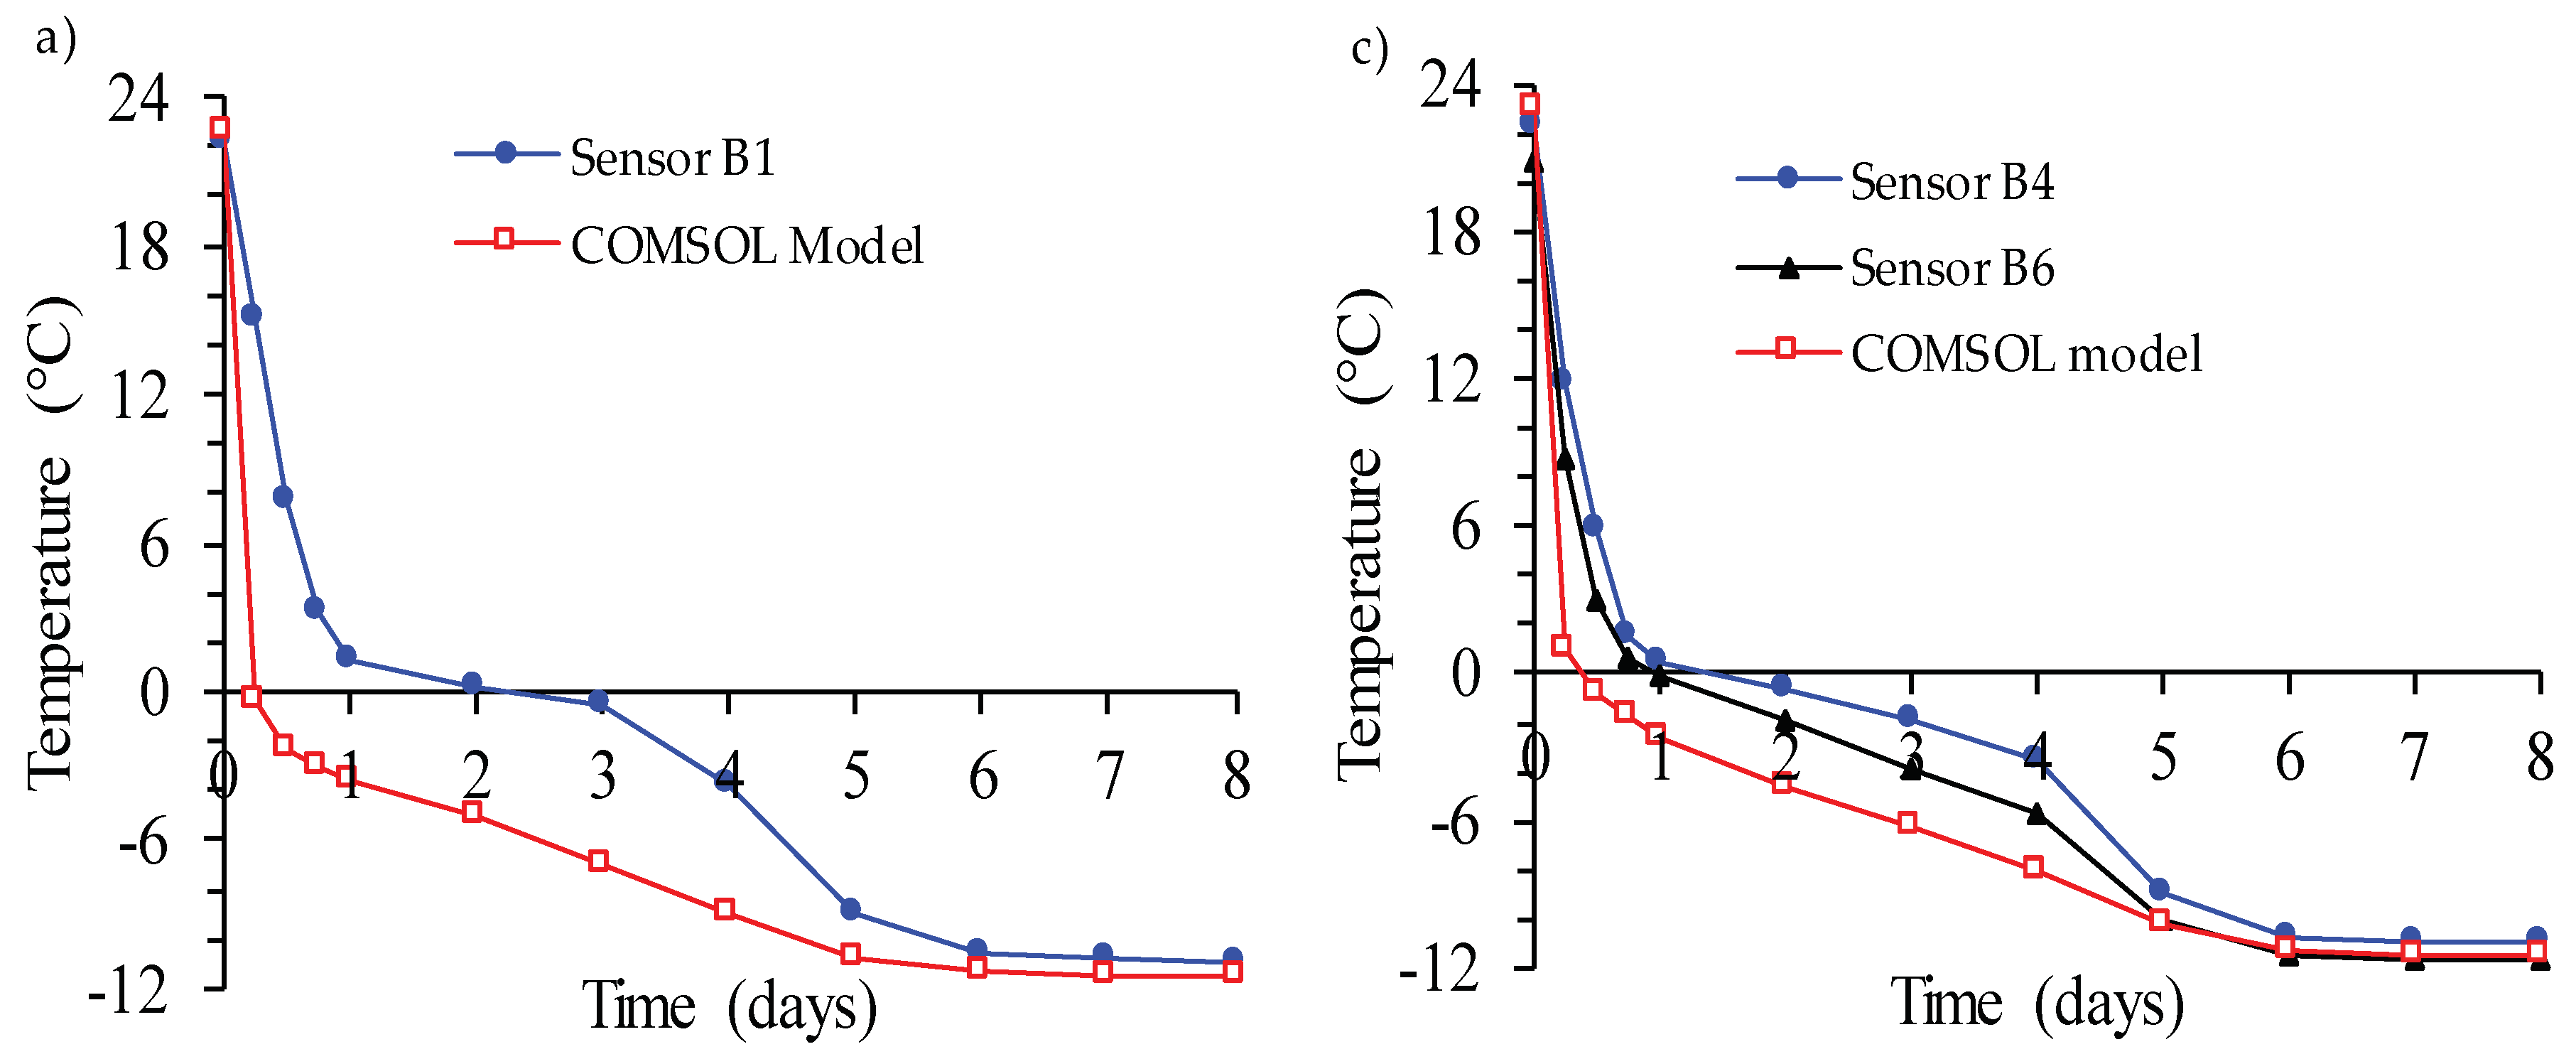
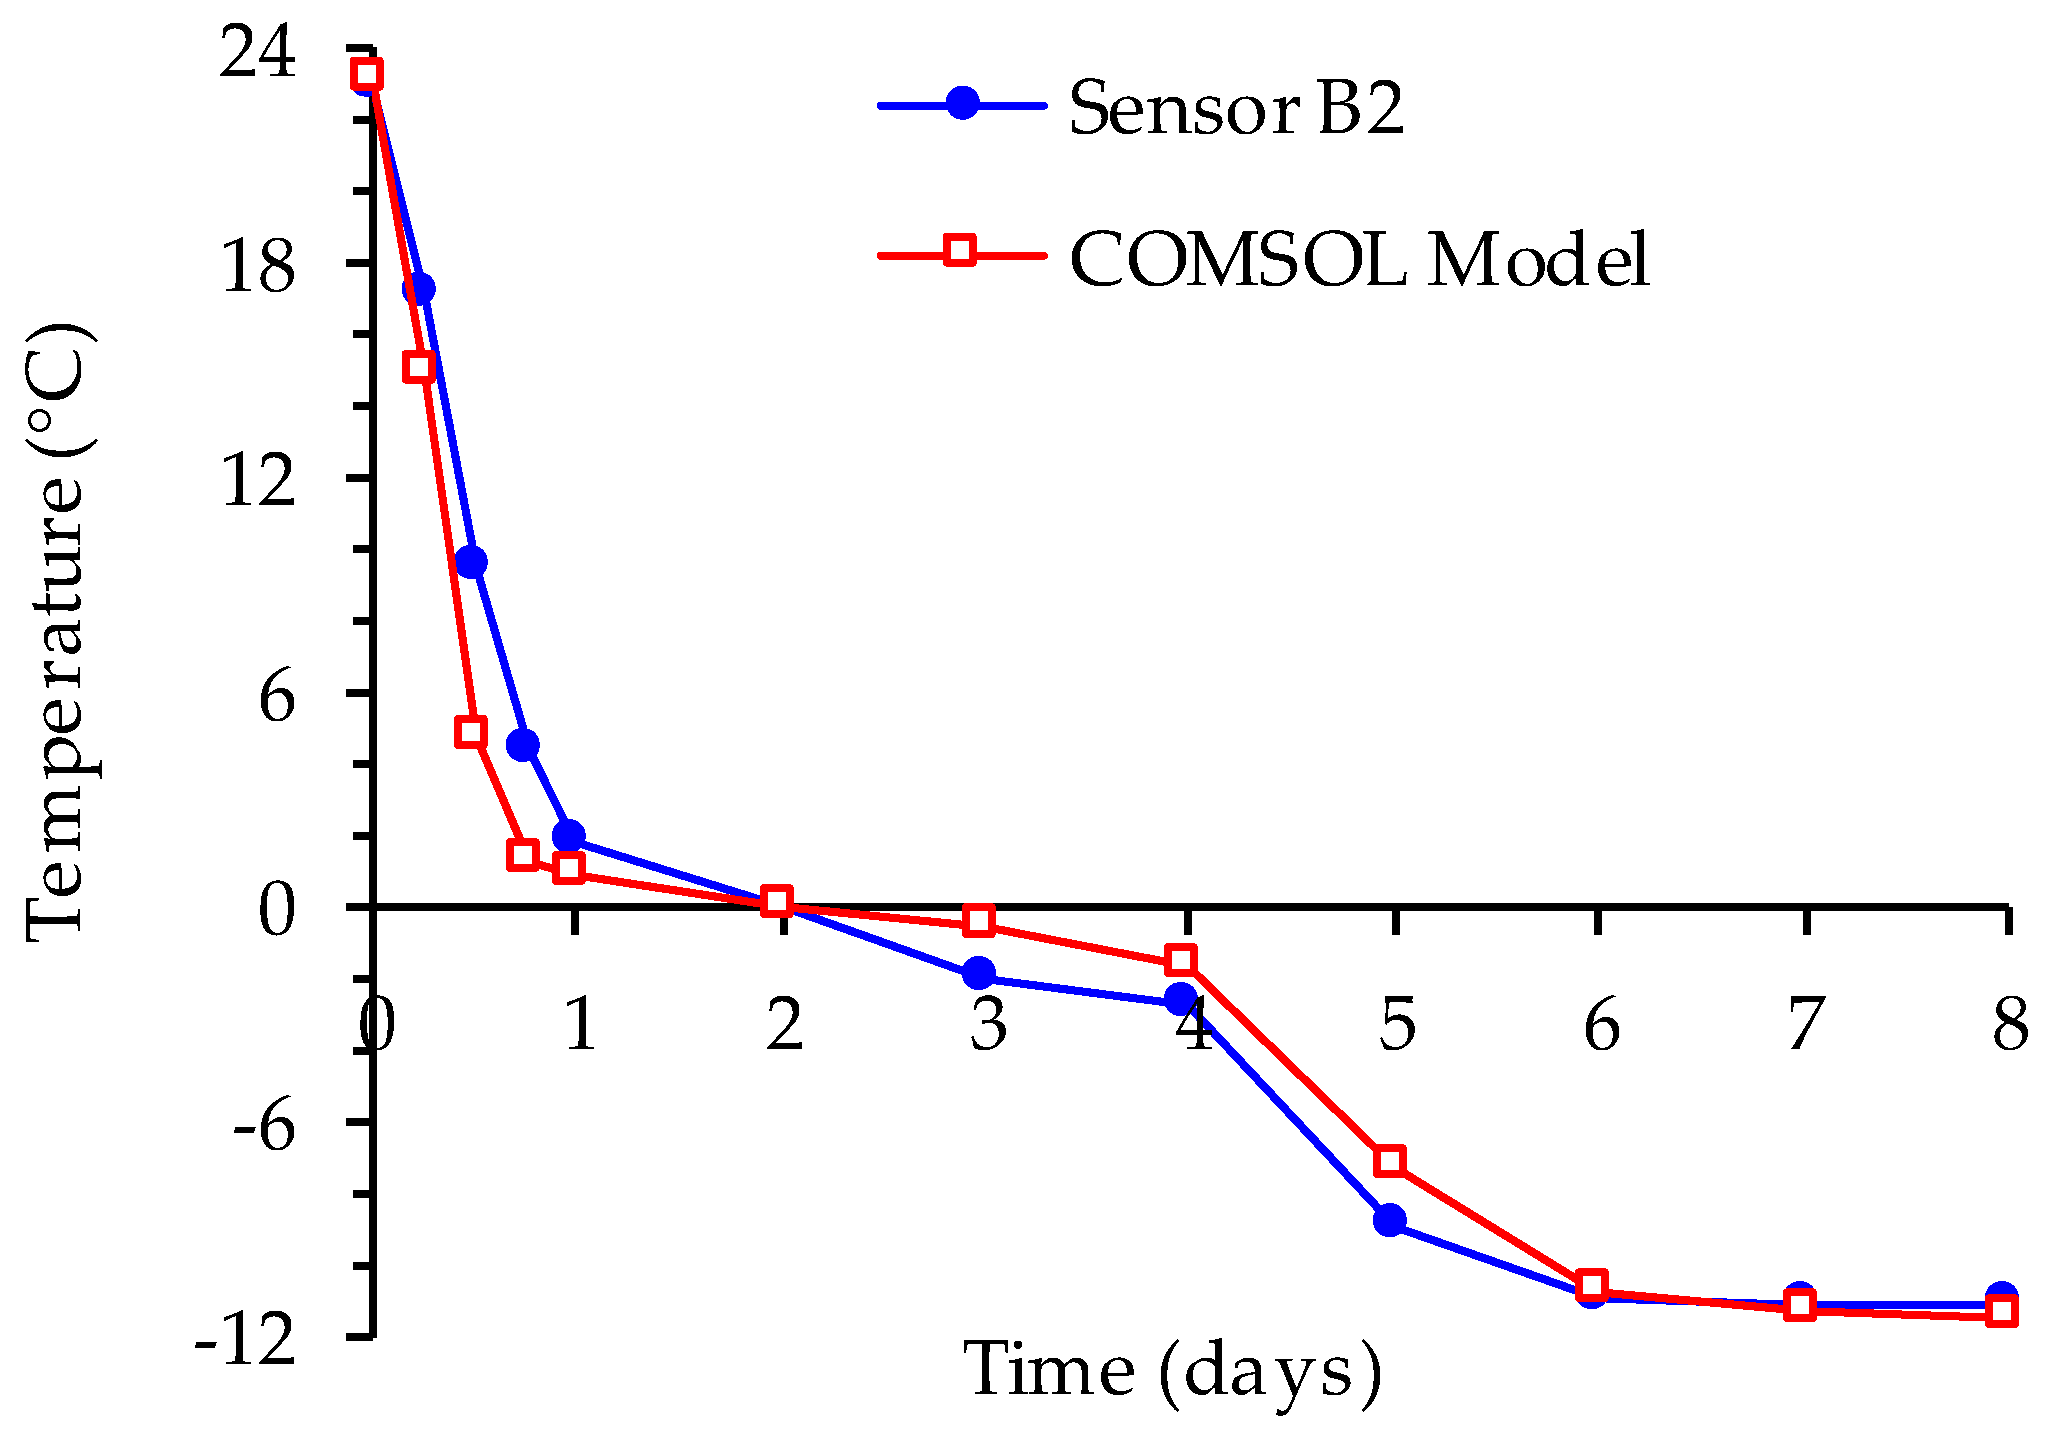
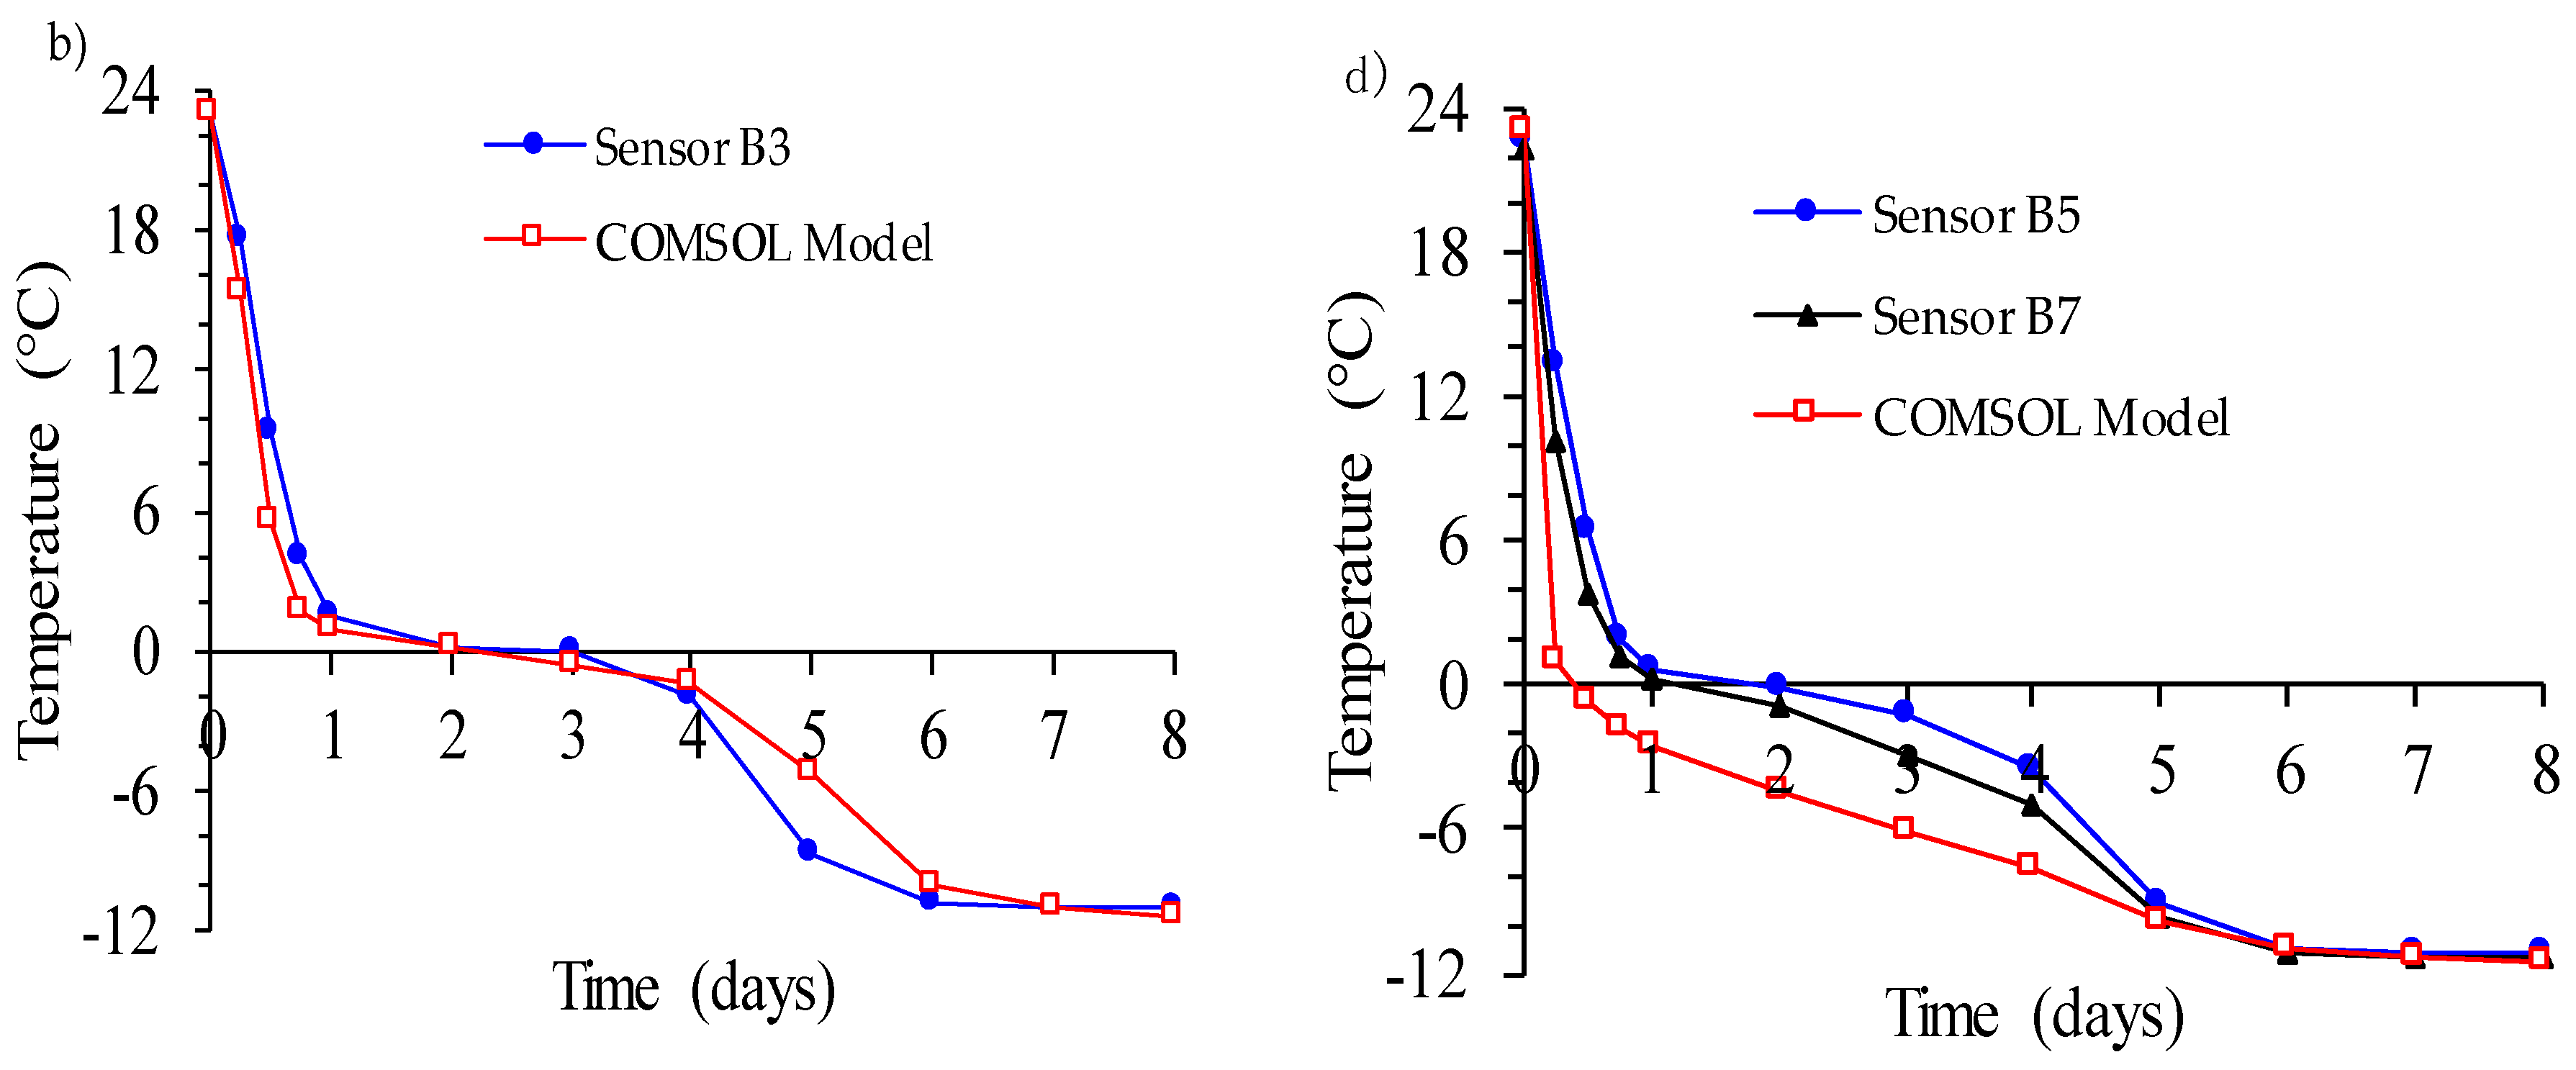
5.2. Model Validation by Comparing Predicted and Experimental Data Obtained from 3D Heat Transfer Tests on CPB Cooled to Freezing

For 3D heat transfer modeling in the barrel, the temperature measured in the cold room during testing (see Figure 6) was applied over the entire exterior barrel surface as a boundary condition. Figure 6 shows the 3D temperature distribution in the CPB in the barrel after 72 h of curing. A gradual drop in temperature can be observed within the CPB matrix. After 72 h, the temperature was approximately 0 °C at the barrel center.
Figure 7 shows comparisons between the temperature evolution observed in the laboratory and the numerically simulated predictions for the first eight days of testing. The measured and numerical results showed good agreement at location B3. For sensors B1, B4, B6, B5, and B7, which were located close to the barrel walls, predicted temperature values were slightly lower than laboratory-measured values, specifically for the first four days (i.e., the period in which the cooling temperature fluctuated). Again, this could be explained by heat dissipation through the barrel walls. Thus, it is possible that the temperature on the exterior barrel wall did not reach room temperature (−11 °C) instantaneously at test start, whereas in the numerical model, a constant boundary condition of −11 °C was applied from the start. The actual temperature on the outside barrel wall should have been applied as a boundary condition. Unfortunately, this temperature was not monitored during testing. Nevertheless, the experimental and numerical results show fairly good agreement.

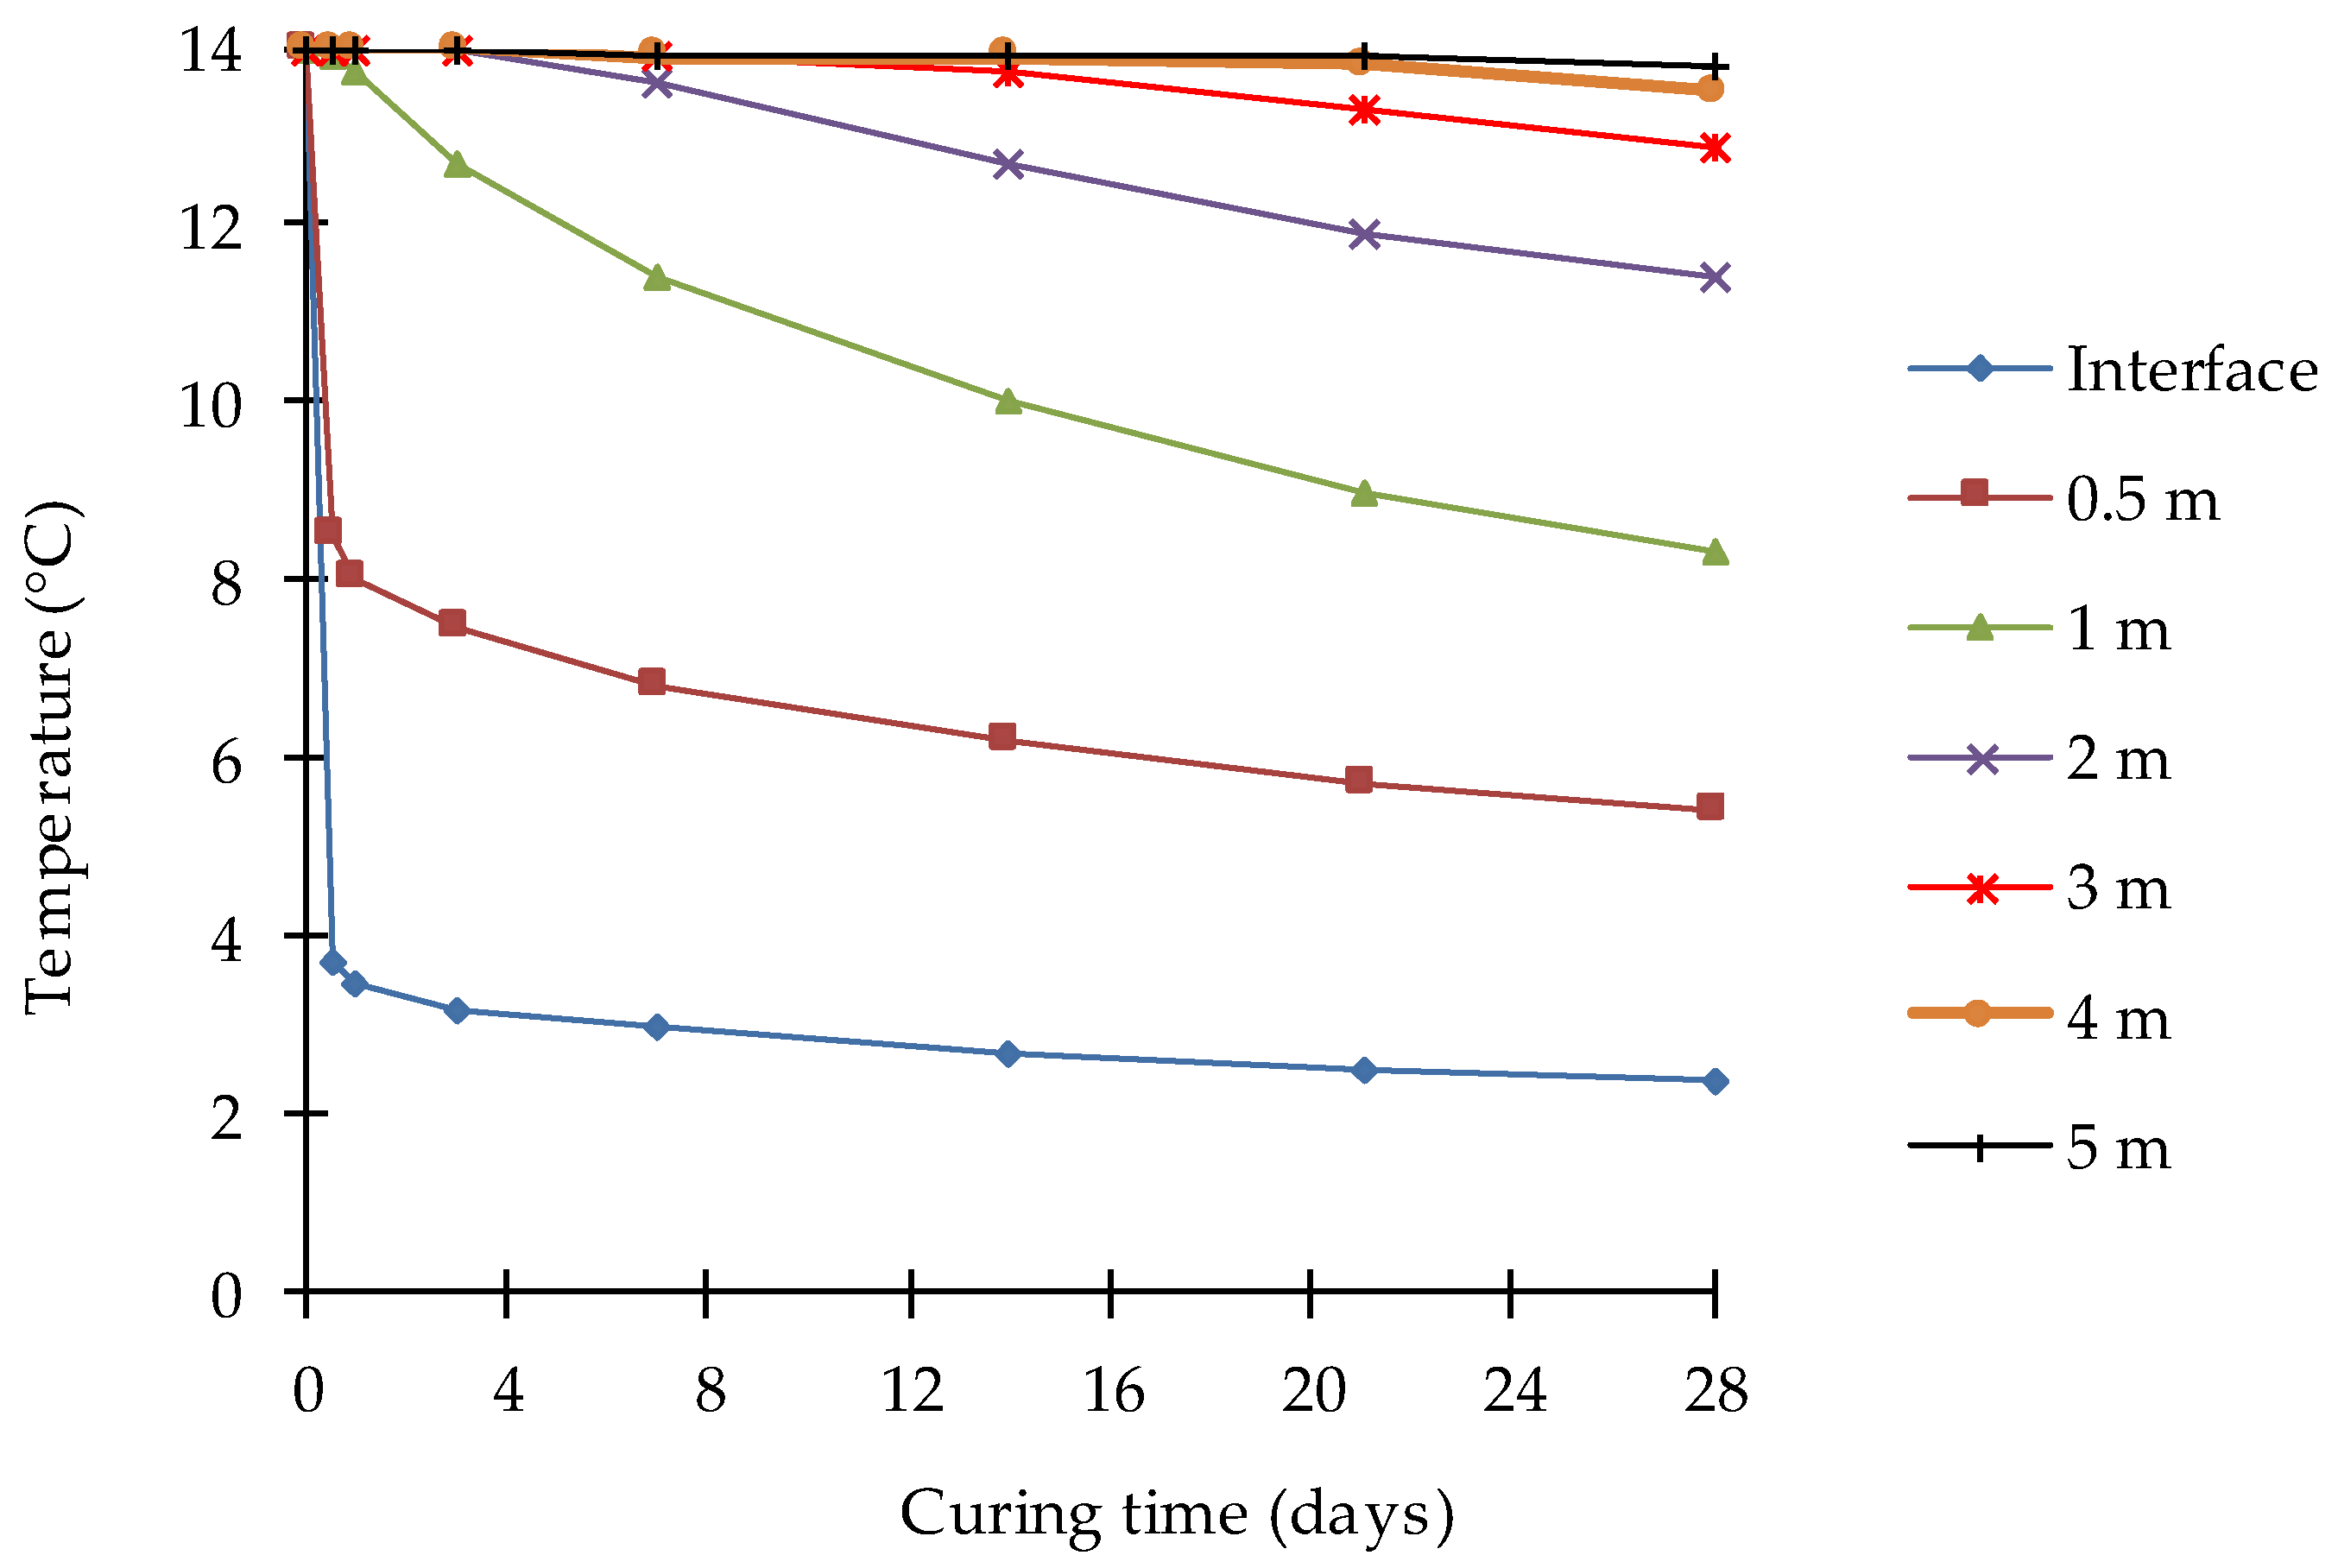
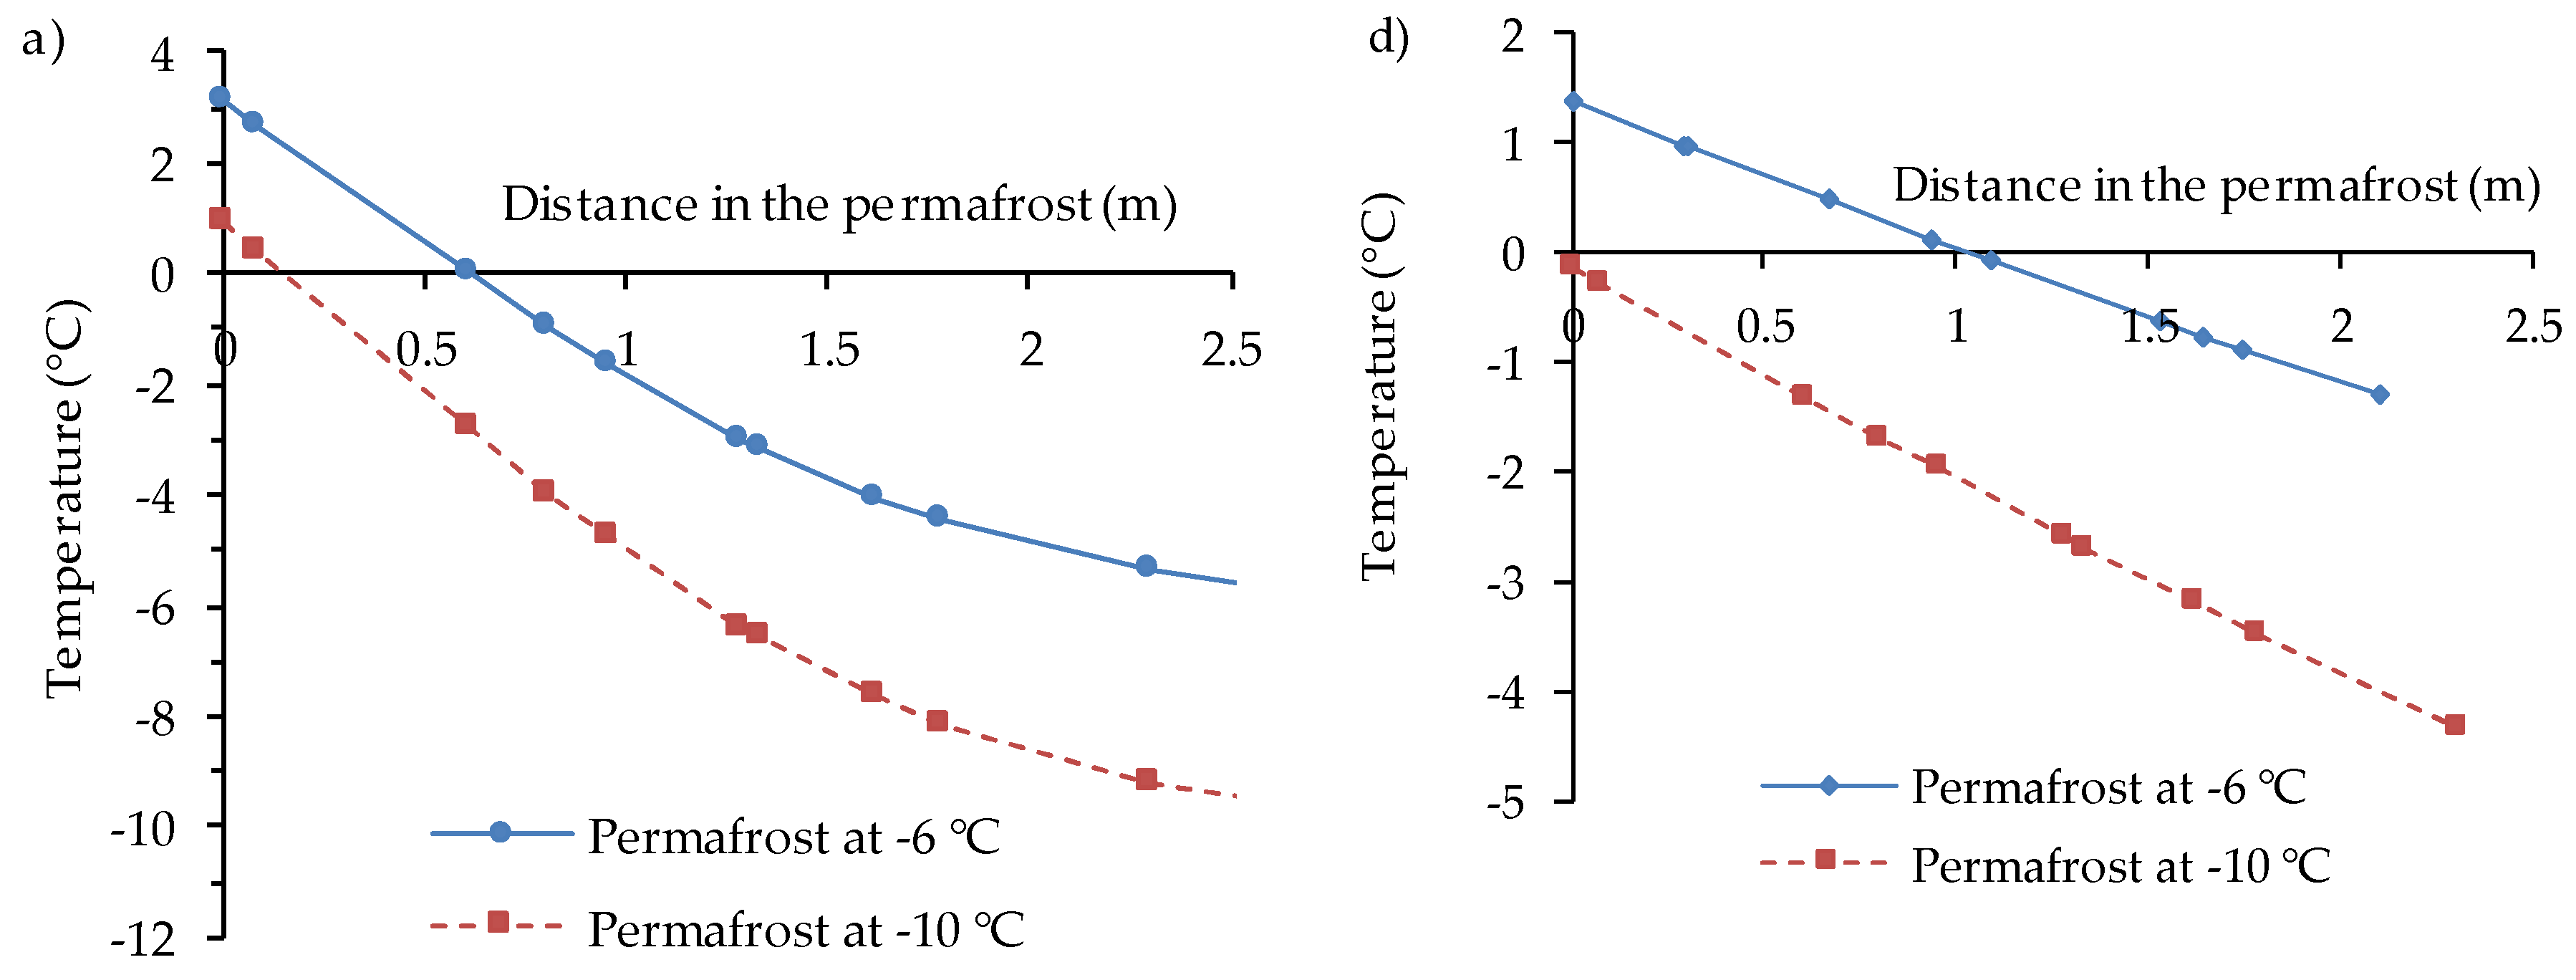
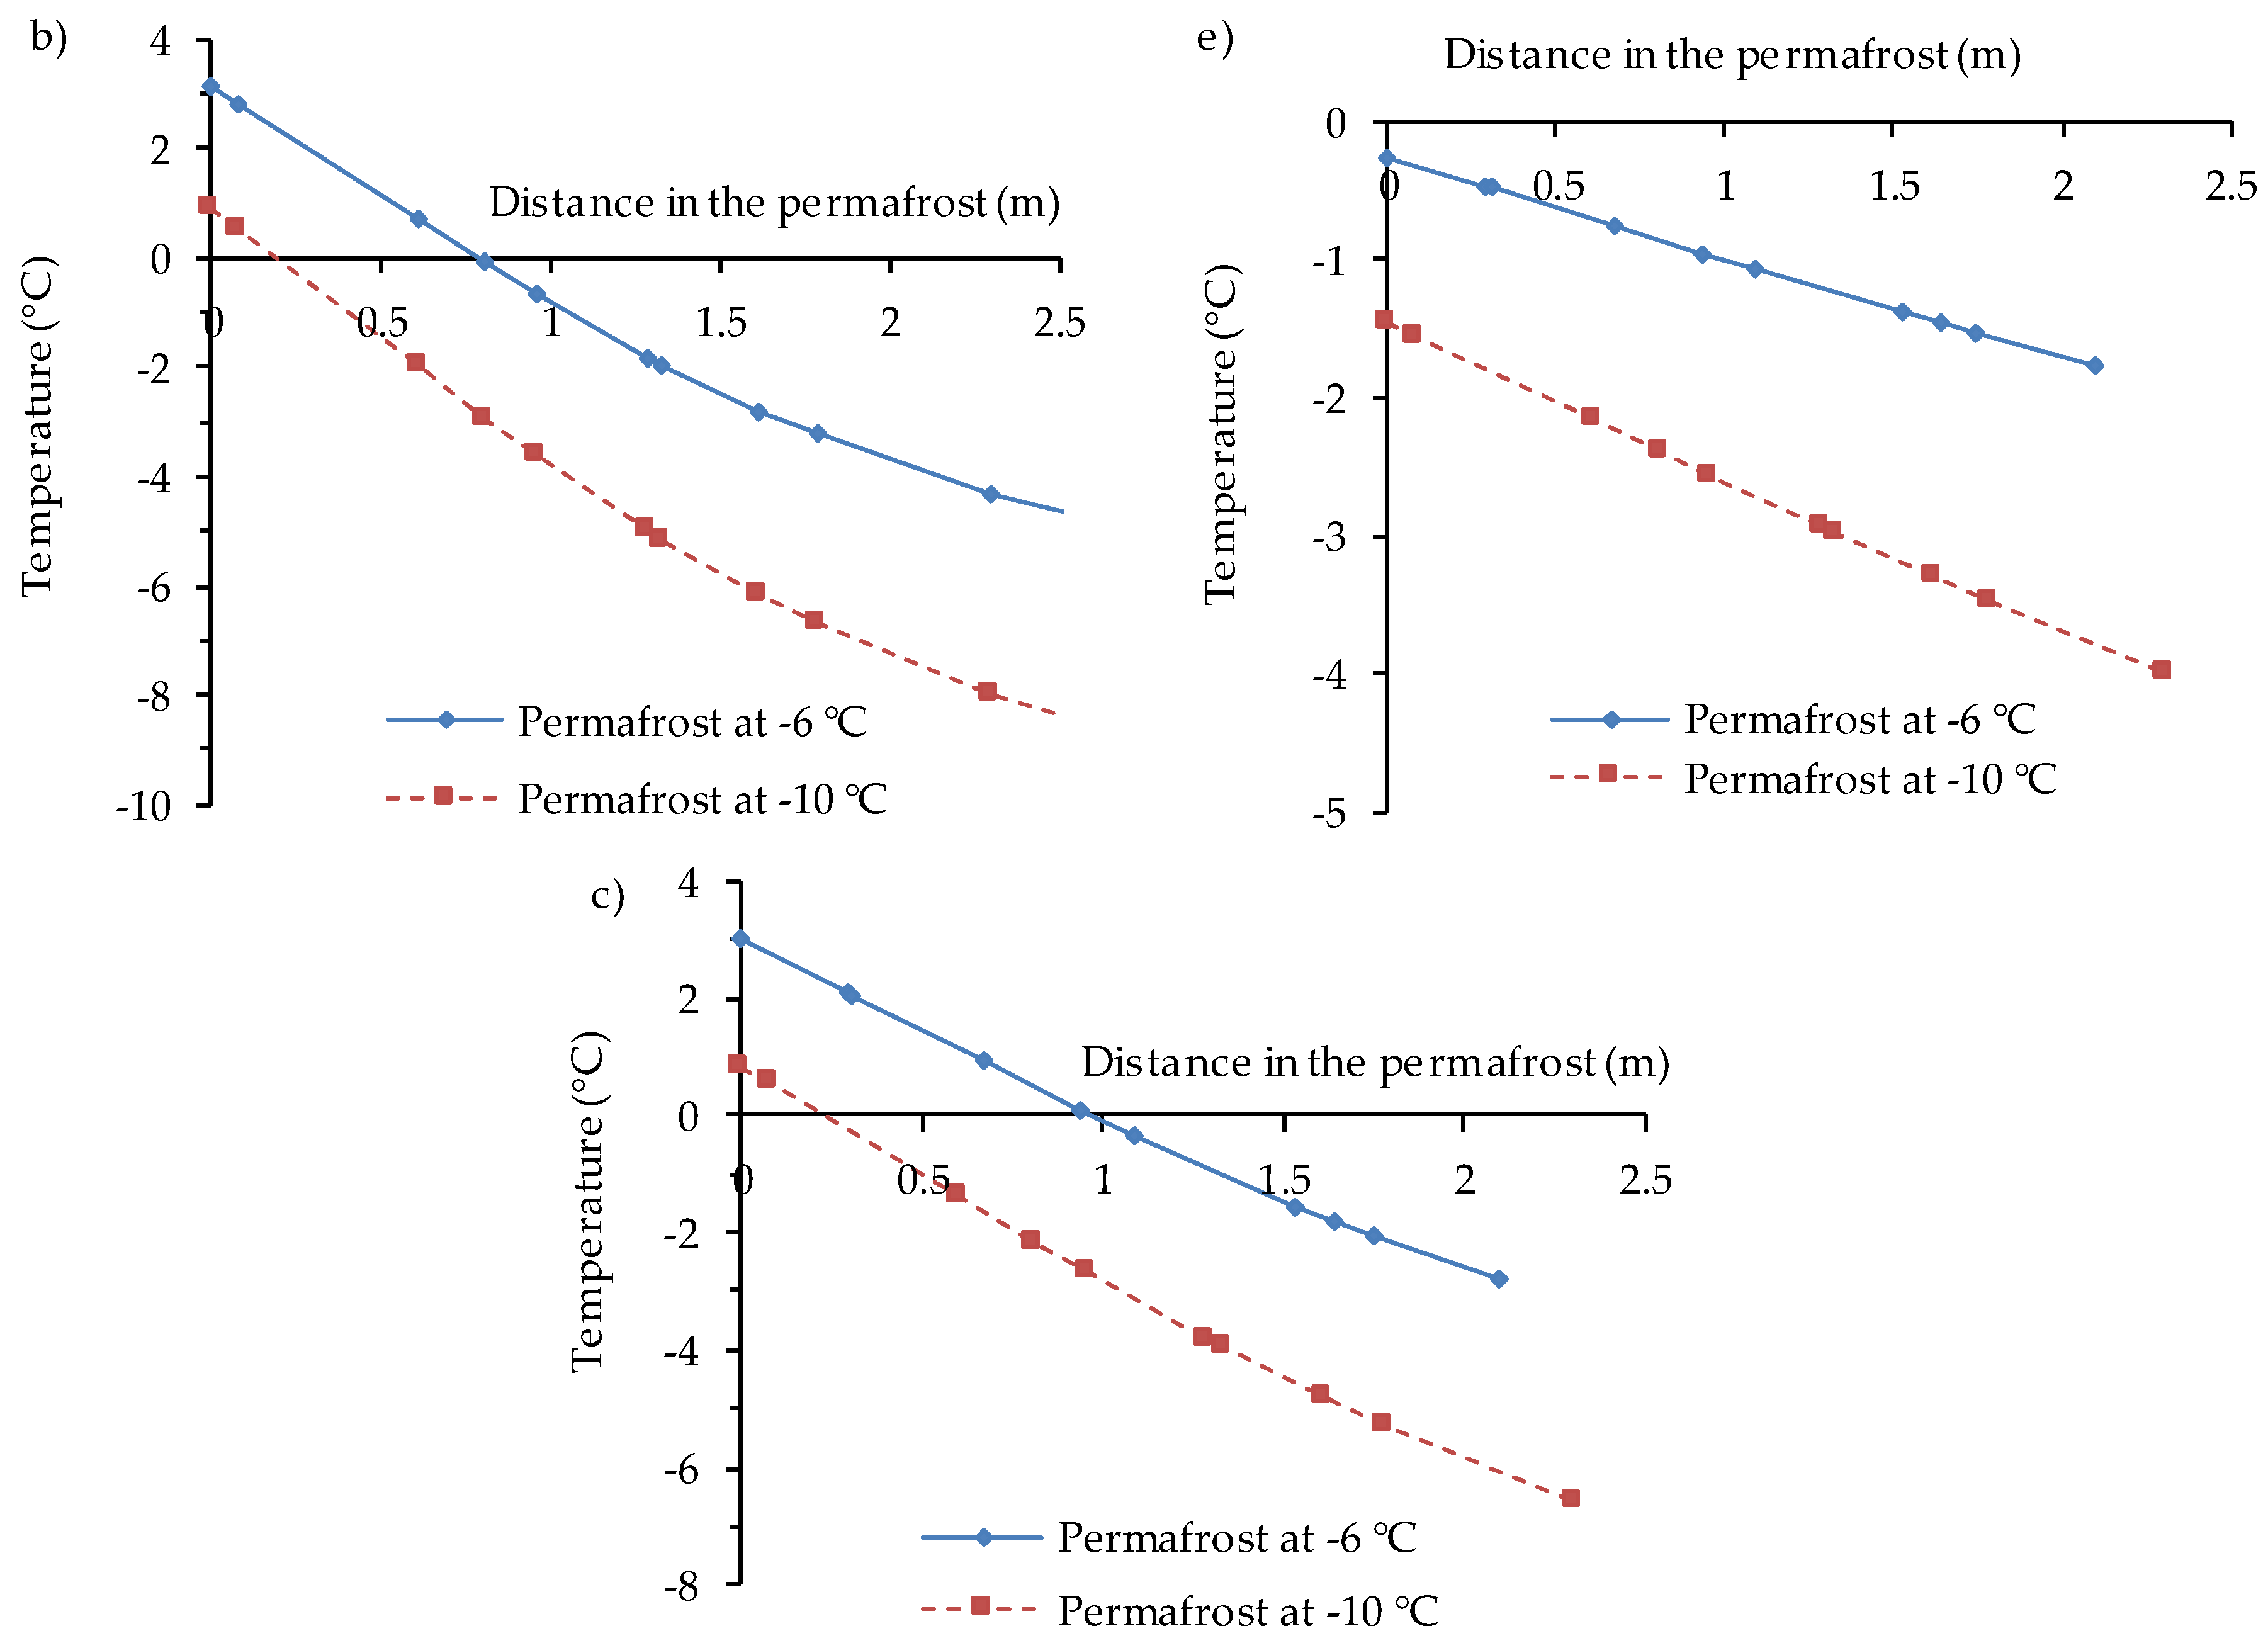
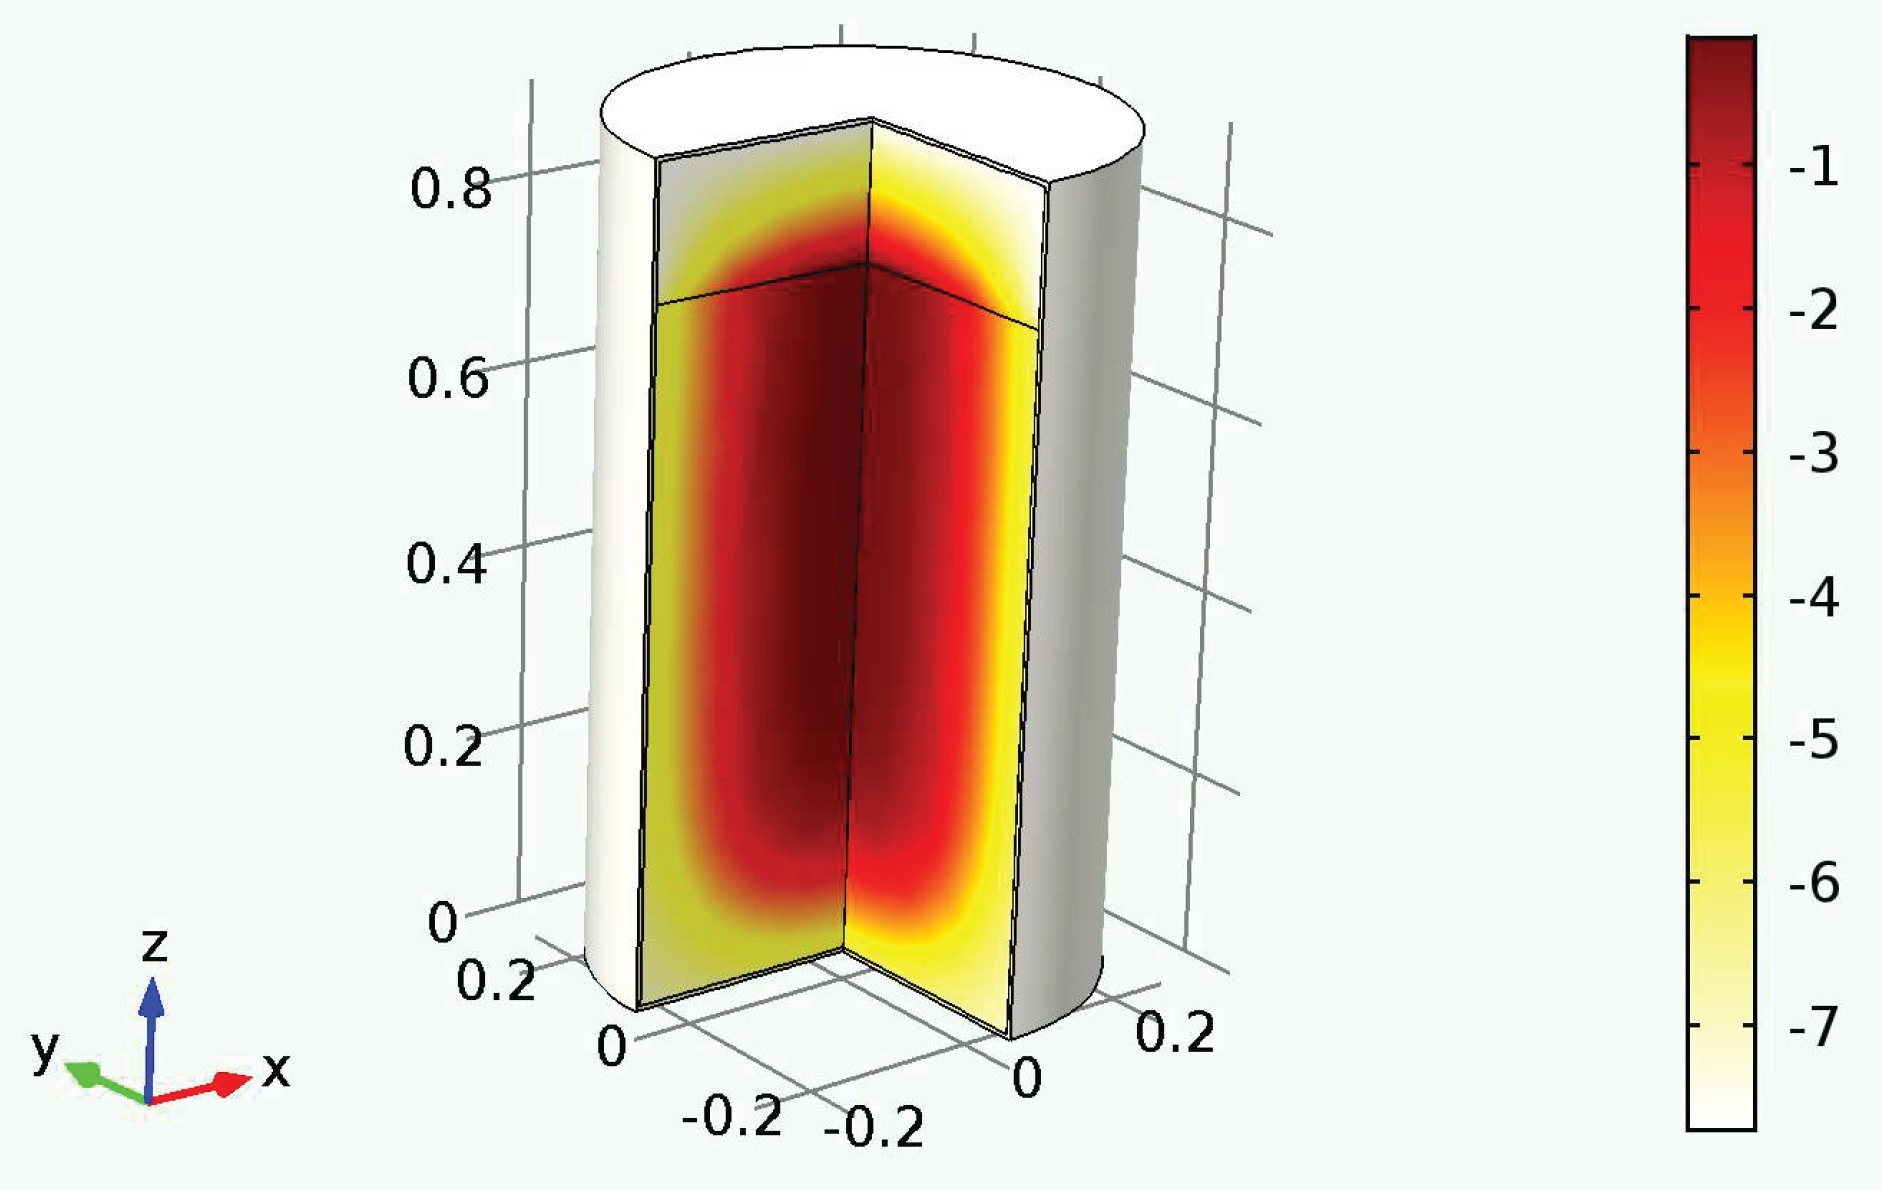
5.3. Application of the Calibrated and Validated Numerical Model to Backfilled Stopes in Permafrost

The above calibrated and validated numerical model was then used to simulate heat transfer in a backfilled stope in permafrost rock. The simulated stope dimensions were set at 25 m (height) × 18 m (depth) × 10 m (width), as shown in Figure 8. The stope filling was considered as instantaneous. The CPB reached a height of 24 m, leaving an air void of 1 m above the CPB. The impact of sequential filling is discussed further in Section 6. In the numerical model, the permafrost zone around the stope was considered as a prism (65 m high × 58 m deep × 50 m wide). Thus, the thickness of the permafrost rock surrounding the CPB was set at 20 m. Previous investigations (results not presented here) have shown that the zone affected by interactions between the CPB and permafrost was smaller than 20 m for actual stope and study conditions. The meshing (presented in Figure 8) was extremely fine in order to produce accurate and stable numerical results.
As thermal boundary conditions, constant temperatures of −6 °C and −10 °C were applied to all faces of the permafrost prism. The initial temperature of the CPB was set at 14 °C. This deposition temperature was predicted from Kalonji [33] using the Non-isothermal pipe flow module in COMSOL Multiphysics® 5.2 and taking into account internal and external heat exchanges and the thermo-rheological behavior of the CPB. The modeled CPB distribution system had the following characteristics: pipeline diameter of 146.3 mm (~6 inches), flow velocity of 1.04 m/s, air temperature of −50 °C, surface pipeline section 294 m in length, underground pipeline section 1036 m in length, and initial CPB temperature (in the backfill plant) of 10 °C. For the permafrost, two initial temperatures of −6 °C and −10 °C were considered. The thermal properties of frozen granite were applied to the permafrost (see Table 4).
Figure 9 presents the evolution of the transverse temperature distribution in the CPB and permafrost along the central axis (see Figure 8), showing that the temperature remains almost unchanged (at around 14 °C) at the center of the CPB for up to 28 days.
The temperature decreases gradually thereafter to about 10 °C on the 120th day of curing and to 3 °C after one year of curing. The temperature falls below 0 °C at the center of the backfill after five years of curing. These results indicate that the CPB temperature decreases gradually with time, and that the CPB core may freeze only after many years of curing. Even after 20 years, the permafrost equilibrium temperature (−6 °C) is not yet reached (under the simulated conditions).
As mentioned above, the deposited CPB must reach a target UCS (generally within 28 days). For the stope in the present study, Figure 9 shows that the CPB temperature is affected mainly to a thickness of about 5 m from the rock walls over 28 days after backfill deposition. This temperature is about 13.6 °C (close to the initial 14 °C) at a distance of 5 m from the CPB–wall rock interface, and it drops to around 3 °C at the interface. Figure 10 illustrates how the CPB temperature evolves over 28 days at different distances from the CPB–rock wall interface. These results provide the required thermal conditions for curing CPB samples prior to strength assessment (UCS) in order to optimize mix recipes in real-life laboratory conditions.
Figure 9 shows that heat is transmitted progressively from the CPB to the frozen walls. The temperature in the permafrost rock rises and can momentarily reach positive values over a small thickness, and it decreases thereafter. If greater thickness of the thawed permafrost can lead to instability of the rock mass, this thickness must be assessed. For this purpose, the temperature distribution with respect to the distance in the permafrost from the CPB–stope wall interface is presented in Figure 11 for initial permafrost temperatures of −6 °C and −10 °C after curing times of 7, 14, 28, 120, and 365 days. From day 7 to day 14 of curing, the thickness of the thawed permafrost increases from 51 cm to 54 cm, and from 10 cm to 18 cm for initial permafrost temperatures of −6 °C and −10 °C, respectively (Figure 11a,b). At 28 days of curing, the thickness of the thawed rock is about 1 m and 20 cm for initial permafrost temperatures of −6 °C and −10 °C, respectively (Figure 11c).
After 120 days, the temperature drops at the interface for both cases, but the thawing thickness of permafrost remains at 1 m when the initial temperature is −6 °C, and 0 m for permafrost at an initial −10 °C (Figure 11d). The temperature continues to drop over time, such that the thawed portion of the permafrost refreezes in both cases after 365 days (Figure 11e). These observations are consistent with the results obtained by Ghoreishi-Madiseh et al. [37].

6. Discussion

The results presented in Section 5.3 were obtained assuming instantaneous stope filling. In practice, stopes are backfilled in two stages to avoid excessive pressure on the barricades. The first step is to pour CPB containing about 5% to 8% binder into the lower part of the stope to form a plug, usually ≥7 m high, where it cures for about 1–5 days [1]. The second step is to backfill the rest of the stope above the plug with CPB containing a lower binder proportion than the plug. A minimum curing time of 28 days is required to achieve target strength [1,55]. This section presents the simulation results considering a two-stage backfilling sequence. Again, the remaining 17 m of the stope filling (25 m high, 1 m void space over the CPB) was considered as instantaneous. Figure 12 shows the temperature evolution at the center of the CPB mass for up to 20 years. From this figure, it can be concluded that both the one-step and two-step (plug + residual backfilling) methods provide similar results.
The influence of various parameters on the thermal behavior of permafrost backfill systems was examined, including CPB deposition temperature, sequential stope filling (layer-by-layer), temperature of surrounding rocks (permafrost), stope geometry (varying height, depth, width, and inclination), and the thermal properties of permafrost with respect to rock type and other factors. Results will be presented elsewhere. The impact of declining temperatures (see Figure 10) on the UCS of CPB curing under permafrost conditions was investigated. Results are presented in a companion paper [56].

7. Conclusions

This paper described a method for predicting the temperature field within CPB in permafrost regions and within the frozen walls of the permafrost. Physical (experimental) models were used to determine 3D heat transfer in CPB. The experimental results were successfully used in the laboratory to calibrate and validate a numerical model built from the Heat Transfer module in COMSOL Multiphysics®. The numerical results were in fairly good agreement with the experimental lab data. The numerical model was then used to predict the temperature field for CPB and its evolution during curing under the thermal boundary conditions of a typical backfilled mine stope (25 m high × 18 m long × 10 m wide) in the permafrost. At least five years were required for the entire CPB mass to reach freezing temperature. Even after 20 years, the permafrost equilibrium temperature (e.g., −6 °C) was not yet reached throughout the whole CPB mass. Results allowed predicting the evolution of curing temperature for CPB samples used to optimize laboratory mix recipes. The thermal behavior of the surrounding permafrost was also modeled, and the thickness of the zone that would be affected by partial thawing and refreezing was determined.

Author Contributions

Conceptualization, M.M., T.B., L.L., M.B., and S.O.; methodology, F.K.B., M.M., T.B., L.L., U.M., P.K.K., M.B., and S.O.; software, F.K.B., M.M., L.L. and P.K.K.; validation, F.K.B. and M.M.; formal analysis, F.K.B., M.M., L.L., and P.K.K.; investigation, F.K.B., U.M., and P.K.K.; resources, M.M., T.B., L.L., M.B., S.O.; data curation, F.K.B., M.M., U.M., and P.K.K.; writing—original draft preparation, K.B., U.M., and P.K.K.; writing—review and editing, M.M, T.B, L.L., M.B., and S.O.; visualization, .K.B., M.M., U.M., and P.K.K.; supervision, M.M., T.B. and M.B.; project administration, M.M.; funding acquisition, M.M., T.B., M.B., L.L. and S.O.

Funding

This research was funded by the Fonds de recherche du Québec, Nature et technologies (FRQNT), and Agnico Eagle Mines Ltd. (Toronto, ON, Canada), grant number 2014-MI-184045, the Natural Sciences and Engineering Research Council of Canada (NSERC), grants numbers 312011-2010 and RGPIN-2015-05172 and the Research Institute of Mines and Environment (RIME UQAT-Polytechnique).

Conflicts of Interest

The authors declare no conflict of interest.

References

  1. Belem, T.; Benzaazoua, M. Design and Application of Underground Mine Paste Backfill Technology. Geotech. Geol. Eng. 2008, 26, 147–174. [Google Scholar] [CrossRef]
  2. Belem, T.; Benzaazoua, M.; Bussière, B. Mechanical behaviour of cemented paste backfill. In Proceedings of the 53th Annual Conference of the Canadian Geotechnical Society, Montreal, QC, Canada, 15–18 October 2000. [Google Scholar]
  3. Benzaazoua, M.; Fall, M.; Belem, T. A contribution to understanding the hardening process of cemented pastefill. Miner. Eng. 2004, 17, 141–152. [Google Scholar] [CrossRef]
  4. Cao, S.; Yilmaz, E.; Song, W. Evaluation of Viscosity, Strength and Microstructural Properties of Cemented Tailings Backfill. Minerals 2018, 8, 352. [Google Scholar] [CrossRef]
  5. Landriault, D. Paste backfill mix design for Canadian underground hard rock mining. In Proceedings of the 97th Annual General Meeting of CIM, Rock Mechanics and Strata Control Session, Halifax, NS, Canada, 14–18 May 1995; pp. 229–238. [Google Scholar]
  6. Li, L. Analytical solution for determining the required strength of a side-exposed mine backfill containing a plug. Can. Geotech. J. 2014, 51, 508–519. [Google Scholar] [CrossRef]
  7. Li, L. Generalized Solution for Mining Backfill Design. Int. J. Geomech. 2014, 14, 04014006. [Google Scholar] [CrossRef]
  8. Li, L.; Aubertin, M. A modified solution to assess the required strength of exposed backfill in mine stopes. Can. Geotech. J. 2012, 49, 994–1002. [Google Scholar] [CrossRef]
  9. Li, L.; Aubertin, M. An improved method to assess the required strength of cemented backfill in underground stopes with an open face. Int. J. Min. Sci. Technol. 2014, 24, 549–558. [Google Scholar] [CrossRef]
  10. Ouattara, D.; Belem, T.; Mbonimpa, M.; Yahia, A. Effect of superplasticizers on the consistency and unconfined compressive strength of cemented paste backfills. Constr. Buil. Mater. 2018, 181, 59–72. [Google Scholar] [CrossRef]
  11. Wu, J.; Feng, M.; Xu, J.; Qiu, P.; Wang, Y.; Han, G. Particle Size Distribution of Cemented Rockfill Effects on Strata Stability in Filling Mining. Minerals 2018, 8, 407. [Google Scholar] [CrossRef]
  12. Zhang, J.; Deng, H.; Taheri, A.; Deng, J.; Ke, B. Effects of Superplasticizer on the Hydration, Consistency, and Strength Development of Cemented Paste Backfill. Minerals 2018, 8, 381. [Google Scholar] [CrossRef]
  13. Boger, D.; Scales, P.; Sofra, F. Rheological concepts. In Paste and Thickened Tailings-A Guide, 2nd ed.; Jewell, Fourie, Ed.; Australian Centre for Geomechanics: Perth, Australia, 2006; p. 25. [Google Scholar]
  14. Cooke, R. Backfill pipeline distribution systems-design methodology review. CIM Mag. 2007, 2. [Google Scholar]
  15. Ouattara, D. Étude des Propriétés Rhéologiques de Résidus Miniers Densifiés. Master’s Thesis, Université du Québec en Abitibi-Témiscamingue, Rouyn-Noranda, QC, Canada, 2011. [Google Scholar]
  16. Ouattara, D.; Mbonimpa, M.; Belem, T. Rheological properties of thickened tailings and cemented paste tailings and the effects of mixture characteristics on shear behaviour. In Proceedings of the 63rd Canadian Geotechnical Conference, Calgary, AB, Canada, 12 September 2010; pp. 1178–1185. [Google Scholar]
  17. Ouattara, D.; Mbonimpa, M.; Belem, T. Rheology of cemented paste backfill incorporating superplasticizers. In Proceedings of the 66th Canadian Geotechnical Conference, Montreal, QC, Canada, 7 June 2013. [Google Scholar]
  18. Ouattara, D.; Mbonimpa, M.; Yahia, A.; Belem, T. Assessment of rheological parameters of high density cemented paste backfill mixtures incorporating superplasticizers. Constr. Build. Mater. 2018, 190, 294–307. [Google Scholar] [CrossRef]
  19. Ouattara, D.; Yahia, A.; Mbonimpa, M.; Belem, T. Effects of superplasticizer on rheological properties of cemented paste backfills. Int. J. Miner. Process. 2017, 161, 28–40. [Google Scholar] [CrossRef]
  20. Zhao, Y.; Soltani, A.; Taheri, A.; Karakus, M.; Deng, A. Application of Slag–Cement and Fly Ash for Strength Development in Cemented Paste Backfills. Minerals 2019, 9, 22. [Google Scholar] [CrossRef]
  21. Belem, T.; Benzaazoua, M.; Bussière, B.; Dagenais, A. Effects of settlement and drainage on strength development within mine paste backfill. In Proceedings of the 9th International Conference, Tailings and Mine Waste, Fort Collins, CO, USA, 27–30 January 2002; Volume 2, pp. 139–148. [Google Scholar]
  22. Belem, T.; Benzaazoua, M.; El Aatar, O.; Yilmaz, E. Effect of drainage and the pore water pressure dissipation on the backfilling sequencing. In Proceedings of the 23rd World Mining Congress, Montreal, QC, Canada, 10 August 2013; pp. 11–15. [Google Scholar]
  23. Belem, T.; Bussière, B.; Benzaazoua, M. The effect of microstructural evolution on the physical properties of paste backfill. In Proceedings of the Tailings and Mine Waste, Fort Collins, CO, USA, 16–19 January 2001; Volume 1, p. 5809. [Google Scholar]
  24. Belem, T.; Effenguet, H.; Mbonimpa, M. Estimation of required minimum binder content by assessing the liquefaction potential of early age cemented mine backfill. In Proceedings of the 66th Canadian Geotechnical Conference, Montreal, QC, Canada, 7 June 2013. [Google Scholar]
  25. Yilmaz, E.; Belem, T.; Benzaazoua, M.; Bussière, B. Assessment of the modified CUAPS apparatus to estimate in situ properties of cemented paste backfill. Geotech. Test. J. 2010, 33, 351–362. [Google Scholar]
  26. Benzaazoua, M.; Belem, T.; Bussière, B. Chemical factors that influence the performance of mine sulphidic paste backfill. Cem. Concr. Res. 2002, 32, 1133–1144. [Google Scholar] [CrossRef]
  27. Benzaazoua, M.; Marion, P.; Picquet, I.; Bussière, B. The use of pastefill as a solidification and stabilization process for the control of acid mine drainage. Miner. Eng. 2004, 17, 233–243. [Google Scholar] [CrossRef]
  28. Ouellet, S.; Bussière, B.; Mbonimpa, M.; Benzaazoua, M.; Aubertin, M. Reactivity and mineralogical evolution of an underground mine sulphidic cemented paste backfill. Miner. Eng. 2006, 19, 407–419. [Google Scholar] [CrossRef]
  29. Fall, M.; Wu, D.; Pokharel, M. Effect of deep mine temperature conditions on the heat development in cemented paste backfill and its properties. Deep Min. 2014, 2014, 559–573. [Google Scholar]
  30. Wu, D.; Fall, M.; Cai, S.-J. Coupled Modeling of Temperature Distribution and Evolution in Cemented Tailings Backfill Structures that Contain Mineral Admixtures. Geotech. Geol. Eng. 2012, 30, 935–961. [Google Scholar] [CrossRef]
  31. Bandopadhyay, S.; Izaxon, V. Ice-cemented backfill for underground support in arctic mines. In Proceedings of the SME Annual Meeting, Denver, CO, USA, 23–25 February 2004. [Google Scholar]
  32. Cluff, D.L.; Kazakidis, V. Frozen Baclfill Mix Formulations and Process for Use Thereof in Underground Mining Applications. U.S. Patent US20120114429A1, 10 May 2012. [Google Scholar]
  33. Kalonji, K. Étude des Propriétés Rhéologiques et du Transport du Remblai Cimenté en Pâte en Conditions Nordiques. Master’s Thesis, Université du Québec en Abitibi-Témiscamingue, Rouyn-Noranda, QC, Canada, 2016. [Google Scholar]
  34. COMSOL Multiphysics. In Heat Transfer Module User’s Guide, COMSOL version; COMSOL Inc.: Burlington, MA, USA, 2015; Volume 5.2.
  35. Kalonji, K.; Mbonimpa, M.; Belem, T.; Benzaazoua, M.; Beya, F.; Ouellet, S. Preliminary investigation of the effect of temperature and salinity on the rheological properties of fresh cemented paste backfills. In Proceedings of the 68th Canadian Geotechnical Conference and 7th Canadian Permafrost Conference, Quebec City, QC, Canada, 20–23 September 2015; pp. 20–23. [Google Scholar]
  36. Kalonji, K.; Mbonimpa, M.; Belem, T.; Benzaazoua, M.; Beya, F.; Ouellet, S. Calage d’un modèle numérique de prédiction de l’évolution de la température pendant le transport du remblai en pâte cimenté. In Proceedings of the 69th Canadian Geotechnical Conference GeoVancouver 2016, Vancouver, BC, Canada, 5 October 2016. [Google Scholar]
  37. Ghoreishi-Madiseh, S.A.; Hassani, F.; Mohammadian, A.; Abbasy, F. Numerical modeling of thawing in frozen rocks of underground mines caused by backfilling. Int. J. Rock Mech. Min. Sci. 2011, 48, 1068–1076. [Google Scholar] [CrossRef]
  38. Hivon, E.; Sego, D. Distribution of saline permafrost in the Northwest Territories, Canada. Can. Geotech. J. 1993, 30, 506–514. [Google Scholar] [CrossRef]
  39. Williams, J.R. Ground Water in the Permafrost Regions of Alaska; US Government Printing Office: Washington, DC, USA, 1970; p. 90. [Google Scholar]
  40. Abbasy, F. Thermal Conductivity of Mine Backfill. Master’s Thesis, Concordia University, Montreal, QC, USA, 2009. [Google Scholar]
  41. Abbasy, F.; Hassani, F.P.; Madiseh, S.A.G.; Côté, J.; Nokken, M.R. An Experimental Study on the Effective Parameters of Thermal Conductivity of Mine Backfill. Heat Transf. Eng. 2014, 35, 1209–1224. [Google Scholar] [CrossRef]
  42. Beya, F.K.; Mbonimpa, M.; Belem, T.; Benzaazoua, M.; Kalonji, K.; Ouellet, S. Preliminary study of the influence of temperature and salinity on the thermal properties of hardening cemented paste backfill. In Proceedings of the 68th Canadian Geotechnical Conference and 7th Canadian Permafrost Conference, Quebec, QC, Canada, 20–23 September 2015. [Google Scholar]
  43. Célestin, J.C.H.; Fall, M. Thermal conductivity of cemented paste backfill material and factors affecting it. Int. J. Min. Reclam. Environ. 2009, 23, 274–290. [Google Scholar] [CrossRef]
  44. ASTM. D5334-08 Standard Test Method for Determination of Thermal Conductivity of Soil and Soft Rock by Thermal Needle Probe Procedure; ASTM: West Conshohocken, PA, USA, 2008. [Google Scholar]
  45. Gobbé, C.; Iserna, S.; Ladevie, B. Hot strip method: Application to thermal characterisation of orthotropic media. Int. J. Therm. Sci. 2004, 43, 951–958. [Google Scholar] [CrossRef]
  46. Civan, F.; Sliepcevich, C. Limitation in the Apparent Heat Capacity Formulation for Heat Transfer with Phase Change. Proc. Okla. Acad. Sci. 1987, 67, 83–88. [Google Scholar]
  47. Yao, M.; Chait, A. An Alternative Formulation of The Apparent Heat Capacity Method for Phase-Change Problems. Numer. Heat Transf. Part B Fundam. 1993, 24, 279–300. [Google Scholar] [CrossRef]
  48. Hwang, C.; Murray, D.; Brooker, E. A thermal analysis for structures on permafrost. Can. Geotech. J. 1972, 9, 33–46. [Google Scholar] [CrossRef]
  49. Krahn, J. Thermal Modeling with TEMP/W: An Engineering Methodology; GEO-SLOPE: Calgary, AB, Canada, 2004; p. 292. [Google Scholar]
  50. ASTM. C150-07 Standard Specification for Portland Cement; ASTM: West Conshohocken, PA, USA, 2007. [Google Scholar]
  51. ASTM. C143/143M-12 Standard Test Method for Slump of Hydraulic-Cement Concrete; ASTM: West Conshohocken, PA, USA, 2012. [Google Scholar]
  52. Landriault, D.; Verburg, R.; Cincilla, W.; Welch, D. Paste technology for underground backfill and surface tailings disposal applications. In Short Course Notes, Canadian Institute of Mining and Metallurgy, Technical Workshop œ April; Golder Paste Technology Ltd.: Sudbury, ON, Canada, 1997; Volume 27. [Google Scholar]
  53. Bansal, V.; Misra, R.; Agrawal, G.D.; Mathur, J. Performance analysis of earth–pipe–air heat exchanger for summer cooling. Energy Build. 2010, 42, 645–648. [Google Scholar] [CrossRef]
  54. Duchaine, F.; Corpron, A.; Pons, L.; Moureau, V.; Nicoud, F.; Poinsot, T. Development and assessment of a coupled strategy for conjugate heat transfer with Large Eddy Simulation: Application to a cooled turbine blade. Int. J. Heat Fluid Flow 2009, 30, 1129–1141. [Google Scholar] [CrossRef]
  55. Thompson, B.; Bawden, W.; Grabinsky, M. In situ measurements of cemented paste backfill at the Cayeli Mine. Can. Geotech. J. 2012, 49, 755–772. [Google Scholar] [CrossRef]
  56. Kwizera, P.; Mbonimpa, M.; Belem, T. Mine backfilling in the permafrost, Part II: Effect of reductions in temperature during curing on the unconfined compressive strength of cemented paste backfills. Minerals 2019. under press. [Google Scholar]
Figure 1. Average grain size distribution curves for Mine A tailings.
Minerals 09 00165 g001
Figure 2. Instrumented barrel with RT-1 sensors before (a,b) and during testing (c).
Minerals 09 00165 g002
Figure 3. Barrel instrumentation with RT-1 sensors (plan view and vertical section views).
Minerals 09 00165 g003
Figure 4. Sensor recordings of temperature changes over time in the backfill containing 5% binder in the barrel cooled at −11 °C.
Minerals 09 00165 g004
Figure 5. Model calibration using data from sensor B2 in the cooled barrel.
Minerals 09 00165 g005
Figure 6. Temperature (°C) distribution in the barrel filled with CPB after 72 h of curing in the cold room.
Minerals 09 00165 g006
Figure 7. Model validation: comparisons between simulation and laboratory results for temperature evolution with time in the barrel: (a) sensor B1, (b) sensor B3, (c) sensors B4 and B6, and (d) sensors B5 and B7.
Minerals 09 00165 g007aMinerals 09 00165 g007b
Figure 8. 3D geometry and meshing for the mine stope model.
Minerals 09 00165 g008
Figure 9. Transverse temperature distribution along the horizontal central axis of the simulated backfilled stope (CPB and permafrost) with curing time after CPB deposition at 14 °C for CPB and −6 °C for permafrost.
Minerals 09 00165 g009
Figure 10. Typical temperature evolution over 28 days in the CPB at distances of 0 (interface), 0.5, 1, 2, 3, 4, and 5 m from the CPB–permafrost wall interface.
Minerals 09 00165 g010
Figure 11. Thickness of thawed permafrost (T > 0) for a CPB deposition temperature of 14 °C and initial permafrost temperatures of −6 °C and −10 °C after curing times of: (a) 7 days, (b) 14 days, (c) 28 days, (d) 120 days, and (e) 365 days (distance 0 represents the interface between the CPB and permafrost).
Minerals 09 00165 g011aMinerals 09 00165 g011b
Figure 12. Comparison of temperature evolution at the center of the CPB for one-step backfilling (instantaneous) and two-step backfilling (instantaneous plug + instantaneous residual filling).
Minerals 09 00165 g012
Table 1. Main grain-size distribution parameters for the Mine A tailings.
ParameterD10D30D60P2P20P80CUCC
Unit(µm)(µm)(µm)(%)(%)(%)(-)(-)
Value3.51027.55.553897.91.0
Table 2. Mineralogical composition of the tested Mine A tailings.
MineralProportion (wt. %)
Quartz40.32
Albite19.49
Muscovite14.65
Ankerite8.77
Chlorite8.07
Magnetite4.58
Calcite2.43
Microcline1.33
Pyrite0.35
Table 3. Salt dosages for the saline water preparation at a total salt concentration of 5 g/L.
SaltConcentration
(g/L)
NaCl0.33
MgSO43.16
MgCl20.05
Na2S2O50.36
CaCl2 0.32
CuSO40.69
KCl0.09
Table 4. Input parameters for numerical modeling.
Input ParametersValue
Volume fraction of solid in the backfill (-) a0.52
Thermal conductivity of unfrozen CPB (W/(m K)) b1.84
Thermal conductivity of frozen CPB (W/(m K)) b 2.10
Thermal conductivity of air (W/(m K)) c0.0242
Thermal conductivity of steel (W/(m K)) c54
Thermal conductivity of PVC (W/(m K)) c 0.16
Thermal conductivity of plexiglass (W/(m K)) d0.184
Thermal conductivity of granite (W/(m K)) e2.90
Heat capacity at constant pressure of unfrozen CPB (J/(kg K)) b 1624
Heat capacity at constant pressure of frozen CPB (J/(kg K)) b 1681
Heat capacity at constant pressure of air (J/(kg K)) c 1006
Heat capacity at constant pressure of steel (J/(kg K)) c 465
Heat capacity at constant pressure of PVC (J/(kg K)) c 900
Heat capacity at constant pressure of plexiglass (J/(kg K)) d 1450
Heat capacity at constant pressure of granite (J/(kg K)) e 995
Density of unfrozen CPB (kg/m3) f1924
Density of frozen CPB (kg/m3) f1785
Density of air (kg/m3) c1.225
Density of steel (kg/m3) c 7833
Density of PVC (kg/m3) c1380
Density of Plexiglas (kg/m3) d1190
Density of granite (kg/m3) e2650
Latent heat from phase 1 to phase 2: L (kJ/kg) g220
Phase change temperature from phase 1 to phase 2: T p c (K) g 271
a Calculated from the solid concentration Cw. b Measured using the KD2 Pro thermal properties analyzer, Beya et al. [42]. c Taken from Bansal et al. [53]. d Taken from Duchaine et al. [54]. e Taken from Ghoreishi-Madiseh et al. [37]. f Experimentally determined in the laboratory (mass-to-volume ratios). g Adjusted value obtained during calibration of the COMSOL Multiphysics® model.

