Rare Earth Occurrences in Streams of Processing a Phosphate Ore

1
Geological Survey of Finland, Outokumpu 83500, Finland
2
Geological Survey of Finland, Espoo 02151, Finland
*
Author to whom correspondence should be addressed.
Minerals 2019, 9(5), 262; https://doi.org/10.3390/min9050262
Submission received: 11 February 2019
/
Revised: 26 April 2019
/
Accepted: 27 April 2019
/
Published: 30 April 2019
(This article belongs to the Special Issue Recent Trends in Phosphate Mining and Beneficiation and Related Waste Management)
Abstract
:Rare earth elements (REEs) are defined as lanthanides with Y and Sc. Rare earth occurrences including the REE-bearing phases and their distributions, measured by rare earth oxides (REOs), in the streams of processing a phosphate ore were determined by using MLA, the mineral liberation analysis and EPMA, the electron probe microanalysis. The process includes an apatite ore beneficiation by flotation and further processing of the beneficiation concentrate with sulfuric acid. Twenty-six, sixty-two and twelve percent of the total REOs (TREO) contents from the ore end up in the products of beneficiation tailings, phosphogypsum (PG) and phosphoric acid, respectively. Apatite, allanite, monazite and pyrochlore are identified as REE-bearing minerals in the beneficiation process. In the beneficiation tailings, the REEs are mainly distributed in monazite (10.3% TREO), apatite (5.9% TREO), allanite (5.4% TREO) and pyrochlore (4.3% TREO). Gypsum, monazite, apatite and other REE-bearing phases were found to host REEs in the PG and the REEs distributions are 44.9% TREO in gypsum, 15.8% TREO in monazite, 0.6% TREO in apatite and 0.6% TREO in other REE-bearing phases. Perspectives on the efficient recovery of REEs from the beneficiation tailings and the PG are discussed.
1. Introduction
The grade of apatite ores can vary from 4% to 20% phosphorus pentoxide (P2O5). Normally, beneficiation by flotation is needed to obtain a high grade (often more than 30% P2O5) apatite concentrate. Meanwhile, beneficiation tailings including waste clay are produced. Then phosphoric acid is prepared in the wet-process by adding sulfuric acid to the apatite concentrate. Phosphogypsum (PG) is the major solid product formed during the process. Rare earth elements (REEs) comprising 15 lanthanides plus Y and Sc are normally contained in the phosphate rocks in various contents from 0.03 to 1.0 wt. % [1,2]. In the phosphate rock processing, most of the REEs from the phosphate rock (over 85%) end up in the wastes (waste clay, flotation tailings and phosphogypsum) [3]. Because these wastes have very fine grain sizes and complex mineralogical compositions, the reprocessing of them for economic recovery of REEs becomes very challenging [3]. Research was carried out to verify whether the wastes might be useful as a raw material for REEs recovery [4,5,6,7,8,9,10,11,12] and the manufacture of building materials [1]. However, the extraction of REEs and other valuable elements from these wastes in phosphate processing has not been industrially realized, while trace elements are considered one of the main environmental concerns of direct use [13].
The incorporation of REEs in PG from solution during the wet-process of phosphoric acid production using sulfuric acid has been investigated for phosphate rocks with different REE grades and it is concluded that about 60–70% of the initial REEs content was lost into the PG [14,15,16,17,18,19,20]. Meanwhile, the occurrence modes or the precipitated phases of REEs in the PG are considered but conclusions are still disputable. Jin et al. (2011) [21] concluded that REEs were present as tiny crystals of rare earth sulphates. A study by Santos et al. (2006) [22] showed that although REEs were enriched in the PG samples they were not associated with CaSO4 itself. The study by Borges et al. (2016) [23] indicated that REEs occur as sulphates, carbonates, fluorides and phosphates. Schmidt et al. (2009) [24] concluded that Eu3+ was adsorbed as an inner-sphere species on the precipitated gypsum. In addition, REEs including Y, La, Ce, Nd, Sm and Pr were detected on the PG surface in both elemental as well as oxide forms by TOF-SIMS [6]. Alhassanieh et al. (2012) [25], in contrast, concluded that Eu3+ was incorporated in the structure of the gypsum as opposed to being adsorbed on the gypsum surface. The study by Dutrizac, J.E. (2017) [14] on the behaviour of all the trivalent REEs concluded that the rare earth ions are structurally incorporated in gypsum, according to a mechanism involving the replacement of three Ca2+ ions by two REE3+ ions and a vacant Ca2+ lattice site.
Compared to the studies on the incorporation and the occurrence modes of REEs in the PG during the wet-process of phosphoric acid production, the studies about REEs transferring and their occurrences in the beneficiation process are very limited. A study by Zhang et al. (2018) [3] indicated that REEs during a phosphate ore processing are distributed approximately 40% in waste clay, 10% in amine tails, 38% in PG and 12% in phosphoric acid but how the REEs occur in these products was not investigated.
In the present study, the occurrences of REEs, including REE-bearing phases and REEs distribution, in the streams of processing a phosphate rock were studied on the basis of mineralogical analyses using MLA, the mineral liberation analysis and EPMA, the electron probe microanalysis of the apatite ore, the flotation concentrate and the PG. Potential technological pathways for REE recovery from the beneficiation tailings and the PG are discussed.
2. Materials and Methods
The samples of apatite ore, flotation concentrate, and PG were obtained from a phosphate mine, which is a carbonatite deposit with an in-situ grade of around 5.0% P2O5. The general concentration process is that the ore is crushed and ground first and then flotation is performed to obtain the apatite concentrate. The beneficiation concentrate is then treated using sulfuric acid for phosphoric acid production. At the same time the PG is produced as the leaching residue. Currently, the material of PG in the mine is not used commercially. Because the beneficiation is a physical process, the REE-bearing phases in the concentrate and the tailings are the same as in the ore.
The samples were split into 100 g subsamples for chemical and mineralogical analyses. The PG sample was classified by screen into three fractions (+75 µm, −75 + 45 µm and −45 µm) and was analysed separately.
Leaching experiments of the flotation concentrate with sulfuric acid were carried out at the conditions of sulfuric acid concentration 2.5 M, temperature 60 °C, acid solution 500 mL, solid 150 g and agitation speed 400 rpm.
Sodium peroxide plus sodium hydroxide digestion was used for the determination of REEs using the ICP-MS, the inductively coupled plasma mass spectrometry, technique, which was performed by Labtium Oy in Finland. The limits of detection (LODs) of the ICP-MS for REEs are shown in Table 1.
The modal mineralogy (i.e., the percentages of the mineral components), the mineral liberation and the grain size distribution of REE-bearing minerals were measured by using a mineral liberation analyser (MLA) (a FEI MLA Quanta 600 system) at the Geological Survey of Finland in Outokumpu. Minerals were identified mostly based on EDS analyses. Using the EDS analysis, the composition of a certain mineral was determined, and the composition was compared to the composition of the mineral as specified in the MinIdent mineralogy database and a mineralogical book [26]. Also, the EDS spectrum was compared to the spectra in the databases of MLA.
For determining the chemical compositions of REE-bearing phases in the samples, and also of certain minerals that cannot be unequivocally identified by the semi-quantitative approach of MLA, the electron probe microanalysis (EPMA) was performed by the wavelength dispersive technique using a Cameca SX100 instrument at the Geological Survey of Finland in Espoo. All analyses were determined using an accelerating voltage of 20 kV. The probe currents and beam diameters used were 6–60 nA and 1–10 µm, respectively. Analytical results were corrected using the PAP on-line correction programme [27]. Depending on samples and minerals the limits of detection (LODs) of the EPMA for REEs are shown in Table 2 and Table 3.
It should be stressed that, because the mineral identification was carried out using the semi-quantitative EDS method, phases with complex chemical compositions, such as allanite, aeschynite, britholite and pyrochlore, should in fact be referred to as phases with allanite-like, aeschynite-like, and so forth, compositions. However, although identification of such phases cannot be treated as entirely accurate, for the sake of clarity and readability of the text simplified and more general names will be used.
The analytical steps and strategy are presented in Figure 1. By combining MLA and EPMA analyses, the REEs concentrations contributed by all REE-bearing phases in the samples are determined. Then, the REE occurrences, for example, the weight distributions of REEs in the streams of the phosphate rock processing with REE-bearing phases, are achieved by combining experimental and commercial production data.
3. Results
3.1. The Individual Concentrations of REEs
The individual concentrations of REEs (measured by rare earth oxides (REOs)) of the ore, the flotation concentrate and tailings and the PG analysed by ICP-MS are shown in Table 4. All the REEs except Pm were detected in the samples but eight REEs, La, Ce, Pr, Nd, Sm, Gd, Dy and Y, are found with relatively high concentrations. Other REEs are in trace contents (REOs < 5 mg/kg). The contents that are smaller than the limits of detection are marked by n.d. (not detected). The contents of total REOs (TREO) are: 539 mg/kg in the ore; 3431 mg/kg in the concentrate; 255 mg/kg in the tailings; and 2280 mg/kg in the PG. It is noted that for the PG the REEs are not evenly distributed in the size fractions and the fine fraction (−45 µm) has higher contents of TREO as shown in Table 5.
3.2. REE-bearing Phases and Distributions of REEs
3.2.1. Beneficiation Process
The modal mineralogy of the apatite ore and concentrate by MLA are shown in Table 6. Apatite, allanite, monazite, zircon and pyrochlore were found to be REE-bearing minerals which contain measurable amounts of REEs. Apatite was enriched from a content of 8.9%wt in the phosphate rock to that of 88.5%wt in the concentrate, but other REE-bearing minerals were not enriched during flotation. Because flotation is a physical process mineral phases are not changed. Thus, the modal mineralogy of the tailings can be calculated based on analysed data of the ore and concentrate.
These REE-bearing minerals identified by MLA were taken into account in the EPMA analyses from which the concentrations of REEs in all the REE-bearing minerals (measured by REOs) were determined (Table 7). The data in the table are the average calculated data of multiple analyses. The numbers of analyses are stated in Table 7.
Eight REEs, including La, Ce, Pr, Nd, Sm, Gd, Dy and Y, were measured for all five REE-bearing minerals. The REOs marking as n.d. in the table are below the LODs. It noted that Sc was detected by ICP-MS in the ore and flotation concentrate shown in Table 4. According to the authors’ previous experience and a study [28] zircon and pyrochlore might be the Sc-bearing phases. Thus, Sc was measured by EPMA for zircon and pyrochlore but was not detected (below the LOD) because the EPMA has higher LOD than ICP-MS. For apatite, allanite and monazite Sc was not measured.
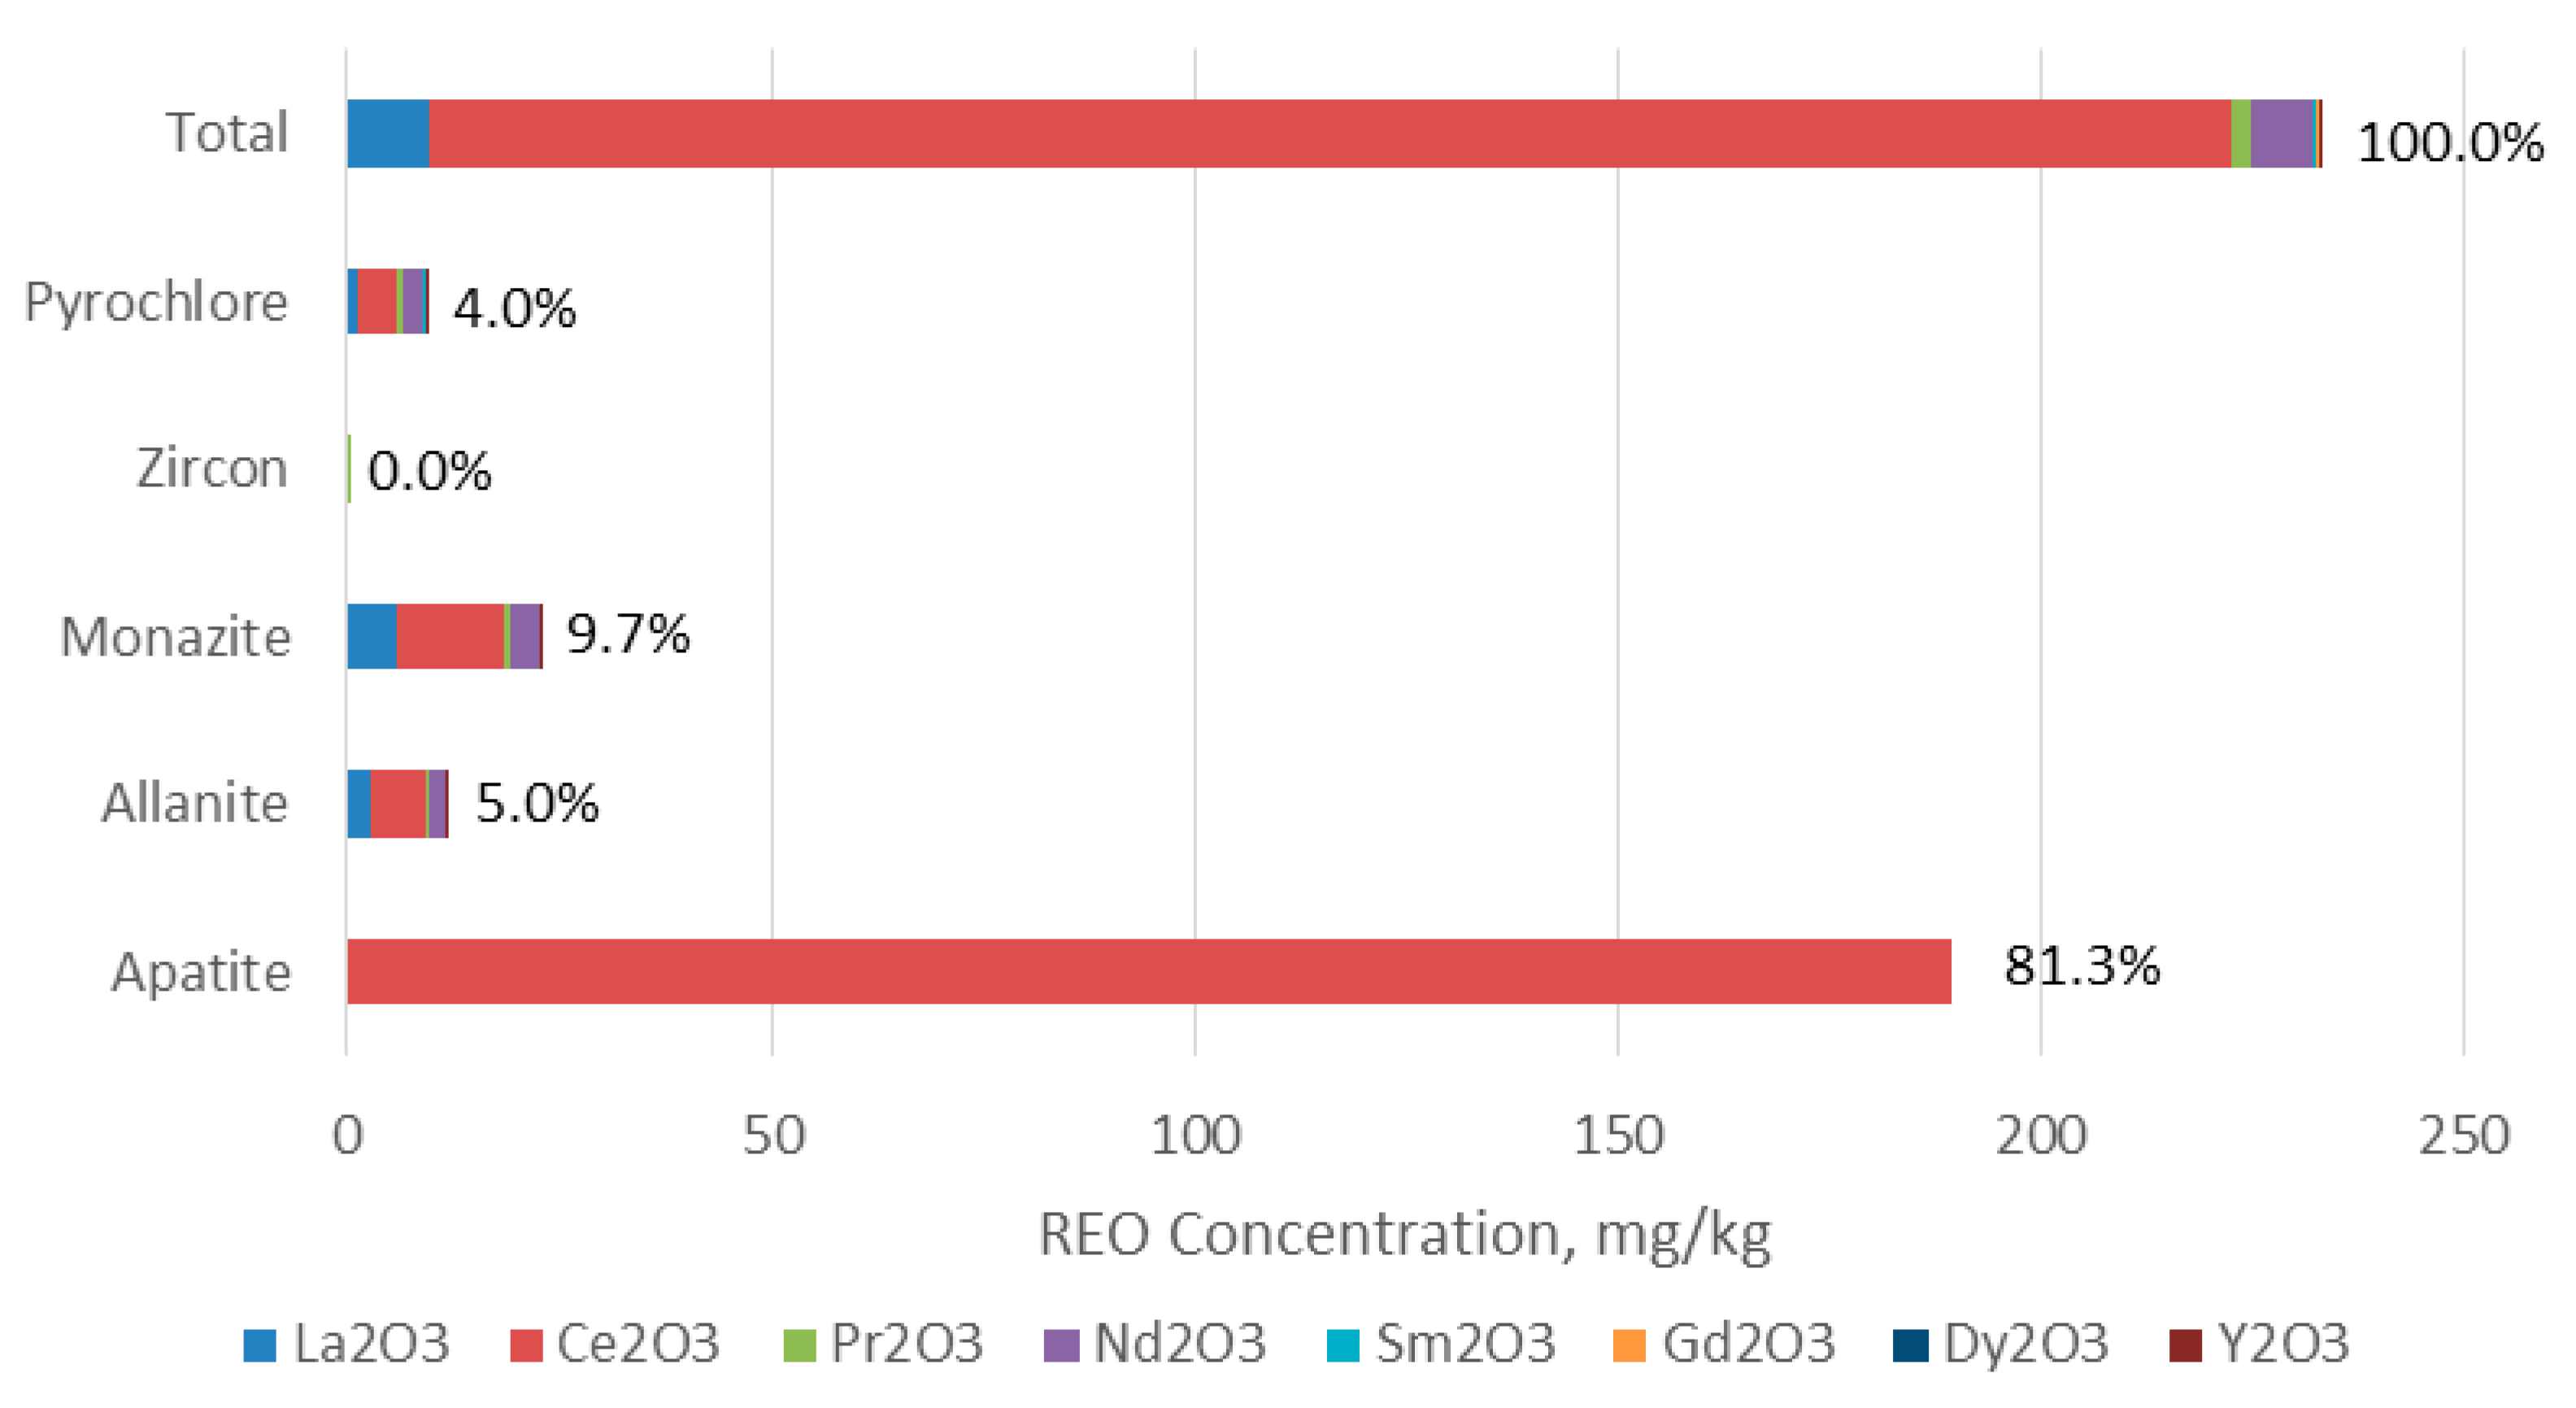
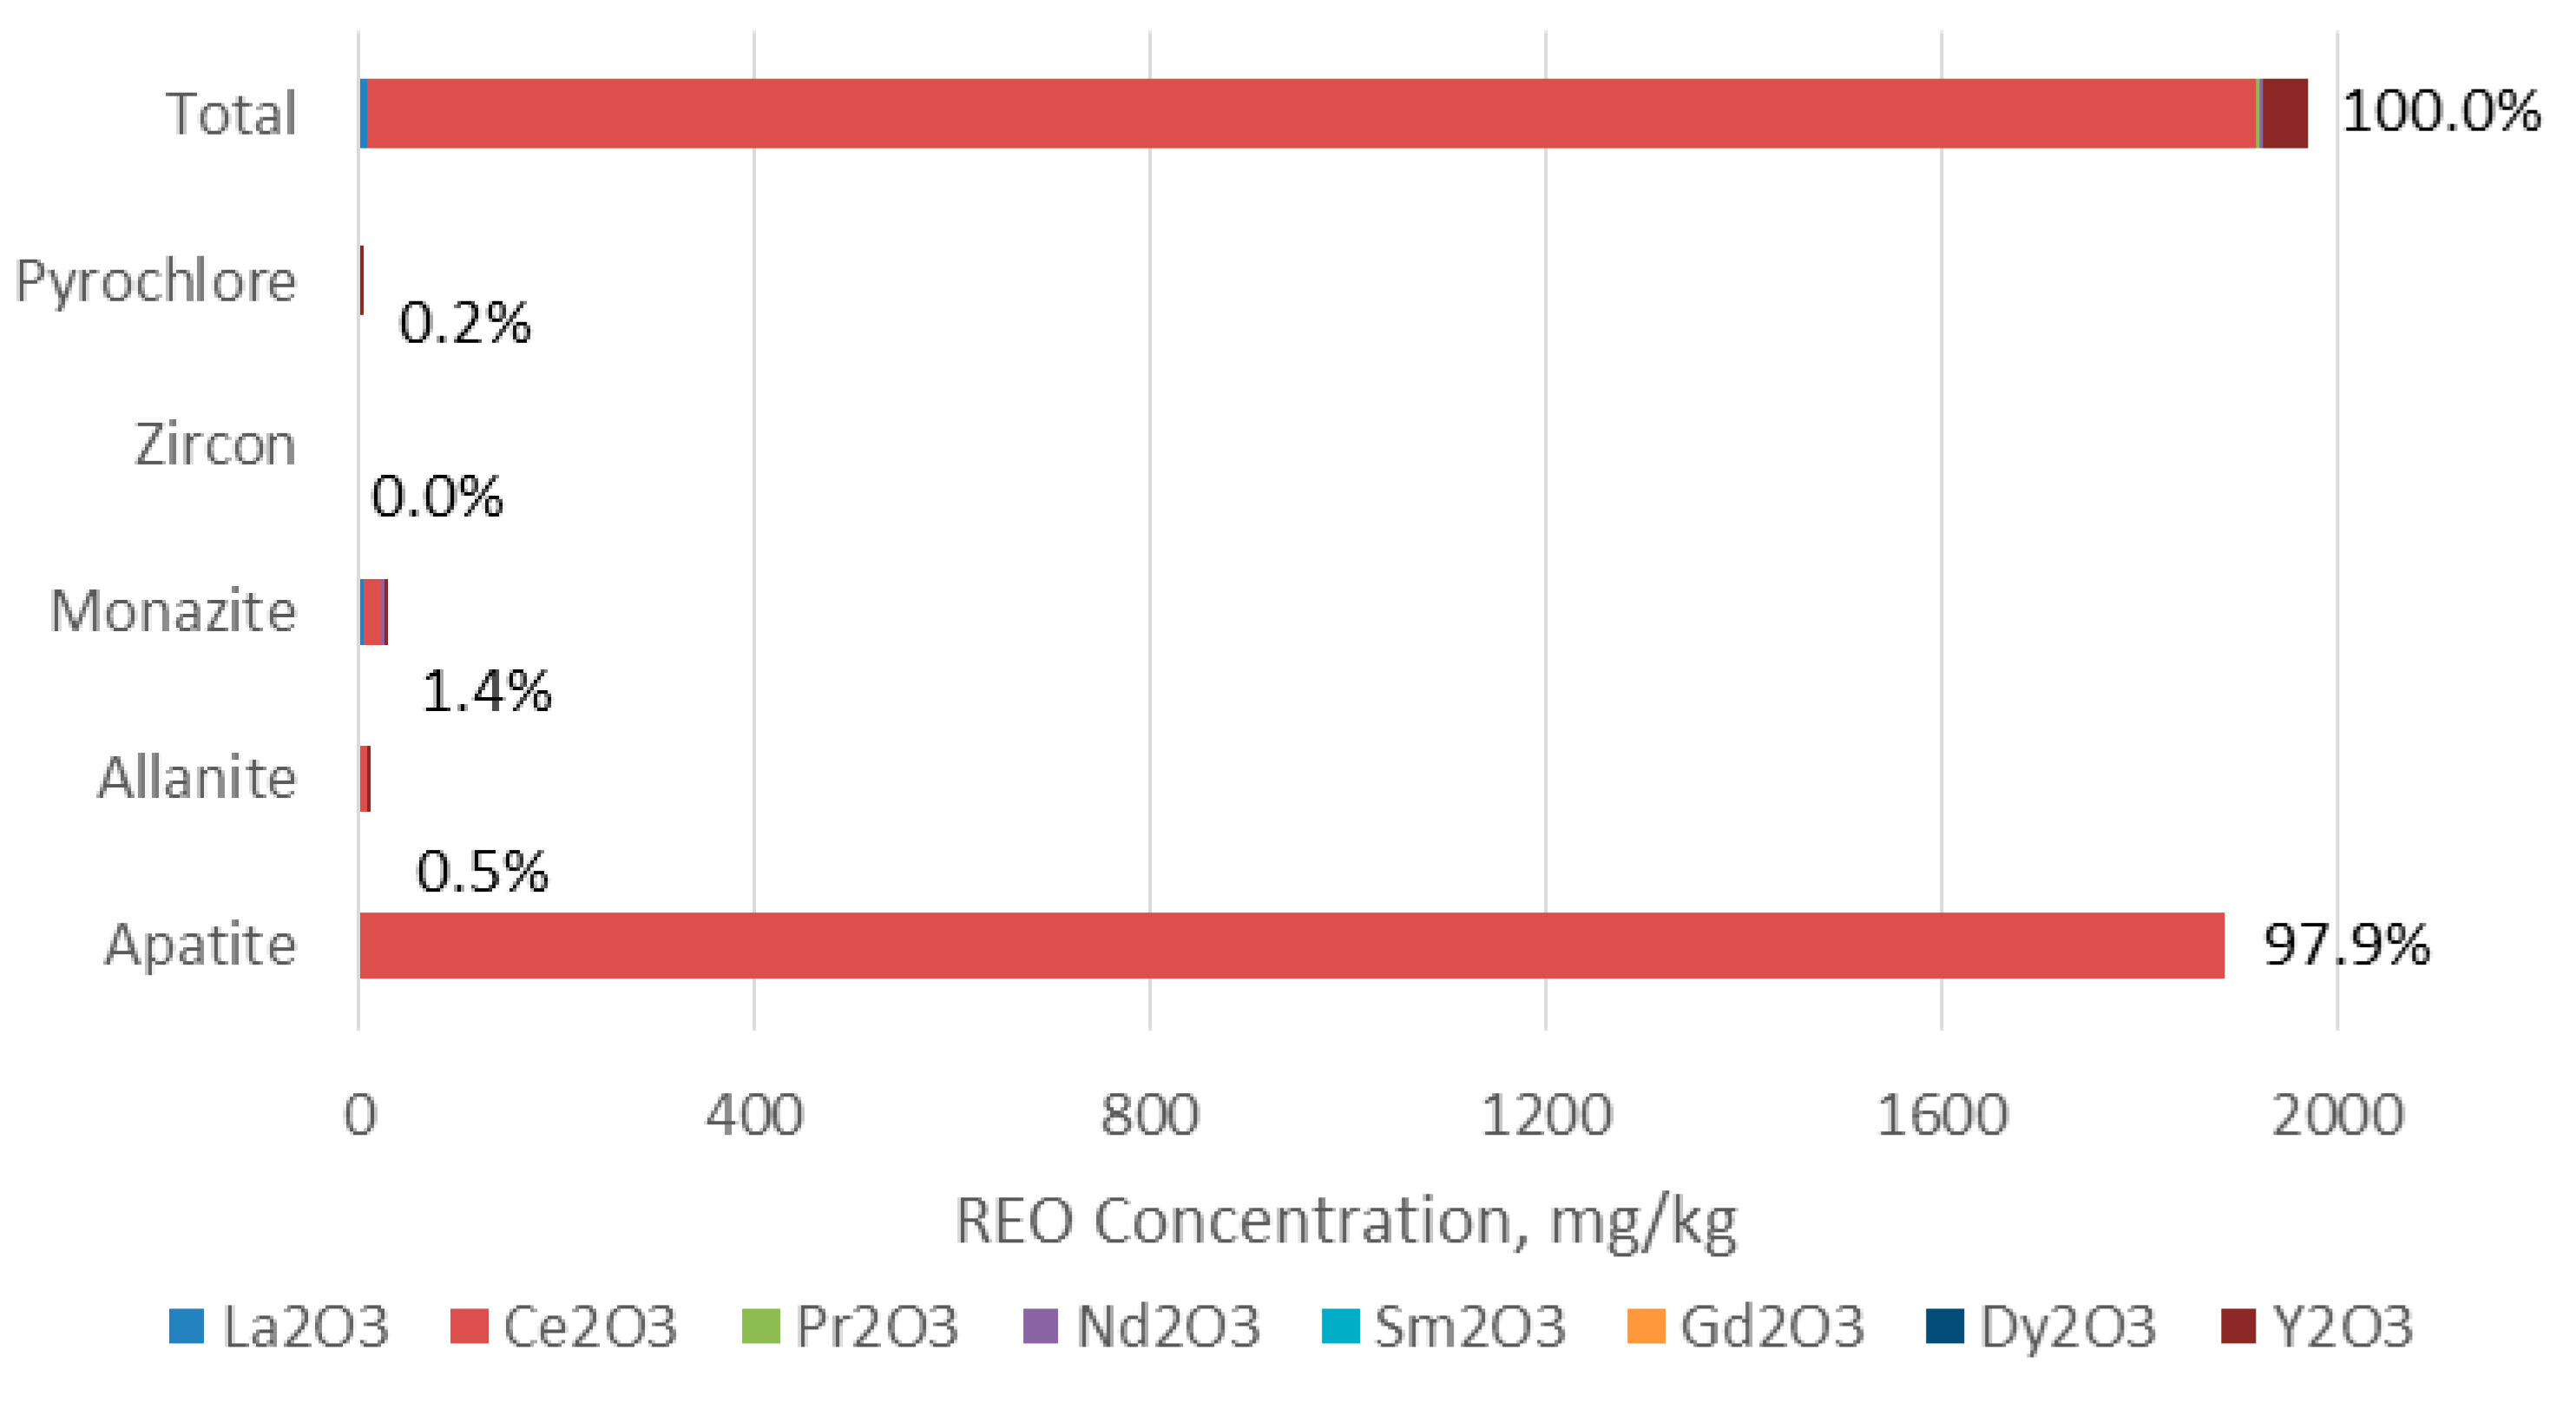
The concentrations of REOs contributed by each REE-bearing mineral in the ore, the concentrate and the tailings are obtained from the analysis results of MLA and EPMA and presented in Figure 2, Figure 3 and Figure 4, respectively.
For the ore with over 81% of REEs are in apatite and other REE-bearing minerals: monazite, allanite and pyrochlore carry about 19% of REEs. Zircon was identified the REE-bearing mineral but the contents of all REOs were below the LODs. The REEs in apatite are mainly Ce and other REEs are below the LODs. The REEs, such as La, Nd, Pr and Y, are present in significant amounts in monazite, allanite and pyrochlore.
During flotation, apatite was effectively enriched in the concentrate. For the concentrate, almost all (98%) of REEs are in apatite. In contrast, for the tailings nearly 80% of REEs are carried by monazite, allanite and pyrochlore. That is, REEs are lost into the tailings mainly due to the fact that monazite, allanite and pyrochlore have poorer flotation efficiency compared to apatite.
According to the concentrator production record in the flotation process, the mass yields of concentrate and tailings are 8.95% and 91.05%, respectively. The recoveries of REEs measured by TREO content in the concentrate and the tailings from the ore for different REE-bearing phases were calculated based on the data of REO concentrations shown in Figure 2, Figure 3 and Figure 4 and in Table 8. Over 89% of TREO were recovered in the concentrate from apatite but much less from allanite, monazite and pyrochlore, that is, most of REEs from allanite, monazite and pyrochlore are lost into the tailings. The overall recoveries of TREO content in the concentrate and the tailings are 74.1% and 22.0%, respectively. It is noted that because of different detection limits and accuracies of MLA and EPMA the summations are not exactly 100% but in the range of 95.0% to 100.8%, which are at very high precisions.
3.2.2. The Phosphogypsum (PG)
Modal mineralogy of the PG sample in three size fractions calculated by MLA are shown in Table 9. REE-bearing minerals including monazite, aeschynite and britholite were identified. Monazite (0.01–0.12%) is the prevailing REE mineral. The other two occur only in trace amounts. Monazite is more concentrated in the fine fraction of −45 µm and the content reaches 0.12 wt. %. The concentrations of monazite in the fractions of +75 µm and −75 + 45 µm are almost the same, only 0.01–0.02 wt. %. The distributions of monazite in the size fractions is consistent with the REE distribution in these fractions as shown in Table 5.
The mineralogical analysis indicates that the grain size of monazite is around 20 µm and the liberation degrees of monazite (>95% liberated) in the fractions of −45 µm, −75 + 45 µm and +75 µm are 100%, 95% and 85%, respectively.
Gypsum (Ca(SO4)·2(H2O)) is, naturally, the dominating mineral with the average content of 97.5 wt. % which was detected by EPMA to be a REE-bearing phase. The other REE-bearing phase listed in the table is not a clear mineral identified by MLA and EPMA.
The individual concentrations of REEs (measured by REOs) in all the REE-bearing phases by EPMA are shown in Table 10 which are the averages of many measurements. The REOs marking as n.d. in the table are below the LODs. Based on these data in Table 10 and the data of modal mineralogy in Table 9 the REO concentrations associated and distributions with these phases are calculated and shown in Figure 5. It is revealed that the TREO concentration in the PG is 0.16%wt and almost all (>98%) of REEs are shared by gypsum and monazite. Gypsum is the largest carrier of REEs which holds over 73% of REO content and 25% of REO content is contained in monazite. The REO contents shared by apatite and the other REE-bearing phase are less than 2%.
A leaching experiment of the apatite concentrate with sulfuric acid under conditions of sulfuric acid concentration of 2.5 M and a temperature 60°C showed the yield of PG by weight (ratio of PG weight to feed weight) in the leaching process is 128%.
The precipitation rates of REEs from the concentrate into the PG were calculated by combining the data of REO concentrations shown in Figure 5 and the yield of PG in the leaching process. The results are shown in Table 11. It is indicated that, depending on the element, the calculated precipitation rates from the concentrate into the PG are in the range of 28.2% to 90.0% REO. The overall precipitation of TREO is 85.1%. Because the recovery of TREO in the concentrate is 74.1% the recovery of TREO in the PG from the ore is 63.0%.
3.3. Occurrences of REEs in the Processing Streams
From the analyses shown, assuming the phosphate mine processes 1.0 Mt of the phosphate rock annually, the occurrences and distributions of REEs (measured by TREO contents) among the processing streams are summarized in Table 12. It is shown that during the processing, 26% and 62% of the TREO contents from the rock, respectively, end up in the beneficiation tailings and the PG. In the tailings the REEs mainly occur in the phases of apatite, monazite, allanite and pyrochlore and in the PG the REEs largely occur in the phases of gypsum and monazite. Only 12% of them are recovered from the product of phosphoric acid in the form of ions.
4. Discussion
In this study both MLA and EPMA analyses were used to determine REEs occurrence in the products and the wastes generated during the processing of apatite ore. Compared to using only MLA the combination of MLA and EPMA analyses provides more precise analysis data because of trace contents of REEs and complexity REE-bearing phases in these products and wastes. For instance, for this studied case MLA only identifies the occurrences of less than 20% of REOs in the PG. Over 80% of REOs existing in the phase of gypsum cannot be recognized by this method. EPMA is able to acquire more precise and quantitative elemental analyses of all REE-bearing phases. Thus, the distributions of REEs in the products of ore beneficiation process and concentrate wet-process can be determined and the values of these products on REEs recovery can be quantitatively assessed.
Compared to ICP-MS analysis the MLA-EPMA method can quantify the chemical compositions of mineralogical phases by measuring solid materials at the micrometre scale. The measured data of Ce2O3 and TREO for four different samples by ICP-MS and MLA-EPMA methods are compared in Table 13.
As shown in Table 13, the data of Ce2O3 and TREO measured with two methods are comparable. For the trace REEs in these samples there are large deviations between the measured data of their oxides by two methods because of significant differences on the detection limits of elements.
The outcomes presented in Table 12 provide not only the basic data to judge the values of these products and wastes generated during the apatite ore processing on the recovery of REEs but also a perspective for commercial recovery of REEs in which both the grades of REEs and their occurrences (REE-bearing phases and REEs distributions) are very important parameters.
For different phosphate ores throughout the world the contents of total REEs vary from 0.03 to 1.0 wt. % [1,2]. This study was based on a phosphate ore with the content of total REEs 0.05 wt. %. As most apatite ores have similar mineralogy of REEs the methods and outcomes from this study are significantly valuable for the studies of REEs recovery from other apatite ores.
According to this study, the beneficiation tailings and PG are certainly the main sources of REEs in this apatite ore processing. They contain 26% and 62% of the REEs from the rock, respectively. In the tailings REEs occur in the phases of apatite, monazite, allanite and pyrochlore. Flotation could be used to concentrate apatite and monazite using fatty acids or hydroxamates as the collectors but allanite and pyrochlore have normally poor floatability using conventional reagents. Wet high intensity or gradient magnetic separation could improve their recoveries according to our previous study [29]. Fine grain sizes of the REE-bearing phases, low degrees of their liberation and low REEs grade would cause the recovery of REEs very challenging by physical techniques (flotation and magnetic separation). Limited studies have been conducted on REE recovery from the beneficiation tailings. In a study [3] of a phosphate ore from Florida, USA the process of gravity separation using a shaking table followed by flotation was applied to concentrate the REE-bearing minerals, monazite and xenotime. Then sulfuric acid leaching was used to recover the REEs from the concentrate but the REE recovery of the physical process was about 30% and the final recovery of the REE was less than 20%.
In the PG, the REEs mainly occur in the phases of gypsum and monazite. Physical methods such as screening, flotation and magnetic separation could be applied to concentrate monazite but high recovery of REEs is not expected because only 26% of the REEs are carried by monazite in the studied sample. Most (73% REOs) REEs carried by gypsum cannot be enriched by physical methods. In addition, higher contents of REEs are distributed in very fine size fractions, such as in the fine fraction of −45 µm as showed in Table 5. Physical processes become more challenging for the concentration of REEs from the PG.
Author Contributions
Conceptualization, investigation, writing—original draft preparation and funding acquisition, X.Y.; mineralogical studies and writing—review and editing, H.T.M. and L.P.
Funding
The authors are grateful to the Academy of Finland (298094) for the financial support.
Conflicts of Interest
The authors declare no conflict of interest.
References
- Binnemans, K.; Jones, P.T.; Blanpain, B.; Van Gerven, T.; Pontikes, Y. Towards zero-waste valorisation of rare-earth-containing industrial process residues: A critical review. J. Clean. Prod. 2015, 99, 17–38. [Google Scholar] [CrossRef]
- Grabas, K.; Pawelczyk, A.; Strek, W.; Szełęg, E.; Stręk, S. Study on the properties of waste apatite phosphogypsum as a raw material of prospective applications. Waste Biomass Valor. 2018, 1–13. [Google Scholar] [CrossRef]
- Zhang, P.; Liang, H.; DePaoli, D. Recovery of rare earths and P from a phosphate flotation tails. In Proceedings of the IMPC 2018 Physical Enrichment—Gravity, Magnetic and Electrostatic Separation, Moscow, Russia, 17–21 September 2018. Paper 761. [Google Scholar]
- Hammas-Nasri, I.; Horchani-Naifer, K.; Férid, M.; Barca, D. Rare earths concentration from phosphogypsum waste by two-step leaching method. Int. J. Miner. Process. 2016, 149, 78–83. [Google Scholar] [CrossRef]
- Jarosiński, A. Development of the Polish wasteless technology of apatite phosphogypsum utilization with recovery of rare earths. J. Alloy. Compd. 1993, 200, 147–150. [Google Scholar] [CrossRef]
- Walawalkar, M.; Nichol, C.K.; Azimi, G. Process investigation of the acid leaching of rare earth elements from phosphogypsum using HCl, HNO3 and H2SO4. Hydrometallurgy 2016, 166, 195–204. [Google Scholar] [CrossRef]
- Azimi, G.; Papangelakis, V.G.; Dutrizac, J.E. Modelling of calcium sulphate solubility in concentrated multi-component sulphate solutions. Fluid Phase Equilibria 2007, 260, 300–315. [Google Scholar] [CrossRef]
- Azimi, G.; Papangelakis, V.G.; Dutrizac, J.E. Development of an MSE-based chemical model for the solubility of calcium sulphate in mixed chloride–sulphate solutions. Fluid Phase Equilibria 2008, 266, 172–186. [Google Scholar] [CrossRef]
- Ismail, Z.H.; Abu Elgoud, E.M.; Abdel Hai, F.; Ali, I.O.; Gasser, M.S.; Aly, H.F. Leaching of Some Lanthanides from Phosphogypsum Fertilizers by Mineral Acids. Arab J. Nucl. Sci. Appl. 2015, 48, 37–50. [Google Scholar]
- Todorovsky, D.; Terziev, A.; Milanova, M. Influence of mechanoactivation on rare earths leaching from phosphogypsum. Hydrometallurgy 1997, 45, 13–19. [Google Scholar] [CrossRef]
- Reid, S.; Walawalkar, M.; Azimi, G. Valorization of rare earth-containing landfilled stocks of industrial process residues: Phosphogypsum and red mud. In Proceedings of the Eres 2017, Santorini, Greece, 28–31 May 2017. [Google Scholar]
- Preston, J.S.; Cole, P.M.; Craig, W.M.; Feather, A.M. The recovery of rare earth oxides from a phosphoric acid by-product. The recovery of rare earth oxides from a phosphoric acid by-product. Part 1: Leaching of rare earth values and recovery of a mixed rare earth oxide by solvent extraction. Hydrometallurgy 1996, 41, 1–19. [Google Scholar] [CrossRef]
- Rutherford, P.M.; Dudas, M.J.; Samek, R.A. Environmental impacts of phosphogypsum. Sci. Total Environ. 1994, 149, 1–38. [Google Scholar] [CrossRef]
- Dutrizac, J.E. The behaviour of the rare earth elements during gypsum (CaSO4·2H2O) precipitation. Hydrometallurgy 2017, 174, 38–46. [Google Scholar] [CrossRef]
- Harbi, H.M.; Eldougdoug, A.A.; El-Shahwai, M.S. Mineral processing and extraction of rare earth elements from the Wadi Khamal nelsonite ore, northwestern Saudi Arabia. Arab. J. Geosci. 2011, 4, 353–363. [Google Scholar] [CrossRef]
- Koopman, C.; Witkamp, G.J. Extraction of lanthanides from the phosphoric acid production process to gain a purified gypsum and a valuable lanthanide by-product. Hydrometallurgy 2000, 58, 51–60. [Google Scholar] [CrossRef]
- Ogawa, Y.; Shikazono, N. REE behavior during anhydrite and gypsum formations of the Kuroko type massive sulfide-sulfate deposits. In Proceedings of the 3rd International Workshop on Water Dynamics, Sendai Japan, 16–17 November 2005; pp. 162–166. [Google Scholar]
- Ogawa, Y.; Shikazono, N.; Ishiyama, D.; Sato, H.; Mizuta, T.; Nakano, T. Mechanisms for anhydrite and gypsum formation in the Kuroko massive sulfidesulfate deposits, north Japan. Mineral. Depos. 2007, 42, 219–233. [Google Scholar] [CrossRef]
- Sandström, A.; Fredriksson, A. Apatite for extraction—Leaching of Kiirunavaara apatite for simultaneous production of fertilizers and REE. In Proceedings of the XXVI International Mineral Processing Congress—IMPC-2012, New Delhi, India, 24–28 September 2012; pp. 4707–4714. [Google Scholar]
- Wang, L.; Long, Z.; Huang, X.; Yu, Y.; Cui, D.; Zhang, G. Recovery of rare earths from wet-process phosphoric acid. Hydrometallurgy 2010, 101, 41–47. [Google Scholar] [CrossRef]
- Jin, H.X.; Li, J.Q.; Wu, F.Z. Acidolysis kinetics and RE leaching mechanics of RE bearing phosphorite ores. J. Univ. Sci. Technol. Beijing 2011, 33, 1071–1078. [Google Scholar]
- Santos, A.J.G.; Mazzilli, B.P.; Fávaro, D.I.T.; Sliva, P.S.C. Partitioning of radionuclides and trace elements in phosphogypsum and its source materials based on sequential extraction methods. J. Environ. Radioact. 2006, 87, 52–61. [Google Scholar] [CrossRef]
- Borges, R.C.; Fávaro, D.I.T.; Caldas, V.G.; Lauria, D.C.; Bernedo, A.V.B. Instrumental neutron activation analysis, gamma spectrometry and geographic information system techniques in the determination and mapping of rare earth element in phosphogypsum stacks. Environ. Earth Sci. 2016, 75, 705. [Google Scholar] [CrossRef]
- Schmidt, M.; Stumpf, T.; Walther, C.; Geckeis, H.; Franghänel, T. Incorporation versus adsorption: Substitution of Ca2+ by Eu3+ and Cm3+ in aragonite and gypsum. Dalton Trans. 2009, 7, 6645–6650. [Google Scholar] [CrossRef]
- Alhassanieh, O.; Mrad, O.; Ajji, Z. Sorption and migration of Cs, Sr and Eu in gypsum-groundwater system. Nukleonika 2012, 57, 125–131. [Google Scholar]
- Howie, R.A.; Zussman, J.; Deer, W. Introduction to the Rock-Forming Minerals, 3rd ed.; Mineralogical Society: Chantilly, VA, USA, 2013. [Google Scholar]
- Pouchou, J.L.; Pichoir, F. Basic expression of “PAP” computation for quantitative EPMA. In Proceedings of the 11 the International Congress on X-Ray Optics and Microanalysis (ICXOM), London, ON, Canada, 4–8 August 1986; pp. 249–253. [Google Scholar]
- Kalashnikov, A.; Yakovenchuk, V.N.; Pakhomovsky, Y.A.; Bazai, A.V.; Sokharev, V.A.; Konopleva, N.G.; Mikhailova, J.A.; Goryainov, P.M.; Ivanyuk, G.Y. Scandium of the Kovdor magnetite-apatite-baddeleyite deposit (Murmansk Region, Russia): Mineralogy, spatial distribution and potential resource. Ore Geol. Rev. 2016, 72, 532–537. [Google Scholar]
- Yang, X.; Satur, J.V.; Sanematsu, K.; Laukkanen, J.; Saastamoinen, T. Beneficiation studies of a complex REE ore. Miner. Eng. 2015, 71, 55–64. [Google Scholar] [CrossRef]
Figure 1.
The analytical steps and strategy.

Figure 2.
Rare Earth oxide (REO) concentrations in the REE-bearing phases of the ore (mg/kg).

Figure 3.
REO concentrations in the REE-bearing phases of the concentrate (mg/kg).

Figure 4.
REO concentrations in the REE-bearing phases of the tailings (mg/kg).

Figure 5.
REO concentrations in REE-bearing phases (mg/kg) and recoveries (%).


Table 1.
The limits of detection (LODs) of the ICP-MS for REEs (mg/kg).
| La | Ce | Pr | Nd | Sm | Eu | Gd | Tb | Dy | Ho | Er | Tm | Yb | Lu | Y | Sc |
|---|---|---|---|---|---|---|---|---|---|---|---|---|---|---|---|
| 0.1 | 0.1 | 0.1 | 0.2 | 0.2 | 0.05 | 0.05 | 0.1 | 0.1 | 0.1 | 0.05 | 0.1 | 0.05 | 0.1 | 1 | 1 |
Table 2.
The limits of detection (LODs) of the EPMA for REEs with sample phosphogypsum (PG) (mg/kg).
Table 2.
The limits of detection (LODs) of the EPMA for REEs with sample phosphogypsum (PG) (mg/kg).
| REE-Bearing Phase | La | Ce | Pr | Nd | Sm | Gd | Tb | Dy | Ho | Er | Yb | Lu | Y |
|---|---|---|---|---|---|---|---|---|---|---|---|---|---|
| Gypsum | 184 | 170 | 247 | 340 | 223 | 246 | 70 | ||||||
| Apatite | 176 | 148 | 262 | 340 | 230 | 233 | 79 | ||||||
| Monazite | 481 | 329 | 545 | 640 | 253 | 527 | 362 | 378 | 532 | 551 | 290 | 222 | 426 |
| Other phase | 185 | 183 | 259 | 362 | 251 | 275 | 85 |
Table 3.
The limits of detection (LODs) of the EPMA for REEs with samples of ore and apatite concentrate (mg/kg).
Table 3.
The limits of detection (LODs) of the EPMA for REEs with samples of ore and apatite concentrate (mg/kg).
| REE-Bearing Phase | La | Ce | Pr | Nd | Sm | Gd | Dy | Y | Sc |
|---|---|---|---|---|---|---|---|---|---|
| Apatite | 983 | 1100 | 1576 | 2194 | 2138 | 2027 | 1077 | 930 | |
| Allanite | 1353 | 1534 | 2022 | 2678 | 2700 | 2460 | 1411 | 1126 | |
| Monazite | 1353 | 1534 | 2022 | 2678 | 2700 | 2460 | 1411 | 1126 | |
| Zircon | n.d. * | 1302 | 1846 | 2569 | 2515 | 2368 | 1243 | 1060 | 421 |
| Pyrochlore | 1721 | 1821 | 2571 | 3644 | 3458 | 3247 | 1794 | 1640 | 603 |
* not determined.
Table 4.
The individual REEs concentrations of the ore, concentrate and PG by ICP-MS (mg/kg).
| La2O3 | Ce2O3 | Pr2O3 | Nd2O3 | Sm2O3 | Eu2O3 | Gd2O3 | Tb2O3 | Dy2O3 | |
| Ore | 89.60 | 235.43 | 30.08 | 119.32 | 17.80 | 4.48 | 12.39 | 1.27 | 5.11 |
| Flot Conc | 581.81 | 1488.11 | 201.08 | 800.22 | 116.46 | 28.44 | 78.52 | 7.69 | 29.02 |
| Flot Tail * | 41.23 | 112.33 | 13.27 | 52.41 | 8.11 | 2.13 | 5.89 | 0.64 | 2.76 |
| PG | 339.75 | 1029.09 | 134.00 | 547.27 | 81.87 | 19.57 | 51.87 | 4.95 | 17.44 |
| Ho2O3 | Er2O3 | Tm2O3 | Yb2O3 | Lu2O3 | Sc2O3 | Y2O3 | TREO | ||
| Ore | 0.76 | 1.79 | 0.18 | 1.00 | n.d. | 10.00 | 19.68 | 539.02 | |
| Flot Conc | 4.09 | 8.95 | 0.82 | 4..11 | 0.50 | 9.50 | 81.28 | 3431.11 | |
| Flot Tail * | 0.43 | 1.09 | n.d. | 0.69 | n.d. | n.d. | 13.63 | 254.83 | |
| PG | 2.41 | 4.92 | 0.34 | 1.15 | n.d. | n.d. | 45.72 | 2280.56 |
* Calculated based on chemical analysis results of ore and concentrate (the concentrate mass yield is 8.95 wt. % according to the concentrator production record).
Table 5.
The individual REEs concentrations of in the size fractions of +75, −75 + 45 and −45 µm in the PG (mg/kg).
Table 5.
The individual REEs concentrations of in the size fractions of +75, −75 + 45 and −45 µm in the PG (mg/kg).
| La2O3 | Ce2O3 | Pr2O3 | Nd2O3 | Sm2O3 | Eu2O3 | Gd2O3 | Tb2O3 | Dy2O3 | |
| +75 µm | 290.85 | 930.0 | 126.39 | 528.37 | 79.55 | 18.99 | 50.14 | 4.83 | 17.33 |
| −75 + 45 µm | 261.53 | 839.81 | 113.29 | 473.55 | 73.06 | 17.48 | 45.53 | 4.49 | 15.61 |
| −45 µm | 485.53 | 1358.69 | 166.19 | 652.01 | 94.62 | 22.70 | 60.97 | 5.76 | 19.63 |
| Ho2O3 | Er2O3 | Tm2O3 | Yb2O3 | Lu2O3 | Sc2O3 | Y2O3 | TREO | ||
| +75 µm | 1.83 | 4.80 | 0.23 | 1.25 | n.d. | n.d. | 41.65 | 2096.34 | |
| −75 + 45 µm | 2.29 | 4.35 | 0.34 | 1.25 | n.d. | n.d. | 41.15 | 1893.84 | |
| −45 µm | 2.06 | 3.89 | 0.23 | 0.91 | n.d. | n.d. | 36.45 | 2909.74 |
The weight percentages of three size fractions of the PG are: +75 µm 36.1 wt. %, −75 + 45 µm 33.7 wt. % and −45 µm 30.2 wt. %.
Table 6.
Modal mineralogy of the ore and flotation concentrate by mineral liberation analyser (MLA).
Table 6.
Modal mineralogy of the ore and flotation concentrate by mineral liberation analyser (MLA).
| Mineral | Phosphate Rock, wt. % | Apatite Concentrate, wt. % | Tailings, wt. % * | |
|---|---|---|---|---|
| REE-bearing minerals | Apatite | 8.880 | 88.460 | 1.052 |
| Monazite | 0.003 | 0.004 | 0.003 | |
| Allanite | 0.0051 | 0.0046 | 0.005 | |
| Zircon | 0.018 | 0.008 | 0.019 | |
| Pyrochlore | 0.003 | 0.001 | 0.003 | |
| non REE-bearing minerals | Calcite | 16.680 | 8.700 | 17.460 |
| Ankerite | 0.081 | 0.140 | 0.075 | |
| Dolomite | 2.450 | 1.350 | 2.561 | |
| Other silicates | 70.780 | 1.020 | 77.64 |
* calculated data based on analysed data of ore and concentrate. The mass yields of the concentrate and tailings are 8.95% and 91.05% according to the concentrator production record.
Table 7.
The individual concentrations of REEs in all the REE-bearing phases: apatite, allanite, monazite, zircon and pyrochlore by EPMA (mg/kg) (measured by REOs).
Table 7.
The individual concentrations of REEs in all the REE-bearing phases: apatite, allanite, monazite, zircon and pyrochlore by EPMA (mg/kg) (measured by REOs).
| Apatite | Allanite | Monazite | Zircon | Pyrochlore | |
|---|---|---|---|---|---|
| Number of analyses | 20 | 9 | 11 | 9 | 7 |
| La2O3 | n.d. | 51724 | 173018 | n.d. | 35183 |
| Ce2O3 | 2133 | 127800 | 381318 | n.d. | 149817 |
| Pr2O3 | n.d. | 12401 | 32844 | n.d. | 19167 |
| Nd2O3 | n.d. | 35174 | 95177 | n.d. | 72237 |
| Sm2O3 | n.d. | n.d. | 5425 | n.d. | 10919 |
| Gd2O3 | n.d. | n.d. | n.d. | n.d. | 5010 |
| Dy2O3 | n.d. | n.d. | n.d. | n.d. | n.d. |
| Sc2O3 | n.d. | n.d. | |||
| Y2O3 | n.d. | n.d. | n.d. | n.d. | 1459 |
| TREO | 2133 | 227099 | 687782 | 0 | 293792 |
Table 8.
Recoveries of total rare earth oxide (TREO) in the concentrate and tailings from different REE-bearing minerals.
Table 8.
Recoveries of total rare earth oxide (TREO) in the concentrate and tailings from different REE-bearing minerals.
| Apatite | Allanite | Monazite | Pyrochlore | Total Rec | |
|---|---|---|---|---|---|
| Concentrate | 89.2 | 8.2 | 10.8 | 2.8 | 74.1 |
| Tailings | 6.1 | 91.9 | 90.0 | 92.2 | 22.0 |
| Sum | 95.3 | 100.0 | 100.8 | 95.0 | 96.1 |
Table 9.
Modal mineralogy of the PG sample (wt. %).
| Mineral | +75 µm | −75 + 45 µm | −45 µm | |
|---|---|---|---|---|
| REE-bearing phases | Gypsum | 96.513 | 99.017 | 97.094 |
| Apatite | 0.802 | 0.055 | 0.119 | |
| Monazite | 0.011 | 0.017 | 0.119 | |
| Other REE-bearing phase | 0.061 | 0.031 | 0.211 | |
| Non REE-bearing phases | Celestine | 0.123 | 0.0545 | 0.475 |
| Fluorite_mix | 1.249 | 0.212 | 0.867 | |
| Tremolite | 0.334 | 0.136 | 0.149 | |
| Other (silicates, Fe-oxide, etc.) | 1.121 | 0.493 | 0.938 | |
| Total | 100 | 100 | 100 |
Table 10.
The individual concentrations of REEs (measured by REOs) of the REE-bearing phases (mg/kg) *.
Table 10.
The individual concentrations of REEs (measured by REOs) of the REE-bearing phases (mg/kg) *.
| Gypsum | Apatite | Monazite | Other REE-Bearing Phase | |
|---|---|---|---|---|
| Number of analyses | 89 | 37 | 8 | 5 |
| La2O3 | n.d. | 506 | 192,697 | 2176 |
| Ce2O3 | 592 | 1587 | 393,139 | 6358 |
| Pr2O3 | n.d. | n.d. | 31,134 | 776 |
| Nd2O3 | 342 | 1025 | 77,262 | 2444 |
| Sm2O3 | n.d. | n.d. | 4124 | 453 |
| Gd2O3 | n.d. | n.d. | 856 | 280 |
| Y2O3 | n.d. | 179 | n.d. | 235 |
| TREO | 934 | 3788 | 699,212 | 122,622 |
* Certain elements in empty fields were not detected.
Table 11.
The precipitation rates of REO from the concentrate into the PG (%).
| La2O3 | Ce2O3 | Pr2O3 | Nd2O3 | Sm2O3 | Eu2O3 | Gd2O3 | Tb2O3 |
| 74.75 | 88.52 | 85.30 | 87.54 | 89.98 | 88.08 | 84.56 | 82.39 |
| Dy2O3 | Ho2O3 | Er2O3 | Tm2O3 | Yb2O3 | Lu2O3 | Y2O3 | TREO |
| 76.92 | 75.42 | 70.36 | 53.07 | 35.82 | 28.16 | 72.00 | 85.08 |
Table 12.
The Occurrences of REO in the Processing Streams.
| Product | Weight, t | TREO, mg/kg | REEs Occurrence | ||
|---|---|---|---|---|---|
| REE-Bearing Phase | TREO, t | % | |||
| Phosphate Rock | 1,000,000 | 233 | 233 | 100.0 | |
| Apatite | 189.3 | 81.3 | |||
| Allanite | 11.5 | 5.0 | |||
| Monazite | 22.7 | 9.7 | |||
| Pyrochlore | 9.3 | 4.0 | |||
| Concentrate | 89,500 | 1928 | 172.5 | 74.1 | |
| Apatite | 168.8 | 72.5 | |||
| Allanite | 0.9 | 0.4 | |||
| Monazite | 2.5 | 1.1 | |||
| Pyrochlore | 0.3 | 0.1 | |||
| Tailings | 910,500 | 66 | 60.3 | 25.9 | |
| Apatite | 13.7 | 5.9 | |||
| Allanite | 12.5 | 5.4 | |||
| Monazite | 24.0 | 10.3 | |||
| Pyrochlore | 10.1 | 4.3 | |||
| Phosphogypsum (PG) | 114,560 | 1258 | 144.1 | 61.9 | |
| Gypsum | 104.6 | 44.9 | |||
| Apatite | 1.3 | 0,6 | |||
| Monazite | 36.7 | 15.8 | |||
| Other REE-bearing phase | 1.4 | 0.6 | |||
| Phosphoric acid | ? | ? | Ions in solution | 28.4 | 12.2 |
Table 13.
The comparison of the measured data of Ce2O3 and TREO for four different samples by ICP-MS and MLA-EPMA methods (mg/kg).
Table 13.
The comparison of the measured data of Ce2O3 and TREO for four different samples by ICP-MS and MLA-EPMA methods (mg/kg).
| Ore | Concentrate | Tailings | PG | |||||
|---|---|---|---|---|---|---|---|---|
| Ce2O3 | TREO | Ce2O3 | TREO | Ce2O3 | TREO | Ce2O3 | TREO | |
| MLA-EPMA | 213 | 233 | 1909 | 1928 | 37 | 56 | 770 | 1258 |
| ICP-MS | 235 | 539 | 1488 | 3431 | 112 | 255 | 1029 | 2281 |
© 2019 by the authors. Licensee MDPI, Basel, Switzerland. This article is an open access article distributed under the terms and conditions of the Creative Commons Attribution (CC BY) license (http://creativecommons.org/licenses/by/4.0/).
Share and Cite
MDPI and ACS Style
Yang, X.; Makkonen, H.T.; Pakkanen, L. Rare Earth Occurrences in Streams of Processing a Phosphate Ore. Minerals 2019, 9, 262. https://doi.org/10.3390/min9050262
AMA Style
Yang X, Makkonen HT, Pakkanen L. Rare Earth Occurrences in Streams of Processing a Phosphate Ore. Minerals. 2019; 9(5):262. https://doi.org/10.3390/min9050262
Chicago/Turabian StyleYang, Xiaosheng, Hannu Tapani Makkonen, and Lassi Pakkanen. 2019. "Rare Earth Occurrences in Streams of Processing a Phosphate Ore" Minerals 9, no. 5: 262. https://doi.org/10.3390/min9050262
Note that from the first issue of 2016, this journal uses article numbers instead of page numbers. See further details here.