Abstract
Prolonged high-intensity grinding can modify the crystal structure of solid substances and/or induce chemical reaction, which is referred to as mechanochemical reaction. Such reactions can exert positive influences on hydrometallurgical processes, therefore, many researchers have applied mechanochemical reactions for metals dissolution from minerals. The mechanism of mechanochemical reaction has been investigated using solid analyses and simulations. Structural changes caused by mechanochemical reactions are not yet sufficiently clarified because the ground samples are amorphous. The objective of this study was to analyze structural changes of cerianite in weathered residual rare earth ore by mechanochemical reduction. The ore was ground by planetary ball milling for 10, 60 and 720 min. Structural change was analyzed by the X-ray absorption near-edge structure and extended x-ray absorption fine structure analysis at the cerium LIII- and K-edges. These analyses revealed that the structural change of cerianite in this ore induced by mechanochemical reduction involved oxygen vacancy production. The process of the oxygen vacancy formation was closely coupled with the quantum effect of localization–delocalization of the 4f electron of cerium.
1. Introduction
Cerianite is tetravalent cerium dioxide (CeO2) and has the fluorite structure (space group ()) [1]. In nature, cerianite exists in rare earth ores [2,3,4,5]. Cerianite has oxygen storage capacity due to a facile redox reaction from tetra- to trivalent cerium, as described in Equation (1) [6], and the ability to improve dispersion of noble metals [7] and provide thermal stabilization of alumina supports [8]. Owing to these unique properties, cerianite has been widely used as a promoter of the three-way catalyst for automobile exhaust emission control [6,7].
Since this redox reaction is involved in the oxygen, many researchers investigated the influence of oxygen partial pressure in the experimental system [9,10]. Zinkevich et al. [9] and Panlener et al. [10] reported that the redox reaction of cerianite was promoted in the lower oxygen partial pressure. In addition, it has been reported that the reducibility of cerianite is enhanced by the addition of yttrium [11,12], gadolinium [13,14], and zirconium to form a solid solution [15,16]. Previous papers [11,12,13,14,15,16] reported that a solid solution of cerianite was reduced from tetra- to trivalent cerium at moderate temperatures (600–700 ℃), while pure cerianite reduced only at high temperatures (<1200 ℃) [17]. The reaction properties, such as structural changes and activation energy of solid solutions of cerianite, have been investigated using both experimental and simulation approaches. In the experimental approaches, the X-ray diffraction analysis [18], electrical conductivity measurements [19], and X-ray absorption fine structure (XAFS) analysis [11,12,13,14,15,16] were usually used to investigate the reaction mechanism and structural changes induced by the addition of yttrium, gadolinium, and zirconium. In the simulation approaches, the activation energy for oxygen migration in a solid solution of cerianite was calculated, using the structural change analysis based on XAFS [20,21].
It is known that the redox reaction of cerianite, as described by Equation (1), only occurs when heating above moderate temperatures; however, our previous paper [2] recently reported that this redox reaction of cerianite in a weathered residual rare earth ore also occurred by planetary ball milling at room temperature.
A reaction that occurs on grinding, such as this redox reaction, is generally known as a mechanochemical reaction [22,23]. High-intensity grinding, like planetary ball milling, has the ability to modify crystal structures of solid substances and/or induce a chemical reaction, which is referred to as mechanochemical reaction [24,25]. Mechanochemical reactions have a positive influence on hydrometallurgical processes and have been applied for metals dissolution from ores [2,5,22,23,26,27,28]; however, these studies only focused on investigation of the reaction mechanism. There is still limited knowledge of mechanochemical reactions and their theory has not been established. To apply mechanochemical reactions with high-intensity grinding to practical use in hydrometallurgical processes, it is strongly desired to establish the theory.
The objective of this study was to clarify the structural change of cerianite in a weathered residual rare earth ore during mechanochemical reduction. We performed grinding on the ore using a planetary ball mill. The ground samples were analyzed by XAFS at the cerium LIII- [2] and K-edges because that was amorphous and the concentration of cerium in the ore was much lower than that of other elements. We then performed extended the x-ray absorption fine structure (EXAFS) analysis using the XAFS spectra at the cerium K-edge to clarify the structural change of cerianite in the ore caused by the planetary ball milling.
2. Materials and Methods
2.1. Analytical Sample
The weathered residual rare earth ore used in this study was obtained from the Republic of South Africa. Detailed characterizations were described in our previous paper [2]. Briefly, as shown in Table 1; Table 2, the major chemical composition of this ore was determined by the x-ray fluorescence (XRF; ZSX Primus III+, Rigaku Corporation, Tokyo, Japan), while concentrations of the rare earth elements were analyzed by the laser-ablation inductively coupled plasma mass spectrometry (LA–ICP–MS; 7500 Series, Agilent Technologies, Santa Clara, CA, USA). The mineral liberation analysis (MLA; QuantaF Co., FEI, USA) revealed that this ore contained four types of cerium minerals: Britholite-(Ce) [(Ce,Ca,Th,La, Nd)5(SiO4,PO4)3(OH,F)], cerianite [(Ce,Th)O2], cerite [Ce9Fe(SiO4)6[(SiO3),(OH)](OH)3], and monazite-(Nd) [(Nd,Ce,La)(P,Si)O4]. Of these, britholite-(Ce), cerite, and monazite-(Nd) were trivalent cerium minerals, while cerianite was the only tetravalent cerium mineral.

Table 1.
Chemical composition of weathered residual rare earth ore, as analyzed by X-ray fluorescence (mass %) [2].
Table 2.
Concentrations of rare earth elements in weathered residual rare earth ore, as analyzed by laser-ablation inductively coupled plasma mass spectrometry [mg/dm3] [2].
Grinding experiments using a planetary ball mill (PM100, Verder Scientific Co. Ltd., Japan) were performed under the same conditions as reported in our previous paper [2]. Briefly, each experiment employed 100 g ore; the rotation speed of the mill was fixed at 300 rpm; 25 chromium steel balls of 19 mm diameter were used as the grinding media. Grinding time was 10, 60 and 720 min. The specific surface areas of the samples, without and with grinding, as measured by a high-efficiency specific surface area and pore distribution analyzer (ASAP 2020 Series, Shimadzu, Kyoto, Japan), are shown in Table 3.
Table 3.
Specific surface area of sample with and without grinding [2].
XAFS analysis at the cerium LIII-edge of samples with and without grinding was performed using the BL5S1 beamline at Aichi Synchrotron Radiation Center, Seto, Japan. XAFS spectra at the cerium LIII-edge have an advantage in evaluating the oxidation state of cerium. The valence of cerium was evaluated by Kyoto the X-ray absorption near-edge structure (XANES) analysis in the range of 5720–5740 eV, using cerium fluoride (CeF3) and tetravalent cerium oxide (CeO2) as reference materials. Briefly, the method of XANES analysis is to represent by superposition the peak intensity of samples using that of reference materials. It should be noted that the calculated results by the XANES analysis have a margin of error about 10%. The concentrations of tri- and tetravalent cerium in the samples with and without grinding are shown in Table 4, which was discussed in our previous paper [2].
Table 4.
Concentrations of tri- and tetravalent cerium in samples with and without grinding, based on X-ray absorption near-edge structure analysis at the cerium LIII-edge [%] [2].
2.2. X-Ray Absorption Fine Structure Analysis at Cerium K-edge
The XAFS analysis, including XANES and EXAFS, is a very powerful analytical technique for an amorphous sample. In particular, the local structure in a specific atom can be analyzed using EXAFS. Low-to-medium-energy synchrotron facilities are relatively accessible, so most of the XAFS analysis for cerianite has been conducted at the cerium LIII-edge (5.7 × 10³ eV) [29,30,31]. The EXAFS analysis at the cerium LIII-edge has a somewhat lower accuracy for derived structural parameters due to its limited data range, arising from the small energy separation between the LIII- and LII-edges [29,30,31]. Therefore, the XAFS analysis for cerianite was conducted at the cerium K-edge (4.0 × 10⁴ eV). This way, a more accurate local structure around the cerium atom could be obtained because of the larger EXAFS data range, as described previously [32].
To analyze the structural change caused by grinding, the XAFS analysis at the cerium K-edge was conducted on samples with and without grinding using the BL14B2 beamline at the SPring-8 Synchrotron Radiation Facility, Japan. All spectra were obtained at room temperature. The electron storage ring was operated at 8.0 GeV with a stored current of 99.6 mA. Energy was scanned from 40 290 eV to 41 233 eV using a step size of 6 eV. Continuous X-rays from synchrotron radiation were monochromatized using a silica (311) double-crystal monochromator. The XAFS spectra for all samples were obtained in fluorescence mode using a 19-element germanium (Ge) solid-state detector. Cerium phosphate (CePO4) and CeO2 were used as reference materials.
The EXAFS functions were derived from the raw XAFS spectra by the pre- and post-edge linear background subtraction and then normalized with respect to the edge jump. After being k3-weighted, where k is the photoelectron wave number, the EXAFS function was Fourier transformed from the k3-weighted EXAFS function to a radial distribution function (RDF) using a Hanning window function within 1–12 × 1010 m−1. Structural parameters for different coordination shells surrounding both the central tri- and tetravalent cerium atoms, i.e., coordination number, atomic distance, and Debye–Waller factor, were obtained by curve fitting using both the k3-weighted EXAFS function and RDF. Structural parameters were obtained from fitting the RDF in the interval of 1.5–4.0 × 10⁻¹⁰ m, using contributions from the first to fourth coordination shells (Ce(IV)–O, Ce(III)–O, Ce(III)–Ce(III), and Ce(IV)–Ce(IV)). The theoretical phases and amplitude functions for these shells were calculated using the FEFF 6.0 software [33,34]. All EXAFS analyses were performed using the Athena and Artemis software [35].
3. Results and Discussion
3.1. X-Ray Absorption Near-Edge Structure Analysis
The XAFS spectra at the cerium K- and LIII-edges [2] corresponding to the XANES region are shown in Figure 1 for samples with and without grinding. Tri- and tetravalent cerium peaks at the cerium K-edge XAFS spectra were observed at 40,460 eV and 40,470 eV, respectively. The valence of cerium was already identified by the XANES analysis at the cerium LIII-edge XAFS spectra, as shown in Table 4 [2]. In addition, the specific surface area was already measured by a high-efficiency specific surface area and pore distribution analyzer, as shown in Table 3 [2]. The concentration of trivalent cerium significantly increased with grinding time, especially after 10 min of grinding. On the other hand, the specific surface area shown in Table 3 increased by 10 min of grinding, but decreased after 10 min of grinding. Thus, it was suggested that the planetary ball milling energy to generate a new surface area by 10 min of grinding, but occur mechanochemical reaction as described in Equation (1) after 10 min grinding [2]. It was confirmed by both the cerium K- and LIII-edge XAFS spectra that the energetic shift corresponded to the change in valence of cerium (Figure 1a). The results of the XANES analysis using the XAFS spectra at the cerium K-edge are shown in Table 5. Compared with the data in Table 4, the trend, in which the concentration of trivalent cerium significantly increased with grinding time, was the same. These results showed that the XAFS spectra at the cerium K-edge were sufficient to identify the valence of cerium in samples both with and without grinding [29,30].
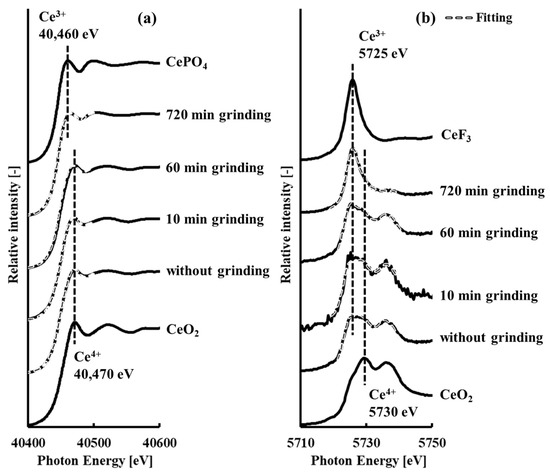
Figure 1.
Cerium (a) K- and (b) LIII-edge X-ray absorption fine structure spectra [2] corresponding to X-ray absorption near the edge structure region of samples with and without grinding, showing resolved components of tri- and tetravalent cerium based on cerium fluoride or cerium phosphate and tetravalent cerium oxide reference spectra, respectively.
Table 5.
Concentrations of tri- and tetravalent cerium in samples with and without grinding, based on X-ray absorption near-edge structure analysis at cerium K-edge (%).
Cerium is the first element in the Periodic Table with a partially occuped f orbital: Its arrangement of electrons is [Xe core]4f1[Xe core]5d16s2 (1s22s22p63s23p63d104s24p64d104f15s25p65d16s2). From Figure 1b, the XAFS spectra at the cerium LIII-edge of CeO2 had two characteristic peaks at 5730 and 5737 eV, while that of CeF3 had only one peak at 5725 eV. The peaks of CeO2 at 5730 eV and 5737 eV are derived from the 2p to (4f1)5d electronic transition, which results from interactions between the cerium 4f electron and the nearest oxygen 2p electron, and from the 2p to (4f0)5d electronic transition, respectively [36,37]. The peak of CeF3 at 5725 eV is derived from the 2p to (4f1)5d electronic transition [36,37]. In CeO2, all tetravalent cerium normally leaves the host atoms and transfers into the 2p bands of two oxygen atoms; in trivalent cerium trioxide (Ce2O3), the cerium 4f electron is fully localized [38]. From the above discussion, it is suggested that the structural change of cerianite in weathered residual rare earth ore during mechanochemical reduction involved localization–delocalization of the cerium 4f electron.
3.2. Extended X-Ray Absorption Fine Structure Analysis
The k3-weighted EXAFS spectra and RDF of CeO2 of samples with and without grinding are shown in Figure 2; Figure 3, respectively. The curve-fitted results are plotted and the corresponding parametric values are listed in Table 6. It should be noted that the third shell (Ce(III)–Ce(III)) contribution was quite minor relative to that of the fourth shell (Ce(IV)–Ce(IV)), and a significant overlap existed between these two shells in the RDF.
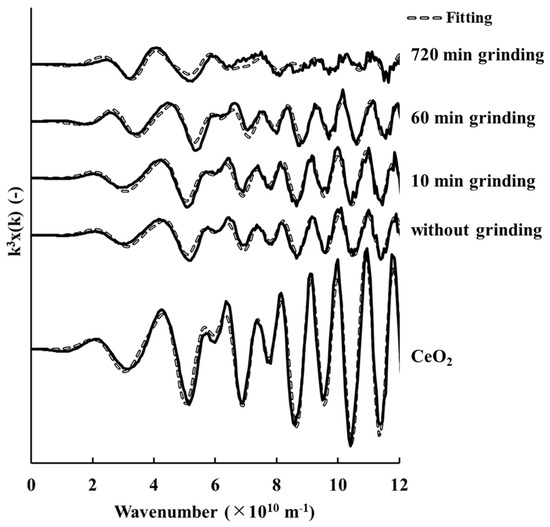
Figure 2.
k3-weighted cerium K-edge extended X-ray absorption fine structure spectra of tetravalent cerium oxide for samples with and without grinding.
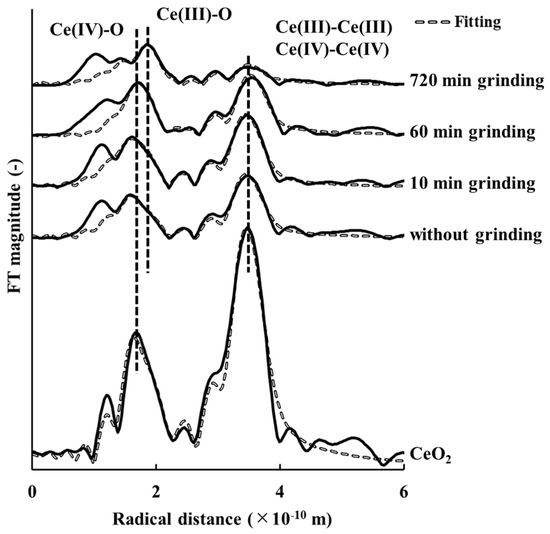
Figure 3.
Radial distribution functions of tetravalent cerium oxide for samples with and without grinding.
Table 6.
Cerium fitting results of radial distribution function for samples with and without grinding, assuming four kinds of cerium shells for tetravalent cerium oxide.
Figure 2 shows that the k3-weighted EXAFS spectra of the sample without grinding was similar to that of the sample ground for 10 min, but these differed from those of samples ground for 60 min and 720 min. This trend is also shown in the RDF (Figure 3). These results clearly showed that the structure of cerianite in the weathered residual rare earth ore started to change after 10 min of grinding.
The curve-fitting results in Table 6 show that the coordination numbers of Ce(IV)–O and Ce(IV)–Ce(IV) in the cerianite decreased as grinding time increased, while those of Ce(III)–O and Ce(III)–Ce(III) increased. From the above discussion, the results of the EXAFS analysis suggested that the structure of the ore changed from cerianite to Ce2O3 because of a mechanochemical reduction [2]. Cerianite has the fluorite structure (space group ()) [1] (Figure 4a). Skorodumova et al. [38] reported that the C-type structure of Ce2O3 (space group ()) was produced on completion of the reduction process [39,40] (Figure 4b). This structure (Figure 4b) can be constructed from eight unit cells of cerianite (Figure 4a) with 25% oxygen vacancies ordered in a particular way [38]. The structure change from cerianite to the C-type structure of Ce2O3 involves minimal reorganization of the skeleton arrangement of the cerium atoms [38]. This structural property should facilitate the excellent reversibility of the reduction–oxidation process.
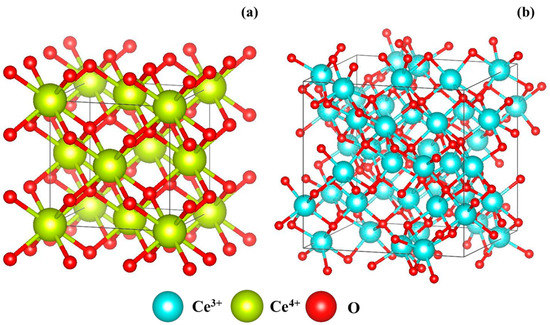
Figure 4.
Lattice unit cells for (a) tetravalent cerium oxide and (b) C-type structure of trivalent cerium [44].
The atomic distances of both Ce(IV)–O and Ce(III)–O in cerianite also decreased as grinding time increased, as shown in Table 6. This trend was similar to the case of Gd2O3-doped cerianite [13]: Ohashi et al. reported that when gadolinium was doped at 30% in cerianite, the Ce(IV)–O and Gd(III)–O atomic distances decreased by 0.032 × 10⁻¹⁰ m and 0.024 × 10⁻¹⁰ m, respectively [13]. Compared with this result, the decrease of atomic distance in the present system was large; thus, the decrease of atomic distances of Ce(IV)–O and Ce(III)–O in the cerianite represented significant structural changes.
The decreases of the Ce(IV)–O and Ce(III)–O atomic distances in the cerianite showed that oxygen vacancies occurred in the structure on grinding, and that oxygen ions surrounding these vacancies around both tri- and tetravalent cerium ions relaxed toward their adjacent vacancies [21]. Skorodumova et al. [38] reported that it required 4.4 × 10² kJ/mol to form an oxygen vacancy in pure cerianite, based on the full-potential linear muffin tin orbitals generalized gradient approximation (FP–LMTO–GGA) [41,42]. In our experimental system, it is suggested that this energy was mainly provided by the planetary ball milling. In addition, it is suggested that the distribution of oxygen vacancies in the stucture of cerianite is related to the valences and ionic radii of tri- and tetravalent cerium ions. In this system, the ionic radii of eight-coordinated tri- and tetravalent cerium are 1.143 × 10⁻¹⁰ m and 0.97 × 10⁻¹⁰ m, respectively [43]. These ionic radii are relatively similar, so oxygen vacancies are considered to be favored near trivalent cerium ions to ensure electrical neutrality. Indeed, Skorodumova et al. [38] reported that it required only 25 kJ/mol, which was the lowest energy among positions that could form an oxygen vacancy, to form an oxygen vacancy adjacent to trivalent cerium in pure cerianite.
Formation of a cluster composed of oxygen vacancies and trivalent cerium ions has been proposed by some researchers, using the cluster model for the structure of cerianite, which is specified by the number of oxygen vacancies and their configuration and those of cations around the vacancies [13,20,21]. According to the cluster model, two models expressing the local structures around oxygen vacancies are proposed, as shown in Figure 5: One oxygen vacancy in the structure of cerianite is introduced for every two trivalent cerium ions, as required by the electroneutrality condition. In the type A model, one unit cell of cerianite contains one trivalent cerium and one oxygen vacancy, while the other unit cell contains one trivalent cerium and no oxygen vacancy; in the type B model, one unit cell of cerianite contains two trivalent ceriums and one oxygen vacancy. If only type A were formed, the Ce(III)–O atomic distance in the cerianite would not be expected to decrease as the concentration of trivalent cerium in the ore increased with grinding time; if only type B were formed, a similar trend would occur. If both types A and B co-existed, and the proportion of type A decreased and that of type B increased with grinding, then the Ce(III)–O atomic distance in the cerianite would decrease as the concentration of trivalent cerium in the ore increased with grinding time. From the above discussion, it is suggested that oxygen vacancies occurred in the cerianite in the weathered residual rare earth ore and changed the structure from that of fluorite to one in which types A and B co-existed and the proportion of type B increased as grinding time by planetary ball milling increased.
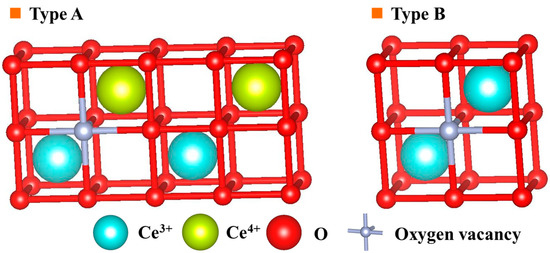
Figure 5.
Two models expressing the local structure around oxygen vacancies in tetravalent cerium oxide [44].
From the results of the XANES and EXAFS analysis, it is suggested that the process of oxygen vacancy formation was closely coupled with the quantum effect of localization–delocalization of the 4f electron of cerium. Oxygen in cerianite has two extra electrons in the p band, provided by tetravalent cerium. When an oxygen vacancy is produced in cerianite, it is suggested that these two electrons are left behind and occupy the lowest possible empty state, which is the f band of cerium. Thus, the tetravalent cerium in the cerianite is reduced to trivalent cerium (Figure 6).
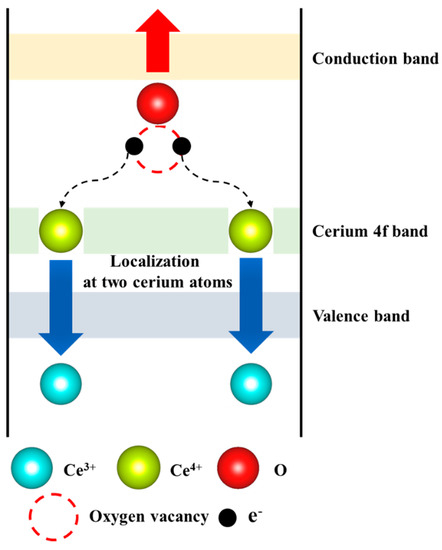
Figure 6.
Schematic process of oxygen vacancy formation in tetravalent cerium oxide.
4. Conclusions
The objective of this study was to clarify the structural change of cerianite in weathered residual rare earth ore during mechanochemical reduction. Results of the XANES and EXAFS analysis revealed that the structural change involved oxygen vacancies produced in the cerianite. The process of the oxygen vacancy formation was closely coupled with the quantum effect of localization–delocalization of the 4f electron of cerium. The EXAFS analysis showed that the atomic distances of both Ce(III)–O and Ce(IV)–O decreased, which indicated that the cerianite changed from the fluorite structure to one in which types A and B co-existed and the proportion of type B increased as grinding time by planetary ball milling increased.
Author Contributions
Conceptualization, C.T., W.L. and T.K.; Formal analysis, T.K.; Investigation, T.K. and Y.T.; Resources, Y.T.; Writing—original draft preparation, T.K.; Writing—review and editing, Y.T., W.L. and C.T.; Supervision, C.T.; Project administration, C.T.; Funding acquisition, C.T.
Funding
This study was partially supported by the Hosokawa Powder Technology Foundation, under Grant Nos. 18504 and 2018, and the Joint Research Center for Environmentally Conscious Technologies in Materials Science (Project No. 30006) at ZAIKEN, Waseda University.
Acknowledgments
The synchrotron radiation experiments were performed using a BL5S1 beamline courtesy of the Aichi Synchrotron Radiation Center, Aichi Science & Technology Foundation, Aichi, Japan (Proposal No. 201801021), and BL14B2 beamline of SPring-8, with approval of the Japan Synchrotron Radiation Research Institute (Proposal No. 2018A1696). Part of this work was performed as a component of the activities of the Research Institute of the Sustainable Future Society, Waseda Research Institute for Science and Engineering, Waseda University, and the Joint Usage/Research Center on Joining and Welding, Osaka University. We thank Kathryn Sole from Edanz Group (www.edanzediting.com/ac) for editing a draft of this manuscript.
Conflicts of Interest
The authors declare no conflict of interest.
References
- Trovarelli, A.; Fornasiero, P. Catalysis by Ceria and Related Materials, 2nd ed.; Imperial College Press: London, UK, 2013; pp. 1–881. [Google Scholar]
- Kato, T.; Granata, G.; Tsunazawa, Y.; Takagi, T.; Tokoro, C. Mechanism and kinetics of enhancement of cerium dissolution from weathered residual rare earth ore by planetary ball milling. Miner. Eng. 2019, 134, 365–371. [Google Scholar] [CrossRef]
- Bochevslaya, Y.G.; Abisheva, Z.S.; Karshigina, Z.B.; Sargelova, E.A.; Kvyatkovskaya, M.N.; Akchulakova, S.T. Effect of the temperature conditions of sulfation process on extraction of rare earth metals from refractory ore. Metallurgist 2018, 62, 574–586. [Google Scholar] [CrossRef]
- Peretyazhko, I.S.; Savina, E.A.; Karmanov, N.S.; Dmitrieva, A.S. Immiscibility of fluoride–calcium and silicate melts in trachyrhyolitic magma: Data on acidic volcanic rocks from the nyalga basin, central mongolia. Petrologiya 2018, 26, 400–425. [Google Scholar] [CrossRef]
- Kato, T.; Granata, G.; Tokoro, C. Evaluation of acids onto the light rare earth elements dissolution from weathered residual rare earth ore activated by mechanochemical treatment by grinding. J. Soc. Powder Technol. Jpn. 2019, 56, 174–180. [Google Scholar] [CrossRef]
- Yao, H.C.; Yao, Y.F.Y. Ceria in automotive exhaust catalysts: I. oxygen storage. J. Catal. 1984, 86, 254–265. [Google Scholar] [CrossRef]
- Diwell, A.F.; Rajaram, R.R.; Shaw, H.A.; Truex, T.J. The role of ceria in three-way catalysts. Stud. Surf. Sci. Catal. 1991, 71, 139–152. [Google Scholar]
- Harrison, B.; Diwell, A.F.; Hallett, C. Promoting platinum metals by ceria. Platin. Metals Rev. 1988, 32, 73–83. [Google Scholar]
- Zinkevich, M.; Djurovic, D.; Aldinger, F. Thermodynamic modelling of the cerium-oxygen system. Solid State Ionics 2006, 177, 989–1001. [Google Scholar] [CrossRef]
- Panlener, R.J.; Blumenthal, R.N.; Garnier, J.E. A thermodynamic study of nonstoichiometric cerium dioxide. J. Phys. Chem. Solids 1975, 36, 1213–1222. [Google Scholar] [CrossRef]
- Wang, D.Y.; Nowick, A.S. Dielectric relaxation from a network of charged defects in dilute CeO2:Y2O3 solid solutions. Solid State Ionics 1981, 5, 551–554. [Google Scholar] [CrossRef]
- Wang, D.Y.; Park, D.S.; Griffith, J.; Nowick, A.S. Oxygen-ion conductivity and defect interactions in yttria-doped ceria. Solid State Ionics 1981, 2, 95–105. [Google Scholar] [CrossRef]
- Ohashi, T.; Yamazaki, S.; Tokunaga, T.; Arita, Y.; Matsui, T.; Harami, T.; Kobayashi, K. EXAFS study of Ce1-xGdxO2-x/2. Solid State Ionics 1998, 113–115, 559–564. [Google Scholar] [CrossRef]
- Deguchi, H.; Yoshida, H.; Inagaki, T.; Horiuchi, M. EXAFS study of doped ceria using multiple data set fit. Solid State Ionics 2005, 176, 1817–1825. [Google Scholar] [CrossRef]
- Nagai, Y.; Yamamoto, T.; Tanaka, T.; Yoshida, S.; Nonaka, T.; Okamoto, T.; Suda, A.; Sugiura, M. X-ray absorption fine structure analysis of local structure of CeO2-ZrO2 mixed oxides with the same composition ratio (Ce/Zr = 1). Catal. Today 2002, 74, 225–234. [Google Scholar] [CrossRef]
- Kaspar, J.; Fornasiero, P.; Balducci, G.; Monte, R.D.; Hickey, N.; Sergo, V. Effect of ZrO2 content on textural and structural properties of CeO2-ZrO2 solid solutions made by citrate complexation route. Inorg. Chim. Acta 2003, 349, 217–226. [Google Scholar] [CrossRef]
- Bulfin, B.; Lowe, A.J.; Keogh, K.A.; Murphy, B.E.; Lubben, O.; Krasnikov, S.A.; Shvets, I.V. Analytical model of CeO2 oxidation and reduction. J. Phys. Chem. C 2013, 117, 24129–24137. [Google Scholar] [CrossRef]
- Meriani, S.; Spinolo, G. Powder data for metastable ZrxCe1-xO2 (x = 0.84 to 0.40) solid solutions with tetragonal symmetry. Powder Diffr. 1987, 2, 255–256. [Google Scholar] [CrossRef]
- Reidy, R.F.; Simkovich, G. Electrical conductivity and point defect behavior in ceria-stabilized zirconia. Solid State Ionics 1993, 62, 85–97. [Google Scholar] [CrossRef]
- Balducci, G.; Islam, M.S.; Kaspar, J.; Fornasiero, P.; Graziani, M. Bulk reduction and oxygen migration in the ceria-based oxides. Chem. Mater. 2000, 12, 677–681. [Google Scholar] [CrossRef]
- Badlducci, G.; Kaspar, J.; Fornasiero, P.; Graziani, M.; Islam, M.S.; Gale, J.D. Computer simulations studies of bulk reduction and oxygen migration in CeO2-ZrO2 solid solutions. J. Phys. Chem. 1997, 101, 1750–1753. [Google Scholar] [CrossRef]
- Pourghahramani, P.; Akhgar, B.N. Characterization of structural changes of mechanically activated natural pyrite using XRD line profile analysis. Int. J. Miner. Process. 2015, 134, 23–28. [Google Scholar] [CrossRef]
- Kahrizsangi, R.E.; Abbasi, M.H.; Saidi, A. Mechanochemical effects on the molybdenite roasting kinetics. Chem. Eng. J. 2006, 121, 65–71. [Google Scholar]
- Bloise, A.; Catalano, M.; Gualtieri, A.F. Effect of grinding on chrysotile, amosite and crocidolite and implications for thermal treatment. Minerals 2018, 8, 135. [Google Scholar] [CrossRef]
- Bloise, A.; Kusiorowski, R.; Gualtieri, A.F. The effect on grinding on tremolite asbestos and anthophyllite asbestos. Minerals 2018, 8, 274. [Google Scholar] [CrossRef]
- Granata, G.; Takahashi, K.; Kato, T.; Tokoro, C. Mechanochemical activation of chalcopyrite: Relationship between activation mechanism and leaching enhancement. Miner. Eng. 2019, 131, 280–285. [Google Scholar] [CrossRef]
- Minagawa, M.; Hisatomi, S.; Kato, T.; Granata, G.; Tokoro, C. Enhancement of copper dissolution by mechanochemical activation of copper ores: Correlation between leaching experiments and DEM simulations. Adv. Powder Technol. 2018, 29, 471–478. [Google Scholar] [CrossRef]
- Mitani, Y.; Tsunazawa, Y.; Okura, T.; Tokoro, C. Enhancement of copper leaching from chalcopyrite using wet-type ball mill. J. Soc. Powder Technol. Jpn. 2015, 52, 723–729. [Google Scholar] [CrossRef][Green Version]
- Nakada, R.; Tanaka, M.; Tanimizu, M.; Takahashi, Y. Aqueous speciation is likely to control the stable isotopic fractionation of cerium at varying pH. Geochim. Cosmochim. Acta 2017, 218, 273–290. [Google Scholar] [CrossRef]
- Okamoto, Y.; Osugi, T.; Akabori, M.; Kobayashi, T.; Shiwaku, H. Chemical state analysis of high-temperature molten slag components by using high-energy XAFS. J. Mol. Liquids 2017, 232, 285–289. [Google Scholar] [CrossRef]
- Kumar, S.; Gautam, S.; Song, T.K.; Chae, K.H.; Jang, K.W.; Kim, S.S. Electronic structure study of Co doped CeO2 nanoparticles using x-ray absorption fine structure spectroscopy. J. Alloys Compd. 2014, 611, 329–334. [Google Scholar] [CrossRef]
- Rygel, J.L.; Chen, Y.; Pantano, C.G.; Shibata, T.; Du, J.; Kokou, L.; Woodman, R.; Belcher, J. Local structure of cerium in aluminophosphate and silicophosphate glasses. J. Am. Ceram. Soc. 2011, 94, 2442–2451. [Google Scholar] [CrossRef]
- Rehr, J.J.; Albers, R.C.; Zabinsky, S.I. High-order multiple-scattering calculations of x-ray-absorption fine structure. Phys. Rev. Lett. 1992, 69, 3399–3400. [Google Scholar] [CrossRef]
- Rehr, J.J. Recent developments in multiple-scattering calculations of XAFS and XANES. Jpn. J. Appl. Phys. 1993, 32, 8–12. [Google Scholar] [CrossRef]
- Ravel, B.; Newville, M. Athena, artemis, hephaestus: Data analysis for x-ray absorption spectroscopy using IFEFFIT. J. Synchrotron Radiat. 2005, 12, 537–541. [Google Scholar] [CrossRef] [PubMed]
- Bianconi, A.; Marcelli, A.; Dexpert, H.; Karnatak, R.; Kotani, A.; Jo, T. Specific intermediate-valence state of insulating 4f compounds detected by L3 x-ray absorption. Phys. Rev. B 1987, 35, 806–812. [Google Scholar] [CrossRef]
- Kaindl, G.; Schmiester, G.; Sampathkumaran, E.V. Pressure-induced changes in LIII x-ray-absorption near-edge structure of CeO2 and CeF4: Relevance to 4f-electronic structure. Phys. Rev. B 1988, 38, 10174–10177. [Google Scholar] [CrossRef]
- Skorodumova, N.V.; Simak, S.L.; Lundqvist, B.L.; Abrikosov, L.A.; Johansson, B. Quantum origin of the oxygen storage capability of ceria. Phys. Rev. Lett. 2002, 89, 166601/1–166601/4. [Google Scholar] [CrossRef]
- Silva, J.L.F.D. Stability of the Ce2O3 phases: A DFT + U investigation. Phys. Rev. B 2007, 76, 193108-1–193108-4. [Google Scholar] [CrossRef]
- Bartos, A.; Lieb, K.P.; Uhrmacher, M.; Wiarda, D. Refinement of atomic positions in bixbyite oxide using perturbed angular correlation spectroscopy. Acta Crystallogr. Sect. B 1993, 49, 165–169. [Google Scholar] [CrossRef]
- Wills, J.M.; Johansson, B.; Eriksson, O. Full-Potential LMTO Total Energy and Force Calculations, 1st ed.; Springer: Berlin, Germany, 2000; pp. 1–148. [Google Scholar]
- Perdew, J.P.; Chevary, J.A.; Vosko, S.H.; Jackson, K.A.; Pederson, M.R.; Singh, D.J.; Fiolhais, C. Atoms, molecule, solids, and surfaces: Applications of the generalized gradient approximation for exchange and correlation. Phys. Rev. B 1993, 46, 6671–6687. [Google Scholar] [CrossRef]
- Shannon, R.D. Revised effective ionic radii and systematic studies of interatomic distances in halides and chalcogenides. Acta Crystallogr. 1976, A32, 751–767. [Google Scholar] [CrossRef]
- Momma, K.; Izumi, F. VESTA 3 for three-dimensional visualization of crystal, volumetric and morphology data. J. Appl. Crystallogr. 2011, 44, 1272–1276. [Google Scholar] [CrossRef]
© 2019 by the authors. Licensee MDPI, Basel, Switzerland. This article is an open access article distributed under the terms and conditions of the Creative Commons Attribution (CC BY) license (http://creativecommons.org/licenses/by/4.0/).