Mineralogical Sequence of Self-Healing Products in Cracked Marine Concrete


1
Department of Structural Engineering, Norwegian University of Science and Technology (NTNU), 7491 Trondheim, Norway
2
SINTEF Building and Infrastructure, Architecture Materials and Structures, 7034 Trondheim, Norway
3
Danish Technological Institute (DTI), Concrete, 2630 Taastrup, Denmark
*
Author to whom correspondence should be addressed.
Minerals 2019, 9(5), 284; https://doi.org/10.3390/min9050284
Submission received: 28 March 2019
/
Revised: 29 April 2019
/
Accepted: 7 May 2019
/
Published: 10 May 2019
(This article belongs to the Special Issue Petrography of Construction Materials: Compositional, Mineralogical and Textural Features)
Abstract
:Self-healing of cracked concrete beams after 25 years of marine exposure was investigated. The extent of self-healing and the chemical and mineralogical composition of the self-healing products were characterized, and mechanisms proposed. There was no effect of varying silica fume (4%, 12%) and fly ash content (0%, 20%) on the mineralogy and chemistry of the self-healing products and the extent of self-healing. Crack widths smaller than 0.2 mm appeared closed. With increasing crack depth, a sequence of changing mineralogy of self-healing products was found. In the outer part of the crack (0–5 mm depth from the exterior surface) only calcite was precipitated followed by brucite layers from 5–30 mm depth. The brucite was occasionally intermixed with calcite. At crack depths >30 mm only ettringite was observed. It is hypothesized that the mineralogical sequence observed with increasing crack depth occurs due to an increasing pH of the solution inside the crack with increased crack depth. Self-healing of cracks in marine exposed concrete is proposed to happen through precipitation of ions from seawater partly in reaction with ions from the cement paste in the outer part of the crack and through dissolution and reprecipitation of ettringite at larger crack depths.
1. Introduction
The formation of cracks due to mechanical stresses and volume deformation is inevitable in concrete structures. Open cracks may have an impact on the durability and serviceability of concrete structures. Cracks facilitate the ingress of aggressive substances like chlorides, and laboratory experiments showed that the time to initiate steel corrosion in reinforced concrete may be reduced [1,2]. However, the impact of cracks on the long-term corrosion of steel in reinforced concrete (propagation) is still an issue of debate [3,4,5].
During long-term exposure, self-healing of cracks in concrete might limit the ingress of aggressive substances. Self-healing mechanisms in cementitious materials are covered by several review articles [6,7,8,9,10]. In field exposed concrete structures, autogenic self-healing is typically the only relevant mechanism. Autogenic self-healing is defined by RILEM as a “recovery process that uses materials components that could otherwise also be present when not specifically designed for self-healing” [6]. Mechanisms of autogenic self-healing can be of mechanical, physical or chemical nature [8,10,11,12]. Mechanical and physical causes like clogging of cracks by e.g., particles broken off from fractured surfaces seem to play a minor role in stopping transport through cracks [11,12,13]. Chemical causes seem to be dominant and there is consent in literature that the presence of water is necessary for the self-healing process to occur [3,8,9]. One possible chemical self-healing mechanism in concrete is the further hydration of unreacted cement and supplementary cementitious materials (SCMs). The formation of calcium silicate hydrates (C-S-H), portlandite (Ca(OH)2) and ettringite (Ca6Al2(SO4)3(OH)12·12H2O) were observed in cracks after three months of water curing [14]. Other chemical mechanisms are dissolution and reprecipitation of ions from the exposure solution and the cement paste. In experiments conducted with fresh water (tap water), the precipitation of calcite (CaCO3) on crack faces appears to be the dominant self-healing mechanism [13]. Precipitation of brucite (Mg(OH)2) and ettringite was observed in marine exposed concrete and explained to be due to the presence of magnesium and sulphate ions in seawater [15,16,17].
From literature, there is no agreement on a maximum crack width that can be completely self-healed. Mohamed et al. [17] found cracks of 0.5 mm crack width to be healed after 15 years in marine exposure. Most short-term laboratory studies of concrete or mortar samples exposed to synthetic seawater (produced from deionized water and laboratory grade chemicals representing ions typically present in seawater) indicate that cracks smaller than 0.2 mm are more likely to be completely self-healed [13,18,19,20]. There are indications that there might be a difference in the self-healing ability of cracks in concrete when exposed to seawater and fresh water. In a cracked Portland cement concrete exposed to seawater for 56 days, cracks of up to 0.6 mm have been observed to be completely self-healed [21]. In the same type of specimens exposed to fresh water, only cracks of up to 0.2 mm showed complete self-healing during 56 days [21].
It is a common practice today to replace parts of the Portland clinker by supplementary cementitious materials. Today, the most commonly used cement in Norway contains about 18% fly ash. Concrete used in projects by the Norwegian Public Roads Administration (NPRA), mostly contains 4–8% silica fume added to this standard fly ash cement. There is only limited information available on the impact of binder type on the self-healing ability of cracks in concrete. Van Tittelboom et al. (2012) suggested that the consumption of portlandite in binders with high amounts of supplementary cementitious materials might reduce the potential for later calcium carbonate precipitation on crack faces [22]. Palin et al. (2015) investigated the self-healing ability of Portland cement and slag-cement mortar [21]. Mortar cubes were cast with a CEM I and a CEM III (slag cement) and cured for 28 days before cracking by a displacement load producing crack widths up to 1 mm. After cracking, the cubes were submerged in fresh water and synthetic seawater for 56 and 140 days. Crack healing was visually assessed with a stereomicroscope and as strength recovery. In seawater, mortars containing only the Portland cement (CEM I) showed greater self-healing capacity (crack healing up to 0.6 mm) compared to the CEM III mortars (crack healing up to 0.1 mm). In fresh water on the other hand, mortars containing slag showed greater self-healing capacity, healing cracks up to 0.4 mm while the CEM I mortar only healed cracks up to 0.2 mm. Zhou et al. (2011) investigated the self-healing ability of slag and fly ash containing concrete based on strength measurements and scanning electron microscopy (SEM) [23]. The authors claim that the self-healing ability was strongest when 30–40% of cement was replaced with slag or fly ash. Unfortunately, there is almost no information given on the experimental set up (exposure, crack width, age, etc.). Increased self-healing ability was also observed in mortars containing high amounts of calcareous fly ash (30–60% replacement of cement) [24]. Edvardsen (1999) used water permeability tests to investigate the self-healing ability of concrete samples in fresh water [13]. Several parameters were tested including cement types (Portland cement and slag cement) and the addition of limestone or fly ash. Investigated crack widths varied from 0.1 to 0.3 mm. Tension cracked concrete samples were exposed to water flow (fresh water) for up to 20 weeks. The results showed that the precipitation of calcium carbonate was the main cause of autogenous self-healing in all samples and that the type of cement used had no influence on the extent of self-healing [13].
It is well known, that cracks have the ability to self-heal. However, there is only little long-term information available on the mechanisms and the possible impact of different binders on self-healing. This paper aims to increase the understanding of the long-term impact of marine exposure and binder type on the mechanisms of autogenous self-healing of cracks in concrete. For this, concretes with relevant binder types and crack widths as found in many marine exposed structures in Norway were investigated. The self-healing ability of cracked concrete with Portland cement and 4% silica fume (PC-4SF) is compared to concrete containing 20% fly ash and 4% silica fume (PC-4SF20FA) and a concrete with 12% silica fume (PC-12SF) after 25 years exposure to tidal water of the north Atlantic. The mineralogy and chemistry of the self-healing products and the extent of self-healing in dependence of binder type were investigated with optical polarizing microscopy, scanning electron microscopy (SEM), X-ray diffraction (XRD) and µ-X-ray fluorescence (µ-XRF) measurements.
2. Materials
2.1. Concrete Beams
In this paper the self-healing ability of cracks in three concrete beams of three different binders was investigated. The concrete beams were mounted from a ferry quay in Sandnessjøen (Northern Norway) and exposed to tidal water for 25 years (Figure 1). The concrete beams had a dimension of 3000 × 300 × 150 mm. Ribbed reinforcement bars with 16 mm diameter were used. The concrete cover was 25 mm. The mean water level was about at the middle of the beams (1.5 m from the top). To induce cracks and maintain them open, two beams were mounted together in 3-Point bending [25]. The average temperature at the field station during the coldest and warmest month is −2 and +16 °C. The monthly precipitation was varying between 100–267 mm [26]. Typical values for the composition of the seawater in the Atlantic ocean and Norwegian fjords are reported in [27]. Right after removing the beams from the field station the surface of the beams was cleaned from shells and algae. The concrete composition and chemical composition of the binders is given in Table 1 and Table 2.
2.2. Concrete Cores
Concrete cores were drilled from the middle of the concrete beams (tidal zone) above the largest cracks to investigate the impact of binder type on the mineralogy and chemistry of possible self-healing products. Information about the position and the surface crack width of the cores is given in Table 3. The surface crack width was measured with a crack width ruler (±0.05 mm) on the surface of the concrete beams. Concrete cores were drilled with a water-cooled concrete drill with minimal use of water. The core dimensions were 75 mm diameter and 150 mm length. After drilling, the surface of the concrete cores was tapped clean and dry with a moist cloth and the cores were packed in several layers of plastic and stored at 5 ± 1 °C. All cores were cut in the longitudinal direction, perpendicular to the crack for further microstructural investigations. A white precipitate was visually observed in all cracks and examined with the methods described in Section 3.
3. Methods
Table 4 gives an overview of the experimental methods used to investigate the phase assemblage of the hydrated binders, the chemical and mineralogical composition of self-healing products and the extent of self-healing of the cracks.
3.1. Phase Assemblage of Binders
3.1.1. Mass Balance Calculations
Mass balance calculations were performed according to calculations based on [29] to predict the phase assemblage in the hydrated binders. Calculations were performed assuming a degree of hydration of 70% for the CEM I—Portland cement (PC), 80% for silica fume (SF) and 50% for the fly ash (FA) and a w/b ratio of 0.4. Different degrees of hydration were tested for the calculation and the system appeared to be very robust with no considerable changes when the degree of hydration was changed.
3.1.2. Scanning Electron Microscopy
Scanning electron microscopy energy dispersive (SEM-EDX) point analysis of the hydrated paste phases was performed (a) in the paste close to the crack (<0.1 mm from the crack) at three different depths from the exterior surface and (b) at two positions in the bulk paste, both 10–15 mm from the crack and about 20 mm from the exterior surface. Thirty points were taken at each of the paste positions close to the crack. The positions at different crack depths were selected based on differences in the phases observed in the cracks. Sixty points were taken at each of the two paste positions away from the cracks (bulk). An illustration of the positions for the SEM-EDX point analysis is given in Figure 2.
SEM-EDX analysis was performed using a Quanta 400 from FEI. For analysis, the thin sections prepared for optical polarizing microscopy were used (see Section 3.2.3). An accelerating voltage of 20 KeV, spot size 5 and a working distance of around 10 mm were used during the analysis, and the data were matrix corrected (PROZA). The analyses were performed using carbon-coated polished sections (cut off piece from thin sectioning) in high vacuum mode.
3.2. Mineralogy and Chemistry of Self-Healing Products
3.2.1. Micro X-ray Fluorescence Elemental Mapping
The flat surface of the cut half concrete cores was used for elemental mappings by the micro X-ray fluorescence (µ-XRF) to characterize the elemental distribution in the analyzed concrete cores with different binders. Additionally, point analysis was performed in selected areas of self-healing products. µ-XRF measurements were performed with a M4 Tornado from Bruker equipped with a silver X-Ray source and two silicon drift detectors for fast data collection. Point analysis were performed at 50 kV accelerating voltage, 200 μA and an acquisition time of 30 s. The results are reported in atomic %. Qualitative mappings were performed at 50 kV accelerating voltage and 600 μA. The distance between each pixel was 80 µm and mappings were collected with an acquisition time of 1 ms/pixel. The spot size of the focused X-Ray beam was 20 µm. All measurements were performed under vacuum (20 mbar). The counts are not calibrated, and each map should only be assessed individually.
3.2.2. Powder X-ray Diffraction
Powder X-ray diffraction (XRD) measurements were performed on self-healing products using a Bruker D8 A25 DaVinci diffractometer equipped with copper K-alpha (Cu Kα) radiation and a LynxEye detector. The diffractometer was set in Bragg–Brentano geometry operating with a step size of 0.013 °/step. Measurements were taken from 5–50 °2θ. Self-healing products were scraped with a plastic spatula from the crack face and ground to fine powder with a hand mortar. The powder was prepared on a silicon single crystal sample holder, cut in a special way to not show any reflections by themselves. The surface of sample holder was smeared with wax and the sample was spread carefully on the sample holder. The wax helps to keep the orientation of the sample random.
3.2.3. Optical Polarizing Microscopy
Optical polarizing microscopic analysis of self-healing products in the cracks of the investigated concrete cores was carried out according to ASTM C856 “Standard Practice for Petrographic Examination of Hardened Concrete”. The microscopic examination was performed on fluorescent impregnated thin sections of the outer 45 mm of the concrete, including the exterior surface and the crack. The thin sections were made by vacuum impregnating a slice of the sample with an epoxy resin containing a fluorescent dye. Subsequently, the impregnated slice was mounted on a glass plate, and ground to a thickness of 20 μm. Finally, the section was covered by a cover glass. The thin section was then examined in an optical polarizing microscope using transmitted light, crossed polarized light, and blue transmitted light with a yellow blocking filter (fluorescent mode).
The vacuum impregnation of the sample with epoxy causes all voids and cavities in the sample to be filled with fluorescent epoxy. By transmitting fluorescent light through the thin section in the microscope, the fluorescent epoxy in the various porosities emits yellow light that makes voids, cavities and cracks easy to identify.
3.2.4. Scanning Electron Microscopy
Scanning electron microscopy energy dispersive (SEM-EDX) analysis of self-healing products in the cracks and the paste close and away from the crack was performed using a Quanta 400 from FEI with the same working conditions as described in Section 3.1.2. The chemistry of the self-healing products inside the crack was assessed by line scans covering the whole crack depth, performed at different crack depth.
3.3. Extent of Self-Healing
The extent of self-healing was studied visually on the epoxy impregnated and polished surfaces of the concrete cores. Pictures of the cracks were taken with a high resolution under the optical polarizing microscope and the crack width was measured at different crack depth with a line drawing tool in the software Paint. The extent of self-healing was divided into two categories; ξ partly self-healed, ☐ no self-healing (open crack).
4. Results
4.1. Phase Assemblage of the Hydrated Binders
Figure 3 shows the results of the EDX point analysis of the bulk cement paste (15–20 mm from the crack face and 20 mm from the exterior surface) in the three different concretes. It can be seen that the hydrated phases of PC-4SF and PC-12SF are rather similar. Both binders contain only silica fume, but in different amounts, and the hydration products observed after 25 years hydration and exposure to marine environment are mainly C-S-H and CH. Additionally, AFm phases (carbo-aluminate, sulpho-aluminates, Friedel’s salt) and Aft phases (ettringite) were detected. It seems that PC-12SF formed more C-S-H phases and less CH compared to PC-4SF. In PC-4SF20FA little or no CH was detected but more AFm and Aft phases compared to the others. In none of the pastes gypsum or thaumasite was detected. The EDX point analysis of the cement paste close to the cracks at different crack depth did not differ significantly from the composition of the paste away from the crack and is therefore not shown here. The average composition of the paste close to the crack at different crack depth is compared to the bulk paste composition in Table 5. Minor differences in the composition were detected close to the crack with increasing crack depth from the exterior surface and between points near and away from the crack (bulk). In PC-4SF, the average magnesium (Mg) and calcium (Ca) content was increased at 5 mm depth close to the crack, while the average sulphur (S) and chloride (Cl) content was decreased compared to the paste at larger crack depth or the bulk. The Cl content reached a maximum at a depth of about 20–25 mm in the bulk, while the S content reached a maximum at a depth of about 30 mm. In PC-4SF20FA, a slightly increased Al content was measured close to the crack at a depth of 5 mm from the exterior surface. In PC-12SF, a slightly increased Cl content was measured close to the crack at a depth of 5 mm from the exterior surface.
The results of mass balance calculations are shown in Table 6. Theoretically, the amount of C-S-H phases formed should increase in the order PC-4SF < PC-4SF20FA < PC-12SF. The highest amount of AFm should form in PC-4SF20FA. With regard to the assumptions made, there should be only little or no portlandite left in PC-4SF20FA and PC-12SF. This is in agreement with the EDX paste analysis shown in Figure 3.
4.2. Extent of Self-Healing
Table 7 shows the results of the extent of self-healing at different crack depth, and the maximum crack width where complete self-healing was observed. The extent of self-healing was divided into two categories; ◣ partly self-healed, ☐ no self-healing (open crack). Most parts were partly self-healed with smaller areas where the crack was completely closed (wmax_s). Explanations of the different categories are given in Figure 4.
In cores PC-4SF and PC-12SF the first 5 mm of the crack were completely open and no precipitation of phases on the crack faces was observed. Partly self-healed areas represent areas were precipitation of phases was observed on the crack faces but in general no crack closing. There were no areas where complete self-healing was observed over a longer distance (>3 mm in length). However, bridging of the cracks by self-healing products was observed occasionally. The largest crack width observed to be completely self-healed was 0.21 mm in core PC-SF. In general, the crack width was < 0.2 mm in areas that were completely closed.
4.3. Mineralogy and Chemistry of Self-Healing Products
4.3.1. Micro X-ray Fluorescence
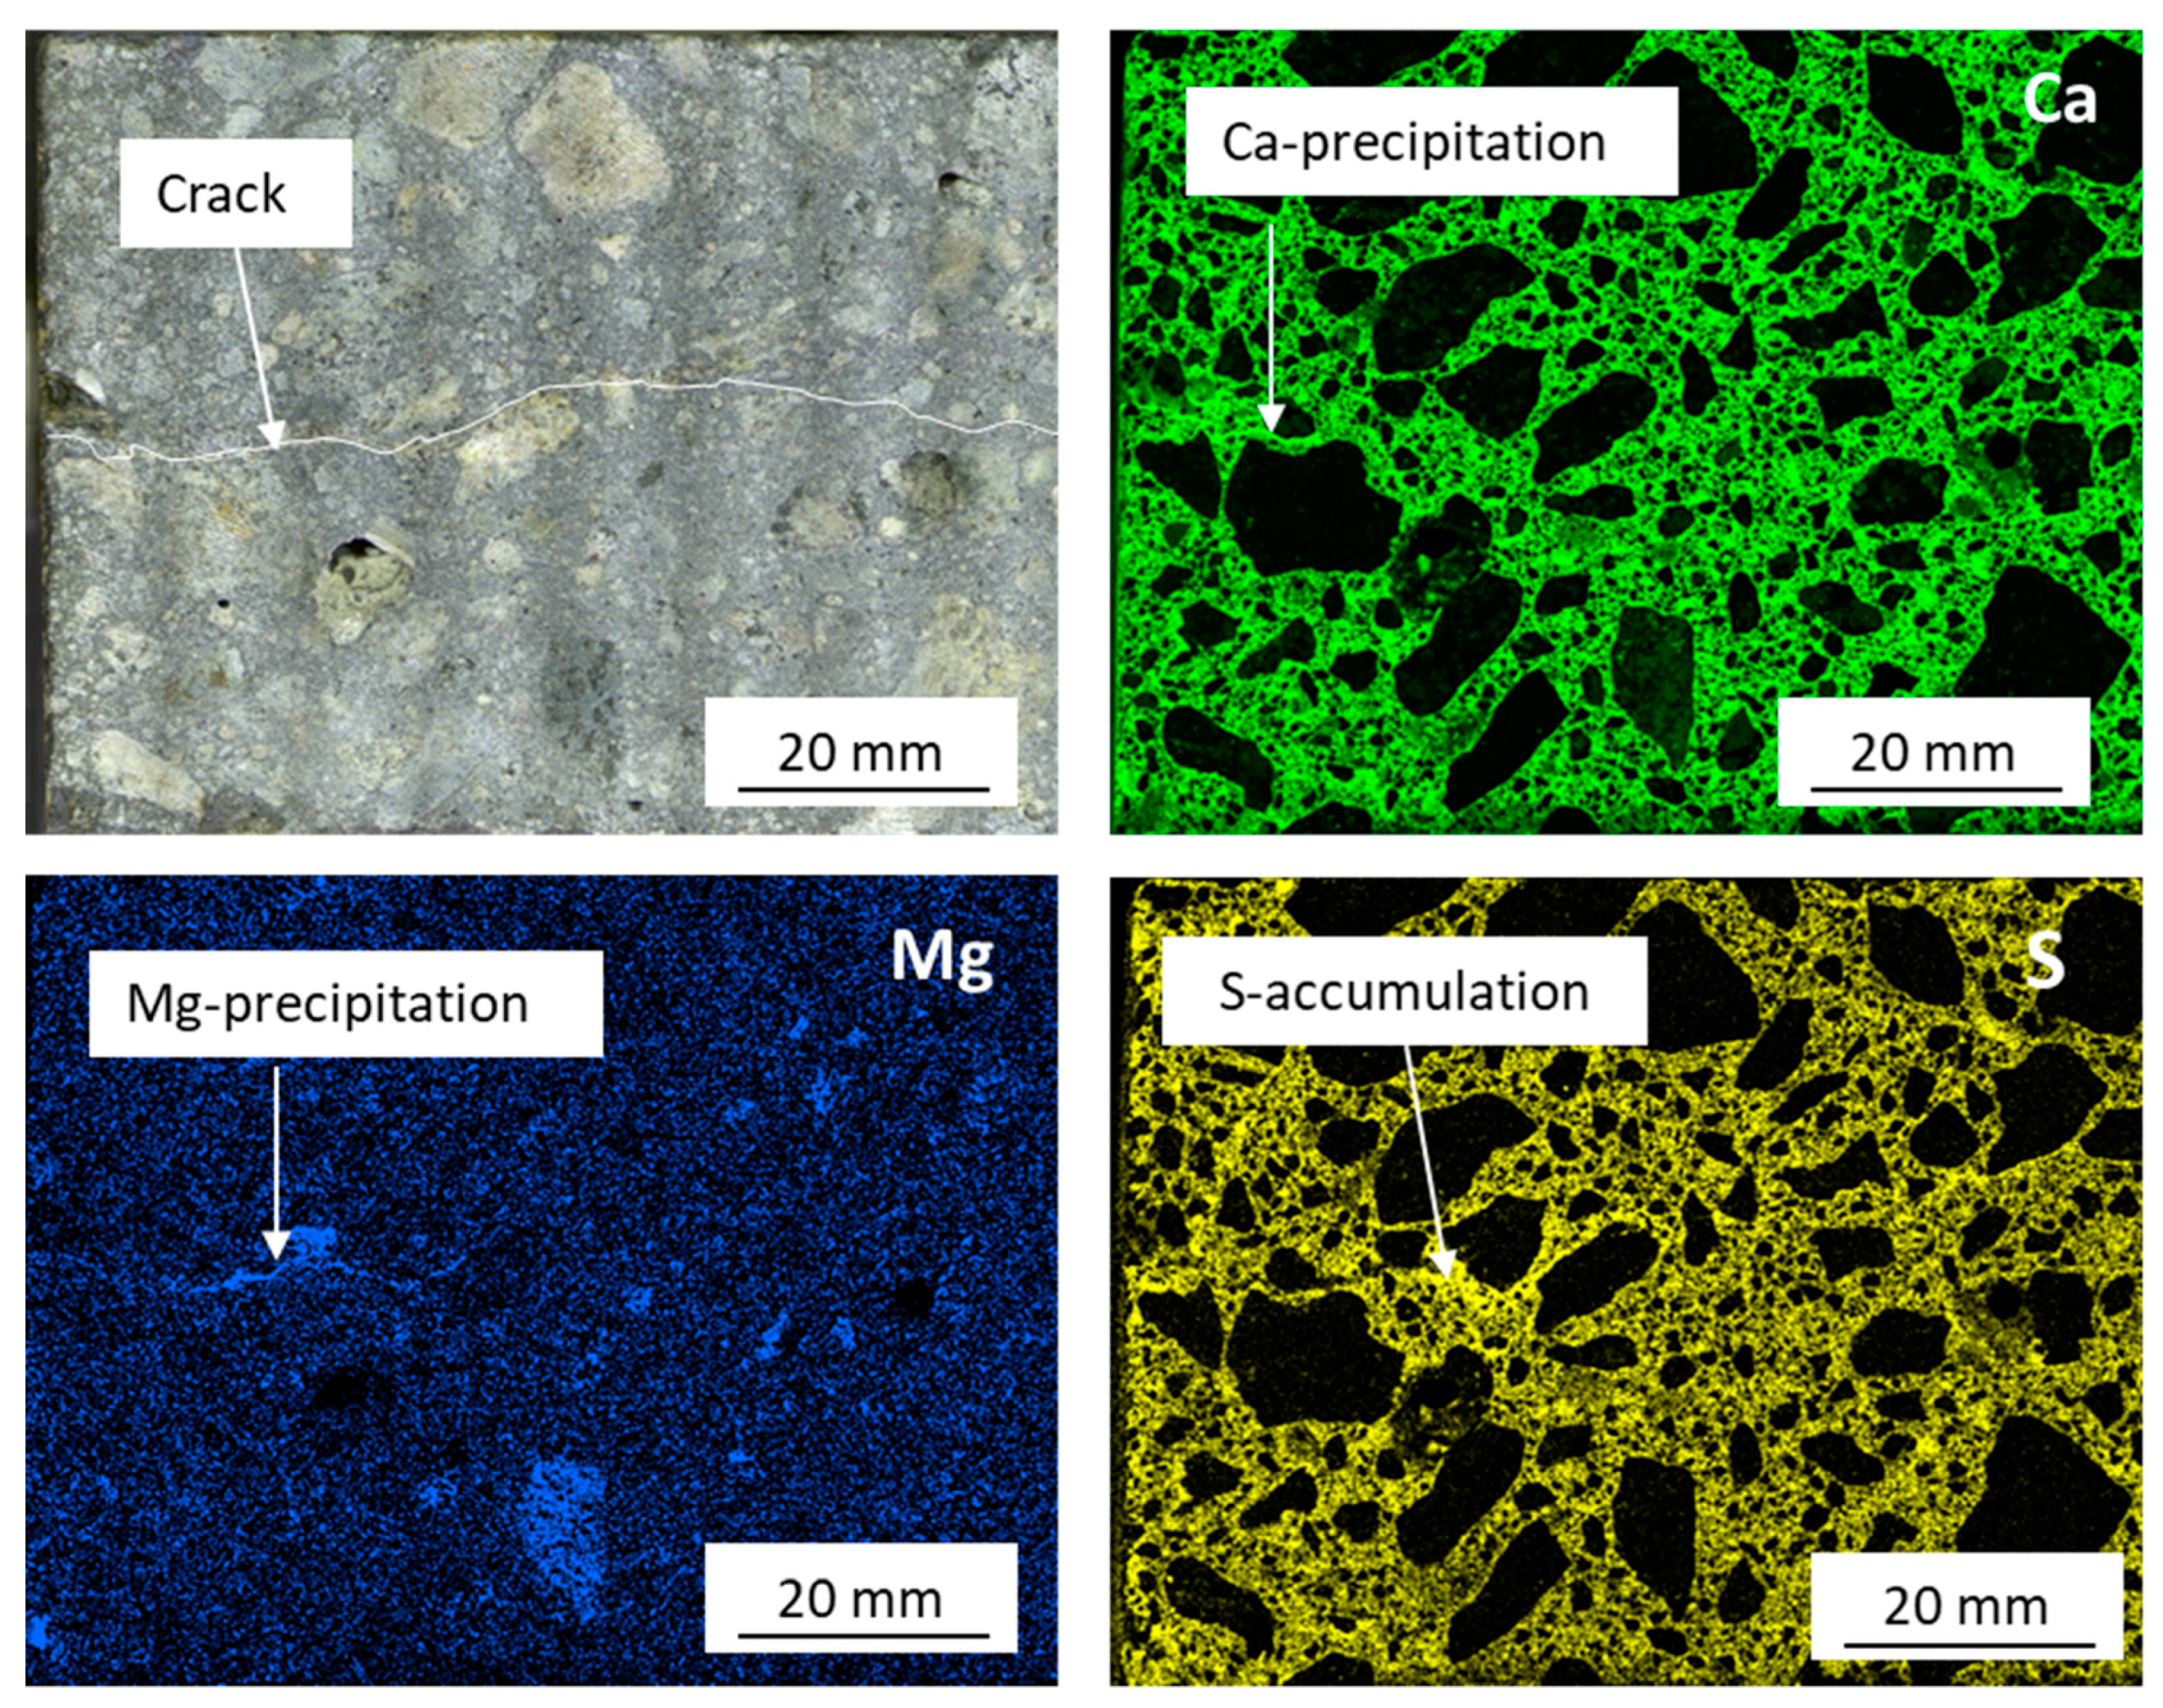
An overview of the elemental distribution in the bulk of the concrete and the cracks was obtained by the micro X-ray fluorescence (µ-XRF) mapping of the whole length of the concrete cores. Parts of the elemental map from PC-4SF20FA including Ca, Mg and S are shown in Figure 5 as a representative example for all concretes. In the Ca map, it is easy to make a distinction between paste and aggregate since the aggregate was poor in Ca (black areas). Within the first 20 mm, high intensities of Ca were observed inside the crack (white arrow). However, due to the high amount of Ca in the surrounding paste this is difficult to see. The Mg precipitation was found inside the crack until a depth of about 30 mm. The highest Mg intensities inside the crack were found at a crack depth between 10–30 mm. This is easier to spot due to the low amount of Mg in the surrounding paste. An accumulation of sulphate in the paste surrounding the crack could be observed in some areas at a depth between 25–40 mm. Figure 6 displays two close-up pictures of the crack in PC-4SF20FA showing the precipitation layer inside the crack. The EDX point analysis was performed inside the self-healing products (inside white lines indicated in Figure 6); the average composition of five points found at two crack depths is given in Table 8. The composition of the self-healing products was rich in Ca at a crack depth of 5 mm, and rich in Mg and Ca at a crack depth of 15 mm. The amount of Ca was reduced while the amount of Mg was increased with increased crack depth. The other cores showed a similar trend. The high standard deviation of the results can be explained by the rather low resolution of the µ-XRF and the relatively large spot size of the analyzing X-ray beam of 20 µm. Due to the relatively low resolution it is not possible to spot potential different phases within the layer of self-healing products. Due to the large spot size of the X-ray beam it cannot be guaranteed that only one single phase is analyzed. The results might be the average of different phases including parts of the concrete adjacent to the crack.
4.3.2. X-ray Diffraction
Parts of the original concrete beams were split along some cracks. Figure 7 (left) shows the crack face of a crack in the tidal zone of PC-4SF20FA. White colored self-healing products were observed on the crack face. The self-healing products were carefully removed with a spatula to collect enough powder for X-ray diffraction (XRD). The diffractogram of the powder collected from the self-healing products of concrete PC-4SF20FA is shown in Figure 7 (right). The diffractogram shows the average composition of the self-healing products at a crack depth between 0–50 mm as otherwise not enough powder would have been available. Brucite, portlandite, calcite and ettringite were detected in the collected powder. Due to the removal of the self-healing product by scratching with a spatula on the crack face, phases from the adjacent concrete might be intermixed with the self-healing products. This is indicated by the detection of quartz, feldspar and muscovite, which are typical, aggregate phases e.g., deriving from granite stone.
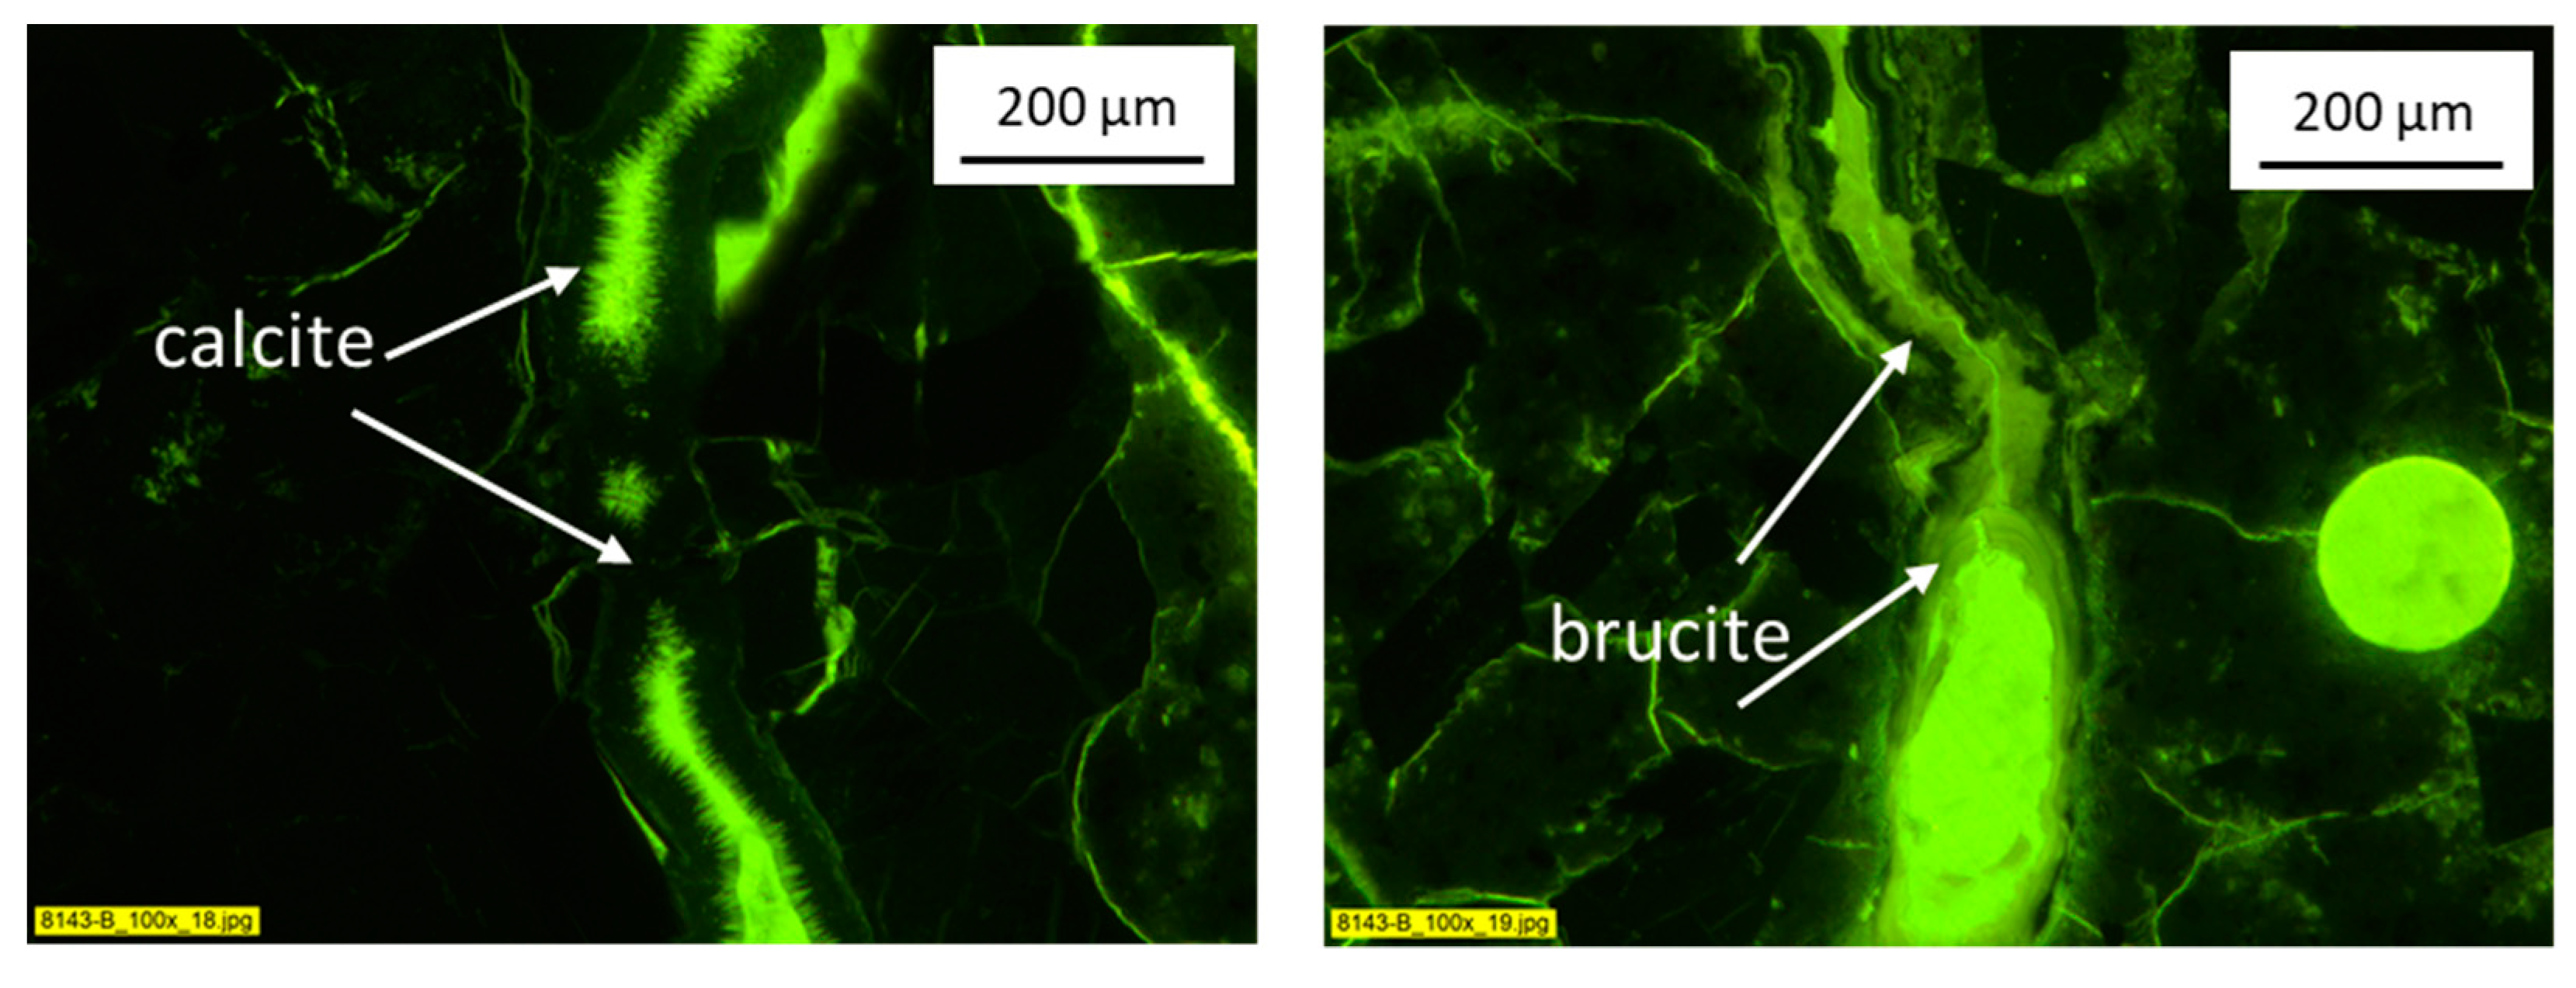
4.3.3. Optical Polarizing Microscopy
In general, it was observed that the mineralogy and the sequence of the self-healing products with crack depth were independent of the binder type. In all three concretes, calcite precipitation appeared along the crack faces in the outer part of the cracks. Further inwards brucite was dominant and even further inwards ettringite dominated. The phases observed at different depths inside the cracks of PC-4SF, PC-4SF20FA and PC-12SF are summarized in Table 9. The variation of mineralogy of self-healing products with increasing crack depth was determined visually under the optical polarizing microscope. The outer 0.5–2 mm of the cracks appeared open while calcite linings partly closing the crack were observed at crack depths between 0.5–30 mm. Brucite linings on the crack faces were found at crack depth between about 5–30 mm, while a brucite gel was observed between about 12–30 mm crack depth. Ettringite needles where observed inside the cracks at crack depths starting from about 25 mm.
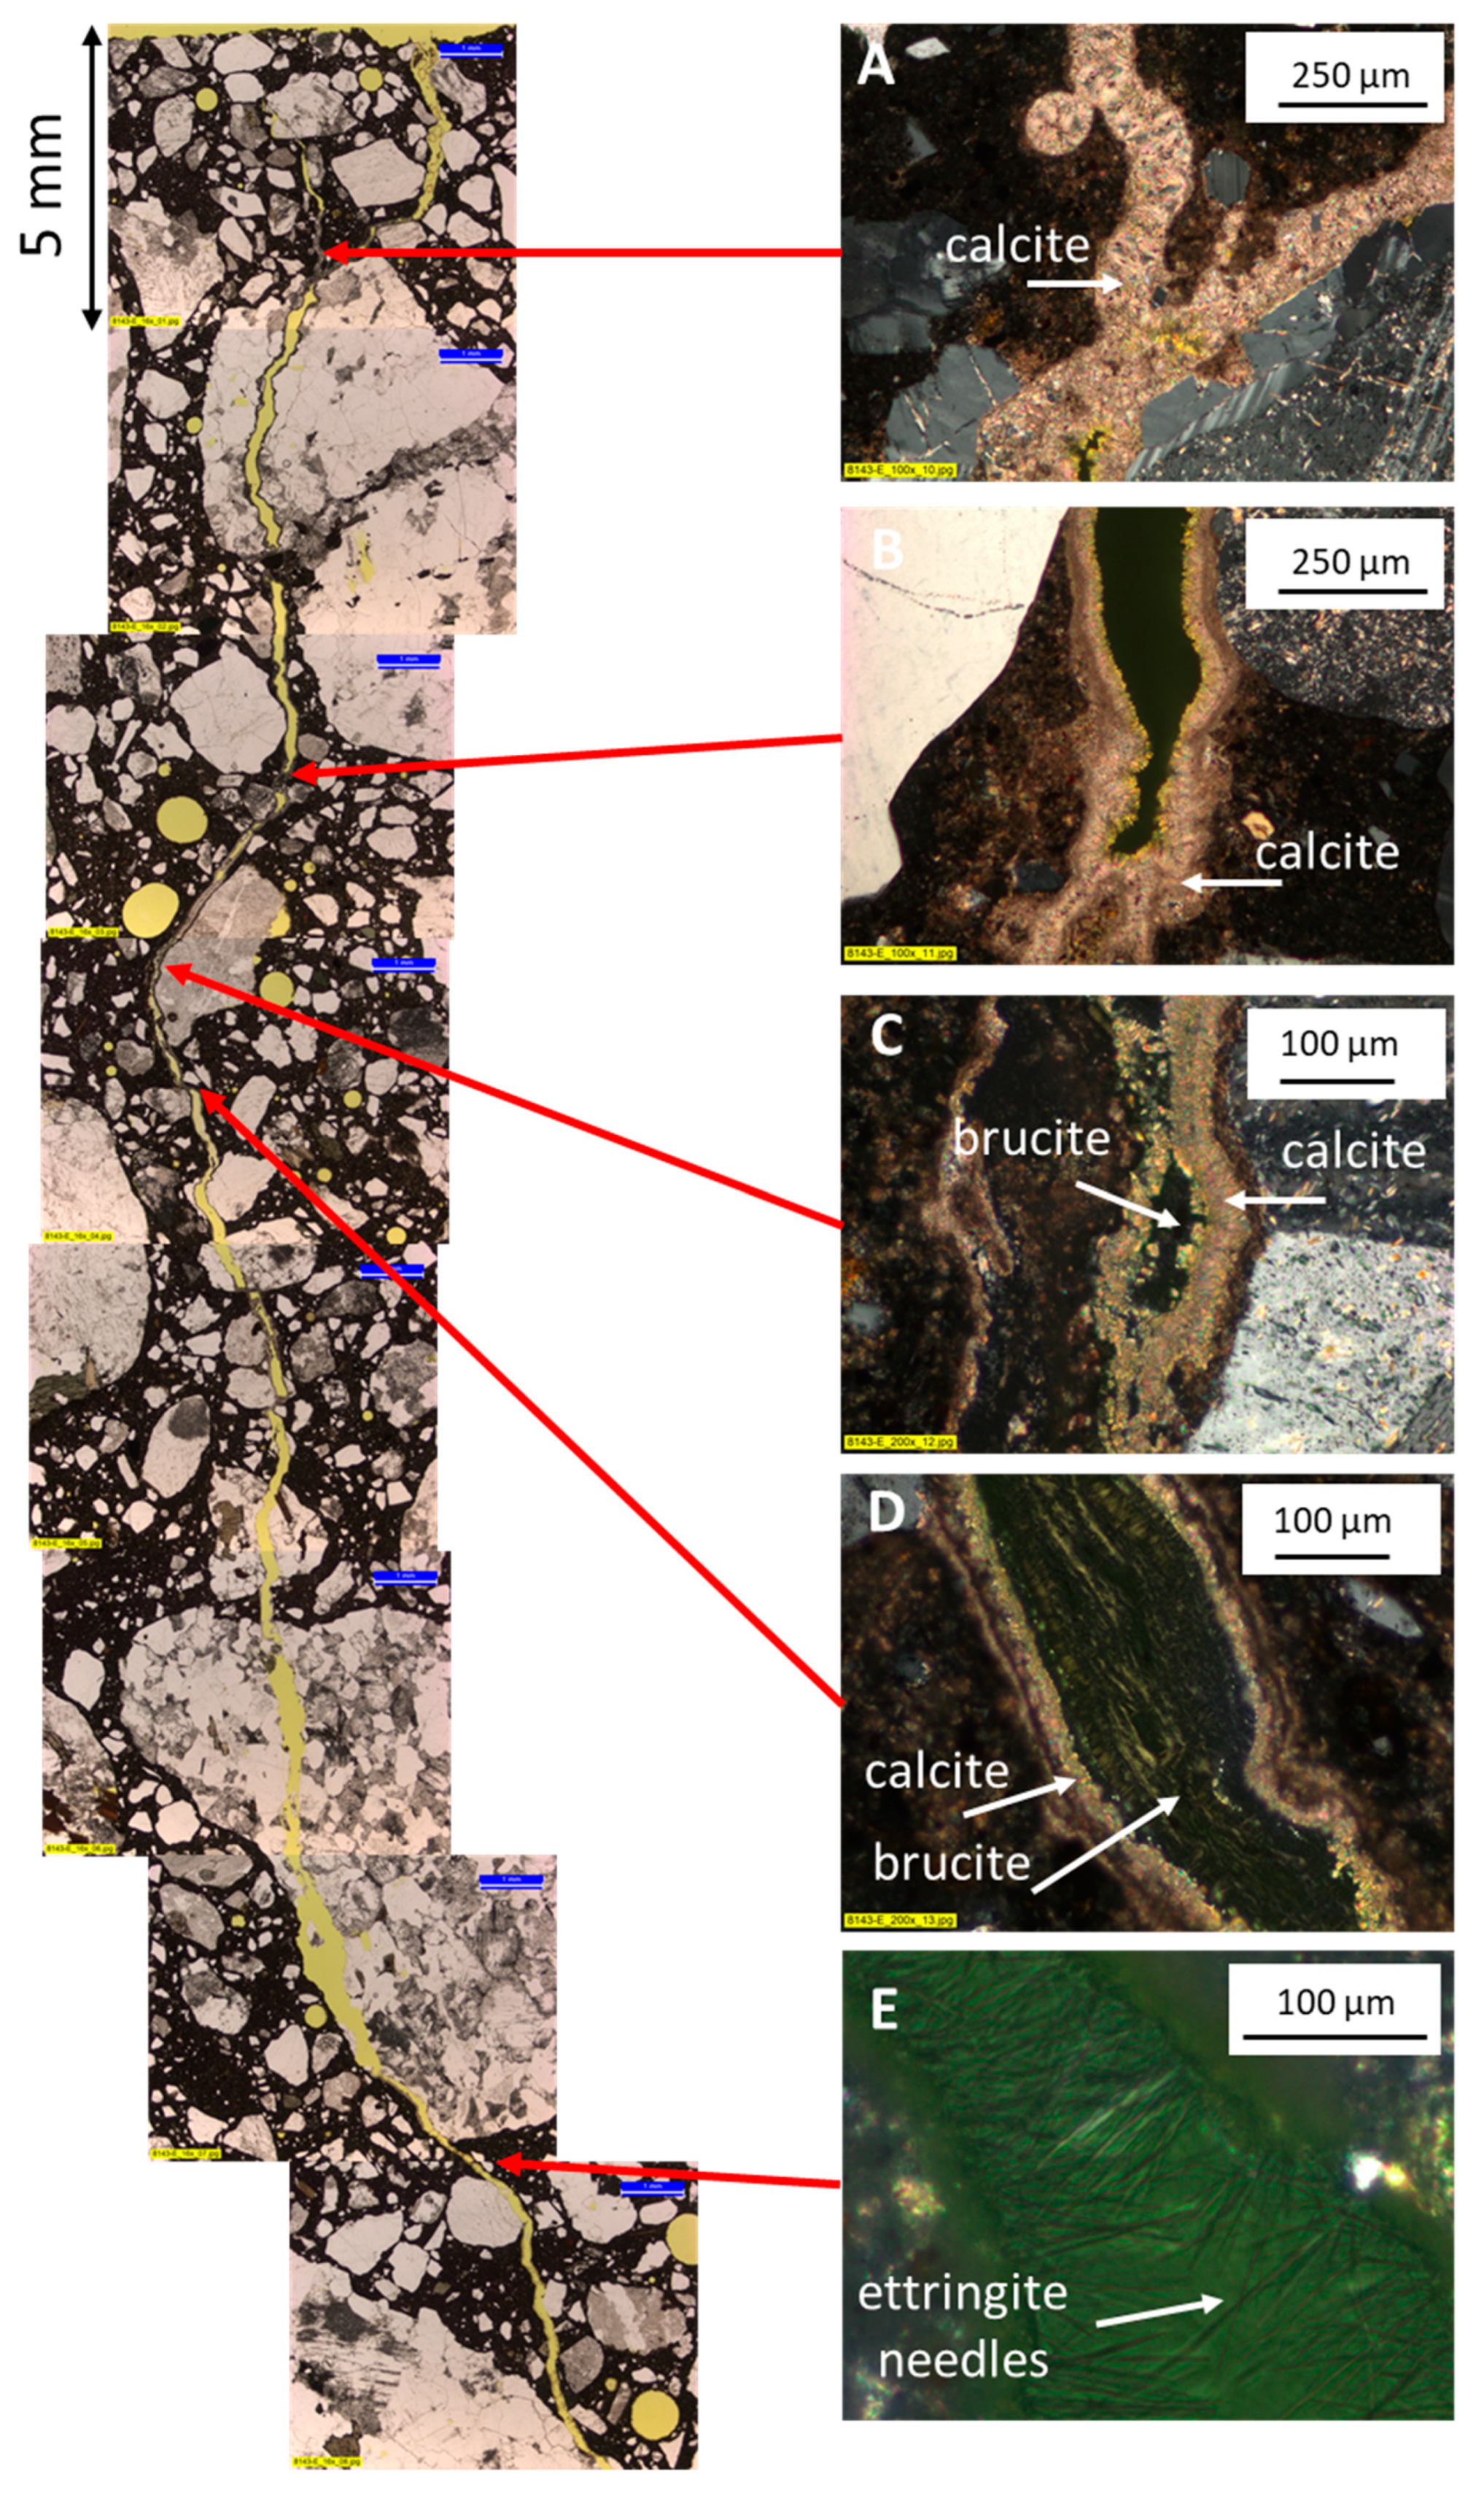
Figure 8 shows pictures from the optical polarizing microscopy of the crack in PC-4SF20FA. On the left side of Figure 8 an overview of the epoxy-impregnated crack is given while close-up pictures of the self-healing products in dependence of crack depth are given to the right of Figure 8. Figure 8 (right) shows close-up pictures at a crack depth of about 4 mm (A), 12 mm (B), 16 mm (C), 18 mm (D) and 40 mm (E). Figure 8A,B show calcium carbonate as dense product closing the crack completely (A) and partly (B). In Figure 8B, a dense lining of calcium carbonate was observed on the crack faces as a dark brown layer. On top of that layer, a lighter layer of needle like calcium carbonate crystals were growing, stretching towards the center of the crack. In some cases, it was observed that bridging by calcium carbonate occurred occasionally where small paste fragments from the cracking of the concrete were present inside the crack.
Figure 8C,D show a calcium carbonate layer intermixed with brucite. In Figure 8D, a clear thin lining of calcium carbonate is observed followed by a thicker lining of brucite in parts completely closing the crack. Ettringite appeared as fine needles, occasionally growing across the cracks but not massively filling the cracks. Ettringite needles growing across the crack at crack depths larger than 32 mm are shown in Figure 8E.
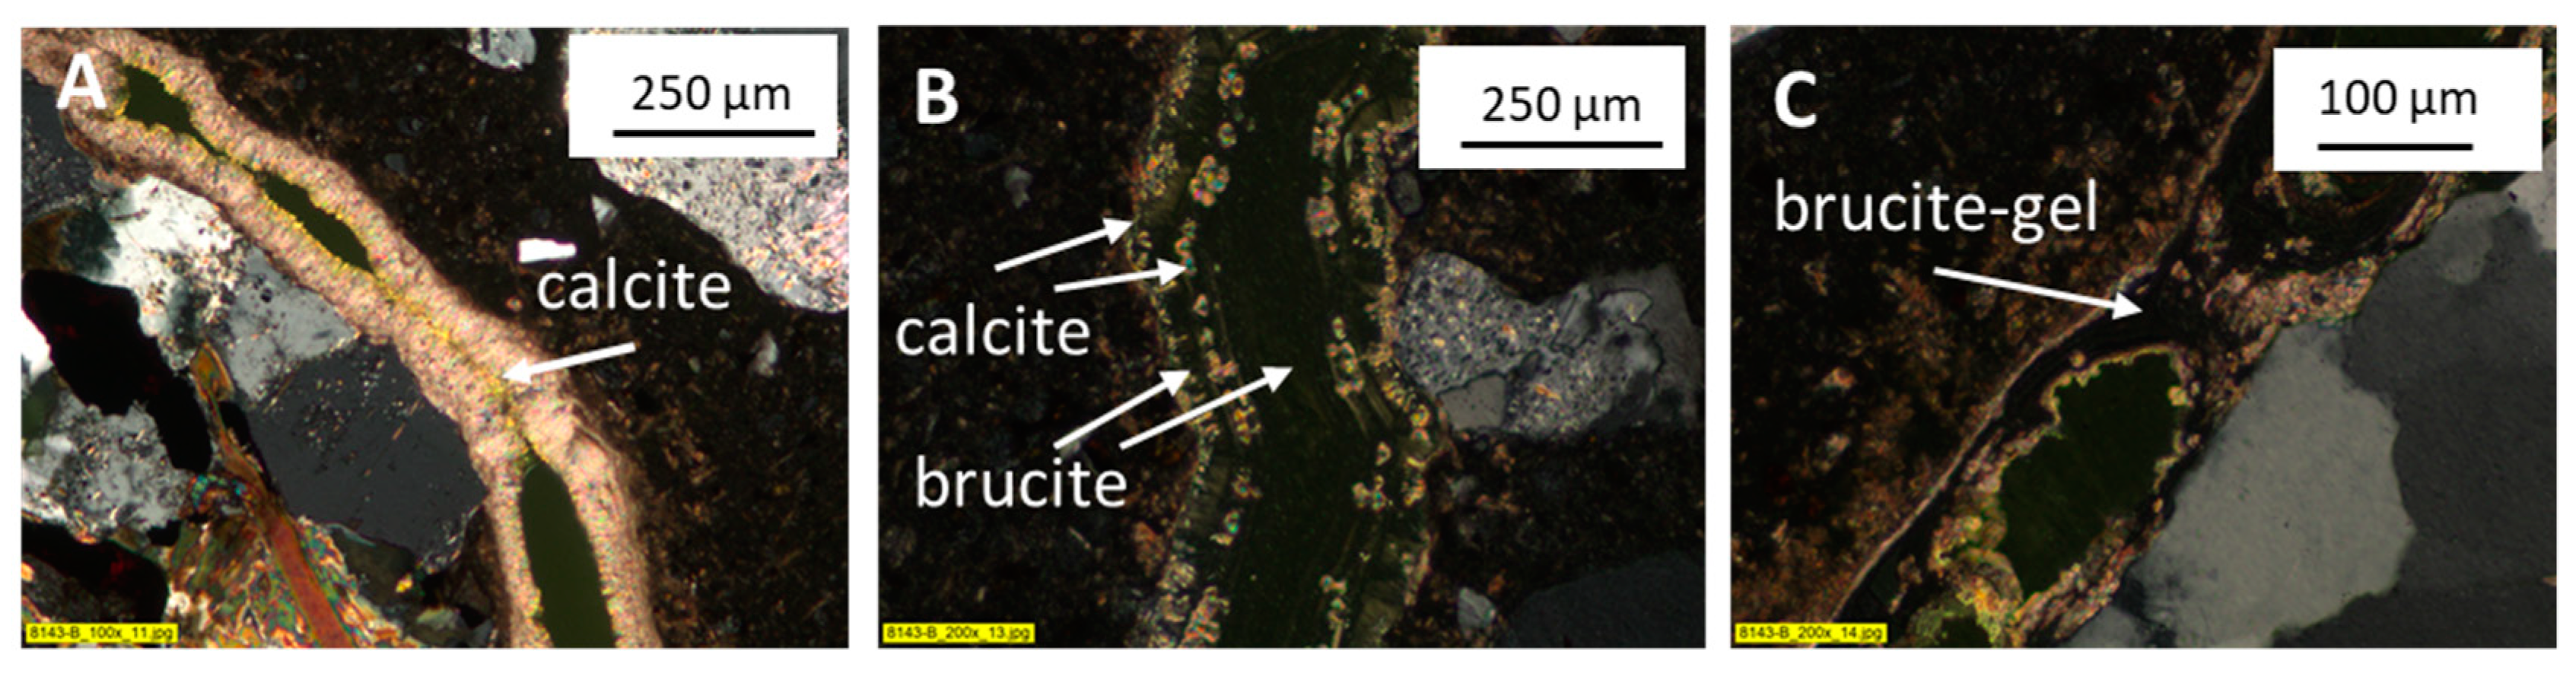
Figure 9 shows a selection of self-healing products found at different crack depths in PC-4SF. As mentioned, calcite was observed to occasionally densely closing the cracks, typically as small bridging calcite crystals. An example is given in Figure 9A. In some places, precipitation of calcite and brucite appeared as a layered texture where each new layer seemed to precipitate on the former layer (Figure 9B). The colorful and more light interference colors are typical for calcium carbonate and there seems to be a layer of calcium carbonate at the crack face, followed by a layer of brucite (dark areas), and again a layer of calcium carbonate on top of the brucite layer. At crack depths larger than 12–16 mm, an isotropic phase forming bridges to close the crack was observed (Figure 9C). The texture of the phase was similar to brucite and SEM-EDX analysis confirmed the brucite composition. However, the phase had no crystallinity and was therefore assigned to be a brucite-gel. The brucite-gel phase was again intermixed with calcium carbonate. There was a clear mixing of calcite and brucite as an interface zone between more massive appearances of the two. While calcite was densely filling the cracks, brucite fillings appeared rather porous (Figure 10). Epoxy could easily penetrate areas of brucite during vacuum preparation of the specimens (Figure 10 right).
4.3.4. Scanning Electron Microscopy
In order to verify the phases observed in the cracks by optical polarizing microscopy, the self-healing products were further studied by scanning electron microscopy (SEM-EDX). Figure 11 shows the results of a line scan analysis performed on PC-4SF. Results from the two other concretes are not shown as they appeared similar to core PC-4SF. In the line scans different colors are used for different elements. An overview is given in Table 10.
Figure 11A shows that the dense lining on the crack faces at a crack depth of 4 mm is high in Ca, confirming it is calcium carbonate. At the right end of the line scan, intensities of magnesium (Mg) and silicon (Si) are increased, indicating the presence of magnesium silicate hydrate (M-S-H) in between the calcium carbonate lining and an aggregate particle. At a depth of 8 mm, (Figure 11B) the intermixing of calcium carbonate and brucite layers were verified by the chemical profile. At this position brucite appeared as the first formed phase followed by alternating formation of calcium carbonate and brucite. The crack was at this position not completely closed. At a depth of 11 mm (Figure 11C) Mg intensities indicate the presence of a massive appearance of layered brucite closing the whole crack. In Figure 11B,C at the right side of the crack the Mg intensities decreased while Ca increased. This may be due to the presence of a very thin calcite or portlandite layer just between the brucite and the cement paste; this thin layer was just seen in the backscatter images. At a depth of 40 mm, (Figure 11D) where the crack was no more than about 0.03 mm wide, increased intensities of aluminium (Al) and S and relative high intensities of Ca verified the presence of ettringite. EDX point analysis verified the composition of the named phases found in the cracks (Table 11).
5. Discussion
5.1. Phase Assemblage of Hydrated Pastes
As expected from the composition of the different concretes there are some differences in the phase assemblage. PC-12SF contained more C-S-H phases compared to PC-12SF and PC-4SF20FA, as expected due to the higher amount of SiO2 in the system. PC-12SF and PC-4SF20FA contained less CH than PC due to the pozzolanic reaction of silica fume or fly ash with CH. PC-4SF contained the lowest amount of SCM (only 4% silica fume), and it appeared that more CH was formed in PC compared to PC-12SF and PC-4SF20FA. PC-4SF20FA contained most AFm phases, mainly mono- and hemisulpho-aluminate. The mass balance calculations (see assumptions in Section 3.1.1) were in agreement with the observations made by SEM-EDX.
The concrete columns were exposed to seawater for 25 years. Thaumasite formation is a typical indication of sulphate attack in cold climates [15]. The phase analysis did neither show the presences of gypsum nor thaumasite (Figure 3) and the microscopy showed no signs of sulphate attack to the concrete. Furthermore, only limited Friedel’s salt was observed in the pastes. Friedel’s salt is a product of a reaction of AFm phases like monsulpho-aluminate with chlorides from the environment [15].
A chemical and mineralogical zonation appears to be a general feature in the surface of marine exposed concrete. The typical zonation is a Mg-rich zone followed by a S-rich zone, followed by a Cl-rich zone [27]. In PC-4SF, increased Mg content was found in the paste near the crack mouth (5 mm depth from the exterior surface), while the sulphur and chloride content were low (Table 5). The chloride content was highest in the bulk compared to in the paste close to the crack. The sulphur content in the paste reached a maximum near the crack face at a depth from the exterior of about 30 mm (Table 5). The observations indicate elemental zonation from the crack face into the bulk. However, the data is not sufficient to confirm this.
5.2. Mechanism of Self-Healing
There was no difference in the self-healing in respect to mineralogy and chemistry between the three different binder combinations investigated. In all three concretes, calcite precipitation appeared along the crack faces in the outer part of the cracks. Further inwards brucite was dominant and even further inwards ettringite dominated (Figure 12A).
The self-healing mechanism seems to be a combination of precipitation of ions from the seawater and dissolution and reprecipitation of phases (ettringite) from the cement paste adjacent to the crack. Seawater from the Atlantic contains about 10 g Na+/L, 19 g Cl−/L, 2.5 g SO42−/L and 1.5 g Mg2+/L [30]. In addition, seawater is saturated with calcium carbonate. All these ions can interact with the cement paste in contact with seawater and may affect the phase assemblage of the paste and possible phases precipitating in cracks and voids.
An illustration of the potential self-healing mechanism found in the different binders is given in Figure 12B.
The cracks investigated in this study were exposed to the tidal zone, meaning that they were subjected to wetting and drying cycles. The first millimeters of a crack will dry out most rapidly causing calcite to precipitate directly from the seawater in form of dense layers. In contact with concrete, the seawater gets oversaturated with Ca ions from CH and C-S-H leaching. In that environment, carbonate ions from seawater can rapidly react with Ca2+ from the cement paste to form calcite.
In the normal pH range of seawater (pH about 8), seawater is undersaturated with respect to brucite. However, when seawater gets in contact with the high pH environment in a concrete pore solution, brucite will precipitate [15]. Mg2+ will react with hydroxyl ions (OH−) from the cement paste to form brucite. In several places it was observed that brucite was intermixed with calcite. Optical polarizing microscopy showed that the brucite layer is not dense (Figure 10). Hence, Ca2+ and CO32− ions can potentially be transported through the brucite layer and co-precipitate as calcite. It was also observed that calcite layers form on top of brucite layers. Mg2+ potentially reacts with CH to form brucite. In this process Ca2+ ions from CH are made available for reaction with CO32- ions from the seawater. This would lead to precipitation of calcite on top of brucite. The formation of a calcite layer on top of a brucite layer was also observed in other investigations on concrete surfaces submerged in seawater [31].
Ettringite was found in the cracks at depths of >23 mm from the exterior surface. In moist concrete, voids might be partly filled with water or reprecipitated hydrates [32] and it was shown that the precipitation of ettringite in voids is thermodynamically possible [33]. The precipitation of ettringite in voids was supported by microscopic observations [34]. Extensive filling of air voids by ettringite was found in a surface near zone (approx. 3–8 mm) in a 55 years old Swedish concrete dam (w/c = 0.55) exposed to fresh water [35]. Cracks might act similarly to voids. It is therefore hypothesized that the observed ettringite formation occurred due to dissolution of hydrate phases and reprecipitation. Further hydration of cement paste does not seem to play a role in the healing of the cracks. A typical cement contains 5–8% C3A and up to 80% C3S and C2S together. Further hydration of cement paste should consequently not only result in the formation of ettringite but also C-S-H. However, no phase containing silicate was found inside the crack. Further hydration of cement paste is therefore less likely as a mechanism of self-healing in the investigated samples.
It was not possible to measure the pH of the solution inside the crack during the 25-year marine exposure. However, the mineralogical sequence with increasing crack depth of calcite followed by brucite intermixed with calcite, followed by ettringite could potentially be explained by the different pH stability areas of the phases. The pH values given in Figure 12B are according to the pH stability areas of the mentioned phases. In solutions with high Ca2+ content, calcite already precipitates at a pH of around 6.5 and is stable up to a pH of about 12.3 [36]. The equilibrium pH of brucite is 10.5 meaning that brucite normally will not precipitate at a pH lower than that [37]. Ettringite on the other hand will not precipitate at a pH < 12.5. Seawater is moving freely into the first few millimeters of the crack close to exterior surface and is washed out regularly. Hence, in the outer few millimeters of the crack the pH is close to neutral 8–9. Seawater is regularly replaced (refreshed) but leaching of hydroxides from the concrete might increase the pH of the solution locally. At the relatively low pH (8–9) calcium carbonate will precipitate due to a reaction of carbonate ions from the seawater and calcium ions from leaching of e.g., CH and C-S-H. Seawater is also transported deeper into the crack. However, the deeper and narrower the crack becomes seawater is less rapidly exchanged and the pH of the solution is increased due to continuous leaching from the cement paste. Due to the higher equilibrium pH, brucite will precipitate deeper inside the crack together with calcite. Even deeper only ettringite precipitates due to the potentially high pH of the solution.
6. Conclusions
In this paper the extent of self-healing and the chemical and mineralogical composition of self-healing products of cracks in concrete beams after 25 years of marine exposure was investigated. Three different Portland cement based binder combinations with varying silica fume (4%, 12%) and fly ash content (0%, 20%) were investigated. The following conclusions are drawn:
- There was no effect of binder combination on the mineralogy and chemistry of the self-healing products and the extent of self-healing. Crack widths smaller than 0.2 mm appeared closed.
- A sequence of changing mineralogy of self-healing products was found with increasing crack depth. In the outer faces of the crack (0–5 mm) only calcium carbonate was precipitated followed by brucite layers from 5–30 mm. The brucite was occasionally intermixed with calcite. At crack depths >30 mm only ettringite was observed.
- Two self-healing mechanisms appear to have acted: (1) Precipitation of ions from seawater partly in reaction with ions from the cement paste in the outer part of the crack. (2) Ettringite formation due to the dissolution and reprecipitation of hydrate phases at larger crack depth. It is hypothesized that the mineralogical sequence observed with increasing crack depth occurs due to an increasing pH of the solution inside the crack with increased crack depth.
Author Contributions
T.D., writing, visualization, methodology, XRD analysis, µ-XRF analysis, visual investigation, field work, data treatment; U.H.J., SEM-EDX analysis, optical polarizing microscopy, data treatment, review; M.R.G., project administration, supervision, writing—review and editing, methodology.
Funding
This research was funded by the Norwegian Public Roads Administration (NPRA) through their Ferry-free E39 coastal route project. Additional funding was received through the Durable Advanced Concrete Structure (DaCS) project funded by the Norwegian Research Council, grant number 245645/O30, and participating partners SINTEF, NTNU, NPRA, Norcem AS, Skanska Norge AS, Veidekke Entreprenør AS, Multiconsult AS, Unicon AS, Mapei AS, AF Gruppen Norge AS, Norbetong AS, Axion AS and Concrete Structures AS.
Acknowledgments
This research is part of the Norwegian Public Roads Administration (NPRA) Ferry-free E39 coastal route project; we acknowledge the financial support. The DaCS (Durable Advanced Concrete Structures) project is also acknowledged for financial support and the partners for discussions. The Norwegian Public Roads Administration (NPRA), represented by Karla Hornbostel and Eva Rodum, is acknowledged for providing the concrete beams from their field structure and support during several meetings and discussions. The concrete laboratory of NTNU, represented by Steinar Seehus, is acknowledged for support with handling the concrete beams in the laboratory. SINTEF Building and Infrastructure is acknowledged for support with drilling and cutting of concrete cores.
Conflicts of Interest
The authors declare no conflict of interest.
References
- Audenaert, K.; De Schutter, G.; Marsavina, L.; Boel, V. Influence of cracks and crack width on penetration depth of chlorides in concrete. Eur. J. Environ. Civ. Eng. 2009, 13, 561–572. [Google Scholar] [CrossRef]
- Marsavina, L.; Audenaert, K.; De Schutter, G.; Faur, N.; Marsavina, D. Experimental and numerical determination of the chloride penetration in cracked concrete. Constr. Build. Mater. 2009, 23, 264–274. [Google Scholar] [CrossRef]
- Concrete Society. Relevance of Cracking in Concrete to Reinforcement Corrosion—Technical Report 44; Concrete Society: Camberley, UK, 2015. [Google Scholar]
- Hornbostel, K.; Geiker, M. Influence of cracking on reinforcement corrosion. In Proceedings of Crack width Calculations Methods for Large Concrete Structures, Nordic Mini-Seminar; Nordic Concrete Federation: Oslo, Norway, 2017. [Google Scholar]
- Boschmann Käthler, A.C.; Angst, U.M.; Wagner, M.; Larsen, C.K.; Elsener, B. Effect of Cracks on Chloride Induced Corrosion of Steel in Concrete—A Review; National Public Roads Administration (NPRA): Oslo, Norway, 2017. [Google Scholar]
- De Rooij, M. (Ed.) Self Healing Phenomena in Cement-based Materials, State of the Art Report from RILEM Technical Commitee 221-SHC; Springer: Dordrecht, The Netherlands, 2013. [Google Scholar]
- Huang, H.; Ye, G.; Qian, C.; Schlangen, E. Self-healing in cementitious materials: Materials, methods and service conditions. Mater. Des. 2016, 92, 499–511. [Google Scholar] [CrossRef]
- Schlangen, E.; Joseph, C. Self-healing process in concrete. In Self-Healing Materials: Fundamentals, Design, Strategies and Applications; Gosh, S.K., Ed.; Wiley-VCH: Hoboken, NJ, USA, 2009. [Google Scholar]
- Van Tittelboom, K.; De Belie, N. Self-healing in cementitious materials—A review. Mater. Des. 2013, 6, 2182–2217. [Google Scholar] [CrossRef]
- Wu, M.; Johannesson, B.; Geiker, M. A review: Self-healing in cementitious materials and engineered cementitious composite as a self-healing material. Constr. Build. Mater. 2012, 28, 571–583. [Google Scholar] [CrossRef]
- Reinhardt, H.W.; Jonkers, H.; Van Tittelboom, K.; Snoeck, D.; De Belie, N.; De Muynck, W.; Verstraete, W.; Wang, J.; Mechtcherine, V. Recovery Against Environmental Action. In Self-Healing Phenomena in Cement-Based Materials; De Rooij, M., Ed.; RILEM Technical Committee 221-SHC; Springer: Dordrecht, The Netherlands, 2013. [Google Scholar]
- Savija, B.; Schlangen, E. Autogenous healing and chloride ingress in cracked concrete. Heron 2016, 61, 15–32. [Google Scholar]
- Edvardsen, C. Water Permeability and Autogenous Healing of Cracks in Concrete. Mater. J. 1999, 96, 448–454. [Google Scholar] [CrossRef]
- Jacobsen, S.; Marchand, J.; Hornain, H. Sem observations of the microstructure of frost deteriorated and self-healed concretes. Cem. Concr. Res. 1995, 25, 1781–1790. [Google Scholar] [CrossRef]
- De Weerdt, K.; Justnes, H.; Geiker, M.R. Changes in the phase assemblage of concrete exposed to sea water. Cem. Concr. Compos. 2014, 47, 53–63. [Google Scholar] [CrossRef]
- Fidjestøl, P.; Nilsen, N. Field Testof Reinforcement Corrosionin Concrete. In Performance of Concrete in Marine Environment; American Concrete Institute: Farmington Hills, MI, USA, 1980. [Google Scholar]
- Mohammed, T.U.; Otsuki, N.; Hamada, H. Corrosion of steel bars in cracked concrete under marine environment. J. Mater. Civ. Eng. 2003, 15, 460–469. [Google Scholar] [CrossRef]
- Maes, M.; Snoeck, D.; De Belie, N. Chloride penetration in cracked mortar and the influence of autogenous crack healing. Constr. Build. Mater. 2016, 115, 114–124. [Google Scholar] [CrossRef]
- Reinhardt, H.-W.; Jooss, M. Permeability and self-healing of cracked concrete as a function of temperature and crack width. Cem. Concr. Res. 2003, 33, 981–985. [Google Scholar] [CrossRef]
- Palin, D.; Jonkers, H.M.; Wiktor, V. Autogenous healing of sea-water exposed mortar: Quantification through a simple and rapid permeability test. Cem. Concr. Res. 2016, 84, 1–7. [Google Scholar] [CrossRef]
- Palin, D.; Wiktor, V.; Jonkers, H.M. Autogenous healing of marine exposed concrete: Characterization and quantification through visual crack closure. Cem. Concr. Res. 2015, 73, 17–24. [Google Scholar] [CrossRef]
- Van Tittelboom, K.; Gruyaert, E.; Rahier, H.; De Belie, N. Influence of mix composition on the extent of autogenous crack healing by continued hydration or calcium carbonate formation. Constr. Build. Mater. 2012, 37, 349–359. [Google Scholar] [CrossRef]
- Zhou, Z.H.; Li, Z.Q.; Xu, D.Y.; Yu, J.H. Influence of Slag and Fly Ash on the Self-Healing Ability of Concrete. Adv. Mater. Res. 2011, 306–307, 1020–1023. [Google Scholar] [CrossRef]
- Jóźwiak-Niedźwiedzka, D. Microscopic observations of self-healing products in calcareous fly ash mortars. Microsc. Res. Tech. 2015, 78, 22–29. [Google Scholar] [CrossRef]
- Holtmon, J.P.; Isaksen, H.R. Utvikling av Kloridbestandig Betong—Rapport fra Produksjon av Prøveelementer, Vegdirektoratet; National Public Roads Administration: Oslo, Norway, 1994. [Google Scholar]
- Jensen, I.S. yr.no/place/Norway/Sandnessjøen; Norwegian Meteorological Institute and Norwegian Broadcasting Corporation, Meteorological Institute of Norway: Oslo, Norway, 2018. [Google Scholar]
- Jakobsen, U.H.; De Weerdt, K.; Geiker, M.R. Elemental zonation in marine concrete. Cem. Concr. Res. 2016, 85, 12–27. [Google Scholar] [CrossRef] [Green Version]
- De Weerdt, K.; Orsáková, D.; Müller, A.C.A.; Larsen, C.K.; Pedersen, B.; Geiker, M.R. Towards the understanding of chloride profiles in marine exposed concrete, impact of leaching and moisture content. Constr. Build. Mater. 2016, 120, 418–431. [Google Scholar] [CrossRef]
- Herfort, D.; Lothenbach, B. Calculation of Ternary Diagrams by Mass Balance Calculations in MS Excel; EMPA: Dübendorf, Switzerland, 2016. [Google Scholar]
- Justnes, H.; De Weerdt, K.; Geiker, M. Chloride Binding in Concrete by Sea Water—The Role of Magnesium. In Proceedings of First International Conference on Performance-based and Life-cycle Structural Engineering; Hong Kong Polytechnic University: Hong Kong, China, 2012. [Google Scholar]
- B Buenfeld, N.R.; Newman, J.B. The development and stability of surface layers on concrete exposed to sea-water. Cem. Concr. Res. 1986, 16, 721–732. [Google Scholar] [CrossRef]
- Angst, U.M.; Geiker, M.R.; Michel, A.; Gehlen, C.; Wong, H.; Isgor, O.B.; Elsener, B.; Hansson, C.M.; François, R.; Hornbostel, K.; et al. The steel–concrete interface. Mater. Struct. 2017, 50, 143. [Google Scholar] [CrossRef]
- Samson, E.; Marchand, J.; Zuber, B.; Skalny, J.P. Ettringite in air voids. In Proceedings of the International RILEM TC 186-ISA Workshop on Internal Sulfate Attack and Delayed Ettringite Formation, Villars, Switzerland, 4–6 September 2002. [Google Scholar]
- Jakobsen, U.H. Personal Communication; Danish Technological Institute, Concrete: Taastrup, Denmark, 2019. [Google Scholar]
- Rosenqvist, M.; Bertron, A.; Fridh, K.; Hassanzadeh, M. Concrete alteration due to 55 years of exposure to river water: Chemical and mineralogical characterisation. Cem. Concr. Res. 2017, 92, 110–120. [Google Scholar] [CrossRef]
- de Moel, P.; Van der Helm, A.; van Rijn, M.; Dijk, J.; Meer, W. Assessment of Calculation Methods for Calcium Carbonate Saturation in Drinking Water for DIN 38404-10 Compliance. Drink. Water Eng. Sci. 2013, 6, 115–124. [Google Scholar] [CrossRef]
- Davidovits, J. Geopolymer, Green Chemistry and Sustainable Development Solutions: Proceedings of the World Congress Geopolymer 2005; Geopolymer Institute: Saint-Quentin, France, 2005. [Google Scholar]
Figure 1.
Picture of the concrete field station in Sandnessjøen.

Figure 2.
Illustration of positions for the SEM-EDX point analysis in the bulk and close to the crack (red rectangles). The blue rectangle illustrates the area of the thin section used for Scanning electron microscopy energy dispersive (SEM-EDX) analysis and optical polarizing microscopy.
Figure 2.
Illustration of positions for the SEM-EDX point analysis in the bulk and close to the crack (red rectangles). The blue rectangle illustrates the area of the thin section used for Scanning electron microscopy energy dispersive (SEM-EDX) analysis and optical polarizing microscopy.

Figure 3.
EDX phase analysis of the bulk of the three different binders investigated.

Figure 4.
Explanation of the categories ◣ partly self-healed, ☐ no self-healing (open crack) and wmax_s used in Table 7.
Figure 4.
Explanation of the categories ◣ partly self-healed, ☐ no self-healing (open crack) and wmax_s used in Table 7.

Figure 5.
Overview picture (self-healed crack marked as white line) and µ-XRF elemental map of Ca (green), Mg (blue) and S (yellow) of PC-4SF20FA.
Figure 5.
Overview picture (self-healed crack marked as white line) and µ-XRF elemental map of Ca (green), Mg (blue) and S (yellow) of PC-4SF20FA.

Figure 6.
Close up pictures of the crack (filled with white precipitate) in PC-4SF20FA, taken with an optical camera inbuilt in the micro X-ray fluorescence (µ-XRF) instrument. Blurred due to relatively low optical resolution of the instrument. The edges (crack faces) are marked with white lines.
Figure 6.
Close up pictures of the crack (filled with white precipitate) in PC-4SF20FA, taken with an optical camera inbuilt in the micro X-ray fluorescence (µ-XRF) instrument. Blurred due to relatively low optical resolution of the instrument. The edges (crack faces) are marked with white lines.

Figure 7.
Left: Self-healing products on crack face in the tidal zone of PC-4SF20FA, Right: XRD diffractogram of the self-healing product. The wide hump between 10–15 °2θ indicates the desiccator wax used for the sample preparation.
Figure 7.
Left: Self-healing products on crack face in the tidal zone of PC-4SF20FA, Right: XRD diffractogram of the self-healing product. The wide hump between 10–15 °2θ indicates the desiccator wax used for the sample preparation.

Figure 8.
Left: Overview image of the epoxy impregnated crack of PC-4SF20FA until a crack depth of 40 mm, Right: Zoomed in pictures of parts of the cracks showing the variation in self-healing products with crack depth.
Figure 8.
Left: Overview image of the epoxy impregnated crack of PC-4SF20FA until a crack depth of 40 mm, Right: Zoomed in pictures of parts of the cracks showing the variation in self-healing products with crack depth.

Figure 9.
Examples of (A) Calcite bridging; (B) brucite and calcite, layered and intermixed; (C) brucite-gel observed inside the crack of PC-4SF at different crack depth; crack depth from the exterior, (A): 4 mm, (B): 17 mm, (C): 23 mm.
Figure 9.
Examples of (A) Calcite bridging; (B) brucite and calcite, layered and intermixed; (C) brucite-gel observed inside the crack of PC-4SF at different crack depth; crack depth from the exterior, (A): 4 mm, (B): 17 mm, (C): 23 mm.

Figure 10.
Crack in core PC-4SF, Left: Massive precipitation of calcite along the crack face with small bridges closing the crack, Right: Brucite interlayered with dense calcite. The porous brucite is fully impregnated with epoxy. Fluorescent light mode.
Figure 10.
Crack in core PC-4SF, Left: Massive precipitation of calcite along the crack face with small bridges closing the crack, Right: Brucite interlayered with dense calcite. The porous brucite is fully impregnated with epoxy. Fluorescent light mode.

Figure 11.
Left: BSE images of self-healing products of PC-4SF at different crack depth, Right: SEM-EDX line scan elemental analysis through the self-healing product. Line colors representing different elements according to Table 10.
Figure 11.
Left: BSE images of self-healing products of PC-4SF at different crack depth, Right: SEM-EDX line scan elemental analysis through the self-healing product. Line colors representing different elements according to Table 10.
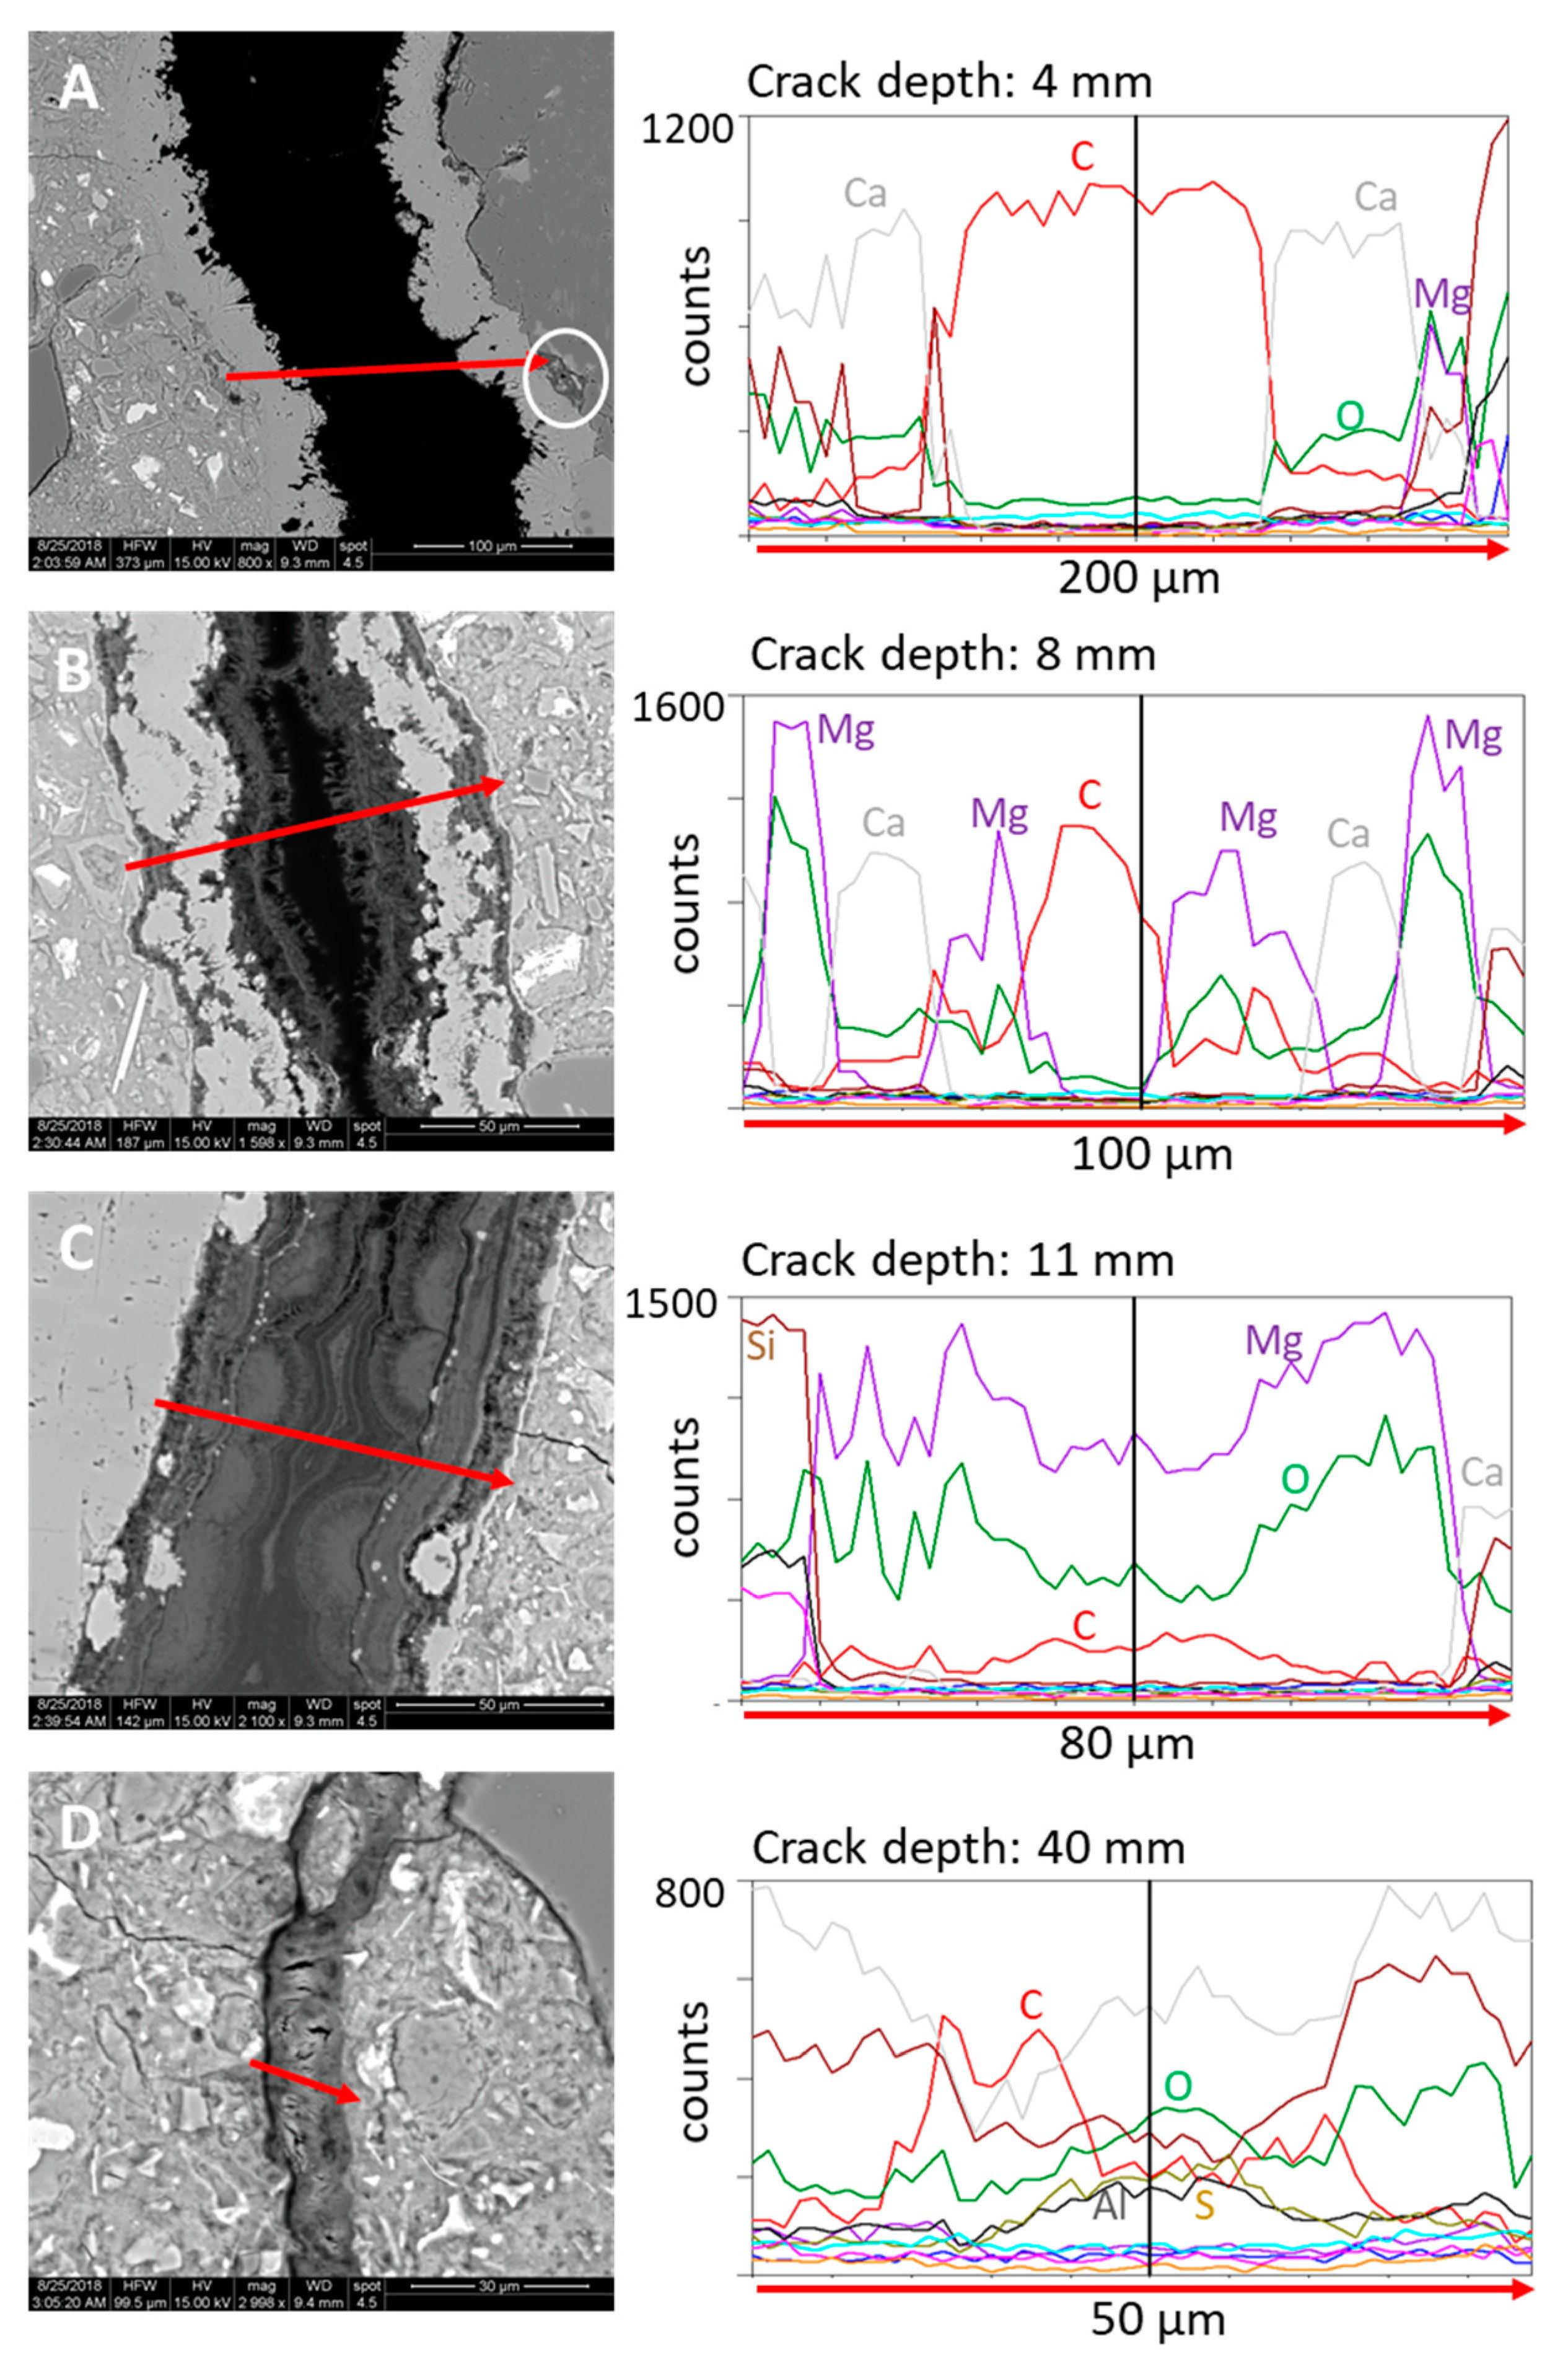
Figure 12.
Illustration of (A) Observed mineralogical sequence of self-healing products with increased crack depth; (B) proposed self-healing mechanism. Only main components contributing to self-healing are indicated.
Figure 12.
Illustration of (A) Observed mineralogical sequence of self-healing products with increased crack depth; (B) proposed self-healing mechanism. Only main components contributing to self-healing are indicated.


Table 1.
Concrete compositions [27].
Table 1.
Concrete compositions [27].
| Component | Unit | PC-4SF | PC-4SF20FA | PC-12SF |
|---|---|---|---|---|
| Cement | kg/m3 | 373 | 384 | 398 |
| Cement type | - | CEM I | CEM I | CEM I |
| Silica fume | % (bwc) 2 | 4 | 4 | 12 |
| Fly ash | % (bwc) 2 | 20 | ||
| Free water | kg/m3 | 160.5 | 166.6 | 198.7 |
| Aggregate 0–8 mm | kg/m3 | 928 | 1014 | 881 |
| Aggregate 8–16 mm | kg/m3 | 904 | 820 | 841 |
| Air entrainer | kg/m3 | 0.3 | 0.6 | |
| Plasticizer | kg/m3 | 6.0 | 7.9 | 8.5 |
| Paste volume | % | 28.6 | 29.5 | 34.8 |
| Theoretical density | kg/m3 | 2.38 | 2.40 | 2.37 |
| Equivalent w/c 1 | - | 0.40 | 0.40 | 0.40 |
1 equiv. w/c = w/(c + (k*s)); k = 2; 2 bwc: by weight of cement.
Table 2.
Chemical composition of binders.
| Oxides | Unit | CEM I | Fly Ash [28] | Silica Fume [28] |
|---|---|---|---|---|
| CaO | wt% | 63.3 | 3.6 | 0.1 |
| SiO2 | wt% | 20.6 | 55.4 | 95.1 |
| Al2O3 | wt% | 4.8 | 27.4 | 1.0 |
| Fe2O3 | wt% | 3.5 | 3.9 | 0.1 |
| MgO | wt% | 2.2 | 1.0 | 0.4 |
| SO3 | wt% | 2.8 | N/A | 0.0 |
| K2O | wt% | 1.0 | 1.1 | 1.0 |
| Na2O | wt% | 0.35 | 0.3 | 0.1 |
| LOI | wt% | 1.0 | N/A | N/A |
| Specific surface area | m2/kg | 341 | N/A | N/A |
Table 3.
Exposure and surface crack width of the investigated concrete cores.
| Core ID | Exposure Zone | Distance from Top of Atmospheric Zone (m) | Crack Width (mm) | |
|---|---|---|---|---|
| Before Drilling | After Drilling | |||
| PC-4SF | Tidal | 1.4 | 0.15 | 0.15 |
| PC-4SF20FA | Tidal | 1.5 | 0.35 | 0.20 |
| PC-12SF | Tidal | 1.4 | 0.20 | 0.15 |
Table 4.
Overview of experimental methods used to investigate the phase assemblage of the hydrated binders, the chemical and mineralogical composition of self-healing products, and the extent of self-healing.
Table 4.
Overview of experimental methods used to investigate the phase assemblage of the hydrated binders, the chemical and mineralogical composition of self-healing products, and the extent of self-healing.
| Concrete/Core | Phase Assemblage | Mineralogy and Chemistry of Self-Healing Products | Extent of Self-Healing | ||||
|---|---|---|---|---|---|---|---|
| Mass Balance | SEM | µ-XRF | XRD 1 | Optical Polarizing Microscopy | SEM | Optical Polarizing Microscopy | |
| PC-4SF | X | X | X | X | X | X | |
| PC-4SF20FA | X | X | X | X | X | X | X |
| PC-12SF | X | X | X | X | X | X | |
1 XRD was prepared on a sample obtained from a cracked part of the tidal zone from the concrete beam representing composition PC-4SF20FA.
Table 5.
Elemental composition measured by the EDX point analysis of the paste (a) close to the crack (<0.1 mm distance from the crack face) at different crack depth from the exterior and (b) in the bulk of the concrete.
Table 5.
Elemental composition measured by the EDX point analysis of the paste (a) close to the crack (<0.1 mm distance from the crack face) at different crack depth from the exterior and (b) in the bulk of the concrete.
| EDX (atomic%) | ||||||||||
|---|---|---|---|---|---|---|---|---|---|---|
| Depth 1,2 (mm) | Na | K | Mg | S | Cl | Al | Si | Ca | Fe | |
| PC-4SF | 4–5 | 1.2 | 0.5 | 3.1 | 0.1 | 0.1 | 1.6 | 8.6 | 29.4 | 0.7 |
| 10–30 | 0.7 | 0.4 | 0.9 | 0.9 | 0. | 2.1 | 12.1 | 23.9 | 0.9 | |
| 30–35 | 1.1 | 0.4 | 0.8 | 1.7 | 0.6 | 1.6 | 12.5 | 22.5 | 0.7 | |
| Bulk | 0.6 | 0.2 | 0.7 | 1.1 | 1.1 | 0.7 | 12.7 | 23.8 | 0.6 | |
| PC-4SF20FA | 4–5 | 0.5 | 0.2 | 1.3 | 1.1 | 0.8 | 1.3 | 12.4 | 19.3 | 1.4 |
| 10–30 | 1.9 | 0.6 | 1.0 | 1.2 | 0.4 | 1.0 | 12.9 | 19.2 | 0.8 | |
| 30–35 | 0.9 | 0.6 | 0.8 | 1.6 | 0.8 | 0.8 | 12.9 | 19.4 | 0.6 | |
| Bulk | 0.8 | 0.3 | 0.8 | 1.2 | 0.7 | 0.8 | 13.4 | 19.4 | 0.7 | |
| PC-12SF | 4–5 | 0.4 | 0.1 | 0.9 | 0.9 | 1.2 | 0.9 | 13.1 | 23.6 | 0.8 |
| 10–30 | 0.7 | 0.3 | 0.7 | 1.1 | 0.9 | 0.7 | 13.0 | 23.1 | 0.7 | |
| 30–35 | 0.6 | 0.3 | 0.6 | 1.1 | 0.8 | 0.6 | 13.7 | 22.8 | 0.5 | |
| Bulk | 0.7 | 0.3 | 0.8 | 1.0 | 0.8 | 0.8 | 13.2 | 23.3 | 0.6 | |
1 Average of EDX measurements (30 points) in paste close to the crack (<0.1 mm away from the crack) at different depth from the exterior surface (mm); 2 Bulk: Average of EDX measurements (60 points) in paste 15–20 mm away from the crack and at 20 mm depth from the exterior surface.
Table 6.
Predicted hydrate phases of the three different binders based on mass balance calculations [29]. See Section 3.1.1 for assumptions.
Table 6.
Predicted hydrate phases of the three different binders based on mass balance calculations [29]. See Section 3.1.1 for assumptions.
| Hydrate | Amount (g/100 g Hydrated Binder) | ||
|---|---|---|---|
| PC-4SF | PC-4SF20FA | PC-12SF | |
| Portlandite | 15 | - | 2 |
| C-A-S-H (C1.75A0.05SH4.3) | 61 | 48 | 78 |
| C-A-S-H (C1.3A0.1SH3) | - | 22 | - |
| C-A-S-H total | 61 | 70 | 78 |
| Monoulpho-aluminate | 1 | 9 | - |
| Hemisulpho-alminate | - | 4 | - |
| Ettringite | 9 | - | 4 |
| Gypsum | - | - | 2 |
| Ferrihydrate | 2 | 2 | 2 |
| Hydrotalcite | 4 | 3 | 4 |
| Ca/Si of C-A-S-H | 1.75 | 1.6 | 1.75 |
| Ca/Al of C-A-S-H | 0.05 | 0.1 | 0.05 |
Table 7.
Crack width (w) and degree of self-healing (S) of cracks and the maximum crack width to be completely closed (wmax_s) in PC-4SF, PC-4SF20FA and PC-12SF.
Table 7.
Crack width (w) and degree of self-healing (S) of cracks and the maximum crack width to be completely closed (wmax_s) in PC-4SF, PC-4SF20FA and PC-12SF.
| Core | PC-4SF | PC-4SF20FA | PC-12SF | ||||||
|---|---|---|---|---|---|---|---|---|---|
| Depth (mm) | S | w (mm) | wmax_s (mm) | S | w (mm) | wmax_s (mm) | S | w (mm) | wmax_s (mm) |
| 0–5 | ☐ | 0.1–0.25 | - | ◣ | 0.05–0.20 | 0.08 | ☐ | 0.05–0.20 | - |
| 5–10 | ◣ | 0.05–0.25 | 0.21 | ◣ | 0.20–0.30 | 0.03 1 | ◣ | 0.05–0.15 | 0.12 |
| 10–15 | ◣ | 0.05–0.15 | 0.12 | ◣ | 0.10–0.25 | 0.16 | ◣ | 0.05–0.20 | 0.18 |
| 15–20 | ◣ | 0.05–0.20 | 0.12 | ◣ | 0.10–0.20 | 0.18 | ◣ | 0.10–0.20 | 0.17 |
| 20–25 | ◣ | 0.05–0.20 | 0.12 | ◣ | 0.05–0.20 | 0.18 | ◣ | 0.10–0.15 | 0.15 |
| 25–30 | ◣ | 0.10–0.15 | 0.13 | ☐ | 0.10–0.40 | - | ☐ | 0.05–0.10 | - |
| 30–35 | ◣ | 0.05–0.15 | - | ◣ | 0.05–0.60 | - | ◣ | 0.05–0.10 | - |
| 35–40 | ◣ | 0.05–0.20 | - | ◣ | 0.05–0.15 | - | ◣ | 0.05–0.10 | 0.05 |
☐ no self-healing, open crack; ◣ partly self-healed crack; wmax_s: maximum crack width to be completely closed in certain areas; 1 Debris blocking the crack.
Table 8.
Average and standard deviation of the µ-XRF composition in atomic% of self-healing products of PC-4SF20FA at a crack depth of 5 and 15 mm.
Table 8.
Average and standard deviation of the µ-XRF composition in atomic% of self-healing products of PC-4SF20FA at a crack depth of 5 and 15 mm.
| Element | Crack Depth (mm) | |
|---|---|---|
| 5 | 15 | |
| Na | 2.4 ± 2.4 | 0.9 ± 0.8 |
| Mg | 1.5 ± 0.5 | 40.4 ± 3.0 |
| Al | 4.2 ± 2.7 | 8.1 ± 2.6 |
| Si | 27.9 ± 24.8 | 21.7 ± 6.2 |
| S | 0.1 ± 0.0 | 0.2 ± 0.1 |
| K | 1.0 ± 1.0 | 0.5 ± 0.1 |
| Ca | 62.4 ± 27.3 | 26.7 ± 7.2 |
| Fe | 0.4 ± 0.2 | 0.5 ± 0.2 |
Table 9.
Variation of mineralogy of self-healing products with crack depth in mm.
| Concrete | Open Crack | Calcite | Brucite | Brucite Gel | Ettringite |
|---|---|---|---|---|---|
| PC-4SF | 0–0.5 | 0.5–30 | 8–29 | 16–29 | 38–45 |
| PC-4SF20FA | 0–2.0 | 2–25 | 9–18 | 14–32 | 32–45 |
| PC-12SF | 0–1.2 | 1.2–30 | 4–12 | 12–23 | 23–45 |
Table 10.
Colors used to present the different elements in the line scan results of Figure 11.
Table 10.
Colors used to present the different elements in the line scan results of Figure 11.
| Element | Color Code |
|---|---|
| Carbon (C) | red |
| Oxygen (O) | green |
| Magnesium (Mg) | Pink |
| Aluminium (Al) | dark grey |
| Silicon (Si) | Brown |
| Calcium (Ca) | light grey |
| Iron (Fe) | Orange |
| Sulfur (S) | Ochre |
| Chloride (Cl) | light blue |
| Sodium (Na) | dark blue |
| Potassium (K) | Violet |
Table 11.
Average and standard deviation SEM EDX composition in atomic% of at least 10 points measured in the self-healing products and M-S-H visible in Figure 11.
Table 11.
Average and standard deviation SEM EDX composition in atomic% of at least 10 points measured in the self-healing products and M-S-H visible in Figure 11.
| Ca | Mg | Al | Si | S | Na | K | O | |
|---|---|---|---|---|---|---|---|---|
| M-S-H | 2.6 ± 0.9 | 20.2 ± 2.3 | 3.7 ± 0.7 | 13.5 ± 1.1 | 0.2 ± 0.2 | 0.4 ± 0.4 | 0.3 ± 0.1 | 57.2 ± 0.8 |
| Calcite | 47.5 ± 0.5 | 0.4 ± 0.2 | 0.2 ± 0.1 | 0.1 ± 0.1 | 0.2 ± 0.2 | 1.5 ± 0.4 | 0.1 ± 0.1 | 49.9 ± 0.2 |
| Brucite | 0.9 ± 0.2 | 45.6 ± 0.8 | 0.4 ± 0.2 | 1.6 ± 0.3 | 0.1 ± 0.1 | 0.0 | 0.1 ± 0.1 | 50.1 ± 0.3 |
| Ettringite | 21.8 ± 0.7 | 0.1 ± 0.1 | 3.9 ± 1.0 | 6.9 ± 2.7 | 5.9 ± 1.9 | 0.3 ± 0.1 | 0.2 ± 0.1 | 59.9 ± 1.0 |
© 2019 by the authors. Licensee MDPI, Basel, Switzerland. This article is an open access article distributed under the terms and conditions of the Creative Commons Attribution (CC BY) license (http://creativecommons.org/licenses/by/4.0/).
Share and Cite
MDPI and ACS Style
Danner, T.; Hjorth Jakobsen, U.; Geiker, M.R. Mineralogical Sequence of Self-Healing Products in Cracked Marine Concrete. Minerals 2019, 9, 284. https://doi.org/10.3390/min9050284
AMA Style
Danner T, Hjorth Jakobsen U, Geiker MR. Mineralogical Sequence of Self-Healing Products in Cracked Marine Concrete. Minerals. 2019; 9(5):284. https://doi.org/10.3390/min9050284
Chicago/Turabian StyleDanner, Tobias, Ulla Hjorth Jakobsen, and Mette Rica Geiker. 2019. "Mineralogical Sequence of Self-Healing Products in Cracked Marine Concrete" Minerals 9, no. 5: 284. https://doi.org/10.3390/min9050284
Note that from the first issue of 2016, this journal uses article numbers instead of page numbers. See further details here.