Article

The System K2CO3–CaCO3–MgCO3 at 3 GPa: Implications for Carbonatite Melt Compositions in the Shallow Continental Lithosphere

by
Anton V. Arefiev
1,2,
Anton Shatskiy
1,2,*,
Ivan V. Podborodnikov
1,2,
Altyna Bekhtenova
1,2 and
Konstantin D. Litasov
1,2
1
Sobolev Institute of Geology and Mineralogy Siberian Branch Russian Academy of Science, Novosibirsk 630090, Russia
2
Department of Geology and Geophysics, Novosibirsk State University, Novosibirsk 630090, Russia
*
Author to whom correspondence should be addressed.
Minerals 2019, 9(5), 296; https://doi.org/10.3390/min9050296
Submission received: 26 April 2019 / Revised: 13 May 2019 / Accepted: 14 May 2019 / Published: 15 May 2019

Abstract

:
Potassic dolomitic melts are believed to be responsible for the metasomatic alteration of the shallow continental lithosphere. However, the temperature stability and range of compositions of these melts are poorly understood. In this regard, we performed experiments on phase relationships in the system K2CO3–CaCO3–MgCO3 at 3 GPa and at 750–1100 °C. At 750 and 800 °C, the system has five intermediate compounds: Dolomite, Ca0.8Mg0.2CO3 Ca-dolomite, K2(Ca≥0.84Mg≤0.16)2(CO3)3, K2(Ca≥0.70Mg≤0.30)(CO3)2 bütschliite, and K2(Mg≥0.78Ca≤0.22)(CO3)2. At 850 °C, an additional intermediate compound, K2(Ca≥0.96Mg≤0.04)3CO3)4, appears. The K2Mg(CO3)2 compound disappears near 900 °C via incongruent melting, to produce magnesite and a liquid. K2Ca(CO3)2 bütschliite melts incongruently at 1000 °C to produce K2Ca2(CO3)3 and a liquid. K2Ca2(CO3)3 and K2Ca3(CO3)4 remain stable in the whole studied temperature range. The liquidus projection of the studied ternary system is divided into nine regions representing equilibrium between the liquid and one of the primary solid phases, including magnesite, dolomite, Ca-dolomite, calcite-dolomite solid solutions, K2Ca3(CO3)4, K2Ca2(CO3)3, K2Ca(CO3)2 bütschliite, K2Mg(CO3)2, and K2CO3 solid solutions containing up to 24 mol % CaCO3 and less than 2 mol % MgCO3. The system has six ternary peritectic reaction points and one minimum on the liquidus at 825 ± 25 °C and 53K2CO3∙47Ca0.4Mg0.6CO3. The minimum point resembles a eutectic controlled by a four-phase reaction, by which, on cooling, the liquid transforms into three solid phases: K2(Mg0.78Ca0.22)(CO3)2, K2(Ca0.70Mg0.30)(CO3)2 bütschliite, and a K1.70Ca0.23Mg0.07CO3 solid solution. Since, at 3 GPa, the system has a single eutectic, there is no thermal barrier for liquid fractionation from alkali-poor toward K-rich dolomitic compositions, more alkaline than bütschliite. Based on the present results we suggest that the K–Ca–Mg carbonate melt containing ~45 mol % K2CO3 with a ratio Ca/(Ca + Mg) = 0.3–0.4 is thermodynamically stable at thermal conditions of the continental lithosphere (~850 °C), and at a depth of 100 km.

Graphical Abstract

1. Introduction

Two possible scenarios of the carbonatite melt formation in the mantle were recently suggested. The first one is a partial melting of hydrothermally-altered basaltic crust (carbonated eclogites) [1] and overlying marine sediments (carbonated pelites) [2] subducted to 500–600 km depths, and stagnating in the transition zone. Partial melting at this depth occurs, owing to destabilization of Na-bearing clinopyroxene and the redistribution of Na into a fusible carbonate assemblage, including Na2Ca4(CO3)5 and magnesite [1].
The melt at this depth has an Na-rich dolomitic composition [1,2]. Natural samples with such melt composition were found as inclusions in superdeep diamonds [3,4,5], in olivines from the deepest known xenoliths of sheared lherzolites and harzburgites [6,7], and in olivine phenocrysts and xenocrysts from kimberlites [8,9]. Thus, the Na-dolomitic melt could ascend from the mantle transition zone to the continental lithosphere, contributing to kimberlitic magmatism as a precursor melt (e.g., [10]), and in diamond formation as a solvent-catalyst and carbon source. These findings emphasize the importance of studying the Na2CO3–CaCO3–MgCO3 system under mantle pressures, which were performed recently at 3 and 6 GPa [11,12].
The second scenario of the formation of mantle carbonatite melt involves the partial melting of carbonated pelite subducted to a 200 km depth [2]. At this depth, Na is compatible, and mainly hosted by refractory clinopyroxene. In contrast, K is incompatible, and enters potassium feldspar or phengite if the water is present in the system. These phases readily react with dolomite at the temperature conditions of “hot” subduction (1100 °C) and yield the K-rich dolomitic melt composition [2]. Inclusions of such melts were found in “fibrous” [13,14,15,16,17,18,19] and gem-quality diamonds [20] worldwide, carried out by kimberlites from the base of subcontinental lithospheric mantle. It was also shown experimentally that these K-rich dolomitic melts can coexist with peridotite under geothermal conditions corresponding to the base of the continental lithospheric mantle [21,22,23], and could be responsible for the diamond formation as a solvent-catalyst and carbon source [24,25].
The previous works stimulated a systematic study of K-bearing carbonate systems including K2CO3–CaCO3–MgCO3 at 6 GPa (pressure conditions suggested for diamond and kimberlite formation) [26,27,28,29]. The results of this study reveal the impact of alkalinity on the minimum temperature stability of K–Ca–Mg carbonate melts at 200 km depth, and clearly indicate that K-rich carbonate melts are stable at the moderate temperature conditions of a cratonic geotherm.
Upward percolation of alkali- and carbonate-rich melts has been widely invoked to explain metasomatic enrichment and wehrlitization in the shallower levels of the subcratonic mantle lithosphere [30,31,32,33,34]. It was also found that high electrical conductivity of these melts measured experimentally at high pressures [35] can account for the conductivity anomalies observed in the lithospheric mantle 80–120 km beneath the Slave craton (NE Canada) [36,37] and >120 km beneath the São Francisco craton (SE Brazil) [38]. Findings of Na–K–Ca–Mg-rich carbonate-dominated melt inclusions in a spinel harzburgite originating from 110 to 115 km depths, indicate that alkali-carbonatite melts could also penetrate to the shallow lithospheric mantle [39]. Yet, an exact melt composition and the possibility of their existence in the shallow continental lithosphere remain unclear. It is therefore important to know phase relations in alkali-alkaline earth carbonate systems under shallow mantle pressures.
As a part of a project on phase equilibria studies aimed at the origin of mantle-derived carbonates and their melts, in this paper, we have determined the subsolidus and liquidus phase relations in the K2CO3–CaCO3–MgCO3 join at 3 GPa. Based on the results and previous data on this system at 6 GPa [29], the P-T range of stability and general compositional trends for the K-bearing carbonatite melts ascending through the mantle lithosphere were suggested.

2. Materials and Methods

2.1. High-Pressure Technique

Experiments were run on the “Discoverer-1500” DIA-type multianvil apparatus [40] at IGM SB RAS in Novosibirsk, Russia. The second-stage anvils consisted of eight “Fujilloy N-05” 26-mm tungsten carbide cubes with a truncation edge length of 12 mm. A 20.5-mm octahedron with ground edges and corners made of semi-sintered ZrO2 (OZ-8C, MinoYogyo Co., Ltd., Mizunami, Japan [41]) was employed as a pressure medium. Pyrophyllite gaskets, 4.0 mm in both width and thickness were used to seal the compressed volume and support the anvil flanks.
The cell assembly design is described by Shatskiy, et al. [42]. The cell contains four graphite cassettes (i.e., multiple sample holders) allowing simultaneous study of 16 samples in a single run. The heating was achieved using a tubular graphite heater, 4.5/4.0 mm outer/inner diameter and 11 mm length. The sample temperature was monitored via a W97Re3-W75Re25 thermocouple inserted in the heater center via walls and electrically insulated by Al2O3 tubes. No correction for the effect of pressure on the thermocouple electromotive force was applied.
The temperature gradients in the cell were examined using thermal modeling software [43]. The results of modeling were also verified experimentally [26] using a two-pyroxene thermometer [44]. The maximum temperature gradients within individual samples and across the sample charge varies from 4–5 to 6–8 °C/mm as temperature increases from 800 to 1300 °C, respectively. We also found no difference in the phase composition of identical samples loaded in different cassettes.
Details of pressure calibration were reported previously [42]. Deviation of pressure from the desirable value during heating to 900 °C in the given cell and press load of 3 MN did not exceed ±0.1 GPa, as confirmed by comparison of pressure calibration at room temperature and 900 °C.
Our experiments conducted in graphite capsules may correspond to approximate fO2 conditions close to the graphite–carbon dioxide (CCO) buffer.
The experiments were performed by compression to a load of 3.0 MN (corresponding to a pressure of 3 GPa), and then heating to a target temperature at a rate of 25–50 °C/min. The temperature was maintained within 2.0 °C of the desired value in a temperature control mode at a constant press load. The experiments were finished by turning off the heater power, resulting in a temperature drop to ambient in a few seconds, followed by slow decompression.

2.2. Starting Materials

Starting materials were prepared by blending reagent grade K2CO3, CaCO3, and natural magnesite (<0.1 mol % impurities) or dolomite (<0.3 mol % impurities) from Brumado (Bahia, Brazil) in an agate mortar with acetone, and loaded as a powder into graphite cassettes. Since K2CO3 is a hygroscopic material, special attention for sample preparation was given to minimize the amount of moisture in the sample absorbed from the atmosphere. The loaded cassettes were dried at 300 °C for 1–2 h. Prepared assemblies were stored at 200 °C in a vacuum for ≥12 h prior to the experiment. All experiments were conducted at 15–35% indoor humidity.

2.3. Analytical Technique
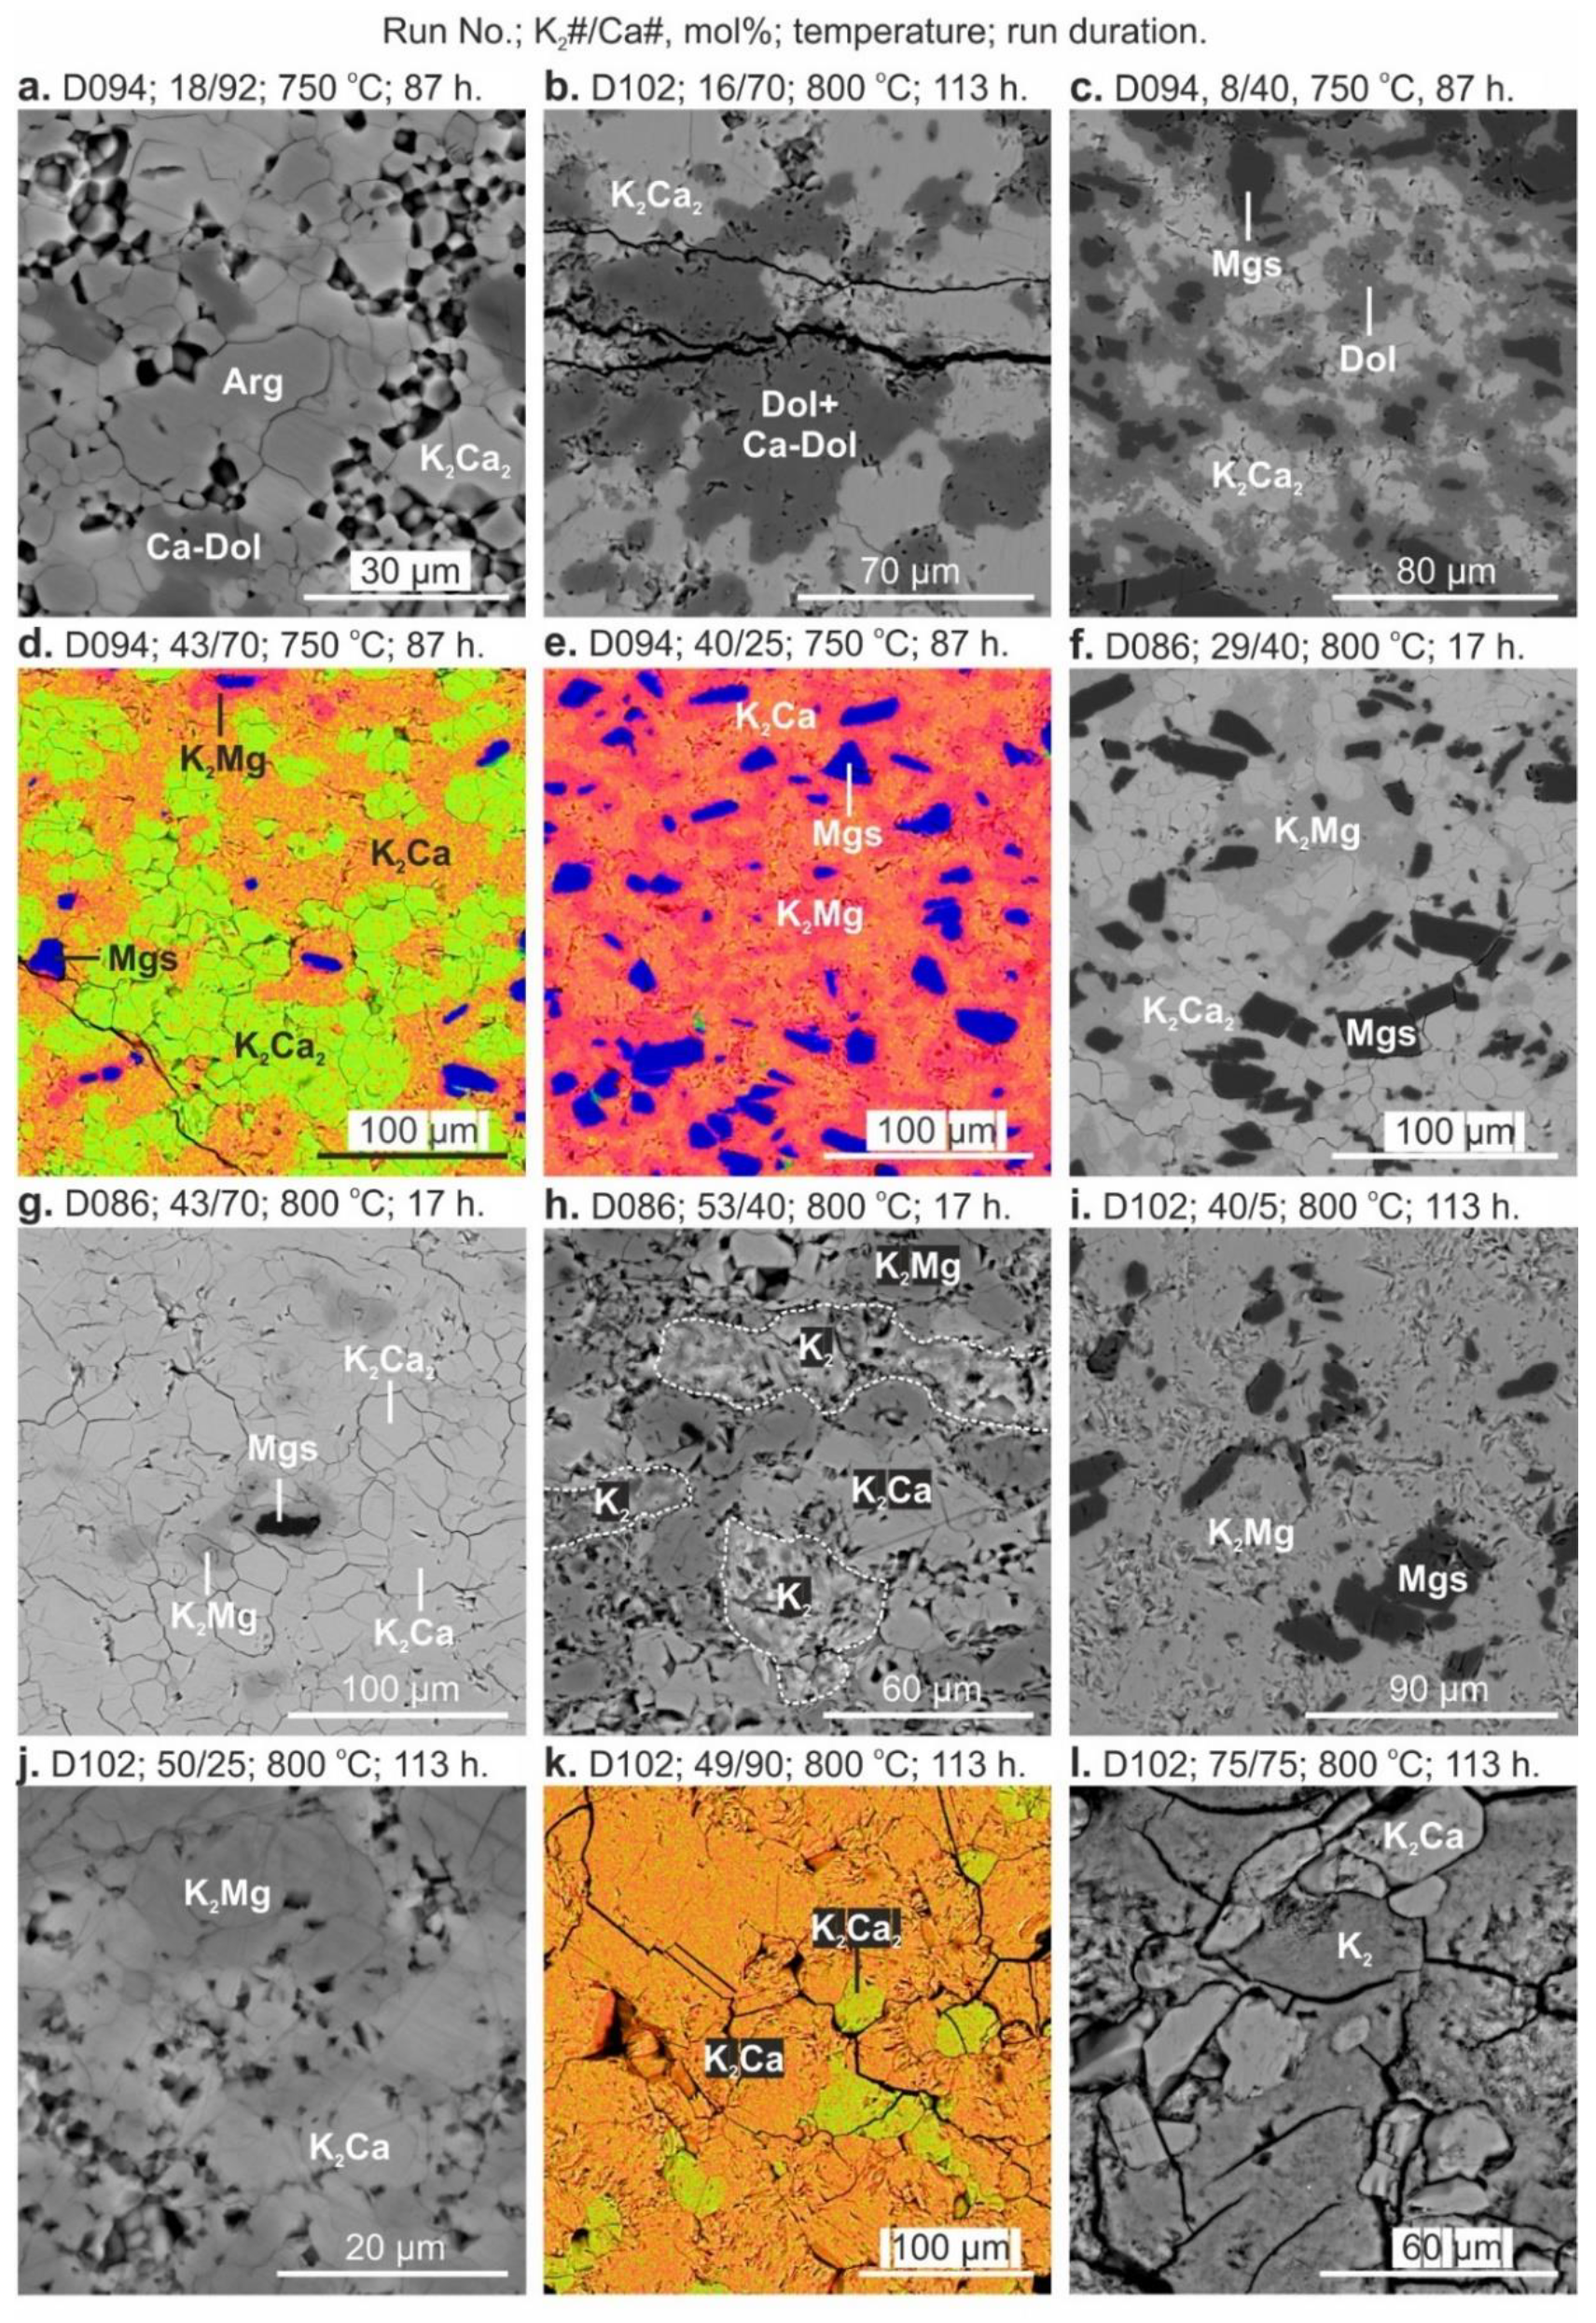
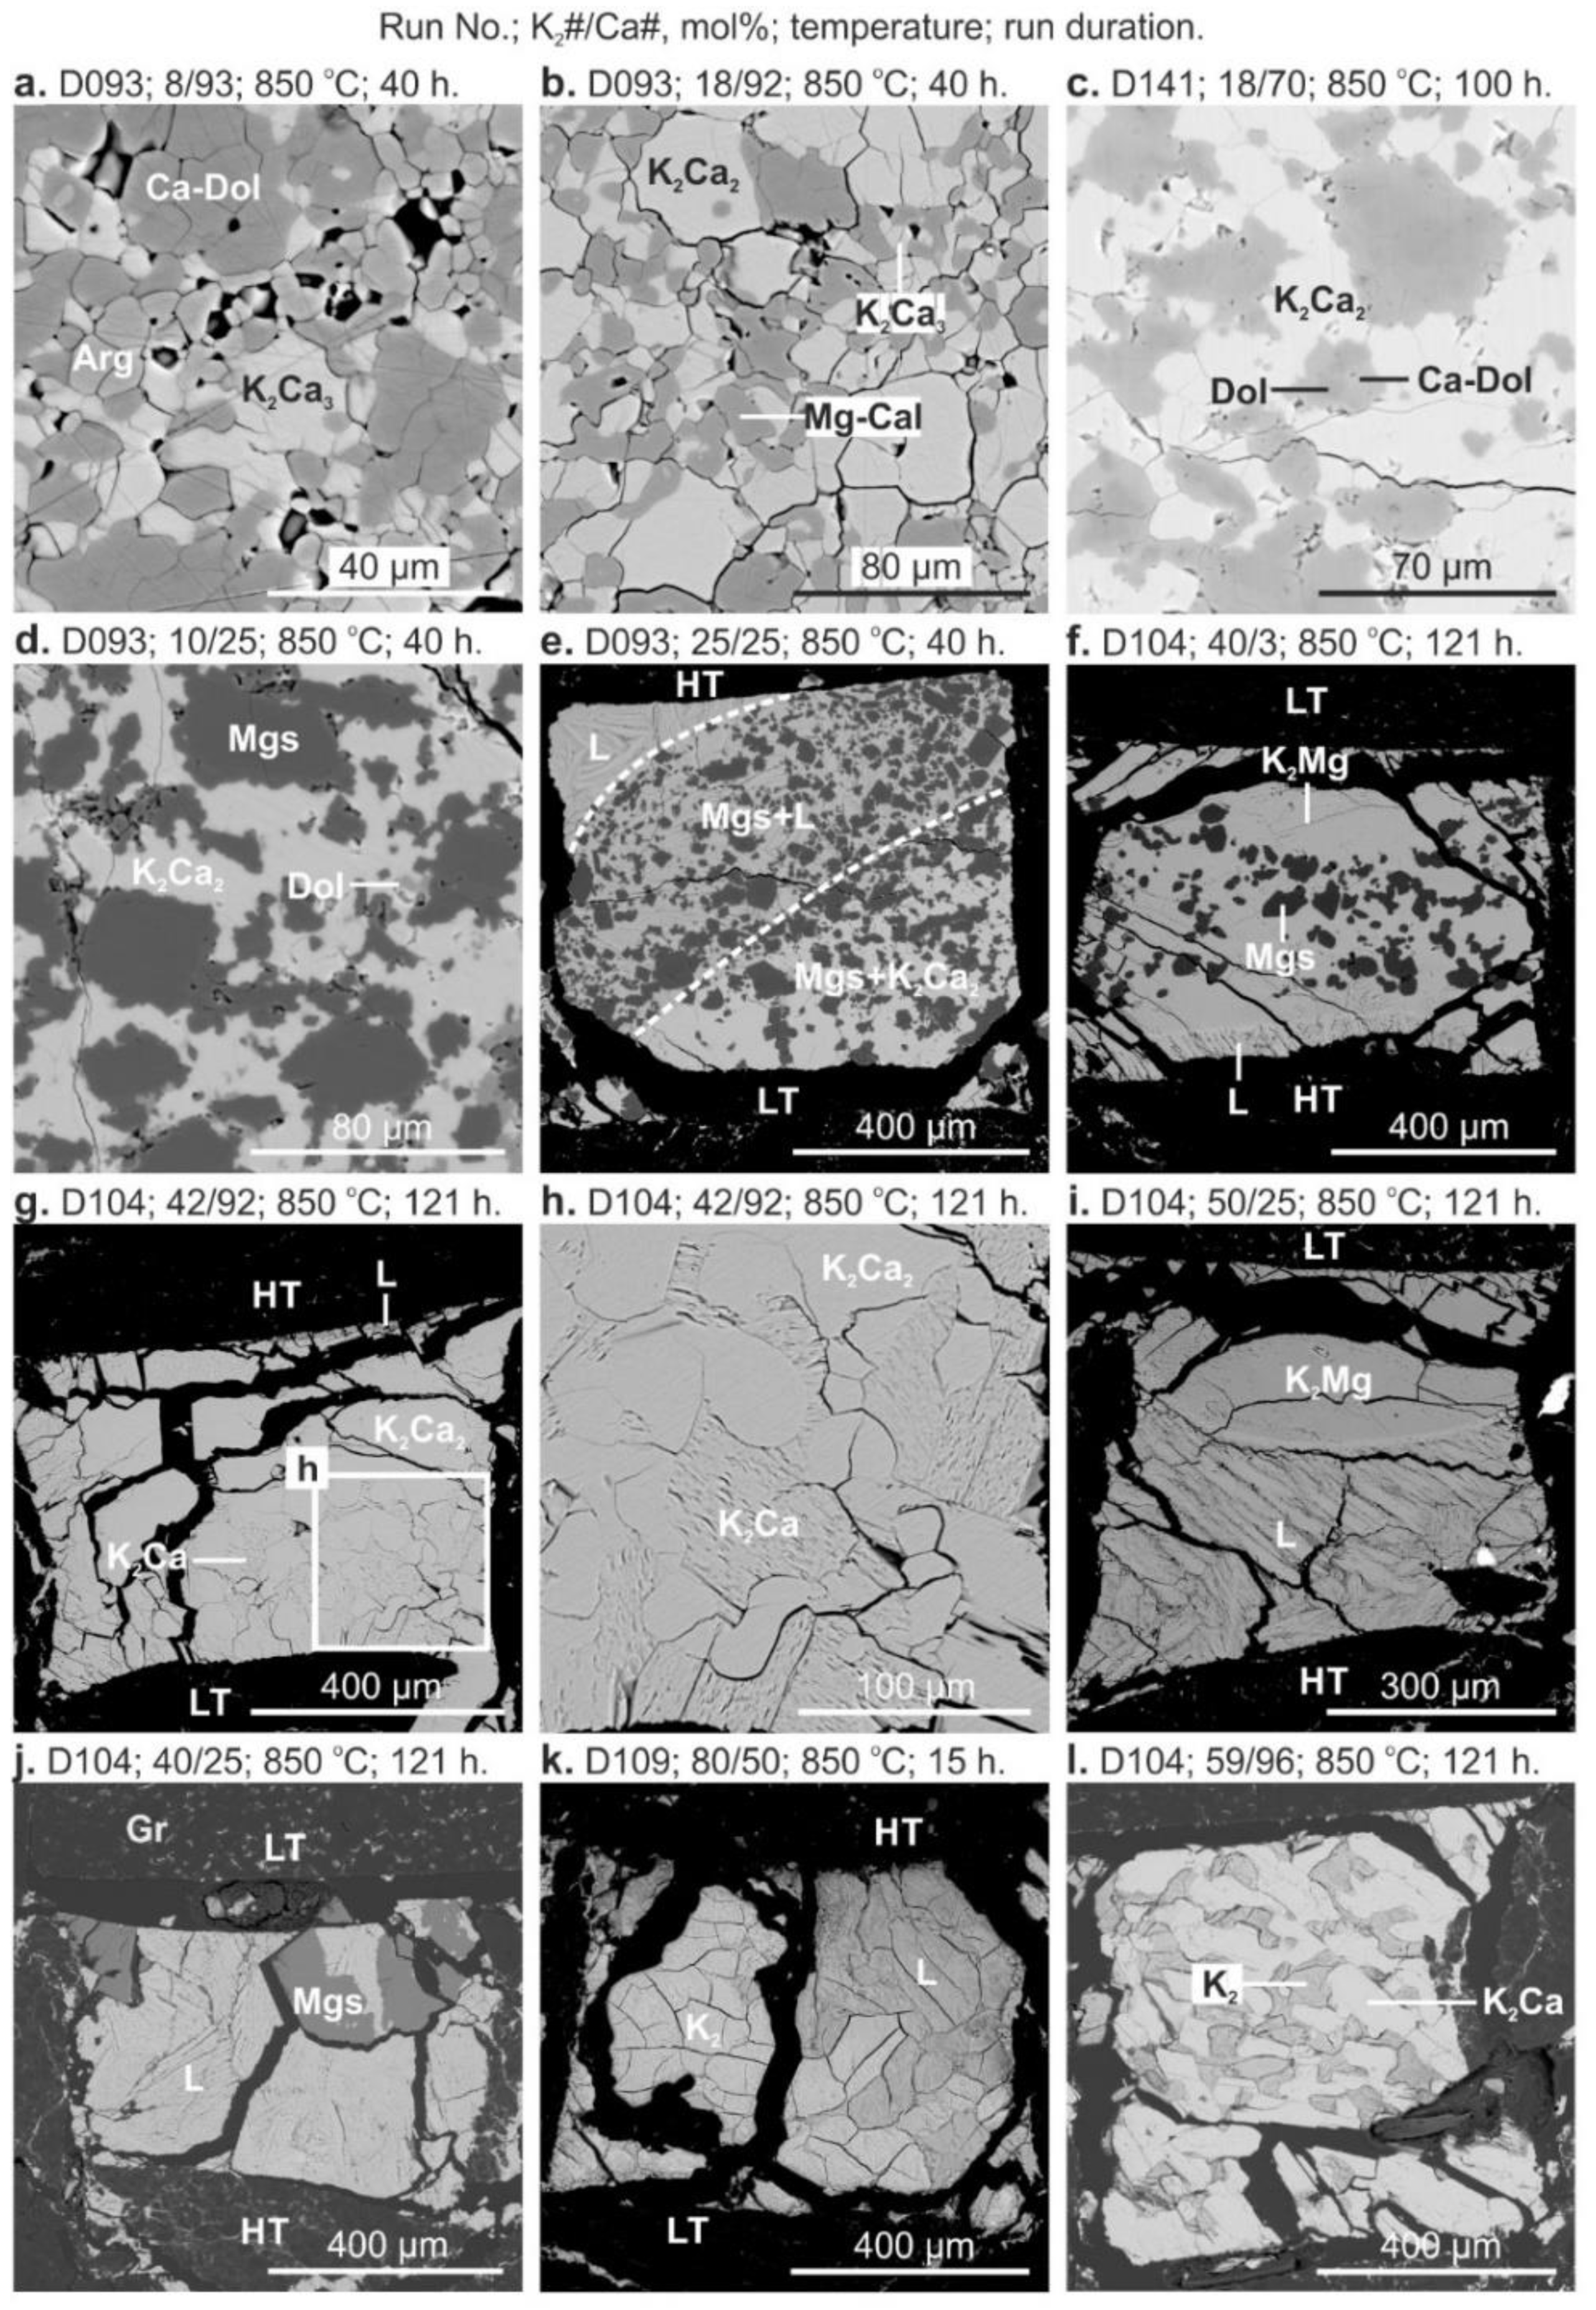
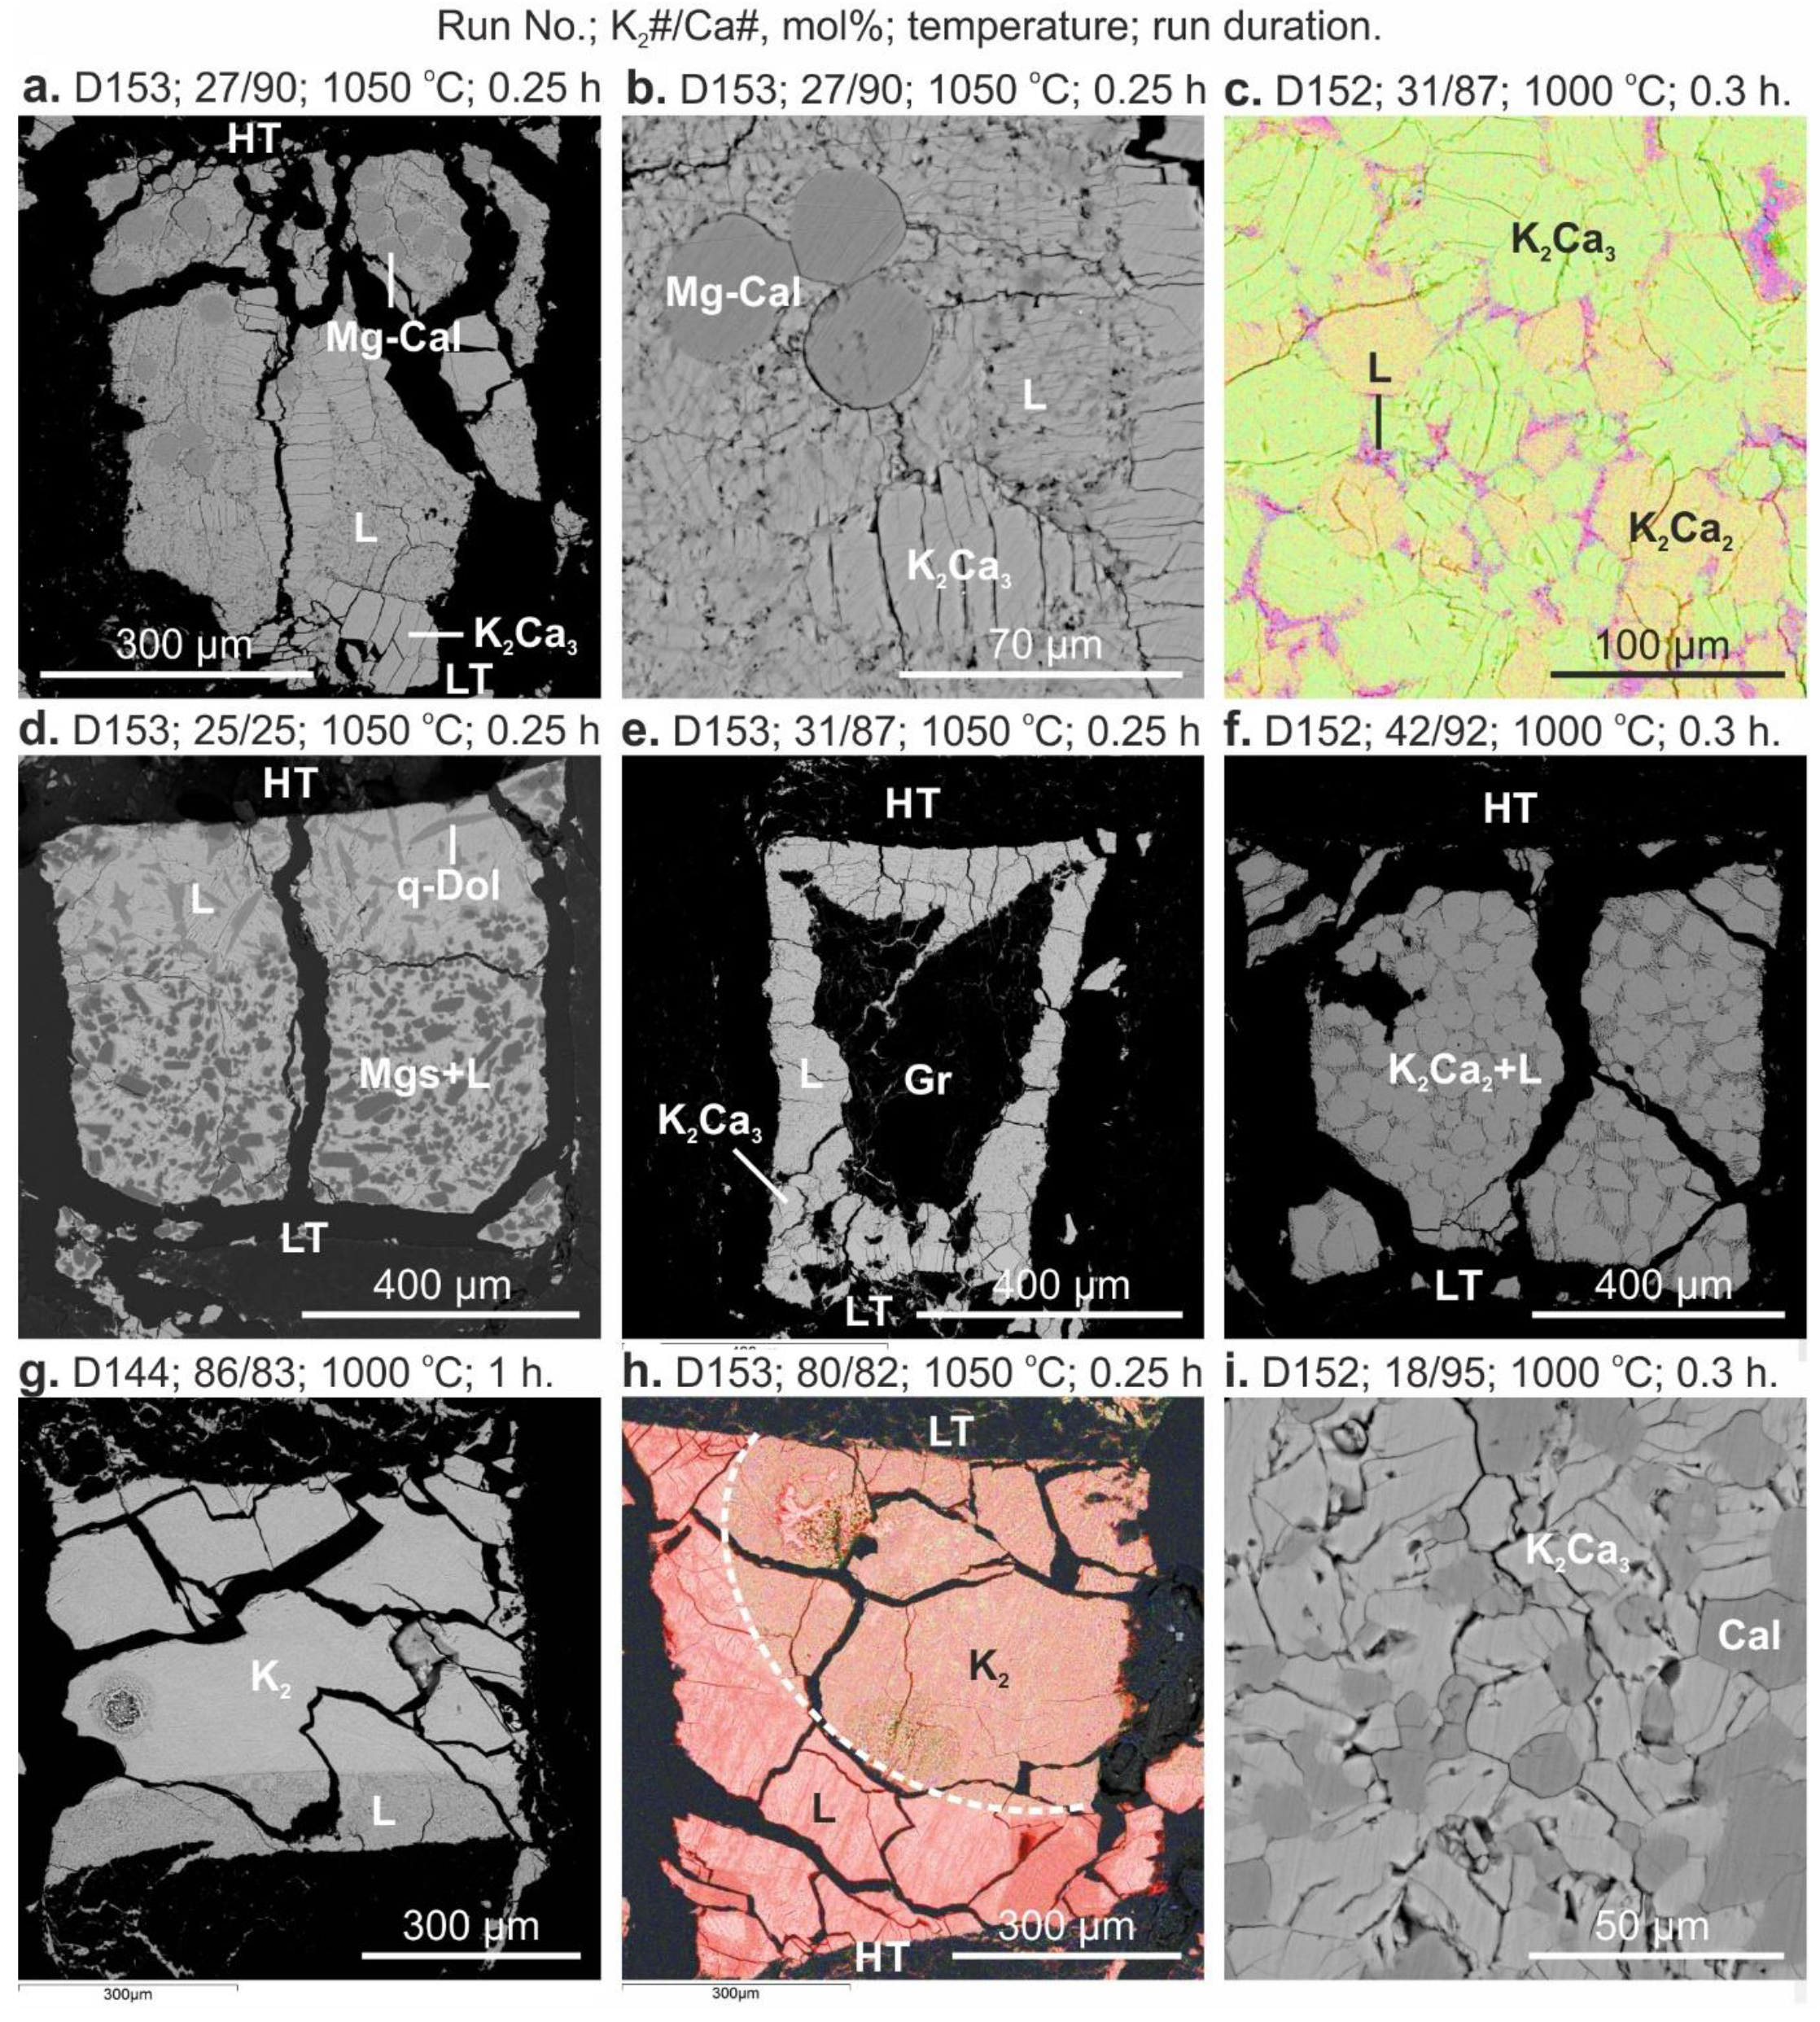
After the experiments were completed, the recovered graphite cassettes were immediately filled with epoxy in a vacuum. Then cassettes were cut using a low-speed diamond saw to get a nearly axial, vertical cross-sections of samples. The obtained specimens were mounted in a plexiglass holder with epoxy and polished in low-viscosity oil using 400(37)-, 1000(13)-, and 1500(9)-mesh(μm) sandpaper. The sample surface was cleaned using an oil spray between each step of polishing. The final polishing was done on a satin cloth with 3 µm diamond paste and oil spray. We used petroleum benzene to remove the oil after polishing. The clean samples were stored in petroleum benzene prior to carbon coating and loading into a scanning electron microscope.
Samples were studied using a MIRA 3 LMU scanning electron microscope (Tescan Orsay Holding, Brno-Kohoutovice, Czech Republic), coupled with an INCA energy-dispersive X-ray microanalysis system 450, equipped with the liquid nitrogen-free Large area EDS X-Max-80 Silicon Drift Detector (Oxford Instruments Nanoanalysis Ltd., High Wycombe, UK) at IGM SB RAS [45]. It is generally accepted that unlike wavelength dispersive X-ray spectroscopy (WDS), energy dispersive X-ray spectroscopy (EDS) is a semi-quantitative method. But that is no longer true. Modern energy-dispersive spectrometers, such as that employed in this study, give a quantitative analysis, whose accuracy approaches to WDS in case of routine analysis of rock-forming minerals [45]. We also need to emphasize that the accuracy of the WDS analysis decreases dramatically in the case of alkali carbonate samples.
Energy-dispersive X-ray spectra (EDS) were collected by using an electron beam-rastering method, in which the stage is stationary, while the electron beam moves over the surface area, with dimensions 5–50 μm (for mineral phases) and 50–500 μm (for a quenched melt) at 20 kV accelerating voltage and 1.5 nA beam current. Live counting time for X-ray spectra was 20 s. The correctness of the EDS measurements was confirmed under the same conditions using post-experimental samples with known compositions and homogeneous textures obtained below the solidus and above the liquidus (Tables S1–S21 in Supplementary information).
The use of EDS coupled with the electron beam-rastering method rather than WDS in the stationary electron beam mode, is due to the following reasons: (1) EDS has much lower beam current than WDS (1.0–1.5 nA and 15–20 nA, respectively). Therefore, EDS is more suitable for the analysis of alkali-rich carbonates, which become unstable (i.e., decompose and evaporate) under the strong electron beam. (2) The defocusing of the electron beam of WDS to minimize sample damage is hardly applicable for many experimental samples, due to small sizes of carbonate grains and melt segregations. Furthermore, each change in beam diameter and current requires calibration. (3) EDS allows obtaining the integral compositions of an area of an irregular shape by scanning it using a thin (0.1 μm) electron beam. This also reduces the damage (evaporation) to the sample, which unavoidably occurs in case of a stationary electron beam. In addition, this is important for the analysis of melt, quenched to an aggregate of dendritic crystals rather than into homogeneous glass.

3. Results

The results of the experiments in the system K2CO3–CaCO3–MgCO3 including compositions of recovered samples and chemical compositions of obtained carbonate phases, are summarized in Tables S1–S21. Backscattered electron (BSE) images of post-experimental samples are shown in Figure 1, Figure 2, Figure 3, Figure 4 and Figure 5. The isothermal sections of the T-X ternary diagram are shown in Figure 6. A list of abbreviations is given in the Nomenclature Section.
At 750 °C (run D094, 87 h) and 800 °C (runs D086, 17 h and D102, 113 h) the diagram contains six three-phase regions (Figure 6a,b, Tables S1–S3). Four regions are the same: Arg + K2Ca2 + Ca-Dol (Figure 1a), Ca-Dol + K2Ca2 + Dol (Figure 1b), Dol + K2Ca2 + Mgs (Figure 1c), and K2Ca + K2 + K2Mg (Figure 1h). However, two of the three-phase regions are different compared to the others. The Mgs + K2Ca2 + K2Ca (Figure 1d) and Mgs + K2Ca + K2Mg (Figure 1e) regions appear at 750 °C, whereas Mgs + K2Ca2 + K2Mg (Figure 1f) and K2Ca + K2Mg + K2Ca2 regions were established at 800 °C (Figure 1g). These results suggest that the following subsolidus reaction occurs as temperature increases from 750 to 800 °C: Mgs + K2Ca → K2Ca2 + K2Mg. The K2Ca2 and K2Ca compounds dissolve up to 16 and 30 mol % of Mg component, respectively, whereas K2Mg dissolves up to 22 mol % of Ca component (Figure 6a,b). The compositions of these compounds can be approximated as follows: K2(Ca≥0.84Mg≤0.16)2(CO3)3, K2(Ca≥0.70Mg≤0.30)(CO3)2, and K2(Mg≥0.78Ca≤0.22)(CO3)2 (Tables S1 and S2). K2CO3 dissolves up to 11 mol % CaCO3 and minor amounts of MgCO3 (Figure 6a,b). The existence of limited solid solutions yields wide two-phase regions of K2Ca2 + K2Ca (Figure 1k), K2Ca + K2 (Figure 1l), Mgs + K2Mg (Figure 1i), K2Mg + K2. Although a mutual solubility of K2Mg and K2Ca compounds is noticeable, a miscibility gap between these phases was clearly observed (Figure 1j).
As temperature increases to 850 °C (runs D093, 40 h; D104, 121 h; D109, 15 h; D141, 100 h; D142, 12 h), the diagram undergoes significant changes, including an appearance of an additional intermediate compound, K2(Ca≥0.96Mg≤0.04)3CO3)4, and a partial melt containing 40–60 mol % K2CO3 with Ca# varying from 0 to 75 mol % (Figure 6c, Tables S4–S8). At this temperature, the diagram contains four subsolidus three-phase fields: Arg + K2Ca3 + Mg-Cal (Figure 2a), Mg-Cal + K2Ca3 + K2Ca2 (Figure 2b), Dol + Ca-Dol + K2Ca2 (Figure 2c), and Mgs + Dol + K2Ca2 (Figure 2d); and four liquid-bearing three-phase fields: Mgs + K2Ca2 + L (Figure 2e), Mgs + K2Mg + L (Figure 2f), K2Ca2 + K2Ca + L (Figure 2g,h), and K2Ca + K2 + L. The melt field is surrounded by five two-phase fields: K2Mg + L (Figure 2i), Mgs + L (Figure 2j), K2Ca2 + L, K2Ca + L, and K2 + L (Figure 2k). The subsolidus two-phase fields adjoined to the K–Ca side of the diagram include Arg + K2Ca3, K2Ca3 + K2Ca2, K2Ca2 + K2Ca, and K2Ca + K2 (Figure 2l).
At 900 °C (runs D082, 15 h; D087, 15 h; D097, 16 h; D105, 14 h; D110, 3 h; and D143, 2h), the K2Mg(CO3)2 compound disappears via incongruent melting to produce magnesite and liquid in accordance with phase relations established in the K2CO3–MgCO3 binary [46]. The four subsolidus three-phase fields remain the same (Figure 6d, Tables S9–S14), but two of them, Arg + K2Ca3 + Mg-Cal and Mg-Cal + K2Ca3 + K2Ca2 (Figure 3a), become narrow, owing to expanding neighboring two-phase fields, Mg-Cal + K2Ca3 (Figure 3b) and Mg-Cal + K2Ca2 (Figure 3c). The melt field is surrounded by four two-phase fields: Mgs + L (Figure 3d), K2Ca2 + L (Figure 3e), K2Ca + L (Figure 3f), and K2 + L; and by three three-phase fields: Mgs + K2Ca2 + L (Figure 3g), K2Ca2 + K2Ca + L (Figure 3h), and K2Ca + K2 + L (Figure 3i).
At 950 °C (runs D116, 30 min; D118, 40 h; and D145, 1 h), the diagram contains two subsolidus three-phase fields Mg-Cal + K2Ca3 + K2Ca2 (Figure 4a) and Arg + K2Ca3 + Mg-Cal. The latter is inferred from phase relations established in the CaCO3–MgCO3 and K2CO3–CaCO3 binaries [42,47] (Figure 6e, Tables S15–S17). The melt field is surrounded by six two-phase fields: Mgs + L (Figure 4b), Dol + L, Ca-Dol + L (Figure 4c), K2Ca2 + L (Figure 4d), K2Ca + L, and K2 + L; and by five three-phase fields: Dol + Mgs + L (Figure 4f), Dol + Ca-Dol + L, Ca-Dol + K2Ca2 + L, K2Ca2 + K2Ca + L, and K2Ca + K2 + L.
As temperature increases to 1000 °C, K2Ca(CO3)2 disappears via incongruent melting to produce K2Ca2(CO3)3 and liquid containing 53 mol % K2CO3 [47]. Besides, aragonite transforms to calcite at about 960 °C [47]. At 1000 °C (runs D144, 1 h and D152, 20 min) and 1050 °C (run D153, 15 min), the diagram contains three liquid-bearing three-phase fields: Dol + Mgs + L, Mg-Cal + K2Ca3 + L (Figure 5a,b), and K2Ca3 + K2Ca2 + L (Figure 5c). The melt field is surrounded by five two-phase fields: Mgs + L (Figure 5d), Cal-Dol + L, K2Ca3 + L (Figure 5e), K2Ca2 + L (Figure 5f), and K2 + L (Figure 5g,h). Two subsolidus two-phase fields are still remaining: Cal + K2Ca3 (Figure 5i) and K2Ca3 + K2Ca2 (Figure 6f,g, Tables S18–S20).
At 1100 °C (run D155, 10 min), three two-phase fields and one three-phase field were established. In addition, the narrow two-phase fields of Cal + K2Ca3, K2Ca3 + L, and K2Ca2 + L were inferred from phase relations established in the K2CO3–CaCO3 binary [47] (Figure 6h, Table S21). The K2Ca3(CO3)4 and K2Ca2(CO3)3 compounds disappear just above 1100 °C. The first one melts incongruently to produce calcite and liquid, whereas the second melts congruently [47].
Significant amounts of Ca, and to a lesser extent, Mg in K2CO3, recovered from experiments at 750–1000 °C and 3 GPa determined by EDS, suggest dissolution of the CaCO3 and minor MgCO3 components in the K-carbonate as a solid solution under given conditions (Supplementary Tables S1, S2, S5, S6, S13, S14, and S18). The maximum CaCO3 and MgCO3 solubility in potassium carbonate of about 20–24 and 1–2 mol%, respectively, was established at 850–900 °C (Figure 6, Supplementary Tables S6 and S13). In contrast, the K2CO3 content in alkaline earth carbonates (aragonite, calcite, calcite-dolomite solid solutions, and magnesite) does not exceed the detection limit of EDS employed in our study (i.e., <0.5 mol %), regardless of the composition of the starting mixture, Dol or Mgs + Cal (Supplementary Tables S1–S21).
Near-liquidus phase relations in the K2CO3–CaCO3–MgCO3 system are illustrated in Figure 7. There are nine primary phase fields characterized by the initial crystallization of Mgs (Figure 2j, Figure 3d, Figure 4b and Figure 5d), Dol (inferred), Ca-Dol (Figure 4c and Figure 6e), Cal-Dol solid solutions (Figure 6e–h), K2Ca3 (Figure 5e and Figure 6f–h ), K2Ca2 (Figure 3e, Figure 4d and Figure 5f), K2Ca (Figure 3f), K2Mg (Figure 2i), and K2 (Figure 2k, Figure 4e and Figure 5g,h ). As can be seen in Figure 7, the system has no thermal barrier for liquid fractionation toward the K-rich compositions. The system has six ternary peritectic reaction points, and one minimum on the liquidus at 825 ± 25 °C and 53K2CO3∙47Ca0.4Mg0.6CO3, which resemble a K2Mg–K2Ca–K2 eutectic point (Figure 7).

4. Discussion

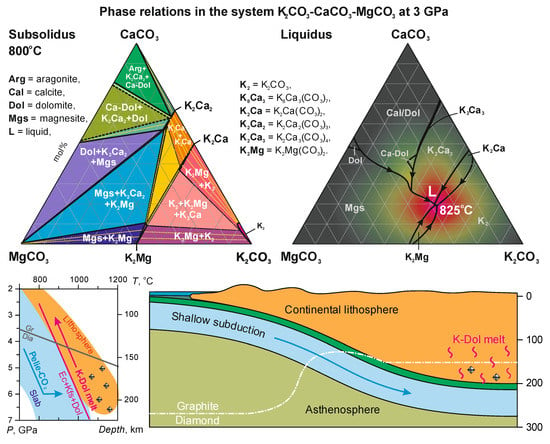
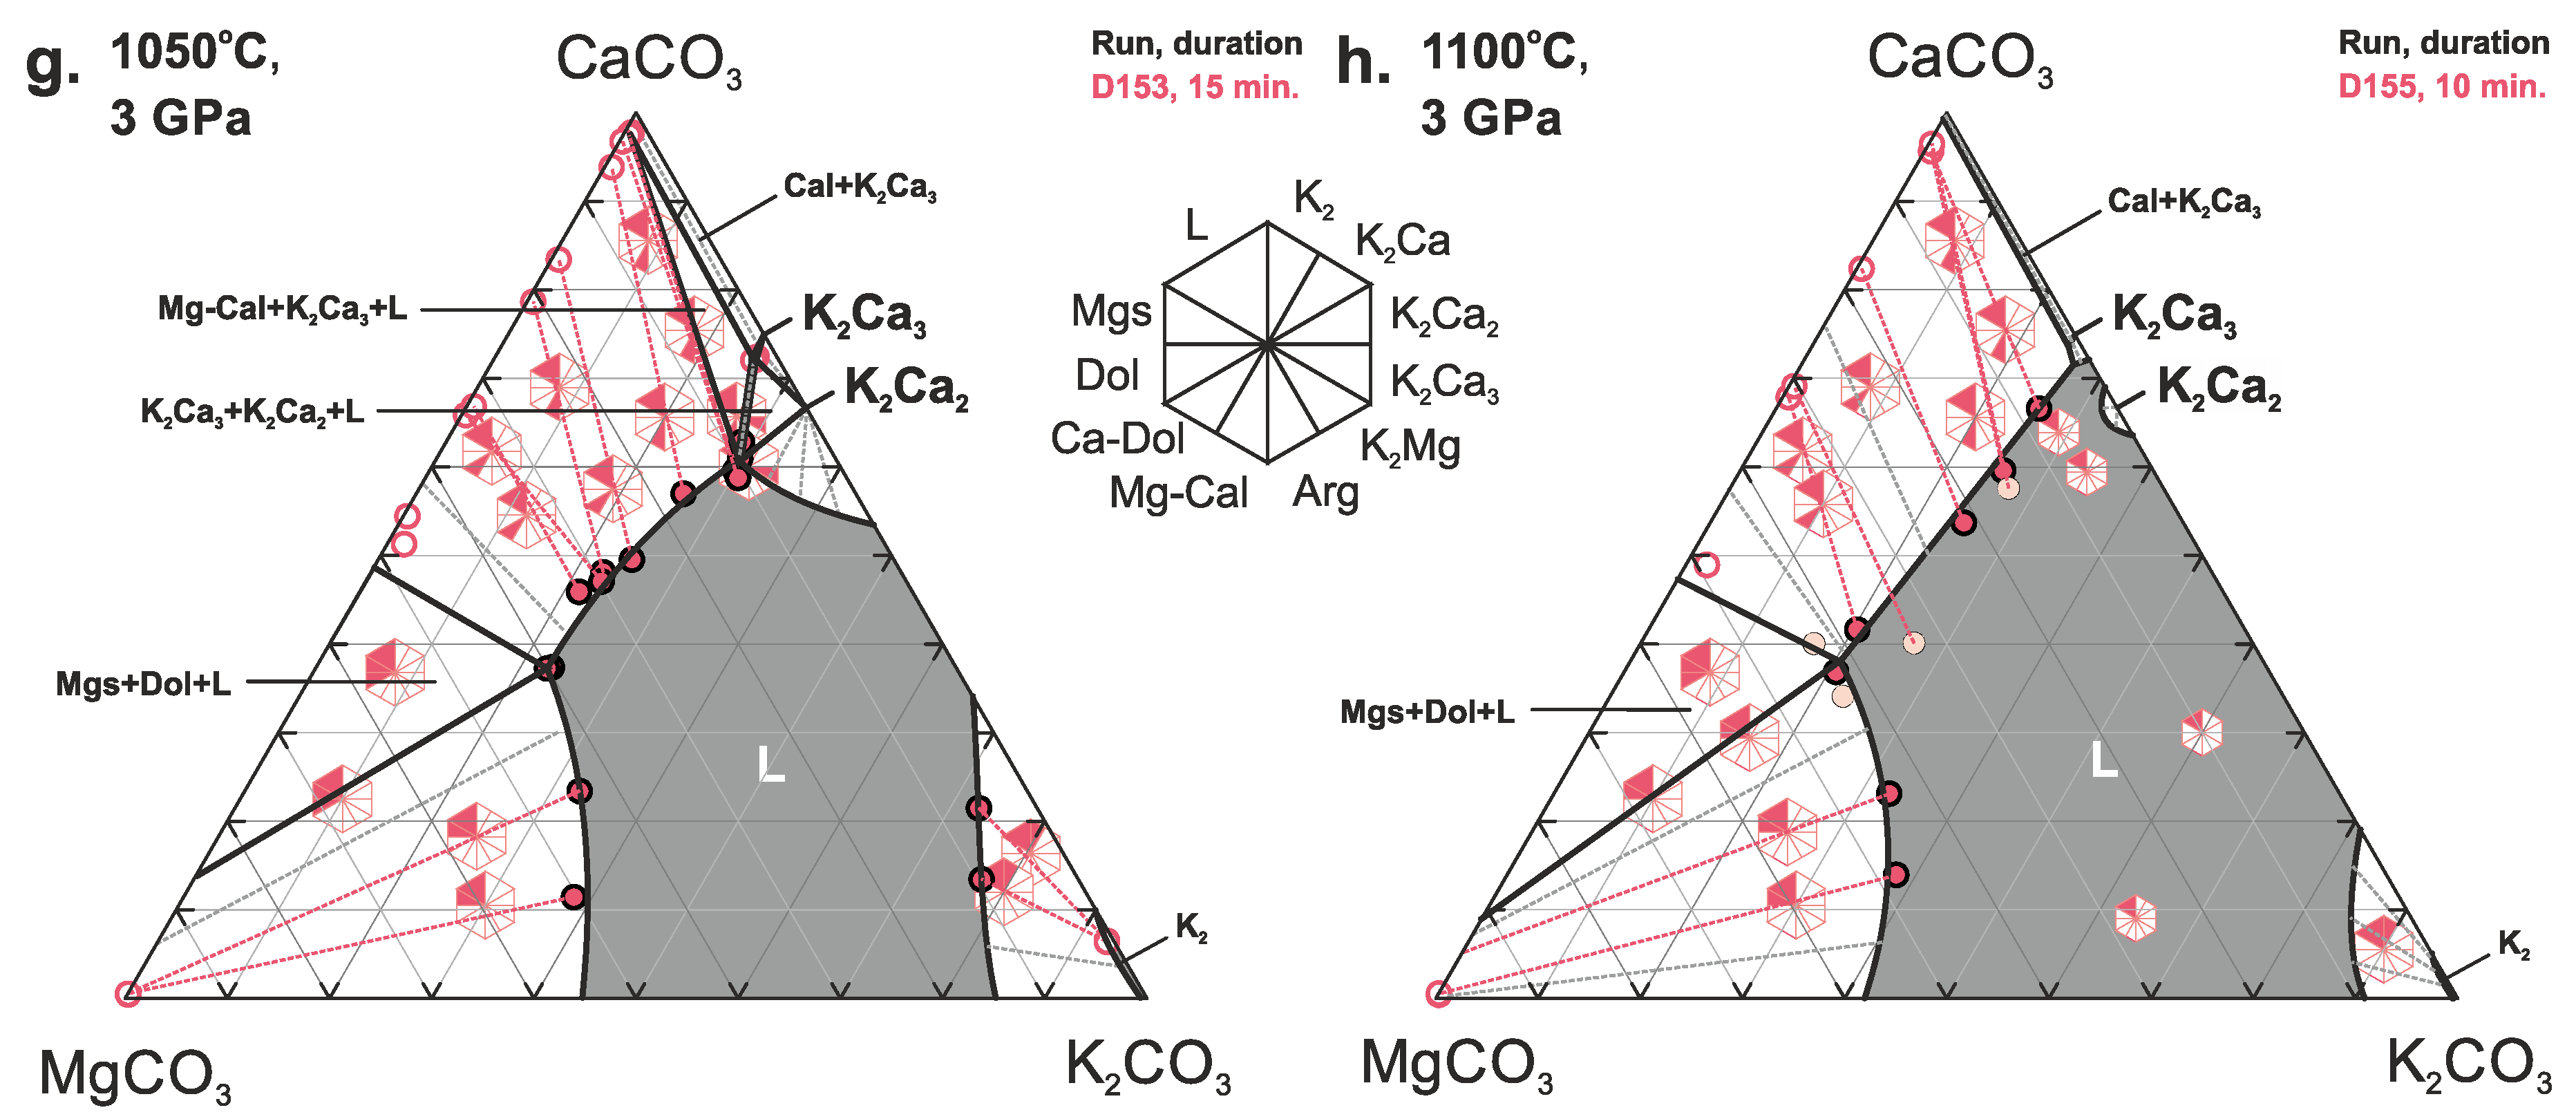
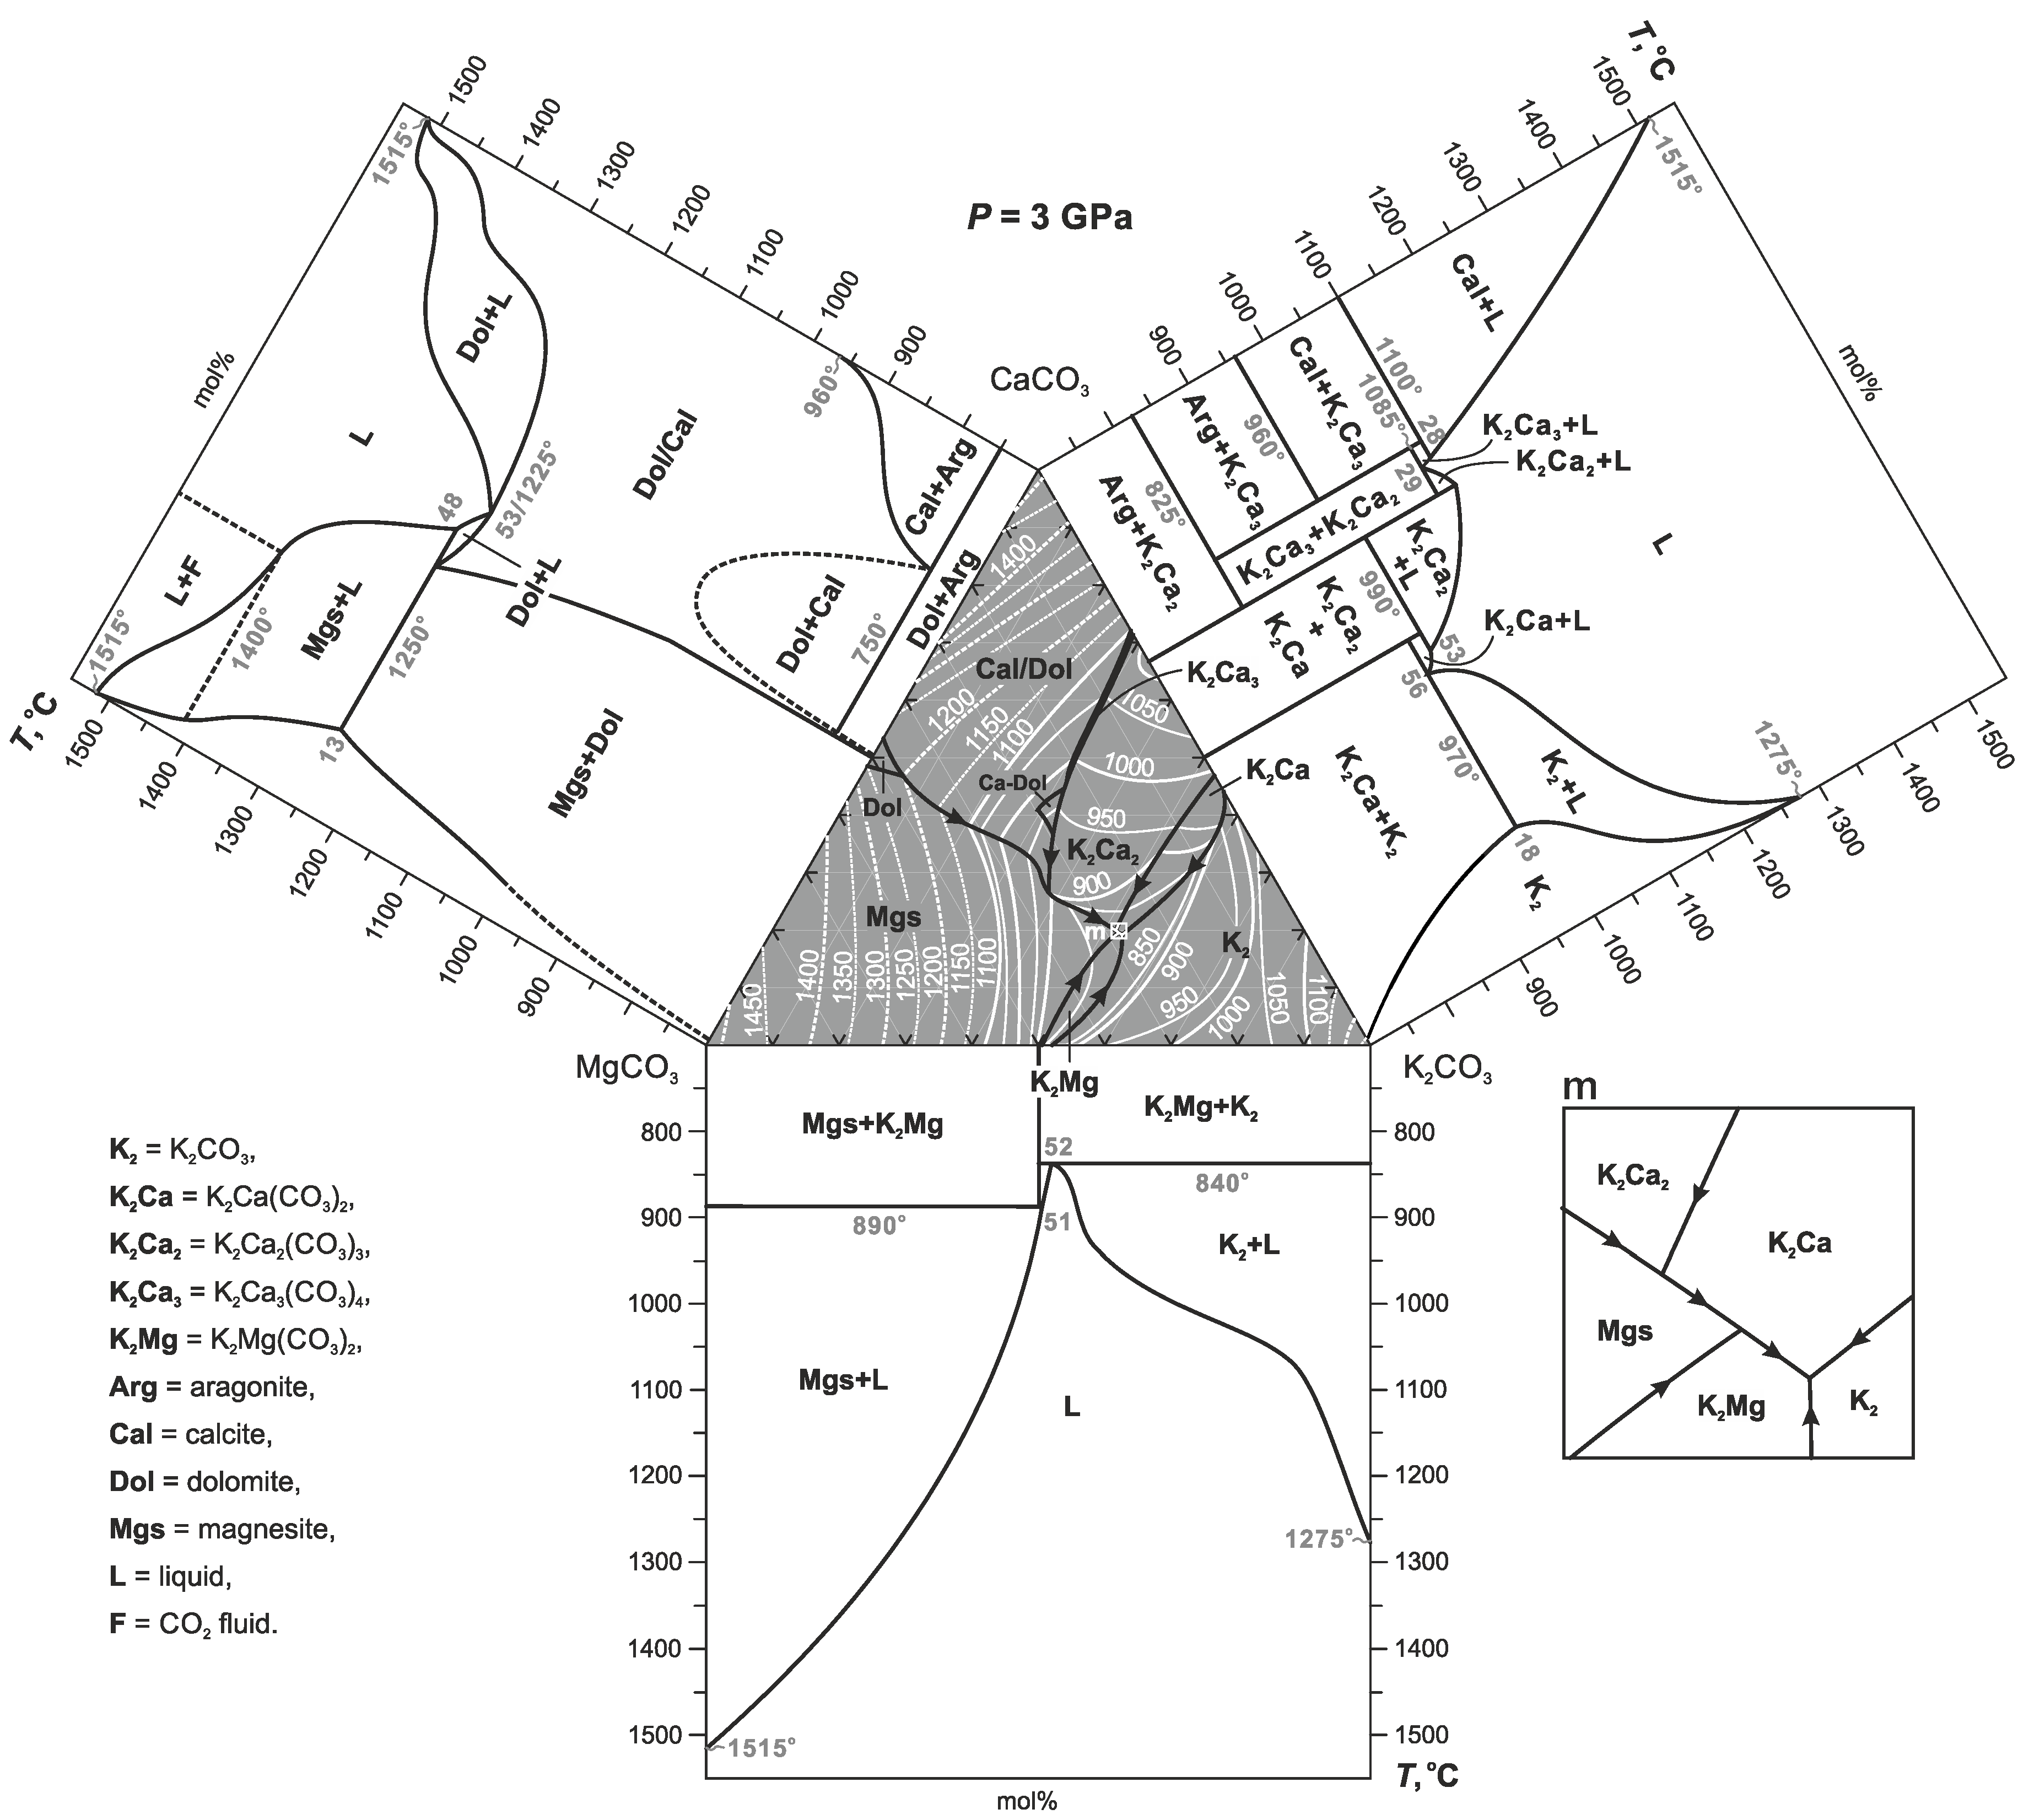
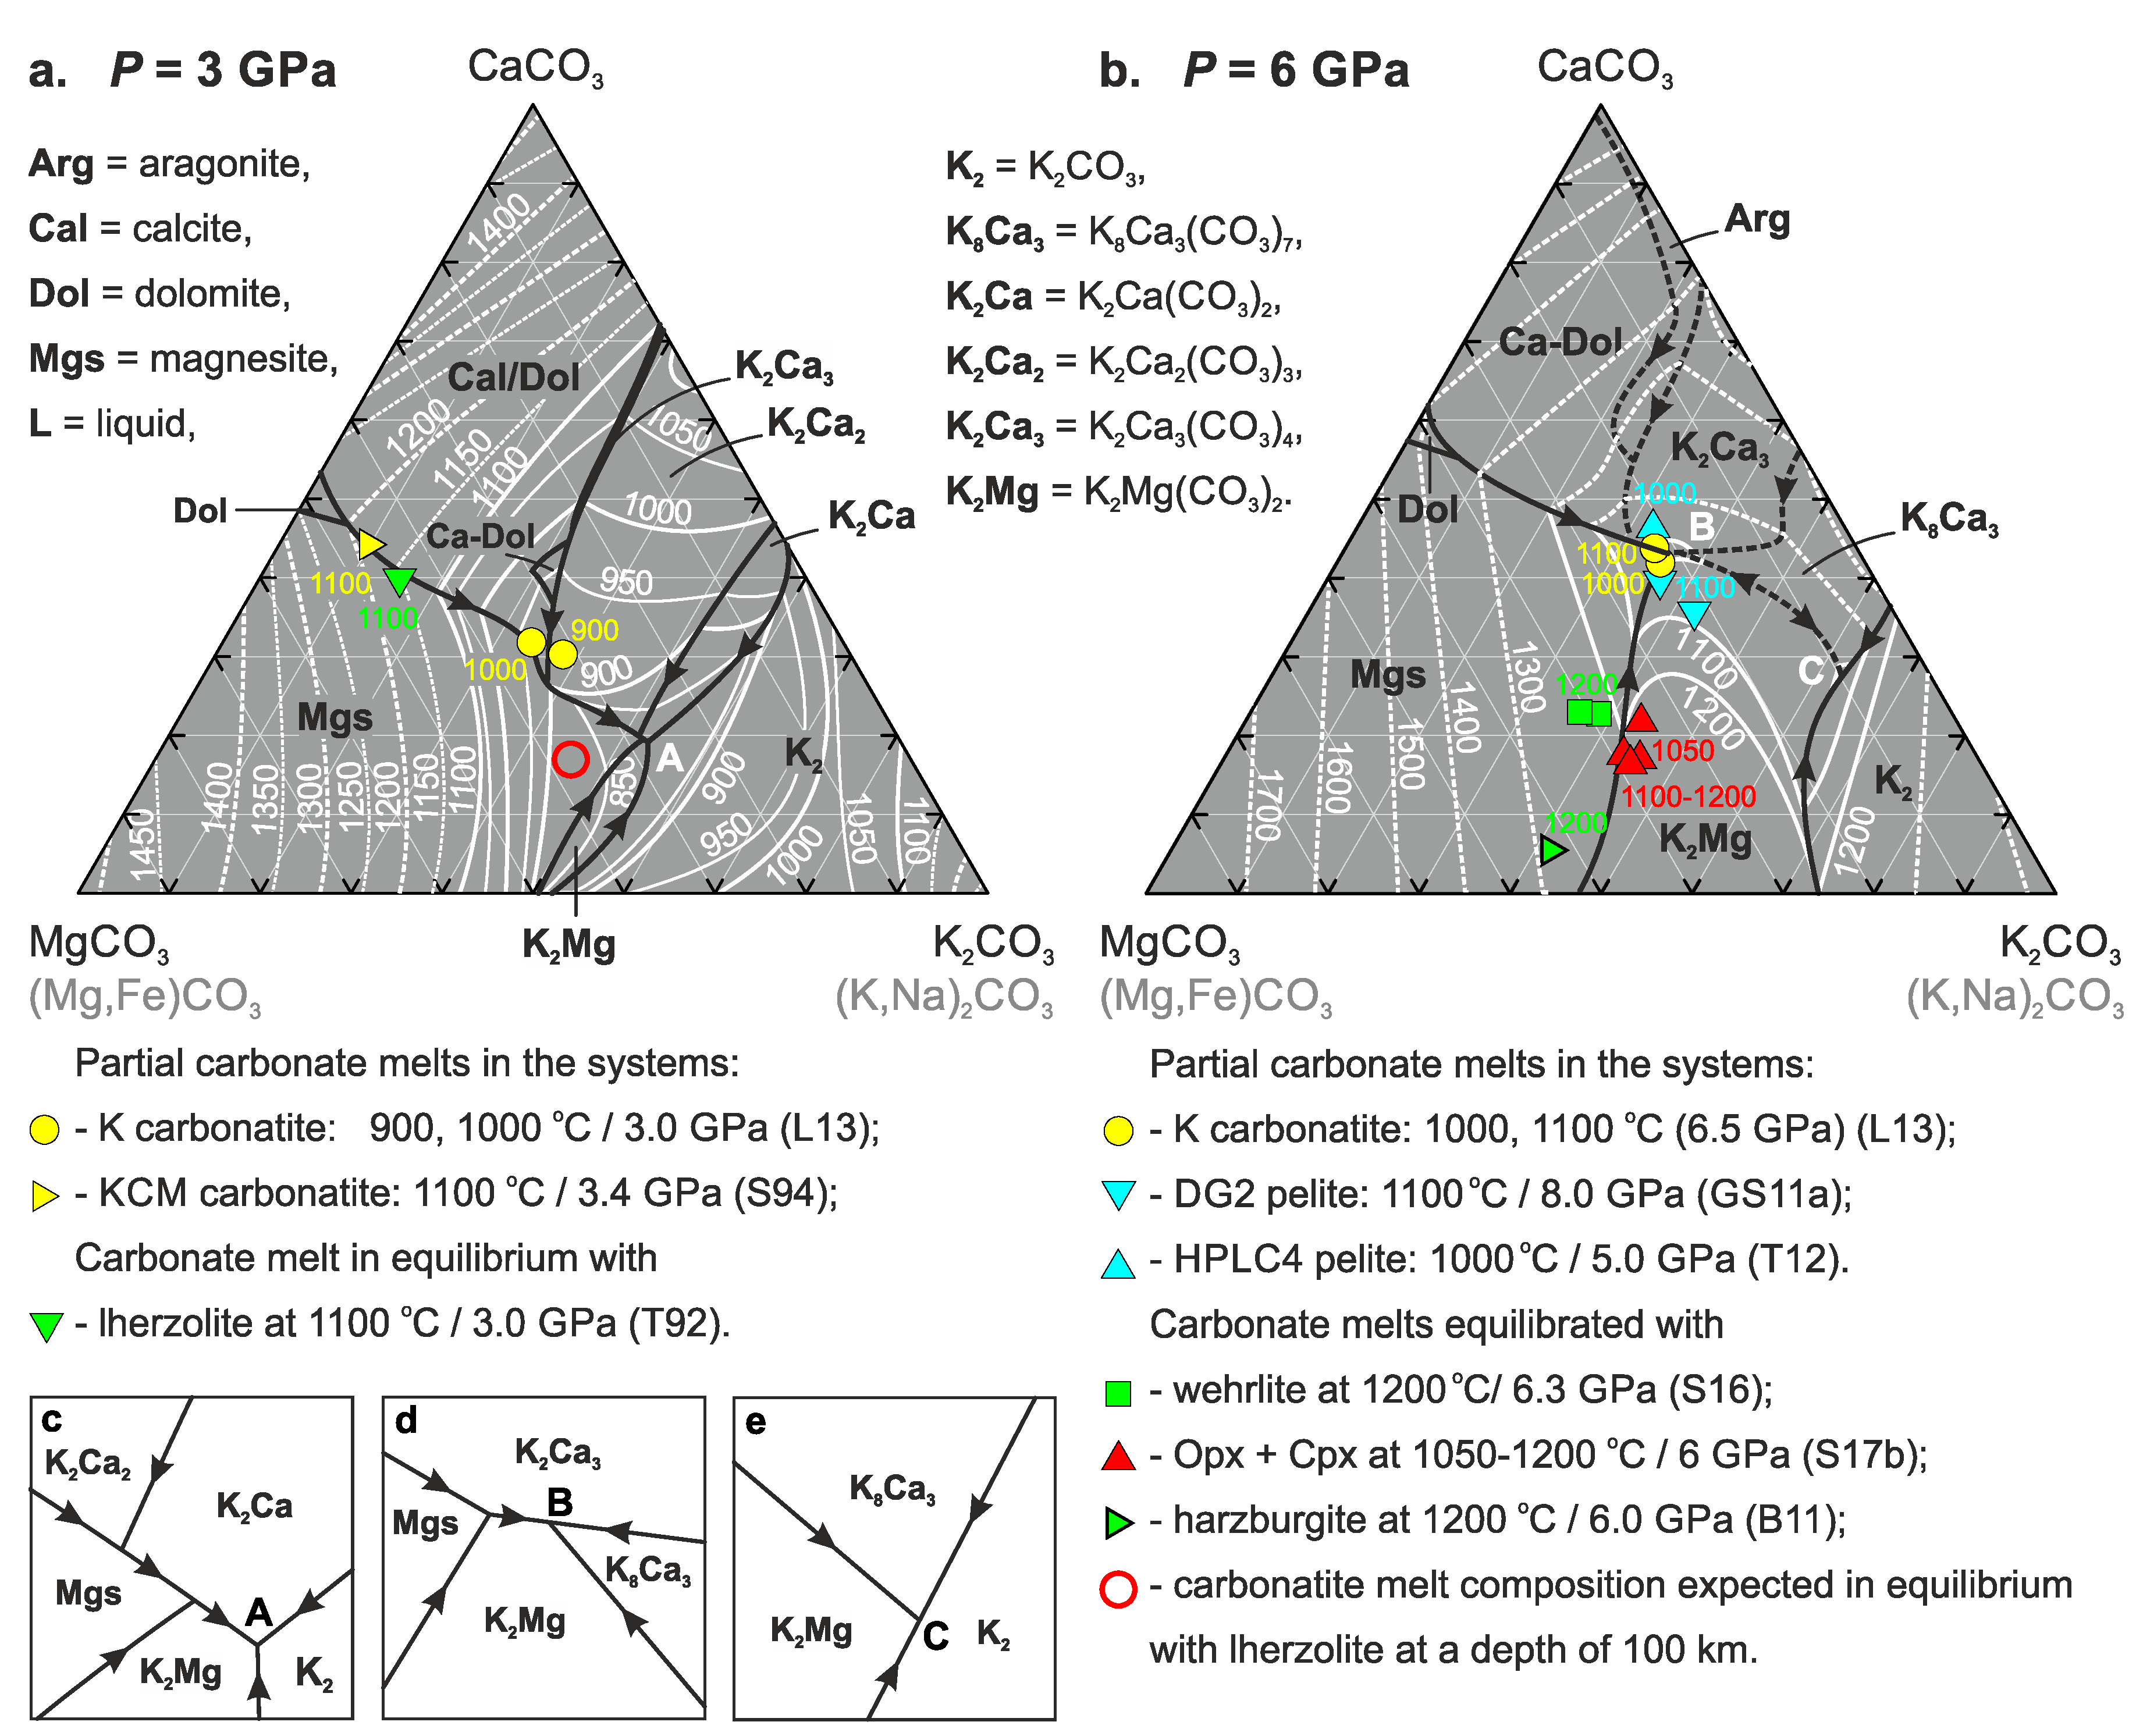
4.1. Phase Relations in the Join K2CO3–CaCO3–MgCO3 at 3 and 6 GPa

The main changes in the subsolidus phase relations induced by decreasing pressure from 6 to 3 GPa result from the CaCO3–MgCO3 and K2CO3–CaCO3 binaries [42,47]. At 6 GPa and 900 °C, the ternary system has five intermediate compounds including K2Ca3(CO3)4 (disordered polymorph), K2Ca(CO3)2 bütschliite, K2Mg(CO3)2, and dolomite [29]. As the temperature increases to 1000 °C, K2Ca(CO3)2 disappears to form K8Ca3(CO3)7 and K2Ca3(CO3)4. As pressure decreases to 3 GPa, the low-pressure K2Ca2(CO3)2 compound appears, whereas K8Ca3(CO3)7 disappears to form Ca-bearing K2CO3 and K2Ca(CO3)2 bütschliite. At 3 GPa, K2Ca3(CO3)4 (ordered polymorph) appears at ≥850 °C [47].
The melting phase relations established at 3 GPa in the present study and 6 GPa [29] are compared in Figure 8. At 6 GPa, the liquidus projection has eight primary solidification phase regions for magnesite, dolomite, calcite-dolomite solid solutions, aragonite, K2Ca3(CO3)4, K8Ca3(CO3)7, K2CO3, and K2Mg(CO3)2 (Figure 8b) [29]. As pressure decreases to 3 GPa, the changes in the phase relations along the CaCO3–MgCO3 and K2CO3–CaCO3 joins yield disappearance of the primary phase regions for aragonite and K8Ca3(CO3)7, narrowing the region for K2Ca3(CO3)4, and any appearance of the primary regions for Ca-dolomite, K2Ca2(CO3)3, and K2Ca(CO3)2 bütschliite (Figure 8a).
At 6 GPa, the system has two minima on the liquidus surface at 37K2CO3∙63Ca0.69Mg0.31CO3 and 62K2CO3∙38Ca0.74Mg0.26CO3 [29]. Both minima are located at 1000 °C. The first minimum (denoted as “B” on Figure 8b,d) resembles a K2Ca3(CO3)4–K8Ca3(CO3)7–K2Mg(CO3)2 eutectic, whereas the second minimum (denoted as “C” on Figure 8b,e) is controlled by a K8Ca3(CO3)7–K2CO3–K2Mg(CO3)2 eutectic [29]. At 3 GPa, the system has a single minimum at 53K2CO3∙47Ca0.4Mg0.6CO3 and 825 ± 25 °C corresponding to the K2Ca(CO3)2–K2CO3–K2Mg(CO3)2 eutectic (Figure 8a,c).

4.2. Temperature Stability Limit of Carbonate Melt vs. Alkalinity

The lower temperature stability limit of the potassic dolomitic melt inferred from the liquidus-solidus minima in the K2CO3–CaCO3–MgCO3 (KCM–CO2) system is 1000 °C at 6 GPa [29] and 825 °C at 3 GPa (Figure 9). A decrease in the K2CO3 content in the carbonatite melt shifts the minimum temperature of its stability to higher temperatures (Figure 9). Thus, the alkalinity of carbonate melt must increase as temperature decreases below the CMAS–CO2 solidus achieving 37 mol % K2CO3 at 1000 °C and 6 GPa [29] and 53 mol % K2CO3 at 825 °C and 3 GPa (at the KCM-CO2 solidus) (Figure 9).
Recent studies of the Na2CO3–CaCO3–MgCO3 system revealed that Na behaves like K in terms of melt composition (i.e., alkalinity and Ca#) and minimum melting temperature:
53K2CO3∙47Ca0.4Mg0.6CO3 and 825 °C at 3 GPa (this study);
52Na2CO3∙48Ca0.62Mg0.38CO3 and 850 °C at 3 GPa [12];
37K2CO3∙63Ca0.69Mg0.31CO3 and 1000 °C at 6 GPa [29];
48Na2CO3∙52(Ca0.75Mg0.25)CO3 and 1050 °C at 6 GPa [11].
Thus, the carbonate melt composition in the systems containing both K and Na should not be radically different.

4.3. Comparison with Carbonate–Silicate Systems

The present results agree with previous data on the partial melt compositions established in the model K-rich carbonatite systems [48,49] (Figure 8, Supplementary information Table S22). Sweeney [49] determined the composition of carbonate melt closest to equilibrium with a phlogopite lherzolite assemblage established at 1100 °C and 3.4 GPa in the KCM system (Figure 8a). Litasov, Shatskiy, Ohtani and Yaxley [48] have reported experimental data on model K-carbonatite, which is compositionally similar to a low-degree partial melt in the K-bearing peridotite-CO2 systems at 3–20 GPa.
We have reanalyzed the melt composition obtained by Litasov, Shatskiy, Ohtani and Yaxley [48] at 3 and 6.5 GPa using the analytical technique employed in the present study (Table S23). Although these melts contain both Na and Fe (Table S22), the data show close agreement with the minimum (near-solidus) melt compositions observed in the present work at 3 GPa (Figure 8a).
The experimentally-determined composition of the K-rich carbonatite melt equilibrated with phlogopite lherzolite at 3 GPa and 1100 °C [33] is consistent within 100 °C with corresponding isotherms on the K2CO3–CaCO3–MgCO3 liquidus surface (Figure 8a, Table S22). This suggests that during its upward percolation, the K-carbonatite melt should change its composition in the same manner as in the ternary system in terms of the (K,Na)2CO3/CaCO3/(Mg,Fe)CO3 ratios.

4.4. Origin of K-Rich Carbonatite Melt

Ultrapotassic carbonatite microinclusions have been discovered in diamonds derived by kimberlites from the lithospheric mantle worldwide [13,16,20,61]. The genesis of this melt remains enigmatic. Formation of ultrapotassic melt by partial melting of peridotites and eclogites can hardly be expected, considering the natural abundance of K2O in these lithologies. On the other hand, continental collision and subduction of sediments (pelites) can introduce significant amounts of K2O and carbonates. According to the traditional point of view, a granitic crust cannot be subducted into the deep mantle because of its buoyancy. However, immersion of the continental crust (metasediment, gneiss, marbles) to depths of 150–250 km has been proven by finding diamondiferous ultrahigh-pressure metamorphic rocks (Dol marbles, pyroxene-carbonate rocks, and gneisses) from Kokchetav (Kazakhstan) and Erzgebirge (Germany) [62,63,64]. The study of nanometer-scale inclusions in microdiamonds from these rocks revealed the presence of highly potassic carbonate-bearing inclusions, presumably carbonatite melt or high-density fluid, which resemble those in kimberlitic diamonds [65,66,67]. Thus, recycled carbonated material of the continental crust is the most probable source of highly potassic carbonatite melts entrapped by lithospheric diamonds.
Indeed, the studies of phase relations in carbonated pelites [2,50,51] suggest that continental collision and low-angle (flat) subduction of the oceanic plates beneath the cratons to depths of 150–250 km (5–8 GPa) and subsequent slab heating to 950–1100 °C could trigger partial melting of the carbonated crustal material and yield potassic dolomitic melt. The obtained melt compositions, plotted on the liquidus projection of the K2CO3–MgCO3–CaCO3 ternary, show excellent agreement both in terms of temperature and the (K,Na)2CO3/CaCO3/(Mg,Fe)CO3 ratio (Figure 8b, Table S22). As can be seen, the pelite-derived melts coincide with the K2CO3–MgCO3–CaCO3 ternary eutectic (Figure 8b).

4.5. The Compositional Trend of Carbonate Melts during Upward Percolation via Lithosphere

An infiltration of K–Ca–Mg carbonate melts into the base of the continental lithosphere is indicated by findings of ultrapotassic carbonatite inclusions in diamonds from kimberlites worldwide. Carbonate melts display low viscosities [68,69,70] and excellent wetting properties [71]. Infiltration experiments demonstrate that such melts are very mobile and can percolate very quickly in mantle rocks [72]. It was suggested that carbonatitic liquids may segregate from their mantle sources and migrate upward by infiltration, even at melt fractions less than 1% [73,74]. The pelite-derived melt has Ca# 62–68, and contains about 32–37 mol % K2CO3 (Figure 8b). Infiltration of this melt into lherzolite or harzburgite yields wehrlitization in accordance with the following exchange reaction [22]:
CaMg(CO3)2 (L) + Mg2Si2O6 (Opx) = CaMgSi2O6 (Cpx) + 2MgCO3 (L).
Reaction (1) shifts the melt composition along the Mgs-K2Mg cotectic toward lower Ca# (Figure 8b). The K–Ca–Mg carbonate melt with Ca# 30–40 does not react with Opx as follows from the experiments in the Di+K2Mg system, where this melt appears in equilibrium with Opx and Cpx at 1050–1350 °C at 6 GPa [52]. In contrast, adding K2CO3 + MgCO3 mixture in the lherzolite system yields a reverse reaction, consuming Cpx. As a result, lherzolite transforms to harzburgite, while the Ca# of melt increases to at least 10 [23] (Figure 8b).
Thus, infiltration of pelite-derived carbonatite melt into the continental lithosphere must be accompanied by wehrlitization and decreases the Ca# of melt from 66 ± 4 to 35 ± 5 (Figure 8b). The further upward percolation of this melt along the P-T path defined by granular lherzolites must not change its composition to a depth of at least 100 km corresponding to 800–900 °C and 3 GPa (Figure 8a and Figure 9).

5. Conclusions

1. Phase relations in the K2CO3–CaCO3–MgCO3 system have been studied at 3 GPa and 750–1100 °C using a Kawai-type multianvil press. At 750 and 800 °C, the system has five intermediate compounds: Dolomite, Ca0.8Mg0.2CO3 Ca-dolomite, K2(Ca≥0.84Mg≤0.16)2(CO3)3, K2(Ca≥0.70Mg≤0.30)(CO3)2 bütschliite, and K2(Mg≥0.78Ca≤0.22)(CO3)2. At 850 °C, an additional K2(Ca≥0.96Mg≤0.04)3CO3)4 compound appears. K2Mg(CO3)2 disappears near 900 °C to produce magnesite and a liquid. K2Ca(CO3)2 bütschliite melts incongruently at 1000 °C to produce K2Ca2(CO3)3 and a liquid. K2Ca2(CO3)3 and K2Ca3(CO3)4 remain stable in the whole studied temperature range.
2. The liquidus projection of the studied ternary system has nine primary crystallization phase regions for magnesite, dolomite, Ca-dolomite, calcite-dolomite solid solutions, K2Ca3(CO3)4, K2Ca2(CO3)3, K2Ca(CO3)2 bütschliite, K2Mg(CO3)2, and K2CO3 solid solutions containing up to 24 mol% CaCO3 and less than 2 mol % MgCO3. The primary solidification regions are separated by five peritectic and four cotectic monovariant lines. The system has one minimum on the liquidus at 825 ± 25 °C, corresponding to ternary eutectic, where liquid with approximate composition 53K2CO3∙47Ca0.4Mg0.6CO3 coexists with three solid phases, K2(Mg0.78Ca0.22)(CO3)2, K2(Ca0.70Mg0.30)(CO3)2 bütschliite, and the K1.70Ca0.23Mg0.07CO3 solid solution.
3. The established phase relations suggest that carbonatite melt, stable at the temperature conditions of the continental lithosphere at a depth of 100 km, must be alkali-rich and contains about 45 mol % K2CO3.

Supplementary Materials

The following are available online at https://www.mdpi.com/2075-163X/9/5/296/s1, Table S1: Compositions (mol %) of the run products in the K2CO3–CaCO3–MgCO3 join at 750 °С, 3 GPa and run duration of 87 h. (run no. D094); Table S2: Compositions (mol %) of the run products in the K2CO3–CaCO3–MgCO3 join at 800 °С, 3 GPa and run duration of 17 h. (run no. D086); Table S3: Compositions (mol %) of the run products in the K2CO3–CaCO3–MgCO3 join at 800 °С, 3 GPa and run duration of 113 h. (run no. D102); Table S4: Compositions (mol %) of the run products in the K2CO3–CaCO3–MgCO3 join at 850 °С, 3 GPa and run duration of 40 h. (run no. D093); Table S5: Compositions (mol %) of the run products in the K2CO3–CaCO3–MgCO3 join at 850 °С, 3 GPa and run duration of 121 h. (run no. D104); Table S6: Compositions (mol %) of the run products in the K2CO3–CaCO3–MgCO3 join at 850 °С, 3 GPa and run duration of 15 h. (run no. D109); Table S7: Compositions (mol %) of the run products in the K2CO3–CaCO3–MgCO3 join at 850 °С, 3 GPa and run duration of 100 h. (run no. D141); Table S8: Compositions (mol %) of the run products in the K2CO3–CaCO3–MgCO3 join at 850 °С, 3 GPa and run duration of 12 h. (run no. D142); Table S9: Compositions (mol %) of the run products in the K2CO3–CaCO3–MgCO3 join at 900 °С, 3 GPa and run duration of 15 h. (run no. D082); Table S10: Compositions (mol %) of the run products in the K2CO3–CaCO3–MgCO3 join at 900 °С, 3 GPa and run duration of 15 h. (run no. D087); Table S11: Compositions (mol %) of the run products in the K2CO3–CaCO3–MgCO3 join at 900 °С, 3 GPa and run duration of 16 h. (run no. D097); Table S12: Compositions (mol %) of the run products in the K2CO3–CaCO3–MgCO3 join at 900 °С, 3 GPa and run duration of 14 h. (run no. D105); Table S13: Compositions (mol %) of the run products in the K2CO3–CaCO3–MgCO3 join at 900 °С, 3 GPa and run duration of 3 h. (run no. D110); Table S14: Compositions (mol %) of the run products in the K2CO3–CaCO3–MgCO3 join at 900 °С, 3 GPa and run duration of 2 h. (run no. D143); Table S15: Compositions (mol %) of the run products in the K2CO3–CaCO3–MgCO3 join at 950 °С, 3 GPa and run duration of 30 min. (run no. D116); Table S16: Compositions (mol %) of the run products in the K2CO3–CaCO3–MgCO3 join at 950 °С, 3 GPa and run duration of 40 h. (run no. D118); Table S17: Compositions (mol%) of the run products in the K2CO3–CaCO3–MgCO3 join at 950 °С, 3 GPa and run duration of 1 h. (run no. D145); Table S18: Compositions (mol %) of the run products in the K2CO3–CaCO3–MgCO3 join at 1000 °С, 3 GPa and run duration of 1 h. (run no. D144); Table S19: Compositions (mol %) of the run products in the K2CO3–CaCO3–MgCO3 join at 1000 °С, 3 GPa and run duration of 20 min. (run no. D152); Table S20: Compositions (mol %) of the run products in the K2CO3–CaCO3–MgCO3 join at 1050 °С, 3 GPa and run duration of 15 min. (run no. D153); Table S21: Compositions (mol %) of the run products in the K2CO3–CaCO3–MgCO3 join at 1100 °С, 3 GPa and run duration of 10 min. (run no. D155); Table S22: Compositions of partial melts established at various temperatures in the carbonate-silicate systems with high K/Na ratio; Table S23. The results of microprobe analyses (WDS) of quenched carbonate melt from the study (Litasov et al., 2013) compared with the EDS data obtained from the same samples in this study.

Author Contributions

Conceptualization, A.S.; methodology, A.S. and K.D.L.; validation, A.S.; formal analysis, A.V.A., I.V.P., and A.B.; investigation, A.V.A.; resources, K.D.L. and A.S.; data curation, A.V.A.; writing—original draft preparation, A.S.; writing—review and editing, A.S.; visualization, A.V.A. and A.S.; supervision, A.S.; project administration, A.V.A. and A.S.; funding acquisition, A.S.

Funding

This research was funded by the Russian Science Foundation, grant number 14-17-00609-P.

Acknowledgments

We thank two anonymous referees for constructive comments. The SEM and EDS studies of experimental samples were performed in the Analytical Center for multi-elemental and isotope research SB RAS. We are grateful to N.S. Karmanov and A.T. Titov for their help in the analytical work.

Conflicts of Interest

The authors declare no conflict of interest. The funders had no role in the design of the study; in the collection, analyses, or interpretation of data; in the writing of the manuscript, and in the decision to publish the results.

References

  1. Thomson, A.R.; Walter, M.J.; Kohn, S.C.; Brooker, R.A. Slab melting as a barrier to deep carbon subduction. Nature 2016, 529, 76–79. [Google Scholar] [CrossRef] [PubMed] [Green Version]
  2. Grassi, D.; Schmidt, M.W. The melting of carbonated pelites from 70 to 700 km depth. J. Petrol. 2011, 52, 765–789. [Google Scholar] [CrossRef]
  3. Kaminsky, F.; Wirth, R.; Matsyuk, S.; Schreiber, A.; Thomas, R. Nyerereite and nahcolite inclusions in diamond: Evidence for lower-mantle carbonatitic magmas. Mineral. Mag. 2009, 73, 797–816. [Google Scholar] [CrossRef]
  4. Kaminsky, F.V.; Wirth, R.; Schreiber, A. Carbonatitic inclusions in deep mantle diamond from Juina, Brazil: New minerals in the carbonate-halide association. Can. Mineral. 2013, 51, 669–688. [Google Scholar] [CrossRef]
  5. Kaminsky, F.V.; Ryabchikov, I.D.; Wirth, R. A primary natrocarbonatitic association in the Deep Earth. Mineral. Petrol. 2016, 110, 387–398. [Google Scholar] [CrossRef]
  6. Sharygin, I.S.; Golovin, A.V.; Korsakov, A.V.; Pokhilenko, N.P. Eitelite in sheared peridotite xenoliths from Udachnaya-East kimberlite pipe (Russia)—A new locality and host rock type. Eur. J. Mineral. 2013, 25, 825–834. [Google Scholar] [CrossRef]
  7. Golovin, A.; Sharygin, I.; Kamenetsky, V.; Korsakov, A.; Yaxley, G. Alkali-carbonate melts from the base of cratonic lithospheric mantle: Links to kimberlites. Chem. Geol. 2018, 483, 261–274. [Google Scholar] [CrossRef]
  8. Kamenetsky, V.S.; Kamenetsky, M.B.; Weiss, Y.; Navon, O.; Nielsen, T.F.D.; Mernagh, T.P. How unique is the Udachnaya-East kimberlite? Comparison with kimberlites from the Slave Craton (Canada) and SW Greenland. Lithos 2009, 112, 334–346. [Google Scholar] [CrossRef]
  9. Golovin, A.V.; Sharygin, I.S.; Korsakov, A.V. Origin of alkaline carbonates in kimberlites of the Siberian craton: Evidence from melt inclusions in mantle olivine of the Udachnaya-East pipe. Chem. Geol. 2017, 455, 357–375. [Google Scholar] [CrossRef]
  10. Shatskiy, A.; Litasov, K.D.; Sharygin, I.S.; Ohtani, E. Composition of primary kimberlite melt in a garnet lherzolite mantle source: Constraints from melting phase relations in anhydrous Udachnaya-East kimberlite with variable CO2 content at 6.5 GPa. Gondwana Res. 2017, 45, 208–227. [Google Scholar] [CrossRef]
  11. Shatskiy, A.; Litasov, K.D.; Sharygin, I.S.; Egonin, I.A.; Mironov, A.M.; Palyanov, Y.N.; Ohtani, E. The system Na2CO3-CaCO3-MgCO3 at 6 GPa and 900–1250 °C and its relation to the partial melting of carbonated mantle. High Press. Res. 2016, 36, 23–41. [Google Scholar] [CrossRef]
  12. Podborodnikov, I.V.; Shatskiy, A.; Arefiev, A.V.; Litasov, K.D. Phase relations in the system Na2CO3-CaCO3-MgCO3 at 3 GPa with implications for carbonatite genesis and evolution. Lithos 2019, 330–331, 74–89. [Google Scholar] [CrossRef]
  13. Navon, O.; Hutcheon, I.; Rossman, G.; Wasserburg, G. Mantle-derived fluids in diamond micro-inclusions. Nature 1988, 335, 784–789. [Google Scholar] [CrossRef]
  14. Schrauder, M.; Navon, O. Hydrous and carbonatitic mantle fluids in fibrous diamonds from Jwaneng, Botswana. Geochim. Cosmochim. Acta 1994, 58, 761–771. [Google Scholar] [CrossRef]
  15. Zedgenizov, D.A.; Rege, S.; Griffin, W.L.; Kagi, H.; Shatsky, V.S. Composition of trapped fluids in cuboid fibrous diamonds from the Udachnaya kimberlite: LAM-ICPMS analysis. Chem. Geol. 2007, 240, 151–162. [Google Scholar] [CrossRef]
  16. Klein-BenDavid, O.; Logvinova, A.M.; Schrauder, M.; Spetius, Z.V.; Weiss, Y.; Hauri, E.H.; Kaminsky, F.V.; Sobolev, N.V.; Navon, O. High-Mg carbonatitic microinclusions in some Yakutian diamonds—A new type of diamond-forming fluid. Lithos 2009, 112, 648–659. [Google Scholar] [CrossRef]
  17. Weiss, Y.; Kessel, R.; Griffin, W.L.; Kiflawi, I.; Klein-BenDavid, O.; Bell, D.R.; Harris, J.W.; Navon, O. A new model for the evolution of diamond-forming fluids: Evidence from microinclusion-bearing diamonds from Kankan, Guinea. Lithos 2009, 112, 660–674. [Google Scholar] [CrossRef]
  18. Zedgenizov, D.A.; Ragozin, A.L.; Shatsky, V.S.; Araujo, D.; Griffin, W.L. Fibrous diamonds from the placers of the northeastern Siberian Platform: Carbonate and silicate crystallization media. Russ. Geol. Geophys. 2011, 52, 1298–1309. [Google Scholar] [CrossRef]
  19. Skuzovatov, S.; Zedgenizov, D.; Howell, D.; Griffin, W.L. Various growth environments of cloudy diamonds from the Malobotuobia kimberlite field (Siberian craton). Lithos 2016, 265, 96–107. [Google Scholar] [CrossRef]
  20. Jablon, B.M.; Navon, O. Most diamonds were created equal. Earth Planet. Sci. Lett. 2016, 443, 41–47. [Google Scholar] [CrossRef]
  21. Kruk, A.N.; Sokol, A.G.; Palyanov, Y.N. Phase relations in the harzburgite–hydrous carbonate melt at 5.5–7.5 GPa and 1200–1350 °С. Petrology 2018, 26, 575–587. [Google Scholar] [CrossRef]
  22. Sokol, A.G.; Kruk, A.N.; Chebotarev, D.A.; Palyanov, Y.N. Carbonatite melt–peridotite interaction at 5.5–7.0 GPa: Implications for metasomatism in lithospheric mantle. Lithos 2016, 248, 66–79. [Google Scholar] [CrossRef]
  23. Brey, G.P.; Bulatov, V.K.; Girnis, A.V. Melting of K-rich carbonated peridotite at 6–10 GPa and the stability of K-phases in the upper mantle. Chem. Geol. 2011, 281, 333–342. [Google Scholar] [CrossRef]
  24. Pal’yanov, Y.N.; Sokol, A.G.; Borzdov, Y.M.; Khokhryakov, A.F.; Sobolev, N.V. Diamond formation from mantle carbonate fluids. Nature 1999, 400, 417–418. [Google Scholar] [CrossRef]
  25. Palyanov, Y.N.; Bataleva, Y.V.; Sokol, A.G.; Borzdov, Y.M.; Kupriyanov, I.N.; Reutsky, V.N.; Sobolev, N.V. Mantle–slab interaction and redox mechanism of diamond formation. Proc. Natl. Acad. Sci. USA 2013, 110, 20408–20413. [Google Scholar] [CrossRef] [Green Version]
  26. Shatskiy, A.; Sharygin, I.S.; Gavryushkin, P.N.; Litasov, K.D.; Borzdov, Y.M.; Shcherbakova, A.V.; Higo, Y.; Funakoshi, K.; Palyanov, Y.N.; Ohtani, E. The system K2CO3-MgCO3 at 6 GPa and 900–1450 °C. Am. Mineral. 2013, 98, 1593–1603. [Google Scholar] [CrossRef]
  27. Shatskiy, A.; Borzdov, Y.M.; Litasov, K.D.; Sharygin, I.S.; Palyanov, Y.N.; Ohtani, E. Phase relationships in the system K2CO3-CaCO3 at 6 GPa and 900–1450 °C. Am. Mineral. 2015, 100, 223–232. [Google Scholar] [CrossRef]
  28. Shatskiy, A.; Litasov, K.D.; Ohtani, E.; Borzdov, Y.M.; Khmelnicov, A.I.; Palyanov, Y.N. Phase relations in the K2CO3-FeCO3 and MgCO3-FeCO3 systems at 6 GPa and 900–1700 °C. Eur. J. Mineral. 2015, 27, 487–499. [Google Scholar] [CrossRef]
  29. Shatskiy, A.; Litasov, K.D.; Palyanov, Y.N.; Ohtani, E. Phase relations on the K2CO3-CaCO3-MgCO3 join at 6 GPa and 900–1400 °C: Implications for incipient melting in carbonated mantle domains. Am. Mineral. 2016, 101, 437–447. [Google Scholar] [CrossRef]
  30. Yaxley, G.M.; Crawford, A.J.; Green, D.H. Evidence for carbonatite metasomatism in spinel peridotite xenoliths from western Victoria, Australia. Earth Planet. Sci. Lett. 1991, 107, 305–317. [Google Scholar] [CrossRef]
  31. Yaxley, G.M.; Green, D.H.; Kamenetsky, V. Carbonatite metasomatism in the southeastern Australian lithosphere. J. Petrol. 1998, 39, 1917–1930. [Google Scholar] [CrossRef]
  32. Dautria, J.; Dupuy, C.; Takherist, D.; Dostal, J. Carbonate metasomatism in the lithospheric mantle: Peridotitic xenoliths from a melilititic district of the Sahara basin. Contrib. Mineral. Petrol. 1992, 111, 37–52. [Google Scholar] [CrossRef]
  33. Thibault, Y.; Edgar, A.D.; Lloyd, F.E. Experimental investigation of melts from a carbonated phlogopite lherzolite: Implications for metasomatism in the continental lithosphere. Am. Mineral. 1992, 77, 784–794. [Google Scholar]
  34. Rudnick, R.L.; McDonough, W.F.; Chappell, B.W. Carbonatite metasomatism in the northern Tanzanian mantle: Petrographic and geochemical characteristics. Earth Planet. Sci. Lett. 1993, 114, 463–475. [Google Scholar] [CrossRef] [Green Version]
  35. Yoshino, T.; Gruber, B.; Reinier, C. Effects of pressure and water on electrical conductivity of carbonate melt with implications for conductivity anomaly in continental mantle lithosphere. Phys. Earth Planet. Inter. 2018, 281, 8–16. [Google Scholar] [CrossRef]
  36. Jones, A.G.; Ferguson, I.J.; Chave, A.D.; Evans, R.L.; McNeice, G.W. Electric lithosphere of the Slave craton. Geology 2001, 29, 423–426. [Google Scholar] [CrossRef]
  37. Jones, A.G.; Lezaeta, P.; Ferguson, I.J.; Chave, A.D.; Evans, R.L.; Garcia, X.; Spratt, J. The electrical structure of the Slave craton. Lithos 2003, 71, 505–527. [Google Scholar] [CrossRef]
  38. Pinto, L.G.R.; de Pádua, M.B.; Ussami, N.; Vitorello, Í.; Padilha, A.L.; Braitenberg, C. Magnetotelluric deep soundings, gravity and geoid in the South São Francisco craton: Geophysical indicators of cratonic lithosphere rejuvenation and crustal underplating. Earth Planet. Sci. Lett. 2010, 297, 423–434. [Google Scholar] [CrossRef]
  39. Giuliani, A.; Kamenetsky, V.S.; Phillips, D.; Kendrick, M.A.; Wyatt, B.A.; Goemann, K. Nature of alkali-carbonate fluids in the sub-continental lithospheric mantle. Geology 2012, 40, 967–970. [Google Scholar] [CrossRef]
  40. Osugi, J.; Shimizu, K.; Inoue, K.; Yasunami, K. A compact cubic anvil high pressure apparatus. Rev. Phys. Chem. Jpn. 1964, 34, 1–6. [Google Scholar]
  41. Shatskiy, A.; Litasov, K.D.; Terasaki, H.; Katsura, T.; Ohtani, E. Performance of semi-sintered ceramics as pressure-transmitting media up to 30 GPa. High Press. Res. 2010, 30, 443–450. [Google Scholar] [CrossRef]
  42. Shatskiy, A.; Podborodnikov, I.V.; Arefiev, A.V.; Minin, D.A.; Chanyshev, A.D.; Litasov, K.D. Revision of the CaCO3–MgCO3 phase diagram at 3 and 6 GPa. Am. Mineral. 2018, 103, 441–452. [Google Scholar] [CrossRef]
  43. Hernlund, J.; Leinenweber, K.; Locke, D.; Tyburczy, J.A. A numerical model for steady-state temperature distributions in solid-medium high-pressure cell assemblies. Am. Mineral. 2006, 91, 295–305. [Google Scholar] [CrossRef]
  44. Brey, G.P.; Kohler, T. Geothermobarometry in four-phase lherzolites II. New thermobarometers, and practical assessment of existing thermobarometers. J. Petrol. 1990, 31, 1353–1378. [Google Scholar] [CrossRef]
  45. Lavrent’ev, Y.G.; Karmanov, N.; Usova, L. Electron probe microanalysis of minerals: Microanalyzer or scanning electron microscope? Russ. Geol. Geophys. 2015, 56, 1154–1161. [Google Scholar] [CrossRef]
  46. Arefiev, A.V.; Shatskiy, A.; Podborodnikov, I.V.; Litasov, K.D. Melting and subsolidus phase relations in the system K2CO3-MgCO3 at 3 GPa. High Press. Res. 2018, 38, 422–439. [Google Scholar] [CrossRef]
  47. Arefiev, A.V.; Shatskiy, A.; Podborodnikov, I.V.; Rashchenko, S.V.; Chanyshev, A.D.; Litasov, K.D. The system K2CO3-CaCO3 at 3 GPa: Link between phase relations and variety of K-Ca double carbonates at ≤ 0.1 and 6 GPa. Phys. Chem. Miner. 2019, 46, 229–244. [Google Scholar] [CrossRef]
  48. Litasov, K.D.; Shatskiy, A.; Ohtani, E.; Yaxley, G.M. The solidus of alkaline carbonatite in the deep mantle. Geology 2013, 41, 79–82. [Google Scholar] [CrossRef]
  49. Sweeney, R.J. Carbonatite melt compositions in the Earth’s mantle. Earth Planet. Sci. Lett. 1994, 128, 259–270. [Google Scholar] [CrossRef]
  50. Grassi, D.; Schmidt, M.W. Melting of carbonated pelites at 8–13 GPa: Generating K-rich carbonatites for mantle metasomatism. Contrib. Mineral. Petrol. 2011, 162, 169–191. [Google Scholar] [CrossRef]
  51. Tsuno, K.; Dasgupta, R.; Danielson, L.; Righter, K. Flux of carbonate melt from deeply subducted pelitic sediments: Geophysical and geochemical implications for the source of Central American volcanic arc. Geophys. Res. Lett. 2012, 39. [Google Scholar] [CrossRef]
  52. Shatskiy, A.; Podborodnikov, I.V.; Arefiev, A.V.; Litasov, K.D.; Chanyshev, A.D.; Sharygin, I.S.; Karmanov, N.S.; Ohtani, E. Effect of alkalis on the reaction of clinopyroxene with Mg-carbonate at 6 GPa: Implications for partial melting of carbonated lherzolite. Am. Mineral. 2017, 102, 1934–1946. [Google Scholar] [CrossRef]
  53. Byrnes, A.P.; Wyllie, P.J. Subsolidus and melting relations for the join CaCO3-MgCO3 at 10 kbar. Geochim. Cosmochim. Acta 1981, 45, 321–328. [Google Scholar] [CrossRef]
  54. Gudfinnsson, G.H.; Presnall, D.C. Melting relations of model lherzolite in the system CaO–MgO–Al2O3–SiO2 at 2.4–3.4 GPa and the generation of komatiites. J. Geophys. Res. Solid Earth 1996, 101, 27701–27709. [Google Scholar] [CrossRef]
  55. Gudfinnsson, G.H.; Presnall, D.C. Continuous gradations among primary carbonatitic, kimberlitic, melilititic, basaltic, picritic, and komatiitic melts in equilibrium with garnet lherzolite at 3–8 GPa. J. Petrol. 2005, 46, 1645–1659. [Google Scholar] [CrossRef]
  56. Kennedy, C.S.; Kennedy, G.C. The equilibrium boundary between graphite and diamond. J. Geophys. Res. 1976, 81, 2467–2470. [Google Scholar] [CrossRef]
  57. Pollack, H.N.; Chapman, D.S. On the regional variation of heat flow, geotherms, and lithospheric thickness. Tectonophysics 1977, 38, 279–296. [Google Scholar] [CrossRef]
  58. Syracuse, E.M.; van Keken, P.E.; Abers, G.A. The global range of subduction zone thermal models. Phys. Earth Planet. Inter. 2010, 183, 73–90. [Google Scholar] [CrossRef]
  59. Tychkov, N.; Agashev, A.; Malygina, E.; Nikolenko, E.; Pokhilenko, N. Thermal perturbations in the lithospheric mantle as evidenced from PT equilibrium conditions of xenoliths from the Udachnaya kimberlite pipe. Doklady Earth Sci. 2014, 454, 84–88. [Google Scholar] [CrossRef]
  60. Bell, D.R.; Schmitz, M.D.; Janney, P.E. Mesozoic thermal evolution of the southern African mantle lithosphere. Lithos 2003, 71, 273–287. [Google Scholar] [CrossRef]
  61. Zedgenizov, D.A.; Ragozin, A.L.; Shatsky, V.S.; Araujo, D.; Griffin, W.L.; Kagi, H. Mg and Fe-rich carbonate-silicate high-density fluids in cuboid diamonds from the Internationalnaya kimberlite pipe (Yakutia). Lithos 2009, 112, 638–647. [Google Scholar] [CrossRef]
  62. Sobolev, N.; Shatsky, V.S.; Vavilov, M.A. Inclusions of microdiamonds and coexisting minerals in garnets and zircons from metamorphic rocks of Kokchetav Massif, USSR. Terra Abstr. 1991, 3, 83. [Google Scholar]
  63. Shatsky, V.S.; Ragozin, A.L.; Sobolev, N.V. Some aspects of metamorphic evolution of ultrahigh-pressure calc-silicate rocks of the Kokchetav Massif. Russ. Geol. Geophys. 2006, 47, 105–119. [Google Scholar]
  64. Nasdala, L.; Massonne, H.-J. Microdiamonds from the Saxonian Erzgebirge, Germany: In situ micro-Raman characterisation. Eur. J. Mineral. 2000, 12, 495–498. [Google Scholar] [CrossRef]
  65. De Corte, K.; Cartigny, P.; Shatsky, V.; Sobolev, N.; Javoy, M. Evidence of fluid inclusions in metamorphic microdiamonds from the Kokchetav massif, northern Kazakhstan. Geochim. Cosmochim. Acta 1998, 62, 3765–3773. [Google Scholar] [CrossRef]
  66. Stöckhert, B.; Duyster, J.; Trepmann, C.; Massonne, H.-J. Microdiamond daughter crystals precipitated from supercritical COH+ silicate fluids included in garnet, Erzgebirge, Germany. Geology 2001, 29, 391–394. [Google Scholar] [CrossRef]
  67. Hwang, S.-L.; Shen, P.; Chu, H.-T.; Yui, T.-F.; Liou, J.G.; Sobolev, N.V.; Shatsky, V.S. Crust-derived potassic fluid in metamorphic microdiamond. Earth Planet. Sci. Lett. 2005, 231, 295–306. [Google Scholar] [CrossRef]
  68. Dobson, D.P.; Jones, A.P.; Rabe, R.; Sekine, T.; Kurita, K.; Taniguchi, T.; Kondo, T.; Kato, T.; Shimomura, O.; Urakawa, S. In-situ measurement of viscosity and density of carbonate melts at high pressure. Earth Planet. Sci. Lett. 1996, 143, 207–215. [Google Scholar] [CrossRef]
  69. Kono, Y.; Kenney-Benson, C.; Hummer, D.; Ohfuji, H.; Park, C.; Shen, G.; Wang, Y.; Kavner, A.; Manning, C.E. Ultralow viscosity of carbonate melts at high pressures. Nat. Commun. 2014, 5, 5091. [Google Scholar] [CrossRef] [Green Version]
  70. Stagno, V.; Stopponi, V.; Kono, Y.; Manning, C.E.; Irifune, T. Experimental determination of the viscosity of Na2CO3 melt between 1.7 and 4.6 GPa at 1200–1700 °C: Implications for the rheology of carbonatite magmas in the Earth’s upper mantle. Chem. Geol. 2018, 501, 19–25. [Google Scholar] [CrossRef]
  71. Minarik, W.G.; Watson, E.B. Interconnectivity of carbonate melt at low melt fraction. Earth Planet. Sci. Lett. 1995, 133, 423–437. [Google Scholar] [CrossRef]
  72. Hammouda, T.; Laporte, D. Ultrafast mantle impregnation by carbonatite melts. Geology 2000, 28, 283–285. [Google Scholar] [CrossRef]
  73. McKenzie, D. The extraction of magma from the crust and mantle. Earth Planet. Sci. Lett. 1985, 74, 81–91. [Google Scholar] [CrossRef]
  74. Hunter, R.H.; McKenzie, D. The equilibrium geometry of carbonate melts in rocks of mantle composition. Earth Planet. Sci. Lett. 1989, 92, 347–356. [Google Scholar] [CrossRef]
Figure 1. BSE images of sample cross sections illustrating subsolidus phase relationships in the system K2CO3–CaCO3–MgCO3 at 3 GPa. The samples represent three runs: D094 at 750 °C and duration of 87 h; D086 at 800 °C and 17 h; D102 at 800 °C and 113 h. Typically the limiting reagents have been consumed completely to form stable phases, suggesting that equilibrium has been achieved. However, in some subsolidus runs, the relicts of Mgs were observed among the run products (g). K2#/Ca# indicates bulk composition of the starting mixture, K2# = 100∙K2CO3/(K2CO3 + CaCO3 + MgCO3), Ca# = CaCO3/(CaCO3 + MgCO3). In the case of the low-contrast BSE images, we used element mapping mode combining X-ray intensities of the selected elements (d,e,k).
Minerals 09 00296 g001
Figure 2. BSE images of sample cross sections illustrating phase relationships in the system K2CO3–CaCO3–MgCO3 at 3 GPa and 850 °C. K2#/Ca# indicates bulk composition of the starting mixture, K2# = 100∙K2CO3/(K2CO3 + CaCO3 + MgCO3), Ca# = CaCO3/(CaCO3 + MgCO3).
Minerals 09 00296 g002
Figure 3. BSE images of sample cross sections illustrating phase relationships in the system K2CO3–CaCO3–MgCO3 at 3 GPa and 900 °C. K2#/Ca# indicates bulk composition of the starting mixture, K2# = 100∙K2CO3/(K2CO3 + CaCO3 + MgCO3), Ca# = CaCO3/(CaCO3 + MgCO3). “Damaged K2” is K2CO3 crystals formed after sample polishing during water evaporation in the vacuum prior carbon coating. The water was absorbed by the post-experimental sample owing to elevated indoor humidity (~50%).
Minerals 09 00296 g003
Figure 4. BSE images of sample cross sections illustrating phase relationships in the system K2CO3–CaCO3–MgCO3 at 3 GPa and 950 °C. K2#/Ca# indicates bulk composition of the starting mixture, K2# = 100∙K2CO3/(K2CO3 + CaCO3 + MgCO3), Ca# = CaCO3/(CaCO3 + MgCO3).
Minerals 09 00296 g004
Figure 5. BSE images of sample cross sections illustrating phase relationships in the system K2CO3–CaCO3–MgCO3 at 3 GPa and 1000 and 1050 °C. K2#/Ca# indicates bulk composition of the starting mixture, K2# = 100∙K2CO3/(K2CO3 + CaCO3 + MgCO3), Ca# = CaCO3/(CaCO3 + MgCO3). In the case of the low-contrast BSE images, we used element mapping mode combining X-ray intensities of the selected elements (c,h).
Minerals 09 00296 g005
Figure 6. Isothermal sections of the ternary K2CO3–MgCO3–CaCO3 T-X diagram at 3 GPa. (a) 750 °C, (b) 800 °C, (c) 850 °C, (d) 900 °C, (e) 950 °C, (f) 1000 °C, (g) 1050 °C, and (h) 1100 °C. K2 = Mg–Ca-bearing K2CO3; K2Ca = K2Ca(CO3)2 (Ca# ≥ 70), K2Ca2 = K2Ca2(CO3)3 (Ca# ≥ 83), K2Ca3 = K2Ca3(CO3)4 (Ca# ≥ 96), K2Mg = K2Mg(CO3)2 (Ca# ≤ 21), Arg = aragonite, Mg-Cal = Mg-bearing calcite, Ca-Dol = Ca-rich dolomite, Dol = dolomite, Mgs = magnesite, L = liquid. Colored marks denote different runs, see the legend at the upper-right corner of each figure.
Minerals 09 00296 g006aMinerals 09 00296 g006b
Figure 7. Melting phase relations for the K2CO3–MgCO3–CaCO3 ternary at 3 GPa. Black are boundary lines and white lines (dashed where inferred) are liquidus isotherms with temperatures in degrees Celsius. The phase relations in the corresponding binaries are from [42,46,47].
Minerals 09 00296 g007
Figure 8. Composition of partial melts established at various temperatures in the carbonate-silicate systems with high K/Na ratio (colored marks) plotted on the liquidus projections of the K2CO3–MgCO3–CaCO3 ternary (black and white) at 3 GPa (this study) (a) and at 6 GPa [29] (b). (ce) Schematic drawings illustrating primary phase fields near ternary eutectics, “A” at 3 GPa, “B” and “C” at 6 GPa. L13—[48], S94—[49], T92—[33], GS11a—[50], T12—[51], S16—[22], S17b—[52], B11—[23].
Minerals 09 00296 g008
Figure 9. P-T plot illustrating the stability field of the K–Ca–Mg carbonate melt. Dotted lines are isopleths with numbers indicating the K2CO3 content in the melt in mol %. The isopleths are constrained based on the present results at 3 GPa and previous data at 6 GPa [29]. Thick solid lines indicate solidi of the following systems: CM–CO2 (black)—CaCO3–MgCO3 [42,53]; KCM-CO2 (red)—K2CO3–CaCO3–MgCO3 (this study and [29]); CMAS (grey)—CaO–MgO–SiO2–Al2O3 [54]; CMAS-CO2 (grey)—CaO–MgO–SiO2–Al2O3–CO2 [55]. Carbonated pelite (DG2) (green) solidus [2] coincides with KCM–CO2. Gr-Dia—The diamond-graphite equilibrium boundary [56]. Continental geotherms with a surface heat flux of 35, 40, and 45 mW/m2 [57]. Subduction geotherms [58]. P-T fields for granular and sheared peridotites [59,60].
Minerals 09 00296 g009

