Article

Hydrogenetic, Diagenetic and Hydrothermal Processes Forming Ferromanganese Crusts in the Canary Island Seamounts and Their Influence in the Metal Recovery Rate with Hydrometallurgical Methods

1
Marine Geology Division, Geological Survey of Spain (IGME), Ríos Rosas, 23, 28003 Madrid, Spain
2
Mineralogy and Petrology Department, Geology Faculty, Complutense University of Madrid (UCM), Jose Antonio Novais, 2, 28040 Madrid, Spain
3
Geosciences Institute (IGEO-UCM-CSIC), Severo Ochoa 7, 28040 Madrid, Spain
4
Federal Institute for Geosciences and Natural Resources (BGR), Stilleweg 2, D-30655 Hannover, Germany
5
HERCULES Laboratory, Évora University, Largo Marquês de Marialva, 8, 7000-809 Évora, Portugal
6
Leibniz Universität Hannover Institut für Mineralogie. Callinstraße, 3, 30167 Hannover, Germany
7
Central Laboratories, Geological Survey of Spain (IGME), C/La Calera, 1, 28760 Tres Cantos—Madrid, Spain
*
Author to whom correspondence should be addressed.
Minerals 2019, 9(7), 439; https://doi.org/10.3390/min9070439
Submission received: 10 May 2019 / Revised: 12 July 2019 / Accepted: 13 July 2019 / Published: 17 July 2019

Abstract

:
Four pure hydrogenetic, mixed hydrogenetic-diagenetic and hydrogenetic-hydrothermal Fe-Mn Crusts from the Canary Islands Seamount Province have been studied by Micro X-Ray Diffraction, Raman and Fourier-transform infrared spectroscopy together with high resolution Electron Probe Micro Analyzer and Laser Ablation Inductively Coupled Plasma Mass Spectrometry in order to find the correlation of mineralogy and geochemistry with the three genetic processes and their influence in the metal recovery rate using an hydrometallurgical method. The main mineralogy and geochemistry affect the contents of the different critical metals, diagenetic influenced crusts show high Ni and Cu (up to 6 and 2 wt. %, respectively) (and less Co and REY) enriched in very bright laminae. Hydrogenetic crusts on the contrary show High Co and REY (up to 1 and 0.5 wt. %) with also high contents of Ni, Mo and V (average 2500, 600 and 1300 μg/g). Finally, the hydrothermal microlayers from crust 107-11H show their enrichment in Fe (up to 50 wt. %) and depletion in almost all the critical elements. One hydrometallurgical method has been used in Canary Islands Seamount Province crusts in order to quantify the recovery rate of valuable elements in all the studied crusts except the 107-11H, whose hydrothermal critical metals’ poor lamina were too thin to separate from the whole crust. Digestion treatment with hydrochloric acid and ethanol show a high recovery rate for Mn (between 75% and 81%) with respect to Fe (49% to 58%). The total recovery rate on valuable elements (Co, Ni, Cu, V, Mo and rare earth elements plus yttrium (REY)) for the studied crusts range between 67 and 92% with the best results for Co, Ni and V (up to 80%). The genetic process and the associated mineralogy seem to influence the recovery rate. Mixed diagenetic/hydrogenetic crust show the lower recovery rate for Mn (75%) and Ni (52.5%) both enriched in diagenetic minerals (respectively up to 40 wt. % and up to 6 wt. %). On the other hand, the presence of high contents of undigested Fe minerals (i.e., Mn-feroxyhyte) in hydrogenetic crusts give back low recovery rate for Co (63%) and Mo (42%). Finally, REY as by-product elements, are enriched in the hydrometallurgical solution with a recovery rate of 70–90% for all the studied crusts.

1. Introduction

Submarine deposits of ferromanganese (Fe-Mn) crusts and polymetallic nodules are considered of high economic interest due to their enrichment of several strategic and critical metals such as Mn, Co, Ni, Cu, Mo, Te and the so-called high field strength elements (Rare Earth Elements plus yttrium (REY), Ti, Hf, Nb, Ta, Zr) [1,2,3,4,5,6]. Security of mineral supply has been identified by the European Commission as a priority challenge facing the raw materials sector. The 2017 list of Critical Raw Materials (CRM) now reflects societies’ growing demand for an ever-increasing number and quantity of elements and minerals that supply the green energy and technology sectors [7]. Fe-Mn crusts grow on seamounts and submarine plateaus worldwide in depth ranging from 400 to 7000 m water depth when currents are strong enough to keep the substrate free of sediments [1,5,8]. Fe-Mn crusts are oxyhydroxides’ deposits consisting of Fe-Mn oxide minerals enriched in cobalt and formed by direct precipitation of colloidal metals from seawater onto hard substrates [9]. Fe-Mn polymetallic nodules occur in the abyssal plains of all the oceans; their growth is due to a concentric accretion of Fe-Mn oxyhydroxides around a nucleus from pore water and from the seawater [6]. Several authors performed mineralogical and geochemical studies in order to comprehend the different formation processes of polymetallic nodules and Fe-Mn crusts [1,4,10,11,12,13,14,15,16,17,18].
Marine Fe-Mn deposits are usually classified in three mineralization types depending on the predominant genetic process acting during their growth: hydrogenetic, hydrothermal and diagenetic forming commonly crusts, nodules or stratabounds. Mn-oxides in hydrogenetic crusts are essentially Fe-vernadite and birnessite; on the other hand, diagenetic and hydrothermal deposits show the presence of todorokite, asbolane and buserite [1,19,20,21,22]. Hydrogenetic crusts are enriched in several critical elements like Co, Ni, Te, V, Mo, REYs and Pt (respectively up to 6600, 4500, 60, 850, 500, 2500 µg/g and 560 ng/g) compared with continental crust [2]. Diagenetic nodules are usually enriched in Ni, Cu, Zn and Co (respectively up to 1,3 and 1 wt. % and 1800 and 2000 µg/g) [2]. Finally, Fe-Mn hydrothermal deposits show large fractionation between Fe and Mn, and the oxide minerals can be enriched in one or more of Li, Mo, Zn, Pb, Cu, or Cr [23] and in scarce cases in Co, Cu, Ni, Hg and Ag [24,25,26]. These three genetic processes are usually discriminated by the use of the concentration of Fe, Mn, Ni, Cu and Co of the samples and plotted in a ternary diagram [27,28,29]. Several high resolution studies [1,12,21,23,30,31,32,33] already proved that Fe-Mn deposits are complex and usually formed by the mix, alternation or local influence of different genetic processes. Similar results were already found in a previous study [21] of selected Fe-Mn crusts from Canary Islands Seamount Province (CISP), which initiated their deposition at least 77 My ago in this region [14,21,34,35].
In previous decades, several studies have been carried out in order to extract valuable metals (essentially Ni, Cu, Co and Mn) from Fe-Mn crusts and nodules [36,37,38,39,40,41]. These metallurgical methods are based on two different type of approach: pyrometallurgy or hydrometallurgy. The waste in energy or chemical compounds and the efficiency are critical in order to choose the correct method. New studies propose a selective pre-treatment in order to concentrate valuable metals or the extraction of other metals (i.e., REY) as a byproduct of the extraction of Ni, Cu, Co and Mo [42]. Previous leaching experiments made on CISP Fe-Mn crusts following the experiment of [43] show high recovery rate for Mn, Ni and Co in the hydroxylamine solution (up to 87%) while Cu and V are divided in the hydroxylamine (~55%) and in the hydrochloric (~40%) solutions. Finally, Mo is concentrated in the hydrochloric fraction (~85%) [21].
High resolution analysis of the texture, mineralogy and the geochemistry of Fe-Mn crusts are very important to determine the contents of strategic and critical elements and the minerals to which those elements are linked. Several authors found that economic valuable elements such as Co, Ni, Cu, and Mo are associated with the manganese oxides in different ways depending on the mineral type such as phyllomanganates (7–10 Å vernadite, 7 Å birnessite, 10 Å buserite) or tectomanganates (e.g., 10 Å todorokite) [42,44,45,46,47,48,49]. This line of work can help to select a distinct metallurgic method to extract the economically important metals.
Here, we report high resolution petrographic, mineralogical and geochemical studies of four selected Fe-Mn crusts from the Canary Island Seamount Province (CISP) as representative of economically potential resources in Macaronesia. We are defining structural and textural features for the mineral phases and the critical elements associated with each of them. We introduce the use of FT-IR and Raman as innovative techniques for identification of poorly-crystalline phases for which X-Ray diffraction (XRD) is difficult. Based on our results, we discuss the importance of knowing the genetic processes and consistently the mineralogy of the Fe-Mn crusts as an essential step in order to select the type of metallurgical treatment that should be used to extract economically interesting metals. One leaching procedure was selected and essayed in the studied Fe-Mn crusts. The different mineral phases, defined in this work as critical-elements bearing minerals, and the elements’ association with these different minerals of Fe-Mn crusts represent a key issue of this work.

2. Materials and Methods

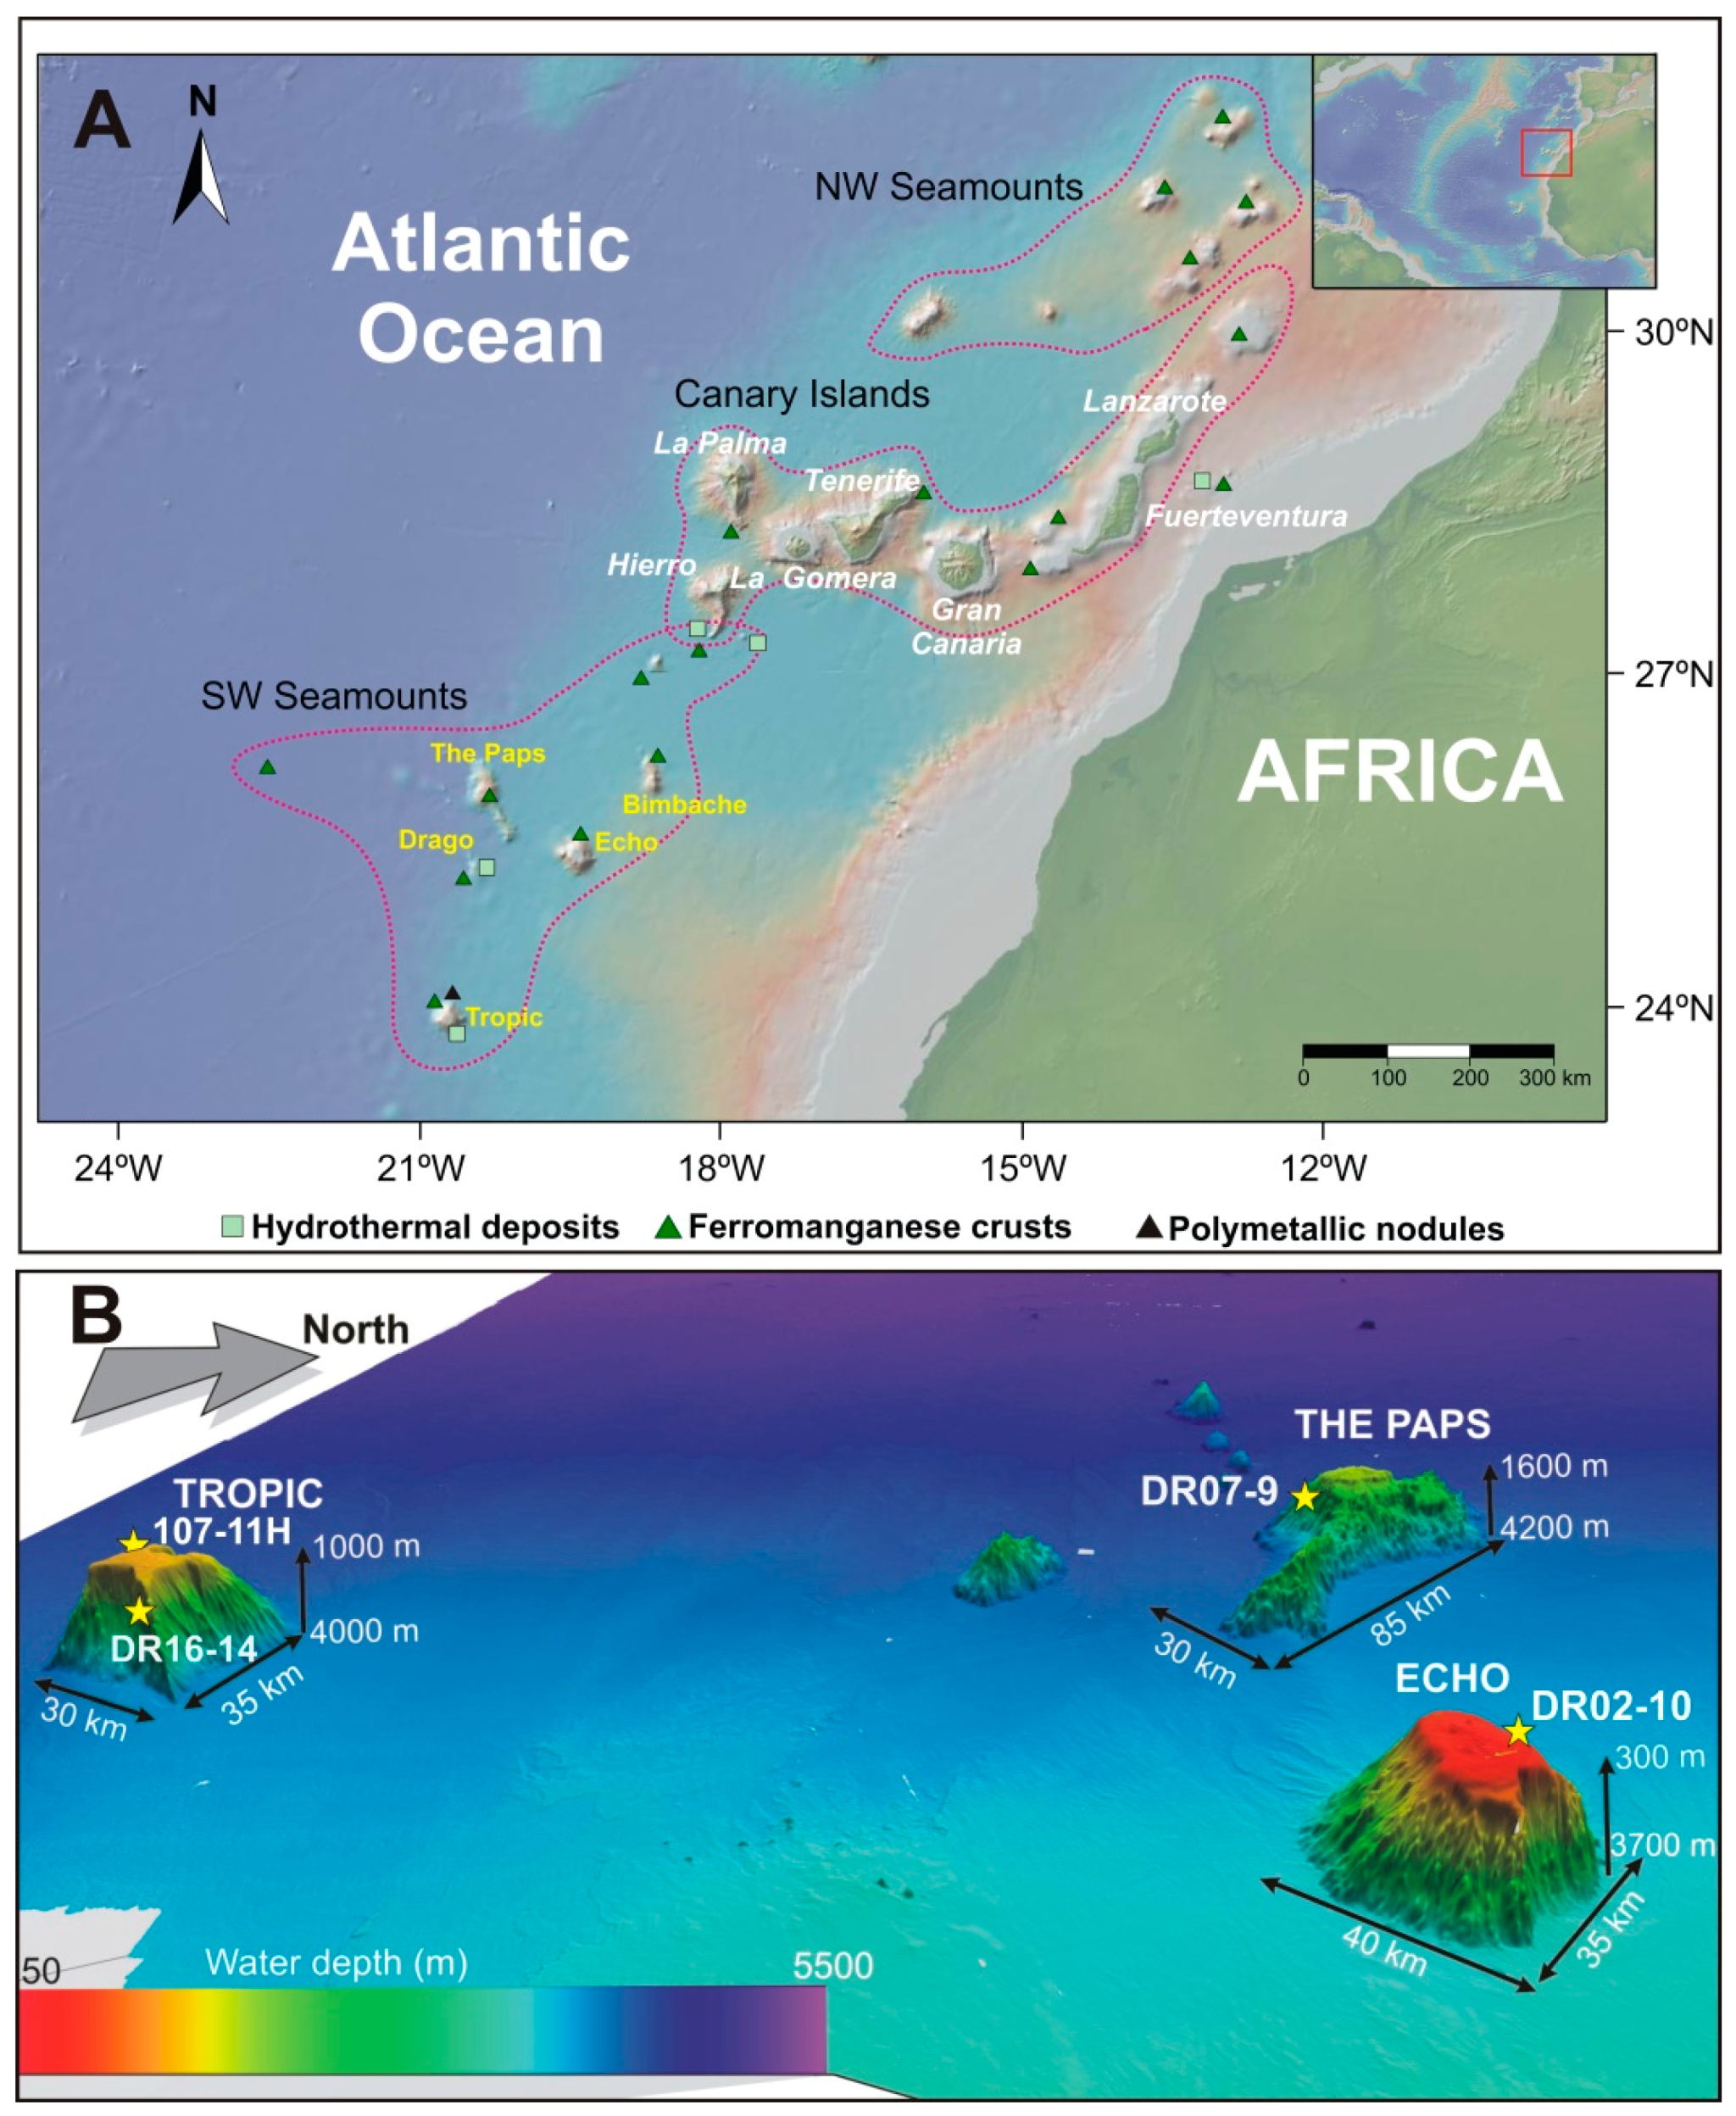
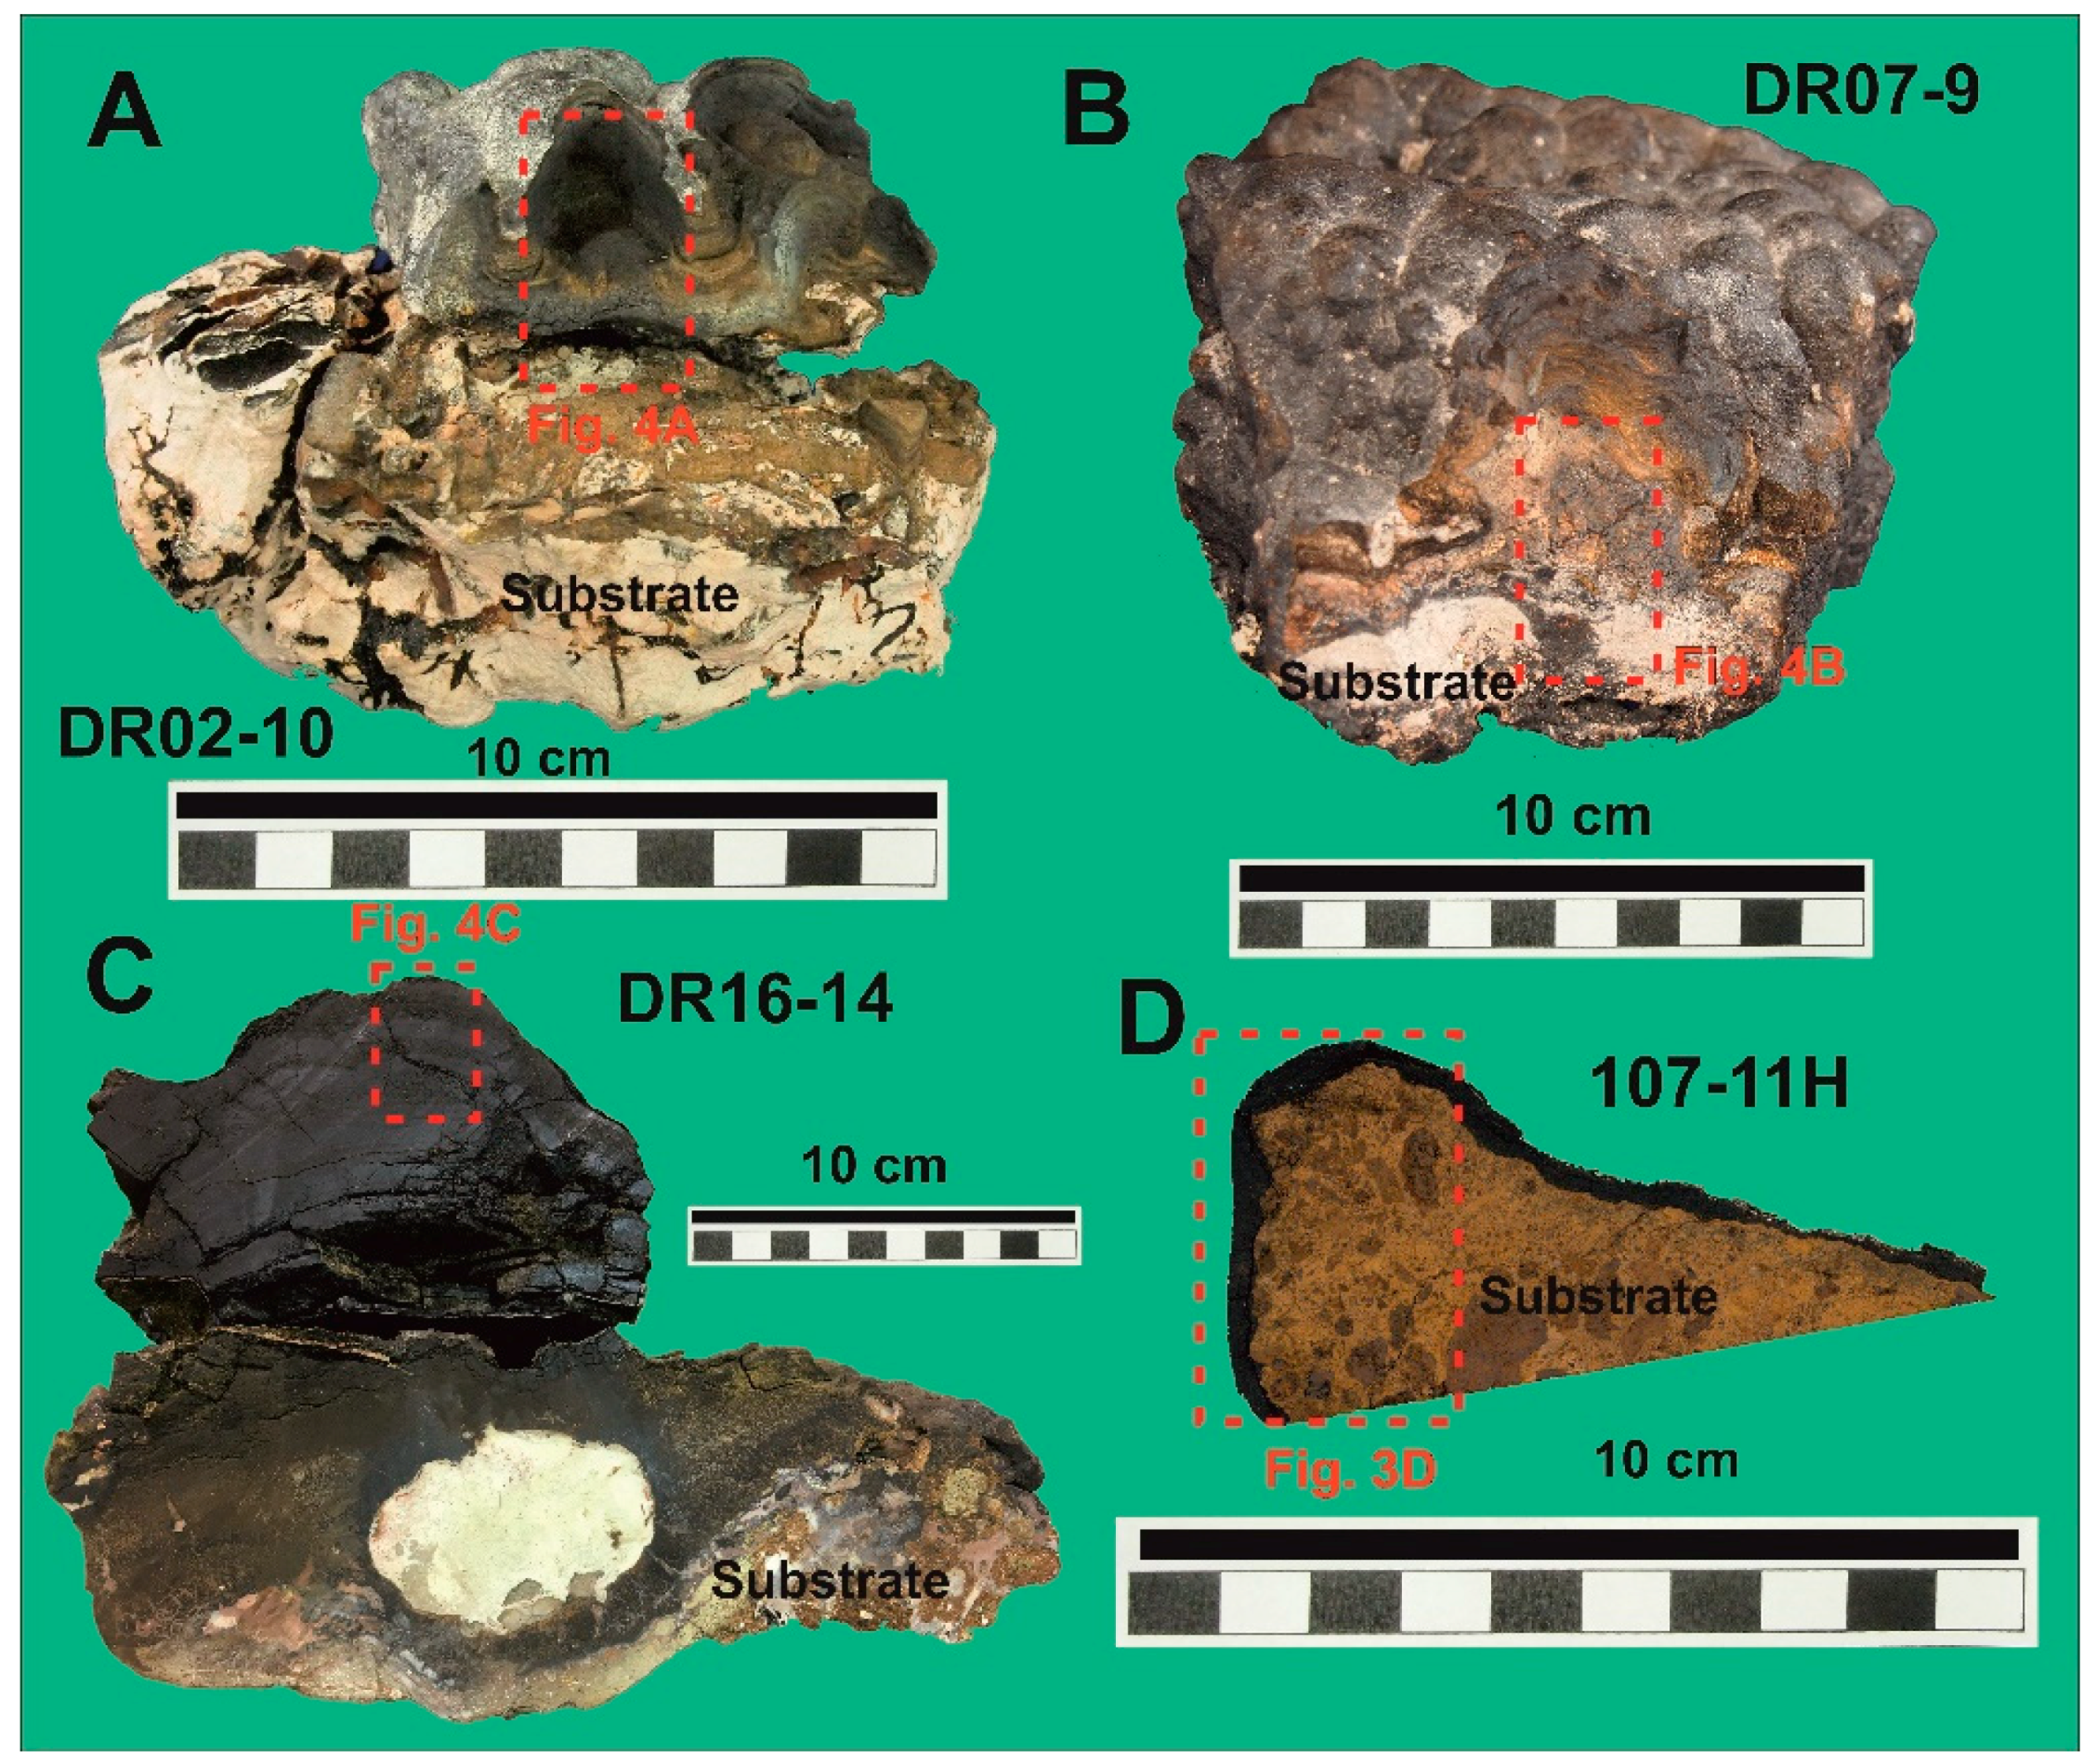
2.1. Sampling and Sample Location

Fe-Mn crusts were selected from dredge hauls collected during the cruise DRAGO0511 (2011), performed by the Geological Survey of Spain (IGME), and using manipulator arms of the remoted operated vehicle (ROV) ISIS during cruise JC142 (2016) performed by National Oceanography Centre (NOC) of Southampton and the British Geological Survey. Four different samples, between 49 previously studied crusts, have been selected for this study based on preliminary mineralogical and geochemical studies, which we suppose represent intermediate composition between different genetic end-members. In addition, they show morphological differences as the presence of well-developed botrioyds or not, texture and color, thickness, different substrates (carbonate rock, phosphorites and altered volcanic breccia). Extensive and thick (3–25 cm) Fe-Mn deposits are covering the substrate rocks and sediments on top and flanks of the seamounts in the CISP [34]. Table 1 shows the sampling sites, location, depth and thickness of studied crusts. This work samples belong to dredges DRAGO0511/DR02 from de Echo Sm., DRAGO0511/DR07 from The Paps Sm., and finally DRAGO0511/DR16 and ROV dive JC142-107 from Tropic Sm (Figure 1 and Figure 2, Table 1). These seamounts are part of the southern CISP. Dredges have been obtained from seamount slopes at water depth between 1700 and 1900 m. The ROV sample was obtained at 1716 m water depth.

2.2. Laboratory Analyses

Different techniques from bulk to high resolution analysis have been used to determine textural, mineralogical and geochemical features of Fe-Mn crusts. XRD, micro-XRD, Raman and FT-IR analysis were performed to determine the mineralogy of the samples. Geochemical studies have been obtained from bulk crusts. Furthermore, high resolution Electron Probe Micro-analyzer (EPMA) and Inductively coupled plasma mass spectrometry (LA-ICP-MS) analyses were conducted to allow a better characterization of the different laminae found in CISP Fe-Mn crusts.
Petrographic, mineralogical and geochemical methods were performed at the Central Laboratories of the Geological Survey of Spain (IGME) (Madrid, Spain), the Department of Crystallography and Mineralogy, Faculty of Geosciences (UCM) (Madrid, Spain), and the National Centre of Electronic Microscopy (ICTS) (Madrid, Spain). Micro spectroscopy (Raman and FT-IR) analyses were performed in the HERCULES laboratory of Évora University, Évora, Portugal while EPMA and LA-ICP-MS were performed in collaboration with the Institute for Mineralogy of the Leibniz University of Hannover (Hannover, Germany) and the Federal Institute for Geosciences and Natural Resources of Hannover (BGR, Hannover, Germany).

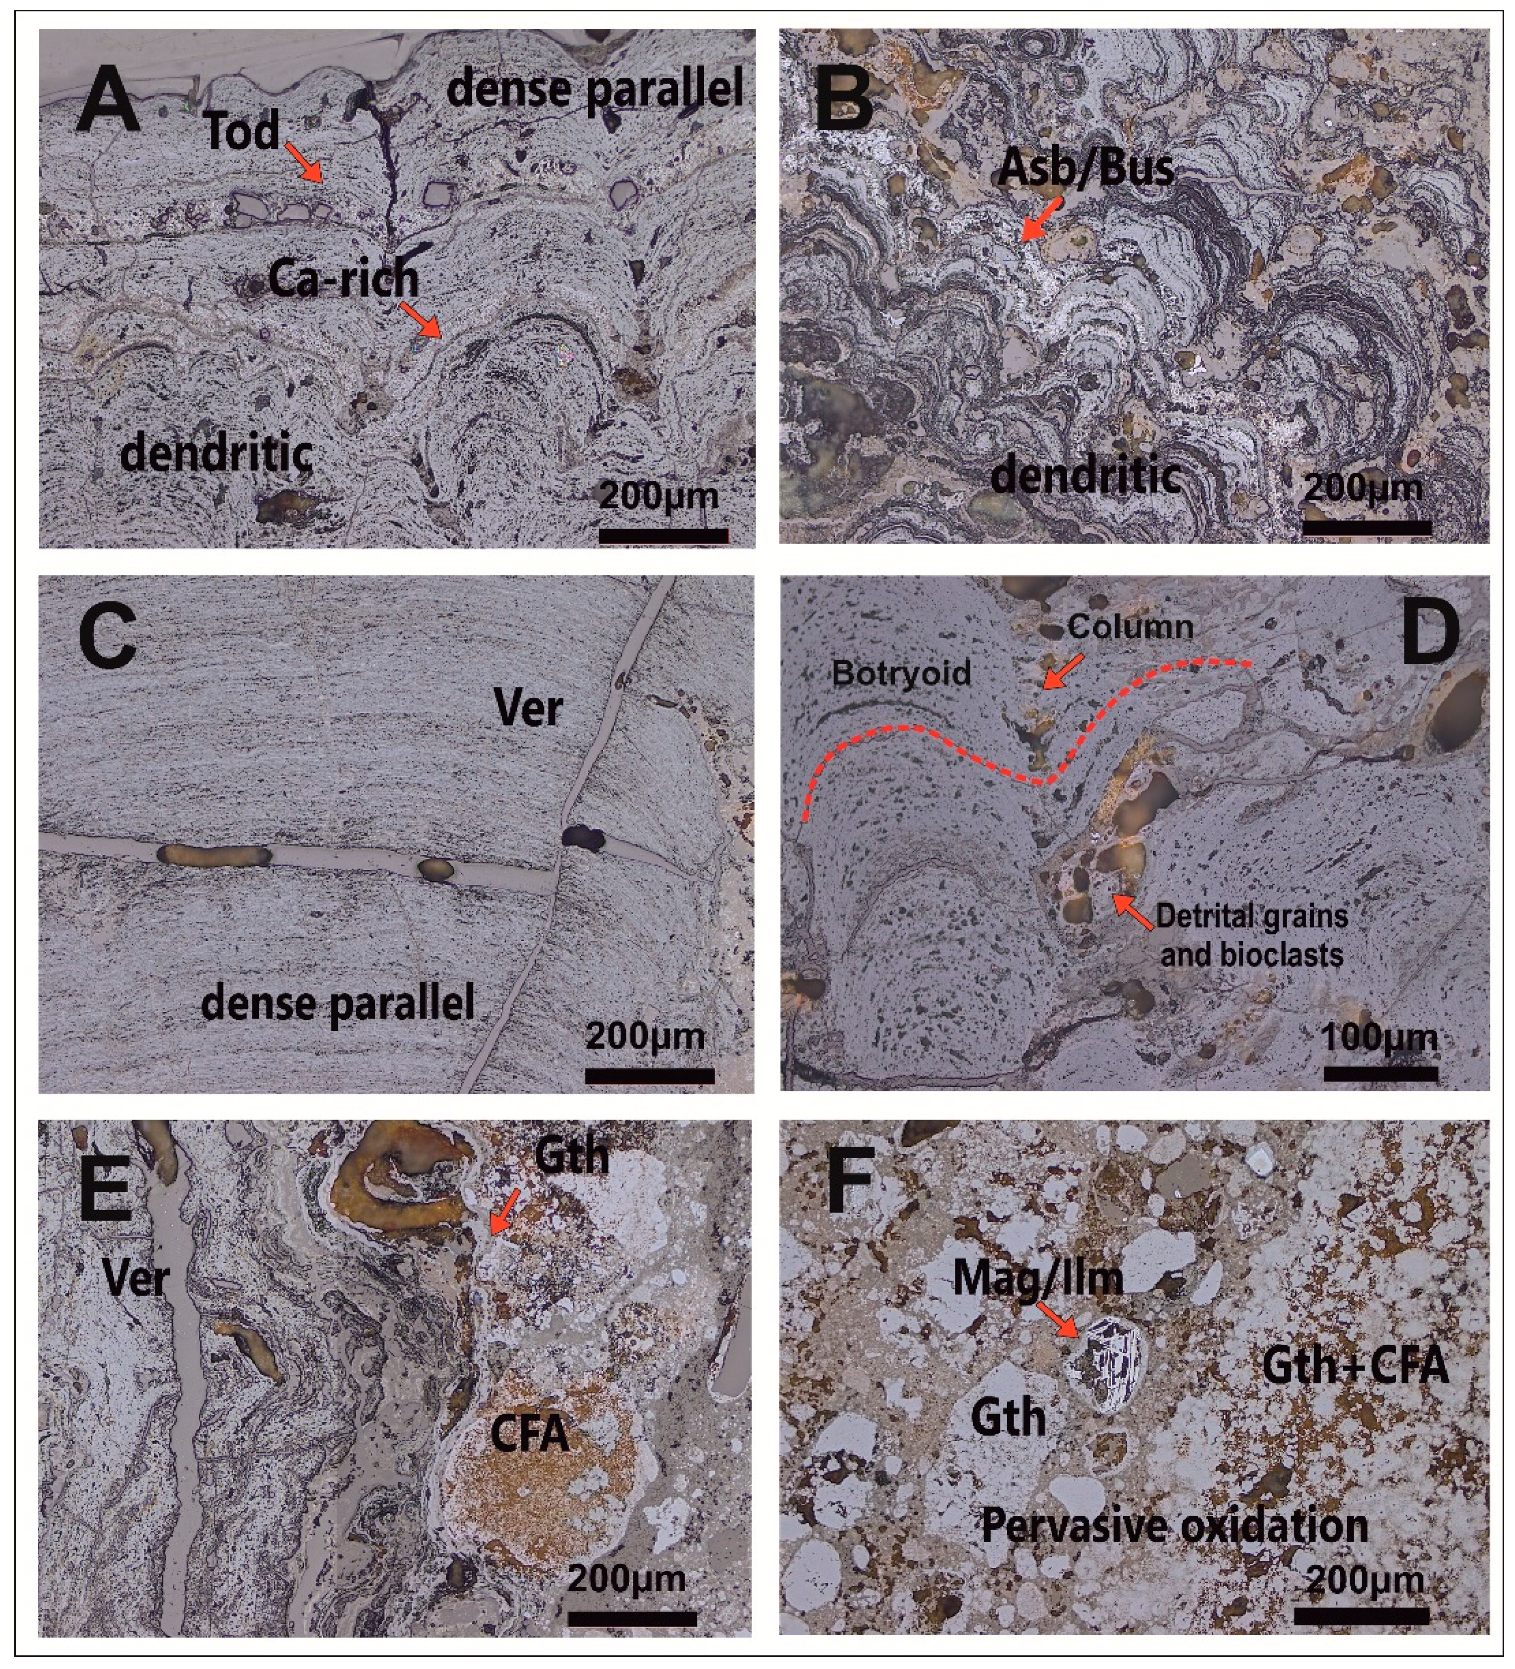
2.2.1. Petrography and Mineralogical Studies

General petrographic analyses of textural and mineralogical features were conducted on polished thin sections (ca. 30–120 μm thick) using a DM2700P Leica Microscope (Leica, Wetzlar, Germany) coupled to a DFC550 digital camera. In this work, we use the terms lamina and layer: lamina is defined as the laterally continuous accretion of Fe-Mn oxyhydroxides with thickness from 1 to 20 microns maximum; layer is defined as the package of several laminae that form a thickness (from 1 to up to 5 cm) with almost the same characteristics and clearly visible in hand samples.
Mineralogical identifications were performed by X-ray powder diffraction (XRD). The equipment used included a PANalytical X’Pert PRO diffractometer (Malvern Panalytical, Almelo, The Netherlands), Cu-Kα radiation, carbon monochromator and automatic slit (PTRX-004). The analytical conditions for the XRD were: CuKα radiation at 40 kV and 30 mA, a curved graphite secondary monochromator, scans from 2–70 (2θ), step size of 0.0170 (2θ) and step time 0.5°/min, mineralogical identification were performed using High Score software and the International Centre for Diffraction Data (ICDD) data base.
Punctual micro XRD was made on polished thin section using a Bruker Discover (Bruker Corporation, Billerica, MA, USA) with Goebel mirror and 1D Lynxeye detector operating at 40 kV and 40 mA, with a beam size of 10 um, a step size of 0.05 (2θ), and a step time of 2 and 10 s (DR02-10, DR16-14 and DR07-9). All of the diffraction patterns have been obtained in profiles selected perpendicular to the lamination of the crusts in a length between 0 and 24 mm.
Raman and FT-IR analyses have been carried out to find a new method to discriminate the individual minerals of low crystallinity within the Fe-Mn crusts. Marine Fe and Mn oxides form poorly crystalline minerals with the absence of long distance order, which make their study difficult using conventional XRD techniques [51]. Therefore, vibrational micro-spectroscopy represented by micro-Raman and micro FT-IR were used to support the identification of these poorly crystalline minerals on selected laminae. Moreover, these techniques could be used directly on thin polished samples as they are nondestructive techniques [52,53,54]. Raman is a spectroscopic technique used to observe vibrational and rotational modes of the different molecules that form a mineral previously excited with a monochromatic laser. Raman has been used in this work to identify vibration and rotation modes of the Mn–O and Mn–O–Mn bonds of Mn minerals. FT-IR, on the other hand, is a technique used to obtain an infrared spectrum of absorption or emission of a material. Raman spectra have been interpreted using an open database RRUFF [55] and the previous work of several authors [54,56,57,58]. FT-IR spectra have been interpreted using [59].
Raman analyses were obtained with a Raman spectrometer HORIBA XPlora (Horiba, Ltd., Kyoto, Japan) equipped with a diode laser of 28 mW operating at 785 nm, coupled to an Olympus microscope (Tokyo, Japan) used for the analyses of the paint cross sections. Raman spectra were acquired in extended mode in the 100–2000 cm−1 region. The laser was focused with an Olympus 50× lens, with 1.1–2.8 mW laser power on the sample surface. For this technique, several exposure times and accumulation cycles have been tested obtaining the better spectra with 10 s of exposure, 50 to 100 cycles of accumulation and 600 g/mm grating that provides high intensity of the signal. The Raman scattering spectra were taken at room temperature between 200 and 900 cm−1, where most of Fe-Mn oxyhydroxides peaks are identifiable.
FT-IR data have been collected with an infrared spectrometer Bruker Hyperion 3000 (Bruker Corporation, Billerica, MA, USA) equipped with a single point mercury cadmium telluride (MCT) detector cooled with liquid nitrogen and a 20× ATR objective with a Ge crystal of 80 μm diameter. The infrared spectra were acquired with a spectral resolution of 4 cm−1, 64 scans, in the 4000–650 cm−1 of the infrared region.

2.2.2. Bulk Geochemical Analyses

The major elements for bulk Fe-Mn crusts were determined using X-ray Fluorescence (XRF), PANalytical’s ZETIUM (Malvern Panalytical, Almelo, The Netherlands) equipment with a rhodium tube and major software (SuperQ, Malvern Panalytical, Almelo, The Netherlands) and Irons protocol. The accuracy of the data was verified using international standard NOD-A-1 (USGS), and precision was found to be better than ±5%. Analytical conditions were 50 kV voltage and 50 mA. The obtained contents were compared with certified international standards (Tables S1 and S2). Na was measured using a Varian FS-220 atomic absorption spectrometer (Varian Inc., Palo Alto, CA, USA) and loss on ignition (LOI) was determined by calcination at 950 °C. For Inductively coupled plasma mass spectrometry (ICP-MS) and Inductively coupled plasma atomic emission spectroscopy (ICP-AES) measurements, samples were prepared with an ultrapure 3-acid digestion (HF, HNO3, and HCl), dried afterwards until almost complete dryness and the residuals were diluted with HCl 10%. ICP-AES (Varian Vista-MPX, Varian Inc., Palo Alto, CA, USA) was used to measure Nb, S and W in bulk samples. Be, V, Co, Ni, Cu, Zn, As, Se, Mo, Ag, Cd, Sb, Ba, Tl, Pb, Th, U and REEs plus Y were measured with ICP-MS (AGILENT 7500 CE, Agilent Technologies, Santa Clara, CA, USA) with 3-acid digestion. Several standard reference materials were used to validate the analytical procedure for trace elements determinations. Measurements have been verified using artificial certified solution and following this analytical sequence: certified solution → blank → reference material → sample → reference material. Blanks were prepared using the same procedure of samples and their analytical contents was below detection limit for all the elements but Cu, Ba and Zn that show respectively 0.1, 0.5 and 1,4 µg/L. The accuracy and precision of the analytical methods have been calculated using the reference material NOD-A-1 (Table S3).
Electron probe micro-analyses (EPMA) were carried out on polished thin sections in order to identify elemental distribution in micro-structures of the selected samples. For this, a Jeol JXA-8900M Electron Probe wavelength dispersive spectrometers/energy dispersive spectrometers (WDS/EDS) Micro Analyzer (Jeol, Tokyo, Japan) was used, operating at 15–20 kV and 50 mA, operating at 15 EDS, and equipped with four wavelength dispersion spectrometers in which these crystals were placed, as follows: channel 1: TAP; channel 2: LIF); channel 3: PETJ; channel 4: PETH. Standards included pure metals, synthetic and natural minerals, all from international suppliers. Back-scattered electron images were also obtained with this instrument. Electron probe micro-analyzer (CAMECA SX 100 and JEOL JXA-8530F, CAMECA, Paris, France, JEOL, Tokyo, Japan) was used in the BGR laboratory. Analyses were made on polished thin sections at 15/20 kV accelerating voltage and 40 nA beam current. The single layers were analyzed with a focused (1–5 µm) and a defocused (5–20 µm) beam. Counting times for the analyzed elements were 10 s for Mn, Fe, Ni, Cu, Na, Mg, Al, Si, K, Ca, Ti, P, S, Cl, 40 s for V, 45 s for Pb, 50 s for Co, 90 s for Zn, 100 s for Ba, Mo and Sr and 110 s for Ce. Rhodochrosite (Mn), hematite (Fe), cobaltite (Co), synthetic Ni2Si (Ni), cuprite (Cu), albite (Na), kaersutite (Mg, Al, Si), biotite (K), apatite (Ca, P), rutile (Ti), willemite (Zn), barite (S, Ba), monazite (Ce), molybdenite (Mo), krokoite (Pb), celestine (Sr), vanadium metal (V) and tugtupite (Cl) were used as standards (BGR standards).

2.2.3. In Situ Trace Element Analyses by Femtosecond-LA-ICP-MS

Trace element concentrations of selected zones of the Fe-Mn crusts were acquired by femtosecond-laser ablation-ICP-MS employing a fast scanning sector field ICP-MS (Thermo Scientific Element XR, Thermo Fisher Scientific, Waltham, MA, USA) coupled to a Spectra Physics (Santa Clara, CA, USA) Solstice 194 nm femtosecond laser ablation system at the Institute of Mineralogy at the Leibniz University of Hannover (Hannover, Germany). Details of the fs-LA system are described in [60,61,62,63]. In the present study, sample material was ablated along lines with a laser spot size of 40 µm in diameter and a scanning speed of 20 µm/s. Laser repetition rate was 20 Hz. Each analysis consisted of 30 s background acquisition and 60–80 s ablation interval. Ablated material was transported with a He gas stream towards the ICP-MS and mixed with Ar before entering the torch. The ICP-MS was operated in low mass resolution mode and the following isotopes were analyzed: 7Li, 27Al, 43Ca, 55Mn, 57Fe, 59Co, 60Ni, 63Cu, 66Zn, 69Ga, 75As, 77Se, 89Y, 90Zr, 93Nb, 95Mo, 121Sb, 125Te, 139La, 140Ce, 141Pr, 143Nd, 147Sm, 153Eu, 157Gd, 159Tb, 163Dy, 165Ho, 167Er, 169Tm, 172Yb, 175Lu, 177Hf, 181Ta, 208Pb, 232Th, 238U. ThO-Th ratios were monitored and found to be always <0.4%, indicating that oxide formation rates were negligible. Precision of the technique is better than 1.5% and the accuracy is better than 1.6%. External calibration of the acquired data was performed using the USGS reference glasses BCR-2G with the preferred values reported in the GeoReM database [64], or using NIST SRM 610 [65]. Data reduction was performed with the Lotus-based spreadsheet program LAMTRACE [66] where 27Al was used for internal standardization.
REY anomalies represent the deviation of the value of the selected element from neighboring elements based on the expected change in REY abundances as a function of atomic number and ionic radii [67]. In order to calculate the anomaly produced by Ce, Eu and Y on bulk samples and LA-ICP-MS analyses on laminae have used the following equations:
C e S N / C e S N   * = 2 × C e S N L a S N + P r S N ,
E u S N / E u S N   * = 2 × E u S N S m S N + G d S N ,
Y S N / Y S N   * = 2 × Y S N D y S N + H o S N .

2.2.4. Hydrometallurgical Method

Several extractive methods have been proposed to process Fe-Mn marine deposits. Pyrometallurgical methods foresees the grind and pre-reduction of the ore and then fed in a furnace with temperatures 1380 to 1420 °C where the metal phase (Fe, Ni and Cu) is formed. Hydrometallurgical methods foresees the use of different leaching agents (HCl, HF, H2SO3) in order to obtain solution enriched in the valuable metals (Co, Cu, Ni, Mo) [36,38,39,40,41]. The hydrometallurgical method used here was previously essayed on Fe-Mn nodules [68,69] and foresees the digestion of the samples in hydrochloric acid (HCl) with the addition of a reducing agent (ethanol) obtaining metals chlorides’ complexes following the equation showed in [69] that remain in solution with up to 90% recovery rate for target elements. The experiment has been selected to prove its efficacy also on Fe-Mn crusts taking in account the recovery rate, similar to all the others’ described methods, together with its less energy waste and simplicity to develop in a geochemical laboratory. The experiment has been used in CISP crusts (DR02-10, DR07-9 and DR16-14) to calculate the percentage of valuable metal recovery. Sample 107-11H shows very thin hydrothermal laminae to be physically separated from the whole crust and see differences due to this genetic process on the recovery rate. For the experiment, two grams of powdered sample were used and leached in 100 mL of solution. The method assumed the leaching of the samples using HCl (23 mL) and the addition of 18.5% of the total volume of ethanol (18.5 vol. %), in order to maintain a reduced condition in the solution, in which the acid concentration remained 2.75 mol/L, for at least five hours with a rotating magnet to allow a better dissolution of the samples, following the proceedings of [68] and modified by [69]. Resultant solution has been filtered with a paper filter with 0.27 mL/s flow rate and pore size of <2 µm. The obtained acid solution was analyzed to calculate the recovery rate for all the strategic elements. Previous results of sequential leaching obtained in [21], with recovery rates of 92–93% Co, 76–87% Ni, 30–55% Cu (in the Mn-oxide fraction) and 85–89% Mo (in the Fe-oxyhydroxides fraction) have been used to compare the recovery rates obtained applying the hydrometallurgical method.

3. Results

3.1. Fe-Mn Crusts Structure

The thickness of the Fe-Mn crusts studied in this work range from less than 1 to 14 cm. The surface morphology of studied crusts vary from botryoidal shape (DR02-10 and DR07-9) forming sub-spherical botryoids (1–4 cm diameter) to planar-subparallel laminations covering substrate rocks (DR16-14 and 107-11H). The crusts present an accumulation of thin laminae represented by continuous accretion of Fe-Mn minerals with thickness in some laminae down than one micron. The union of packages of laminae with the same characteristics forms sublayers and layers. In Fe-Mn crusts studied from CISP, three to four main layers can be discriminated. The main layers could be differentiated by drastic changes in crust color, from black to dark brown or reddish brown, textural changes, i.e., from dendritic/mottled to subparallel, density of the lamination and changes in porosity of the crusts (Figure 2). In cross-sections, crusts show columnar, mottled, botryoidal and laminated layering (Figure 3A–F).
Crust DR02-10 shows dark brown to reddish brown color generally matte (Figure 2 and Table 1) and an average thickness of 38 mm in which it is possible to identify almost three main layers (1–1.5 cm thickness) visible by changes in crust color and density of the lamination. Crust DR07-9 has an average thickness of 90 mm. with a black to brownish color, forming four main layers (1–2 cm thickness). Crust DR16-14 is the thicker crust of the studied in this work with an average of 140 mm. This crust shows a black color, sometimes with a metallic luster, which change to dark brown at its base. Four (2–5 cm thickness) main layers could be differentiated by changes in density lamination and porosity in the upper part and by color changes near the substrate rock. Finally, crust 107-11H shows a very thin layer (less than 5 mm) with a subparallel lamination (Figure 2 and Table 1).
Substrate rock of crust DR02-10 is represented by hard consolidated, white-pinkish, phosphatized carbonate rock (Figure 2A). Crust DR07-9 forms upon a semi-consolidated limestone, with a beige color, in which it is possible to identify the presence of Fe-Mn minerals growing in cavities of the rock. (Figure 2B). Sample DR16-14 is covering a volcanic breccia with carbonate cement and phosphatization, with a pinkish color (Figure 2C). The substrate of the crust 107-11H is formed mainly by intensively altered volcanic breccia with an orange/brown color, in which it is possible to identify several altered clasts in an oxide matrix (Figure 2D).

3.2. Mineralogy

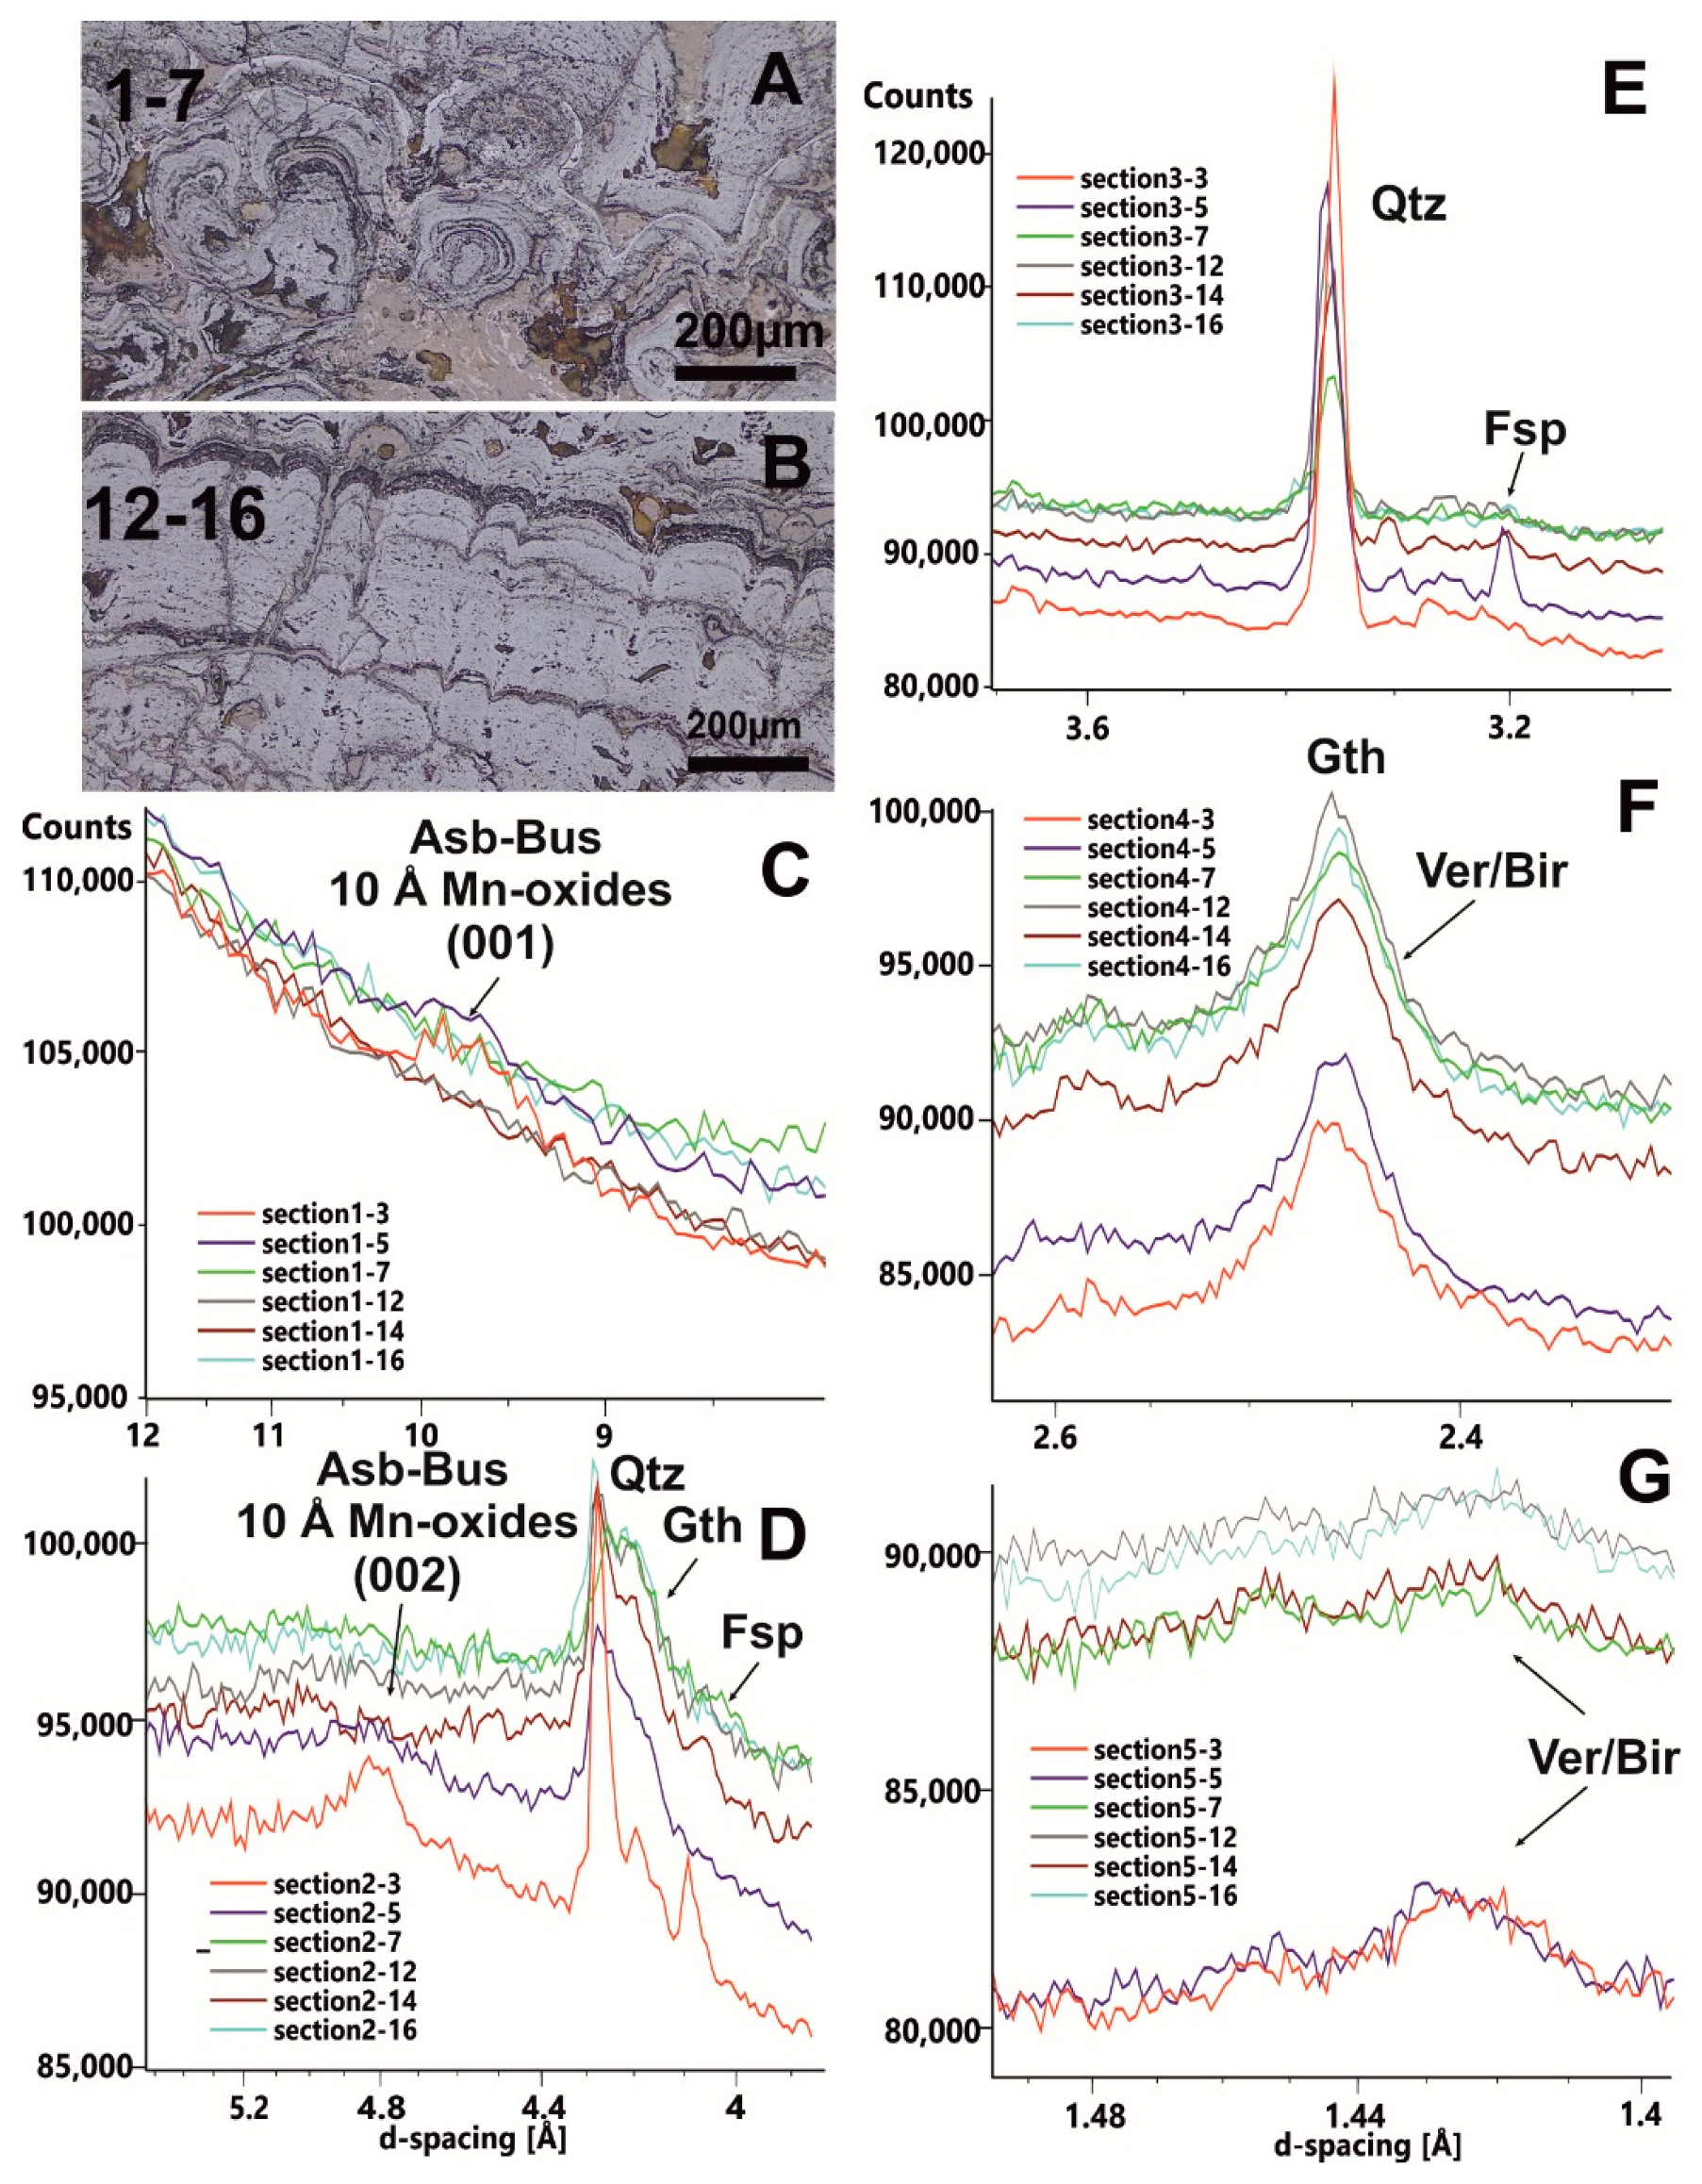
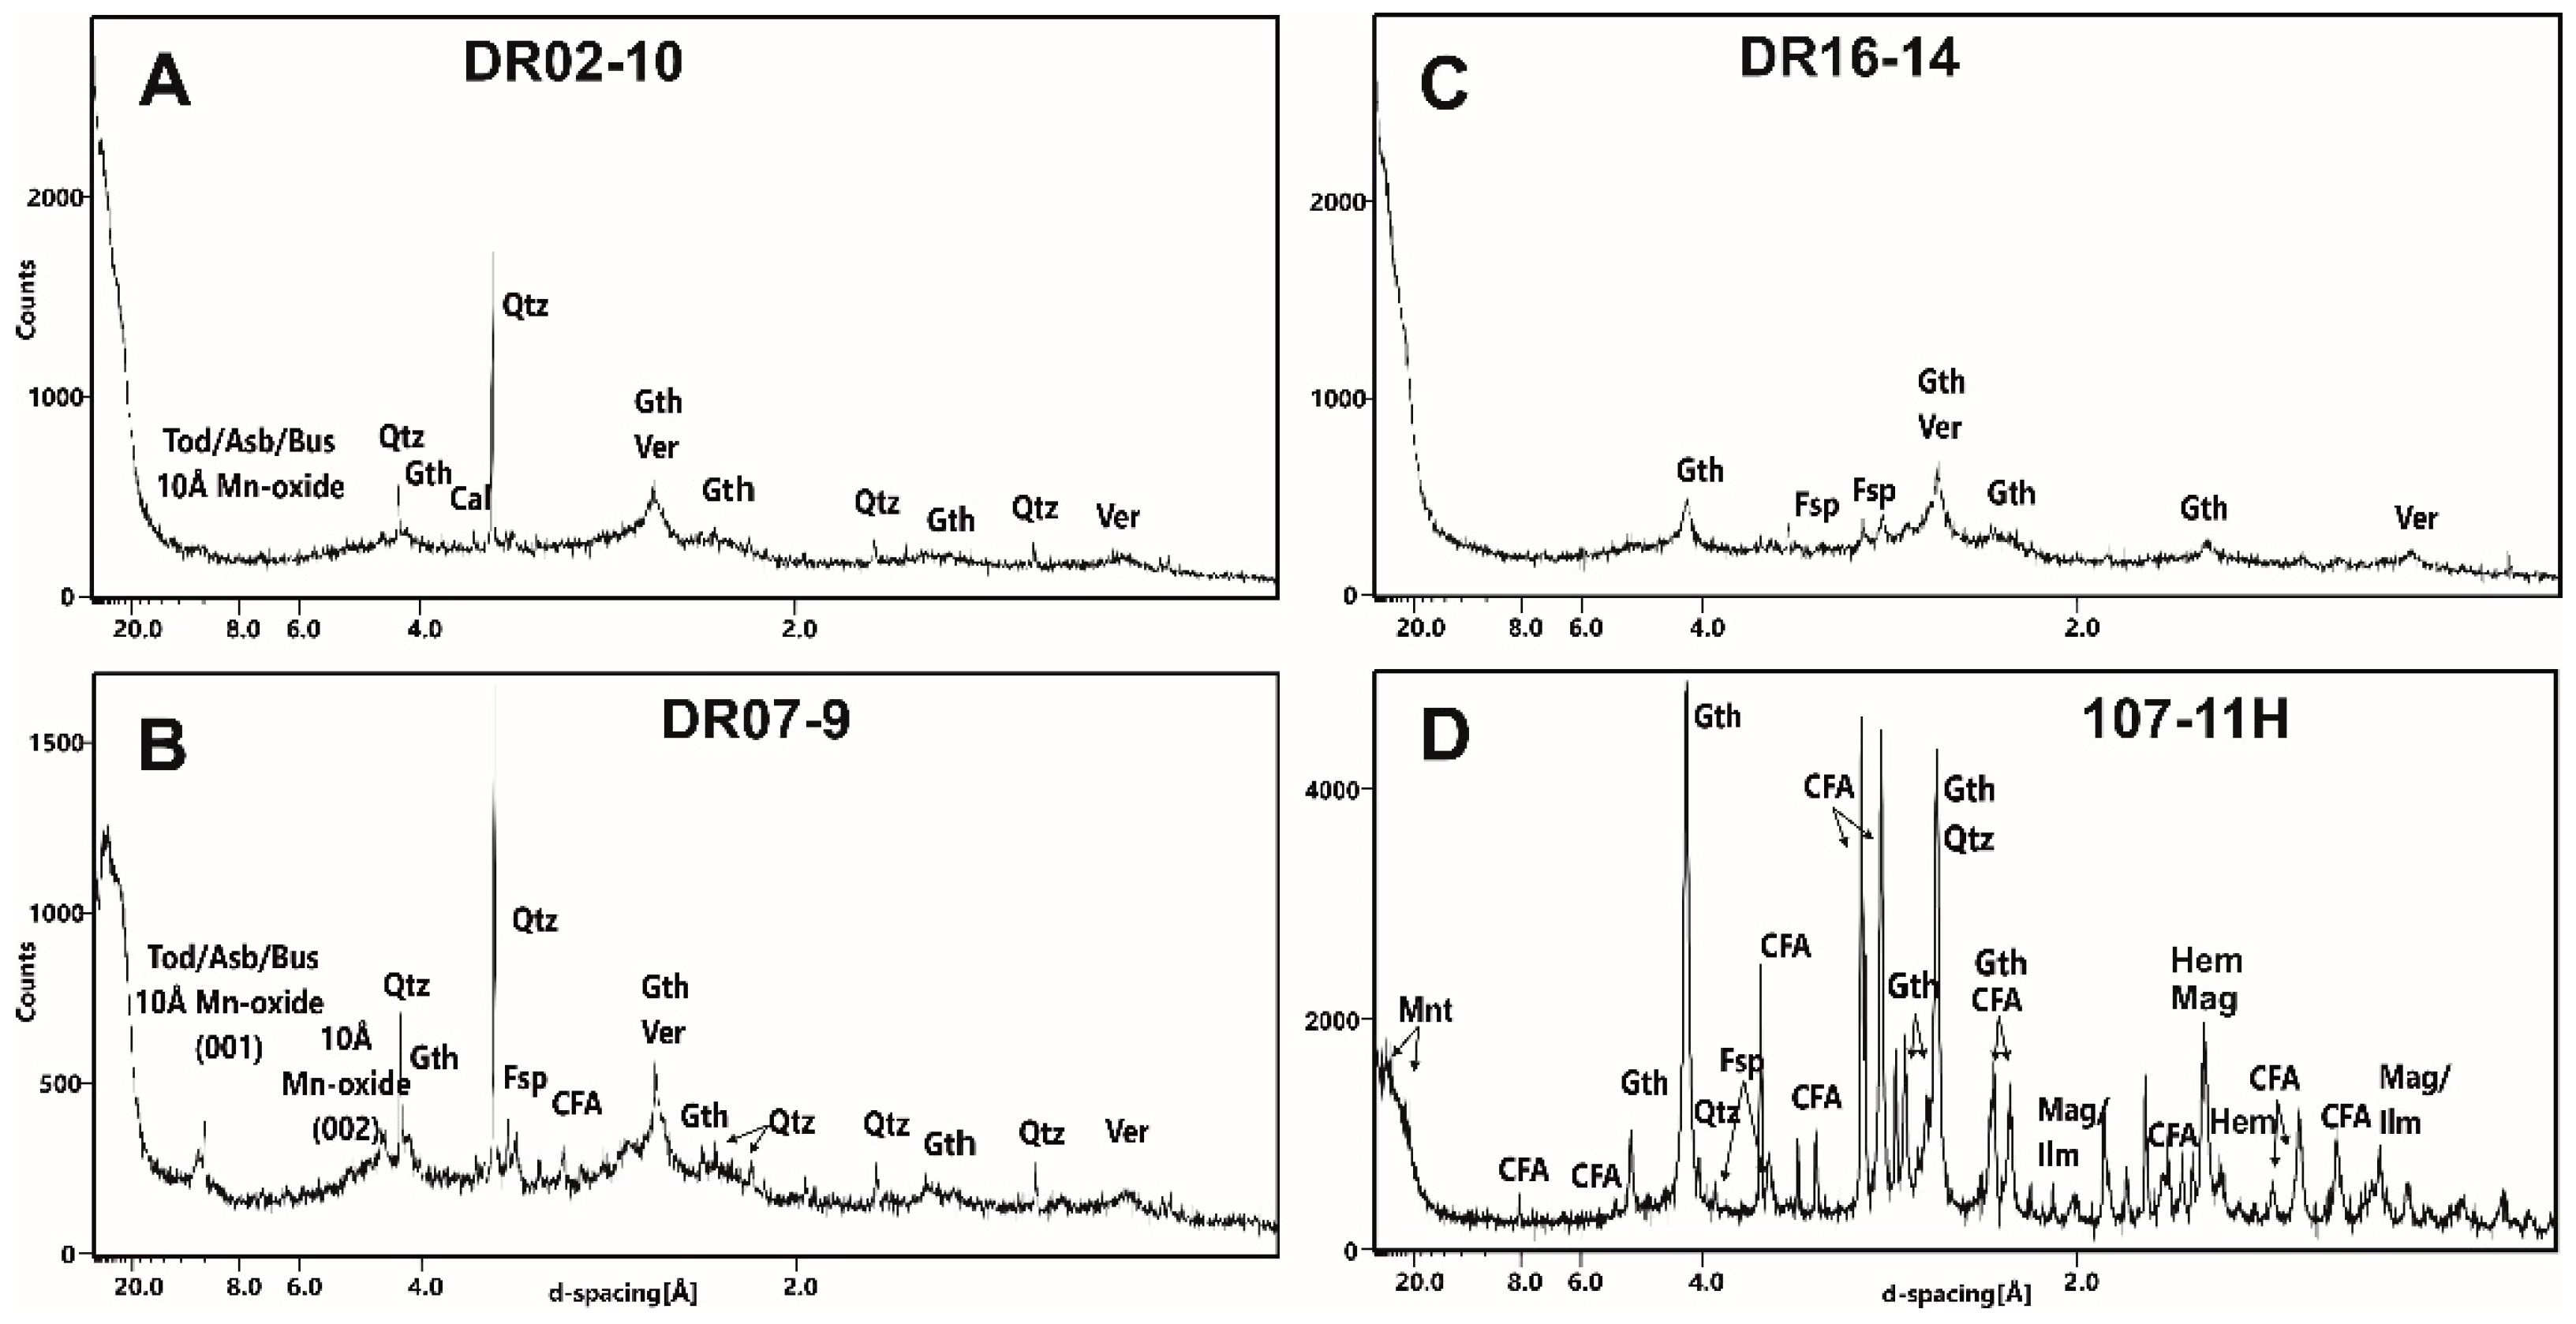
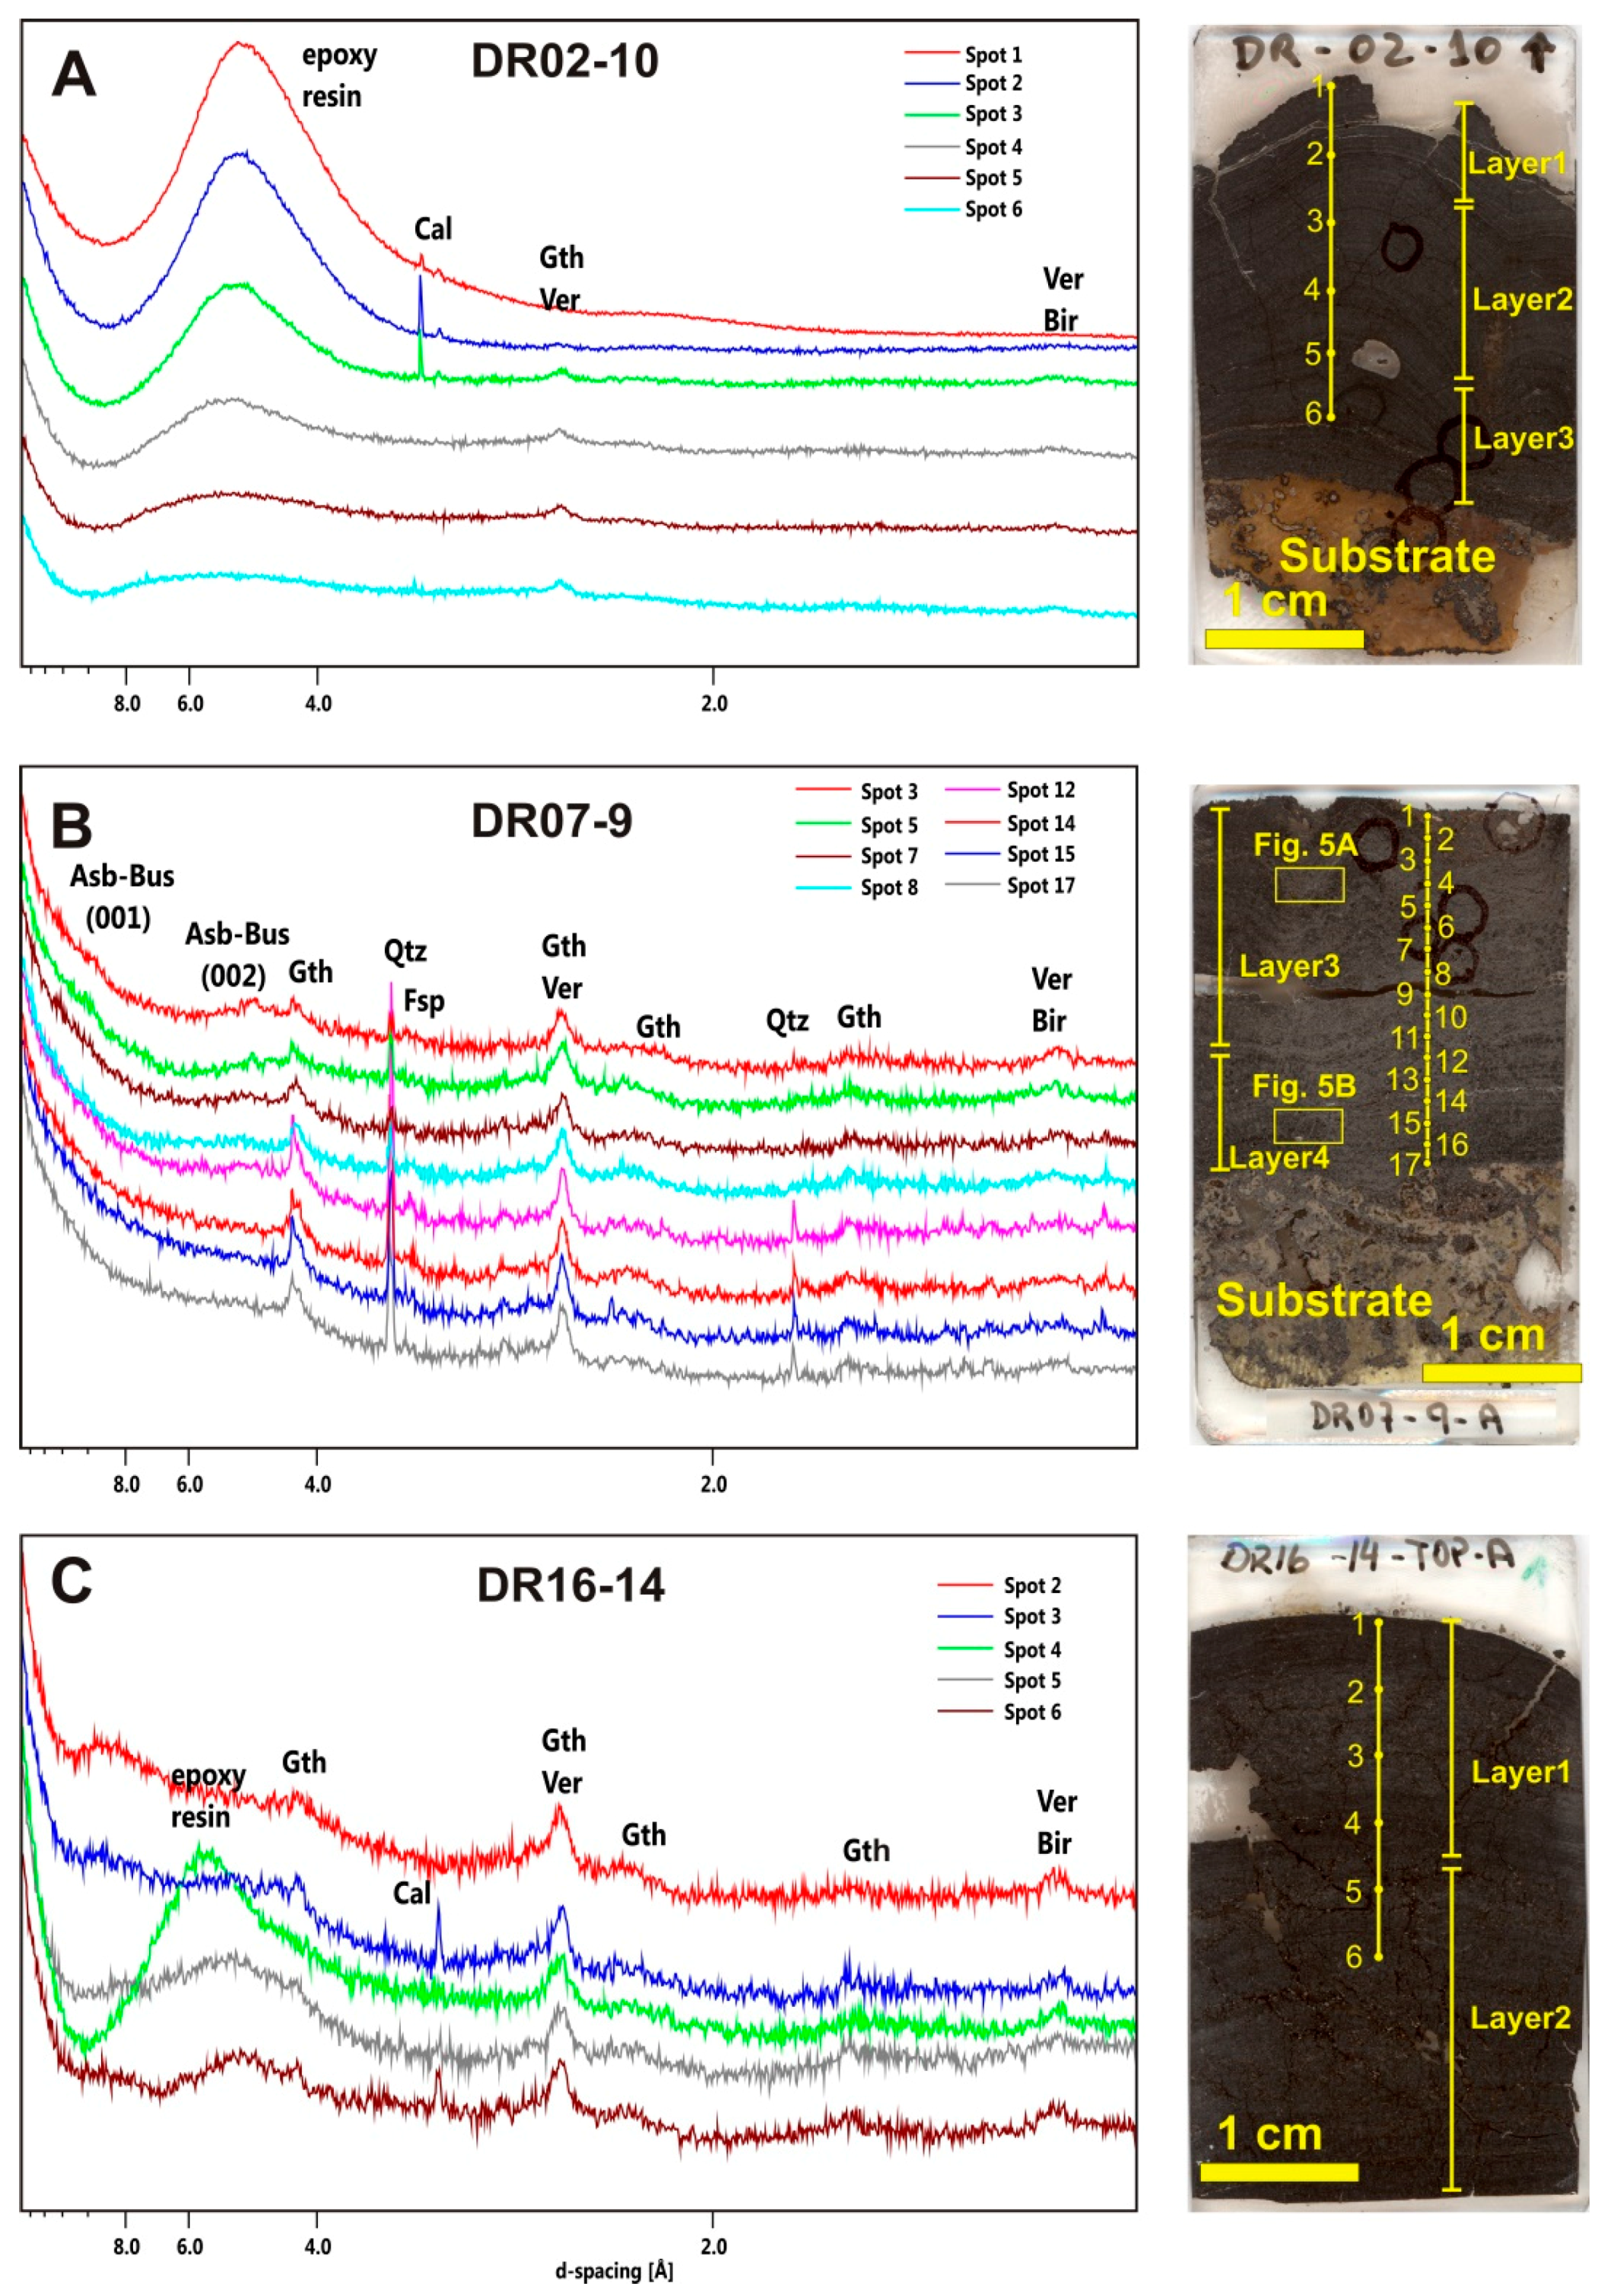
3.2.1. Petrography, XRD and Micro-XRD

Under the petrographic microscope with reflected light, CISP Fe-Mn crusts are grey colored with low to imperceptible pleocroism; in crossed nicols, they are isotropic. Fe-Mn oxyhydroxides form sub-parallel laminae of less than a micron thickness. Within the crusts, it is possible to identify some detrital and accessory minerals, usually represented by wind-transported quartz and feldspar, calcite and bioclasts formed by coccoliths and foraminifera tests, as was already observed in previous studies [21,34] (Figure 3D). The Fe-Mn oxyhydroxides accretion is usually botryoidal (DR02-10) and sometimes form dendritic to mottled or dense-subparallel textures (DR07-9 and DR16-14) (Figure 3A–D). In crusts DR02-10 and DR07-9, some bright laminae concordant growth structures were identified occupying an area with predominance of dendritic growth structures (Figure 3A,B) and abundant detrital minerals (quartz and feldspars). The bright laminae show fibrous internal texture (Figure 3B). On the other hand, crust DR16-14 shows a columnar to dense parallel lamination, with very low growth rate (Figure 3C,D) as already seen in [21]. Finally, crust 107-11H is formed by a core of volcanic breccia in which it is possible to identify several ghosts of previous minerals (feldspar and magnetite) and the presence of a pervasive oxidation of the substrate with abundant goethite and disseminated CFA. Covering this substrate, there is a thin Fe-Mn crust with the presence of bright laminae in the rock-crust contact but also through the lamination (Figure 3E,F).
XRD analyses on bulk samples show their low crystallinity, low counts and un-defined reflections of these ferromanganese mineralizations. Detected minerals are predominantly represented by Mn-oxides and Fe-oxyhydroxides with low contents of detrital minerals. Fe-vernadite (hereafter vernadite) is the most abundant Mn-oxide phase (up to 90%) followed by birnessite (7 Å phyllomanganates). Vernadite is clearly recognized in the broad reflections at 2.45 and 1.42 Å that occur in all samples but 107-11H, in which it is impossible to recognize it due to the reflection of better crystallized minerals (Figure 4). Birnessite usually overlaps vernadite in the same range reflections. Some samples show the presence of small amounts of buserite and asbolane which are intergrown with each other. Asbolane and buserite, but also todorokite, have typical reflections around 9–10 Å and can be seen in crusts DR02-10 and DR07-9 (Figure 4A,B). Fe-oxyhydroxides are represented essentially by goethite group minerals, represented by goethite, lepidocrocite and feroxyhyte, all stable polymorphs of the iron oxyhydroxide FeO(OH). Detrital minerals are represented by quartz (Qtz), feldspar (Fds) and calcite (Cal) recognized in crusts DR02-10 and DR07-9 (Figure 4A,B). Crust 107-11H only shows the presence of goethite, hematite, magnetite/ilmenite and carbonate fluor-apatite (CFA) with quartz, smectite and feldspars. Mn-oxides in this sample are very scarce (Figure 4D, Table 2).
XRD profiles made on cross-sections show variations in mineralogy through the sequences of precipitation for each ferromanganese deposit, from sub-actual laminae on top (rich in detrital and 10Å Mn-oxides, i.e., DR07-9 or calcite, i.e., DR02-10 and DR16-14) to ancient layers at the base (richest in vernadite, i.e., DR16-14) as is detailed below.
Crust DR02-10 shows the formation of a broad reflection in the range from 6 to 4 Å due to the epoxy resin. This lump is higher in the upper part of the sample due to higher porosity (Figure 5A). In the upper part of the crust, the presence of calcite is recognized. In crust DR07-9 detrital minerals, quartz and feldspar are distributed throughout the whole sample.
Reflections of quartz and feldspars are better defined in the surface layers, meaning a major detrital input during the growth of the last 6–7 mm (Figure 6C,D Sections 2-3, 2-5, 3-3, 3-5).
In the same area and clearly related to the bright laminae of the crust section around 4.5 mm and 6 mm depth (Figure 6A), small reflections at 9.8 and 4.5 Å can be identified, which are characteristically for Mn-oxides such as 10 Å phyllomanganates (Figure 6B,C; Sections 1-3, 1-5 and 2-3, 2-5).
Cross XRD section on crust DR16-14 also shows the same lump due to the epoxy resin in the middle part of the crust and a low amount of detrital minerals. The micro-XRD profile shows the presence of the reflection belonging to calcite grains in the inter-columnar region or the presence of detrital particles and bioclasts (foraminifera and coccoliths) that have also been detected under the petrographic microscope in the middle part of the cross section (Figure 5C). Fe and Mn minerals are represented by goethite 4.2 and 2.4 Å and vernadite 2.45 and 1.42 Å reflections (Figure 4C and Figure 5C).

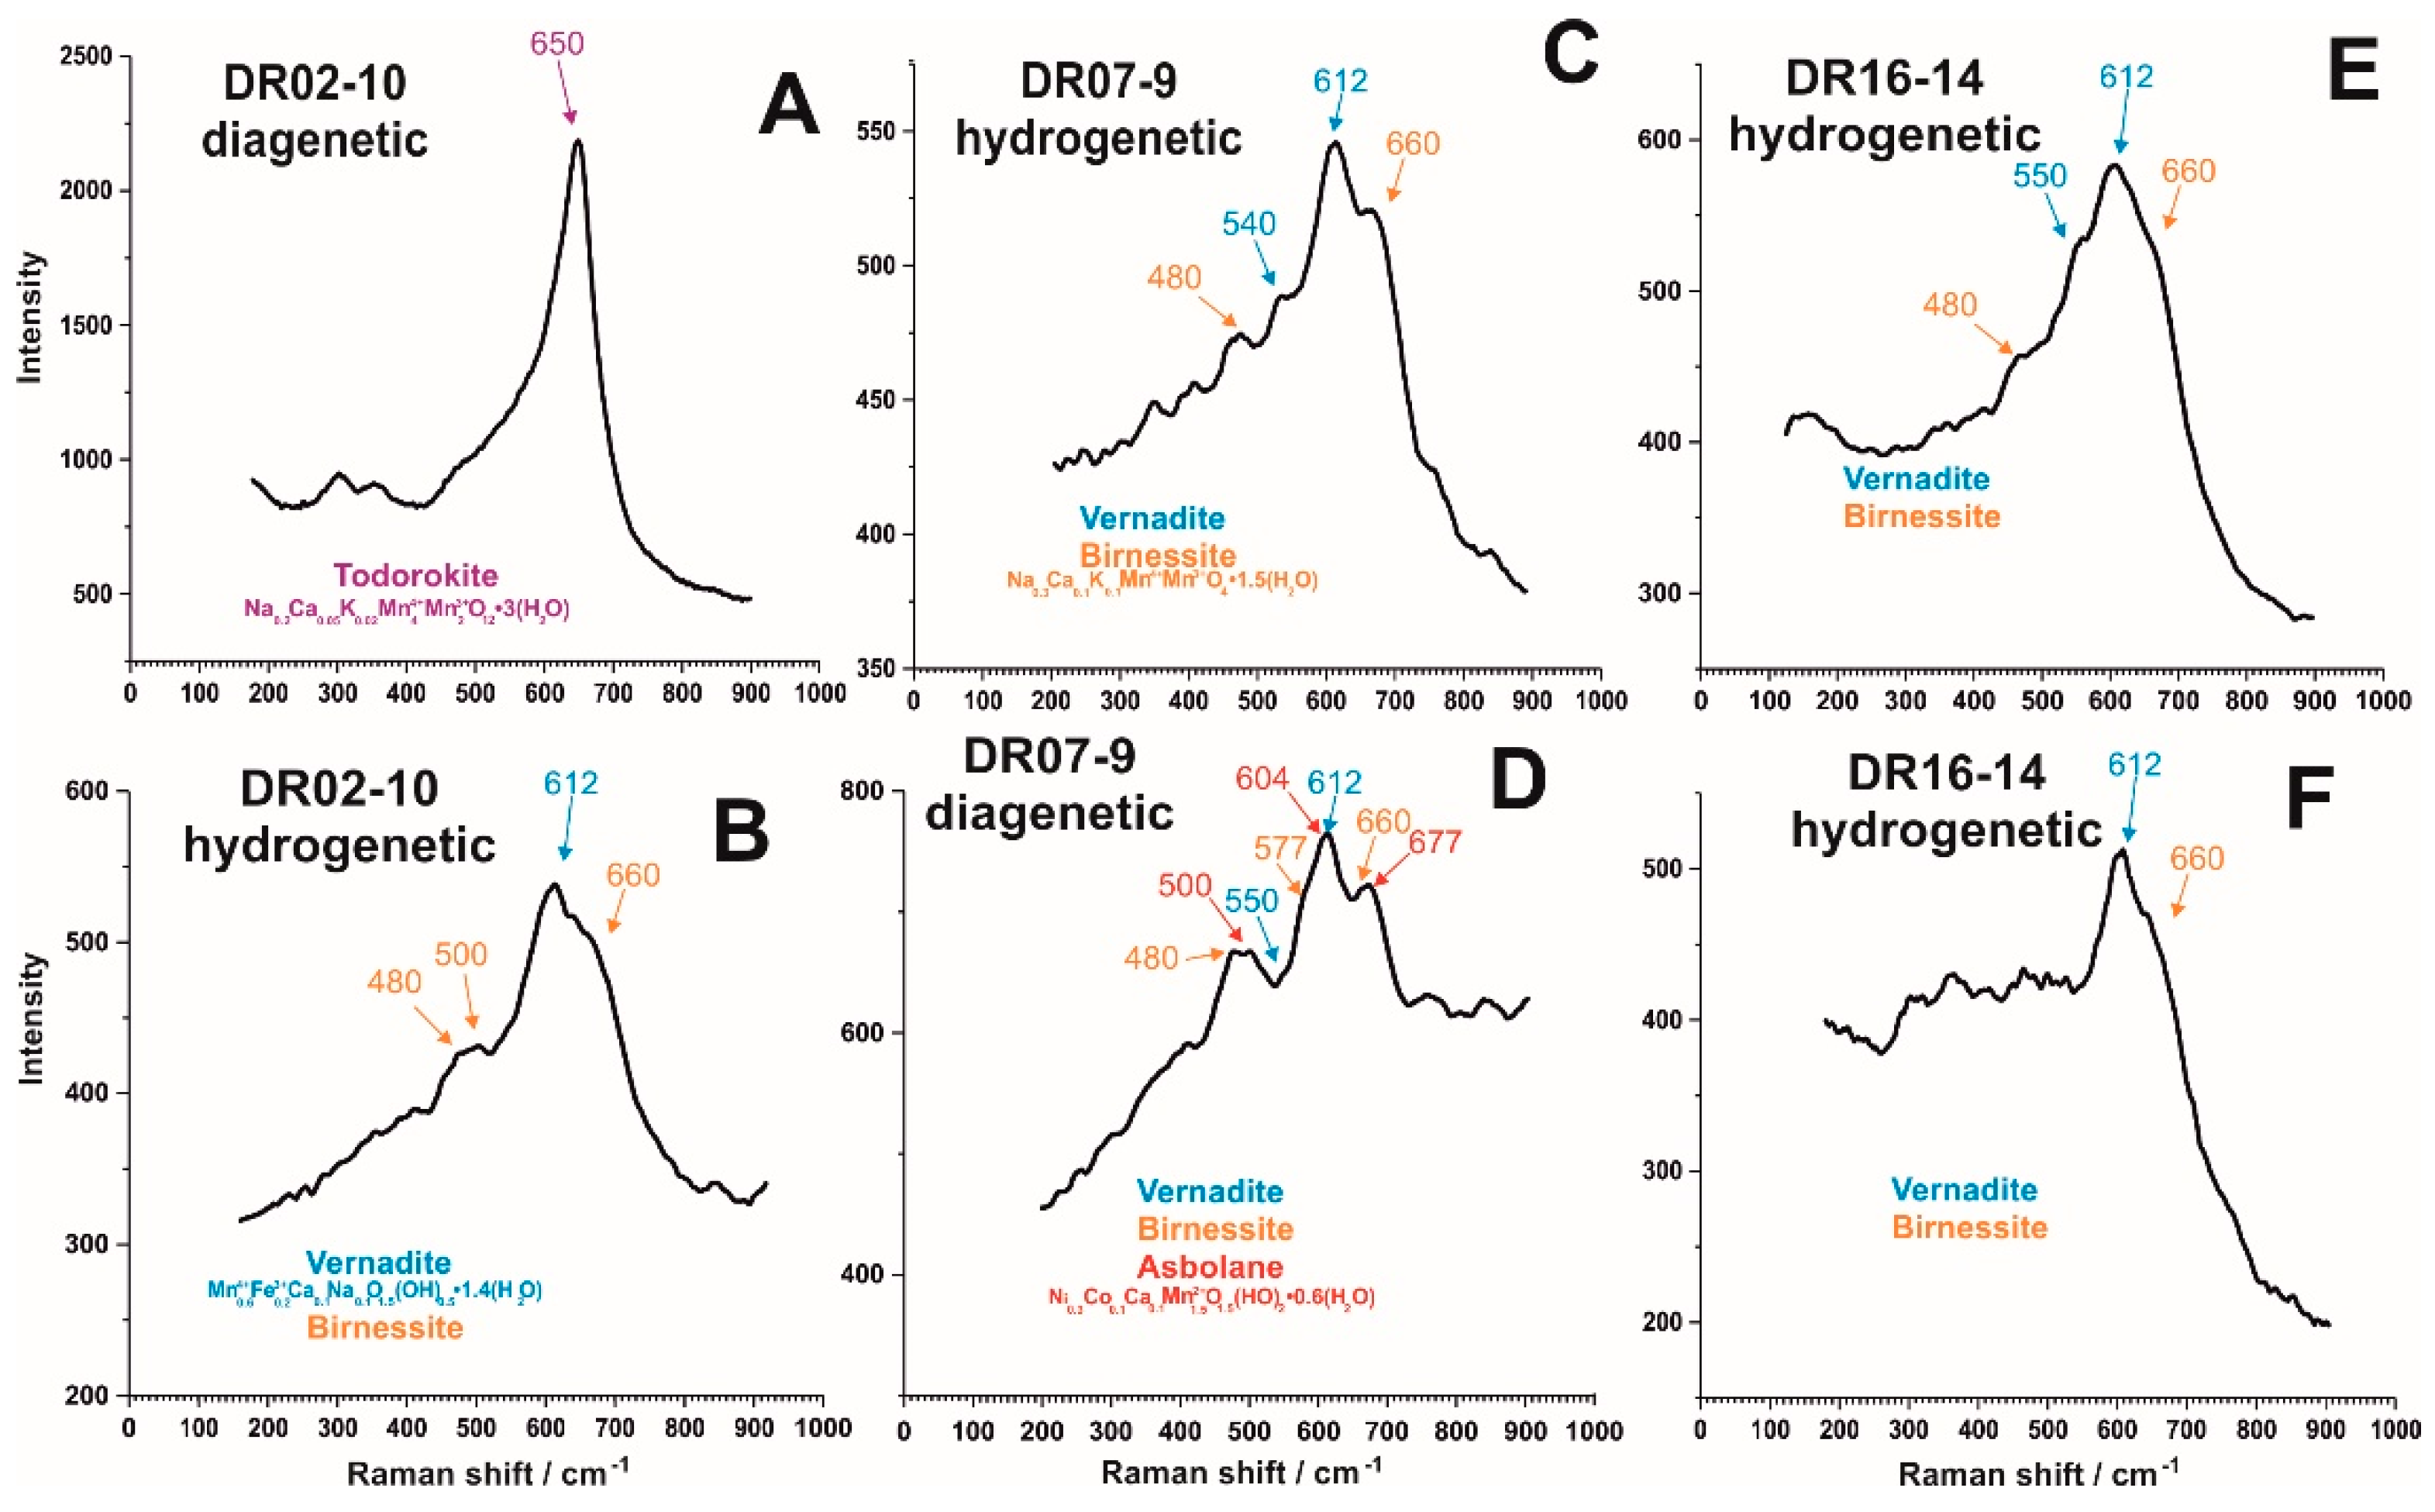
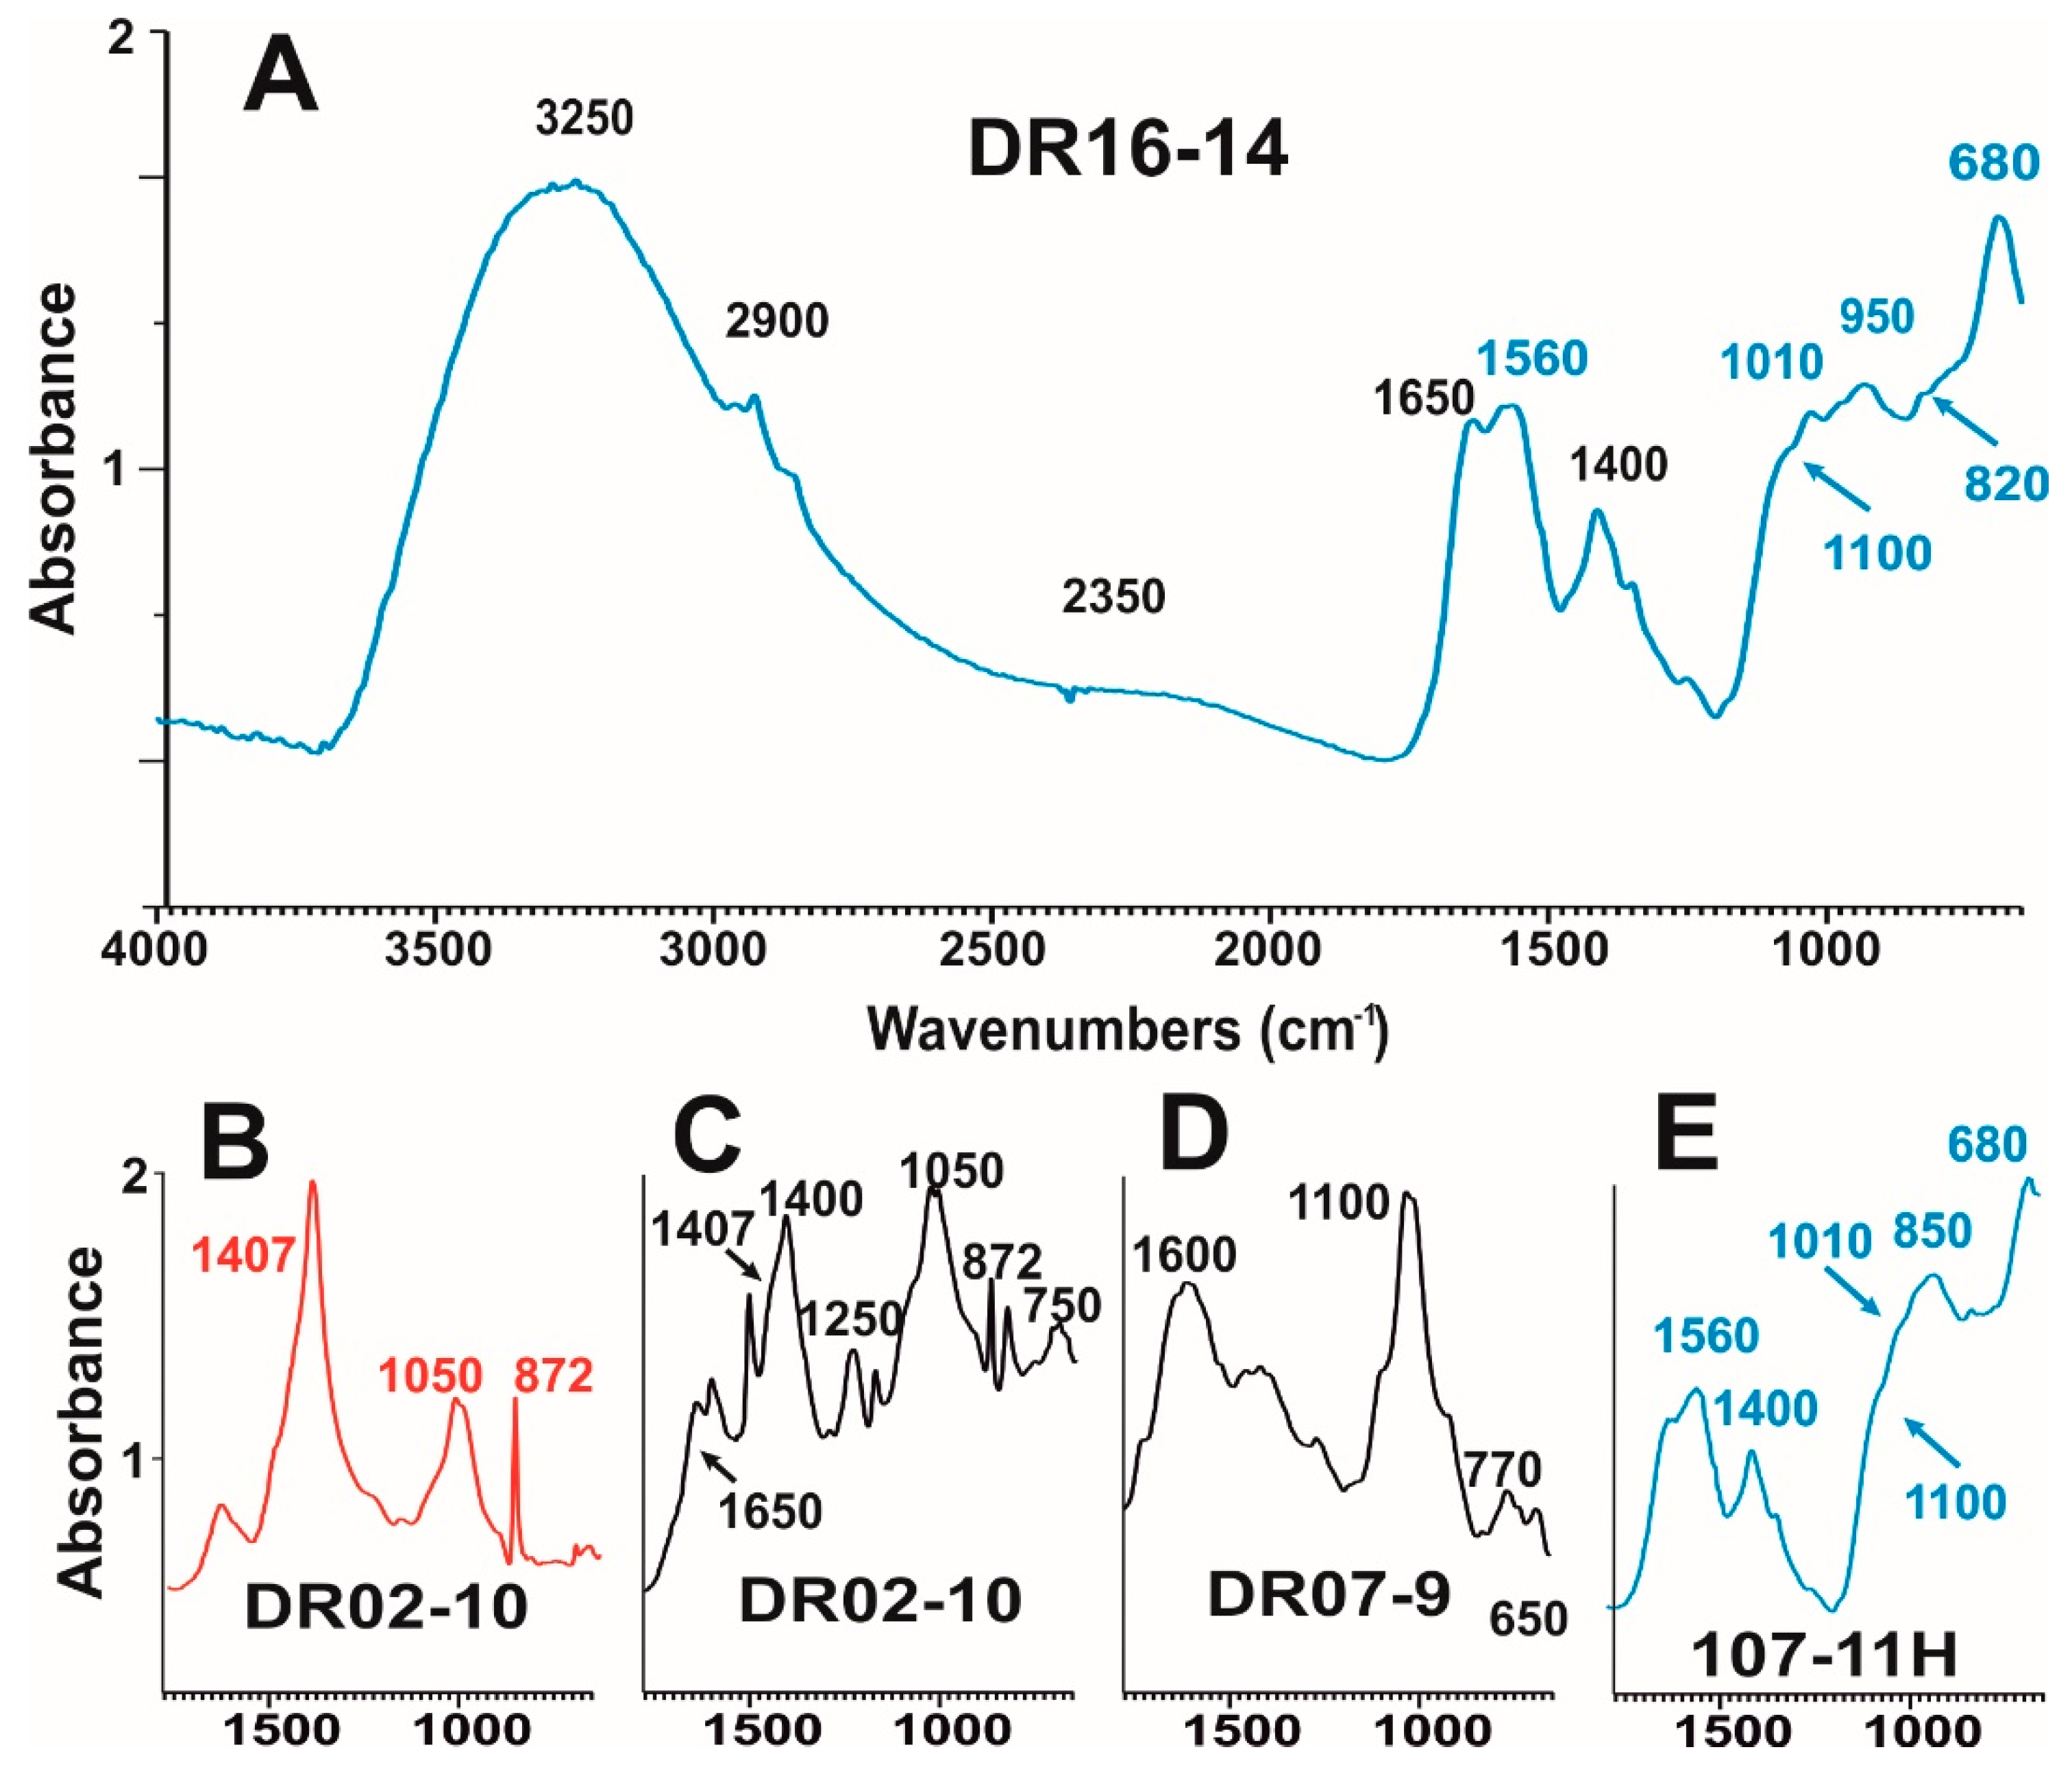
3.2.2. Raman and FT-IR Spot Analysis

The Raman spectra for the studied Fe-Mn crust are shown in Figure 6. The obtained intensity are variable due to the multiple acquisition procedure. Mn-oxides usually show three main band frequencies shift regions that can be recognized at 200–450, 450–600 and 600–750 cm−1 [52,54,56,58,70,71].
Micro-Raman high-resolution analysis made on selected laminae of studied crusts report the layer-by-layer mineralogy of the studied crusts. In sample DR02-10, the general Fe-Mn minerals and the bright laminae have been analyzed in order to see if it is possible to differentiate the mineralogy of the selected laminae. Both laminae show two main spectra evidenced by peaks located at 300, 350 and 640 cm−1—in one of them, todorokite, and at 480, 500, 610 and 660 cm−1 in the other, vernadite and birnessite (Figure 7A,B).
Crust DR07-9 also present two main types of vibrational spectra. The first spectra show small peaks at 300, 350, and 480 cm−1 and high peaks at 540, 612 and 660 cm−1 (Figure 7C). Other recognizable peaks sometimes forming shoulders are located at 480, 577, 604, 660 and 677 cm−1 (Figure 7D). These peaks belong to mineral associations of vernadite-birnessite and vernadite, birnessite and asbolane [52,53,54].
Finally, crust DR16-14 always shows peaks at 480, 550, 612 and 660 cm−1 belonging to vernadite, and birnessite that, in some laminae, are accompanied by small peaks at 300 350 and 400 cm−1, belonging to goethite (Figure 7E,F).
FT-IR analysis reflects in the studied range the vibrational energy of the different atomic bonds that can be found in Fe-Mn crusts. Spot analysis show that all the crusts display a broad absorbance band in the range of 3000 and 3500 cm−1 and 1650 cm−1 that belong to the symmetrical stretching and bending OH vibrational energy. Other common peaks can be found at range 1480–1580 cm−1 belonging to O–H and inorganic C–O absorption bands, and finally 1010–1070 cm−1 peaks belonging to Mn(III)–OH vibrational absorption bands (Figure 8A).
Peaks found around 2900 cm−1 are typical of organic compounds but in this study are related to the presence of the epoxy resin of the polished sections while the peak (or the vacancy) at ~2350 and 1560 cm−1 is a combination of the bands due to the stretching and bending vibrations due to the H–O–H and depends on the presence of water in the oxy-hydroxide minerals structure (Figure 8A). The peak at 1400 cm−1 due to the C–O vibrational band is also present in almost every analysis.
Some peaks are not very clear in all the samples or are better identified in some laminae than in others. This is the case of a very high peak found in sample DR02-10 at 1407 cm−1 that together with the related peaks at 1796 and 872 cm−1 is representative of calcite vibrations (Figure 8A). Other peaks that vary their intensity in different laminae in DR07-9 are found at 760, buserite/asbolane, and 680 cm−1, vernadite, which are linked to the different Mn-oxide minerals analyzed (Figure 8B).
The FT-IR peak list also confirms the presence of todorokite in recognized peaks at ~750, 1050 and 1650 cm−1 (Figure 8C) [59,72,73]. FT-IR analysis of crust DR07-9 shows the presence of peaks at 650 and 770 and 1100 cm−1 (Figure 8D), which indicate buserite and asbolane, respectively [59]. On the other hand, crusts DR16-14 and 107-11H show Mn minerals represented by vernadite peaks at 820, 950 and 1010 cm−1 and birnessite 680 cm−1 in FT-IR analysis [59] (Figure 8A).

3.3. Geochemistry

3.3.1. Bulk Geochemistry

Bulk crusts composition is summarized in Table 3. Geochemical results on Fe-Mn crusts (DR02-10, DR07-9 and DR16-14), measured in order to avoid the influence of substrate rock, show a high Fe (21.9 to 27.2 wt. %) and Mn (17.5 to 20.5 wt. %) contents and an Mn/Fe ratio varying between 0.67 and 0.75. The other major elements show less contents: Si (2.63 to 9.7 wt. %), Al (1.64 to 3.29 wt. %), Ca (2.34 to 3.3 wt. %), Mg (1.5 to 2.2 wt. %), K (0.35 to 0.81 wt. %), Na (1.50 to 1.63 wt. %), P (0.6 wt. %) and Ti (0.81 to 1.18 wt. %), demonstrating that alumina-silicates elements are generally depleted in Fe-Mn crusts compared with continental crust. The crust 107-11H and its substrate rock show higher Fe (38.1 wt. %), Ca (10.2 wt. %) and P (3.99 wt. %) with very low contents of Mn (1.44 wt. %) and other major elements Si (1.87 wt. %), Al (0.71 wt. %), Mg (0.4 wt. %), Na (0.4 wt. %), K (0.21 wt. %) and Ti (0.2 wt. %). Mn/Fe ratio for this sample is very low, 0.04 (Table 3).
Strategic and critical elements are generally enriched in crusts, with high bulk contents of Co (4355 to 8347 μg/g), Ni (2481 to 4430 μg/g), V (878 to 1266 μg/g), Cu (463 to 1016 μg/g) and Mo (381 to 648 μg/g). Co, Ni and Cu are the metals traditionally considered of greatest economic potential in Fe-Mn crusts and their Co+Ni+Cu average content is 8700 μg/g. Crust DR07-9 shows enrichment in Ni and Cu, respectively, up to 4430 and 1016 μg/g. On the other hand, crust DR16-14 shows high contents of Co (8347 μg/g) and Ce (2230 μg/g) but also V (1266 μg/g), Mo (648 μg/g), Ba (1998 μg/g) and Pb (1868 μg/g). Finally, crust 107-11H shows low contents in all these elements compared with the other three (Table 3).
Rare earth elements (REEs) plus Yttrium (REY) are also abundant in the studied Fe-Mn crusts. Results of normalizing crusts to PAAS (Post-Archean Australian Shales) are shown in Figure 9A. The bulk result of crusts DR02-10, DR07-9 and DR16-14 exhibit a similar pattern with positive Ce anomalies (2.5, 2.6 and 2.5, respectively) and negative Y anomalies (0.60, 0.62 and 0.49, respectively). This is reflected also in the REY plot of the bulk data of the studied crusts that show similar strong positive Ce anomalies compared to PAAS (Figure 9A). The crust recovered on the Tropic Sm. (DR16-14) shows the highest content in REY (3700 μg/g). The crusts DR02-10 and DR07-9 recovered on Echo and The Paps Sms., on the other hand, show low REY contents (3000 and 2300 μg/g respectively). Crust DR02-10 also shows a similar Y anomaly with sample DR07-9 (0.6 and 0.62, respectively) but slightly high compared to DR16-14 (0.48), also evidenced in the PAAS normalized spider diagram (Figure 9A). Sample 107-11H recovered on Tropic Sm. has the lowest REY contents (Σ450 μg/g), slightly positive Ce anomaly (1.3) and a clear positive Y anomaly normalized to PAAS (Figure 9A). Bulk data have also been used to plot the result of the ratio CeSN/CeSN* (SN = shale normalized) compared first with Nd (μg/g) and then with YSN/HoSN ratio according to [3]. The genetic interpretation of these results will be discussed below.

3.3.2. Electron Probe Micro Analysis

Obtained EPMA backscatter images show that Fe-Mn crusts are generally composed by thin laminations down to one micron thickness packed together in almost three main structures forming layers of variable thickness ranging between 1 and 5 cm: dendritic-mottled, columnar and dense subparallel. More than 900 spot and layer-by-layer analyses were made on selected crusts. The average element contents have been summarized in Table 4. EPMA analysis shows some differences with the bulk composition. Fe contents of the three thicker crusts vary in almost the same range (average of 22 ± 3 wt. %), but Mn is slightly higher (average 21 ± 4 wt. %). Other major elements as Si, Al and P show lower contents (average 2 ± 0.1, 1 ± 0.4 and 0.2 ± 0.01 wt. %, respectively). These differences are interpreted as related to the substrate and detrital fragments’ input in bulk analysis that dilute the Fe and Mn oxides’ concentration targeted here by EPMA.
Crust DR07-9 shows a dendritic/mottled to columnar structure growth with several erosive discontinuities (Figure 10B,C). Usually, these discontinuities are crowned by the presence of bright laminae evidenced in backscattered images (Figure 9A,C). The areas of low reflectivity represent more than 90 vol. % of the crust forming thin laminae with subparallel growth. Spot analysis made on these low reflectivity minerals show almost similar average contents of Fe (24 wt. %) and Mn (20 wt. %) with very low contents of aluminum silicates elements (Σ 5 wt. %). They also have high Co, Ni, V, Ba, Mo and Ce (5700, 4100, 1300, 2400, 470 and 2400 μg/g, respectively). On the other hand, spot analysis on bright fibrous laminae (less than 10 vol. % of the whole thin section) reveals the presence on Mn-rich minerals (up to 45 wt. %) with low Fe (2 wt. % in average). The same laminae also have high Ni (up to 5 wt. %) and Cu (up to 1%) contents. Bright laminae conversely show lower contents of Co (2200 μg/g), V (440 μg/g), Ba (1100 μg/g), Mo (110 μg/g) and very low Ce (270 μg/g) compared with the rest of laminae. On top of the bright laminae are clearly recognizable several detrital grains and the tests of foraminifera (Figure 10C). Several erosive discontinuities have been recognized in this area cutting sometimes the fibrous growth. In the same area, it is also possible to identify some laminae with lower brightness and low or no fibrous growth in them (Figure 10C). These laminae show less content Mn (36 wt. %) and slightly high Fe (5.5 wt. %). They also show similar Ni contents (up to 4 wt. %) but less Cu (0.6 wt. % in average); in contrast with the fibrous laminae, these ones also have higher Co (up to 4500 μg/g), Mo (190 μg/g) and Ce (580 μg/g).
Crust DR16-14 shows mostly columnar to dense sub-parallel structural growth. In general, this crust shows in the EPMA analysis higher contents of Fe (23 wt. %), Mn (21 wt. %) and essentially Co (up to 1 wt. %); nevertheless, Ni, (3000 μg/g), Ba (2000 μg/g), Mo (570 μg/g), Ce (2600 μg/g) and V (1400 μg/g) contents are similar to the ones obtained on the low reflectivity laminae of crust DR07-9 (Figure 10D). In this crust, it is also possible to identify some local discontinuities, but they are less abundant, and they never are associated with the presence of high reflectivity fibrous laminae (Figure 10A,C). On top part of DR16-14, a slightly bright lamina have been found concordant with the growth structure enriched in Fe, Ti and V (up to 49 and 0.9 wt. % and 2500 μg/g, respectively) and depleted in Mn (max 2 wt. %) with respect to the rest of the laminae, trace elements Co, Ni, Mo, Ba and Ce (470, 350, 60, 900 and 390 μg/g, respectively) are also depleted in these laminae.
In crust DR02-10, the presence of two different type of bright laminae has been recognized with differences in their textural features and chemistry. One of them is similar to the one recognized in DR07-9 described above, but with lower contents of Mn (up to 40 wt. %), Ni (up to 1 wt. %) and Cu (0.4 wt. %) and high Ca (up to 8 wt. %). These laminae are also slightly depleted in all the other trace elements compared with DR07-9. The other type of bright laminae has high contents of Ca (up to 17 wt. %) and lower Mn (37 wt. %), Ni (0.8 wt. %) and Cu (0.25 wt. %). Backscattered micro images show the presence of dissolution marks of abundant foraminifera, especially from the group of the orbitulinidae (Figure 10A). These laminae also show depleted contents of all the other trace elements such as Co, V, Ba, Mo and Ce (260, 140, 180, 330 and 104 μg/g mean content, respectively) with respect the low reflectivity laminae.
The substrate of the crust 107-11H is formed by a pervasively altered volcanic breccia in which it is possible identify several feldspar crystals and ghosts with corrosion and growth of a rim of new formed minerals (goethite and CFA) (Figure 11A). It is essentially composed of quartz, feldspars, Fe oxides like goethite, magnetite and ilmenite and authigenic CFA, too. This substrate shows high Fe (up to 58 wt. %), Ca (up to 29 wt. %), Ti (up to 6 wt. %) and P (up to 3 wt. %). In the first mm in contact with the altered substrate, it is possible to identify a lamination formed essentially by Fe-oxyhydroxides (goethite group) (Figure 11B,C; Table 5). The outer Fe-Mn oxides crust show Fe-vernadite with high contents of Fe and Mn (average 28 and 17 wt. %) and also high Co, Ni, V and Ce (respectively up to 0.6, 0.3, 0.1 and 0.2) (Table 4). Through the crust lamination, it is possible to recognize a lamina, identified as continuous in all the thin section, similar to the Fe enriched lamina found in DR16-14 (Figure 11D).

3.3.3. LA-ICP-MS Punctual Analysis

CISP Fe-Mn crusts have been analyzed by LA-ICP-MS to obtain element concentrations of selected laminae following the results of the EPMA image and spot analysis. LA-ICP-MS has been used to analyze the four types of laminae previously identified with EPMA: low reflectivity laminae with sub-parallel growth; high reflectivity laminae with fibrous texture; high reflectivity laminae with low or no fibrous texture; and medium reflectivity laminae enriched in Fe. The laminae with low reflectivity, which forms the whole crust DR16-14 and most of the crusts DR02-10, DR07-9 as well as the Fe-Mn crust of a sample of 107-11H, analyzed by LA-ICP-MS in all the samples, are characterized by high and similar contents of Fe and Mn in accordance with the values obtained by microprobe. In these laminae, Co reaches contents of up to 1.5 wt. % and an average of 0.9 ± 0.4 wt. % with less contents of Ni (up to wt. 0.5% and average of 0.3 ± 0.1 wt. %) and Cu (up to 1300 μg/g and average of 1000±600 μg/g). Other important trace elements enriched in these laminae are Mo, Nb and Te (average 600 ± 144, 127 ± 65 and 93 ± 45 μg/g, respectively) (Table 5). The plot of these Fe-Mn laminae in the REY/PAAS-normalized graphic show patterns falling in the blue field with Ce positive and Y negative anomalies (Figure 8A).
Some high reflectivity laminae with fibrous crystals have been found in crusts DR02-10 and DR07-9. These laminae can be divided in two types, Ni-rich and Ca-rich. Ni-reach laminae (up to 6.5 wt. %) have been found in both crusts (Figure 10A,C); they also show higher Mn (up to 40 wt. %) and Cu (up to 2 wt. %) contents than the rest of the laminae with less reflectivity. Other elements are also enriched in bright laminae compared to the less reflectivity types: Li (average 200 μg/g and up to 400 μg/g), Zn (average 2000 μg/g). On the other hand, Ni-rich laminae are characterized by low contents of Co (average 0.3 wt. %), very low contents in all REY (average 400 μg/g) but also less Te, Nb and Pb (8, 10 and 540 μg/g, respectively) (Table 5).
Ca-rich laminae (Figure 10A) show high Mn (up to 35 wt. %) and Ca (up to 12 wt. %), are also enriched in Ni (up to 1.4 wt. %), Li (700 μg/g) and slightly in Zn (1000 μg/g) but not in Cu (0.2 wt. %) compared with the Ni-rich laminae. Elements with less contents are Fe (0.5 %), Co (245 μg/g), REY (100 μg/g) but also Te, Nb and Pb (respectively down the detection limit, 8 and 100 μg/g) (Table 5). REY patterns of these two types of laminae show a similar behavior with a negative Ce and Y REY/PAAS anomalies falling in the red field of the graphic (Figure 9A).
Finally, Fe-rich laminae found in samples DR07-9, DR16-14 and 107-11H have very high Fe (up to 40 wt. %), with low Mn (5 wt. %) and are also slightly enriched in REY (2600 μg/g). They are plotted in an intermediate field in the PAAS-normalized REY diagram (Figure 10A, yellow field).
The analysis of secondary formed minerals and first laminae in contact with the substrate of crust 107-11H (i.e., goethite; Figure 11B,C) shows a REY pattern with a marked Ce negative anomaly and a different LREE/HREE ratio compared to the other studied laminae, showing a relative HREE enrichment in these laminae comparing with the other subset, with a Y positive anomaly (Figure 9A, purple field) and very low contents of all the REY. Genetic interpretation of these laminae will be discussed below. The spot analysis obtained with LA-ICP-MS has also been plotted in the diagrams from [3].
LA-ICP-MS spot analyses have also been used to calculate Ce, Eu and Y anomalies on studied laminae (Table S4). Results show high Ce anomaly in low reflectivity laminae (average from 2.5 to 4.4 in the four crusts) with less Eu (around 1 in average) and Y anomaly (around 0.6 in average). Bright laminae, on the other hand, show less Ce anomaly (0.6 and 1, respectively, in crusts DR02-10 and DR07-9) compared with the previous ones, although Eu and Y anomalies are almost the same (1 and 0.7 in average, respectively). Fe-rich laminae seem to have a behavior similar to the low reflectivity laminae with high Ce and low Eu and Y (in average respectively 3.2, 1 and 0.7). Finally, laminae in contact with the altered substrate of 107-11H reflect also high Ce anomaly (1.7 and 4) with the same Eu anomaly (1 in average) but slightly high Y (0.9 in average) (Table S4).

3.3.4. Hydrometallurgical Treatment

One hydrometallurgical method has been used in order to quantify the recovery rate of the economically interesting elements of studied crusts. Fe-rich laminae (as found in crust 107-11H) analyzed here show low contents of all the valuable metals (Table 5) and have been not considered for this metallurgical experiment. In addition, the difficulty to separate by physical methods enough quantity of these laminae (less than 20 µm each) from the whole crust made the experimentation with this genetic type impossible. Crusts DR02-10, DR07-9 and DR16-14 have been digested in a solution of HCl (2.75 mol/L) with the addition of 18.5 ml of ethanol in order to maintain reduced conditions in the solution and an initial pH 1.5. The result of this hydrometallurgical method is shown in Table 6. The bulk contents of studied crusts are presented in comparison with the analysis of the solution after digestion to obtain the recovery rate. The error of the analytical method is calculated around 10% (Table S1), which explains a recovery rate higher than 100% obtained in the samples and marked in bold for Co or too low for Mo. Obtained recovery rates show high values for Mn (between 75 and 81%) than for Fe (49 to 58%). The recovery rate of the valuable trace metals studied is also high for Co (between 63 to 108%), Ni (53 to 85%), Cu (50 to 74%) and V (58 to 85%). Mixed diagenetic/hydrogenetic crust DR07-9 has a lower recovery rate for Mn (75%) and Ni (52%). The other more hydrogenetic or purely hydrogenetic crusts DR02-10 and DR16-14 show a high recovery rate both for Mn (81%) and Ni (85 and 70%). On the other hand, purely hydrogenetic crust DR16-14 has the lower recovery rate for Co (63%). Finally, Mo shows the lowest recovery rate registered, between 26 to 63%, in all of the studied crusts. Usually, REY values are measured by the ICP-MS technique, but, in this case, the matrix effect produced by the hydrochloric solution made the study of all of them impossible. Due to the limitation of the ICP-AES, the studied REY are Y, La and Ce that represent almost 80% of the total REY in analyzed crusts and their behavior can be extended to all the REEs. Y, La and Ce also show a high recovery rate ranging between 70 to 89%.
The XRD analysis on the solid residues shows the presence of essentially quartz, feldspars, and goethite group minerals (goethite and feroxyhyte) and less buserite/asbolane and todorokite (only in crusts DR02-10 and DR07-9, and only goethite group minerals in crust DR16-14 (Figure S1).

4. Discussion

Fe-Mn crusts from the CISP were studied to distinguish and evaluate different structural-textural characteristics, mineralogical and geochemical composition and proposing and testing a potential beneficiation method for critical metals. The petrographic, mineralogical and geochemical high-resolution analyses have been useful to differentiate and propose hydrogenetic, diagenetic and hydrothermal processes involved in the growth of the studied crusts. The discussion of high resolution analysis was used here to identify the different low crystalline minerals forming the crusts. Spot EPMA and LA-ICP-MS show the enrichment of critical-element bearing minerals depending on the genetic processes acting during their growth. Finally, we explore a hydrometallurgical method, indicating that the recovery rate of valuable metals is related to the mineralogy of the crusts and consistently to the genetic process.

4.1. Bulk Analysis vs. High-Resolution Analysis

The results of bulk analysis present several important differences in element concentration of the studied crusts. Petrographic, mineralogical and geochemical bulk analysis of studied Fe-Mn crusts from CISP reveals that they are predominantly formed by a hydrogenetic process. The presence of high contents of low crystalline and intergrown minerals like vernadite (up to 90%) and goethite group minerals (unstable ferrihydrite, goethite and feroxyhyte) is consistent with the optical studies in which their small crystal size due to the particulate precipitation made it impossible to differentiate them. In addition, the predominant columnar to dense parallel structure in all samples reveals a slow growth consistent with the predominance of this hydrogenetic origin for all studied crusts and with the results obtained by other authors [1,15,18,20,23,75,76]. In some samples, it is possible to distinguish areas with more dendritic to mottled structure bound to high detrital input and in some crusts the presence in bulk XRD of ~10 Å reflection that usually indicates diagenetic Mn-oxides as todorokite, buserite or asbolane (Figure 4A,B) [22,30,47]. However, it is generally difficult to recognize and identify these other Mn-oxides in bulk XRD due to their low crystallinity and their intergrowth with each other, but also due to the presence of detrital minerals that may mask Mn-oxides with their better defined reflections (Figure 4A,B).
Diagenetic 10 Å Mn-oxides have been identified forming bright and thin laminae in crusts DR02-10 and DR07-9; their reflections are visible in the bulk analysis as already seen in other samples on this seamount [21], but their low concentration compared with the bulk of the crusts made the analysis of their study with XRD very difficult. In this way, micro-XRD, Raman and FT-IR analysis have proven useful in order to identify the different Mn-oxides of the studied CISP crusts [52,53,54,56,58,59]. Micro-XRD profile analyses through the studied crusts show that the mineralogy varies from the top up to the 24 mm, both due to the presence of different detrital minerals as due to the influence of genetic processes. Crust DR07-9 shows the presence of ~10Å Mn-oxides in the upper part (Figure 5B) where they are clearly bound to detrital minerals and diagenetic processes (Figure 6C,D Sections 1-3, 1-5 and 2-3, 2-5). On the other hand, in the middle part of the crust, the hydrogenetic minerals like vernadite (δ-MnO2) are dominant, showing reflections better defined and with higher intensity (Figure 6F,G). Studied crusts show four types of laminae, the first one with uniform growth and low reflectivity comprehend the whole crust DR16-14 and up to 90 vol. % of the crusts DR02-10 and DR07-9. The remnant 10 vol. % of these crusts is formed by bright fibrous laminae sometimes enriched in Ca (DR02-10, Table 5) that can be differentiated in well and poorly crystalized. Finally, a fourth type is represented by less bright laminae enriched in Fe found essentially on the top of DR16-14 and through 107-11H.
The study of the low reflectivity laminae in all the crusts reveal the presence of essentially hydrogenetic vernadite, whose characteristic peak can be recognized at 612 cm−1 (Figure 7B,C,E,F). The other mineral that could be recognized is diagenetic birnessite that overlaps with vernadite forming a shoulder, sometimes well developed (Figure 7C) at 670 cm−1 [52,54,55,56,58]. FT-IR on the same type of laminae results in an absorbance band typical of oxyhydroxides characterized by a big absorption band due to the presence of water in the structure (Figure 8A), but also by the band of typical Mn-oxides in the range between 1000 and 650 cm−1 belonging to vernadite and birnessite (Figure 8A,E). This result is consistent with obtained data of bulk XRD (Figure 4A–C) in which vernadite and birnessite have been recognized.
In sample DR02-10, Raman analyses on these bright laminae reveal the presence of the todorokite characteristic stretching (bending) peak at 650 cm−1 (Figure 7A) [52,53,54,56]. FT-IR analyses also confirm a diagenetic todorokite together with a high Ca (Figure 8B,C) [59,72,73]. Raman analyses made on the bright laminae found in crust DR07-9 show on the other hand several peaks (Figure 7D), belonging to three different minerals: vernadite, birnessite (buserite) and asbolane [52,53,54]. Asbolane and buserite presence, mostly overlapping, in the same laminae was also confirmed by their FT-IR peaks (Figure 7D) [59].
Discriminating a ternary diagram from [27] and modified according to [6] and [33] has been used to classify the mineralization. The bulk chemical composition and discrimination plots clearly show a hydrogenetic origin of three of these crusts (Figure 12A). The Fe-Mn crusts plot in the hydrogenetic field on the Mn–Fe–(Co + Ni + Cu) x10 ternary diagram. Mn/Fe ratios close to 1 [6,77], high REY contents, positive Ce anomalies, negative Y anomalies (Figure 9A) and moderate to high Co, Te, V, and Tl contents are all characteristic of hydrogenesis. In contrast, the crust 107-11H plots at the almost pure Fe-rich hydrotermal end-member on the Mn-Fe-(Co + Ni + Cu) ×10 ternary diagram (Figure 12A). This crust shows very low trace metal contents, low positive Ce anomaly and positive Y anomaly (Figure 9A), all characteristic of hydrothermal Fe-Mn deposits. Major elements like Fe and Mn are slightly diluted in crusts DR02-10 and DR07-9 (Table 3) due to the presence of detrital minerals. Trace elements also seem to have a uniform distribution in all the studied crusts, showing high contents of Ni and Cu in crust DR07-9 and high Co and Ce in crust DR16-14. Geochemical studies on bulk composition confirm the prevalent hydrogenetic origin of crusts in the CISP [21.34].
On the other hand, if we plot high-resolution analysis, it is possible to observe that some laminae enriched in Mn, Ni and Cu plot in the diagenetic field (Figure 12A). In addition, laminae from the crust 107-11H plot in both the hydrothermal and the hydrogenetic fields showing genetic model variations in its history growth (Figure 12A).
These results are consistent with previous analysis of Fe-Mn crusts of the region [21]. Other discriminating diagrams have been used to differentiate the genetic process of the studied crusts, the first to compare the ratio of Co/(Ni + Cu) with the ratio Mn/Fe following the work of [28] (Figure 12B). Other authors proposed several other binary graphics for the classification of Fe-Mn crusts and nodules using so-called High Field Strength Elements (HFSE) compared with the Mn/Fe ratio or the sum of Ni, Cu and Co in wt. % [31] (Figure 13). In both diagrams, it is visible that some high-resolution analysis on selected laminae of DR02-10 and DR07-9 plot in the diagenetic (or suboxic) field. Their chemistry indicates diagenetic origin, probably due to a temporary cover with sediments of the Fe-Mn oxyhydroxides and disappearance of the water–crusts interface, or early diagenesis that produces replacements in the previous precipitated hydrogenetic laminae [6,33,78]. In Figure 12, it is also clear that spot analysis made on the pervasively altered substrate rock and Fe-Mn laminae near the substrate of the crust 107-11H plot in the hydrothermal field confirming this genetic influence at the base of the crust.
Comparing our results with previous work, it can be deduced that the diagenetic laminae in the hydrogenetic crusts are similar to diagenetic layers in nodules for instance from the CCZ. In [24] and then in [30], authors have conducted similar high resolution studies on a set of diagenetic nodules from the German area of the Clarion–Clippertone Zone (CCZ) in the Central Pacific Ocean. These authors found that the studied nodules are generally made up of two layer types and a mix of them. These authors found that their layer type 1 is due to hydrogenetic growth of nodules with some differences in composition compared to the hydrogenetic layers in the Fe-Mn crusts from CISP and formed by precipitation of colloids of hydrated Fe and Mn oxides from oxic sea water [33].
The layer type 2 found in nodules is clearly similar to the bright laminae found in crusts DR02-10 and DR07-9. EPMA analysis of CCZ nodules provides contents of Mn of up to 40 wt. % and very low contents of Fe (around 1 wt. %). This layer type also shows high Ni and Cu (respectively 2 and 1.37 wt. % in average) but very low Co and Ce (0.03 and 0.01 wt. %). Bright laminae analyzed in CISP Fe-Mn crusts have quite similar contents of all these elements but Cu that is less (from 0.2 to 1.1 wt. % in average; Table 5). The enrichment in Cu of CCZ nodules may be due to the high biogenic input that provide dissolved elements in the sediments that could be mobilized during diagenesis [79]. In addition, the presence of carbonate in the sediments from CISP could explain this difference. Copper recycling in carbonate rich sediments is higher than in essentially siliceous sediments (98% vs. 83–94%), resulting in Cu loss in seawaters [33]. Furthermore, high Cu in CISP freshly precipitated hydrogenetic Fe-Mn oxyhydroxides is highly bound to Fe-oxyhydroxides, 54% as seen in [21], that, under suboxic conditions, were not mobilized as reversely occur to Mn-oxides in CCZ sediments or due to the occupation of metal positions by released Mn2+ [80,81]. The higher Mn/Fe ratio of these laminae is typical of suboxic diagenetic growth [4,6,30,33,77]. High-resolution spot analysis of crust DR02-10 further indicates a strong suboxic diagenesis that is reflected in the minor Ni+Cu contents of these laminae (0.8 vs. 4 wt. % in average) [4,33,82,83].
Similar results have also been obtained with LA-ICP-MS analyses on the different laminae found in studied Fe-Mn crusts. As could be seen, the different studied laminae show different REY contents and behavior in their normalization with PAAS (Figure 9, Table 5). Obtained REY contents plotted in Figure 9 (blue field) show that hydrogenetic laminae show their usual pattern with a high Ce positive anomaly and a marked Y negative anomaly compared with PAAS (line analysis of dense layers in Figure 10). These laminae are enriched in LREEs (up to 3000 μg/g), which counts 90% of the total of REY.
Obtained anomalies of CeSN/CeSN* of these laminae (Table S4) are normally high (up to 4.5), except DR16-14 that shows Ce anomaly of 2 due to the high enrichment in all the LREE compared with the other samples (Table S4). REY contents in the bright laminae of crusts DR02-10 and DR07-9 normalized to PAAS plot in the diagenetic field (Figure 9A red field, Figure 10A,C) with their typical Ce normalized negative anomaly that is also consistent with the calculation of CeSN/CeSN* (average 0.6) (Table S4).
In Figure 9, it is also possible to differentiate two intermediate patterns, the first found in crusts DR07-9 and the other in crusts DR16-14 and 107-H11. The first one belongs to one of the bright diagenetic laminae (Figure 10C). The Ce/PAAS positive anomaly shown by these laminae (Figure 9A) and the gradual transition from unidentifiable dense laminations to fibrous crystals support the theory that these laminae have a previous hydrogenetic origin. Due to sediment cover and also to the presence of a thick crust above, they start to experience diagenesis under oxic or suboxic conditions (Figure 12B) proved by the high Mn/Fe ratio (average 63) and the high contents of trace metals as Ni and Cu (average 3 and 1 wt. % respectively) [33]. Mn-oxides start a recrystallization process promoted by the mobilization of Mn2+ ions released by the previously precipitated hydrogenetic Fe-Mn oxyhydroxides that are unstable in these new conditions [4,33,77,84,85]. CeSN/CeSN* is also slightly high compared with the diagenetic laminae (average 2.5) (Table S4). Finally, the other intermediate pattern (Figure 9 green field) is from Fe-rich laminae found essentially at the top of DR16-14 (Figure 10D) and through the lamination of 107-11H (Figure 11D). These laminae show a clear hydrogenetic influence (CeSN/CeSN*, respectively, 2 and 4.4) on freshly precipitated Fe-oxyhydroxides. These Fe enriched laminae are consistent with volcanic and hydrothermal events through the crusts growth [86,87,88,89,90,91,92]. The formation of Fe- and P-rich low temperature hydrothermal deposits have been documented in the 2011–2012 submarine volcanic event at El Hierro Island [93,94]. Sample 107-11H shows the presence of a very thin Fe-Mn crust above the hydrothermally altered substrate. Punctual analyses show that the first laminae just above the transition from the substrate rock to oxide crust are also enriched in Fe and Ti with a hydrothermal component (Figure 11B,C). They could be part of an ancient low-temperature hydrothermal system, formed after a volcanic event, producing the alteration of volcanic rocks and the formation of Fe-rich hydrothermal aggregates as occurring on El Hierro Island [93] (Figure 10B,C, Table 5). Fe-rich laminae show an intermediate pattern of REYs between the hydrothermal and the hydrogenetic field. The behavior of these Fe-rich laminae, which could be seen in crusts DR16-14 near the surface and in crust 107-11H at 2 mm from the surface, is probably due to a local volcanic event with similar characteristics that promoted an enrichment of dissolved Fe in the water that was subsequently hydrogenetically precipitated as it was already seen in [95] and will be discussed separately.

4.2. Environmental Influence in Fe-Mn Crusts

FeMn crusts from the CISP formed by the combination of several processes under different environmental conditions including changes in the OMZ thickness, the presence of volcanism and hydrothermal systems and the input of the Sahara desert dust [21,34] over the last 75 My [35].
CISP crusts studied have all been recovered at a water depth between 1700 and 1900 m. This area is influenced by the North Atlantic Deep Water (NADW) that moves water masses from north to south. The action of this current, together with the other deep currents Antarctic Intermediate Water (AAIW) and Antarctic Bottom Water (AABW), generate upwelling movement due to the presence of the seamounts provoking a high biological activity that increases the Oxygen Minimum Zone (OMZ) [96,97]. CISP seamounts are influenced by dust clouds from the Sahara desert that could fly hundreds of kilometers west from the African coast [98,99]. These factors can influence the formation of the crusts in different ways. Hydrothermal and volcanic activity together with Saharan influence may have led to the enrichment of different elements in the surrounding seawater, which eventually were incorporated in the Fe-Mn oxide precipitates (e.g., Fe, P, Si, etc.) [34]. On the other hand, the activity of currents, or the lack of them, can keep the substrate clean of sediments allowing the direct precipitation of Fe-Mn oxyhydroxides from the seawater [1,5,23,100], or could locally allow the coverage of Fe-Mn crusts with sediments and stop the water–mineral interaction. In this case, the precipitation of particular type of laminae composed of diagenetic minerals is possible. High resolution analysis of Fe-Mn crusts is useful to individuate and separate areas with different mineralogical and chemical compositions [101]. These authors suggest that the different mineralogy and geochemistry found in Fe-Mn crusts are related both to regional and local environmental changes, and micro studies are necessary for a strategic planning of area selection with the potential for future exploitation. Higher detrital input is usually bound to a dendritic growth of Fe-Mn minerals [1,6].
Hydrogenetic precipitation of Fe-Mn oxyhydroxides is directly bound to the presence of a thick OMZ, which is a reservoir of dissolved Mn and other elements in seawaters [1,34]. The area OMZ studied is located between 100 and 1000 m water depth with a core of lower content of dissolved oxygen (between 50 and 150 umol/kg) located between 200 and 400 m. depth [96,97]. Studies of dissolved elements in waters have been made in the area showing enrichment of dissolved elements (e.g., Fe, Mn, Co) in the range depth of the OMZ [102]. The action of upwelling currents generates a mixing zone that allows for the precipitation of thick Fe-Mn crusts on top and the slope of seamounts [4,5,15,100]. The hydrogenetic Fe-Mn layers have been found as major in all the studied crusts; these layers have a great variability in element contents in each studied crust. Crusts DR16-14 and 107-11H recovered in the east and west flanks, respectively, of the Tropic Sm. are slightly enriched in Co, Ce and in ΣREY with respect to Crust DR02-10 and DR07-9. On the other hand, diagenetic laminae identified in crusts DR02-10 and DR07-9 seem to be formed by successions of burial and exposure of crusts and the precipitation of Mn, Ni and Cu enriched minerals from the pore waters (Table 5). This genesis is also confirmed by the high detrital minerals and bioclasts found in correspondence of these laminae (Figure 10A,C). Also in DR02-10, diagenetic laminae show an enrichment in Ca due to a higher bioclast input as can be seen in EPMA images (Figure 10A; Table 5). The presence of these diagenetic laminae influences the bulk geochemistry of the crusts by increasing the contents of Ni and Cu as has been recognized in this (Table 3) and previous work [21,34]. Fe-rich laminae found in studied crusts (Figure 9B,D and Figure 10D) could be related to an increase of dissolved Fe in seawater due to high Saharan input but also to local hydrothermal and volcanic activity near the seamounts [86,92,98,99,103,104].

4.3. Hydrothermal Influence in Fe-Mn Crusts

Hydrothermal influence in Fe-Mn crusts form CISP have been confirmed with the high resolution study of crust 107-11H. In this sample, it is possible to identify an altered substrate with the presence of several corroded and disappeared minerals (essentially feldspars, olivine and some magnetite) with a hydrothermal rim around them (Figure 11A). Alkaline volcanic rocks (basalts and basaltic breccia) are abundant on Tropic Sm and the CISP [89,105,106]. The pervasive alteration partly preserves the original brecciated structure and ghosts of previous minerals in this sample. Smectite and amorphous silica are alteration products of silicates (olivine, glass and pyroxenes) on this rock [86]. Peaks of quartz recognized in the sample can be due to the Saharan input as previously seen in [34]. Hematite and goethite group minerals can be produced by the alteration of magnetite and olivine [86,107]. Similar textures and low-temperature hydrothermal alteration have been observed in basalts from Tagoro volcano (El Hierro Island) and in the Canary Islands area [86,87,93]. Phosphate enrichment in the hydrothermal products has also been observed there. EPMA analyses made through this sample and in selected laminae plotted in the ternary diagram (Figure 14A) show that the two main processes in the formation of this crusts have been the hydrothermal and the hydrogenetic from base to top. In this sample, several laminae in contact with the altered substrate have been identified, presenting very high contents of Fe (up to 40 wt. %) and low Mn (maximum 2 wt. %). They also show low contents in all the typical trace elements usually enriched in Fe-Mn crusts Co, Ni, Mo and ΣREY (average of 196, 366, 43 and 750 µg/g, respectively) and slightly high Cu (up to 1000µg/g in average). These laminae also present high contents of As (up to 1500µg/g) due to the hydrothermal influence [93,108]. To confirm these results, LA-ICP-MS spot analyses have been made in several different laminae (green discontinuous lines in Figure 11) to obtain their trace elements and REY contents. Results of these analyses plotted in a PAAS normalized diagram show that, in these crusts, it is also possible to identify the purely hydrogenetic origin of the Fe-Mn oxyhydroxides together with a component that is essentially hydrothermal (Figure 14A). Using this diagram, it is possible to differentiate laminae with Fe-oxyhydroxides with a clear hydrothermal origin from laminae with a mixed origin focusing on Ce negative anomaly and Eu and Y positive anomalies normalized to PAAS. Similar patterns have been found in Fe-Mn crusts recovered in several seamounts of the Eolian Islands archipelago [108].
La-ICP-MS analyses of all the studied crusts have been used to plot in the ternary diagram from [31] (Figure 14B). In the diagram, the field of the three main genetic processes of the crusts have been proven. Many of the spot analyses made in the four studied crusts fall in the hydrogenetic field that is consistent with a major hydrogenetic influence in crusts that were studied. In addition, some spot analyses of crusts DR02-10 and DR07-9 fall in the diagenetic (oxic and suboxic) field and in the region between diagenetic and hydrogenetic. Finally, some spot analyses of crust 107-11H are plotted in the hydrothermal field and in the mixed hydrothermal/hydrogenetic zone. Both graphic representations confirm the hydrothermal alteration of the substrate rock and the influence of the hydrothermal activity in the first laminae of Fe-Mn oxyhydroxides precipitated in contact with the substrate. The enrichment in LREEs over MREEs is proven by ratios LaSN/SmSN > 1 in these hydrothermal laminae while the ratio for hydrogenetic laminae of <1 supports a different genetic origin for these laminae. Hydroxide complexes of La are less stable in seawater compared with Sm; in addition, REE in seawater form mono- and di-carbonate complexes whose stability increase with the atomic number, promoting a higher scavenging of LREY in hydrogenetic laminae [3,109]. Hydrothermal laminae as were also seen in [20] reflect the seawater REY pattern, although some laminae can show a positive Eu anomaly in the REY/PAAS plot diagram, typical of hydrothermal fluids (Figure 14A).
In addition, Ce, Eu and Y anomalies on these laminae are useful to separate them by their genetic process. Laminae with very high Ce anomaly (up to 4.4) are the hydrogenetic or hydrogenetic/hydrothermal laminae represented in Figure 14A by the blue and green fields. These laminae show low Y and Eu anomalies (average 0.7 and 1, respectively). The hydrothermal/hydrogenetic laminae also show a high Ce anomaly (4 in average) that is only slightly low compared with the hydrogenetic and hydrogenetic/hydrothermal laminae. These laminae also have a slightly high Y anomaly (0.9 in average) and a similar Eu anomaly (average 1) compared with the previous laminae. Hydrothermal Fe-oxyhydroxides, on the other hand, have a low Ce (1.7 in average) and high Y (1 in average) anomalies. Finally, new formed minerals within the substrate rock are clearly hydrothermal; hydrothermal fluids that participate in the formation of these minerals acquire their signature interacting with volcanic/magmatic bodies. These minerals have very low Ce anomaly (0.6) and high Eu and Y anomalies (1.2 and 1.4 respectively) (Table S4). Furthermore, the hydrothermal influence on the formation of the Fe-rich laminae in contact with the substrate rock was also confirmed by Fe isotopes analyses on Fe-oxyhydroxides showing a positive value of the δ57Fe (from 0.27 to 0.60‰) similar to the obtained in freshly precipitated Fe-oxyhydroxides from the active hydrothermal system of Tagoro volcano in El Hierro Island (0.57‰) [110]. Nevertheless, we also consider for these laminae the superposition of halmyrolysis (palagonization of glass and development of Fe-oxyhydroxides) on the hydrothermally altered basalt as we can deduct from the Y/Ho ratio (24 ± 1) similar to island-arc basalts [109]. This phenomenon is common in deep-sea volcanic rocks [111].

4.4. CISP Crusts Composition and Metallurgic Methods

Nowadays, the interest in Fe-Mn crusts and nodules worldwide is centered on their important metal contents, essentially for the strategic and critical trace metal such as Co, Cu, Ni, Ti, V, Mo, Tl, W, Nb, Te and REEs [1,2,10,42,112]. Previous studies show that, while Mn nodules are easily recoverable and different mining caterpillar prototypes are being built and tested, Fe-Mn crusts have many more difficulties due to the great variability of thickness, composition at microscale level and to their accumulation and adhesion on substrate rock [101,112]. Fe-Mn crust substrates composed by phosphorites, as sometimes occur in the Pacific or the CISP, could increase the value of potential resources (including P and Y) for future exploitation projects [101]. Elements interesting for mining are enriched in Fe-Mn crusts both as absorbed on the surface of the precipitated minerals or incorporated within the octahedral of the Fe and Mn oxyhydroxides structures due to their atomic radius similarity [1,2,6,30,33,38,40,43,85].
Several metallurgical experiments have been made on Fe-Mn crusts and nodules to extract interesting metals. In the 1970s, four processes were considered economically viable to process Mn nodules: (a) Reductive ammonia leach, (b) High-pressure sulfuric acid leach, (c) Reduction and hydrochloric acid leach, and (d) Reductive smelting and sulfuric acid leach [41,68,113,114,115]. Between these methods, the third and fourth are considered of much interest due to their higher metal extraction.
The leaching process with ammonia, which involves a roasting process to pre-reduce metals, allows a selective leaching of essentially Co, Cu, Ni and Mo without dissolving Mn, Fe or the gangue present. This process is similar to the one used in the metallurgic treatment of the lateritic nickel ores but demand the use of reducing agents at high temperatures [40,116,117,118]. As part of the hydrochloric acid leach process, the use of diluted hydrochloric acid is employed in order to leach Mn and related valuable elements (Co, Ni, Cu) without dissolving Fe [119].
Pyrometallurgic methods are focused on the formation of alloys enriched in valuable metals (Ni, Co, Cu and Mo), producing a slag enriched in Mn (> 40% Mn in the slag). This enriched slag could be also subsequently treated as Mn ore for several steel alloys. The method consists in the heating at 1450 °C of the previously grinded and pelletized crusts with the addition of SiO2 as flux. The Mn enriched slag could be treated at 1600 °C for further ferromanganese reduction [38,120]. Recovery rates of Co, Ni and Cu are above 90%, but Mo has a more variable recovery rate but also in a 90% mean.
In order to consider a metallurgic method, it is useful to define that both hydrometalluric methods described above need large volumes of acid waste and consequent ecological problems [38,40]. Pyrometallurgic methods have a higher metal recovery rate but also the inconvenience of a very careful temperature control of the slag in order to minimize the Mn amount in the metal alloy [42]. Furthermore, recent studies proposed by [36] on the methods to extract valuable elements from Fe-Mn minerals, comparing hydrometallurgy and pyrometallurgy, suggest that the hydrometallurgical methods are generally preferable due to the lower energy consumption and consequently small carbon footprint.
The interest in metals of Fe-Mn crusts is not only restricted to Co, Ni, Cu and Mo but also for their REEs contents and other minor and critical metals. In this way, several researchers consider that REEs in the residue after the extraction of base metals would be more concentrated (up to three times that of bulk crust) and economically viable for their extraction as a byproduct and that LREEs have the higher recovery rate [121,122,123]. Total REYs contents obtained in hydrogenetic minerals from CISP crusts with LA-ICP-MS varying from 3000 and 5000 µg/g, 80–90% of them are represented by LREEs (Table 5 and Table S4). With these range contents of hydrogenetic minerals, after the base metal extraction, REY ores are also achievable.
Fe-Mn crusts from CISP, as seen above, are formed by the mix of several genetic processes that lead to the formation of various Fe-Mn oxyhydroxides. Hydrogenetic minerals (Fe-vernadite) are enriched essentially in Co, V, Mo and REY (Table 5 and Table S4). The action of diagenesis through the growth of crusts DR02-10 and DR07-9 leads to the formation of thin laminae formed by todorokite, buserite and asbolane (Figure 7, Figure 8 and Figure 10) that are enriched in Ni and Cu with low contents of the other elements (Table 5 and Table S4) that change their bulk contents slightly. Due to the small thickness of these laminae (down 20 micron), it has been impossible to study them separately. Previous sequential leeching analyses made both on hydrogenetic and mixed diagenetic/hydrogenetic crusts from CISP and other similar deposits [18,21,121,124] show that Co, Ni, Cu, LREEs and in general most of the valuable elements (eg., Te, Nb, Pt) are strictly bound to the Mn-oxides phase, as observed in the Pacific Ocean deposits. In this sense, Mn-oxides (Fe-vernadite) could be defined as critical-element bearing minerals to mine high- and green-tech metals as byproducts. On the other hand, HREEs are bound as complexed anions to the Fe-oxyhydroxides [1,43].
Due to the enrichment in all the valuable metals in CISP Fe-Mn crusts, all of the previous metallurgic methods could be considered to extract metals from crusts. Purely hydrogenetic crusts (e.g., DR16-14) have the benefit of their higher enrichment in REYs (essentially LREEs) that made them interesting and valuable candidates as byproducts. On the other hand, mixed diagenetic/hydrogenetic crusts (e.g., DR07-9) due to their lower REY (bulk 2300 vs. 3700 ppm) and Mo (380 vs. 640 ppm) could be considered exclusively as Ni + Co + Cu (+ Fe-Mn) ore (Table 3).
In this work, we experimented with the metal extraction with a leaching method proposed by [18] in order to verify the recovery rate obtained for each element. Studied crusts contain up to 1 wt. % of valuable metals represented by Co, Ni, Cu, V, Mo and REY.
Hydrogenetic minerals (essentially Fe-vernadite, DR16-14) show a total recovery rate for valuable metals (Co, Ni, Cu, V, Mo and REY) of 68 ± 10%, and the better values are found for Mn, Ni, V and REY (respectively 81, 70, 83 and up to 89 ± 10%), but lower recovery for Fe, Co, Cu and Mo (57, 63, 50 and 42 ± 10%). This result could be due to the presence of high Fe content and the better intermixed growth of Fe and Mn oxyhydroxides in this sample and the presence of great amounts of hydrogenetic Fe-oxyhydroxides (i.e.,, Mn-feroxyhyte Supplementary Materials Figure S1C) with poor dissolution (only 57 ± 10% of the total Fe) that also concentrate these elements in their structure. Better results have been obtained in DR02-10 with a total recovery rate for considered elements with up to 90 ± 10% with not so good recovery results for Mo (63 ± 10%). In this crust, hydrogenetic minerals but also diagenetic minerals enriched in Ca have been found, with also high Ni and Cu, which could explain the better recovery rate due to the lower resistance of Ca to the hydrochloric acid (Figure 10A and Table 5). Co recovery rate of this sample reaches 108 ± 10%, and this value can be due to the analytical error; the residue of the hydrometallurgical method will be analyzed in future works in order to calculate the mass balance between the phases and reduce this error (Table S3). Finally, sample DR07-9 shows a total recovery rate for all the valuable metals of 67 ± 10% with inferior recovery results for Mn and Ni (75 and 53 ± 10%) compared with the other samples. This difference could be explained by the mineralogy of the samples; diagenetic better crystalized minerals found in this sample (todorokite, buserite and asbolane, Figure 6D and Figure 7D) with Mn contents up to 40 wt. % and high Ni (up to 6 wt. %) (Figure 10C and Table 5) seem to be more resistant to the leaching process and can still be found in XRD analyses made on the residue (Figure S1B). Cu is also enriched in these minerals, but its recovery rate is higher at 67 ± 10%. This is due to the Cu position in the interlayer zone of the buserite structure that allows for a better release of this metal [72,125,126]. On the other hand, it seems that Mn, Ni and Co form alternate layers along the c-axis in the crystal structure of asbolane [127]. Mo recovery rate of studied samples (26–63 ± 10%) is the lowest of all considered trace elements. Mo is bound to Mn-oxides, as was reported by several authors [121,128,129], but also, in previous studies, it was reported that, during leaching experiments, Mo concentrated with the Fe fraction [18,43]; this behavior can be due to a re-adsorption of Mo in the remaining Fe-oxyhydroxides during the experiment [121].
Pyrometallurgical methods such as performed in [130] show a higher recovery rate (up to 90% for Ni, Cu, Co) compared with this experiment. Hydrometallurgical experiments show more variation depending on the selected procedure. The recovery rate obtained by [117] with an ammoniacal solution in previously roasted Fe-Mn nodules also show higher recovery rates for Ni and Cu (up to 90%) but low for Co (maximum 82%). Both experiments appear as suitable methods for processing Fe-Mn deposits but have the inconvenience of the higher energetic waste [36]. Pure hydrometallurgical methods, on the other hand, are a more suitable method with less energetic waste and their flexibility on multiple products. The method using hydrochloric acid with the addition of a reducing agent (ethanol) proposed by [18] and performed here also show a higher recovery rate (up to 96% for valuable metals) compared with our experiment. The first consideration is that the recovery rate of Fe in CISP crusts is the lower of all the studied elements (around 50 ± 10% of the total) compared with the 90% obtained in polymetallic nodules. In addition, the recovery rate obtained for bulk crusts reflect partially the influence of the mineralogy of the Fe-Mn crusts. The lower recovery rate obtained in our experiment compared with [69] must be due to a high time exposure time of the samples to leaching solution during their filtering (that took some hours). As was indicated by authors in [66], the equilibrium reaction forming CH3Cl is faster than the reaction forming C2H5Cl and this depletes the free chloride ions in solution promoting the precipitation of the metals as hydroxides or their absorption on the residual Fe oxyhydroxides instead of remaining in solution as metal chlorides’ complexes [131]. The use of a vacuum filtration is conducted in order to have better control on the time.
Comparison with previous sequential leaching performed in [21] shows that the hydroxylamine digestion has a higher recovery rate for several elements as Mn (92% and 82%), Co (93% and 92%) and Ni (87% and 76%), respectively, in mixed diagenetic/hydrogenetic and purely hydrogenetic crusts, but lower recovery rates for elements like Cu (54% and 29%), V (53% and 51%) and especially Mo (around 2% in both crusts). In contrast, the concentrated hydrochloric digestion of the sequential leaching is useful to dissolve almost all the Fe (80% and 61%), together with part of the Cu (33% and 54%), not linked to the purely Mn oxides, part of the V (40% and 36%) and almost all the Mo (89% and 85%). Between the REY (sum of Y, La and Ce), it is also possible to see that both the hydroxylamine and the hydrochloric digestions have lower recovery rates (45% and 60% and 34% and 26%, respectively). In this way, hydroxylamine digestion is a better method in order to extract Mn, Co and Ni, but the recovery of the other valuable elements needs a second leaching step. A similar experiment has been made on Fe-Mn nodules from the Gulf of Cádiz [132]. In this work, a concentrated hydrofluoric acid (HF 40%) has been used in order to dissolve all the Fe-oxides and silicates and obtain a residual solid Mn concentrate. After the acid treatment, both the solution and the residual solid were analyzed. The analysis of the solution shows that all the Fe was dissolved with also around 40 % of the Mn. On the other hand, the residual solid was enriched in Mn but also in all the valuable trace elements by a factor of 2 in the case of Co (120 μg/g the residual solid vs. 64 μg/g in the bulk) and higher for Ni and Cu (250 and 83 μg/g vs. 43 and 16 μg/g). This enrichment can reach also a factor of 3 in the case of the LREEs, i.e., La (80 μg/g vs. 18 μg/g). In high resolution analysis of this study and also in sequential leaching of two types of crusts performed in [21], it seems clear that Fe-Mn crusts from CISP concentrate most of the valuable metal in the Mn oxides (Table 4 and Table 5). In this way, the pre-treatment with hydrofluoric acid allows for obtaining a manganese concentrate enriched essentially in Co, Ni, Cu, Mo and most of the LREEs.
Finally, we can remark that detailed studies of the seamounts and their crusts will be useful in future mining plans and metals’ extractive works. The location of high diagenetic influenced crusts (rich in Mn, Ni and Cu) in one area of the seamount with respect to the rest, with predominance of hydogenetic crusts, can lead to choosing the hydroxylamine leaching. This method, as seen above, shows a better recovery rate of in diagenetic Mn-oxides compared with the hydrochloric leaching.

5. Conclusions

The work deals with a detailed mineral and chemical investigation on Fe-Mn crusts together with qualification of the metal recovery rate highlighting the great importance from both scientific and economic points of view.
Fe-Mn crusts from CISP are enriched in several economic elements (Co, Ni, Cu and REY) with contents up to 1 wt. %. The enrichment in one element or another is strictly bound to the genetic process that influenced each crust and also on their mineralogy.
High-resolution mineralogical analyses performed with micro XRD, Raman and FT-IR on selected laminae have been useful as innovative tools, to recognize these minerals forming very thin laminae (down 50 micron) and identifying the diagenetic processes that form different minerals through the growth of crusts DR02-10 (todorokite and less buserite) and DR07-9 (essentially buserite and intergrown asbolane). These techniques have been used to better identify and separate the purely hydrogenetic minerals (essentially vernadite) with low crystallinity and those that form both mixed diagenetic/hydrogenetic microlayers (birnessite, Ni-Cu asbolane and buserite).
High-resolution geochemistry performed both with EPMA and LA-ICP-MS shows that bright laminae on DR02-10 and specially DR07-9 are highly enriched in Mn (up to 40 wt. %), Ni (up to 6 wt. %) and Cu (up to 2 wt. %) with very low contents of other trace metals or REY. These contents are in the range of typical diagenetic nodules from the Pacific Ocean. On the other hand, hydrogenetic minerals show quite similar contents of Fe and Mn (ranging from 16 to 23 wt. %), but high contents of Co, V, Mo and especially REY (up to 1, 0.1, 0.06 and 0.3 wt. %) closely to other crusts in the Atlantic or Pacific oceans. Finally, some bright laminae evidenced with EPMA in crusts DR16-14 and 107-11H are enriched in Fe (up to 60 wt. %) with small contents of trace metals. REY and HFSE pattern of these laminae plot in the hydrothermal or mixed hydrothermal/hydrogenetic field.
A hydrometallurgical method performed on studied crusts shows a recovery rate of valuable elements (Co, Ni, Cu, V, Mo and REY) ranging from 67 to 90%. Mixed diagenetic/hydrogenetic influenced crust shows a low recovery rate for Mn (75%) and Ni (52%) compared with a lower diagenetic influenced or purely hydrogenetic crusts, probably due to the difficulty digestion of better crystalized minerals (todorokite, asbolane and buserite) as appearing in the XRD made on the residue. The comparison with previous sequential leaching on similar mixed diagenetic and purely hydrogenetic samples suggest the adoption of a pre-digestion with hydroxylamine in order to dissolve up to 90% of Mn, and Co and up to 80% of Ni. This pre-digestion also provides interesting contents of Cu, V and REY (50% on average). Subsequently, the digestion with hydrochloric acid in a reduced solution provides the rest of the valuable elements, essentially Cu, V, Mo and the undissolved REY. More experiments in this sense will be developed in future works.

Supplementary Materials

The following are available online at https://www.mdpi.com/2075-163X/9/7/439/s1, Figure S1: X-ray diffraction of the residual solids, Table S1: Method uncertainty, Table S2: Accuracy and precision of the XRF technique, Table S3: Accuracy and precision of the ICP-MS technique, Table S4: Ce, Eu and Y anomalies and REY data.

Author Contributions

Marine Geology Dv., Geological Survey of Spain (IGME) provided the samples for this work; E.M. and F.J.G. conceived and designed the experimental research; T.K., A.V.W., P.M., J.M. and M.O. provided the access to several high resolution equipment in their laboratories; E.M. performed the experiments, analysed the data and wrote the paper; F.J.G., L.S., T.M., T.K., A.V.W., P.M., J.M. and R.L. substantially revised the work. J.R. and M.O. have performed and revised all the geochemical and LA-ICP-MS analyses and C.M. has performed Raman and FT-IR analysis. The authors have approved the submitted version and agree to be personally accountable for the author’s own contributions and for ensuring that questions related to the accuracy or integrity of any part of the work, even ones in which the author was not personally involved, are appropriately investigated, resolved, and documented in the literature.

Funding

This research was funded by the EXPLOSEA project (CTM2016-75947-R) of the Secretary of State for Research and Innovation (SEIDI-MINEICO) of Spain, the SUBVENT project (CGL2012-39524-C02), the Extension of the Continental Shelf of Spain project (CTM2010-09496-E), IGME project REMIMARES (IGME-2571); and European projects EMODnet-Geology (EASME/EMFF/2016/1.31.2-Lot 1/SI2.750862) and H2020 GeoERA-MINDeSEA project (Grant Agreement No. 731166, project GeoE.171.001).

Acknowledgments

Data for this paper have been collected in the framework of the Project for the Spanish Extension of the Continental Shelf according the United Nations for Convention of the Law of the Sea (UNCLOS). We want to acknowledge the MarineE-Tech project (NERC grants NE/M011186/1 and NE/M011151/1, JC142 expedition) from which one of the samples has been used for this study (107-11H) and the principal investigators (PIs) of this project (Bramley Murton, NOC & Paul Lusty, BGS). Egidio Marino would also like to thank the Ministry of Science, Innovation and Universities for its FPU scholarship (FPU014/06774). The staff of the Centro Nacional de Microscopía Electrónica and the Laboratories of: Crystallography and Mineralogy Department (Geology Faculty) of the Complutense University of Madrid (UCM); Geological Survey of Spain (IGME); Federal Institute for Geosciences and Natural Resources (BGR); the Leibniz Universität Hannover Institut für Mineralogie; and the Laboratorio HERCULES of Évora are also thanked for allowing us to use their facilities. We thank the five anonymous Reviewers and Editors for comments that helped improve this paper.

Conflicts of Interest

The authors declare no conflict of interest. The founding sponsors had no role in the design of the study; in the collection, analyses, or interpretation of data; in the writing of the manuscript, and in the decision to publish the results.

References

  1. Hein, J.R.; Koschinsky, A.; Bau, M.; Manheim, F.T.; Kang, J.-K.; Roberts, L. Cobalt-rich ferromanganese crusts in the Pacific. In Handbook of Marine Mineral Deposits; Cronan, D.S., Ed.; CRC Press: London, UK, 2000; pp. 239–279. [Google Scholar]
  2. Hein, J.R.; Mizell, K.; Koschinsky, A.; Conrad, T.A. Deep-ocean mineral deposits as a source of critical metals for high- and green-technology applications: Comparison with land-based resources. Ore Geol. Rev. 2013, 51, 1–14. [Google Scholar] [CrossRef]
  3. Bau, M.; Schmidt, K.; Koschinsky, A.; Hein, J.; Kuhn, T.; Usui, A. Discriminating between different genetic types of marine ferro-manganese crusts and nodules based on rare earth elements and yttrium. Chem. Geol. 2014, 381, 1–9. [Google Scholar] [CrossRef]
  4. Halbach, P.; Hebisch, U.; Scherhag, C. Geochemical variations of ferromanganese nodules and crusts from different provinces of the Pacific Ocean and their genetic control. Chem. Geol. 1981, 34, 3–17. [Google Scholar] [CrossRef]
  5. Bogdanov, Y.A.; Bogdanova, O.Y.; Dubinin, A.V.; Gorand, A.; Gorshkov, A.I.; Gurvich, E.G.; Isaeva, A.B.; Ivanov, G.V.; Jansa, L.F.; Monaco, A. Composition of Ferromanganese Crusts and Nodules at Northwestern Pacific Guyots and Geologic and Paleoceanographic Considerations. In Proceedings of the Ocean Drilling Program: Scientific Results; Haggerty, J.A., Premoli Silva, I., Rack, F., McNutt, M.K., Eds.; Ocean Drilling Program: College Station, TX, USA, 1995; Volume 144, p. 1059. [Google Scholar]
  6. Kuhn, T.; Wegorzewski, A.V.; Rühlemann, C.; Vink, A. Composition, Formation, and Occurrence of Polymetallic Nodules. In Deep-Sea Mining; Sharma, R., Ed.; Springer: Cham, Switzerland, 2017; pp. 23–63. [Google Scholar]
  7. Commission, E. Critical Raw Materials. 2019. Available online: http://ec.europa.eu/growth/sectors/ raw-materials/specific-interest/critical_en (accessed on 8 January 2019).
  8. Hein, J.R.; Koschinsky, A. Deep-Ocean Ferromanganese Crusts and Nodules. In Treatise on Geochemistry; Holland, H.D., Turekian, K.K., Eds.; Elsevier: Amsterdam, The Netherlands, 2014; pp. 273–291. [Google Scholar]
  9. International Seabed Authority (ISA). 2019. Available online: https://www.isa.org.jm (accessed on 10 January 2019).
  10. Glasby, G. Manganese deposits in the southwest Pacific. In Phase I Report-Inter-University Program of Research on Ferromanganese Deposits of the Ocean Floor; Seabed Assessment Program; National Science Foundation: Washington, DC, USA, 1973; pp. 137–169. [Google Scholar]
  11. Burns, R.G.; Burns, V.M. Mineralogy. In Marine Manganese Deposits; Elsevier: Amsterdam, The Netherlands, 1977; Volume 15, pp. 185–248. [Google Scholar]
  12. Usui, A. Minerals, Metal Contents, and Mechanism of Formation of Manganese Nodules from the Central Pacific Basin (GH76-1 and GH77-1 Areas). In Marine Geology and Oceanography of the Pacific Manganese Nodule Province; Springer: Boston, MA, USA, 1979; pp. 651–679. [Google Scholar]
  13. Koschinsky, A.; van Gerven, M.; Halbach, P. First investigations of massive ferromanganese crusts in the NE Atlantic in comparison with hydrogenetic pacific occurrences. Mar. Georesour. Geotechnol. 1995, 13, 375–391. [Google Scholar] [CrossRef]
  14. Hein, J.R.; Schwab, W.C.; Davis, A. Cobalt- and platinum-rich ferromanganese crusts and associated substrate rocks from the Marshall Islands. Mar. Geol. 1988, 78, 255–283. [Google Scholar] [CrossRef]
  15. Hein, J.R.; Bohrson, W.A.; Schulz, M.S.; Noble, M.; Clague, D.A. Variations in the Fine-Scale Composition of a Central Pacific Ferromanganese Crust: Paleoceanographic Implications. Paleoceanogrphy 1992, 7, 63–67. [Google Scholar] [CrossRef]
  16. Cronan, D.S.; Varnavas, S.P.; Hodkinson, R. Hydrothermal Mineralizing Processes and Associated Sedimentation in the Santorini Hydrothermal Embayments. Mar. Georesour. Geotechnol. 2000, 18, 77–118. [Google Scholar] [CrossRef]
  17. Koschinsky, A.; Hein, J.R. Uptake of elements from seawater by ferromanganese crusts: Solid-phase associations and seawater speciation. Mar. Geol. 2003, 198, 331–351. [Google Scholar] [CrossRef]
  18. Lusty, P.A.J.; Murton, B.J. Deep-Ocean Mineral Deposits: Metal Resources and Windows into Earth Processes. Elememts 2018, 14, 301–306. [Google Scholar] [CrossRef] [Green Version]
  19. Varentsov, I.M.; Drits, V.A.; Gorshkov, A.I.; Sivtsov, A.V.; Sakharov, B.A. Mn-Fe oxyhydroxide crusts from Krylov Seamount (Eastern Atlantic): Mineralogy, geochemistry and genesis. Mar. Geol. 1991, 96, 53–70. [Google Scholar] [CrossRef]
  20. Baturin, G.N.; Dubinchuk, V.T.; Rashidov, V.A. Ferromanganese crusts from the Sea of Okhotsk. Oceanology 2012, 52, 88–100. [Google Scholar] [CrossRef]
  21. Marino, E.; González, F.J.; Lunar, R.; Reyes, J.; Medialdea, T.; Castillo-Carrión, M.; Bellido, E.; Somoza, L. High-Resolution Analysis of Critical Minerals and Elements in Fe–Mn Crusts from the Canary Island Seamount Province (Atlantic Ocean). Minerals 2018, 8, 285. [Google Scholar] [CrossRef]
  22. Post, J.E. Manganese oxide minerals: Crystal structures and economic and environmental significance. Proc. Natl. Acad. Sci. USA 1999, 96, 3447–3545. [Google Scholar] [CrossRef] [PubMed]
  23. Hein, J.R.; Koschinsky, A.; Halbach, P.; Manheim, F.T.; Bau, M.; Kang, J.-K.; Lubick, N. Iron and manganese oxide mineralization in the Pacific. Geol. Soc. Lond. Spec. Publ. 1997, 119, 123–138. [Google Scholar] [CrossRef]
  24. González, F.J.; Somoza, L.; Hein, J.R.; Medialdea, T.; León, R.; Urgorri, V.; Reyes, J.; Martín-Rubí, A.J. Phosphorites, Co-rich Mn nodules, and Fe-Mn crusts from Galicia Bank, NE Atlantic: Reflections of Cenozoic tectonics and paleoceanography, Geochemistry. Geophys. Geosyst. 2016, 17, 346–374. [Google Scholar] [CrossRef]
  25. Pelleter, E.; Fouquet, Y.; Etoubleau, J.; Cheron, S.; Labanieh, S.; Josso, P.; Bollinger, C.; Langlade, J. Ni-Cu-Co-rich hydrothermal manganese mineralization in the Wallis and Futuna back-arc environment (SW Pacific). Ore Geol. Rev. 2017, 87, 126–146. [Google Scholar] [CrossRef] [Green Version]
  26. Hein, J.R.; Koschinsky, A.; McIntyre, B.R. Mercury- and silver-rich ferromanganese oxides, southern California Borderland: Deposit model and environmental implications. Econ. Geol. 2005, 100, 1151–1168. [Google Scholar] [CrossRef]
  27. Bonatti, E.; Kraemer, T.; Rydell, H. Classification and genesis of submarine iron-manganese deposits. In Ferromanganese Deposits on the Ocean Floor; Horn, D.R., Ed.; Arden House: New York, NY, USA, 1972; pp. 149–165. [Google Scholar]
  28. Dymond, J.; Lyle, M.; Finney, B.; Piper, D.Z.; Murphy, K.; Conard, R.; Pisias, N. Ferromanganese nodules from MANOP Sites H, S, and R—Control of mineralogical and chemical composition by multiple accretionary processes. Geochim. Cosmochim. Acta 1984, 48, 931–949. [Google Scholar] [CrossRef]
  29. Lyle, M. Formation and growth of ferromanganese oxides on the Nazca plate, In GSA MEMOIRS Nazca Plate: Crustal Formation and Andean Convergence; Kulm, L.D., Dymond, J., Dasch, E.J., Hussong, D.M., Roderick, R., Eds.; Geological Society of America: Boulder, CO, USA, 1981; pp. 269–294. [Google Scholar]
  30. Wegorzewski, A.V.; Kuhn, T.; Dohrmann, R.; Wirth, R.; Grangeon, S. Mineralogical characterization of individual growth structures of Mn-nodules with different Ni+Cu content from the central Pacific Ocean. Am. Miner. 2015, 100, 2497–2508. [Google Scholar] [CrossRef]
  31. Josso, P.; Pelleter, E.; Pourret, O.; Fouquet, Y.; Etoubleau, J.; Cheron, S.; Bollinger, C. A new discrimination scheme for oceanic ferromanganese deposits using high field strength and rare earth elements. Ore Geol. Rev. 2017, 87, 3–15. [Google Scholar] [CrossRef] [Green Version]
  32. Menendez, A.; James, R.; Shulga, N.; Connelly, D.; Roberts, S.; Menendez, A.; James, R.; Shulga, N.; Connelly, D.; Roberts, S. Linkages between the Genesis and Resource Potential of Ferromanganese Deposits in the Atlantic, Pacific, and Arctic Oceans. Minerals 2018, 8, 197. [Google Scholar] [CrossRef]
  33. Wegorzewski, A.V.; Kuhn, T. The influence of suboxic diagenesis on the formation of manganese nodules in the Clarion Clipperton nodule belt of the Pacific Ocean. Mar. Geol. 2014, 357, 123–138. [Google Scholar] [CrossRef]
  34. Marino, E.; González, F.J.; Somoza, L.; Lunar, R.; Ortega, L.; Vázquez, J.T.; Reyes, J.; Bellido, E. Strategic and rare elements in Cretaceous-Cenozoic cobalt-rich ferromanganese crusts from seamounts in the Canary Island Seamount Province (northeastern tropical Atlantic). Ore Geol. Rev. 2017, 87, 41–61. [Google Scholar] [CrossRef]
  35. Josso, P.; Parkinson, I.; Horstwood, M.; Lusty, P.; Chenery, S.; Murton, B.J. Improving confidence in ferromanganese crust age models: A composite geochemical approach. Chem. Geol. 2019, 513, 108–119. [Google Scholar] [CrossRef]
  36. Zubkov, M.V.; Plucinski, P.K.; Dartiguelongue, A.C.Y.; Lusty, P.A.J. Metal Extraction from Deep-Ocean Mineral Deposits. Elememts 2018, 14, 319–324. [Google Scholar] [CrossRef]
  37. Vasil’chikov, N.V.; Shirer, G.B.; Matsepon, Y.A.; Krasnykh, I.F.; Grishankova, E.A. Iron-Manganese Nodules from the Ocean Floor—Raw Materials for the Production of Cobalt, Nickel, Manganese, and Copper. Sov. J. Non-Ferrous Met. (Engl. Transl.) 1968, 9, 46–49. [Google Scholar]
  38. Friedmann, D.; Pophanken, A.K.; Friedrich, B. Pyrometallurgical extraction of valuable metals from polymetallic deep-sea nodules. In Proceedings of the EMC 2015, Aachen, Germany, 14–17 June 2015. [Google Scholar]
  39. Abramovski, T.; Stefanova, V.; Causse, R.; Romanchuk, A. Technologies for the processing of polymetallic nodules from Clarion Clipperton zone in the Pacific Ocean. J. Chem. Technol. Metall. 2017, 52, 258–269. [Google Scholar]
  40. Pophanken, A.; Friedrich, B. Challenges in the Metallurgical Processing of Marine Mineral Resources. In Proceedings of the EMC 2013, Weimar, Germany, 23–26 June 2013. [Google Scholar]
  41. Friedmann, D.; Pophanken, A.K.; Friedrich, B. Pyrometallurgical Treatment of High Manganese Containing Deep Sea Nodules. J. Sustain. Metall. 2017, 3, 219–229. [Google Scholar] [CrossRef]
  42. Wegorzewski, A.V.; Köpcke, M.; Kuhn, T.; Sitnikova, M.; Wotruba, H. Thermal Pre-Treatment of Polymetallic Nodules to Create Metal (Ni, Cu, Co)-Rich Individual Particles for Further Processing. Minerals 2018, 8, 523. [Google Scholar] [CrossRef]
  43. Koschinsky, A.; Halbach, P. Sequential leaching of marine ferromanganese precipitates: Genetic implications. Geochim. Cosmochim. Acta 1995, 59, 5113–5132. [Google Scholar] [CrossRef]
  44. Sherman, D.M.; Peacock, C.L. Surface complexation of Cu on birnessite (δ-MnO2): Controls on Cu in the deep ocean. Geochim. Cosmochim. Acta 2010, 74, 6721–6730. [Google Scholar] [CrossRef]
  45. Peacock, C.L. Physiochemical controls on the crystal-chemistry of Ni in birnessite: Genetic implications for ferromanganese precipitates. Geochim. Cosmochim. Acta 2009, 73, 3568–3578. [Google Scholar] [CrossRef]
  46. Peacock, C.L.; Sherman, D.M. Sorption of Ni by birnessite: Equilibrium controls on Ni in seawater. Chem. Geol. 2007, 238, 94–106. [Google Scholar] [CrossRef]
  47. Manceau, A.; Lanson, M.; Takahashi, Y. Mineralogy and crystal chemistry of Mn, Fe, Co, Ni, and Cu in a deep-sea Pacific polymetallic nodule. Am. Miner. 2014, 99, 2068–2083. [Google Scholar] [CrossRef]
  48. Bodeï, S.; Manceau, A.; Geoffroy, N.; Buatier, M. Formation of todorokite from vernadite in Ni-rich hemipelagic sediments. Geochim. Cosmochim. Acta 2007, 71, 5698–5716. [Google Scholar] [CrossRef]
  49. Liu, L.; Min, M.; Liu, F.; Yin, H.; Zhang, Y.; Qiu, G. Influence of vanadium doping on the supercapacitance performance of hexagonal birnessite. J. Power Sources 2015, 277, 26–35. [Google Scholar] [CrossRef]
  50. GeoERA-MINDeSEA. 2019. Available online: http://geoera.eu/projects/mindesea/ (accessed on 15 March 2019).
  51. Redfern, A.S.T. A.S. Marfunin (Ed.) Advanced Mineralogy Volume 1. Composition, Structure, and Properties of Mineral Matter; Volume 2. Methods and Instrumentations. Berlin, Heidelberg and New York (Springer-Verlag). Vol. 1: 1994, xxvii + 551 pp. Price DM198.00, ISBN 3-540-57254-6. Vol. 2: 1995, xxi + 441 pp. Price DM198.00. ISBN 0-387-57255-4. Mineral. Mag. 62, 877. [CrossRef]
  52. Roqué-Rosell, J.; Mosselmans, J.F.W.; Proenza, J.A.; Labrador, M.; Galí, S.; Atkinson, K.D.; Quinn, P.D. Sorption of Ni by “lithiophorite-asbolane” intermediates in Moa Bay lateritic deposits, eastern Cuba. Chem. Geol. 2010, 275, 9–18. [Google Scholar] [CrossRef]
  53. Little, S.H.; Sherman, D.M.; Vance, D.; Hein, J.R. Molecular controls on Cu and Zn isotopic fractionation in Fe-Mn crusts. Earth Planet. Sci. Lett. 2014, 396, 213–222. [Google Scholar] [CrossRef]
  54. Ostrooumov, M. Raman and Infrared Reflection Spectroscopic Study of Mineralogical Composition of Iron-Manganese Nodules (Pacific and Indian Oceans). Int. J. Exp. Spectrosc. Tech. 2017, 2, 2–12. [Google Scholar] [CrossRef]
  55. Lafuente, B.; Downs, R.T.; Yang, H.; Stone, N. The power of databases: The RRUFF project. In Highlights in Mineralogical Crystallography; Armbruster, T., Danisi, R., Eds.; W. De Gruyter: Berlin, Germany, 2015; pp. 1–30. [Google Scholar]
  56. Julien, C.; Massot, M.; Baddour-Hadjean, R.; Franger, S.; Bach, S.; Pereira-Ramos, P.J. Raman spectra of birnessite manganese dioxides. Solid State Ion. 2003, 159, 345–356. [Google Scholar] [CrossRef]
  57. Julien, C. Local cationic environment in lithium nickel-cobalt oxides used as cathode materials for lithium batteries. Solid State Ion. 2000, 136, 887–896. [Google Scholar] [CrossRef]
  58. Julien, C.M.; Massot, M.; Poinsignon, C. Lattice vibrations of manganese oxides: Part I. Periodic structures. Spectrochim. Acta-Part A Mol. Biomol. Spectrosc. 2004, 60, 689–700. [Google Scholar] [CrossRef]
  59. Chukanov, N.V.; Chervonnyi, A.D. Infrared Spectroscopy of Minerals and Related Compounds; Springer: Cham, Switzerland, 2016; p. 1109. [Google Scholar]
  60. Oeser, M.; Weyer, S.; Horn, I.; Schuth, S. High-precision fe and mg isotope ratios of silicate reference glasses determined in situ by femtosecond LA-MC-ICP-MS and by solution nebulisation MC-ICP-MS. Geostand. Geoanal. Res. 2014, 38, 311–328. [Google Scholar] [CrossRef]
  61. Lazarov, M.; Horn, I. Matrix and energy effects during in-situ determination of Cu isotope ratios by ultraviolet-femtosecond laser ablation multicollector inductively coupled plasma mass spectrometry. Spectrochim. Acta Part B At. Spectrosc. 2015, 111, 64–73. [Google Scholar] [CrossRef]
  62. Collinet, M.; Charlier, B.; Namur, O.; Oeser, M.; Médard, E.; Weyer, S. Crystallization history of enriched shergottites from Fe and Mg isotope fractionation in olivine megacrysts. Geochim. Cosmochim. Acta 2017, 207, 277–297. [Google Scholar] [CrossRef]
  63. Neave, D.A.; Shorttle, O.; Oeser, M.; Weyer, S.; Kobayashi, K. Mantle-derived trace element variability in olivines and their melt inclusions. Earth Planet. Sci. Lett. 2018, 483, 90–104. [Google Scholar] [CrossRef] [Green Version]
  64. Jochum, K.P.; Nohl, U.; Herwig, K.; Lammel, E.; Stoll, B.; Hofmann, A.W. GeoReM: A New Geochemical Database for Reference Materials and Isotopic Standards. Geostand. Geoanal. Res. 2005, 29, 333–338. [Google Scholar] [CrossRef]
  65. Jochum, K.P.; Weis, U.; Stoll, B.; Kuzmin, D.; Yang, Q.; Raczek, I.; Jacob, D.E.; Stracke, A.; Birbaum, K.; Frick, D.A.; et al. Determination of Reference Values for NIST SRM 610-617 Glasses Following ISO Guidelines. Geostand. Geoanal. Res. 2011, 35, 397–429. [Google Scholar] [CrossRef]
  66. Jackson, S. LAMTRACE Data Reduction Software for LA-ICP-MS. In Laser Ablation ICP-MS in the Earth Sciences: Current Practices and Outstanding Issues; Sylvester, P., Ed.; Mineralogical Association of Canada Short Course Series; Mineralogical Association of Canada: Vancouver, BC, Canada, 2008; pp. 305–307. [Google Scholar]
  67. Lipin, B.R.; McKay, G.A. Geochemistry and Mineralogy of Rare Earth Elements; Mineralogicas Society of America: Washington, DC, USA, 1989. [Google Scholar]
  68. Kane, W.S.; Cardwell, P.H. Winning of Metal Values from Ore Utilizing Recycled Acid Leaching Agent. U.S. Patent 3923615A, 2 December 1974. [Google Scholar]
  69. Jana, R.K.; Singh, D.D.N.; Roy, S.K. Hydrochloric Acid Leaching of Sea Nodules with Methanol and Ethanol Addition. Mater. Trans. JIM 1993, 34, 593–598. [Google Scholar] [CrossRef] [Green Version]
  70. Mulè, G.; Burlet, C.; Vanbrabant, Y. Automated curve fitting and unsupervised clustering of manganese oxide Raman responses. J. Raman Spectrosc. 2017, 48, 1665–1675. [Google Scholar] [CrossRef]
  71. Guan, Y.; Sun, X.; Jiang, X.; Sa, R.; Zhou, L.; Huang, Y.; Liu, Y.; Li, X.; Lu, R.; Wang, C. The effect of Fe-Mn minerals and seawater interface and enrichment mechanism of ore-forming elements of polymetallic crusts and nodules from the South China Sea. Acta Oceanol. Sin. 2017, 36, 34–46. [Google Scholar] [CrossRef]
  72. Cui, H.; Feng, X.; Tan, W.; He, J.; Hu, R.; Liu, F. Synthesis of todorokite-type manganese oxide from Cu-buserite by controlling the pH at atmospheric pressure. Microporous Mesoporous Mater. 2009, 117, 41–47. [Google Scholar] [CrossRef]
  73. Al-Sagheer, F.A.; Zaki, M.I. Synthesis and surface characterization of todorokite-type microporous manganese oxides: Implications for shape-selective oxidation catalysts. Microporous Mesoporous Mater. 2004, 67, 43–52. [Google Scholar] [CrossRef]
  74. Taylor, S.R.; McLennan, S.M. The Continental Crust, Its Composition and Evolution: An Examination of the Geochemical Record Preserved in Sedimentary Rocks; Blackwell Scientific: Hoboken, NJ, USA, 1985. [Google Scholar]
  75. Baturin, G.N.; Dubinchuk, V.T. Mineralogy and chemistry of ferromanganese crusts from the Atlantic Ocean. Geochem. Int. 2011, 49, 578–593. [Google Scholar] [CrossRef]
  76. Yeo, I.A.; Dobson, K.; Josso, P.; Pearce, R.B.; Howarth, S.A.; Lusty, P.A.J.; le Bas, T.P.; Murton, B.J. Assessment of the Mineral Resource Potential of Atlantic Ferromanganese Crusts Based on Their Growth History. Microstruct. Texture Miner. 2018, 8, 327. [Google Scholar] [CrossRef]
  77. Benites, M.; Millo, C.; Hein, J.; Nath, B.N.; Murton, B.; Galante, D.; Jovane, L. Integrated Geochemical and Morphological Data Provide Insights into the Genesis of Ferromanganese Nodules. Minerals 2018, 8, 488. [Google Scholar] [CrossRef]
  78. Hein, J.R.; Spinardi, F.; Okamoto, N.; Mizell, K.; Thorburn, D.; Tawake, A. Critical metals in manganese nodules from the Cook Islands EEZ, abundances and distributions. Ore Geol. Rev. 2015, 68, 97–116. [Google Scholar] [CrossRef]
  79. Frazer, J.Z.; Fisk, M.B. Geological factors related to characteristics of sea-floor manganese nodule deposits. Deep Sea Res. Part A Oceanogr. Res. Pap. 1981, 28, 1533–1551. [Google Scholar] [CrossRef]
  80. Koschinsky, A. Heavy metal distributions in Peru Basin surface sediments in relation to historic, present and disturbed redox environments. Deep Sea Res. Part II Top. Stud. Oceanogr. 2001, 48, 3757–3777. [Google Scholar] [CrossRef]
  81. Halbach, P.; Scherhag, C.; Hebisch, U.; Marchig, V. Geochemical and mineralogical control of different genetic types of deep-sea nodules from the Pacific Ocean. Min. Depos. 1981, 16, 59–84. [Google Scholar] [CrossRef]
  82. Friedrich, G.; Kunzendorf, H.; Plüger, W.L. Geochemical investigations of deep-sea manganese nodules from the Pacific on board RV “Valdivia“. In Papers on the Origin and Distribution of Manganese Nodules in the Pacific and Prospects for Their Exploration; Morgenstein, M., Ed.; University of Hawaii and IDOE-NSF: Valdivia, Chile, 1973; pp. 32–43. [Google Scholar]
  83. Friedrich, G.H.W.; Kunzendorf, H.; Plüger, W.L. Ship-borne geochemical investigations of deep-sea manganese-nodule deposits in the Pacific using a radioisotope energy-dispersive X-ray system. J. Geochem. Explor. 1974, 3, 303–317. [Google Scholar] [CrossRef]
  84. Koschinsky, A.; Stascheit, A.; Bau, M.; Halbach, P. Effects of phosphatization on the geochemical and mineralogical composition of marine ferromanganese crusts. Geochim. Cosmochim. Acta 1997, 61, 4079–4094. [Google Scholar] [CrossRef]
  85. Hein, J.R.; Conrad, T.; Mizell, K.; Banakar, V.K.; Frey, F.A.; Sager, W.W. Controls on ferromanganese crust composition and reconnaissance resource potential, Ninetyeast Ridge, Indian Ocean. Deep Sea Res. Part I Oceanogr. Res. Pap. 2016, 110, 1–19. [Google Scholar] [CrossRef]
  86. Rodrı́guez-Losada, J.A.; Martinez-Frias, J.; Bustillo, M.A.; Delgado, A.; Hernandez-Pacheco, A.; de Krauss, J.V. The hydrothermally altered ankaramite basalts of Punta Poyata (Tenerife, Canary Islands). J. Volcanol. Geotherm. Res. 2000, 103, 367–376. [Google Scholar] [CrossRef]
  87. Schiffman, P.; Staudigel, H. Hydrothermal alteration of a seamount complex on La Palma, Canary Islands: Implications for metamorphism in accreted terranes. Geology 1994, 22, 151–154. [Google Scholar] [CrossRef]
  88. Lindblom, S.; Gérard, M. Textural and fluid inclusion evidence for hydrothermal activity in the volcaniclastic apron of Gran Canaria. In Proceedings of the Ocean Drilling Program, Scientific Results; Weaver, P.P.E., Schmincke, H.-U., Firth, J.V., Eds.; Texas A&M University: College Station, TX, USA, 1998; Volume 157, pp. 429–439. [Google Scholar] [CrossRef]
  89. Schmincke, H.-U.; Krastel, S.; Hansteen, T.; Sumita, M. Preliminary Results, Leg M43/1, Rock Sampling and Description. In DECOS/OMEX II, Cruise No. 43; METEOR-Berichte: Hamburg, Germany, 2000. [Google Scholar]
  90. van den Bogaard, P. The origin of the Canary Island Seamount Province-New ages of old seamounts. Sci. Rep. 2013, 3, 2107. [Google Scholar] [CrossRef] [PubMed]
  91. Hannington, M.D.; Petersen, S.; Santana-Casiano, M.; Fraile-Nuez, E.; Klischies, M.; Lange, S.; Hissman, K.; Schauer, J.; Striewski, P.; Anderson, M.O.; et al. POS-494 Leg 2 Cruise Report: Assessment of Ongoing Magmatic-Hydrothermal Discharge of the El Hierro Submarine Volcano, Canary Islands by the Submersible JAGO; RV POSEIDON. GEOMAR Helmholtz Centre for Ocean Research Kiel, Instituto de Oceanografia y Cambio Global, Instituto Español de Oceanografía: Kiel, Germany, 2016; p. 88. [Google Scholar] [CrossRef]
  92. Donoghue, E.; Troll, V.R.; Harris, C.; O’Halloran, A.; Walter, T.R.; Torrado, F.J.P. Low-temperature hydrothermal alteration of intra-caldera tuffs, Miocene Tejeda caldera, Gran Canaria, Canary Islands. J. Volcanol. Geotherm. Res. 2008, 176, 551–564. [Google Scholar] [CrossRef]
  93. González, F.J.; Rincón-Tomás, B.; Somoza, L.; Hein, J.R.; Medialdea, T.; Madureira, P.; Reyes, J.; Hoppert, M.; Reitner, J. Fe-rich mineralized microbes from hydrothermal vents at Tagoro submarine volcano, El Hierro Island (central east Atlantic). In Proceedings of the 113th Annual GSA Cordilleran Section Meeting-2017, Honolulu, HI, USA, 23–25 May 2017. [Google Scholar]
  94. Somoza, L.; González, F.J.; Barker, S.J.; Madureira, P.; Medialdea, T.; de Ignacio, C.; Lourenço, N.; León, R.; Vázquez, J.T.; Palomino, D. Evolution of submarine eruptive activity during the 2011-2012 El Hierro event as documented by hydroacoustic images and remotely operated vehicle observations. Geochem. Geophys. Geosyst. 2017, 18, 3109–3137. [Google Scholar] [CrossRef]
  95. Muiños, S.B.; Hein, J.R.; Frank, M.; Monteiro, J.H.; Gaspar, L.; Conrad, T.; Pereira, H.G.; Abrantes, F. Deep-sea Fe-Mn Crusts from the Northeast Atlantic Ocean: Composition and Resource Considerations. Mar. Georesour. Geotechnol. 2013, 31, 40–70. [Google Scholar] [CrossRef]
  96. Brandt, P.; Hormann, V.; Körtzinger, A.; Visbeck, M.; Krahmann, G.; Stramma, L.; Lumpkin, R.; Schmid, C. Changes in the Ventilation of the Oxygen Minimum Zone of the Tropical North Atlantic. J. Phys. Oceanogr. 2010, 40, 1784–1801. [Google Scholar] [CrossRef]
  97. Brandt, P.; Greatbatch, R.J.; Claus, M.; Didwischus, S.-H.; Hormann, V.; Funk, A.; Hahn, J.; Krahmann, G.; Fischer, J.; Körtzinger, A. Ventilation of the equatorial Atlantic by the equatorial deep jets. J. Geophys. Res. Ocean. 2012, 117, C12. [Google Scholar] [CrossRef]
  98. Eltayeb, M.A.H.; Injuk, J.; Maenhaut, W.; van Grieken, R.E. Elemental Composition of mineral aerosol generated from Sudan Sahara Sand. J. Atmos. Chem. 2001, 40, 247–273. [Google Scholar] [CrossRef]
  99. Muhs, D.R.; Budahn, J.; Skipp, G.; Prospero, J.M.; Patterson, D.; DeAnna Patterson, E. Geochemical and mineralogical evidence for Sahara and Sahel dust additions to quaternary soils on Lanzarote, eastern Canary Islands, Spain. Terra Nov. 2010, 22, 399–410. [Google Scholar] [CrossRef]
  100. Koschinsky, A.; Halbach, P.; Hein, J.R.; Mangini, A. Ferromanganese crusts as indicators for paleoceanographic events in the NE Atlantic. Geol. Rundsch. 1996, 85, 567–576. [Google Scholar] [CrossRef]
  101. Usui, A.; Nishi, K.; Sato, H.; Nakasato, Y.; Thornton, B.; Kashiwabara, T.; Tokumaru, A.; Sakaguchi, A.; Yamaoka, K.; Kato, S.; et al. Continuous growth of hydrogenetic ferromanganese crusts since 17 Myr ago on Takuyo-Daigo Seamount, NW Pacific, at water depths of 800–5500 m. Ore Geol. Rev. 2017, 87, 71–87. [Google Scholar] [CrossRef]
  102. Schlitzer, R.; Anderson, R.F.; Dodas, E.M.; Lohan, M.; Geibert, W.; Tagliabue, A.; Bowie, A.; Jeandel, C.; Maldonado, M.T.; Landing, W.M.; et al. The GEOTRACES Intermediate Data Product 2017. Chem. Geol. 2018, 493, 210–223. [Google Scholar] [CrossRef]
  103. Grousset, F.E.; Parra, M.; Bory, A.; Martinez, P.; Bertrand, P.; Shimmield, G.; Ellam, R.M. Saharan wind regimes traced by the Sr-Nd isotopic composition of subtropical Atlantic sediments: Last glacial maximumvs today. Quat. Sci. Rev. 1998, 17, 395–409. [Google Scholar] [CrossRef]
  104. Grousset, F.E.; Biscaye, P.E. Tracing dust sources and transport patterns using Sr, Nd and Pb isotopes. Chem. Geol. 2005, 222, 149–167. [Google Scholar] [CrossRef]
  105. Blum, N.; Halbach, P.; Münch, U. Geochemistry and mineralogy of alkali basalts from Tropic Seamount, Central Atlantic Ocean. Mar. Geol. 1996, 136, 1–19. [Google Scholar] [CrossRef]
  106. Presentación Parcial de Datos e Información Sobre los Límites de la Plataforma Continental de España al Oeste de las Islas Canarias, Conforme a la Parte VI y el Anexo II de la Convención de las Naciones Unidas Sobre el Derecho del Mar; Instituto Geológico y Minero de España (IGME): Madrid, Spain, 2015; Volume 5.
  107. Mehegan, J.M.; Robinson, P.T.; Delaney, J.R. Secondary Mineralization and Hydrothermal Alteration in the Reydarfjordur Drill Core, Eastern Iceland. J. Geophys. Res. Solid Earth 1982, 87, 6511–6524. [Google Scholar] [CrossRef]
  108. Dekov, V.M.; Savelli, C. Hydrothermal activity in the SE Tyrrhenian Sea: An overview of 30 years of research. Mar. Geol. 2004, 204, 161–185. [Google Scholar] [CrossRef]
  109. Bau, M. Controls on the fractionation of isovalent trace elements in magmatic and aqueous systems: Evidence from Y/Ho, Zr/Hf, and lanthanide tetrad effect. Contrib. Mineral. Petrol. 1996, 123, 323–333. [Google Scholar] [CrossRef]
  110. Marino, E.; González, F.J.; Somoza, L.; Medialdea, T.; Lunar, R. Hydrothermal input on the formation of Fe-Mn crusts from Canary Islands Seamount Province: Geochemical and Fe isotopic studies. In preparation.
  111. Dubinin, A.V.; Uspenskaya, T.Y.; Gavrilenko, G.M.; Rashidov, V.A. Geochemistry and genesis of Fe-Mn mineralization in island arcs in the west Pacific Ocean. Geochem. Int. 2008, 46, 1206–1227. [Google Scholar] [CrossRef]
  112. Koschinsky, A.; Heinrich, L.; Boehnke, K.; Cohrs, J.C.; Markus, T.; Shani, M.; Singh, P.; Stegen, K.S.; Werner, W. Deep-sea mining: Interdisciplinary research on potential environmental, legal, economic, and societal implications. Integr. Environ. Assess. Manag. 2018, 14, 672–691. [Google Scholar] [CrossRef] [PubMed]
  113. Agarwal, J.C.; Wilder, T. Recovery of Metal Values from Manganese Nodules. US Patent 3788841A, 1 January 1974. [Google Scholar]
  114. Agarwal, J.C.; Beecher, N.; Davies, D.S.; Hubred, G.L.; Kakaria, V.K.; Kust, R.N. Processing of ocean nodules: A technical and economic review. JOM 1976, 28, 24–31. [Google Scholar] [CrossRef]
  115. Han, K.N.; Fuerstenau, D.W. Acid leaching of ocean manganese nodules at elevated temperatures. Int. J. Miner. Process. 1975, 2, 163–171. [Google Scholar] [CrossRef]
  116. Acharya, S.; Anand, S.; Das, S.C.; Das, R.P.; Jena, P.K. Ammonia leaching of ocean nodules using various reductants. Erzmetall 1989, 42, 66–73. [Google Scholar]
  117. Mishra, D.; Srivastava, R.R.; Sahu, K.K.; Singh, T.B.; Jana, R.K. Leaching of roast-reduced manganese nodules in NH3–(NH4)2CO3 medium. Hydrometallurgy 2011, 109, 215–220. [Google Scholar] [CrossRef]
  118. Gamaletsos, P.N.; Godelitsas, A.; Filippidis, A.; Pontikes, Y. The Rare Earth Elements Potential of Greek Bauxite Active Mines in the Light of a Sustainable REE Demand. J. Sustain. Metall. 2018, 5, 20–47. [Google Scholar] [CrossRef]
  119. Kanungo, S.B.; Jena, P.K. Reduction leaching of manganese nodules of Indian Ocean origin in dilute hydrochloric acid. Hydrometallurgy 1988, 21, 41–58. [Google Scholar] [CrossRef]
  120. Sridhar, R.; Jones, W.E.; Warner, J.S. Extraction of copper, nickel and cobalt from sea nodules. JOM 1976, 28, 32–37. [Google Scholar] [CrossRef]
  121. Mohwinkel, D.; Kleint, C.; Koschinsky, A. Phase associations and potential selective extraction methods for selected high-tech metals from ferromanganese nodules and crusts with siderophores. Appl. Geochem. 2014, 43, 13–21. [Google Scholar] [CrossRef]
  122. Spickermann, R. Rare Earth Content of Manganese Nodules in the Lockheed Martin Clarion-Clipperton Zone Exploration Areas. In Proceedings of the Offshore Technology Conference, Houston, TX, USA, 30 April–3 May 2012. [Google Scholar]
  123. Papavasileiou, K. Near future REE resources for Europe-The new frontier of Marine exploration, mining and processing. In Proceedings of the 1st European Rare Earth Resources Conference, At Milos, Greece, 4–7 September 2014; pp. 410–427. [Google Scholar]
  124. Lugovskaya, I.G.; Dubinchuk, V.T.; Baturin, G.N. Composition of technological sample of ferromanganese crusts from seamounts and products of its processing. Lithol. Miner. Resour. 2007, 42, 515–522. [Google Scholar] [CrossRef]
  125. Manceau, A.; Drits, V.A.; Silvester, E.; Bartoli, C.; Lanson, B. Structural mechanism of Co2+oxidation by the phyllomanganate buserite. Am. Mineral. 1997, 82, 1150–1175. [Google Scholar] [CrossRef]
  126. Manceau, A.; Lanson, B.; Drits, V.A. Structure of heavy metal sorbed birnessite. Part III: Results from powder and polarized EXAFS spectroscopy. Geochim. Cosmochim. Acta 2002, 66, 2639–2663. [Google Scholar] [CrossRef]
  127. Manceau, A.; Gorshkov, A.I.; Drits, V.A. Structural chemistry of Mn, Fe, Co, and Ni in manganese hydrous oxides: Part II. Information from EXAFS spectroscopy and electron and X-ray diffraction. Am. Mineral. 1992, 77, 1144–1157. [Google Scholar]
  128. Kashiwabara, T.; Takahashi, Y.; Tanimizu, M. A XAFS study on the mechanism of isotopic fractionation of molybdenum during its adsorption on ferromanganese oxides. Geochem. J. 2009, 43, e31–e36. [Google Scholar] [CrossRef] [Green Version]
  129. Kashiwabara, T.; Takahashi, Y.; Marcus, M.A.; Uruga, T.; Tanida, H.; Terada, Y.; Usui, A. Tungsten species in natural ferromanganese oxides related to its different behavior from molybdenum in oxic ocean. Geochim. Cosmochim. Acta 2013, 106, 364–378. [Google Scholar] [CrossRef]
  130. Sahu, K.K.; Agarwal, S.; Mishra, D.; Agrawal, A.; Randhawa, N.S.; Godiwalla, K.M.; Jana, R.K. Nickel, Cobalt and Copper Recovery from Sea Nodules by Direct Smelting Process. In Ni-Co 2013; Springer International Publishing: Cham, Switzerland, 2013; pp. 291–298. [Google Scholar]
  131. Balintova, M.; Petrilakova, A. Study of pH Influence on Selective Precipitation of Heavy Metals from Acid Mine Drainage. Chem. Eng. Trans. 2011, 25, 345–350. [Google Scholar]
  132. González, F.J. Nódulos y Costras de Hierro-Manganeso en el Golfo de Cádiz y la Antártida: Génesis e Implicaciones Paleoceanográficas; Publicaciones del Instituto Geológico y Minero de España: Madrid, Spain, 2008. [Google Scholar]
Figure 1. (A) regional setting of the Canary Islands Seamounts Province (CISP). General view of the study area where the Canary archipelago and the most important seamounts of the southwest area of CISP with their associated mineral deposits are displayed (Map from GeoERA-MINDeSEA project [50]); (B) 3D view of the studied seamounts and location of the sampling site.
Minerals 09 00439 g001
Figure 2. Image of selected Fe-Mn crust samples for this study. (A) Crust DR02-10 was dredged from Echo Sm., (B) crust DR07-9 from The Paps Sm., (C) DR16-14 and (D) 107-11H from Tropic Sm. Red discontinuous squares mark the areas where thin sections were taken for further investigations (Figure 4).
Minerals 09 00439 g002
Figure 3. Microphotographs of the studied thin sections. (A) DR02-10, variation from dendritic to dense parallel textures and the presence of bright laminae of todorokite (Tod); (B) DR07-9, dendritic structure crowned by several bright laminae with fibrous minerals of asbolane (Asb) and buserite (Bus); (C,D) DR16-14, dense parallel and columnar textures essentially composed by vernadite (Ver); (E) 107-11H, contact between altered substrate (right) and Fe-Mn crust (left) with the presence of goethite (Gth) and carbonate-fluorapatite (CFA); (F) 107-11H, pervasive oxidation and phosphatization of the substrate rock with residual magnetite/ilmenite (Mag/Ilm) crystals.
Minerals 09 00439 g003
Figure 4. (AD) X-Ray Diffraction (XRD) analysis of bulk samples. In samples DR02-10, DR07-9 and DR16-14 is possible recognize Fe-oxyhydroxides represented by goethite group (Gth) minerals and Mn-oxides essentially Fe-vernadite (Ver) and birnessite (Bir). (A,B) In samples DR02-10 and DR07-9, it is also possible to recognize ~10Å reflection due to the presence of todorokite (Tod), asbolane (Asb) or buserite (Bus). Calcite (Cal) have been detected in DR02-10, and quartz (Qtz) shows its peaks in both samples. (D) Sample 107-11H, on the other hand, shows the abundance of Carbonate-fluorapatite (CFA), goethite (Gth), hematite (Hem), Qtz, feldspars (Fsp), montmorillonite (Mnt) and magnetite (Mag)/ilmenite (Ilm).
Minerals 09 00439 g004
Figure 5. (AC) micro-XRD analyses (left) on polished cross thin sections (right) in transect from 0 to 24 mm are shown. In all samples, the different reflections belong to Fe and Mn oxyhydroxides (Fe-vernadite, birnessite and goethite); (B) in spots 3 and 5 of sample DR07-9, the reflections belong to asbolane/buserite. Circles in the figure are interesting areas analyzed with Raman, FT-IR and EPMA. Spectra 1, 2, 4, 6, 9, 10, 11, 13, 16 in B and spectrum 1 in C have been avoided due to their similarity with those chosen in the figure.
Minerals 09 00439 g005
Figure 6. (A,B) optical microscope image of areas belonging to the analyzed regions of the sample. Micro-XRD cross analysis made on crust DR07-9 in the selected from the top to 24 mm, d-spacing (C,D) 12–8 Å and 5.3–3.9 Å, in which it is possible to recognize the (001) and (002) reflection of asbolane/buserite in Sections 2–3 and 2–5; (E) 3.7–3 Å, Qtz and Fsp reflections; (F,G) 2.65–2.3 Å and 1.49–1.4 Å in which the reflections of vernadite/birnessite fall.
Minerals 09 00439 g006
Figure 7. (AF) micro-Raman spectra in different spot analysis made on studied samples; (A) typical peak at 650 cm−1 of 10Å todorokite and (B) 612 cm−1 peak of vernadite partially masked by peaks of birnessite at 480, 500 and 660 cm−1; (C) 480 and 660 cm−1 peaks of birnessite and 550 and 612 cm−1 peaks of vernadite; (D) 500, 604 and 677 cm−1 peaks of asbolane overlapping with vernadite and birnessite; (E,F) 480, 660 cm−1 and 550 and 612 cm−1 peaks belonging to birnessite and vernadite.
Minerals 09 00439 g007
Figure 8. (AE) FT-IR spectra of different Fe-Mn oxyhydroxides laminae of the studied samples. (A) general spectra for a hydrogenetic crust with the main absorptions of OH, O–H 3250 cm−1, C–O and C–H bands 2900, 2350 and 1560 cm−1 and hydrogenetic minerals in the range between 1400 and 650 cm−1; (BE) absorption bands of the interesting Mn-oxides and related minerals; (B) marked in red absorption bands of the CO32− (872 and 1407 cm−1) related to the Ca-rich lamina in DR02-10 and the presence of foraminiphera (Figure 3A) and Mn minerals band 1050 cm−1; (C) marked in black diagenetic Mn-oxides enriched in Ca (CO32− 872, 1407 cm−1); (D) diagenetic Mn-oxides with their typical absorption at 1600, 1100 and 770 cm−1; (E) marked in blue hydrogenetic Mn-oxides with their typical absorption at 1010–850 and 680 cm−1.
Minerals 09 00439 g008
Figure 9. (A) PAAS [74] normalized REY of bulk (continuous lines) and spot LA-ICP-MS analysis (colored regions). (B,C) binary diagram REYs CeSN/CeSN* ratio compared with Nd and YSN/HoSN ratio [3] to differentiate genetic processes for bulk (stars) and spot analyses.
Minerals 09 00439 g009
Figure 10. (AD) EPMA backscattered images of this study Fe-Mn crusts. Several different laminae have been identified and analyzed with EPMA spots analyses (yellow squares) and LA-ICP-MS (discontinuous green lines). Red spots are referred to Raman and FT-IR analyses on samples in Figure 6.
Minerals 09 00439 g010
Figure 11. (AD) EPMA images of crust 107-11H. (A) altered feldspars with hydrothermal rim and new formation of goethite and carbonate-fluorapatite (CFA) minerals in the substrate. (B,C) formation of hydrothermal Fe and Ti rich oxyhydroxides in the contact with the substrate rock; (D) hydrogenetic Fe-Mn layer intercalated with a continuous Fe rich lamina. EPMA spots’ analyses (yellow squares), FT-IR (red spot) and LA-ICP-MS (discontinuous green lines) have been marked.
Minerals 09 00439 g011
Figure 12. (A) EPMA spots analysis plotted in the ternary diagram from [27] to differentiate genetic processes of the Fe-Mn oxides, light grey field hydrogenetic, medium grey hydrothermal and dark grey diagenetic, modified according [6,33], discontinuous red lines, to better differentiate the genetic fields; (B) the same EPMA analysis plotted in the binary diagram according [28] to differentiate diagenetic or suboxic diagenetic fields.
Minerals 09 00439 g012
Figure 13. Several binary diagrams of the High Field Strength Elements (HFSE) according to [31] in which have been plotted LA-ICP-MS analysis of the selected samples. Hydrogenetic (blue) and diagenetic (orange) fields have been evidenced; the hydrothermal field is indicated in every diagram.
Minerals 09 00439 g013
Figure 14. (A) REY/PAAS normalized patterns of spot analyses made with LA-ICP-MS on crust 107-11H. In the diagram, it is possible to see the hydrothermal influence in the Fe-Mn oxyhydroxides; (B) ternary diagram from [31] in which have been plotted the spot LA-ICP-MS analyses to differentiate the genetic processes that take place in CISP Fe-Mn crusts and the plot of one sample of Fe-oxyhydroxides obtained from the the eruption of the Tagoro volcano on El Hierro Island.
Minerals 09 00439 g014
Table 1. Sample localization in the seamount, water depth and Fe-Mn crust thickness.
SampleSeamountSample LocalizationLatitudeLongitudeWater Depth (m)Fe-Mn Crust Thickness (mm)
DR02-10EchoNorth flank25°29,62′ N19°23,47′ W189038
DR07-9The PapsWest flank25°57,18′ N20°21,73′ W186090
DR16-14TropicEast flank23°52,91′ N20°37,07′ W1719140
107-11HTropicWest flank23°54,70′ N20°46,73′ W17165
Table 2. X-Ray Diffraction (XRD) mineralogy of crystalline and low crystalline phases from CISP selected crusts. Major > 25%; Moderate < 25%, >10%; Minor < 10% based in XRD and geochemistry of studied crusts.
CrustMajor ModerateMinor
DR02-10δ-MnO2 Goethite10Å Mn-Ox., Quartz, Feldspar
DR07-9δ-MnO2Goethite10Å Mn–Ox., Quartz, carbonate-fluorapatite (CFA), Feldspar, phyllosilicates
DR16-14δ-MnO2Goethite
107-11HCFAGoethite, Hematite, Quartz, Magnetite, Ilmeniteδ-MnO2, smectite
Table 3. Elemental content of selected bulk samples from CISP normalized to 0% H2O. LOI = Loss on Ignition, D.L. = detection limit.
ElementDR02-10DR07-9DR16-14107-11H
Fe (wt. %)26.421.927.238.1
Mn17.515.620.61.44
Ti0.960.811.180.20
Si 5.139.702.631.87
Al1.993.291.640.71
Ca2.342.563.3010,2
K0.420.810.350.21
Mg1.502.201.540.40
P0.570.560.603.99
Na1.631.501.630.40
LOI22.920.723.912.3
Mn/Fe0.670.720.750.04
Co (µg/g)435544168347497
Ni248344302481398
V11878781266319
Cu5951016463178
Mo45338164852
Zn613683649187
Pb187414201868193
Te4238645
Tl6812113014
Ba165813281998139
As439352489146
Se3728407
Cd2.22.31.9<D.L. (0.7)
Sb59598912
Cr26543035
Be1411124
Th5448815
U1613124
Y217164179115
La34225342670
Ce171713432230154
Pr73569710
Nd30523239244
Sm6348798.5
Eu15.211.818.82.1
Gd73558312
Tb10.57.911.71.6
Dy63476611
Ho12.3912.22.7
Er3525338.2
Tm4.93.54.61.2
Yb3122288.2
Lu4.83.44.11.3
Table 4. Average chemical composition in wt. % obtained with EPMA of each studied crust, the number of analysis is indicated. Min = minimum, Max = maximum, ±2σ = 95% confidence.
ElementDR02-10
n = 136
DR07-9
n = 256
DR16-14
n = 364
107-11H
n = 184
MeanMin.Max.± 2σMeanMin.Max.± 2σMeanMin.Max± 2σMeanMinMax.±2σ
Mn211.11461.1324.60.35491.28170.10280.70170.01381.21
Fe210.44471.5819.50.37501.38250.16530.88284.27591.47
Si1.890.287.490.131.960.01230.311.790.1110.50.111.590.093.380.08
Al1.140.393.060.051.470.024.560.090.760.004.80.051.450.123.970.09
Ca3.020.50170.441.870.072.920.082.120.005.430.092.440.23300.38
K0.220.061.010.040.240.012.040.040.150.011.740.020.110.000.560.01
Na0.550.181.460.060.350.021.220.030.210.000.640.010.220.010.400.01
Mg1.561.143.030.061.910.066.190.151.150.002.320.021.580.126.340.12
P0.140.000.250.010.170.000.300.010.140.000.380.010.280.023.300.04
Ti0.530.001.130.040.430.001.010.450.550.001.350.020.880.056.100.09
Co0.440.000.840.030.510.001.680.040.640.001.360.030.640.001.600.05
Ni0.310.031.110.031.080.005.490.170.210.000.500.010.360.002.310.05
Cu0.070.000.440.010.250.001.100.030.050.000.270.000.130.000.560.01
V0.120.010.210.010.110.010.480.010.150.000.320.010.150.010.320.01
S0.270.020.650.020.120.000.270.010.160.000.420.010.200.010.400.01
Cl0.220.020.670.020.090.000.590.010.130.011.250.010.070.000.440.01
Mo0.040.000.080.000.040.000.080.000.050.000.120.000.030.000.070.00
Ba0.190.000.300.010.200.015.730.060.210.000.340.010.210.000.840.01
Ce0.180.000.310.010.180.000.330.010.230.010.430.010.190.000.390.01
Table 5. LA-ICP-MS data obtained in the different laminae analyzed and divided by genetic process type. Values are expressed in µg/g for all elements but majors (Al, Ca, Mn and Fe) expressed in wt. %. <D.L. below detection limit.
ElementLiAlCaMnFeMn/FeCoNiCuZnAsNbMoTeYCeΣREY
Low Reflectivity Laminae
DR02-10Mean29.70.72.916200.85405625245215186491683856920215502369
Min.21.50.52.012160.422250206015437345362261521698931743
Max.53.91.04.018281.085730311084563574741148510323823403040
± 2σ11.90.20.7240.221232359223102101135761824589482
DR07-9Mean14.40.72.420230.976151382713411076631677425813617712738
Min.8.10.61.917140.60339026608475484934744219713602240
Max.39.80.93.027311.8710,3005910216016908788210109126922203197
± 2σ5.90.10.2230.251255619231255748941931186226
DR16-14Mean<D.L.0.42.618210.8866952090389647623745558622518683445
Min.<D.L.0.32.114180.6759601460357550556634906519816002931
Max.<D.L.0.43.021241.0975602690433837688875979525320603790
± 2σ<D.L.0.00.3330.20645533351325310451425210404
107-11HMean63.31.22.623231.0313,58353901717144381519759216120727273868
Min.16.60.91.617180.68838042801450119067612140310514719402747
Max.1021.43.430351.5217,700708022301830117023487020825435804888
± 2σ21.90.20.6440.212305772252158123311252432489606
High Reflectivity Fibrous Laminae
DR02-10Mean6.600.411.134079.802236528208812481975743171973
Min.292.0.37.032046.9317754701340442144457291158
Max.913.0.618.2361106.9630979202790221023106995272595
± 2σ209.20.14.42019.2956975518655328416513
DR07-9Mean197.0.51.442163.5013062793311256260342449211570158
Min..800.10.720019.70438683049601080171243052262
Max.287.1.42.7632152.382350600002100054808410755350192270
± 2σ65.50.40.513034.9657316328445111681721701124561
High Reflectivity Poor Fibrous Laminae
DR07-9Mean197.11.21.23959.32567934,03872581917188174291033201369
Min.71.70.80.93032.64208013,500515083490722701384151
Max.408.02.01.7641215.031550065,100126003340358376321656273496
± 2σ72.00.30.2823.02344612,160177863367695494375
Fe-Rich Laminae
DR16-14Mean<D.L.0.80.61340.0370830465011251108916439118297696
Min.<D.L.0.70.50310.0124219456010001060784130104208635
Max.<D.L.1.00.71370.04951414749123011601049452127351775
± 2σ<D.L.0.10.1030.013268987994914239116570
107-11HMean28.71.11.05390.13110316241144657120930015719616314692192
Min.9.60.90.51310.022703757775389332162614177476728
Max.51.01.41.310510.31185039401800815157047225424519219902843
± 2σ17.80.20.3360.1056412193479920391783843532755
Near Substrate Rock Fe-Rich Laminae
107-11HMean6.11.20.51390.02191366103390415082934313885467749
Min.4.01.20.40330.01712015615711190252166575127347
Max.7.61.30.62430.0545771012601330190033593180958371173
± 2σ1.70.10.1140.021752323133642904436509286334
Altered Substrate Rock
107-11HMean3.80.51.10260.00381854272254406015174422131
Min.3.20.20.30170.001112214497121128320651
Max.4.51.21.90310.0168274991495113017019536268209
± 2σ1.00.40.7060.00296637417945673523193070
Table 6. Recovery rate of the most valuable metals of the studied samples. Values marked in bold refer to too high or too low values obtained.
BULK
Mn (%)FeCo (μg/g)Ni Cu VMoYLaCe
DR02-1018264355248359511874532173421717
DR07-916224416443010168783811642531343
DR16-1421278347248146312666481794262230
Hydrometallurgical Method
DR02-1014154720210044310052851922711483
DR07-9121137082330685512981181761056
DR16-1417155213173223010442711593341709
Recovery Rate ±10 (%)
DR02-10815810885748563887986
DR07-975498453685826727079
DR16-1481576370508342897877

