Re Sulfides from Zhelos and Tokty-Oi Intrusions (East Sayan, Russia)


1
A.P. Vinogradov Institute of Geochemisry Siberian Branch of Russian Academy of Science, 664033 Irkutsk, Russia
2
Geological Institute Siberian Branch of Russian Academy of Science, 670047 Ulan-Ude, Russia
*
Author to whom correspondence should be addressed.
Minerals 2019, 9(8), 479; https://doi.org/10.3390/min9080479
Submission received: 1 July 2019
/
Revised: 5 August 2019
/
Accepted: 6 August 2019
/
Published: 7 August 2019
(This article belongs to the Special Issue Sulfide Geochemistry)
Abstract
:Re sulfides were discovered in Cu–Ni–platinum-group elements (PGE) ores of the Zhelos and Tokty-Oi intrusions. These intrusions can be considered as products of the mantle superplume responsible for Rodinia’s break-up. The mineral compositions were determined in situ in polished samples. Electron microprobe analyses were mostly consistent with a general formula of (Cu,Fe,Mo,Os,Re)5S8, (Cu,Fe,Mo,Os,Re)4S7, and (Cu,Fe,Mo,Re)S2. One of the major features of Re sulfide from the Zhelos intrusion is its high osmium content. The ΣMe/S ratio for a part of our data is consistent with that of the tarkianite. Re sulfides from the Tokty-Oi have a ΣMe/S ratio similar to those in rheniite or dzeskazganite, but differ from them by the presence of Fe and Cu and the metal-to-metal ratio. The localization of the Re sulfide within the chalcopyrite suggests its crystallization from the residual Cu-rich liquid.
1. Introduction
Rhenium is one of the rarest and most scattered elements; its average content in the Earth’s crust is ~0.7 ppb, in the primitive mantle −0.28 ppb. Strong Re enrichments are characteristic of marine sediments, due to their removal from sea water under anoxic conditions [1]. The content of rhenium in mafic and ultramafic rocks is characterized by a significant dispersion and changes in the range of 0.1–2 ppb [2], while the associated Ni–Cu (±PGE) ores are characterized by a high Re content (up to 286 ppb).
Individual rhenium minerals in nature are extremely rare. Due to their chalcophile properties, these occur in sulfides and selenides. A detailed history of the discovery of rhenium minerals is presented in [3,4]. The first rhenium mineral was discovered in copper-lead ores of the Dzheskazgan Deposit (Kazakhstan) in 1962 [5]. Since then, each discovery of rhenium minerals is considered unique and worthy of being discussed [6,7,8,9,10,11,12,13,14,15,16,17].
All known natural phases enriched in rhenium can be divided into three types: (1) rhenium disulfide—reniite [12,13,16], with a content of Re ~74 wt.%; (2) Re–Mo–Cu sulfides, with different stoichiometric ratios [3,6,7,8,9,10,11,15], containing ~46–60 wt.% Re; and (3) molybdenite, with a high content of rhenium ranging from 1–5 to 46 wt.% [17,18].
This study provides data on the composition of Re sulfides, which, in addition to Mo and Co, contain as much as 5 wt. % Os.
2. Materials and Methods
In this research, we studied the original core samples of rocks and ores selected from boreholes.
The composition of sulfides and minerals of platinum group and rhenium was determined in situ in polished samples. Previously, the samples were studied by scanning LEO1430VP (Carl Zeiss, Oberkochen, Germany) electron microscope with INCAEnergy 350 (Oxford instruments, Abingdon, UK) analitical system (Ulan-Ude). Then, polished samples were analyzed on a JEOL JXA8200 SuperProbe (GEOL, Tokyo, Japan), a high-resolution SEM and WD/ED combined Electron Prob Microanalyzer, equipped with 5 wavelength dispersive X-ray spectrometer, and an energy dispersive X-ray spectrometer with a 133 eV lithium drift type silicon semiconductor detector (Common Use Center of Isotope and Geochemical Studies in Vinogradov Institute of Geochemistry, Irkutsk). Elements were determined by their characteristic X-ray wavelengths on wave-dispersion spectrometers, at the following operation conditions: accelerating voltage 20 kV, beam current 20 nA, beam diameter 1 μm, count time 10 s along peak line plus 5 s for background on both sides of the peak line. The proprietary software was used for data processing. X-ray Kα lines were used to measure S, Fe, Ni, and Cu; Lα lines for Ir, Ru, Rh, Pt, Pd, and As; Lβ lines for Mo; and Mα lines for Os and Re. Metrological characteristics of the technique were determined on control samples of known composition.
3. Results
3.1. Geological Background
The Zhelos and Tokty-Oi Intrusions located in the central part of the Eastern Sayan (South Siberia, Russia). Ultramafic intrusions are widespread in this region. These intrusions are thought to be produced by the mantle superplume responsible for Rodinia’s break-up [19]. Ultramafite rocks are lens- and arc-shaped bodies (Figure 1), with a visible width of 20 to 700 m and a length of 0.1 to 7 km, divided into separate blocks by series of faults. Intrusions, which previously represented dike-like and sill-like bodies, together with the host rocks of the volcanogenic-sedimentary complex, were involved in folding and underwent metamorphic transformations [20]. Host rocks are various gneisses, marbles, and orthoamphibolites. Contacts with host rocks are mostly obscured by plicative deformations.
The Zhelos and Tokty-Oi intrusions are differentiated bodies, composed of rocks varying from dunites to lherzolite and characterized by gradual transitions between species. Rocks of both intrusions have a composition, with major oxides ranging within (wt. %): SiO2 38–46, TiO2 0.08–0.9, Al2O3 1–8, MgO 25–49, CaO 0.4–12. The composition of the initial melt was close to picritic [19].
In both intrusions, there are four types of sulfide ores: (1) disseminated with a sulfide content of 5–15 vol. %; (2) net-textured (15–30 vol. % sulfides); (3) massive with sulfide content of up to 80 vol. %; and (4) vein disseminated and massive in the host rocks [20]. The rhenium sulfide was found in the Zhelos intrusion in disseminated sulfide ores, and in the Tokty-Oi intrusion in vein disseminated ores.
The highest Re content (up to 480 ppb) is typical for vein disseminated and massive ores, while the total content of the PGE varies from 2 to 12 ppm. In the net-textured and massive ores of the Zhelos intrusion the content of Re is 280 ppb, total PGE contents up to 15 ppm, with a ratio Pd/Pt = 3–8. In the disseminated ores of the Zhelos intrusion the content of Re is 200–350 ppb, total PGE contents 1–7 ppm. In the Tokty-Oi intrusion, disseminated ores are characterized by a content of Re 150–450 ppb, the total PGE being 1.6–3.3 ppm.
3.2. Composition of Sulfide Ores
The most common sulfide assemblage is pyrrhotite (troilite) + pentlandite ± chalcopyrite in both intrusions. The vein ores in the host amphibolites are composed of pyrrhotite or chalcopyrite. Troilite forms thin lamellae in hexagonal pyrrhotite and anhedral polycrystalline aggregates. Monoclinic pyrrhotite is present only in vein ores. Chalcopyrite and pentlandite occur mostly as anhedral polycrystalline aggregates, and pentlandite is present as exsolved flames in pyrrhotite. Pentlandite lamellae and flames are common in chalcopyrite, and mackinawite "worms" are ubiquitous in pentlandite. Cobaltite–gersdorfite are common in all types of ores. Most of the PGM identified are sperrylite, palladium bismuthotelluride phases, irarsite, osarsite, and omeiite [20].
Pyrrhotites from the Tokty-Oi intrusion are characterized by a generally higher Ni content (up to 1.5 wt. %). The Fe/Ni atomic ratio in pentlandite ranges from 1.4 to 0.7. In pentlandite from sulfide ores of the Zhelos intrusion, the value of the Fe/Ni ratio is higher than that of the Tokty-Oi intrusion. Pentlandite from vein ores of the Tokty-Oi intrusion and in all ore types of the Zhelos intrusion has a high cobalt content up to 2 wt. %. The compositions of pentlandite and iron monosulfides are in good agreement with each other. Pentlandite with a ratio of Fe/Ni > 1.2 is associated with troilite, whereas pentlandite with Fe/Ni ~0.7 is associated with pyrrhotite. The composition of chalcopyrite is generally stoichiometric.
3.3. Samples with Re Sulfide
The analytical results are presented in Table 1 and Table 2. Rhenium sulfide was found in two samples. Sample 09-6 is an ultramafiс rock from the Zhelos intrusion with disseminated sulfides. In the sample, sulfides are presented by aggregates of troilite, pentlandite, pyrrotite, and chalcopyrite (Figure 2a,b). Magnetite occurs as veins crosscutting pentlandite grains and is located on the border of pentlandite and troilite grains (Figure 2a). Pentlandite (Fe4.83–5.09Ni4.31–4.05Co0.10–0.12S8, Figure 3b, point 1–3) sometimes contains numerous worm-like grains of mackinawite (Fe0.83–0.75Ni0.28–0.18Co0.02Cu0.01–0.02S, Figure 2b, point 4–6). Pentlandite contains up to 1 wt. % Co, the value of Fe/Ni ratio is 1.22–1.44 (Figure 2a, point 3–5). Re sulfide is hosted by chalcopyrite that also contains pentlandite lamellae (Figure 3a,b). The composition of chalcopyrite is characterized by a very small deviation from the stoichiometry in the direction of increasing Fe and the presence of 0.82 wt. % Ni. The chalcopyrite formula is consistent with Fe1.02Cu0.94Ni0.04S2. Pentlandite in "lamellae" contains 1.5 wt. % Co, and the value of the Fe/Ni ratio is 1.12–1.15. Platinum group minerals in this sample are represented by michenerite, zonal grain of hollingworthite–irarsite and sobolevskite. All minerals are localized in the marginal parts of chalcopyrite.
Sample 06-2 is vein chalcopyrite ore with a small amount of pentlandite in the amphibolite. Chalcopyrite occurs as anhedral patches (Figure 2c,d). In the marginal parts, it is replaced by limonite. Pentlandite mainly occurs as small grains associated with chalcopyrite. In this sample, Pyrrhotite is absent. The composition of chalcopyrite corresponds to the formula Fe1.02Cu0.98S2. Pentlandite contains 1.97 wt. % Co and is characterized by a Fe/Ni ratio of 0.77. The pentlandite formula is Fe3.82Ni4.92Co0.26S8. Platinum group minerals are represented by testibiopalladinite, which is also closely associated with chalcopyrite.
3.4. Re Sulfide Composition
In sample 09-6 Re sulfide was found inside the grain of chalcopyrite (Figure 3a,b) in the form of three idiomorphic crystals of size 12 μm × 12 μm, 8 μm × 7 μm, and 5 μm × 2 μm. In all points, there is up to 5 wt.% Os. Rhenium content varies in the range of 46–51 wt.%. The composition of the largest grain is characterized by changes in the ΣMe/S ratio, with variations in the contents of Re, Mo, and Cu. In points 5, 6, and 9, the mineral formula, as calculated on the basis of S = 8 atoms, can be written as (Cu0.71Fe0.52–0.58 Mo1.25–1.17Os0.22–0.19Re2.32–2.4)5.01S8. In points 7 and 8, the mineral formula, as calculated on the basis of S = 7 atoms, which can be written as (Fe0.54Mo0.87Os0.23Re2.37)4S7 and (Cu1.13Fe0.83Mo0.66Os0.15Re2.27)5.04S7, respectively.
These compositional variations were confirmed by repeated analyses at neighboring points. The composition of the second grain in terms of the ratio ΣMe/S is close to that in points 7 and 8. It is characterized by higher contents of Fe and Mo; for points 10 and 11, they can be written as (Cu0.81Fe0.84Mo1.05Os0.15Re2.12)4.97S7 and (Cu0.85Fe0.77Mo1.09Os0.21Re2.09)5.03S7, respectively.
In sample 06-2, there is one large grain (7 μm × 20 μm) (Figure 3c) and a few small. The first and the three largest of the last (Figure 3d), with the size 3 μm × 5 μm, 3 μm × 2 μm, 2 μm × 2 μm, have been analyzed. Rhenium sulfide in this sample does not contain Os and in some cases Mo. Rhenium content varies in the range of 56–60 wt.%. For the first grain (Figure 3c, points 1–3) of the mineral formula, as calculated on the basis of S = 2 atoms, can be written as (Cu0.22Fe0.07Mo0.13Re0.66)1.08S2, (Cu0.19Fe0.05Mo0.11Re0.69)1.04S2 and (Cu0.21Fe0.07Re0.67)0.95S2, respectively. The composition of fine grains (Figure 3d, points 1–3) is consistent with the formula (Cu0.19–0.21Fe0.12–0.18Re0.62–0.67)0.95–1.08S2.
4. Discussion and Concluding Remarks
One of the major features of Re sulfide from the Zhelos intrusion is its high osmium content, similar to the mineral from the Ekojoki Ni–Cu (–PGE) deposit in Finland [11]. All rhenium-bearing minerals contain some radiogenic Os, which was formed as a result of the radioactive decay of the 187Re by emission of β-particles. Since the half-life of 187Re is 42.3 billion years, only very rich Re and geologically ancient minerals can contain enough 187Os to be determined by the electron microprobe [11]. If we assume that all Os in the Re-sulfide crystal is radiogenic 187Os, then the Re–Os model age will exceed 5 billion years.
Such an ancient model age indicates that not all Os in this sulfide is radiogenic and that Re–Mo–Cu–Fe–Os sulfide contained a significant amount of “common” Os at the time of crystallization.
The Cu and Fe concentrations measured in Re sulfides are realistic because they are substantially higher than can be expected due to the fluorescence from associated chalcopyrite and characterize steadily all grains, regardless of their location and size.
Re sulfides from the Zhelos and Tokty-Oi, closely resemble some of the Cu-containing rhenium sulfides reported previously, although there are certain differences. The ΣMe/S ratio for a part of our data (Figure 3b, points 5, 6, and 9) is consistent with that of the tarkianite with the composition corresponding to the ideal formula (Cu,Fe)(Re,Mo)4S8 [4]. A mineral of similar composition was identified in a Ni-rich sulfide from the Precambrian ultrabasic rocks (in Sweden) [7], Hitura Ni–Cu deposit (Finland) [6] and Lukkulaisvaara layered intrusion (Karelia, Russia) [3]. The sulfide from Zhelos is distinct from these by its high content of Os, but it does have a similar metal-to-metal ratio to that of the mineral from Lukkulaisvaara (Figure 4). Some of the data obtained (Figure 3b, points 7, 8, 10, and 11) have no known analogues in the metal–sulfur ratio.
Re sulfides from the Tokty-Oi have a ΣMe/S ratio as in rheniite (ReS2) [13] or dzeskazganite (Re,Mo)S2) [21], but differ from them by the presence of Fe and Cu and the metal-to-metal ratio. The composition of the Tokty-Oi minerals is closer to that of the Re sulfide from the Voronov Bor deposit (Russia) [14] in the (Cu + Fe + Ni + Co)–(Re + Os + Mo)–S ternary diagram and in the (Cu + Fe)–(Re + Mo + Os) binary diagram (Figure 4).
The sulfide mineral assemblages observed in the Zhelos and Tokty-Oi sulfide ores may be interpreted as the result of fractional crystallization of orthomagmatic sulfide liquids. The observed association of the rhenium sulfides with magmatic Fe–Ni–Cu sulfides suggests that it was formed from an immiscible sulfide liquid. It is well-known that Os, Ir, Ru, Rh (IPGE), Re, and Co are partitioned into MSS [22,23,24], however the localization of the Re sulfide within the chalcopyrite allows to speculate its crystallization from a residual Cu-rich liquid. The fractionation of original sulfide liquids resulted in a Cu-rich residue enriched in Re and some other chalcophile elements (Ag, Bi, Te). However, since high levels of rhenium are observed in all types of ores of the studied intrusions, it can be assumed that the initial magma was enriched in rhenium. So far, there is no information on the rhenium contents in the host rocks. Therefore, the question of what caused the high content of rhenium in the parental magma is open to debate.
Author Contributions
Metodology, investigation, and writing—original draft preparation, T.B.K.; investigation and project administration, A.S.M.; investigation and resources, D.A.O.
Funding
The research was performed within the frame of the state order project IX.129.1, No. 0350-2016-0030.
Acknowledgments
We thank “Intergeoproject” LLC, “VSNK” LLC and “GPP-Geological Company” LLC and personally to V.A. Durasov, A.M. Altynnikov, A.V. Rozhnikov, A.V. Salaev, A.I. Stekhin, and Yu.N. Kiselev for their assistance in carring out field work.
Conflicts of Interest
The authors declare no conflict of interest.
References
- Koide, M.; Hodge, V.; Yang, J.S.; Goldberg, E.D. Determination of rhenium in marine waters and sediments by graphite furnace atomic absorption spectrometry. Anal. Chem. 1987, 59, 1802–1805. [Google Scholar] [CrossRef]
- Lesnov, F.P.; Anoshin, G.N. Correlations between Re and PGE concentrations in rocks, ores, and minerals of mafic-ultramafic associations. Dokl. Earth Sci. 2011, 437, 387–392. [Google Scholar] [CrossRef]
- Barkov, A.Y.; Lednev, A.I. A rhenium–molybdenum–copper sulfide from the Lukkulaisvaara layered intrusion, northern Karelia, Russia. Eur. J. Mineral. 1993, 5, 1227–1233. [Google Scholar] [CrossRef]
- Kojonen, K.K.; Roberts, A.C.; Isomaki, O.P.; Knauf, V.; Johanson, B.; Pakkanen, L. Tarkianite, (Cu,Fe)(Re,Mo)4S8, a new mineral species from the Nitura Mine, Nivala, Finland. Can. Mineral. 2004, 42, 539–544. [Google Scholar] [CrossRef]
- Poplavko, E.M.; Marchukova, I.D.; Zak, S.S. A rhenium mineral in the Dzhezkazgan ore deposit. Dokl. Acad. Nauk SSSR 1962, 146, 433–436. (In Russian) [Google Scholar]
- Häkli, T.A.; Hänninen, E.; Vuorelainen, Y.; Papunen, H. Platinum-group minerals in the Hitura nickel deposit, Finland. Econ. Geol. 1976, 71, 1206–1213. [Google Scholar] [CrossRef]
- Ekstrom, M.; Hálenius, U. A new rhenium rich sulfide from two Swedish localities. Neues Jahrb. Mineral. Mon. 1982, 1, 6–10. [Google Scholar]
- Mitchell, R.H.; Laflamme, J.H.G.; Cabri, L.J. Rhenium sulfide from the Coldwell complex, Northwestern Ontario, Canada. Miner. Mag. 1989, 53, 635–637. [Google Scholar] [CrossRef]
- Marchetto, C.M.L. Platinum-group minerals in the O’Toole (Ni–Cu–Co) deposit, Brazil. Econ. Geol. 1990, 85, 921–927. [Google Scholar] [CrossRef]
- Tarkian, M.; Housley, R.M.; Volborth, A.; Greis, O.; Moh, G.H. Unnamed Re–Mo–Cu sulfide from the Stillwater complex, and crystal chemistry of its synthetic equivalent spinel type (Cu,Fe)(Re,Mo)4S8. Eur. J. Mineral. 1991, 3, 977–982. [Google Scholar] [CrossRef]
- Peltonen, P.; Pakkanen, L.; Johanson, B. Re–Mo–Cu–Os sulphide from the Ekojoki Ni–Cu deposit, SW Finland. Mineral. Petrol. 1995, 52, 257–264. [Google Scholar] [CrossRef]
- Znamensky, W.S.; Korzhinsky, M.A.; Steinberg, G.S.; Tkachenko, S.I.; Yakushev, A.I.; Laputina, U.P.; Bryzgalok, I.A.; Samotoin, N.D.; Magazina, L.O.; Kuzmina, O.V.; et al. Rheniite, ReS2, the natural rhenium disulfide from fumaroles of Kudryavy volcano, Iturup isl., Kurily Islands. Zapiski RMO. 2005, 34, 32–40. (In Russian) [Google Scholar]
- Tessalina, S.G.; Yudovskaya, M.A.; Chaplygin, I.V.; Brick, J.-L.; Capmas, F. Sources of unique rhenium enrichment in fumaroles and sulphides at Kudryavy volcano. Geochim. Cosmochim. Acta 2008, 72, 889–909. [Google Scholar] [CrossRef]
- Lavrov, O.B.; Kulashevich, L.V. The first finds of rhenium minerals in Karelia. Dokl. Earth Sci. 2010, 432, 598–601. [Google Scholar] [CrossRef]
- Dare, S.A.S.; Barnes, S.-F.; Prichard, H.M.; Fisher, P.C. The timing and formation of platinum-group minerals from the Creighton Ni–Cu–Platinum-Group element sulfide deposit, Sudbury, Canada: Early crystallization of PGE-rich sulfarsenides. Econ. Geol. 2010, 105, 1071–1096. [Google Scholar] [CrossRef]
- Zaccarini, F.; Garuti, G.; Fiorentini, M.L.; Locmelis, M.; Kollegger, P.; Thalhammer, O.A.R. Mineralogical hosts of platinum group elements (PGE) and rhenium in the magmatic Ni–Fe–Cu sulfide deposits of the Ivrea Verbano Zone (Italy): An electron microprobe study. N. Jb. Miner. Abh. 2014, 191, 169–187. [Google Scholar] [CrossRef]
- Voudouris, P.C.; Melfos, V.; Spry, P.G.; Bindi, L.; Kartal, T.; Arikas, K.; Moritz, R.; Ortell, M. Rhenium-rich molybdenite and rheniite in the Pagoni Rachi Mo–Cu–Te–Ag–Au prospect, northern Greece: Implications for the Re geochemistry of porphyry-style Cu–Mo and Mo mineralization. Can. Mineral. 2009, 47, 1013–1036. [Google Scholar] [CrossRef]
- Voudouris, P.C.; Melfos, V.; Spry, P.G.; Bindi, L.; Kartal, T.; Arikas, K.; Moritz, R.; Ortell, M.; Kartal, T. Extremely Re-rich molybdenite from porphyry Cu–Mo–Au prospects in Northeastern Greece: Mode of occurrence, causes of enrichment, and implications for gold exploration. Minerals 2013, 3, 165–191. [Google Scholar] [CrossRef]
- Mekhonoshin, A.S.; Ernst, R.; Söderlund, U.; Hamilton, M.A.; Kolotilina, T.B.; Izokh, A.E.; Polyakov, G.V.; Tolstykh, N.D. Relationship between platinum-bearing ultramafic-mafic intrusions and large igneous provinces (exemplified by the Siberian Craton). Russ. Geol. Geophys. 2016, 57, 822–833. [Google Scholar] [CrossRef]
- Kolotilina, T.B.; Mekhonoshin, A.S.; Orsoev, D.A. PGE distribution in sulfide ores from ultramafic massifs of the central East Sayan Mountains, Southern Siberia, Russia. Geol. Ore Depos. 2016, 58, 20–36. [Google Scholar] [CrossRef]
- Dedeshko M., P.; Satpaeva, T.A.; Fain, E.E. Chemical composition of a rhenium mineral from the Dzhezkazgan ore. Vestn. Akad Nauk Kazakh S.S.R. 1964, 20, 47–53. (In Russian) [Google Scholar]
- Prichard, H.M.; Hutchinson, D.; Fisher, P.C. Petrology and crystallization history of multiphase sulfide droplets in a mafic dike from Uruguay: implications for the origin of Cu–Ni–PGE sulfide deposits. Econ. Geol. 2004, 99, 365–376. [Google Scholar] [CrossRef]
- Sinyakova, E.F.; Kosyakov, V.I. Experimental modeling of zoning in copper–nickel sulfide ores. Dokl. Earth Sci. 2007, 417, 1380–1385. [Google Scholar] [CrossRef]
- Dare, S.A.S.; Barnes, S.-F.; Prichard, H.M. The distribution of platinum group elements (PGE) and other chalcophile elements among sulfides from the Creighton Ni–Cu–PGE sulfide deposit, Sudbury, Canada, and the origin of palladium in pentlandite. Miner. Depos. 2010, 45, 765–793. [Google Scholar] [CrossRef]
Figure 1.
(a) A general map showing the location of the area in the Russian Federation (shown by red rectangle symbol); (b) geologic map of the central Iya–Kukshera interfluve, East Sayan Mountains. Digits in squares denote the Zhelos (1) and Tokty-Oi (2) intrusions.
Figure 1.
(a) A general map showing the location of the area in the Russian Federation (shown by red rectangle symbol); (b) geologic map of the central Iya–Kukshera interfluve, East Sayan Mountains. Digits in squares denote the Zhelos (1) and Tokty-Oi (2) intrusions.
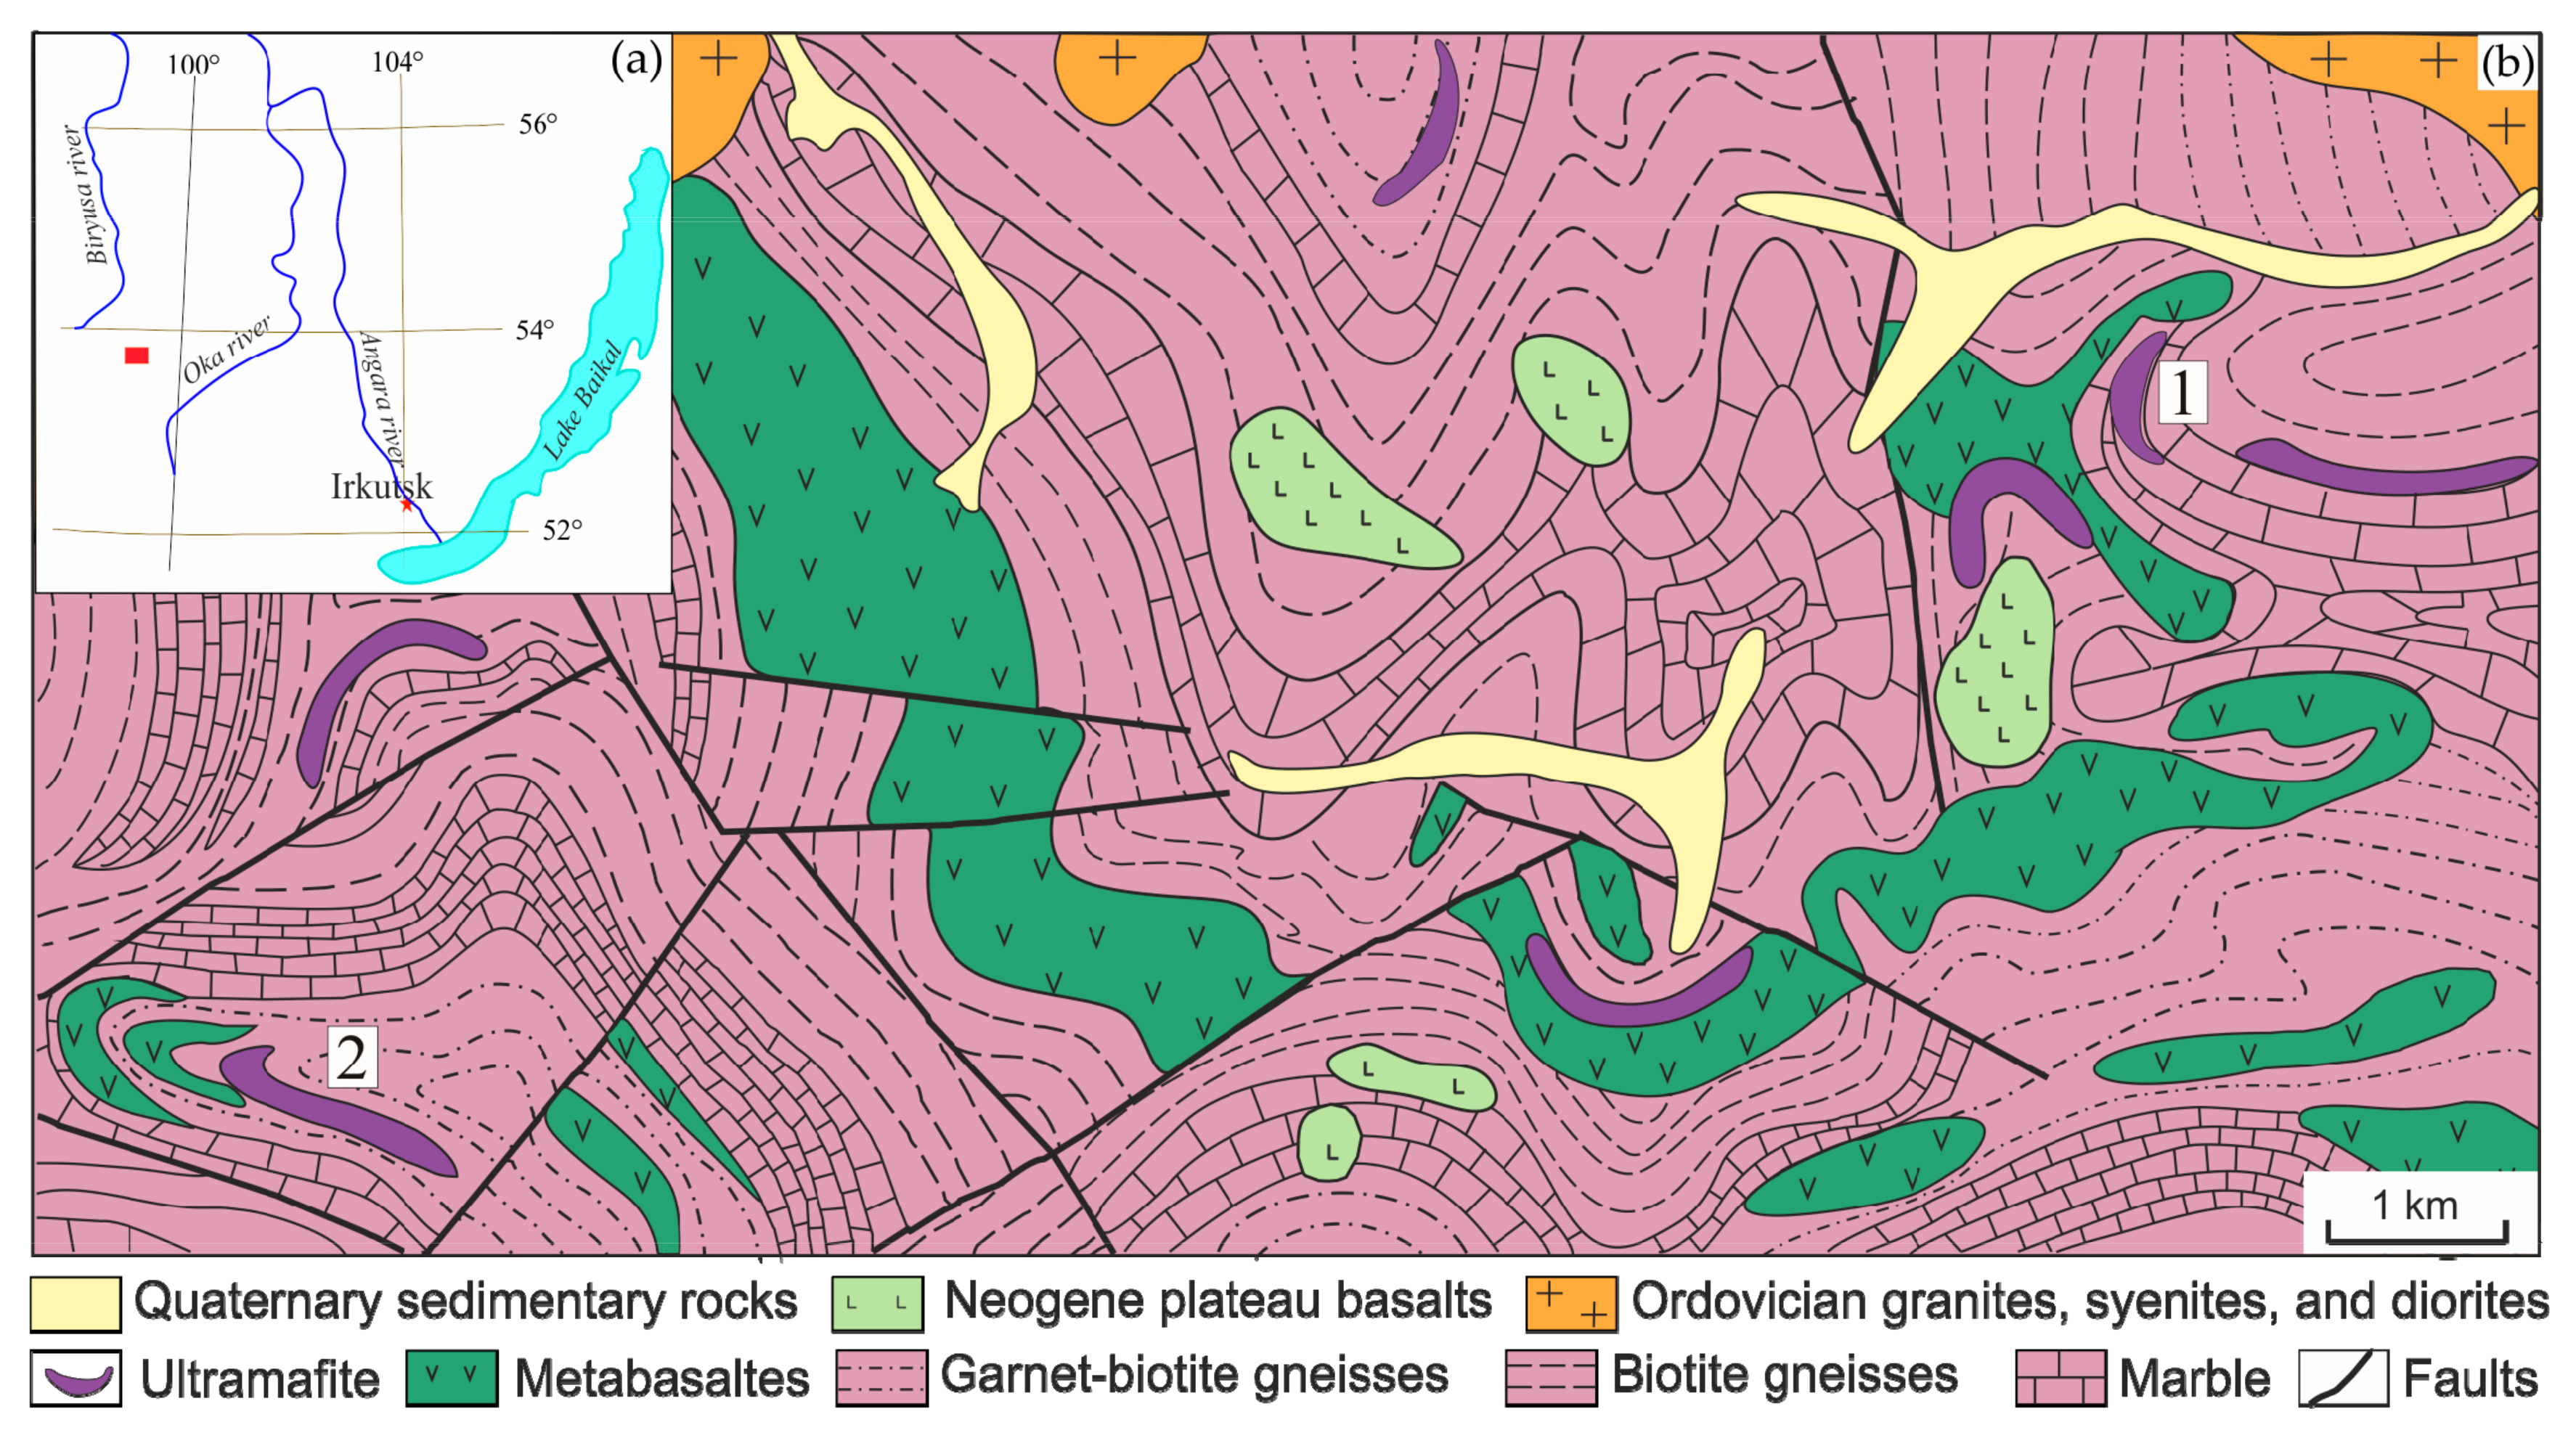
Figure 2.
Back-scattered electron image of sulfide minerals: (a,b) sample 09-6; (c,d) sample 06-02. Am: amphibole, Ccp: chalcopyrite, Mag: magnetite, Mcw: mackinawite, Pn: pentlandite, Ol: olivine, Srp: serpentine, Tro: troilite. The points correspond to the analyses in Table 1.
Figure 2.
Back-scattered electron image of sulfide minerals: (a,b) sample 09-6; (c,d) sample 06-02. Am: amphibole, Ccp: chalcopyrite, Mag: magnetite, Mcw: mackinawite, Pn: pentlandite, Ol: olivine, Srp: serpentine, Tro: troilite. The points correspond to the analyses in Table 1.
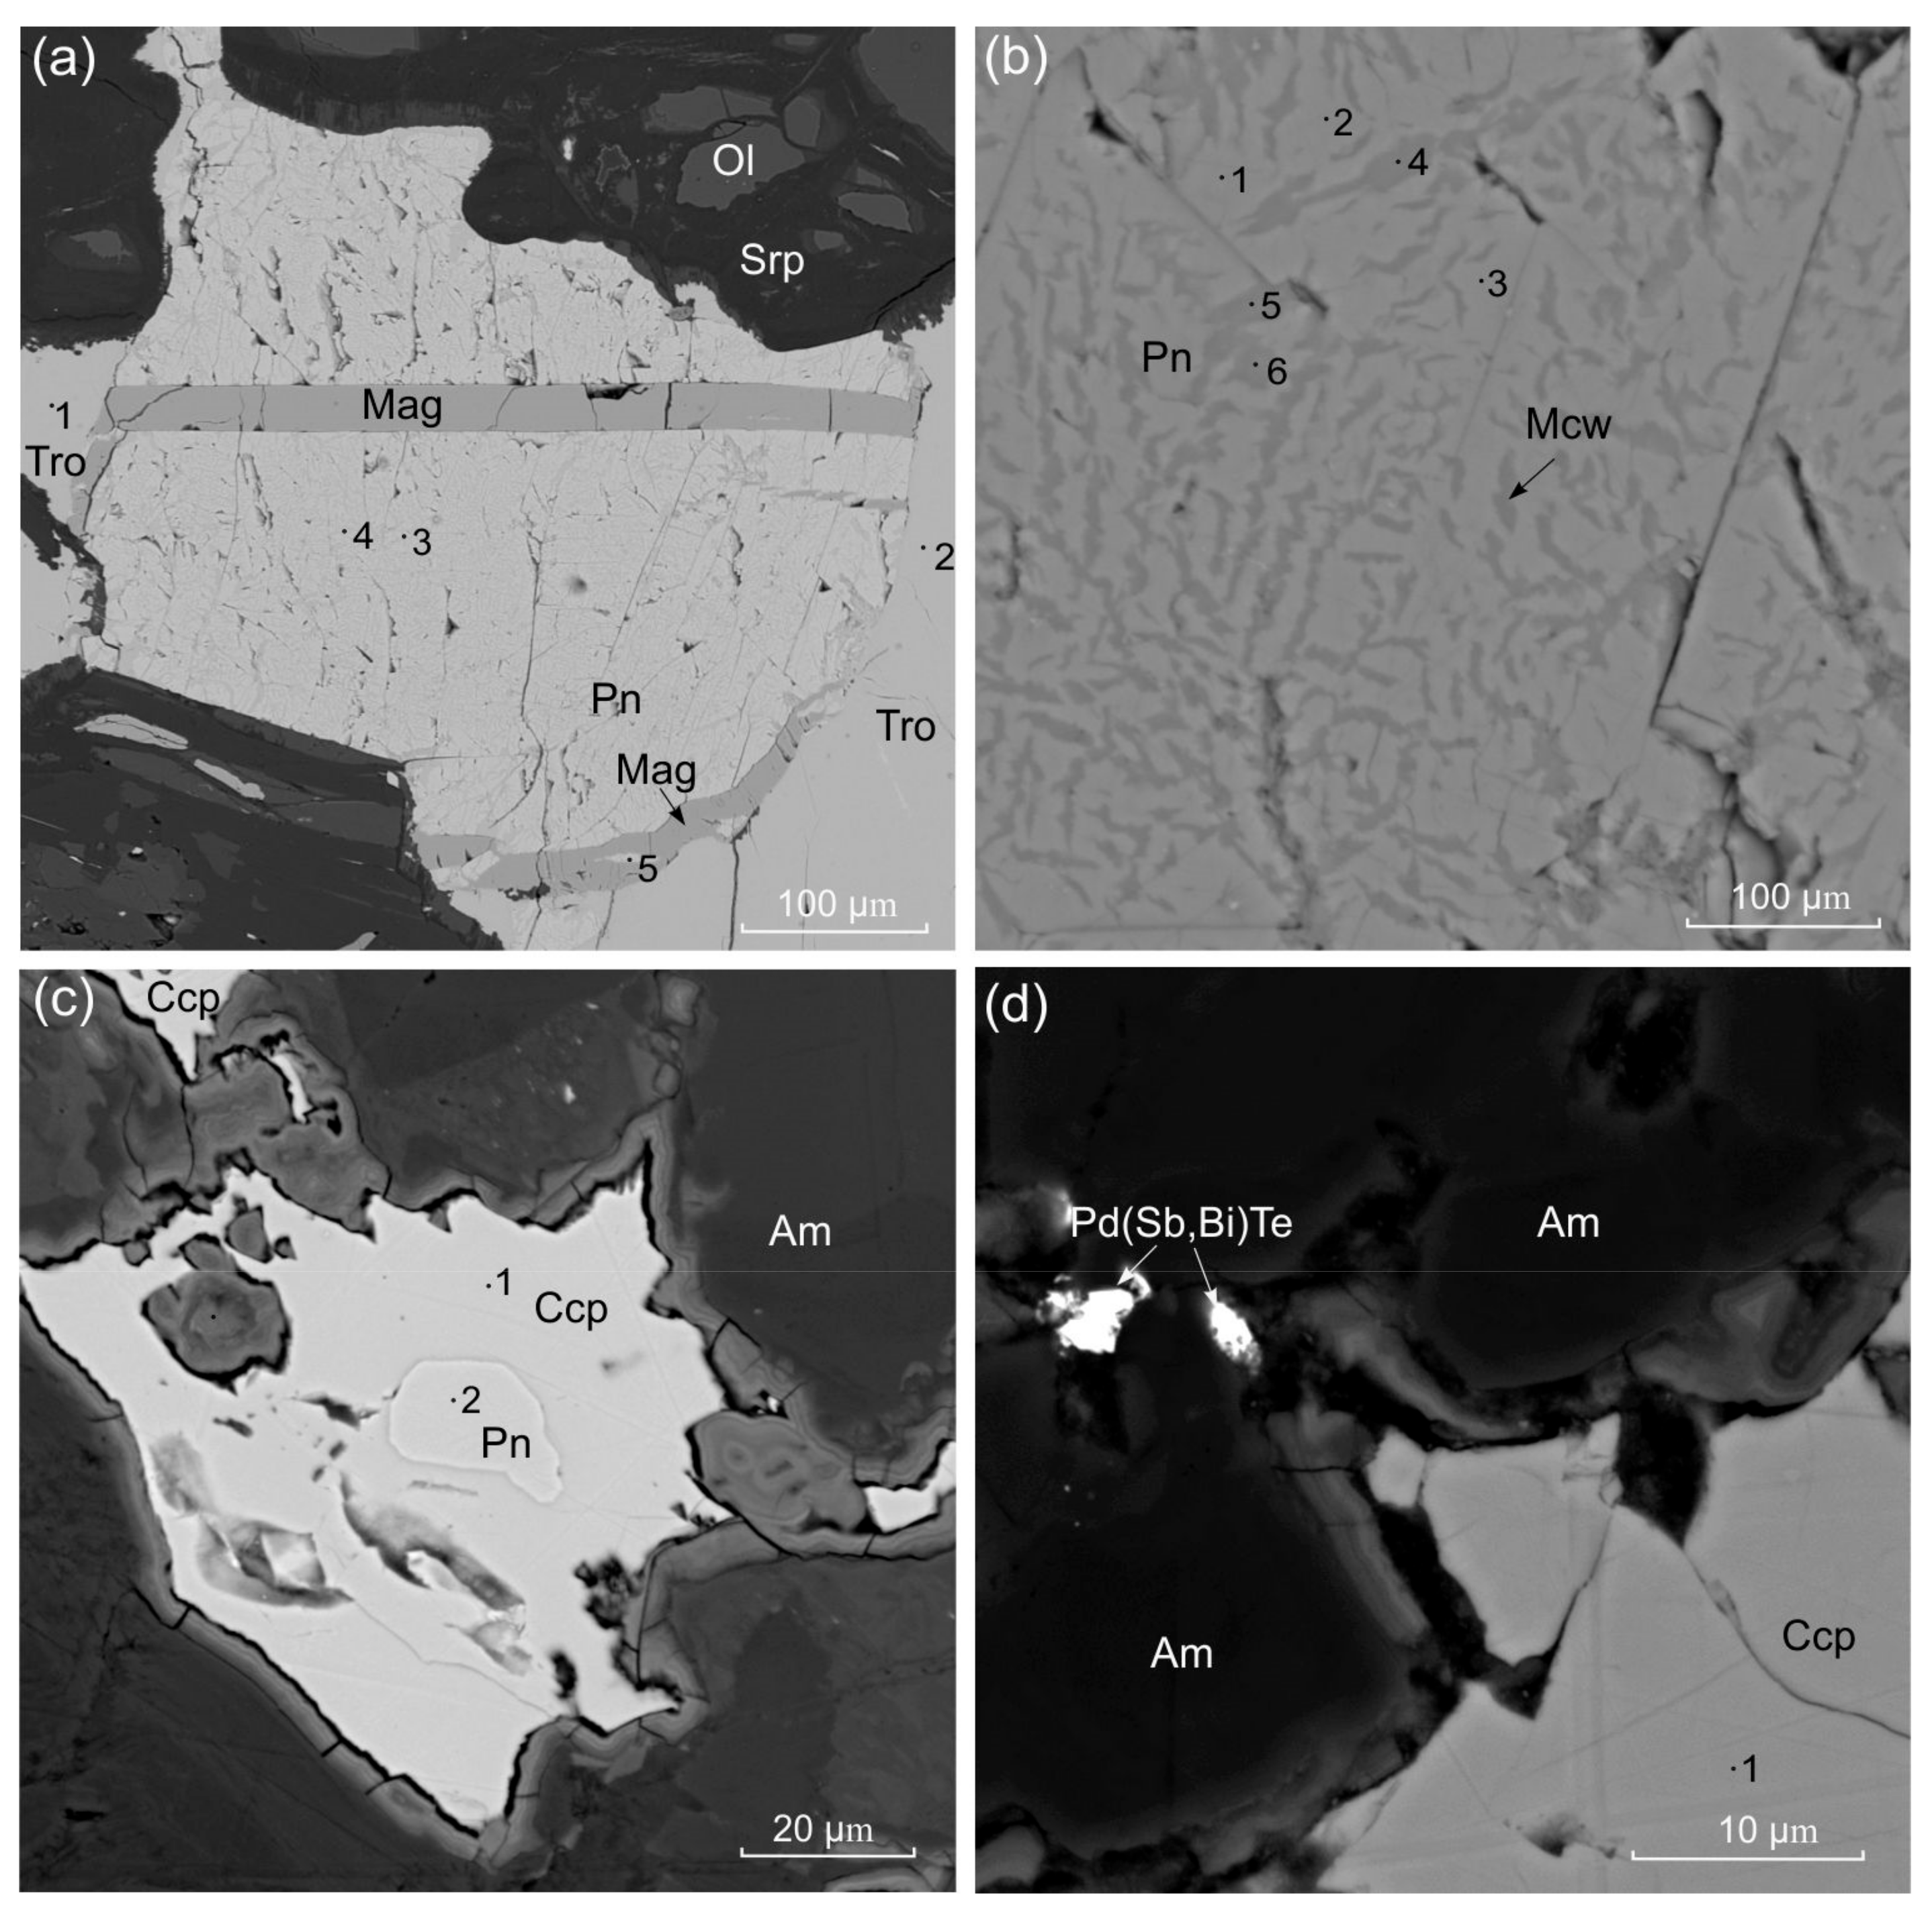
Figure 3.
Back-scattered electron image of Re sulfides: (a) Position of rhenium sulfide in pyrrhotite–chalcopyrite–pentlandite aggregate (sample 09-6); (b) Enlarged fragment of Figure 3a (blue square); (c,d) sample 06-02. Am: amphibole, Ccp: chalcopyrite, Pn: pentlandite, Po: pyrrhotite. The points correspond to the analyses in Table 1 and Table 2.
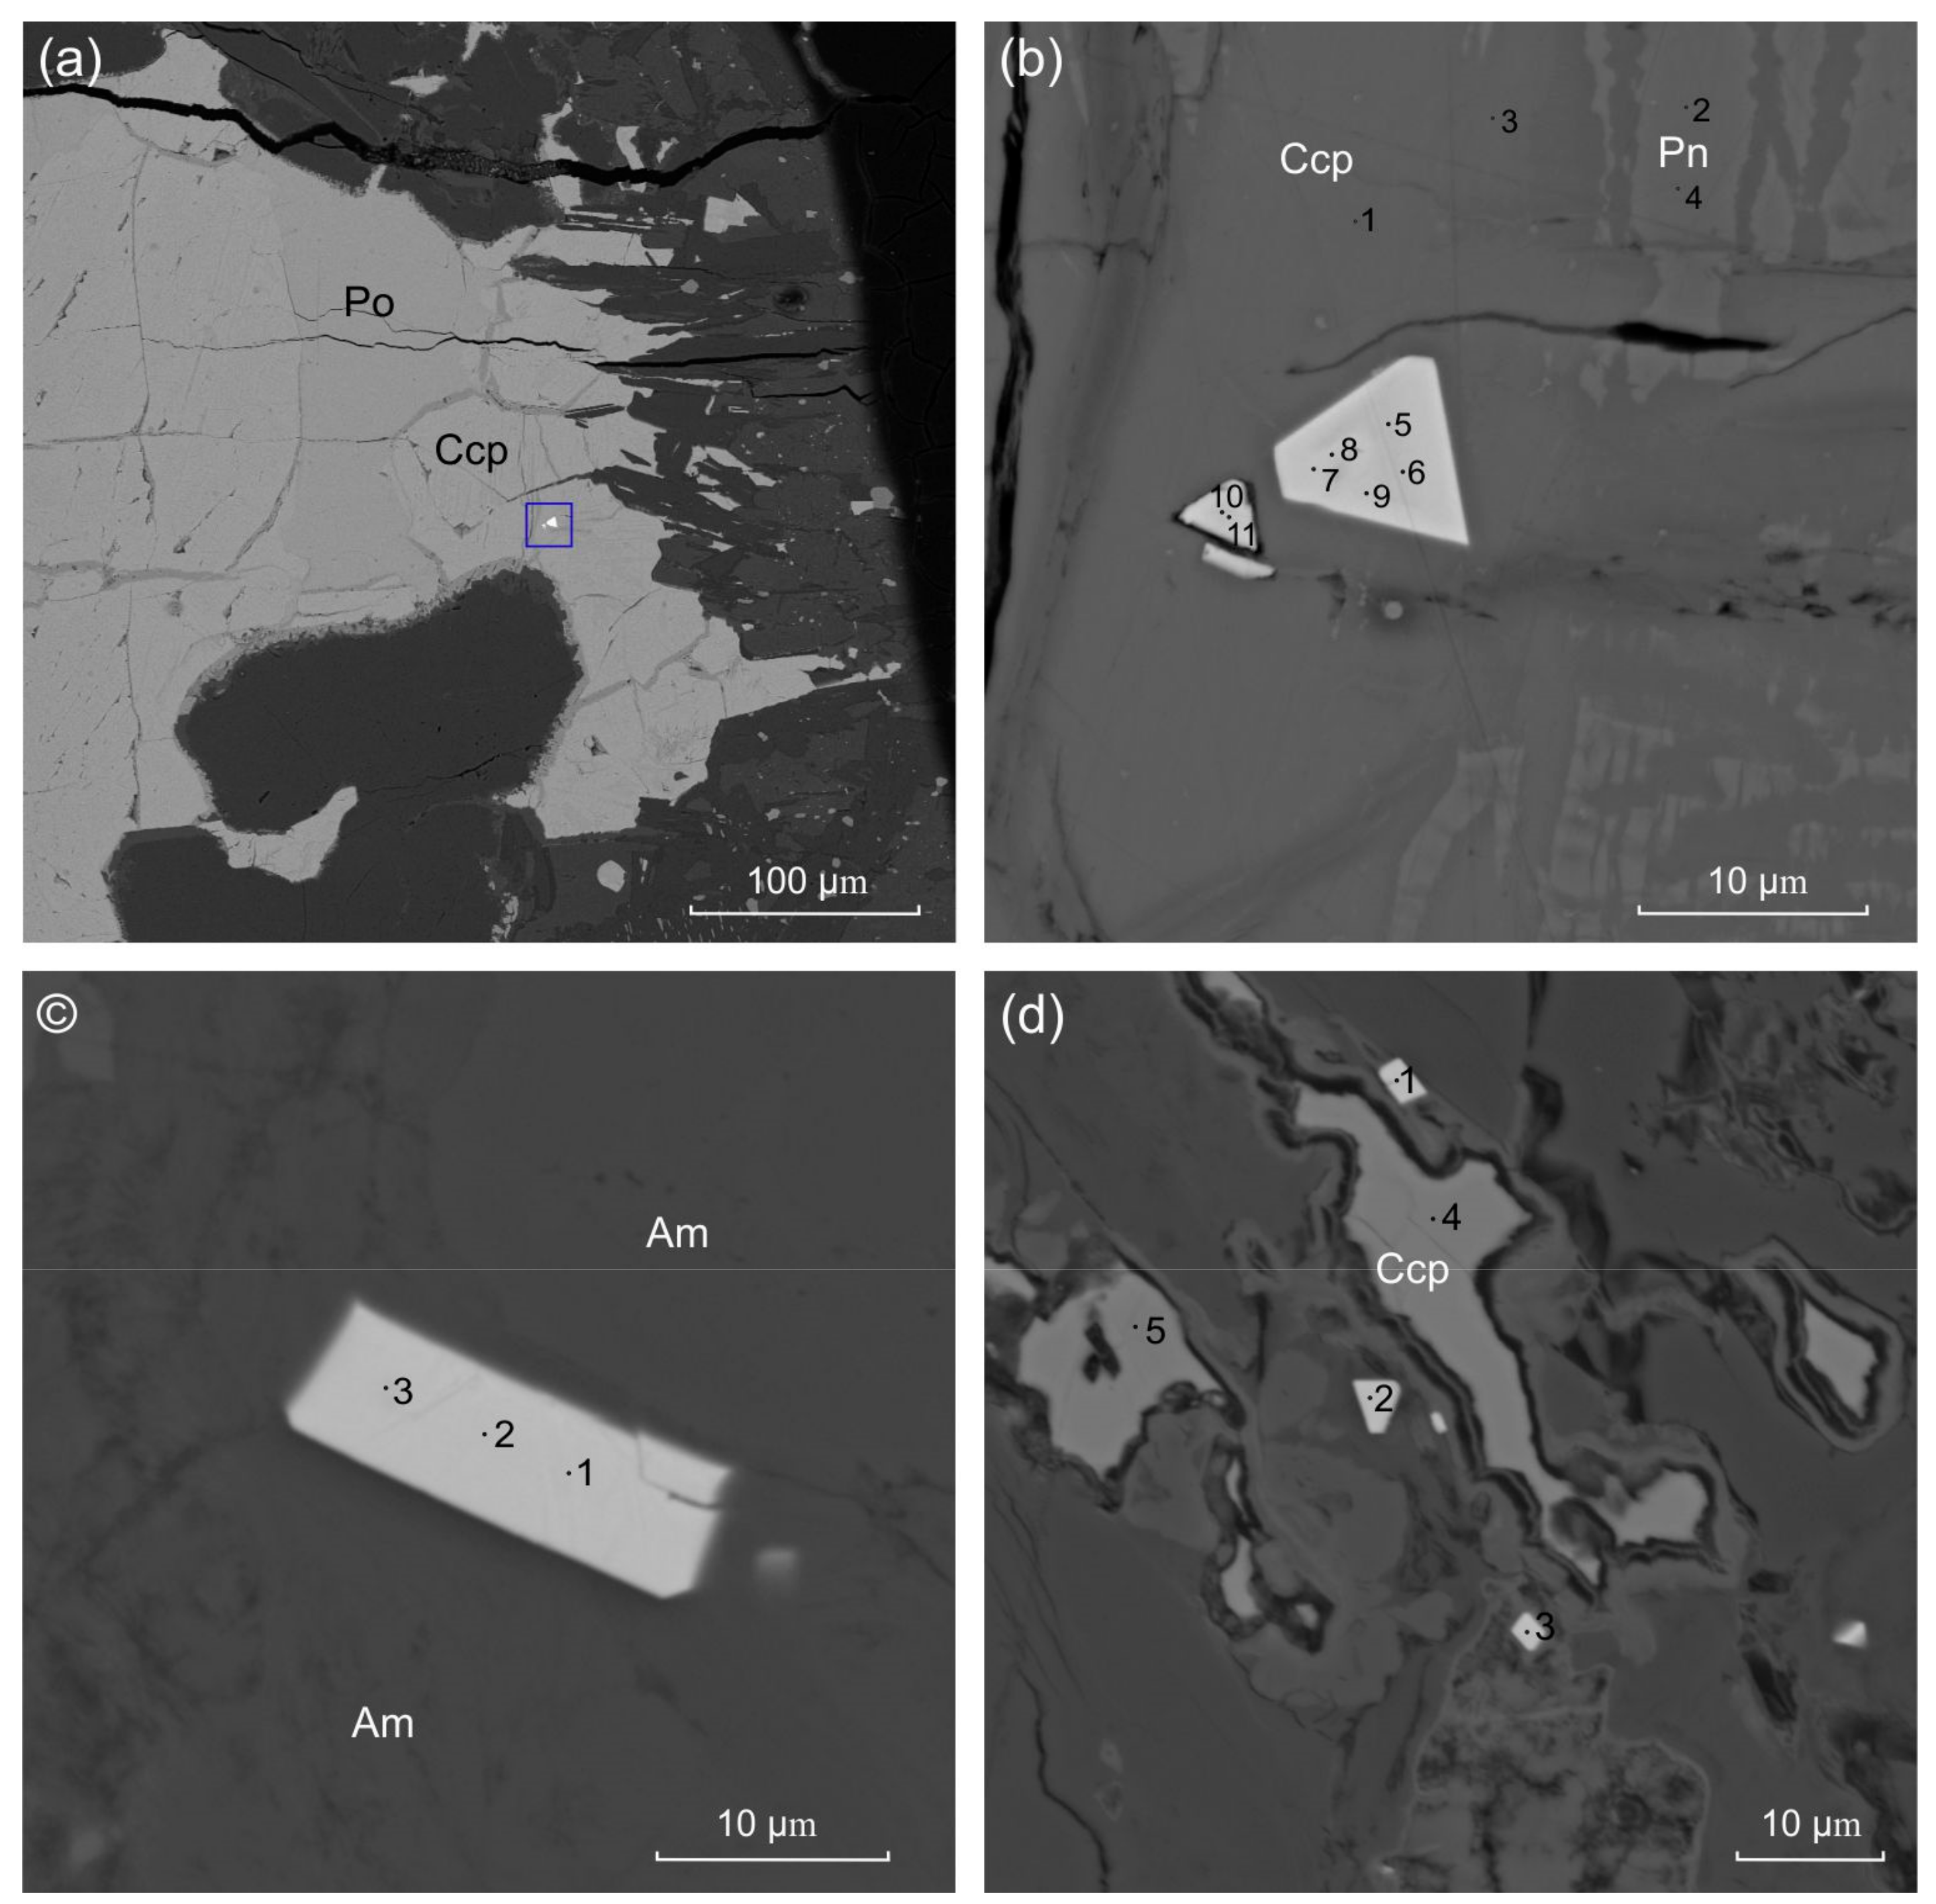
Figure 4.
Chemical composition of Re sulfides plotted as: (a) the ternary plot (Cu + Fe + Ni + Co)–(Re + Os + Mo)–S (at.%); (b) the binary plot of (Re + Mo + Os) vs. (Cu + Fe) (atoms per formula unit). Symbol used: blue circle—Zhelos; green circle—Tokty-Oi; E: Ekojoki; L: Lukkulisvaara; VB: Voronov Dvor.


Table 1.
Electron-microprobe data (wt. %) on sulfide associated with rhenium minerals.
| Sample | Figure | Point | Fe | Co | Ni | Cu | S | Total |
|---|---|---|---|---|---|---|---|---|
| 09-6 | 2(a) | 1 | 64.05 | bdl | bdl | bdl | 36.33 | 100.38 |
| 09-6 | 2(a) | 2 | 63.64 | bdl | bdl | bdl | 36.22 | 99.86 |
| 09-6 | 2(a) | 3 | 38.34 | 0.6 | 27.97 | bdl | 33.52 | 100.43 |
| 09-6 | 2(a) | 4 | 39.2 | 0.98 | 25.77 | bdl | 32.98 | 98.93 |
| 09-6 | 2(a) | 5 | 35.65 | 0.9 | 30.16 | bdl | 33.09 | 99.8 |
| 09-6 | 2(b) | 1 | 35.2 | 0.91 | 30.85 | bdl | 33.34 | 100.3 |
| 09-6 | 2(b) | 2 | 35.52 | 0.78 | 31.02 | bdl | 33.67 | 100.99 |
| 09-6 | 2(b) | 3 | 34.91 | 0.9 | 30.9 | bdl | 33.35 | 100.06 |
| 09-6 | 2(b) | 4 | 49.88 | 0.96 | 11.87 | 0.83 | 35.36 | 98.9 |
| 09-6 | 2(b) | 5 | 49.17 | 0.99 | 11.34 | 1.65 | 35.04 | 98.19 |
| 09-6 | 2(b) | 6 | 44.62 | 1.06 | 17.66 | bdl | 35.01 | 98.35 |
| 06-2 | 2(с) | 1 | 27.51 | 1.97 | 37.27 | bdl | 33.08 | 99.83 |
| 06-2 | 2(с) | 2 | 31.5 | bdl | bdl | 33.56 | 34.55 | 99.62 |
| 06-2 | 2(d) | 1 | 30.47 | bdl | bdl | 34.45 | 34.4 | 99.32 |
| 09-6 | 3(b) | 1 | 31.09 | bdl | bdl | 33.66 | 34.68 | 99.43 |
| 09-6 | 3(b) | 2 | 34.02 | 1.49 | 31.01 | bdl | 33.46 | 99.98 |
| 09-6 | 3(b) | 3 | 31.16 | bdl | 0.84 | 32.74 | 34.99 | 99.73 |
| 09-6 | 3(b) | 4 | 33.68 | 0.93 | 31.41 | bdl | 32.61 | 98.63 |
| 06-2 | 3(d) | 4 | 31.3 | bdl | bdl | 34.2 | 34.28 | 99.78 |
| 06-2 | 3(d) | 5 | 31.13 | bdl | bdl | 33.57 | 34.66 | 99.36 |
Note: “bdl” means “below detection limit”.
Table 2.
Electron-microprobe analyses (wt. %) of the Re sulfide.
| Sample | Figure | Point | Fe | Cu | Os | Mo | Re | S | Total | ΣMe/S1 | Re/Mo1 | Re/Cu1 |
|---|---|---|---|---|---|---|---|---|---|---|---|---|
| 09-6 | 3b | 5 | 3.54 | 4.92 | 4.48 | 13.05 | 47.00 | 27.91 | 100.90 | 0.63 | 1.86 | 3.28 |
| 09-6 | 3b | 6 | 3.17 | 4.87 | 3.98 | 12.14 | 48.27 | 27.67 | 100.10 | 0.63 | 2.05 | 3.41 |
| 09-6 | 3b | 7 | 3.42 | 7.22 | 4.93 | 9.38 | 49.76 | 25.32 | 100.03 | 0.72 | 2.73 | 2.37 |
| 09-6 | 3b | 8 | 5.43 | 8.51 | 3.24 | 7.34 | 49.45 | 26.22 | 100.19 | 0.72 | 3.47 | 2.0 |
| 09-6 | 3b | 9 | 2.75 | 5.75 | 3.65 | 9.35 | 51.38 | 27.18 | 100.06 | 0.63 | 2.83 | 3.07 |
| 09-6 | 3b | 10 | 5.56 | 6.15 | 3.39 | 11.84 | 46.60 | 26.49 | 100.03 | 0.71 | 2.03 | 2.60 |
| 09-6 | 3b | 11 | 5.07 | 6.39 | 4.75 | 12.24 | 45.57 | 26.24 | 100.27 | 0.72 | 1.92 | 2.45 |
| 09-6 | 3b | 12 | 15.69 | 13.12 | 2.88 | 6.62 | 32.53 | 28.76 | 99.60 | 0.77 | 2.53 | 0.85 |
| 06-2 | 3c | 1 | 3.82 | 6.99 | bdl | bdl | 57.61 | 31.24 | 99.66 | 0.50 | 2.83 | |
| 06-2 | 3c | 2 | 3.41 | 6.2 | bdl | bdl | 57.81 | 31.89 | 99.32 | 0.47 | 3.20 | |
| 06-2 | 3c | 3 | 4.74 | 6.7 | bdl | bdl | 58.50 | 30.04 | 99.99 | 0.54 | 3.00 | |
| 06-2 | 3d | 1 | 1.77 | 6.36 | bdl | 5.85 | 56.48 | 29.32 | 99.77 | 0.54 | 4.97 | 3.05 |
| 06-2 | 3d | 2 | 1.37 | 5.59 | bdl | 4.89 | 58.39 | 29.13 | 99.37 | 0.52 | 6.15 | 3.59 |
| 06-2 | 3d | 3 | 1.83 | 6.39 | bdl | bdl | 60.20 | 30.97 | 99.39 | 0.47 | 3.24 |
Note: 1atomic ratio. “bdl” stands for “below detection limit”.
© 2019 by the authors. Licensee MDPI, Basel, Switzerland. This article is an open access article distributed under the terms and conditions of the Creative Commons Attribution (CC BY) license (http://creativecommons.org/licenses/by/4.0/).
Share and Cite
MDPI and ACS Style
Kolotilina, T.B.; Mekhonoshin, A.S.; Orsoev, D.A. Re Sulfides from Zhelos and Tokty-Oi Intrusions (East Sayan, Russia). Minerals 2019, 9, 479. https://doi.org/10.3390/min9080479
AMA Style
Kolotilina TB, Mekhonoshin AS, Orsoev DA. Re Sulfides from Zhelos and Tokty-Oi Intrusions (East Sayan, Russia). Minerals. 2019; 9(8):479. https://doi.org/10.3390/min9080479
Chicago/Turabian StyleKolotilina, Tatiana B., Aleksey S. Mekhonoshin, and Dmitriy A. Orsoev. 2019. "Re Sulfides from Zhelos and Tokty-Oi Intrusions (East Sayan, Russia)" Minerals 9, no. 8: 479. https://doi.org/10.3390/min9080479
Note that from the first issue of 2016, this journal uses article numbers instead of page numbers. See further details here.