Investigation of Spectral Variation of Pine Needles as an Indicator of Arsenic Content in Soils


1
Department of Astronomy, Space Science and Geology, Chungnam National University, 99 Daehak-ro, Yuseong-gu, Daejeon 34134, Korea
2
Department of Geological Sciences, Chungnam National University, 99 Daehak-ro, Yuseong-gu, Daejeon 34134, Korea
3
Department of Geography & Anthropology, Louisiana State University, Baton Rouge, LA 70803, USA
4
Convergence Research Center for Development of Mineral Resources (DMR), Korea Institute of Geoscience and Mineral Resources, 124 Gwahak-ro, Yuseong-gu, Daejeon 34132, Korea
*
Author to whom correspondence should be addressed.
Minerals 2019, 9(8), 498; https://doi.org/10.3390/min9080498
Submission received: 19 June 2019
/
Revised: 16 August 2019
/
Accepted: 16 August 2019
/
Published: 19 August 2019
(This article belongs to the Special Issue Arsenic Geochemistry and Health)
Abstract
:The spectral response to arsenic (As) stress of pine needles (Pinus densiflora Siebold and Zucc.) from an abandoned lead (Pb)–zinc (Zn) mine was investigated based on chemical and spectroscopic analyses. The correlation analysis between the content of As in needle samples and that of soils and spectral parameters of the needle samples were conducted. The results showed very high correlation between As content in pine needles and soils. The major spectral response of pine needles to the As stress were characterized by the increase in the green and red color reflectance, the decrease in the first derivatives at 1648 nm, and the shrink in the red absorption feature. These changes were caused by the pigment content loss and the structural changes of phenolic compounds in the pine needles due to the As content. The linear regression analysis with the stepwise method showed the first derivatives at 668 nm and 1648 nm were the most useful variables in the regression model for As content prediction in pine needles. The As index of pine needles could be used to detect As content in soils associated with As and heavy metals contamination and/or mineralization in coniferous forests.
1. Introduction
Arsenic (As) is renowned for its high toxic potential in the natural ecosystem [1]. The main sources of As contamination are mining, smelting, and other industrial activities such as metallurgy, electroplating, dyes, pottery, and petroleum refining [2]. Other important sources of As are the irrigation of As contaminated water and the use of agrochemical materials or animal manures where As compounds are used [3,4]. Specifically, As is known as one of the most serious metal and metalloid contaminants in abandoned metal mines in Korea [5]. Arsenic can be transported by water or air in the ecosystems, resulting in interruption of the natural circulation nodes that they reach [2]. Due to its widespread occurrence and toxicity, reliable and eco-friendly methods for evaluating As contamination have become extremely necessary [4,6].
Field sampling and laboratory-based chemical analyses are the major analytical approaches to As and heavy metal content in soils [7,8]. Field-based methods take large amounts of labor, time, and money [9]. Furthermore, point-based measurements of field sampling need spatial interpolation to cover the whole study area, no matter how dense the samples are [10]. Several studies have used a remote sensing approach as an alternative solution to the field method, because it is a rapid, non-destructive, and economic way to provide a synoptic view of the area with better spatial and temporal coverage [7,11,12,13]. However, remote sensing on metal and metalloid contamination in soils is limited when most areas are covered with vegetation [7,9].
To walk around the vegetation cover problem, there have been efforts focusing on how vegetation responds to the metal and metalloid contamination. In general, vegetation growing in a metal and metalloid contaminated soil internally accumulates these elements, and the metal and metalloid stresses induce changes in foliar optic properties [9,14,15]. Such changes are primarily linked with pigment content [12,16], biochemical composition [17], cellular structure [18,19], moisture content [15], and phenological changes [14]. Changes in the vegetation’s foliar optic properties can be detected by the remote sensors, especially spectrometers with high spectral resolutions.
Based on the spectral response of plants to metal and metalloid stress, studies on botanical geology that explore metal and metalloid enriched areas have been carried out. Yost and Wenderoth [20] reported that reflectance spectra of balsam fir and red spruce growing on copper–molybdenum deposits showed variations in the near infrared (NIR hereafter) spectrum. Collins et al. [21] found a higher green band reflectance and a blue-shift of the red edge of the conifers growing in mineralized areas in response to the metal and metalloid contamination. Kupková et al. [22] measured the chlorophyll content of silver birch and scots pine foliage from heavy metal contaminated areas based on different spectral indices.
Previous studies on the foliar spectral response to As content focused on herbaceous plants such as rice [3,4,9], spinach [23], and Pteris ferns [24]. For example, visible and near infrared spectra (VNIR hereafter) of rice have been used to monitor As and heavy metal content in soils and variations in chlorophyll content under As stress [3,4,9]. They reported that VNIR spectra were sensitive to chlorophyll content and cellular structure of rice plants associated with As stress caused by uptake of As from the soil. Slonecker et al. [24] constructed effective prediction models of As content in Pteris ferns using first derivatives of the reflectance based on pot experiments. Bandaru et al. [23] found high correlations between NIR bands and leaf As content/structural changes of spinach. They found an As effect on total leaf thickness and intercellular spaces.
It is well known that spectral characteristics associated with As and heavy metal elements vary between vegetation species [24]. It indicates that spectral response of herbaceous plants in regards to As content may not be applicable to coniferous trees. Moreover, spectroscopic studies associated with As contaminated coniferous trees are relatively limited. Therefore, it calls for a systematic study of the relationships between the As content in the conifers and their foliar spectral characteristics.
Pine trees are common coniferous trees dwelling over large areas globally and are noted for a high intake of As and heavy metals in contaminated soils. Due to their high tolerance against As and heavy metal elements, they are often used in the treatment of As and heavy metal contaminated soils [22]. The pinus densiflora Siebold and Zucc. (P. densiflora hereafter), called Korean red pine, is one of the most widely distributed pine trees commonly found in Korea, Japan, China, and Southern Russia [25]. These countries face many environmental problems associated with As and heavy metal contamination [4,5,26,27]. The knowledge on the change in the spectral reflectance of pine needles in response to As content may offer the opportunities of identifying high As contamination in the soil or water using remote sensing in these countries. In this study, we investigated spectral response of pine needles to As content based on chemical and spectroscopic analysis, and prediction models of As content using a stepwise linear regression model which we developed. Hopefully, the model may be applicable for exploration of As contamination in soils.
2. Materials and Methods
2.1. Study Area
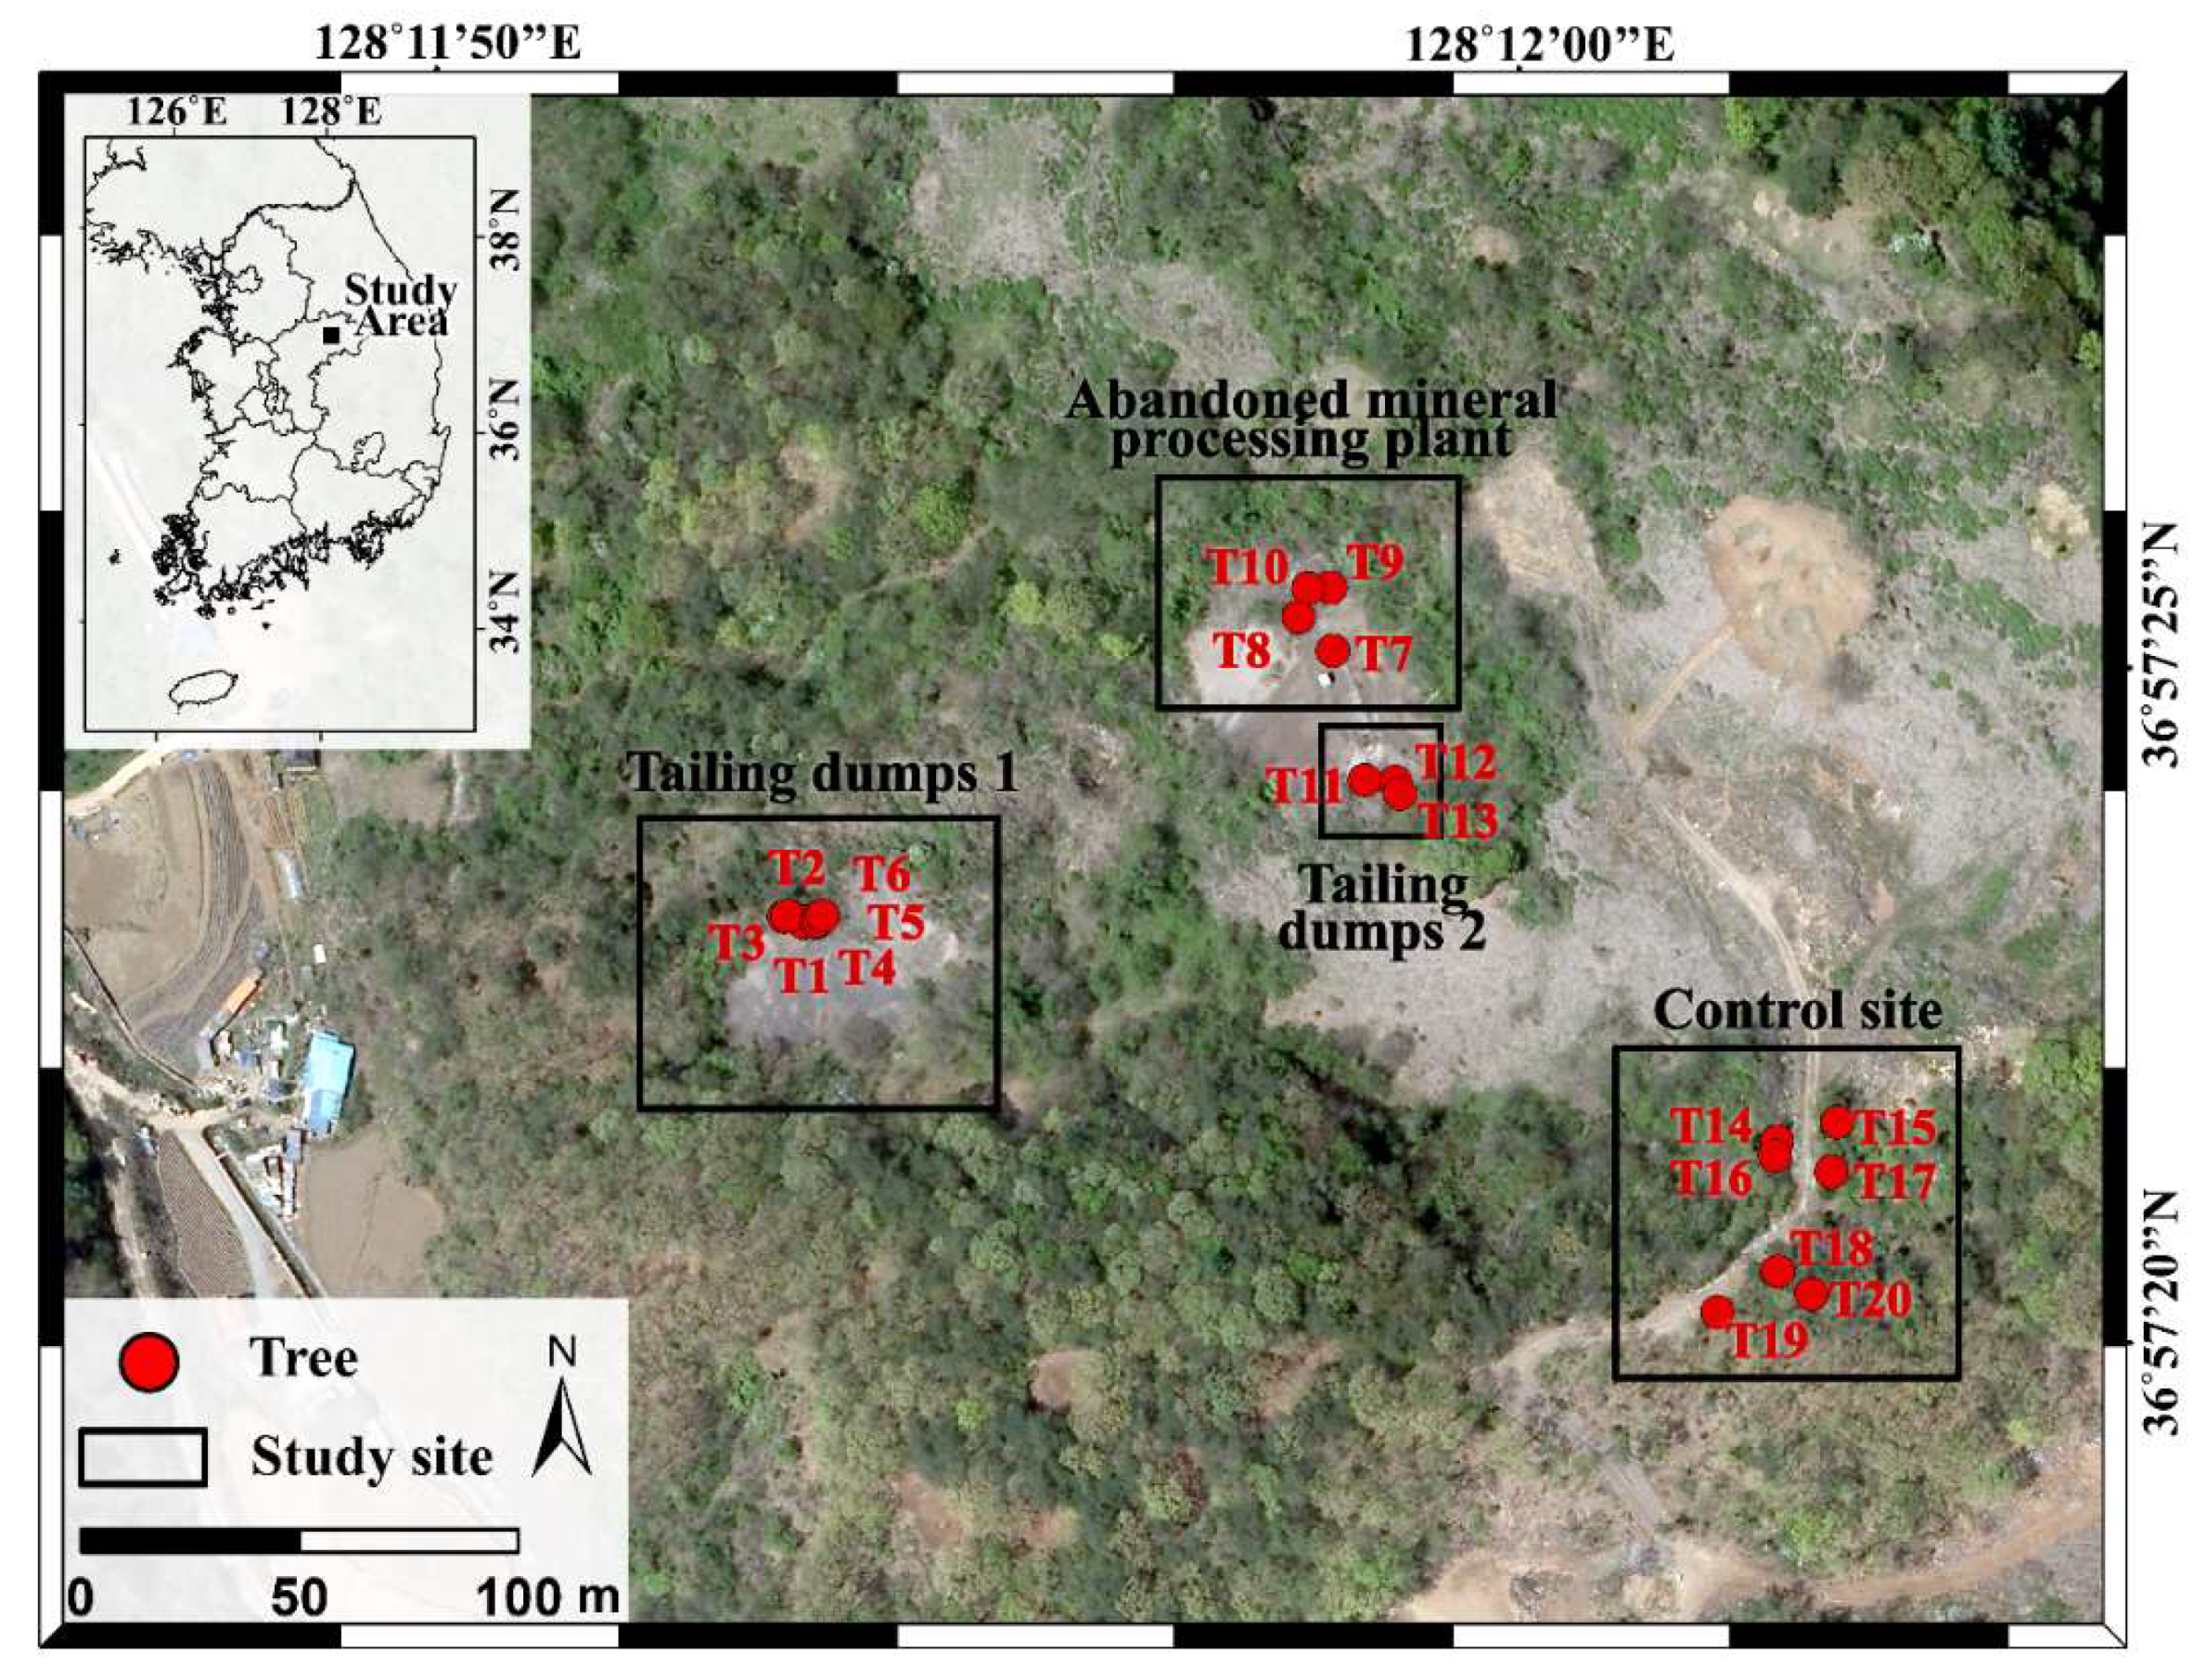
To study the relationship between As content and reflectance of pine needles growing in As and heavy metal contaminated soils, we selected the Boksu mine, the abandoned lead (Pb)–zinc (Zn) mine in South Korea (36°57′23″ N, 128°11′59″ E; Figure 1). The study area has an annual average temperature of 10.5 °C and an average annual precipitation of 892 mm [28]. According to the survey report published by the Korean government and the Mine Reclamation Corporation (MIRECO), the Boksu mine has been undergone serious environmental problems including soil and stream contamination due to mine water, tailing, dust, and waste debris [5]. The soils near the Boksu mine are heavily contaminated with cadmium (Cd), lead (Pb), arsenic (As), nickel (Ni), zinc (Zn), and copper (Cu). The contamination levels of these elements are very high based on the metal and metalloid contamination standard in soil [5,29]. For mine reclamation, phytoremediation approaches using P. densiflora have been carried out on re-cultivated soil. Such contamination and vegetation cover condition make this area an ideal site for our experiments.
2.2. Site Selection and Sample Collection
In accordance with the standard sampling methods for the examination of soil contamination prescribed by the Korean ministry of environment, the soil was chosen from a central location where pine trees reside and the surrounding locations of the four normal directions. We sampled the soil at 0–15 cm depth after removing the organic layer. The collected soils were passed through a 100 mesh sieve to minimize the granular effect. The content of As and heavy metals in the soil was measured using a portable X-ray fluorescence spectrometer (PXRF hereafter) on-site. The content of As and heavy metals in the soil was compared with the contamination limits (Table 1). Contaminated pine needles were sampled from pine trees growing on the tailing dumps (T1 to 6, T11 to 13) and an abandoned mineral processing plant (T7 to 10), where serious As and heavy metal contamination was reported (Figure 1). Control trees (T14 to 20) were selected from the nearby location where the soil contamination level was ignorable (Figure 1 and Table 1). The control site was located within the same watershed with the study sites where the conditions in illumination, precipitation, wind, and geology are the same as the trees with contamination. Given the fact that the control site has the same conditions in plant growth except As and heavy metal contamination in the soils, the difference in spectral responses between the trees in contaminated and control site would present the effect of As and heavy metal content.
The sample collection was carried out during April 2018. Healthy and fully developed pine branches located in sunlit areas were collected from an upper and middle part of the canopy using a pruning pole [14,22]. 163 sets of pine needles were sampled from 13 pine trees in contaminated areas and 23 sets of pine needles were collected from 7 control trees. The collected samples were stored in polyethylene bags and carried to the laboratory in an ice-cooled container. The samples were then washed with distilled water and refrigerated at 4 °C. They were also wrapped with wet tissue to preserve their condition in the refrigerator. The chemical and spectroscopic analyses were performed within three days of the sampling in laboratory conditions [22,27,30].
2.3. PXRF Scanning
A PXRF method was used to measure As and heavy metal content in soil on-site and As content in pine needle samples under laboratory conditions. PXRF is well known as a screening tool for metal and metalloid contents in various environmental samples and a standard protocol regulated by the National Institute for Occupational Safety and Health (NIOSH) and the United States Environmental Protection Agency’s Environmental Response Team (USEPA/ERT) [31,32,33,34,35]. Compared with the wet chemical analysis, PXRF has advantages of its non-destructive, rapid measurements and simplified pre-processing procedure. Several studies have also reported that the accuracy of PXRF is high enough for most elements except cobalt (Co) [36,37]. The PXRF can measure chemical composition at aperture diameter, which enables direct comparison between spectral reflectance and the content of metal and metalloid at exactly the same spot of the sample [33,38]. Due to these advantages, the use of PXRF has been widely applied to vegetation analyses [35,39].
This study used an Olympus Delta PXRF analyzer (Olympus Innov-X, Waltham, MA, USA), where the limit of detection is 1 to 3 mg/kg for As, 2 to 5 mg/kg for Zn and Pb, 3 to 7 mg/kg for Cu, and 8 to 15 mg/kg for Cd. The device is featured with an X-ray tube operated at 10–40 kV and the high-resolution silicon drift detector with <165 eV. Quantitative analysis of the As content for needle samples followed the method 6200 in laboratory conditions [31]. We calibrated the instrument with a steel “316” calibration check reference coin before the measurements were made. The samples were scanned with a two-beam configuration mode, Geochem mode.
The metal and metalloid content was estimated by scanning for 60 s per soil sample. The As content was measured for three minutes for needle samples in direct contact with the instrument aperture to minimize X-ray energy loss [35,40]. The needle samples were stacked with length, width, and thickness of about 8 cm, 5 cm, and 0.5–1 cm, respectively, which are the same as those used for spectral measurements. For each sample, three readings were taken with the aperture repositioned at the same spot of the samples, and the average value of the three readings was used for the spectral analysis [33,35].
2.4. Spectral Analysis
The spectral reflectance values of the samples were measured with a Labspec 5100 portable spectrometer covering 350 to 2500 nm with a 3 to 6 nm spectral resolution. The instrument was optimized and calibrated with a white reference plate (LabSphere, Inc., North Sutton, NH, USA) before the measurements were made. Measuring spectral reflectance of pine needles has been difficult due to the small area of contact with the aperture of the instrument [41]. The optical properties of pine needles in previous researches have been obtained by stacking the needles with a layer of uniform thickness [22,42]. This method was often combined with the contact probe [41,42]. In this study, the contact probe mode (Analytical Spectral Devices Inc., Boulder, CO, USA) was used to acquire spectral reflectance of pine needles at the same spot where PXRF measurements were taken. The needle samples were positioned on a black surface to reduce background upwelling radiation through the pine needles [22,43]. A stack of pine needles was positioned in parallel to fully cover the field of view of the contact probe, resulting in a uniform reflection condition [22]. Three measurements of reflectance spectra were conducted for each sample, and the acquired spectral reflectance values were averaged [22,30,44].
The averaged spectra were used for comparative analysis of spectral variations between As contaminated and control pine needles. The independent sample t-test was carried out to verify a statistical difference between the As contaminated and control spectra. The spectral data were examined with Kolmogorov-Smirnov test for normality and Levene’s test for homogeneity of variances. The statistical significance for the selection of the null hypothesis or the alternative hypothesis was set to 0.05. Statistical tests were performed in the Statistical Package for the Social Sciences (SPSS hereafter, Version 24.0, SPSS Inc., Chicago, IL, USA). We also calculated reflectance differences between contaminated pine needles and control pine needles (RDC hereafter) to enhance the spectral response of the As content by removing the intrinsic spectral characteristics of pine needles.
The first derivative (FD hereafter) and the continuum removal (CR hereafter) of the spectra were calculated in addition to the spectral values [45]. The FD transformation can reduce additive constant and background effects and enhance weak signals and spectrum inflection characteristics [46,47,48]. First, the acquired raw reflectance spectra were smoothed by the Savitzky-Golay convolution method with the least-squares fitting [47]. The smoothing was applied to the condition of a second order polynomial on 25 smoothing points [48]. The smoothed spectra was then converted to the FD spectra using the Savitzky-Golay differential method. The derivatives were calculated using a second order polynomial fitted over 3 points [45,47]. The smoothing and differentiation was applied using Unscrambler X software (version 10.4, Camo software, Oslo, Norway).
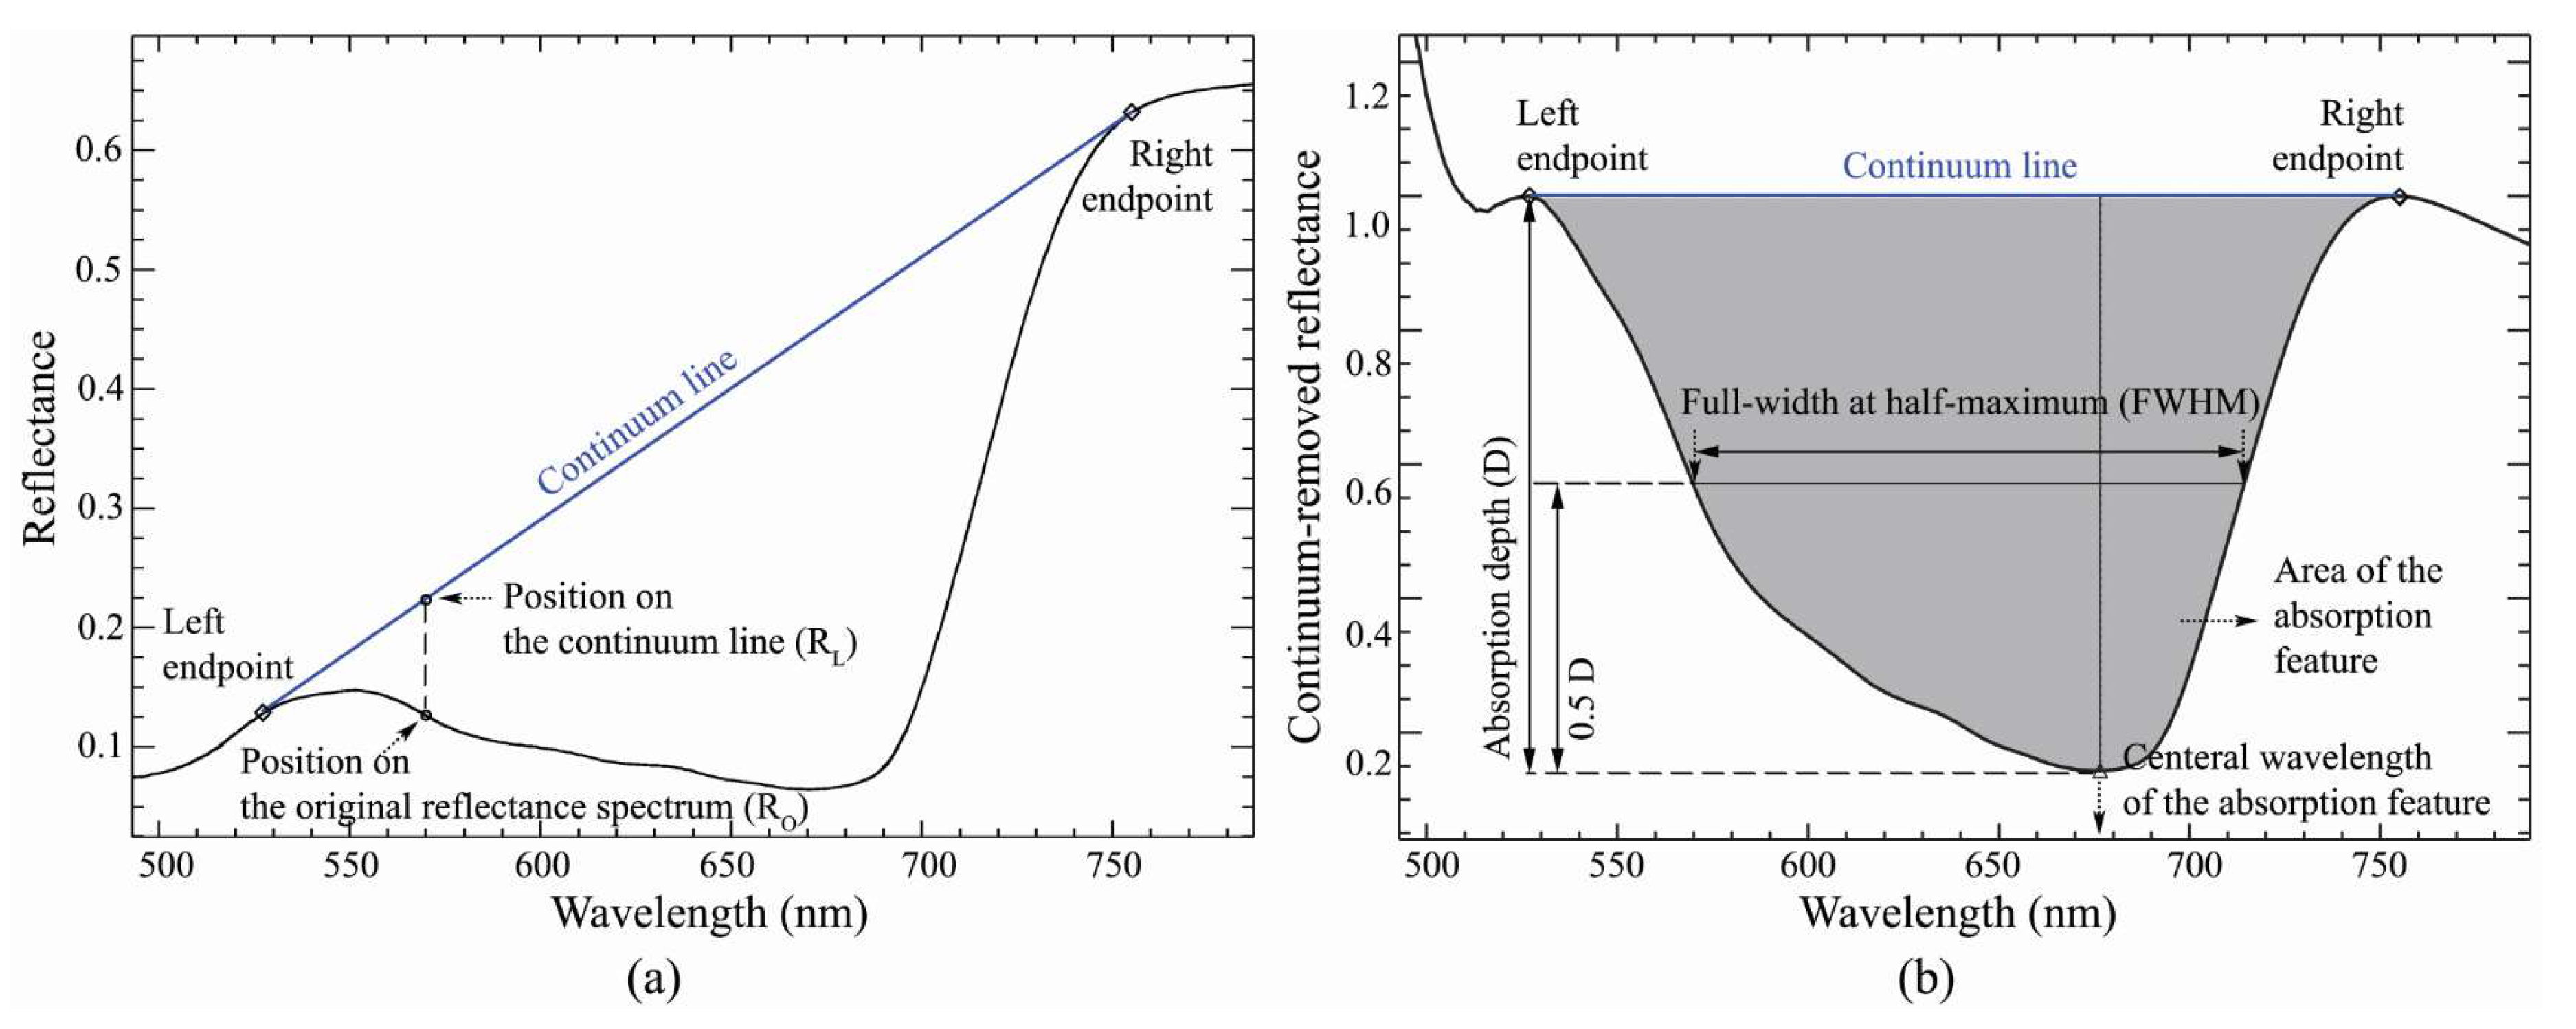
The CR method amplifies the minor absorption characteristics expressed by the specific material by linking the absorption feature with a straight continuum line [46]. The continuum line is defined as the line connecting the left and right endpoints of the absorption characteristics (Figure 2a). The endpoints have the highest reflectance values around the absorption feature of the interest. The CR (RC) is calculated by dividing the original reflectance spectrum (RO) by the value of corresponding position on the continuum line (RL) for all the wavelength region of absorption feature [49]:
The CR of the pine needle spectra was then calculated as parameters describing the absorption feature of the interest. We used the PRISM (Processing Routines in IDL for Spectroscopic Measurements) software to analyze spectral features [49]. PRISM automatically adjusts the left and right endpoints of the absorption feature, and computes the parameters of the continuum-removed feature such as band center, band depth, band area, and the full-width at half maximum (FWHM hereafter). Figure 2b shows an example of absorption feature parameters established by PRISM. We applied the PRISM to the visible spectrum of pine needles to analyze the As stress. Many studies have reported that the reflectance of the visible region is closely related to the metal and metalloid stress of a plant [9,12,30,50].
2.5. Wavelength Selection and Regression Model Development
To select the best wavelengths associated with As content in pine needles, a correlogram was constructed based on the correlation (Pearson’s correlation coefficient, r hereafter) between RDC and As content. Apart from the RDC, the correlation was also computed for the FD. Based on the correlogram, the wavelength regions with high correlation coefficients (|r| > 0.6) were selected as explanatory variables [7]. This procedure would make the regression model more reliable [51].
To develop and validate the regression model, the 92 spectra were divided into two subsets: a calibration (62 samples) and a validation subset (30 samples). The stepwise regression method in the SPSS was applied to find the best variable combination. The regression models were constrained to use the explanatory variables with probability values (p hereafter) less than 0.05 and a variance inflation factor (VIF hereafter) less than 10 to prevent multicollinearity problems in independent variables [7,52]. The regression models with maximum coefficients of determination (R2C hereafter) and the minimum root mean squared error of calibration (RMSEC hereafter) were chosen as the best-fit prediction model.
The validation subset was used to test the prediction accuracy of the best models. The validation results were assessed by the coefficients of determination (R2V hereafter) and root mean squared error of validation (RMSEV hereafter) [53]. In addition to the assessment parameters, the additional error measures were performed using the standard error of prediction (SEP hereafter) and the residual predictive deviation (RPD hereafter) from the validation set, based on the following equations [54,55,56]:
where n is the number of samples, Yi_predicted and Yi_measured are the predicted and measured values for As from the ith calibration model, and Cstdev is the standard deviation of As contents (mg/kg). The increase of the RPD values indicates an improvement in the prediction accuracy. The error assessment was evaluated based on three categories: RPD < 1.4 or R2V < 0.5 means poor prediction models which are not recommended; 1.4 < RPD < 2.0 or 0.5 < R2V <0.8 means acceptable prediction models; RPD > 2.0 or R2V > 0.8 means excellent prediction models [57].
3. Results
3.1. Arsenic Content of Pine Needle Samples
We analyzed the As content in the needles of pine trees dwelling in As and heavy metal contaminated soils of an abandoned mine. The As content of pine needles are summarized in Table 2. We scanned 163 sets of pine needles from 13 pine trees residing in the contaminated areas. Among them, As was detected in 92 sets of samples that accounted for 60% of the total contaminated samples. Arsenic was not detected in the rest, because their As content was below the limit of detection. Although As content of those sets were below the detection limit, those sets should be distinguished from the control sets and excluded from further study.
The contamination level of soils in the contaminated area and control area showed a distinct difference (Table 1). A high correlation (r = 0.94) between As content in the soil and the pine was also observed (Table 2). It indicates that the spectral response of pine needles in the contaminated area would include As enrichment effect in the soil.
The standard deviation of the three replicates from all acquired As data was calculated. As a result, the average standard deviation of As content was 1.0 mg/kg. The average content of As was 3.5 mg/kg (Table 2). The pine needles in the study area showed an average As content level of more than twice as high as the maximum normal range of plants (0.009–1.5 mg/kg) growing on non-contaminated soil [58]. The range of As content was large, from 1.0 to 11.7 mg/kg. In addition, the As content in the same tree showed a large variability. For example, the maximum/minimum ratio of T10 is 4. The inconsistency of the pine needle was also confirmed previously [59]. Therefore, in this research, we did the tests on the needle level instead of the tree level.
3.2. Spectral Characteristics of Arsenic Contaminated Pine Needles
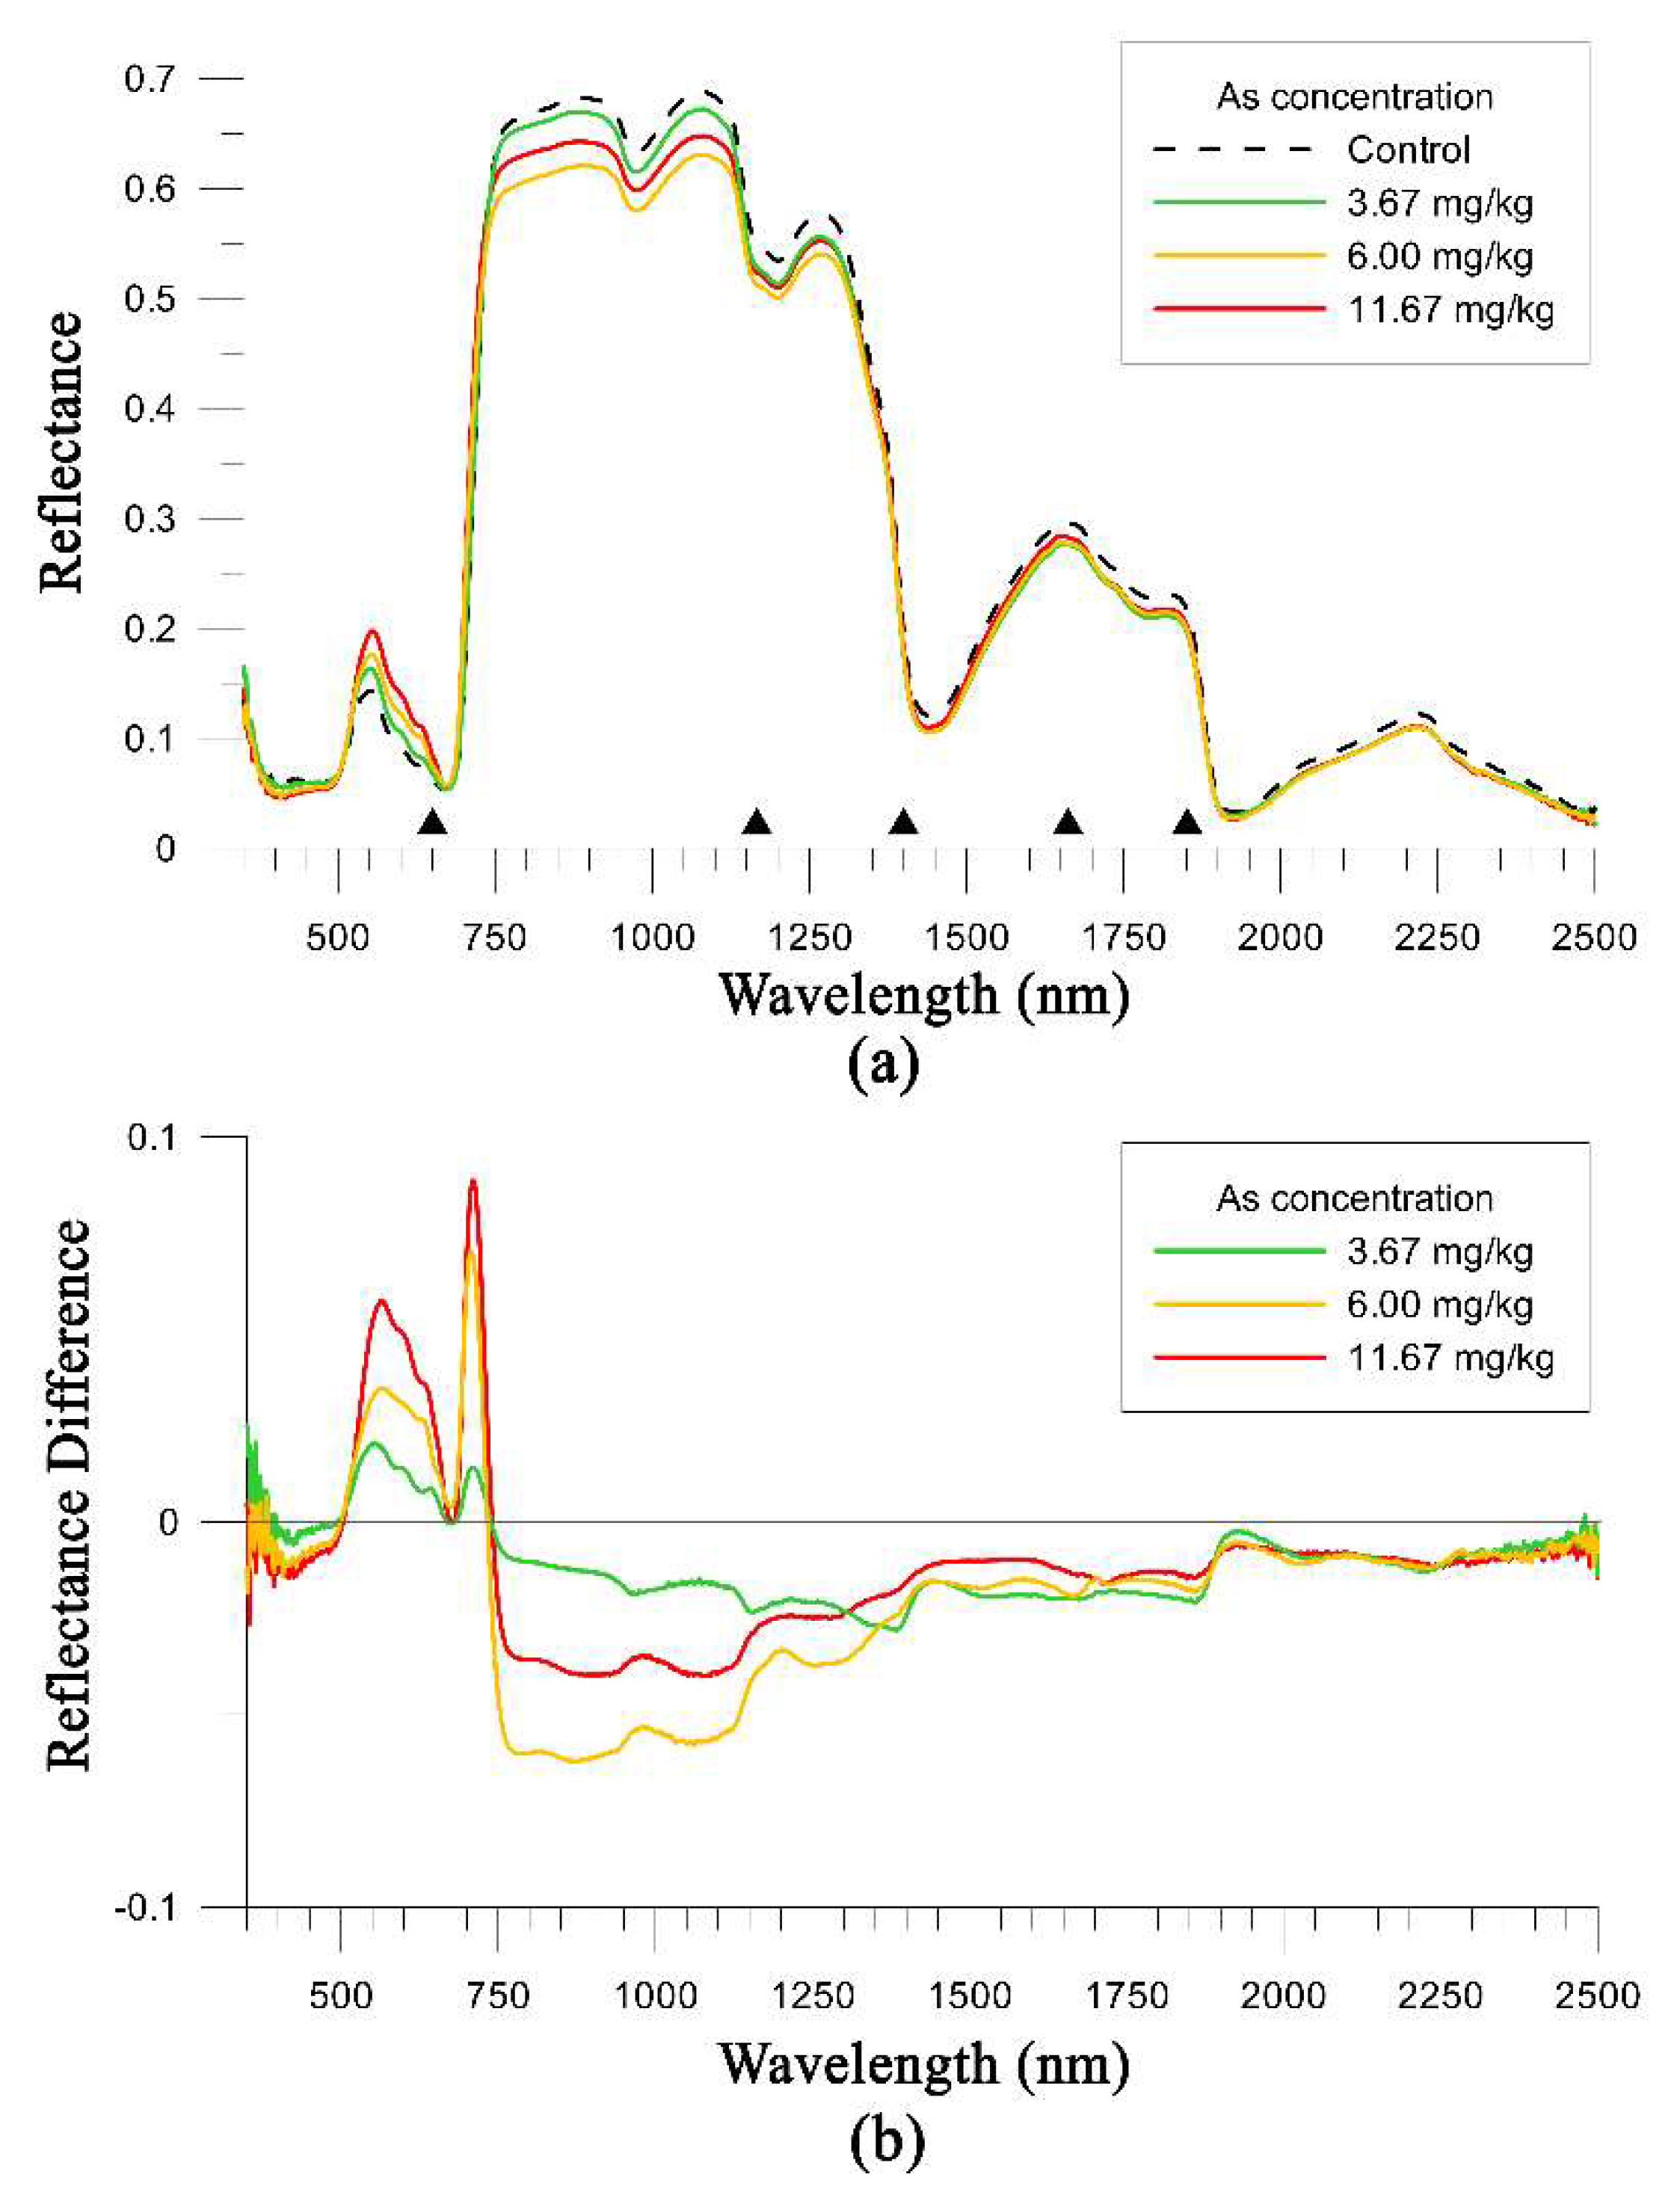
Spectral characteristics of pine needles induced by As stress were analyzed by comparative analysis between the average spectra of As contaminated and control samples (Figure 3a). The spectral signatures included commonly found spectral features of pine needles, such as absorption features within the blue (400–500 nm) and red regions (600–700 nm), and the green peak (550 nm) caused by chlorophyll and several carotenoids [30,60]. Furthermore, the spectra showed high NIR (700–1300 nm) reflectance caused by the internal cellular structure [7,15,16], minor water absorption features at 970 nm and 1200 nm, and major water absorption at 1450 nm and 1920 nm [59].
Figure 3b showed the RDC in the spectral range of 350–2500 nm. Reflectance variations to As contents were detected at 500–1400 nm. In the spectral region of 500–700 nm, an increase in the reflectance of pine needles associated with As content was observed near the green peak, red absorption band, and the red edge regions. However, the RDC curves showed no systematic relationship between infrared reflectance and As content. The t-test showed that statistically significant spectral differences were found near 650 nm, 1160 nm, 1350 nm, 1660 nm, and 1850 nm (Figure 3a).
3.3. Wavelength Selection
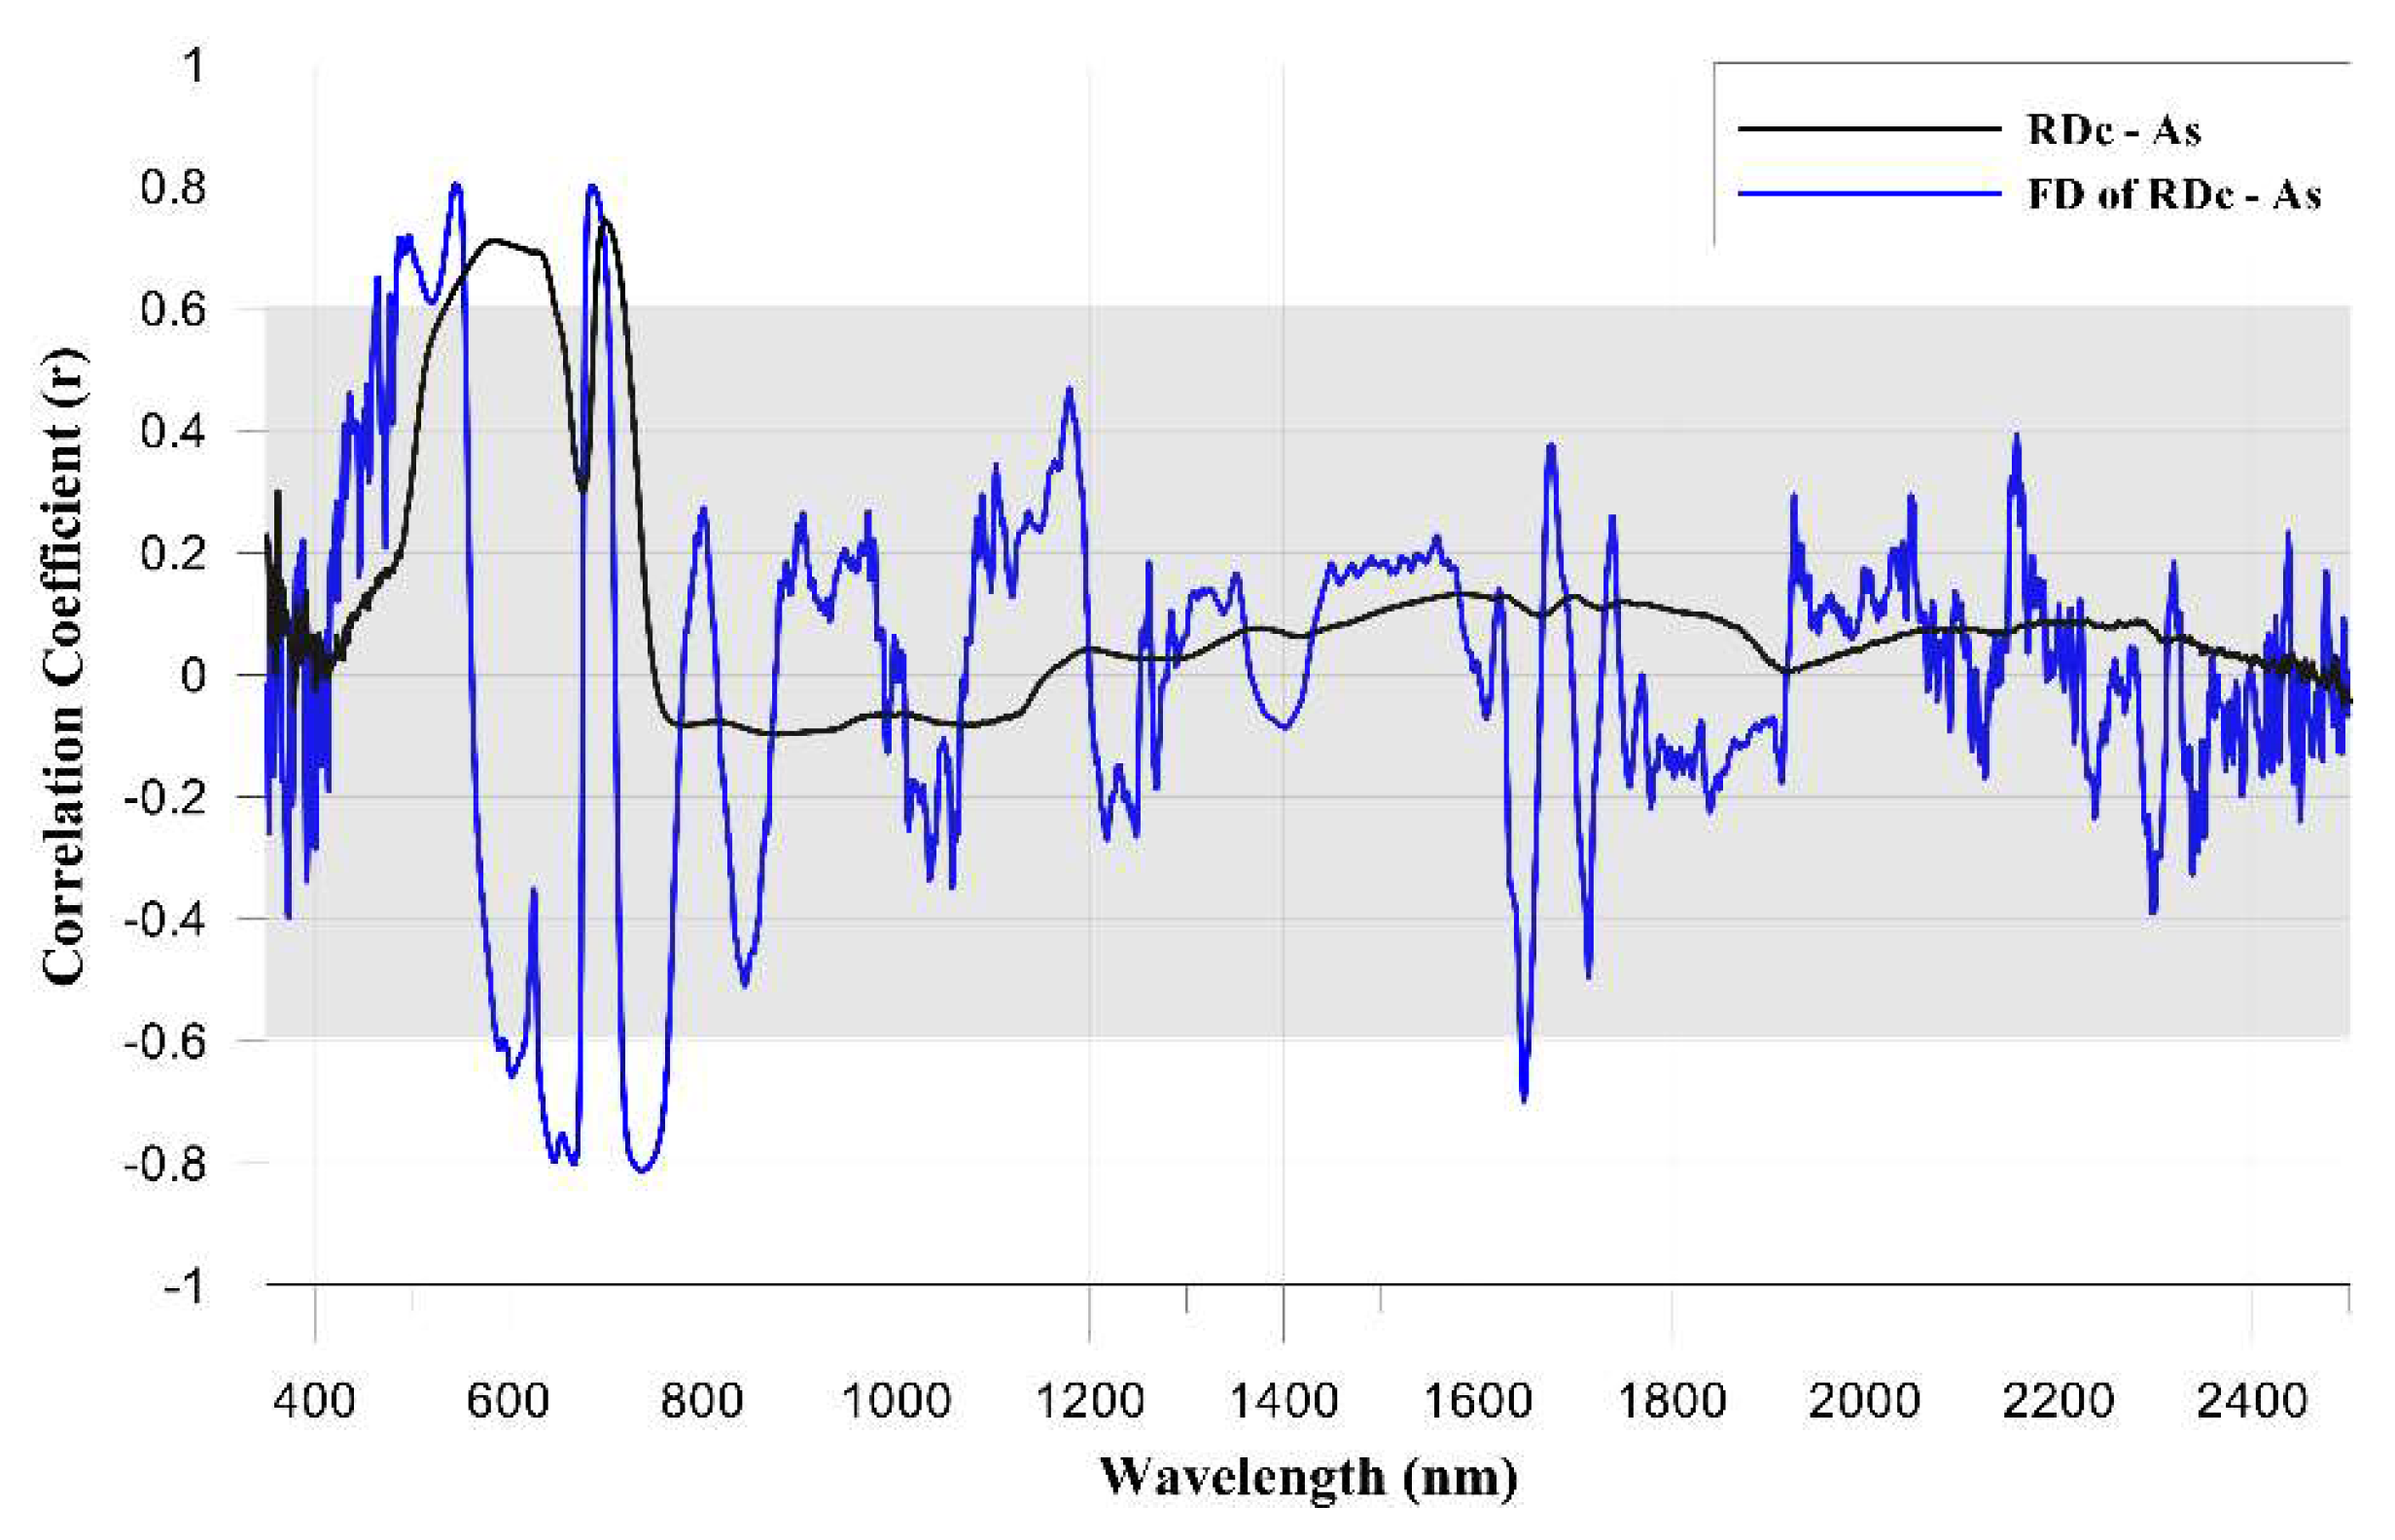
Correlation analysis between As content and the RDc of pine needles as well as its FD was carried out to select the most suitable wavelengths for the regression model development (Figure 4). A relatively high positive correlation (r > 0.6) between As content and the RDC was detected within the spectral regions of 535–648 nm and 690–719 nm (Table 3). The highest correlations were observed at 586 nm and 700 nm, with an r value of 0.71 and 0.74, respectively (Figure 4 and Table 3).
The correlation between As content and the FD of RDC alternated between a positive and negative relationship (Figure 4). Relatively high positive correlation regions were found at 463–466 nm, 478 nm, 484–554 nm, and 679–702 nm (Table 3). The spectral regions of 589–616 nm, 631–674 nm, and 717–764 nm showed a strong negative relationship. The highest correlations were detected at 545 nm (r = 0.80), 668 nm (r = −0.80), 686 nm (r = 0.80), and 738 nm (r = −0.81). In the shortwave infrared region, no significant correlation between As content and the FD of the RDC was detected except the spectral range from 1645–1652 nm. The strongest r value was −0.70 at 1648 nm (Table 3).
The spectral feature parameters of 500–800 nm showed a high correlation with As content in the left and right endpoints, FWHM, and feature area (Table 4). The left endpoint moved toward the longer wavelength and the right endpoint moved toward the shorter wavelength with increase in As content. It led to the systematic decrease in FWHM and feature area with As content. The |r| values of these parameters were higher than 0.76. It indicates that these spectral feature parameters are interconnected responding to the As stress. Among these spectral feature parameters, FWHM was the most sensitive to the As content (r = −0.85).
3.4. Regression Model Development and Validation
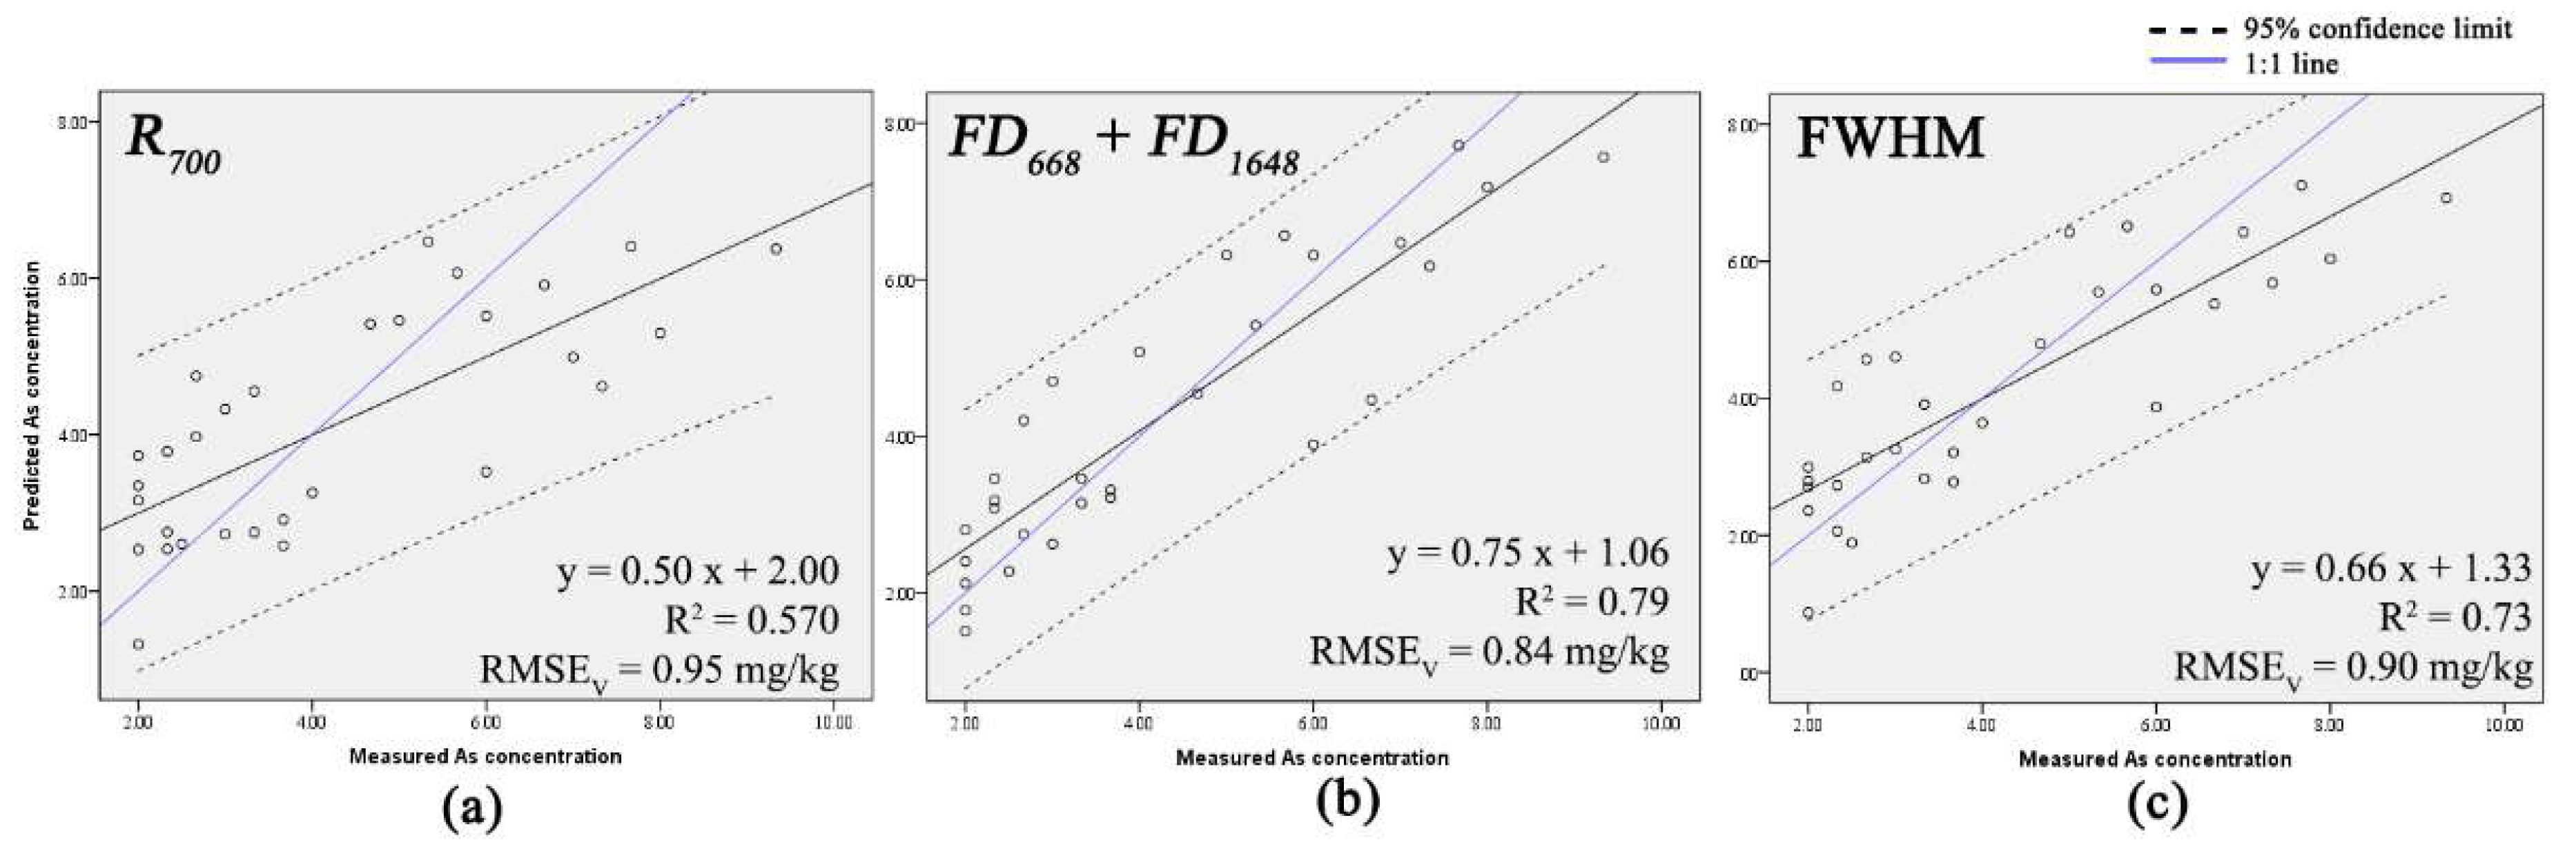
There were 62 calibration samples used for the empirical formula to predict As content. We tested and selected the best regression models using the significant spectral parameters for As content prediction in pine needles. As a result, two single regression models and one multiple regression model were derived (Table 5). The single regression models were derived from the RDC at 700 nm (R700 hereafter) and the FWHM of CR reflectance. The multiple regression model was based on the FDs of the RDC at 668 nm (FD668 hereafter) and 1648 nm (FD1648 hereafter). The VIF was 1.406, which was less than 10, indicating there was no multicollinearity.
Among the best-fit calibration models, the regression model using R700 exhibited the worst calibration results with highest RMSEC of 1.55 mg/kg and the lowest R2C of 0.55 (Table 5). The best model was the multiple regression model based on FD668 and FD1648 (R2C = 0.74, RMSEC = 1.18 mg/kg), followed by the model from the FWHM (R2C = 0.72, RMSEC = 1.23 mg/kg). The accuracy assessment from the validation dataset also confirmed the model selection results (Figure 5).
There were 30 validation samples used to validate the selected calibration models. The comparative analysis between the measured As content and predicted As content derived from the spectral parameters revealed that all regression models had RPD > 1.4 and R2V > 0.5 (Figure 5 and Table 5). The regression model using R700 had the worst accuracy with the validation slope of 0.5 and R2V of 0.57. Also, the values of RMSEV and SEP were the highest, and the prediction error of As content was the largest. Regression models using FD668 and FD1648 showed the strongest statistical significance among the models with the best validation slope and R2V, minimum RMSEV and SEP. In particular, the RPD of this model exceeded 2.0. The prediction model using the FWHM showed moderate predictability and standard error of As content.
4. Discussion
The PXRF analysis showed that soils in the study area were seriously contaminated with As and heavy metals (Table 1). Arsenic was detected in the pine needles grown in the contaminated area (Table 2). This phenomenon might be associated with the As uptake mechanism of pine trees. Kopačková et al. [61] analyzed the transfer of chemical elements (e.g., Cu, Zn, and As) in a soil-plant system, and found that the As content in the needle of spruce trees was highly correlated with the soil’s As content. It is known that As has high bioavailability in herbaceous plants and coniferous trees [3,61,62]. This study confirmed the high correlation between As content in pine needles and soils. Recent reports revealed that plants absorb arsenous acid via aquaporins because of the similar chemical characteristics with silicic acid, a bio-stimulant for plant growth [63,64]. Absorbed arsenate from the root is immediately reduced to arsenite, complexed with thiol peptides or transferred to shoots [1,65]. This phenomenon would make a clear difference in As content between the samples in the contaminated areas and control areas in this study. The t-test results confirmed that spectra between contaminated and control pine needles are statistically different (Figure 3a). The difference between these two groups indicated the physical and chemical changes of the needles caused by the As content.
The correlogram showed that the reflectance within spectral region of 535–648 nm and 690–719 nm was positively correlated with the As content in needles (Figure 4 and Table 3). This spectral range is closely related to chlorophyll content [15,59,66]. This implies that the uptake of As could reduce the chlorophyll content in pine needles. These findings are in agreement in previous studies. Collins et al. [21] reported that coniferous trees found in mineralized areas have a higher reflectance in the green band (500–600 nm) compared to those from non-mineralized areas. Sabins [67] also observed an increase in the green and red band reflectance for plants in higher metal and metalloid concentrated soils.
Higher correlation coefficients between As content and the FD spectra were observed near 545 nm, 668 nm, 686 nm, and 738 nm (Figure 4 and Table 3). The FD spectra were more closely related to As content than to the reflectance spectra. A greater statistical significance between As content and FD spectra was consistent with the results of Slonecker et al. [24]. Noticeably, the correlation curve dramatically changed from positive to negative near the green peak and red edge region (Figure 4). This indicates that an increase in the As content changed the slope of the blue edge and the red edge and eventually caused a blue-shift. The changes in correlation of FD near the red edge region are strongly related to chlorophyll content [52]. Curran et al. [68] found a high correlation (R2 = 0.91) between chlorophyll content and the blue-shift of the red edge position (REP hereafter) for slash pine. The blue-shift of REP under the metal and metalloid stress has also been reported in herbaceous plants growing in heavily metal contaminated soil [7,12]. Our result confirmed that As content in pine needles contributed to the reduction of chlorophyll content.
Within the shortwave infrared region, the FD of 1645–1652 nm also showed a significant correlation with As content (Figure 4 and Table 3). The wavelengths near 1650 nm are associated with phenolic compounds and lignin [46,69]. Conifers have a high foliar phenolic ratio of 7.3%–12.3% to carbon content of trees [70]. Phenolic compounds are known as heterogeneous groups that protect against environmental stress conditions [61]. Lignin, a structural compound of polyphenolics nature, also plays an important role in litter composition and nutrient cycling in needles [71]. In addition, the spectral region was known for a spectral band sensitivity to metal and metalloid stress and moisture [72]. Therefore, the first derivative value near 1650 nm, which is closely related to phenolic compounds and lignin, may be useful for an As-stress stress marker.
Two single regression models using R700 and FWHM were constructed to predict As content in pine needles (Figure 5). The R700 and FWHM included the green and red bands related to plant pigments. The RPDs of the two models were above 1.4 (Table 5), indicating that all constructed models are statistically acceptable [57]. The model based on FWHM had a higher prediction accuracy for As content than R700 had with a high RPD and a low SEP (Table 5). The t-test results revealed that the reflectance spectra between the control and contaminated needles were statistically different at 650 nm (Figure 3a). It confirms that the spectral variation presented at FWHM could be useful as an indicator of indirect As stress in pine needles.
In addition to the visible bands, FD668 and FD1648 were used to derive multiple regression models covering infrared bands (Figure 5). The regression model had RPD > 2.0, indicating an excellent prediction model [57] (Table 5). Given the fact that these bands had a clear difference between the control and the contaminated spectra (Figure 3a) and a high correlation with As content (Figure 4), the regression model employed the most suitable bands of FD668 and FD1648 for detecting As content. Infrared regions are closely related to internal architecture and chemistry of leaves [19,24,50]. Indeed, previous studies reported that infrared regions are preferred for detection of metal and metalloid stresses while the visible region is sensitive to not only the metal and metalloid stress but also various stresses in plant associated with pigments [23,24]. For example, Sridhar et al. [19,73] noted that the combination of red edge and infrared regions is more feasible for monitoring As and heavy metal contamination in Chinese brake fern and barley plants growing in contaminated soil. We found the same phenomenon in conifer trees that the stress by As content was measurable in both visible and infrared bands. Given the fact that the multiple regression model showed the highest prediction accuracy and the model incorporates factors of both visible and infrared bands, we introduce the most practical prediction model for As stress in pine needles as:
Although the multiple regression model was the most accurate from our analysis, in aerial remote sensing, the use of mid-infrared bands is often limited in practice because the most common design of the sensor for aerial surveys is the VNIR bands. Therefore, we suggested the prediction model based on FWHM as an alternative model using only VNIR bands for predicting As content in pine needles. The FWHM incorporated more stress sensitive spectra induced by a decrease in foliar pigment with As content (Table 4), and thus the prediction accuracy was higher than the model based on R700.
The previous studies on As contamination prediction models dealt with herbaceous plants where the experimental setting is relatively easier than trees. The As prediction models developed for rice [3,4,9], spinach [23], and Pteris fern [24] was not well applicable to pine needles as we tested the statistical significance using our data. This result indicates that the leaf surface reflectance varies by leaf types such as herbaceous, broadleaved and coniferous species [22,74]. Therefore, the spectral indices for As stress prediction should be developed according to the specific plant type. This study is one of the few experiments conducted for conifers with As stress.
Arsenic uptake in pine needles was more viable than other heavy metals, and As was accompanied by other metal and metalloid elements (Table 1 and Table 2). Moreover, the As content in soil and pine needles showed a significant correlation (Table 2). Given the fact that As is considered not only as a metal and metalloid contamination agent but also as an indicative element in gold ore deposits [75,76,77,78], we anticipate the As stress index suggested in this study will be useful for the detection of As contamination in soils associated with As and heavy metal contamination and/or mineralization. In this study, measured arsenic data should be considered semi-quantitative due to lack of evaluation of QA/QC and elemental interferences. For quantitative evaluation of As content, it is necessary to compare PXRF and wet chemical analysis methods for a subset of samples in future studies. However, this study may be useful for quick scanning in the field and remote sensing applications. Moreover, we only looked at the spectral response to As content. However, the spectral parameters may also include the influence of other factors in the soil (including other metals such as Pb, Cd, Zn, and Cu). In order to separate the single As effect from other metal factors, it is necessary to conduct a further analysis such as a pot experiment. We have to acknowledge the results reported from this study were only based on pine needles of P. densiflora sampled from a limited area. It is necessary to investigate other species of conifers to define the general phenomenon. Nonetheless, our work could serve as a pilot study pointing in a direction to demonstrate the feasibility of the methods we used.
5. Conclusions
We investigated the spectral response to the As content of P. densiflora needles that grew near an abandoned mine and evaluated the prediction power of the spectral bands for As content estimation. The As contents of the pine needles and the soil underneath were highly correlated. This indicates transfer of As from soils to pine needles. The As content of pine needles showed large variations, even for the needles sampled from the same tree. This implies that the As contents cannot be modelled at the tree level (e.g. one sample from one tree). The observed spectral changes of pine needles induced by As stress included an increase in reflectance near the green peak, the red absorption band, and the red edge regions. Correlation analysis between the As content and the RDC revealed that 545 nm, 586 nm, 668 nm, 686 nm, 700 nm, 738 nm, and 1648 nm were the best suited wavelengths for the prediction models of As content in pine needles. Moreover, spectral feature parameters of 500–800 nm made by the neighboring green peak and the red edge showed a systematic variation in the left and right endpoints, FWHM, and feature area. Based on the wavelength selection, two simple regression models and one multiple regression model were derived. The single regression models include the regression models for the R700 and the FWHM of CR reflectance. Multiple linear regression model was constructed based on the combinations of FD668 and FD1648. The models suggested in this study were statistically valid with RPD > 1.4.
We suggested that the most useful model for As content prediction in pine needles was the multiple regression model using FD668 and FD1648. It combines stress sensitive spectra induced by a decrease in foliar pigment and the As stress sensitive spectra associated with changes in internal structures. Furthermore, we presented a suboptimal regression model employing the FWHM. The simple models were reasonably accurate with only one variable to be obtained from the sensors. Given the fact that As content in soil and pine needles showed a high correlation, the As stress index is expected to be useful in the detection of As contamination in soils associated with As and heavy metal contamination and/or mineralization in coniferous forest This study is one of rare studies provided prediction models for As content for coniferous trees, while further study is necessary to confirm general spectral response of all coniferous trees.
Author Contributions
Conceptualization, J.Y. and J.H.S.; methodology, J.Y. and J.H.S.; software, J.H.S.; validation, J.Y., J.K., and L.W.; formal analysis, J.H.S.; investigation, J.Y., J.H.S., and L.W.; resources, J.H.S.; data curation, J.H.S. and J.K.; writing—original draft preparation, J.H.S. and J.Y.; writing—review and editing, L.W.; visualization, J.H.S. and J.K.; supervision, J.Y.; project administration, J.Y. and S.-M.K.; funding acquisition, J.Y. and S.-M.K.
Funding
This study was supported by the National Research Foundation of Korea Grant, funded by the Korean Government under Grant NRF-2017R1D1A1A02018524 and NRF-2018R1A4A1059956.
Conflicts of Interest
The authors declare no conflict of interest.
References
- Alloway, B.J. Sources of heavy metals and metalloids in soils. In Heavy Metals in Soils: Trace Metals and Metalloids in Soils And their Bioavailability, 3rd ed.; Alloway, B.J., Ed.; Springer: Dordrecht, The Netherlands, 2013; pp. 11–50. [Google Scholar]
- Nagajyoti, P.C.; Lee, K.D.; Sreekanth, T.V.M. Heavy metals, occurrence and toxicity for plants: A review. Environ. Chem. Lett. 2010, 8, 199–216. [Google Scholar] [CrossRef]
- Li, X.; Liu, X.; Liu, M.; Wang, C.; Xia, X. A hyperspectral index sensitive to subtle changes in the canopy chlorophyll content under arsenic stress. Int. J. Appl. Earth. Obs. Geoinf. 2015, 36, 41–53. [Google Scholar] [CrossRef]
- Shi, T.; Liu, H.; Wang, J.; Chen, Y.; Fei, T.; Wu, G. Monitoring arsenic contamination in agricultural soils with reflectance spectroscopy of rice plants. Environ. Sci. Technol. 2014, 48, 6264–6272. [Google Scholar] [CrossRef] [PubMed]
- KME (Korean Ministry of Environment). Final Report of Environmental Investigation for Abandoned Mine in Korea, 2007; Ministry of Environment: Sejong, Korea, 2007.
- Schwartz, G.; Eshel, G.; Ben-Dor, E. Reflectance spectroscopy as a tool for monitoring contaminated soils. In Soil Contamination; InTech: London, UK, 2011. [Google Scholar]
- Dunagan, S.C.; Gilmore, M.S.; Varekamp, J.C. Effects of mercury on visible/near-infrared reflectance spectra of mustard spinach plants (Brassica rapa P.). Environ. Pollut. 2007, 148, 301–311. [Google Scholar] [CrossRef] [PubMed]
- Von Steiger, B.; Webster, R.; Schulin, R.; Lehmann, R. Mapping heavy metals in polluted soil by disjunctive kriging. Environ. Pollut. 1996, 94, 205–215. [Google Scholar] [CrossRef]
- Shi, T.; Liu, H.; Chen, Y.; Wang, J.; Wu, G. Estimation of arsenic in agricultural soils using hyperspectral vegetation indices of rice. J. Hazard. Mater. 2016, 308, 243–252. [Google Scholar] [CrossRef]
- Hernández, A.J.; Pastor Piñeiro, J. Validated approaches to restoring the health of ecosystems affected by soil pollution. In Soil Contamination Research Trend; Domínguez, J.D., Ed.; Nova Science Publishers: New York, NY, USA, 2008; pp. 51–72. [Google Scholar]
- Choe, E.; van der Meer, F.; van Ruitenbeek, F.; van der Werff, H.; de Smeth, B.; Kim, K.W. Mapping of heavy metal pollution in stream sediments using combined geochemistry, field spectroscopy, and hyperspectral remote sensing: A case study of the Rodalquilar mining area, SE Spain. Remote. Sens. Environ. 2008, 112, 3222–3233. [Google Scholar] [CrossRef]
- Kooistra, L.; Salas, E.A.L.; Clevers, J.G.P.W.; Wehrens, R.; Leuven, R.S.E.W.; Nienhuis, P.H.; Buydens, L.M.C. Exploring field vegetation reflectance as an indicator of soil contamination in river floodplains. Environ. Pollut. 2004, 127, 281–290. [Google Scholar] [CrossRef]
- Lamine, S.; Petropoulos, G.P.; Brewer, P.A.; Bachari, N.-E.-I.; Srivastava, P.K.; Manevski, K.; Kalaitzidis, C.; Macklin, M.G.J.S. Heavy Metal Soil Contamination Detection Using Combined Geochemistry and Field Spectroradiometry in the United Kingdom. Sensors 2019, 19, 762. [Google Scholar] [CrossRef]
- Dobrota, C.; Lazar, L.; Baciu, C. Assessment of physiological state of Betula pendula and Carpinus betulus through leaf reflectance measurements. Flora 2015, 216, 26–34. [Google Scholar] [CrossRef]
- Rosso, P.H.; Pushnik, J.C.; Lay, M.; Ustin, S.L. Reflectance properties and physiological responses of Salicornia virginica to heavy metal and petroleum contamination. Environ. Pollut. 2005, 137, 241–252. [Google Scholar] [CrossRef]
- Danson, F.M.; Steven, M.D.; Malthus, T.J.; Clark, J.A. High-spectral resolution data for determining leaf water content. Int. J. Remote Sens. 1992, 13, 461–470. [Google Scholar] [CrossRef]
- Datt, B. Remote sensing of chlorophyll a, chlorophyll b, chlorophyll a+b, and total carotenoid content in eucalyptus leaves. Remote Sens. Environ. 1998, 66, 111–121. [Google Scholar] [CrossRef]
- Féret, J.B.; François, C.; Gitelson, A.; Asner, G.P.; Barry, K.M.; Panigada, C.; Richardson, A.D.; Jacquemoud, S. Optimizing spectral indices and chemometric analysis of leaf chemical properties using radiative transfer modeling. Remote Sens. Environ. 2011, 115, 2742–2750. [Google Scholar] [CrossRef] [Green Version]
- Sridhar, B.B.M.; Han, F.X.; Diehl, S.V.; Monts, D.L.; Su, Y. Spectral reflectance and leaf internal structure changes of barley plants due to phytoextraction of zinc and cadmium. Int. J. Remote Sens. 2007, 28, 1041–1054. [Google Scholar] [CrossRef]
- Yost, E.; Wenderoth, S. The reflectance spectra of mineralized trees (Visible and near IR reflectance spectra of soil mineralized trees, using multispectral photographic filters). In Proceedings of the 7th International Symposium on Remote Sensing of Environment, University of Michigan, Ann Arbor, MI, USA, 17–21 May 1971; pp. 269–284. [Google Scholar]
- Collins, W.; Chang, S.H.; Raines, G.L.; Canney, F.; Ashley, R. Airborne biogeophysical mapping of hidden mineral deposits. Econ. Geol. 1983, 78, 737–749. [Google Scholar] [CrossRef]
- Kupková, L.; Potůčková, M.; Zachová, K.; Lhotáková, Z.; Kopačková, V.; Albrechtová, J. Chlorophyll Determination in silver birch and scots pine foliage from heavy metal polluted regions using spectral reflectance data. EARSeL E-Proc. 2012, 11, 64–73. [Google Scholar]
- Bandaru, V.; Hansen, D.J.; Codling, E.E.; Daughtry, C.S.; White-Hansen, S.; Green, C.E. Quantifying arsenic-induced morphological changes in spinach leaves: Implications for remote sensing. Int. J. Remote Sens. 2010, 31, 4163–4177. [Google Scholar] [CrossRef]
- Slonecker, T.; Haack, B.; Price, S. Spectroscopic analysis of arsenic uptake in Pteris ferns. Remote Sens. 2009, 1, 644–675. [Google Scholar] [CrossRef]
- Farjon, A. Pinus Densiflora. Available online: http://dx.doi.org/10.2305/IUCN.UK.2013-1.RLTS.T42355A2974820.en (accessed on 1 August 2018).
- Herawati, N.; Suzuki, S.; Hayashi, K.; Rivai, I.F.; Koyama, H. Cadmium, copper, and zinc levels in rice and soil of Japan, Indonesia, and China by soil type. Bull. Environ. Contam. Toxicol. 2000, 64, 33–39. [Google Scholar] [CrossRef]
- Liu, Y.; Li, W.; Wu, G.; Xu, X. Feasibility of estimating heavy metal contaminations in floodplain soils using laboratory-based hyperspectral data—A case study along Le’an River, China. Geo. Spat. Inf. Sci. 2011, 14, 10–16. [Google Scholar] [CrossRef]
- KMA (Korean Meteorological Administration). Annual Climatological Report; Korean Meteorological Administration: Seoul, Korea, 2017.
- Shin, J.H.; Yu, J.; Wang, L.; Kim, J.; Koh, S.-M.; Kim, S.-O. Spectral Responses of Heavy Metal Contaminated Soils in the Vicinity of a Hydrothermal Ore Deposit: A Case Study of Boksu Mine, South Korea. IEEE Trans. Geosci. Remote. Sens. 2019, 57, 4092–4106. [Google Scholar] [CrossRef]
- Liu, Y.; Chen, H.; Wu, G.; Wu, X. Feasibility of estimating heavy metal concentrations in Phragmites australis using laboratory-based hyperspectral data—A case study along Le’an River, China. Int. J. Appl. Earth. Obs. Geoinf. 2010, 12, S166–S170. [Google Scholar] [CrossRef]
- U.S. Environ. Protection Agency. Method 6200: Field Portable X-ray Fluorescence Spectrometry for the Determination of Elemental Concentrations in Soil and Sediment; U.S. Environ. Protection Agency: Washington, DC, USA, 2007. Available online: https://www.epa.gov/sites/production/files/2015-12/documents/6200.pdf (accessed on 22 August 2018).
- NIOSH. Method No. 7702: Lead by Field Portable XRF, 4th ed.; National Institute for Occupational Safety and Health (NIOSH): Cincinnati, OH, USA, 1998. Available online: https://www.cdc.gov/niosh/docs/2003-154/pdfs/7702.pdf (accessed on 1 August 2018).
- Hu, W.; Huang, B.; Weindorf, D.C.; Chen, Y. Metals analysis of agricultural soils via portable X-ray fluorescence spectrometry. Bull. Environ. Contam. Toxicol. 2014, 92, 420–426. [Google Scholar] [CrossRef]
- Melquiades, F.L.; Appoloni, C.R. Application of XRF and field portable XRF for environmental analysis. J. Radioanal. Nucl. Chem. 2004, 262, 533–541. [Google Scholar] [CrossRef]
- Sacristán, D.; Rossel, R.A.V.; Recatalá, L. Proximal sensing of Cu in soil and lettuce using portable X-ray fluorescence spectrometry. Geoderma 2016, 265, 6–11. [Google Scholar] [CrossRef]
- Weindorf, D.C.; Zhu, Y.; Chakraborty, S.; Bakr, N.; Huang, B. Use of portable X-ray fluorescence spectrometry for environmental quality assessment of peri-urban agriculture. Environ. Monit. Assess. 2012, 184, 217–227. [Google Scholar] [CrossRef]
- Weindorf, D.C.; Zhu, Y.; McDaniel, P.; Valerio, M.; Lynn, L.; Michaelson, G.; Clark, M.; Ping, C.L. Characterizing soils via portable x-ray fluorescence spectrometer: 2. Spodic and Albic horizons. Geoderma 2012, 189, 268–277. [Google Scholar] [CrossRef]
- Ulmanu, M.; Anger, I.; Gament, E.; Mihalache, M.; Plopeanu, G.; Ilie, L. Rapid determination of some heavy metals in soil using an X-ray fluorescence portable instrument. Res. J. Agric. Sci. 2011, 43, 235–241. [Google Scholar]
- Reidinger, S.; Ramsey, M.H.; Hartley, S.E. Rapid and accurate analyses of silicon and phosphorus in plants using a portable X-ray fluorescence spectrometer. New Phytol. 2012, 195, 699–706. [Google Scholar] [CrossRef]
- Kalnicky, D.J.; Singhvi, R. Field portable XRF analysis of environmental samples. J. Hazard. Mater. 2001, 83, 93–122. [Google Scholar] [CrossRef] [Green Version]
- Rautiainen, M.; Lukeš, P.; Homolova, L.; Hovi, A.; Pisek, J.; Mottus, M. Spectral properties of coniferous forests: A review of in situ and laboratory measurements. Remote Sens. 2018, 10, 207. [Google Scholar] [CrossRef]
- Daughtry, C.; Biehl, L.L. Changes in Spectral Properties of Detached Leaves; LARS Tech. Report 061584; Purdue University Laboratory for Applications of Remote Sensing: West Lafayette, IN, USA, 1984. [Google Scholar]
- Eitel, J.U.; Gessler, P.E.; Smith, A.M.; Robberecht, R. Suitability of existing and novel spectral indices to remotely detect water stress in Populus spp. For. Ecol. Manage. 2006, 229, 170–182. [Google Scholar] [CrossRef]
- Hong-Yan, R.E.N.; Zhuang, D.F.; Singh, A.N.; Jian-Jun, P.A.N.; Dong-Sheng, Q.I.U.; Run-He, S.H.I. Estimation of As and Cu contamination in agricultural soils around a mining area by reflectance spectroscopy: A case study. Pedosphere 2009, 19, 719–726. [Google Scholar] [CrossRef]
- Sanches, I.D.; Souza Filho, C.R.; Magalhães, L.A.; Quitério, G.C.M.; Alves, M.N.; Oliveira, W.J. Assessing the impact of hydrocarbon leakages on vegetation using reflectance spectroscopy. ISPRS J. Photogramm. Remote. Sens. 2013, 78, 85–101. [Google Scholar] [CrossRef]
- Kokaly, R.F.; Skidmore, A.K. Plant phenolics and absorption features in vegetation reflectance spectra near 1.66 μm. Int. J. Appl. Earth. Obs. Geoinf. 2015, 43, 55–83. [Google Scholar] [CrossRef]
- Savitzky, A.; Golay, M.J. Smoothing and differentiation of data by simplified least squares procedures. Anal. Chem. 1964, 36, 1627–1639. [Google Scholar] [CrossRef]
- Tsai, F.; Philpot, W. Derivative analysis of hyperspectral data. Remote Sens. Environ. 1998, 66, 41–51. [Google Scholar] [CrossRef]
- Kokaly, R.F. PRISM: Processing Routines in IDL for Spectroscopic Measurements (Installation Manual and User’s Guide, Version 1.0); Technical Report 2011-1155; US Geological Survey: Reston, VA, USA, 2011. [Google Scholar]
- Rathod, P.H.; Rossiter, D.G.; Noomen, M.F.; Van der Meer, F.D. Proximal spectral sensing to monitor phytoremediation of metal-contaminated soils. Int. J. Phytoremediat. 2013, 15, 405–426. [Google Scholar] [CrossRef]
- Wang, F.; Gao, J.; Zha, Y. Hyperspectral sensing of heavy metals in soil and vegetation: Feasibility and challenges. ISPRS J. Photogramm. Remote. Sens. 2018, 136, 73–84. [Google Scholar] [CrossRef]
- Yoder, B.J.; Pettigrew-Crosby, R.E. Predicting nitrogen and chlorophyll content and concentrations from reflectance spectra (400–2500 nm) at leaf and canopy scales. Remote Sens. Environ. 1995, 53, 199–211. [Google Scholar] [CrossRef]
- Chodak, M.; Niklińska, M.; Beese, F. Near-infrared spectroscopy for analysis of chemical and microbiological properties of forest soil organic horizons in a heavy-metal-polluted area. Biol. Fertil. Soils 2007, 44, 171–180. [Google Scholar] [CrossRef]
- Kemper, T.; Sommer, S. Estimate of heavy metal contamination in soils after a mining accident using reflectance spectroscopy. Environ. Sci. Technol. 2002, 36, 2742–2747. [Google Scholar] [CrossRef]
- Shi, T.; Cui, L.; Wang, J.; Fei, T.; Chen, Y.; Wu, G. Comparison of multivariate methods for estimating soil total nitrogen with visible/near-infrared spectroscopy. Plant. Soil 2013, 366, 363–375. [Google Scholar] [CrossRef]
- Vasques, G.M.; Grunwald, S.; Harris, W.G. Spectroscopic models of soil organic carbon in Florida, USA. J. Environ. Qual. 2010, 39, 923–934. [Google Scholar] [CrossRef]
- Chang, C.W.; Laird, D.A.; Mausbach, M.J.; Hurburgh, C.R. Near-infrared reflectance spectroscopy–principal components regression analyses of soil properties. Soil Sci. Soc. Am. J. 2001, 65, 480–490. [Google Scholar] [CrossRef]
- Kabata-Pendias, A.; Pendias, H. Trace Elements in Soil and Plants; CRC press: Boca Raton, FL, USA, 1984. [Google Scholar]
- Brackx, M.; Van Wittenberghe, S.; Verhelst, J.; Scheunders, P.; Samson, R. Hyperspectral leaf reflectance of Carpinus betulus L. saplings for urban air quality estimation. Environ. Pollut. 2017, 220, 159–167. [Google Scholar] [CrossRef]
- Carter, G.A.; Knapp, A.K. Leaf optical properties in higher plants: Linking spectral characteristics to stress and chlorophyll concentration. Am. J. Bot. 2001, 88, 677–684. [Google Scholar] [CrossRef]
- Kopačková, V.; Lhotáková, Z.; Oulehle, F.; Albrechtová, J. Assessing forest health via linking the geochemical properties of a soil profile with the biochemical parameters of vegetation. Int. J. Environ. Sci. Technol. 2015, 12, 1987–2002. [Google Scholar] [CrossRef]
- Kastori, R.; Plesničar, M.; Sakač, Z.; Panković, D.; Arsenijević-Maksimović, I. Effect of excess lead on sunflower growth and photosynthesis. J. Plant. Nutr. 1998, 21, 75–85. [Google Scholar] [CrossRef]
- Ma, J.F.; Yamaji, N.; Mitani, N.; Xu, X.-Y.; Su, Y.-H.; McGrath, S.P.; Zhao, F.-J. Transporters of arsenite in rice and their role in arsenic accumulation in rice grain. Proc. Natl. Acad. Sci. 2008, 105, 9931–9935. [Google Scholar] [CrossRef] [Green Version]
- Meharg, A.A.; Jardine, L. Arsenite transport into paddy rice (Oryza sativa) roots. New Phytol. 2003, 157, 39–44. [Google Scholar] [CrossRef]
- Zhao, F.J.; McGrath, S.P.; Meharg, A.A. Arsenic as a food chain contaminant: Mechanisms of plant uptake and metabolism and mitigation strategies. Annu. Rev. Plant. Biol. 2010, 61, 535–559. [Google Scholar] [CrossRef]
- Carter, G.A. Responses of leaf spectral reflectance to plant stress. Am. J. Bot. 1993, 80, 239–243. [Google Scholar] [CrossRef]
- Sabins, F.F. Remote sensing for mineral exploration. Ore. Geol. Rev. 1999, 14, 157–183. [Google Scholar] [CrossRef]
- Curran, P.J.; Dungan, J.L.; Gholz, H.L. Exploring the relationship between reflectance red edge and chlorophyll content in slash pine. Tree Physiol. 1990, 7, 33–48. [Google Scholar] [CrossRef]
- Foley, W.J.; McIlwee, A.; Lawler, I.; Aragones, L.; Woolnough, A.P.; Berding, N. Ecological applications of near infrared reflectance spectroscopy–a tool for rapid, cost-effective prediction of the composition of plant and animal tissues and aspects of animal performance. Oecologia 1998, 116, 293–305. [Google Scholar] [CrossRef]
- Aspinwall, M.J.; King, J.S.; Booker, F.L.; McKeand, S.E. Genetic effects on total phenolics, condensed tannins and non-structural carbohydrates in loblolly pine (Pinus taeda L.) needles. Tree Physiol. 2011, 31, 831–842. [Google Scholar] [CrossRef]
- Ushio, M.; Miki, T.; Kitayama, K. Phenolic control of plant nitrogen acquisition through the inhibition of soil microbial decomposition processes: A plant-microbe competition model. Microbes Environ. 2009, 24, 180–187. [Google Scholar] [CrossRef]
- Thenkabail, P.S.; Lyon, J.G.; Huete, A. Hyperspectral remote sensing of vegetation. In Advances in Hyperspectral Remote Sensing of Vegetation and Agricultural Croplands, 1st ed.; Thenkabail, P.S., Lyon, J.G., Huete, A., Eds.; CRC Press: Boca Raton, FL, USA, 2012; pp. 4–35. [Google Scholar]
- Sridhar, B.B.M.; Han, F.X.; Diehl, S.V.; Monts, D.L.; Su, Y. Monitoring the effects of arsenic and chromium accumulation in Chinese brake fern (Pteris vittata). Int. J. Remote Sens. 2007, 28, 1055–1067. [Google Scholar] [CrossRef]
- Sims, D.A.; Gamon, J.A. Relationships between leaf pigment content and spectral reflectance across a wide range of species, leaf structures and developmental stages. Remote Sens. Environ. 2002, 81, 337–354. [Google Scholar] [CrossRef]
- Wu, Y.; Chen, J.; Wu, X.; Tian, Q.; Ji, J.; Qin, Z. Possibilities of reflectance spectroscopy for the assessment of contaminant elements in suburban soils. Appl. Geochem. 2005, 20, 1051–1059. [Google Scholar] [CrossRef]
- Zhu, Y.; An, F.; Tan, J. Geochemistry of hydrothermal gold deposits: A review. Geosci. Front. 2011, 2, 367–374. [Google Scholar] [CrossRef] [Green Version]
- Yi, J.S.; Lee, J.M.; Chon, H.T. Chemical speciation of Arsenic in the water system from some abandoned Au-Ag mines in Korea. Econ. Environ. Geol. 2003, 36, 481–490. [Google Scholar]
- Kwon, J.C.; Park, H.J.; Jung, M.C. Correlation of Arsenic and Heavy Metals in Paddy Soils and Rice Crops around the Munmyung Au-Ag Mines. Econ. Environ. Geol. 2015, 48, 337–349. [Google Scholar] [CrossRef]
Figure 1.
An aerial photograph of the study area (Boksu Pb–Zn mine) showing sampling locations.
Figure 2.
Spectral absorption features in the range from 500 nm to 800 nm: (a) Continuum endpoints (diamonds) and continuum line (blue line), and (b) continuum-removed features describing the absorption depth, the full-width of feature at half-maximum absorption depth, wavelength position of the center of the feature (triangle), and area of the feature (grey-filled region).
Figure 3.
(a) The reflectance spectra for control and As-contaminated pine needles at three different levels of content, and (b) its RDc. Black triangles indicate wavelength at which the reflectance between control and As-contaminated spectra is statistically different at a significant level of 0.05.
Figure 4.
Correlogram of pine needles between the RDc and As content, and the FD of the RDc and As content.
Figure 4.
Correlogram of pine needles between the RDc and As content, and the FD of the RDc and As content.
Figure 5.
Comparison between the measured As content in experiments and the predicted As content derived from regression models: (a) validation model at R700, (b) validation model at FD668 and FD1648, and (c) validation model at FWHM.
Figure 5.
Comparison between the measured As content in experiments and the predicted As content derived from regression models: (a) validation model at R700, (b) validation model at FD668 and FD1648, and (c) validation model at FWHM.

Table 1.
Representative average content of As and heavy metal elements in soils for sampling sites and contamination limits prescribed in the soil environment conservation act in Korea (unit: mg/kg).
Table 1.
Representative average content of As and heavy metal elements in soils for sampling sites and contamination limits prescribed in the soil environment conservation act in Korea (unit: mg/kg).
| Average Content | Soil Contamination Limits 1 | |||||
|---|---|---|---|---|---|---|
| Tailing Dump 1 | Abandoned Minerals Processing Plant | Tailing Dump 2 | Control Sites | Warning Limits | Counter-Plan Limits | |
| As | 16,420 | 24,530 | 11,600 | 50 | 50 | 150 |
| Pb | 27,500 | 8250 | 5690 | 80 | 400 | 1200 |
| Zn | 16,050 | 8110 | 5580 | 420 | 600 | 1800 |
| Cu | 3710 | 2130 | 1660 | 320 | 500 | 1500 |
| Cd | 190 | 180 | 50 | - | 10 | 30 |
1 The soil contamination limits apply to Zone 2 depending on the purpose of land use. Zone 2 includes forests, salterns, building lots (nonresidential), warehouses, rivers, historic ruins, physical sites, recreational sites, and miscellaneous sites.
Table 2.
Arsenic contents of pine needles sampled from study sites (mg/kg).
| Statistics | Tailing Dump 1 | Abandoned Minerals Processing Plant | Tailing Dump 2 | Control | Total | ||||||||||
|---|---|---|---|---|---|---|---|---|---|---|---|---|---|---|---|
| T1 | T2 | T3 | T4 | T5 | T6 | T7 | T8 | T9 | T10 | T11 | T12 | T13 | T14-20 | ||
| No. of measurement | 7 | 10 | 8 | 2 | 4 | 19 | 14 | 29 | 23 | 19 | 19 | 6 | 3 | 23 | 186 |
| No. of detection | 2 | 0 | 1 | 0 | 0 | 2 | 10 | 23 | 21 | 17 | 16 | 0 | 0 | 0 | 92 |
| Mean | 1.5 | - | 2.0 | - | - | 2.7 | 5.5 | 3.0 | 7.3 | 4.1 | 2.3 | - | - | - | 3.5 |
| Min | 1.0 | - | 2.0 | - | - | 2.0 | 3.7 | 2.0 | 5.0 | 2.0 | 2.0 | - | - | - | 1.0 |
| Max | 2.0 | - | 2.0 | - | - | 3.3 | 7.0 | 4.7 | 11.7 | 8.0 | 3.0 | - | - | - | 11.7 |
The Pearson correlation coefficient of As content in the soil and the pine was 0.94 at significant level of 0.01.
Table 3.
Wavelength regions with the Pearson correlation coefficients (|r| > 0.6), strongest correlation wavelength of corresponding wavelength regions, and the strongest correlation coefficients of the strongest correlation wavelength.
Table 3.
Wavelength regions with the Pearson correlation coefficients (|r| > 0.6), strongest correlation wavelength of corresponding wavelength regions, and the strongest correlation coefficients of the strongest correlation wavelength.
| Wavelength Region (nm) | Strongest Correlation Spectrum (nm) | Strongest Correlation Coefficient |
|---|---|---|
| RDc | ||
| 535–648 | 586 | 0.71 |
| 690–719 | 700 | 0.74 |
| FD of RDc | ||
| 463–466 | 465 | 0.65 |
| 478 | 478 | 0.62 |
| 484–554 | 545 | 0.80 |
| 589–616 | 603 | –0.66 |
| 631–674 | 668 | –0.80 |
| 679–702 | 686 | 0.80 |
| 717–764 | 738 | –0.81 |
| 1645–1652 | 1648 | –0.70 |
Table 4.
Correlation coefficient (r) matrix between As content and spectral parameters of red absorption derived from continuum-removed spectra.
Table 4.
Correlation coefficient (r) matrix between As content and spectral parameters of red absorption derived from continuum-removed spectra.
| As Content | Left Endpoint | Right Endpoint | Central Feature Position | Feature Depth | Feature FWHM | Feature Area | |
|---|---|---|---|---|---|---|---|
| As content | 1.00 | 0.76 ** | −0.80 ** | 0.32 ** | −0.27 ** | −0.85 ** | −0.80 ** |
| Left endpoint | 1.00 | −0.83 ** | 0.38 ** | −0.13 | −0.85 ** | −0.76 ** | |
| Right endpoint | 1.00 | -0.24 * | 0.23 * | 0.92 ** | 0.85 ** | ||
| Central feature position | 1.00 | −0.30 ** | −0.37 ** | −0.43 ** | |||
| Feature depth | 1.00 | 0.36 ** | 0.61 ** | ||||
| Feature FWHM | 1.00 | 0.96 ** | |||||
| Feature area | 1.00 |
** Correlation is significant at the 0.01 level; * Correlation is significant at the 0.05 level.
Table 5.
Statistical results of the regression models using calibration and validation subset for the needle spectral parameters.
Table 5.
Statistical results of the regression models using calibration and validation subset for the needle spectral parameters.
| Spectral Transformation | Spectral Parameter | Calibration | Validation | ||||
|---|---|---|---|---|---|---|---|
| R2C | RMSEC (mg/kg) | R2V | RMSEV (mg/kg) | SEP | RPD | ||
| Reflectance | 700 nm | 0.55 | 1.55 | 0.57 | 0.95 | 1.43 | 1.51 |
| First Derivative | 668 nm, 1648 nm | 0.74 | 1.18 | 0.79 | 0.84 | 0.98 | 2.19 |
| Absorption features | FWHM | 0.72 | 1.23 | 0.73 | 0.90 | 1.14 | 1.89 |
F-test, p < 0.001; VIF < 10.
© 2019 by the authors. Licensee MDPI, Basel, Switzerland. This article is an open access article distributed under the terms and conditions of the Creative Commons Attribution (CC BY) license (http://creativecommons.org/licenses/by/4.0/).
Share and Cite
MDPI and ACS Style
Shin, J.H.; Yu, J.; Wang, L.; Kim, J.; Koh, S.-M. Investigation of Spectral Variation of Pine Needles as an Indicator of Arsenic Content in Soils. Minerals 2019, 9, 498. https://doi.org/10.3390/min9080498
AMA Style
Shin JH, Yu J, Wang L, Kim J, Koh S-M. Investigation of Spectral Variation of Pine Needles as an Indicator of Arsenic Content in Soils. Minerals. 2019; 9(8):498. https://doi.org/10.3390/min9080498
Chicago/Turabian StyleShin, Ji Hye, Jaehyung Yu, Lei Wang, Jieun Kim, and Sang-Mo Koh. 2019. "Investigation of Spectral Variation of Pine Needles as an Indicator of Arsenic Content in Soils" Minerals 9, no. 8: 498. https://doi.org/10.3390/min9080498
Note that from the first issue of 2016, this journal uses article numbers instead of page numbers. See further details here.