Article

Bio-Precipitation of Calcium and Magnesium Ions through Extracellular and Intracellular Process Induced by Bacillus Licheniformis SRB2

1
Shandong Provincial Key Laboratory of Depositional Mineralization and Sedimentary Minerals, College of Earth Science and Engineering, Shandong University of Science and Technology, Qingdao 266590, China
2
Laboratory for Marine Mineral Resources, Qingdao National Laboratory for Marine Science and Technology, Qingdao 266237, China
3
Department of Bioengineering, College of Chemical and Environmental Engineering, Shandong University of Science and Technology, Qingdao 266590, China
4
School of Earth Sciences, University of Bristol, Bristol, BS8 1RJ, UK
5
Cabot Institute, University of Bristol, Cantock’s Close, Bristol, BS8 1UJ, UK
*
Authors to whom correspondence should be addressed.
Minerals 2019, 9(9), 526; https://doi.org/10.3390/min9090526
Submission received: 14 July 2019 / Revised: 19 August 2019 / Accepted: 29 August 2019 / Published: 30 August 2019
(This article belongs to the Special Issue Biosorption and Biomineralization in Metal Removal)

Abstract

:
Removal of calcium and magnesium ions through biomineralization induced by bacteria has been proven to be an effective and environmentally friendly method to improve water quality, but the process and mechanism are far from fully understood. In this study, a newly isolated probiotic Bacillus licheniformis SRB2 (GenBank: KM884945.1) was used to induce the bio-precipitation of calcium and magnesium at various Mg/Ca molar ratios (0, 6, 8, 10, and 12) in medium with 30 g L−1 sodium chloride. Due to the increasing pH and HCO3 and CO32− concentrations caused by NH3 and carbonic anhydrase, about 98% Ca2+ and 50% Mg2+ were precipitated in 12 days. The pathways of bio-precipitation include extracellular and intracellular processes. Biominerals with more negative δ13C values (−16‰ to −18‰) were formed including calcite, vaterite, monohydrocalcite, and nesquehonite with preferred orientation. The nucleation on extracellular polymeric substances was controlled by the negatively charged amino acids and organic functional groups. The intracellular amorphous inclusions containing calcium and magnesium also contributed to the bio-precipitation. This study reveals the process and mechanism of microbial desalination for the removal of calcium and magnesium, and provides some references to explain the formation of the nesquehonite and other carbonate minerals in a natural and ancient earth surface environment.

1. Introduction

Three quarters of the Earth’s surface is covered by water, and more than 97% of the water is seawater and saline water. Seawater contains a large number of ions, among which Na (1.05 wt %), Mg (0.135 wt %), and Ca (0.04 wt %) are the three most abundant metal ions [1,2] that can cause serious problems such as the corrosion of machines, scale in cooling systems, human stone disease, and inefficient washing [2,3]. Thus, the removal of Mg2+ and Ca2+ is very important in the pretreatment of seawater due to the great deal of harm above-mentioned. Recently, desalinated seawater has become an important water source and is widely used in mining processes as well as in other industrial fields by many countries who face a lack of water such as China, Chile, and Israel [3,4,5,6]. Seawater desalination is also an important way to produce potable water, and has provided 80% of the available water for human consumption in north Chile [3]. Desalinated seawater has already been widely used in the field of agriculture in Spain, a European country rich in semi-arid regions [7]. In the process of seawater desalination, mature membrane-based desalination technologies are most widely used [8], and include reverse osmosis (RO) and nanofiltration (NF),which can filtrate seawater using a polymer-material membrane at a pressure of 340–6800 kPa [9], and electrodialysis (ED) and reverse electrodialysis (RED), which can make ions flow through an ion-selective membrane to reach an opposite-charged electrode driven by direct current (DC) [10]. In addition, there are forward osmosis (FO) and membrane distillation (MD) technologies [11,12]. It can be seen that membrane technologies require driving forces such as pressure, electricity, and thermal energy to overcome the natural osmotic pressure to allow the water/ions to pass through the membrane quickly. Due to these above limitations, agreement on exploring a new environmentally friendly and economical method has been reached [4].
Over the last several years, new methods regarding seawater desalination using microorganisms have received wide attention [13,14,15,16]. In comparison to traditional desalination technology, the removal of Ca2+ and Mg2+ ions using a biological process has many advantages such as lower energy consumption, lower industrial cost, and less negative environmental impact [17,18,19]. For example, cyanobacteria Synechococcus sp. PCC 7002 has been used as an ion exchanger to remove different kinds of ions in seawater [20]. Another example is the use of microbial desalination cells (MDC) [21]. MDC can drive anions and cations in a salt solution to move to the anode and cathode, respectively, using electricity generated by exoelectrogenic bacteria, and then the ions can be removed from the water [22]. Thus, the method of MDC has provided a breakthrough in water treatment. Aside from the ion exchanger and MDC, another way to treat wastewater with microorganisms is through biomineralization.
The definition of biomineralization is that microorganisms can change the local environment surrounding cells by increasing the pH and elevating the supersaturation to induce the precipitation of minerals [23,24,25]. Biomineralization can be divided into two types: biologically controlled mineralization (BCM) and biologically induced mineralization (BIM) based on the degree of biological control [26]. It has numerous applications including CO2 fixation [27,28], dolomite precipitation [29], pathological concretions [30], cement remediation [31], and the solid-phase capture of soluble materials [32,33]. At the same time, bio-precipitation of metals ions (Fe, U, Pb, Cd, Ca, Mg, and so on) induced by microorganisms play a vital role in decreasing the contamination of metal ions in soils and water [28,34,35,36]. Furthermore, the formation of minerals and rocks has also been closely linked to biomineralization [37,38,39,40,41], for example, aerobic bacterial strains can induce the formation of some biominerals such as dolomite, huntite, high Mg-calcite, and hydromagnesite at Earth surface conditions at aqueous Mg/Ca ratios (2 to 11.5). Moreover, the microbes in the hypersaline coastal lagoon, Lagoa Vermelha (Brazil) can induce the precipitation of Ca2+ and Mg2+ ions to form modern carbonate stromatolites [42]. The formation of the above minerals and rocks provides a theoretical and practical basis for decreasing the contamination of Ca2+ and Mg2+ ions in wastewater. Some microorganisms are able to precipitate and survive in a waste saline adverse environment with a higher concentration of Mg2+ ions, thus resulting in a decrease in the concentration of Mg2+ ions. Biomineralization induced by bacteria is a new type of water treatment method by which dissolved ions in the wastewater/seawater can be mineralized into solid-state precipitates under the influence of microorganisms that can reduce the metal ion concentration to control water pollution.
The mechanism of biomineralization has been explored over the past few decades, and several biological processes such as denitrification, iron reduction, sulfate reduction, and catalytic reaction of urease and carbonic anhydrase have been found to create the necessary conditions for biomineral precipitation [43]. More recent studies have suggested that organic functional groups also play a very important role in the biomineralization process [43,44]. Among the many functional groups for biomineralization, carboxyl groups have been more reported. It has been found that carboxyl groups originating from halophilic bacteria Haloferax volcanii DS52 contribute to the biomineralization of disordered dolomite (CaMgCO3) [44]. However, it is not possible to find all the factors that affect biomineralization, mainly because of the extreme heterogeneity of microorganisms and the wide range of the physicochemical properties of metal ions. Since metal ions transforming into minerals by biomineralization is a relatively complicated process, the current understanding of biomineralization seems to be very limited. Thus, the mechanism of biomineralization and the characteristics of biominerals still need to be further studied.
In this study, Bacillus licheniformis SRB2 bacteria were identified by a 16S rDNA sequence comparison and used to induce the bio-precipitation of Ca2+ and Mg2+ ions in a saline solution. The concentrations of Ca2+ and Mg2+ ions were measured by an atomic absorption spectrophotometer (AAS) to calculate the precipitation ratios. To further explore the biomineralization mechanism, the growth curve, pH values, the activity of carbonic anhydrase, the concentration of ammonium, and carbonate and bicarbonate ions were analyzed, respectively. X-ray powder diffraction (XRD), scanning electron microscope (SEM)-energy disperse spectroscopy (EDS), Fourier transform infrared spectroscopy (FTIR), and stable carbon isotope analysis were used to characterize the precipitates to further prove their biogenesis. Furthermore, aside from the extracellular bio-precipitation, whether the Ca2+ and Mg2+ ions could enter the cell was also investigated by laser scanning microscopy and a fluorescence spectrophotometer. To further determine the nucleation sites, ultrathin slices of B. licheniformis SRB2 cell were prepared and analyzed by transmission electron microscopy (TEM) and selected area electron diffraction (SAED), and at the same time, the amino acid composition of the extracellular polymeric substance (EPS) originating from the SRB2 bacteria was also analyzed by an amino acid analyzer. This study may provide further understanding on the mechanism of biomineralization, and supply an environmental-friendly and economic method for the removal of Ca2+ and Mg2+ ions in saline wastewater.

2. Materials and Methods

2.1. 16S rDNA-Based Identification of Bacteria

Bacterium SRB2 was screened, incubated, and stored in this geological microbial laboratory. Regarding the 16S rDNA-based identification of SRB2, the methods to extract the bacterial total DNA and the detailed steps to perform the polymerase chain reaction (PCR) are both referred to in the literature [45]. The PCR products were subsequently sequenced by Shanghai Sangon Biotech Co. Ltd. (Shanghai, China). These sequences were assembled with DNAMAN 8.0 software, and then the complete 16S rDNA sequence was compared with those of the GenBank database. The neighbor-joining method was used to build the phylogenetic tree of SRB2 by Mega 6 software.

2.2. Preparation of the Liquid Bacterial Seed of SRB2 Strain

A single colony of SRB2 bacteria was inoculated into 100 mL sterilized liquid medium (unit g·L−1: beef extract 5, tryptone 10, NaCl 10, pH 7.2), and then cultured in an oscillation incubator (HZQ-F160, Harbin electronic technology development Co. Ltd., Harbin, China) with a speed of 130 rpm at 37 °C. The cell concentration was measured with a spectrophotometer (722s, Shanghai Analysis Instrument Factory, Shanghai, China) at a wavelength of 600 nm. When the OD600 value of the fermented liquid was approximately 0.95, the preparation of the liquid bacterial seed of SRB2 strain was complete.

2.3. Physiological and Biochemical Characteristics of SRB2 Bacteria

2.3.1. Morphology, Gram Staining, and Ammonia Test

The single colony of SRB2 bacteria was observed by the naked eye, and the single bacterium was analyzed by SEM, Gram staining, and the ammonia test, according to the methods reported by Han et al. [45].

2.3.2. Growth Curve and pH Changes

To evaluate the tolerance of SRB2 bacteria on the salinity, 2 mL of the liquid bacterial seed of SRB2 strain was inoculated into 200 mL of liquid culture medium (unit g·L−1: beef extract 5, tryptone 10, pH 7.2) with 1%, 2%, 3%, and 4% of sodium chloride (NaCl, m:v), and the cell concentration was measured using a spectrophotometer at a wavelength of 600 nm.
The liquid bacterial seed of SRB2 strain was inoculated into the liquid culture medium with 3% of NaCl at a volume ratio of 1% and this was set as the experimental group. The other group inoculated with the sterile distilled water at a volume ratio of 1% was set as the control group. The experiment was performed in triplicate. All samples were cultured in a constant temperature oscillation incubator at 130 rpm and 37 °C. The cell concentration was measured by a spectrophotometer at a wavelength of 600 nm and the pH values were measured using a pH meter (PHS-3C, Shanghai Shengke Instrument Equipment Co. Ltd., Shanghai, China).

2.3.3. Ammonium Concentration and pH Based on Ammonium

The concentration of ammonium (NH4+) in the fermented liquid was measured with a titration reported method [45]. The pH values based on the NH4+ concentration were also calculated according to the same reference.

2.3.4. Carbonic Anhydrase Activity

Carbonic anhydrase (CA) activity was measured based on the transformation reaction from p-nitrophenylacetate to nitrophenol. The working solution was prepared by mixing 0.5 mL of p-nitrophenylacetate alcoholic solution (3.6 g·L−1) and 10 mL of ethyl diethylmalonate Hank’s Balanced Salt Solution (HBSS, 1.56 g·L−1). One mL of the bacterial solution diluted five times was reacted with 1 mL of the working solution at 35 °C for 30 min, and then quickly cooled in an ice bath, before finally being measured by a spectrophotometer at a wavenumber of 400 nm. Before reaction, the mixture should also be measured by a spectrophotometer at the same wavenumber. Here, one unit of CA (U) was defined as the amount of enzyme required to release 1 μmol of p-nitrophenol per min and 1 L.

2.3.5. Bicarbonate and Carbonate Ions, and pH Values

The concentrations of bicarbonate and carbonate ions were measured by the acid–base titration method [45]. To determine how bicarbonate and carbonate ions could affect the pH, the solution of sodium bicarbonate and sodium carbonate was prepared according to the concentration of bicarbonate and carbonate ions, and the pH was measured.

2.4. Medium Used to Induce Biominerals

The liquid culture medium containing 0.01 mol·L−1 of Ca2+ ions was prepared and the Mg/Ca molar ratio was adjusted to 0, 6, 8, 10, and 12 by using magnesium chloride, respectively. A total of 10.6 g Na2CO3 and 9.0 g NaHCO3 were dissolved in 100 mL of sterile distilled water and filtrated through a filter membrane with a pore diameter of 0.22 µm, respectively. Three mL of the Na2CO3 filtrate and 5 mL of the NaHCO3 filtrate was added into 200 mL of the liquid medium at each value of Mg/Ca molar ratio, respectively; and the pH value of the medium was adjusted to 7.2. The liquid bacterial seed was inoculated into the above medium with an inoculation volume ratio of 1% and this was set as the experimental group; and the medium with various pH of 6.0, 8.0, and 9.2, besides 7.2, were inoculated with sterile distilled water at a volume ratio of 1% to be set as the control groups, with the aim to compare the difference in minerals between the experimental group at different stages and the control group. The experiments were performed in triplicate. All cultures were incubated in a constant temperature oscillation incubator at 130 rpm and 37 °C.

2.5. Ca2+ and Mg2+ Concentration and the Electroconductivity

Ca2+ and Mg2+ concentrations were measured by an atomic absorption spectrophotometer (AAS, TAS-986, Zhengzhou Nanbei Instrument Equipment Co. Ltd., Zhengzhou, Henan Province, China). To analyze the characteristics of the precipitation process, the Boltzmann equation was used and the kinetic parameters were also analyzed based on the concentrations of Ca2+ and Mg2+ in the time range of 0 to 400 h. The Boltzmann equation is as follows (1):
y = A 1 A 2 1 + e k ( t t max )
where y represents the deposition amount of Ca2+; A1 and A2 indicate the calculated maximum and minimum Ca2+ concentration, respectively; tmax is the time when the deposition rate reached its maximum value; and k represents the average deposition rate constant.
The electroconductivity of the medium was measured in the biomineralization process by an electroconductivity meter (DDS-11A, Digital conductivity meter, Shanghai Instrument Electric Science Instrument Limited by Share Ltd., Shanghai, China).

2.6. Characterization of Minerals

The minerals were washed three times with distilled water, and dried at room temperature for 24 h, then analyzed by scanning electron microscope (SEM, Hitachi S-4800, Japan Hitachi Company, Tokyo, Japan) and energy dispersive spectrometer (EDS, EX-450, Japan Horiba, Japan). The mineral phase and the crystal structure were analyzed by x-ray diffraction (XRD, D/Max-RC, Rigaku Corporation, Tokyo, Japan) instrument, with a 2θ angle range of 10–90°, a step size of 0.02, and a count time of 8° min−1. Rietveld refinement was performed to calculate the mass ratio of minerals in the mixture by using Material Studio 8.0 software. Minerals were ground sufficiently with an agate mortar, and the powder was analyzed by high resolution transmission electron microscopy (HRTEM, JEM-2100, Japan Electronics Company, JEOL, Japan) and selected area electron diffraction (SAED). The functional groups in/on the minerals were also analyzed by Fourier transform infrared spectroscopy (FTIR, Nicolet 380, Thermo Fisher Scientific Inc., Massachusetts, USA) with a scanning range of 5000–400 cm−1 through the potassium bromide pressed-disk technique. The biotic and abiotic minerals were ground in an agate mortar. Prior to carbon isotope analysis, the minerals were first soaked in sodium hypochlorite for 24 h to fully remove the organic constituents adsorbed on the surfaces. The stable carbon isotopic composition was analyzed by a carbon isotope laser spectrometer (Picarro G2121-i, rPicarro Inc., Santa Clara, CA, USA). Organic substances such as beef extract (National Medicine Chemical Reagent Co. Ltd.) and tryptone (Beijing Aoboxing Biotechnology Co. Ltd.) were vacuum dried at −60 °C in a freeze dryer (FD-1A-50, Shanghai Bilang Instrument Manufacturing Co. Ltd., Shanghai, China), and then ground into powder for carbon isotope analysis.

2.7. EPS and Ultrathin Slices of SRB2

Cells in the stationary phase were collected by centrifugation at 2500 rpm for 15 min. Next, the precipitated cells were washed with HBSS solution more than three times to remove the organic components originating from the culture medium. The cells were suspended in HBSS solution and cultured in a water bath at 60 °C for 40 min, then centrifuged at a speed of 10,000 rpm for 5 min. The supernatant was vacuum dried in a freeze dryer at −60 °C for 24 h. Finally, the dried EPS powder was analyzed by an amino acid analyzer (L-8900, Hitachi, Japan).
Ultrathin slices of SRB2 cells were prepared as follows: the cells were washed three times to remove the medium components with the phosphate buffer (Na2HPO412H2O 20.7472 g/L, NaH2PO42H2O 3.1167 g/L, pH 7.2), fixed in 2.5% glutaraldehyde for 2 h, and washed three times with phosphate buffer, then fixed in 1 mL 1% osmic acid for about 1 h, and finally put into a 4 °C refrigerator overnight after being cleaned three times with phosphate buffer. The next morning, the cells were dehydrated by acetone and the dehydration sequence was as follows: 30% (15 min)–50% (15 min)–70% (15 min)–90% (30 min)–100% (15 min)–100% (15 min). Next, 1 mL of 30% epoxy resin solution was added to embed the cells. Finally, the samples were cut using a diamond slicing knife for analysis with TEM and SAED (H-7650, Hitachi, Japan).

3. Results and Discussion

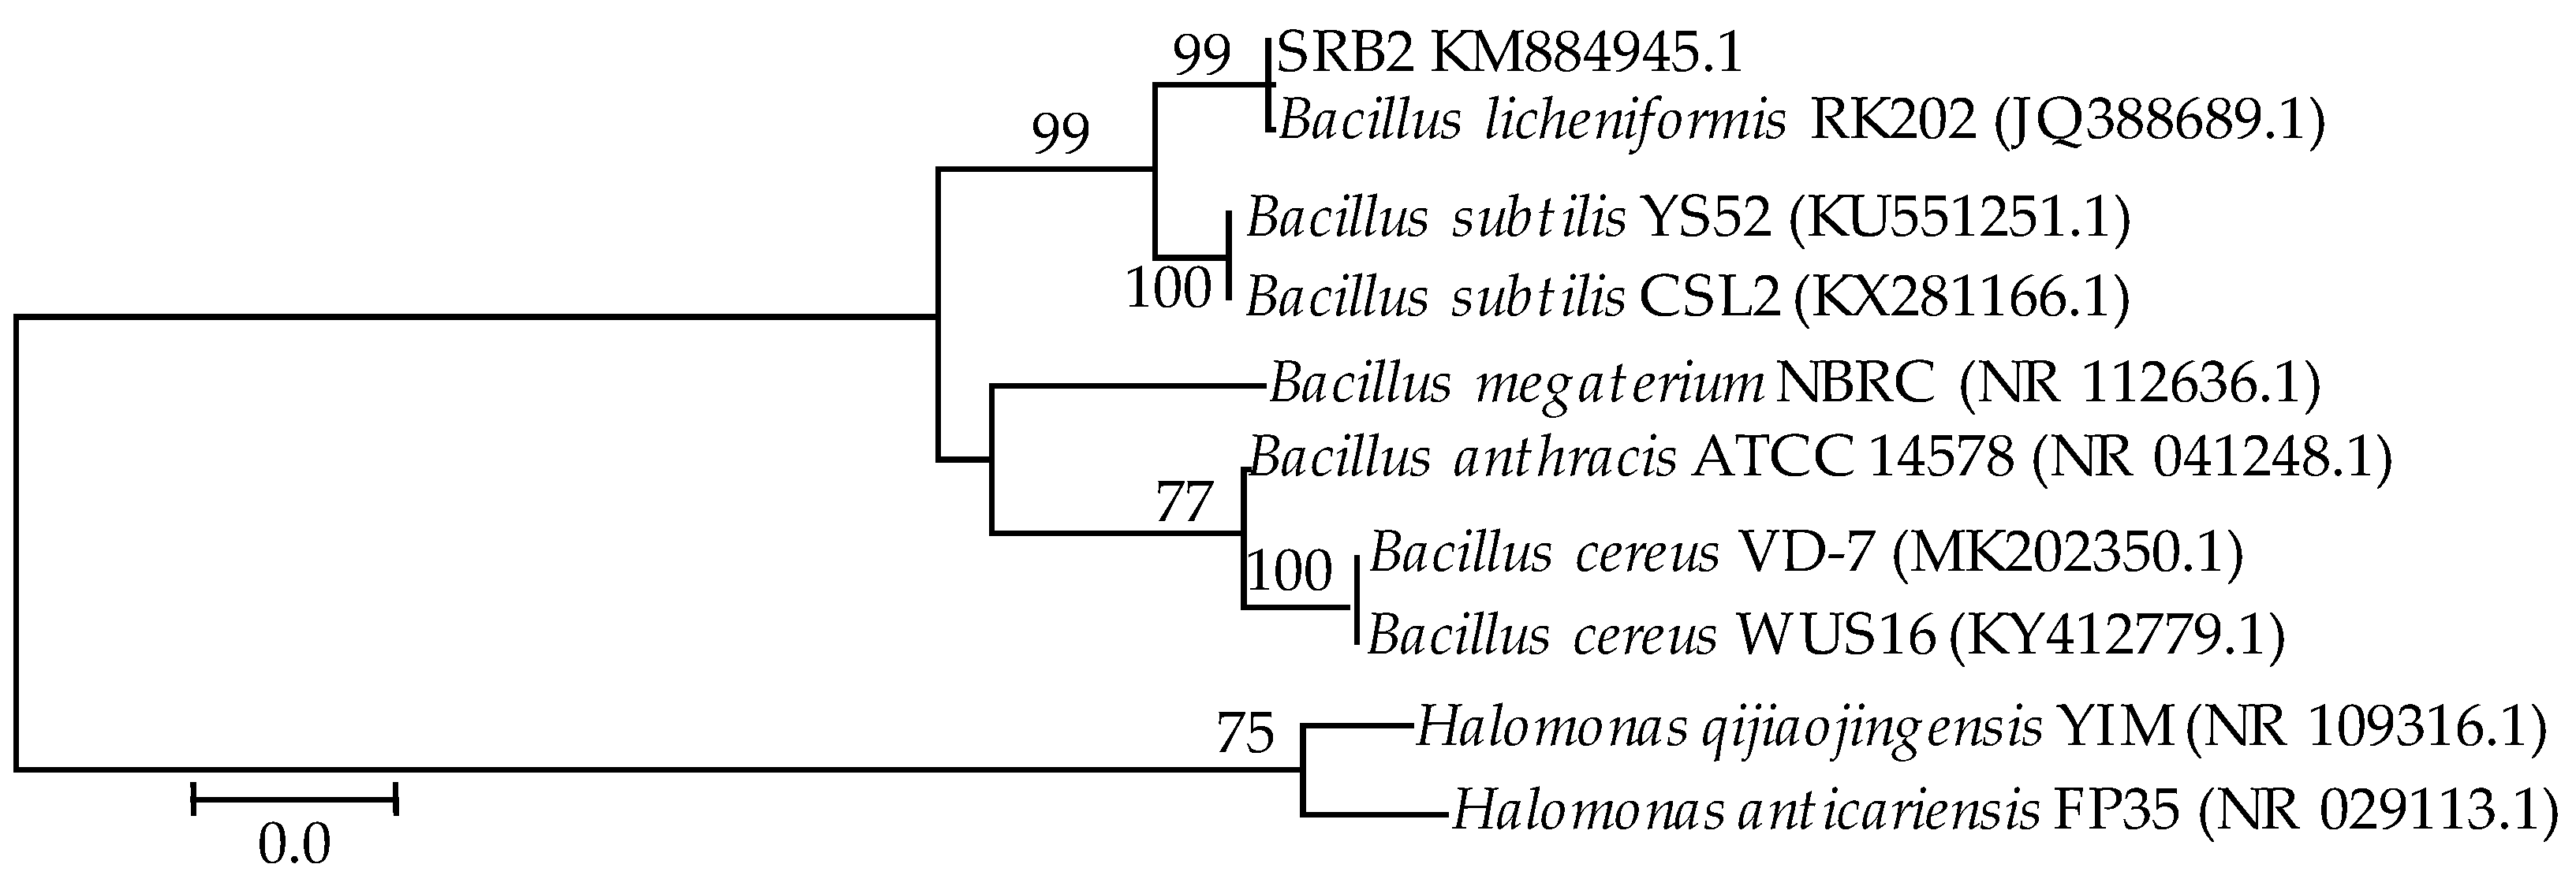
3.1. 16S rDNA Identification

The full length of 16S rDNA (KM884945.1) was determined as 1483 bp. The nucleotide sequence homology remained at 99% when comparing the 16S rDNA sequences of SRB2 with those of 95 strains belonging to the species of Bacillus licheniformis in GenBank. The phylogenetic tree shown in Figure 1 proved that the SRB2 strain was most closely related to B. licheniformis. Therefore, strain SRB2 was identified as B. licheniformis.

3.2. Physiological and Biochemical Characteristics of SRB2 Bacteria

3.2.1. Morphology, Gram Staining, and Ammonia Test

A single colony of B. licheniformis SRB2 was yellow, irregular, and had a diameter of 0.1–0.5 cm after three days of cultivation (Figure S1a). The short-bar-shaped bacterium (Figure S1b) was about 1.5 µm in length and 0.7 µm in width, and the EPS around bacterium could also be recognized. The purple color after Gram staining indicated that SRB2 was Gram-positive bacteria (Figure S1c). After adding Nessler’s reagent, the brown color of the experimental group suggested that SRB2 was able to produce ammonia (Figure S1d).

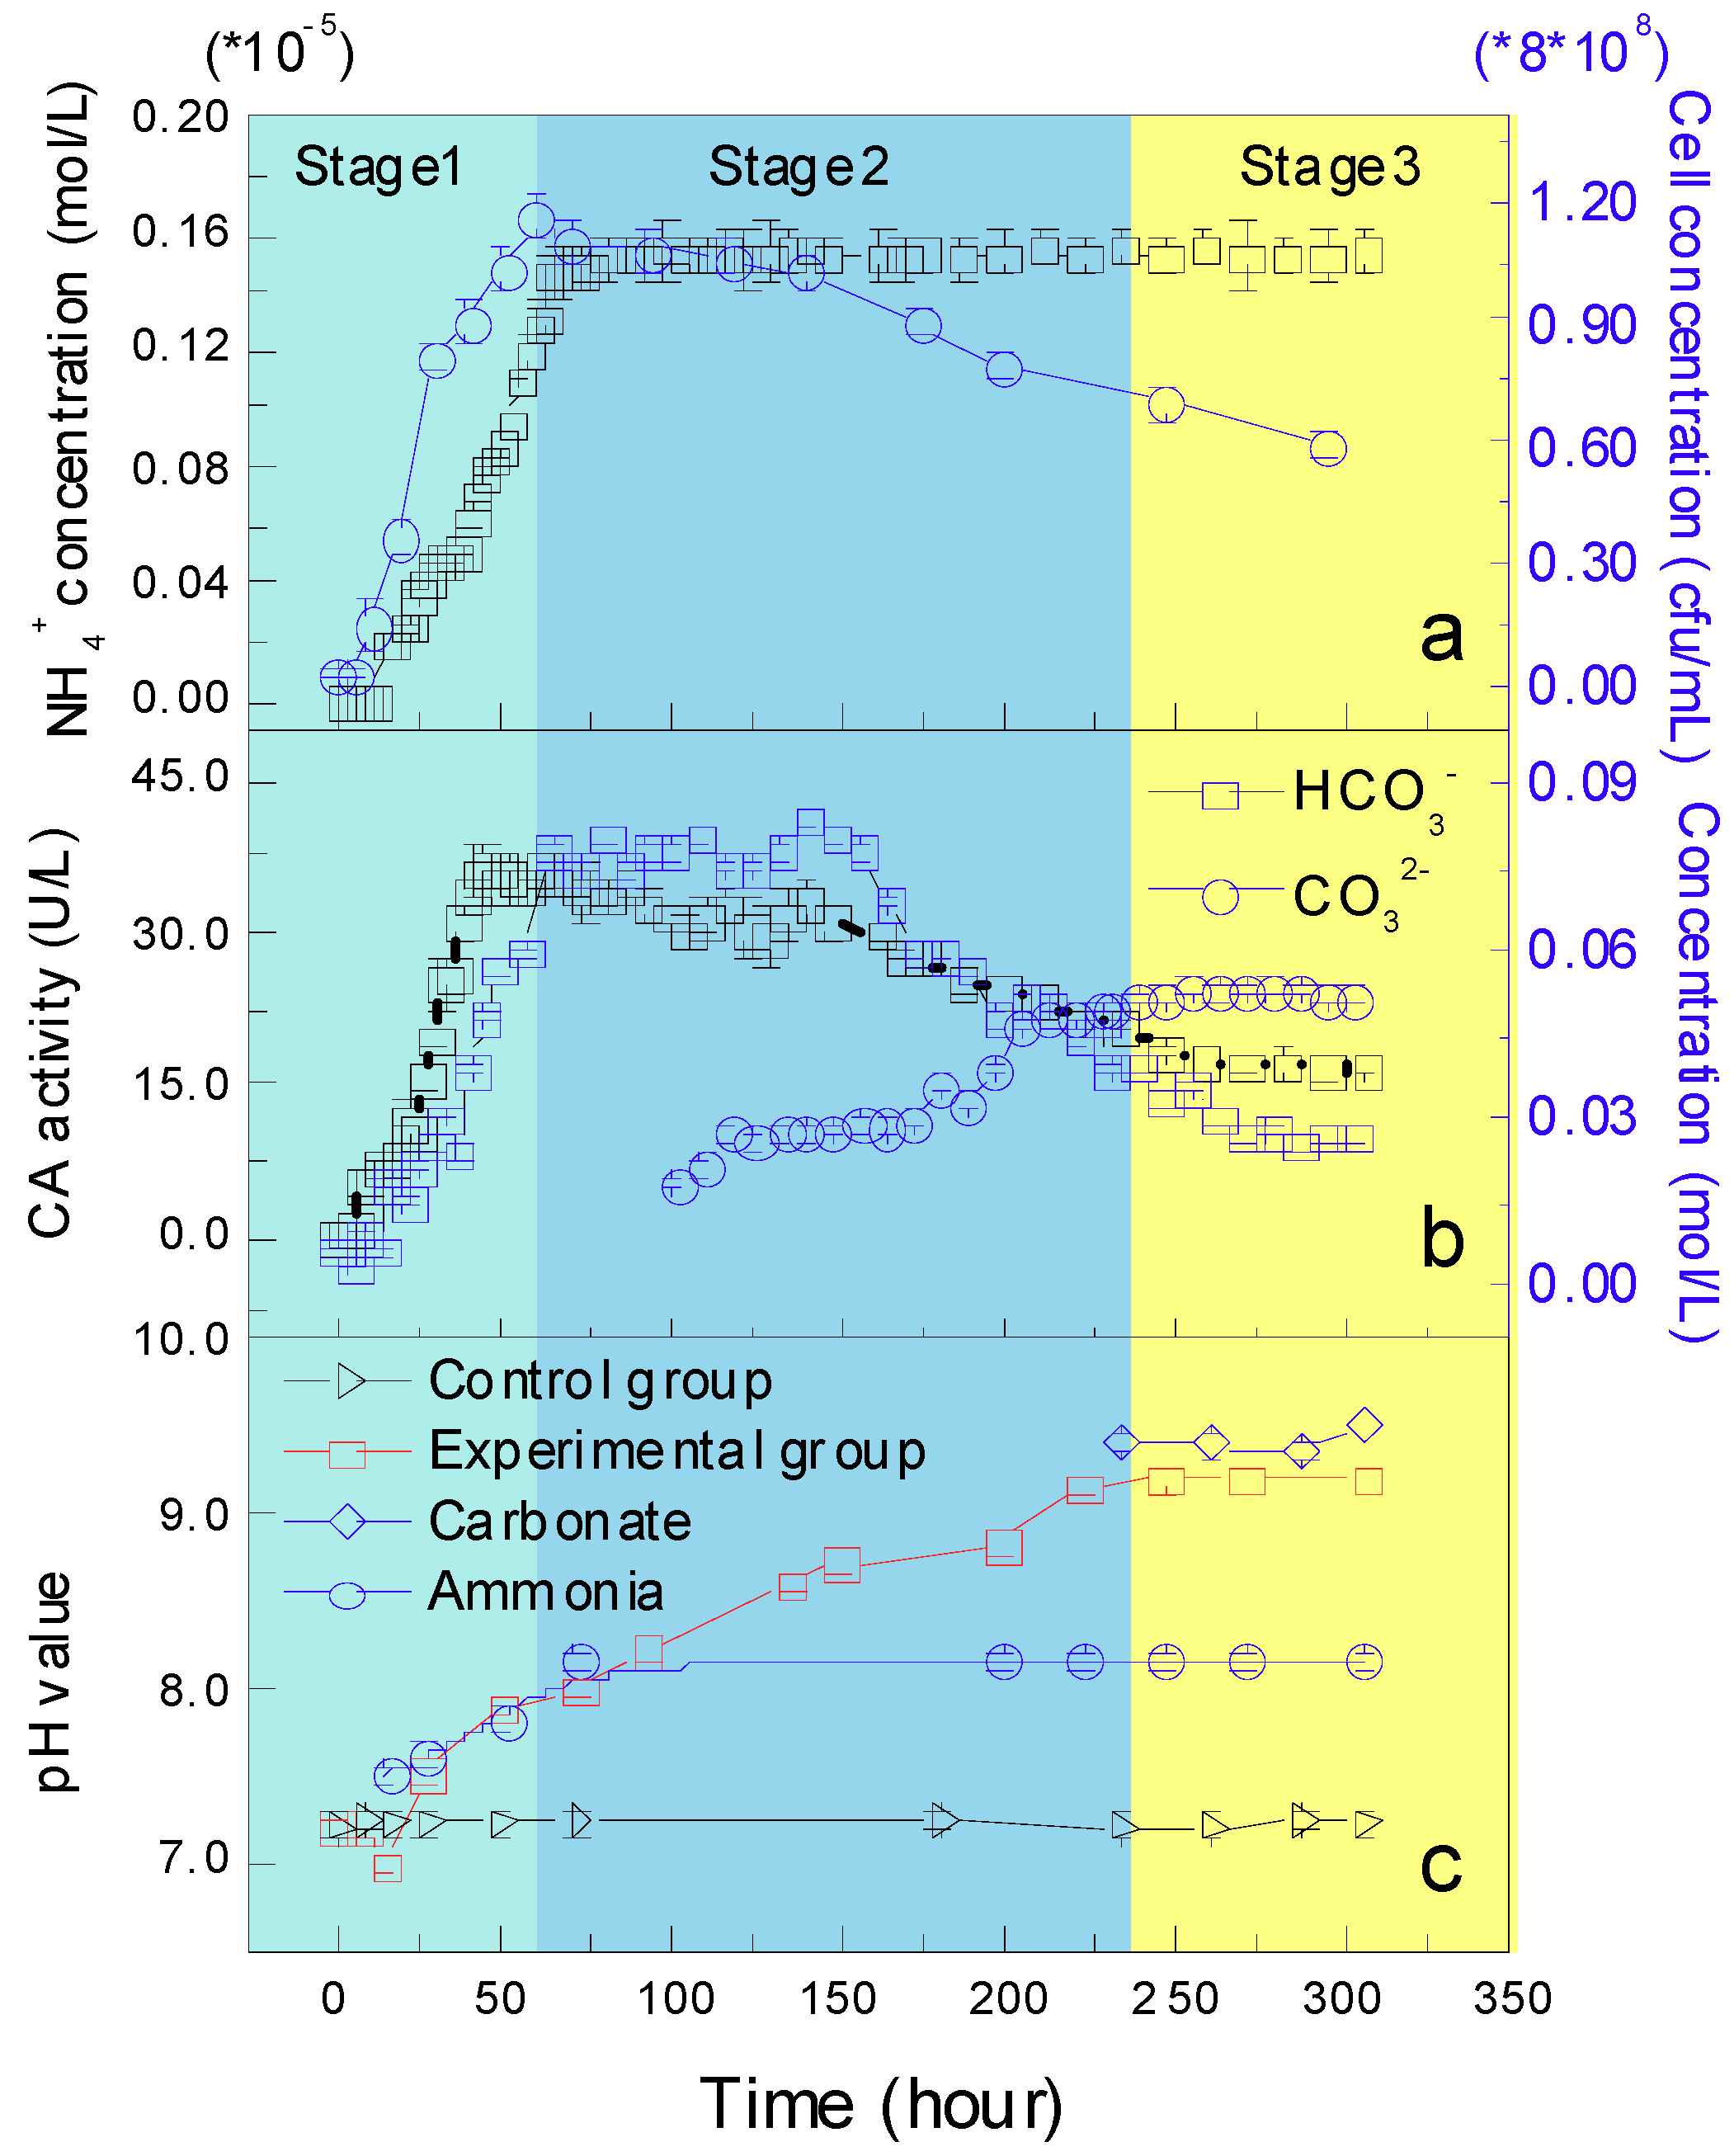
3.2.2. Growth Curve, CA Activity, the Concentration of NH4+, HCO3 and CO32− Ions, and pH Changes

It was found that SRB2 lived well in a 3% salt concentration, which was similar to the seawater salt concentration (Figure S2). The growth curve of SRB2 could be divided into four phases: the lag phase, the logarithmic phase, the stationary phase, and the decline phase (Figure 2a). The lag growth period was over a time range of 0–6 h, where the cell concentration was almost unchanged, about 0.032–0.035 cfu mL−1 (Figure 2a), however, the pH decreased from 7.2 to 6.9 (Figure 2c). The logarithmic phase was from 6 to 60 h (Figure 2a), where the cell concentration increased sharply from 0.16 to 1.13 cfu mL−1, and the concentration of NH4+ and HCO3 ions and CA activity also reached their maximum value of 0.15 mol L−1 (Figure 2a), 0.08 mol L−1 (Figure 2b), and 35 U L−1 (Figure 2a), respectively (Figure 2). Furthermore, the pH gradually increased (Figure 2c). The stationary phase was in a time range of 60–100 h, where the cell concentration was stable at about 1.1 cfu mL−1 (Figure 2a), and the NH4+ concentration was almost unchanged (Figure 2a). From 100th hour, carbonate ions could be detected in the medium (Figure 2b) while the pH still increased rapidly (Figure 2c). During the decline phase, CA activity decreased slowly from 32 to 16 U L−1, HCO3 concentration also decreased, while CO32 concentration and the pH still increased quickly (Figure 2). Interestingly, the ammonium concentration was almost unchanged. The pH value based on NH4+ concentration was lower than that in the experimental group (8.2 ˂ 9.2, Figure 2c), which indicates that the quantity of ammonia released by SRB2 bacteria was not enough to increase the pH to 9.2 and is well consistent with the results of Han et al. [45,46]. While the pH value based on the concentration of HCO3 and CO32− ions was higher than that based on NH4+ concentration and higher than that in the experimental group, which indicated that pH increase was closely related to the concentration of the HCO3 and CO32− ions, and not only the NH4+ concentration. CA can catalyze the hydration of carbon dioxide to release a large number of HCO3 and CO32− ions, thus resulting in an increase in pH [45,46]. When compared, our results were well consistent with their results.

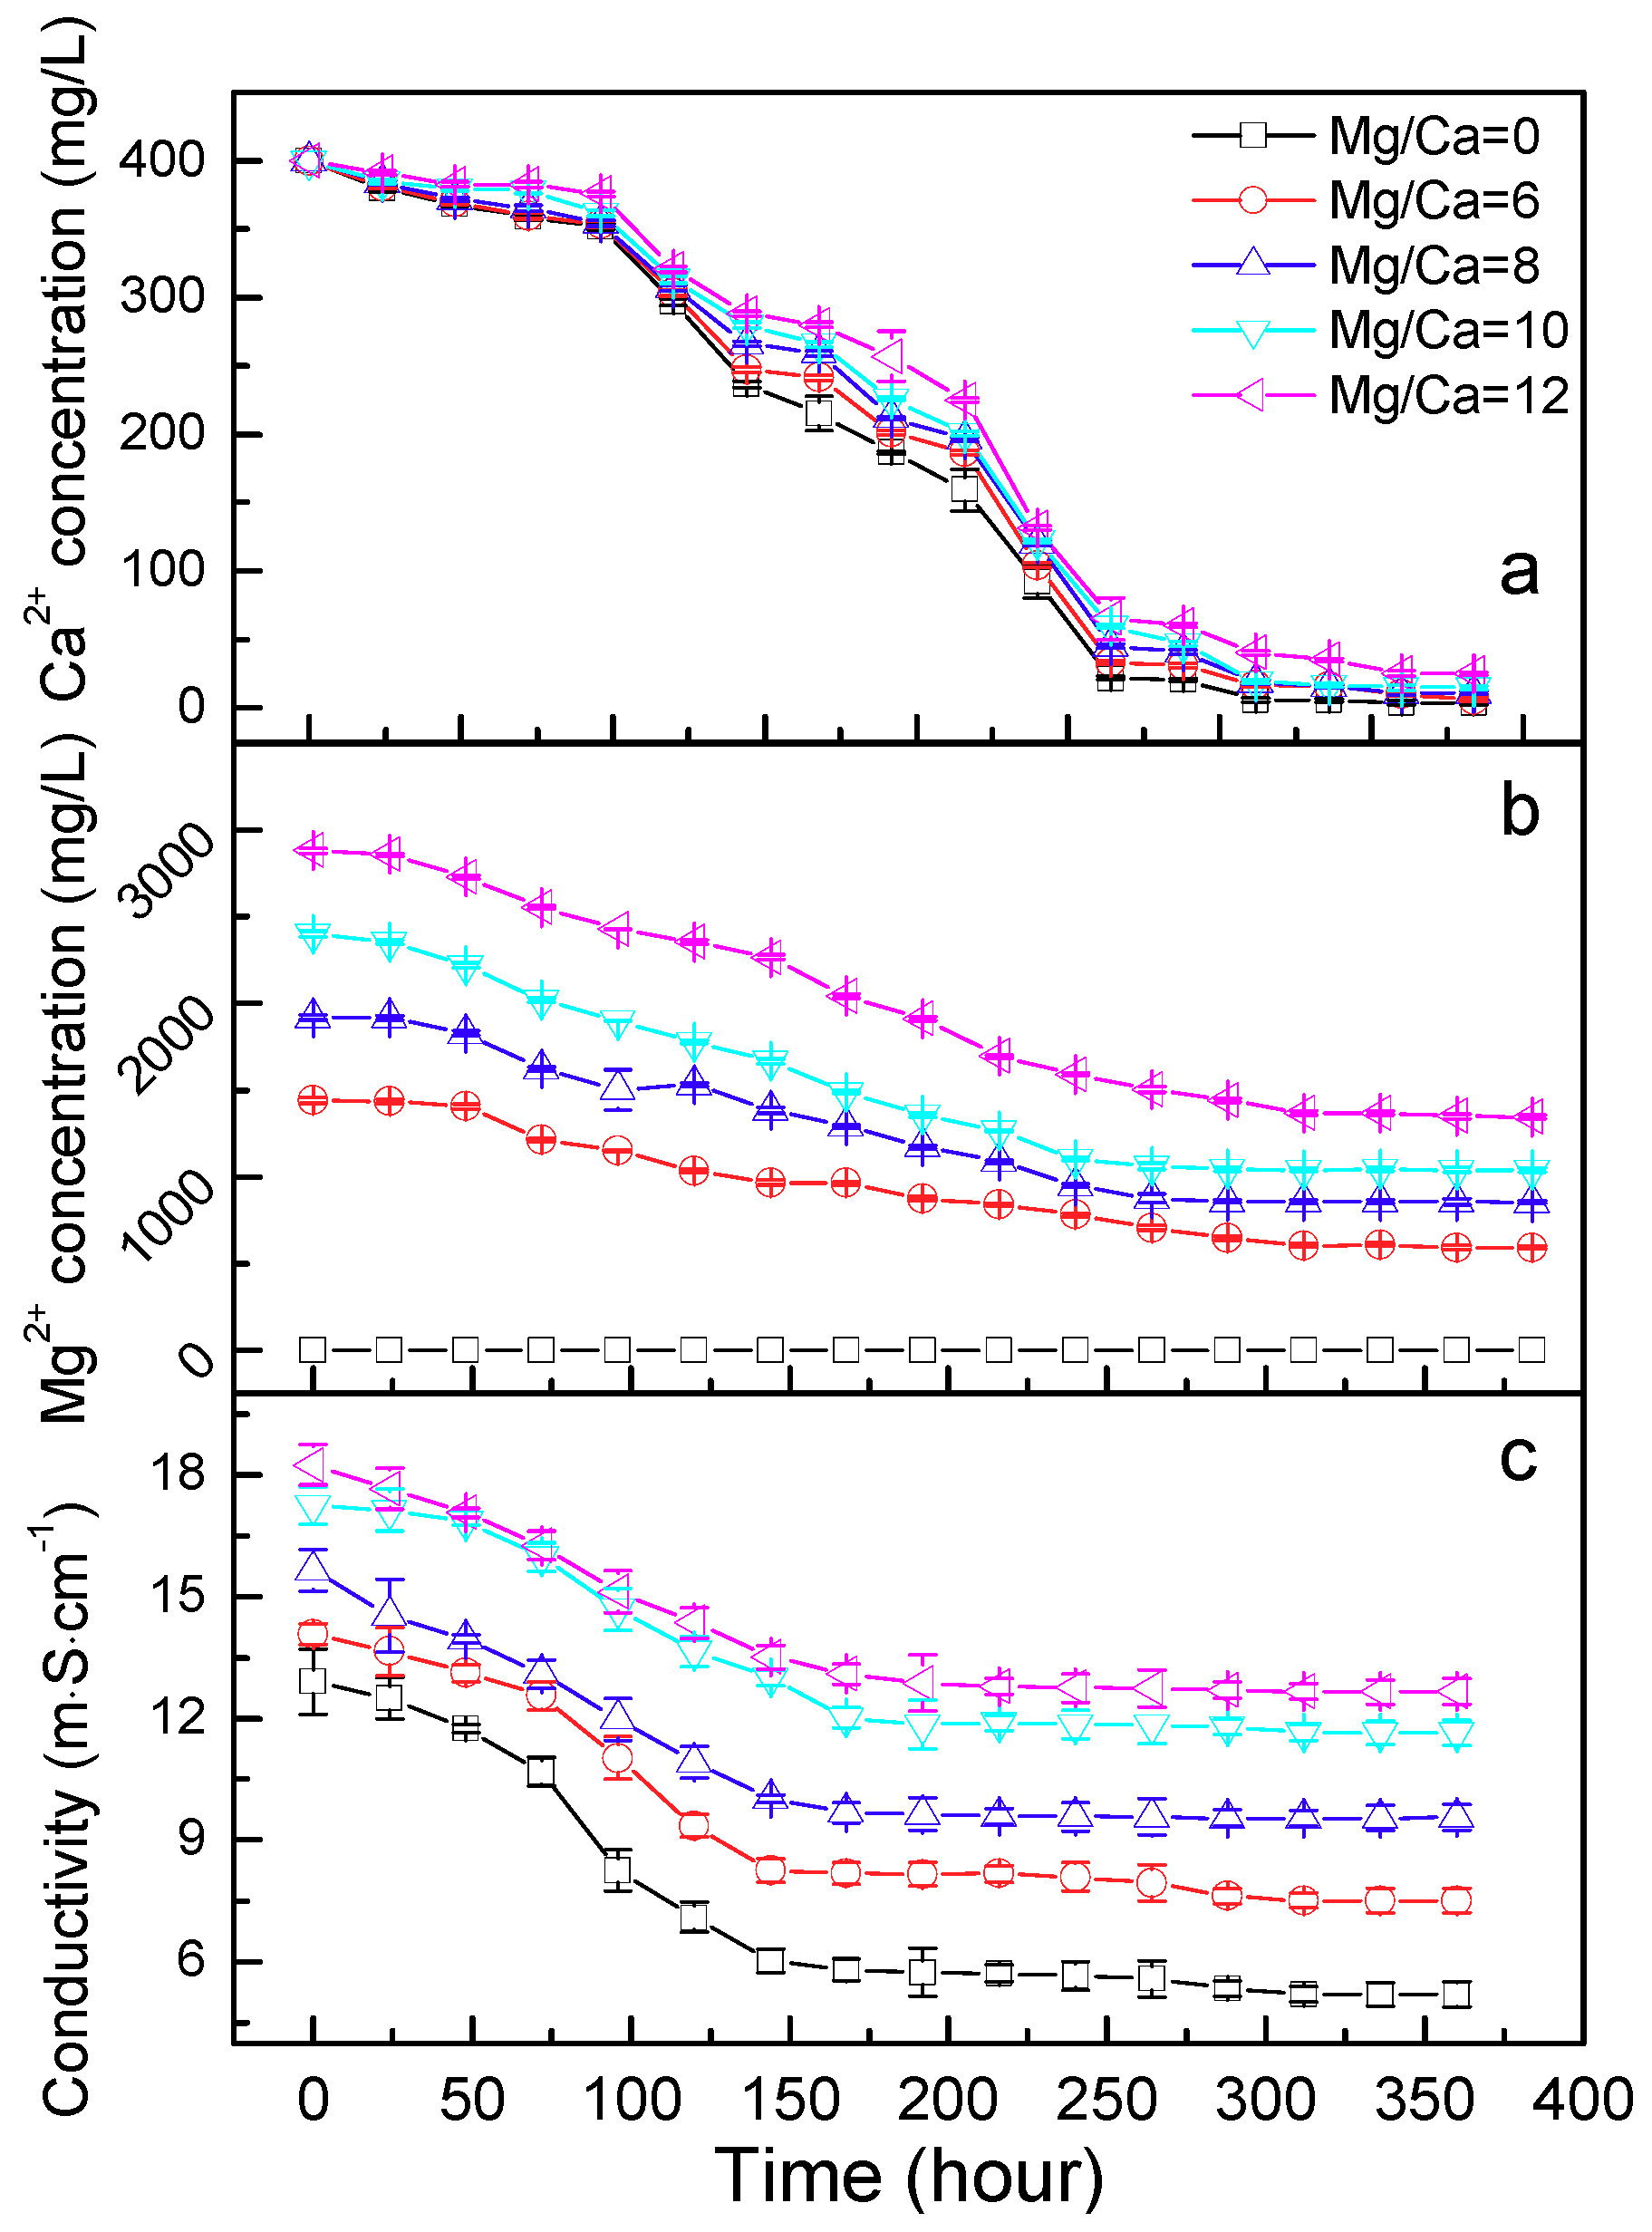
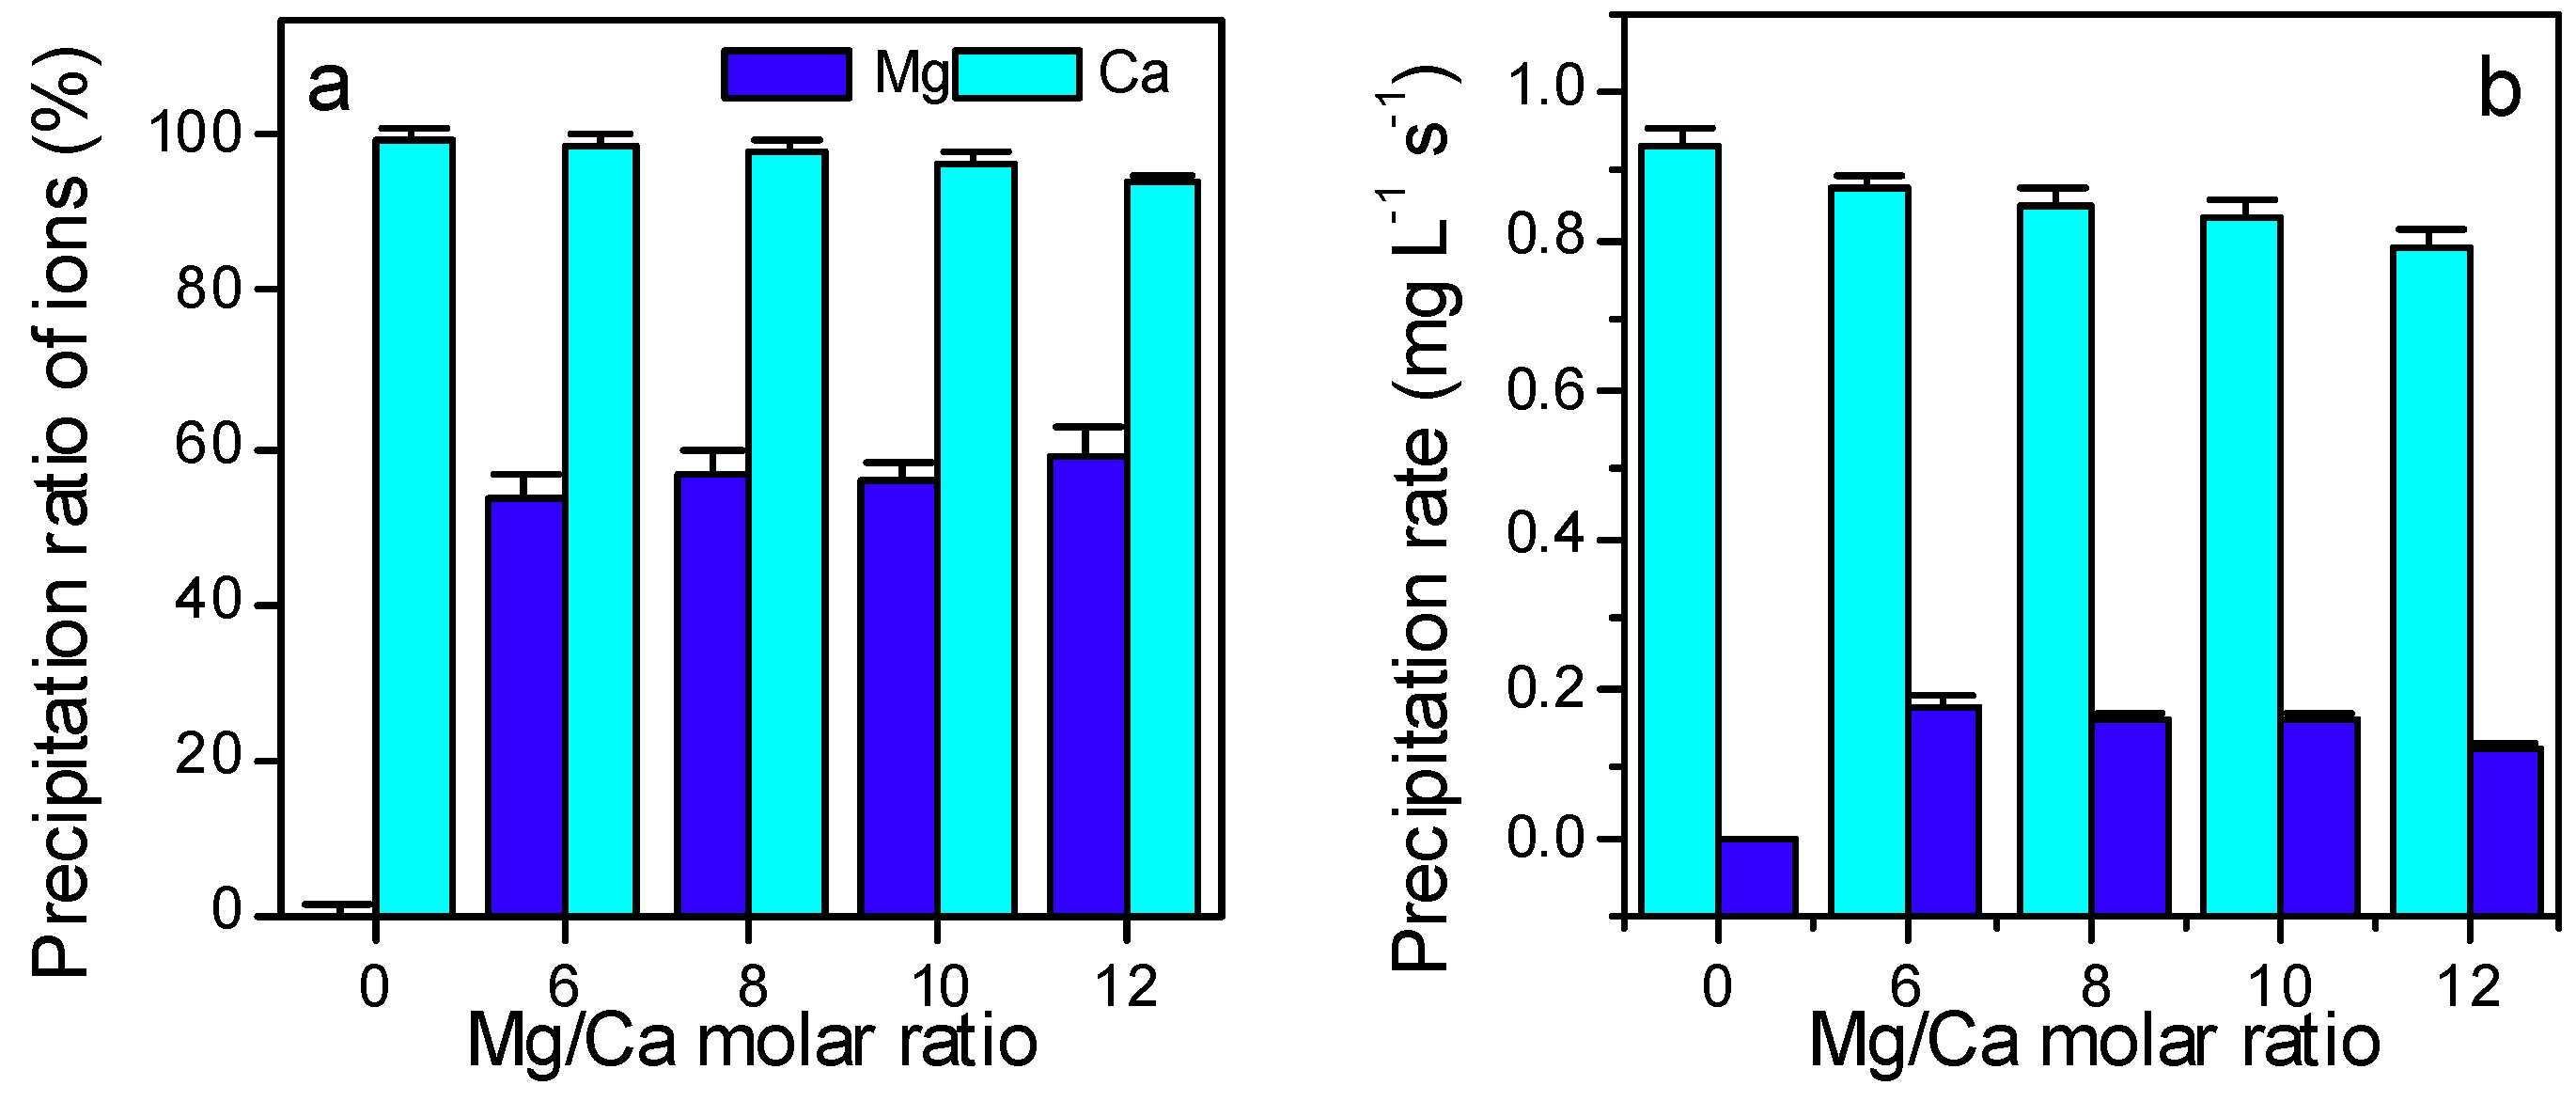
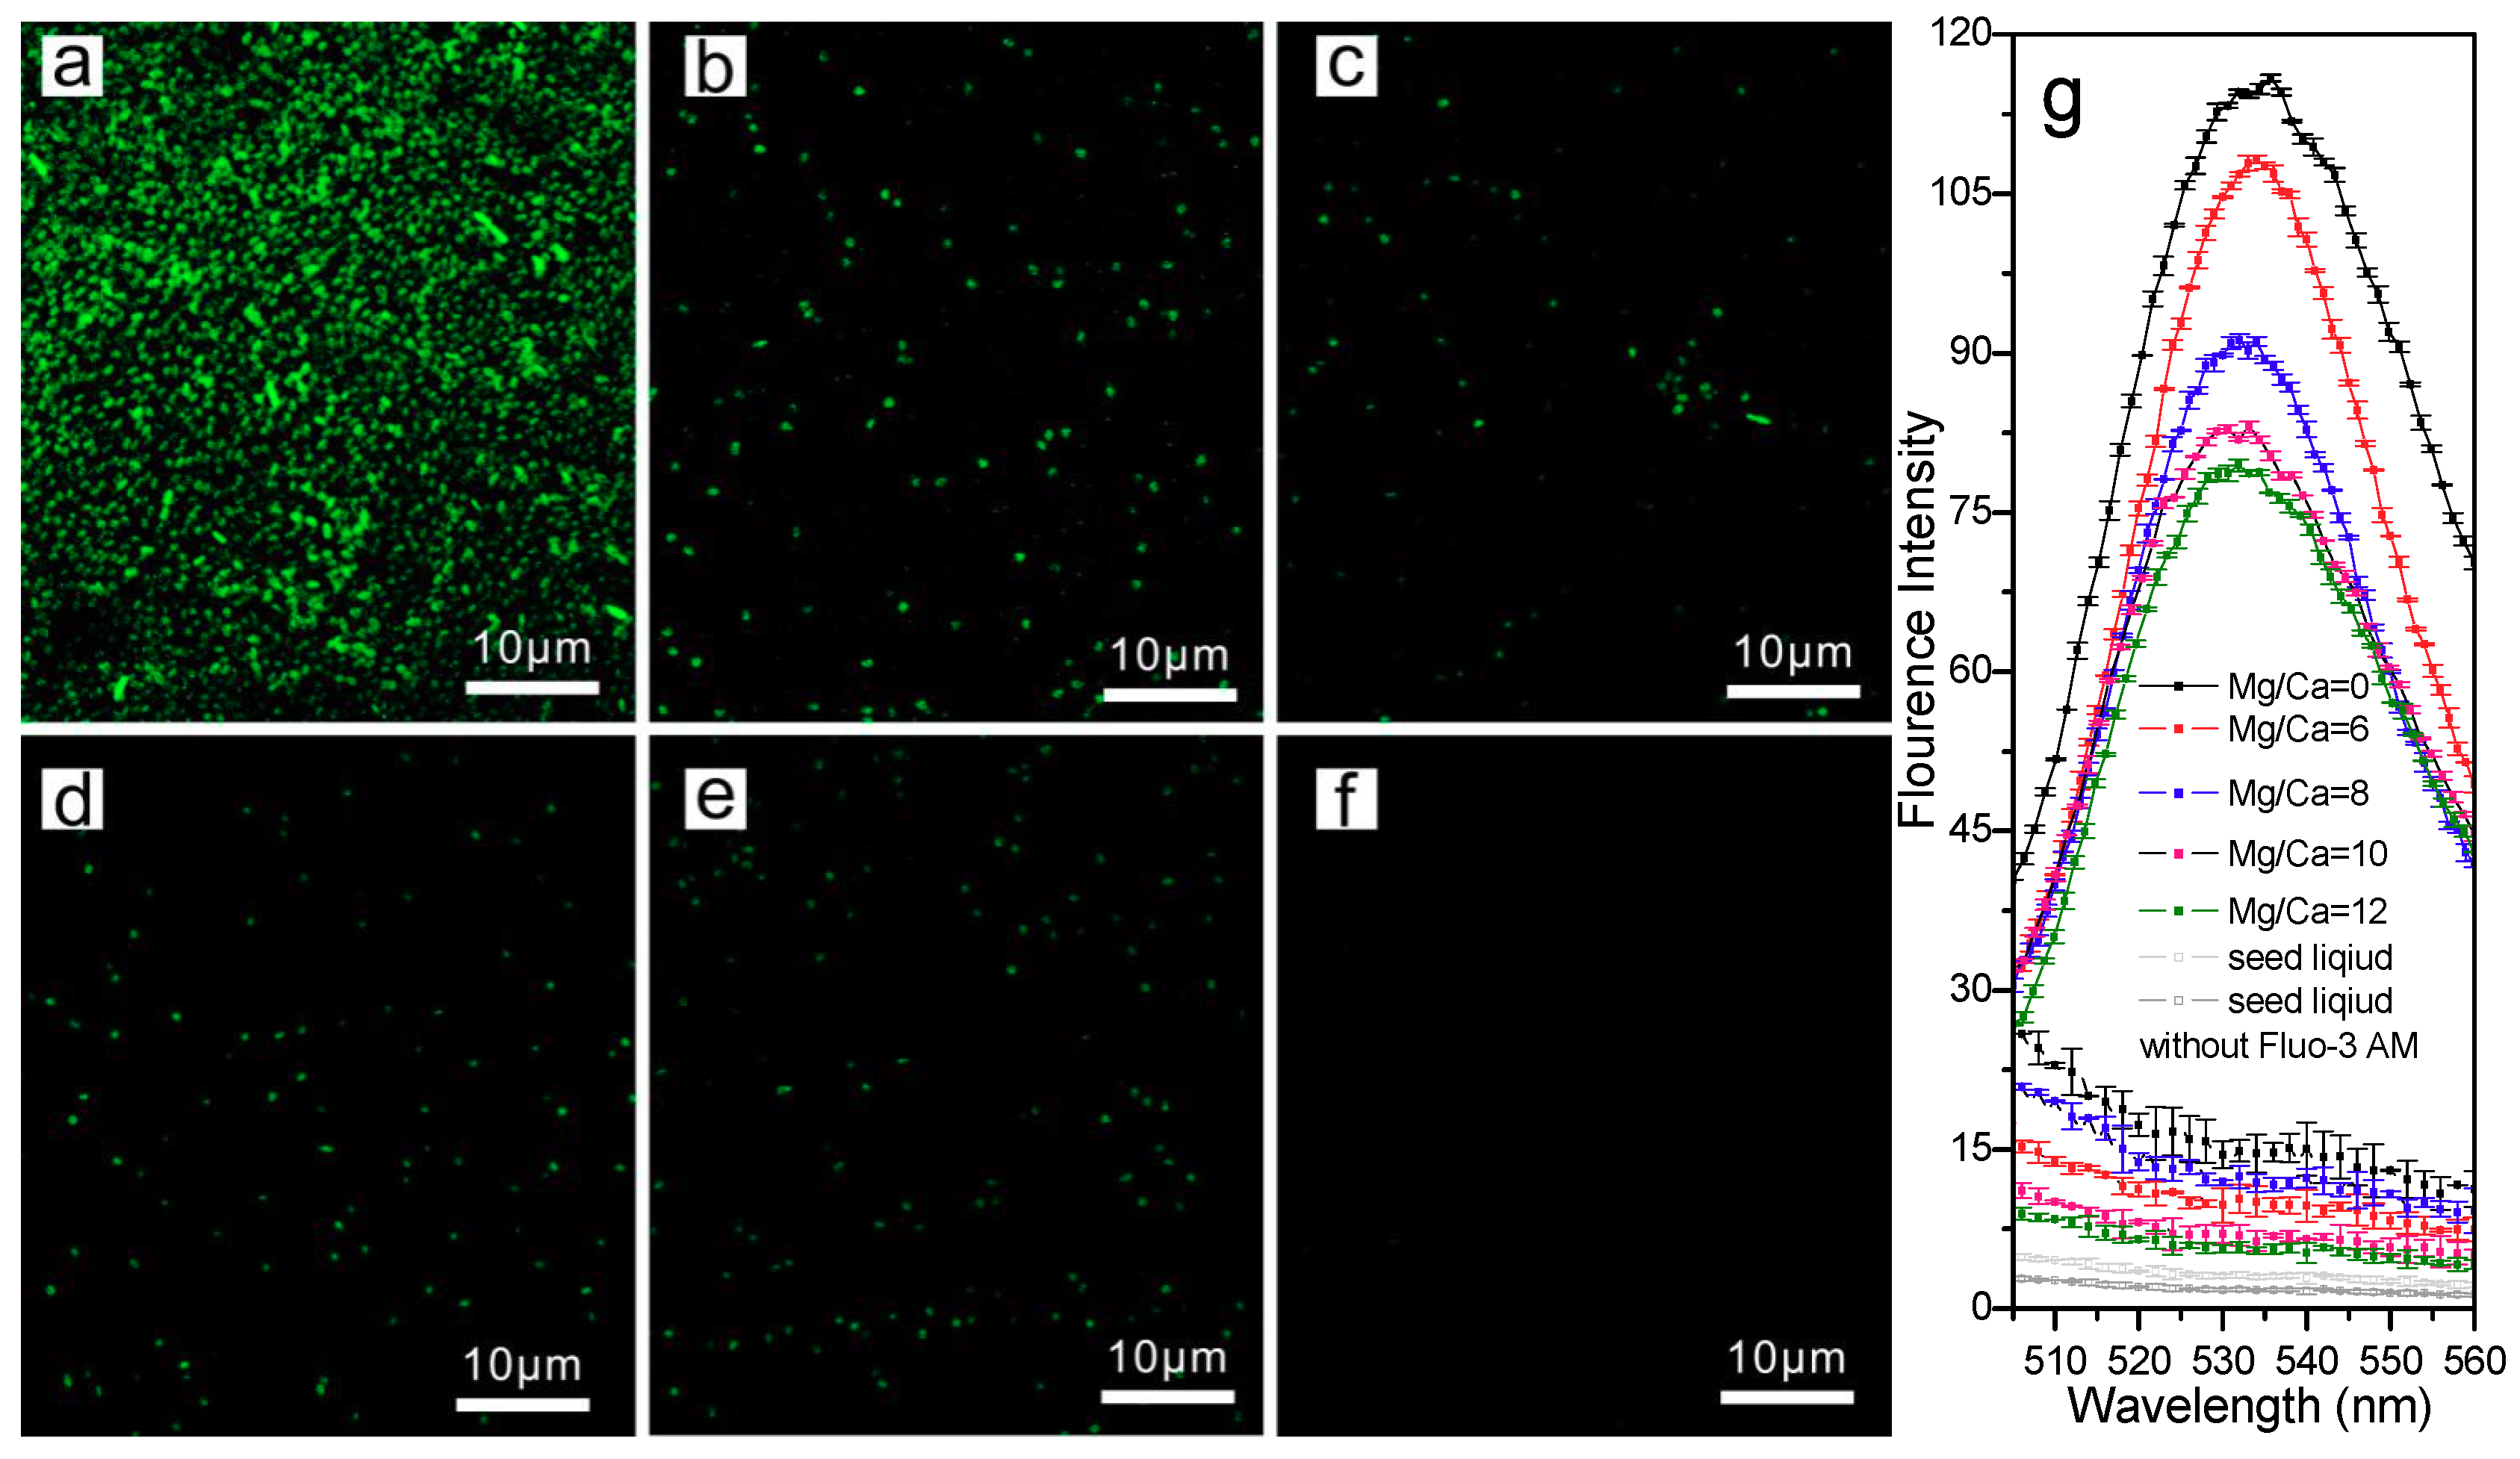
3.3. Ca2+ and Mg2+ Concentration, and the Electroconductivity

From the precipitation curve, it was found that 8% of Ca2+ and 9% of Mg2+ were rapidly deposited just at beginning of growth (Figure 3). In 100 h, 13% of calcium ions and 16% of magnesium ions were precipitated (Figure 3). It could also be seen from the calcium ion sedimentation curve that with the appearance of carbonate ions, the deposition rate also increased significantly from 100 to 216 h. Ca2+ (~95%) and Mg2+ (~50%) in the experimental group were quickly precipitated during this time (Figure 3). The conductivity of the culture medium was also found to be reduced due to the rapid removal of metal cations from solution (Figure 3c).
As shown in Figure 4, the precipitation rates (μg L−1 s−1) of Ca2+ in the experimental groups were 0.93, 0.87, 0.85, 0.83, and 0.79 at Mg/Ca molar ratios of 0, 6, 8, 10, and 12. The deposition rate of Ca2+ gradually decreased with increasing Mg/Ca ratios (Figure 4b). Approximately 50% Mg2+ and 96% Ca2+ (Figure 4a) in the culture medium could be precipitated by B. licheniformis SRB2 through the bio-precipitation process. The precipitation rates (μg L−1 s−1) of Mg2+ in the experimental groups were 0, 0.18, 0.16, 0.16, and 0.12 at Mg/Ca molar ratios of 0, 6, 8, 10, and 12 (Figure 4b)
Overall, after about 300 h (12.5 days), about 98% of the Ca2+ ions and 50% of the Mg2+ ions in the experimental group had precipitated. This shows that SRB2 has a high precipitation efficiency for calcium and magnesium ions.

3.4. The Extra- and Intra- Cellular Precipitation of Ca2+ and Mg2+ Ions, and Biominerals Induced by SRB2

In an alkaline environment, the dissolved calcium and magnesium ions precipitated in the form of several kinds of biominerals with unique characteristics under the influence of SRB2 activity, while there were no minerals in the abiotic control groups at pH of 6.0 and 7.2. In the abiotic experiments at pH 8.0 and 9.2, it was found that, at a Mg/Ca ratio of 0, a large number of minerals with complex rhombohedrons were formed and a few minerals had an elongated and spherical shape, while at other Mg/Ca ratios, the precipitates were irregular and rough (Figure S3). Organic elements such as P, S, and N could not be detected (Figure S4).

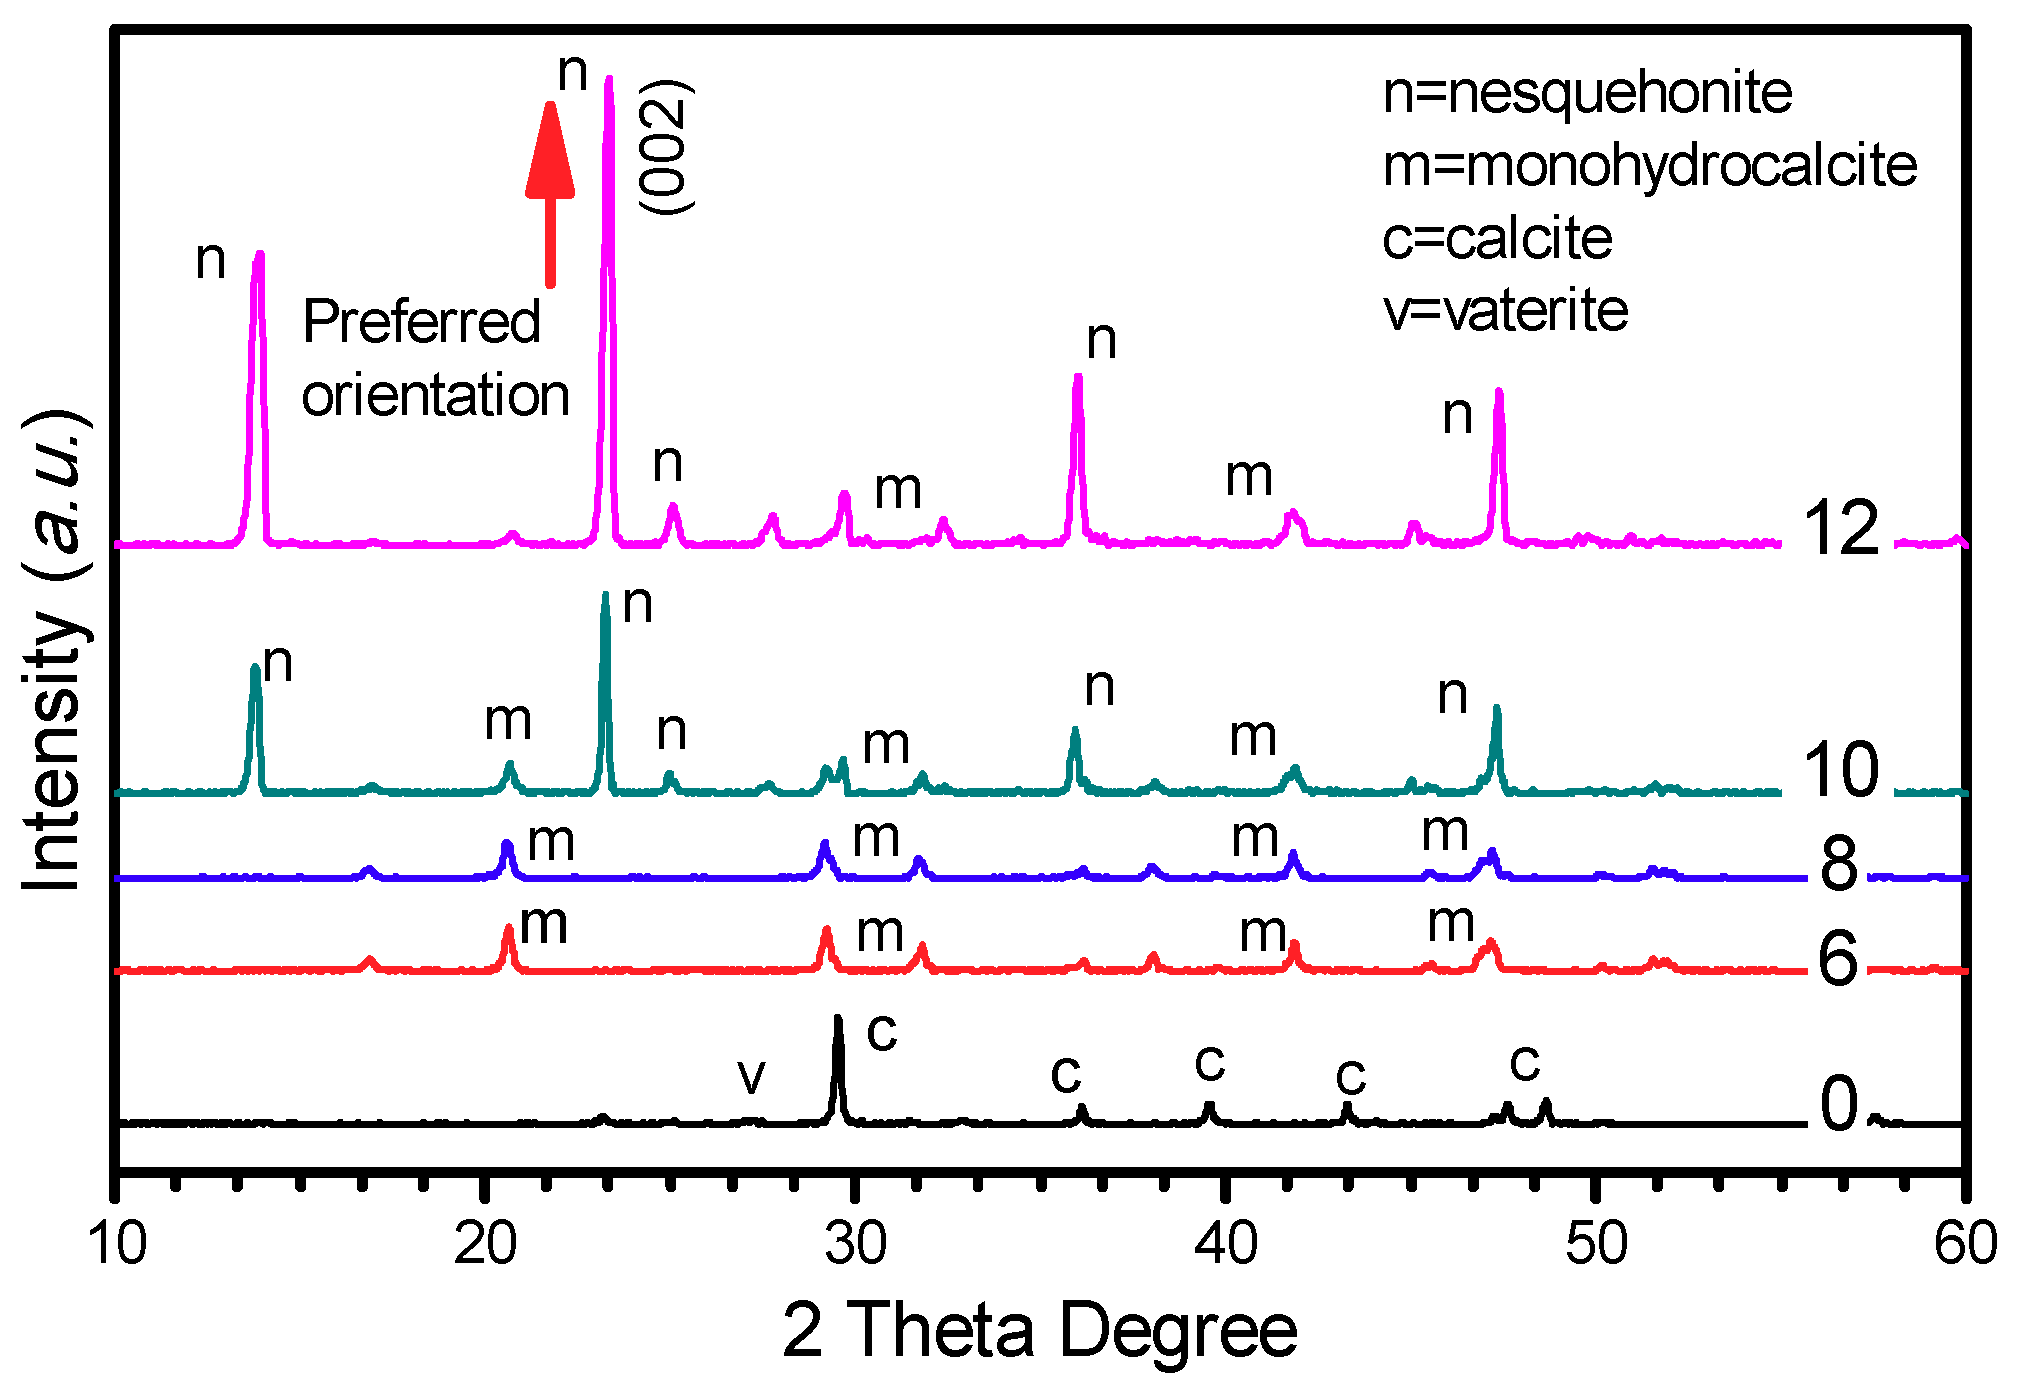
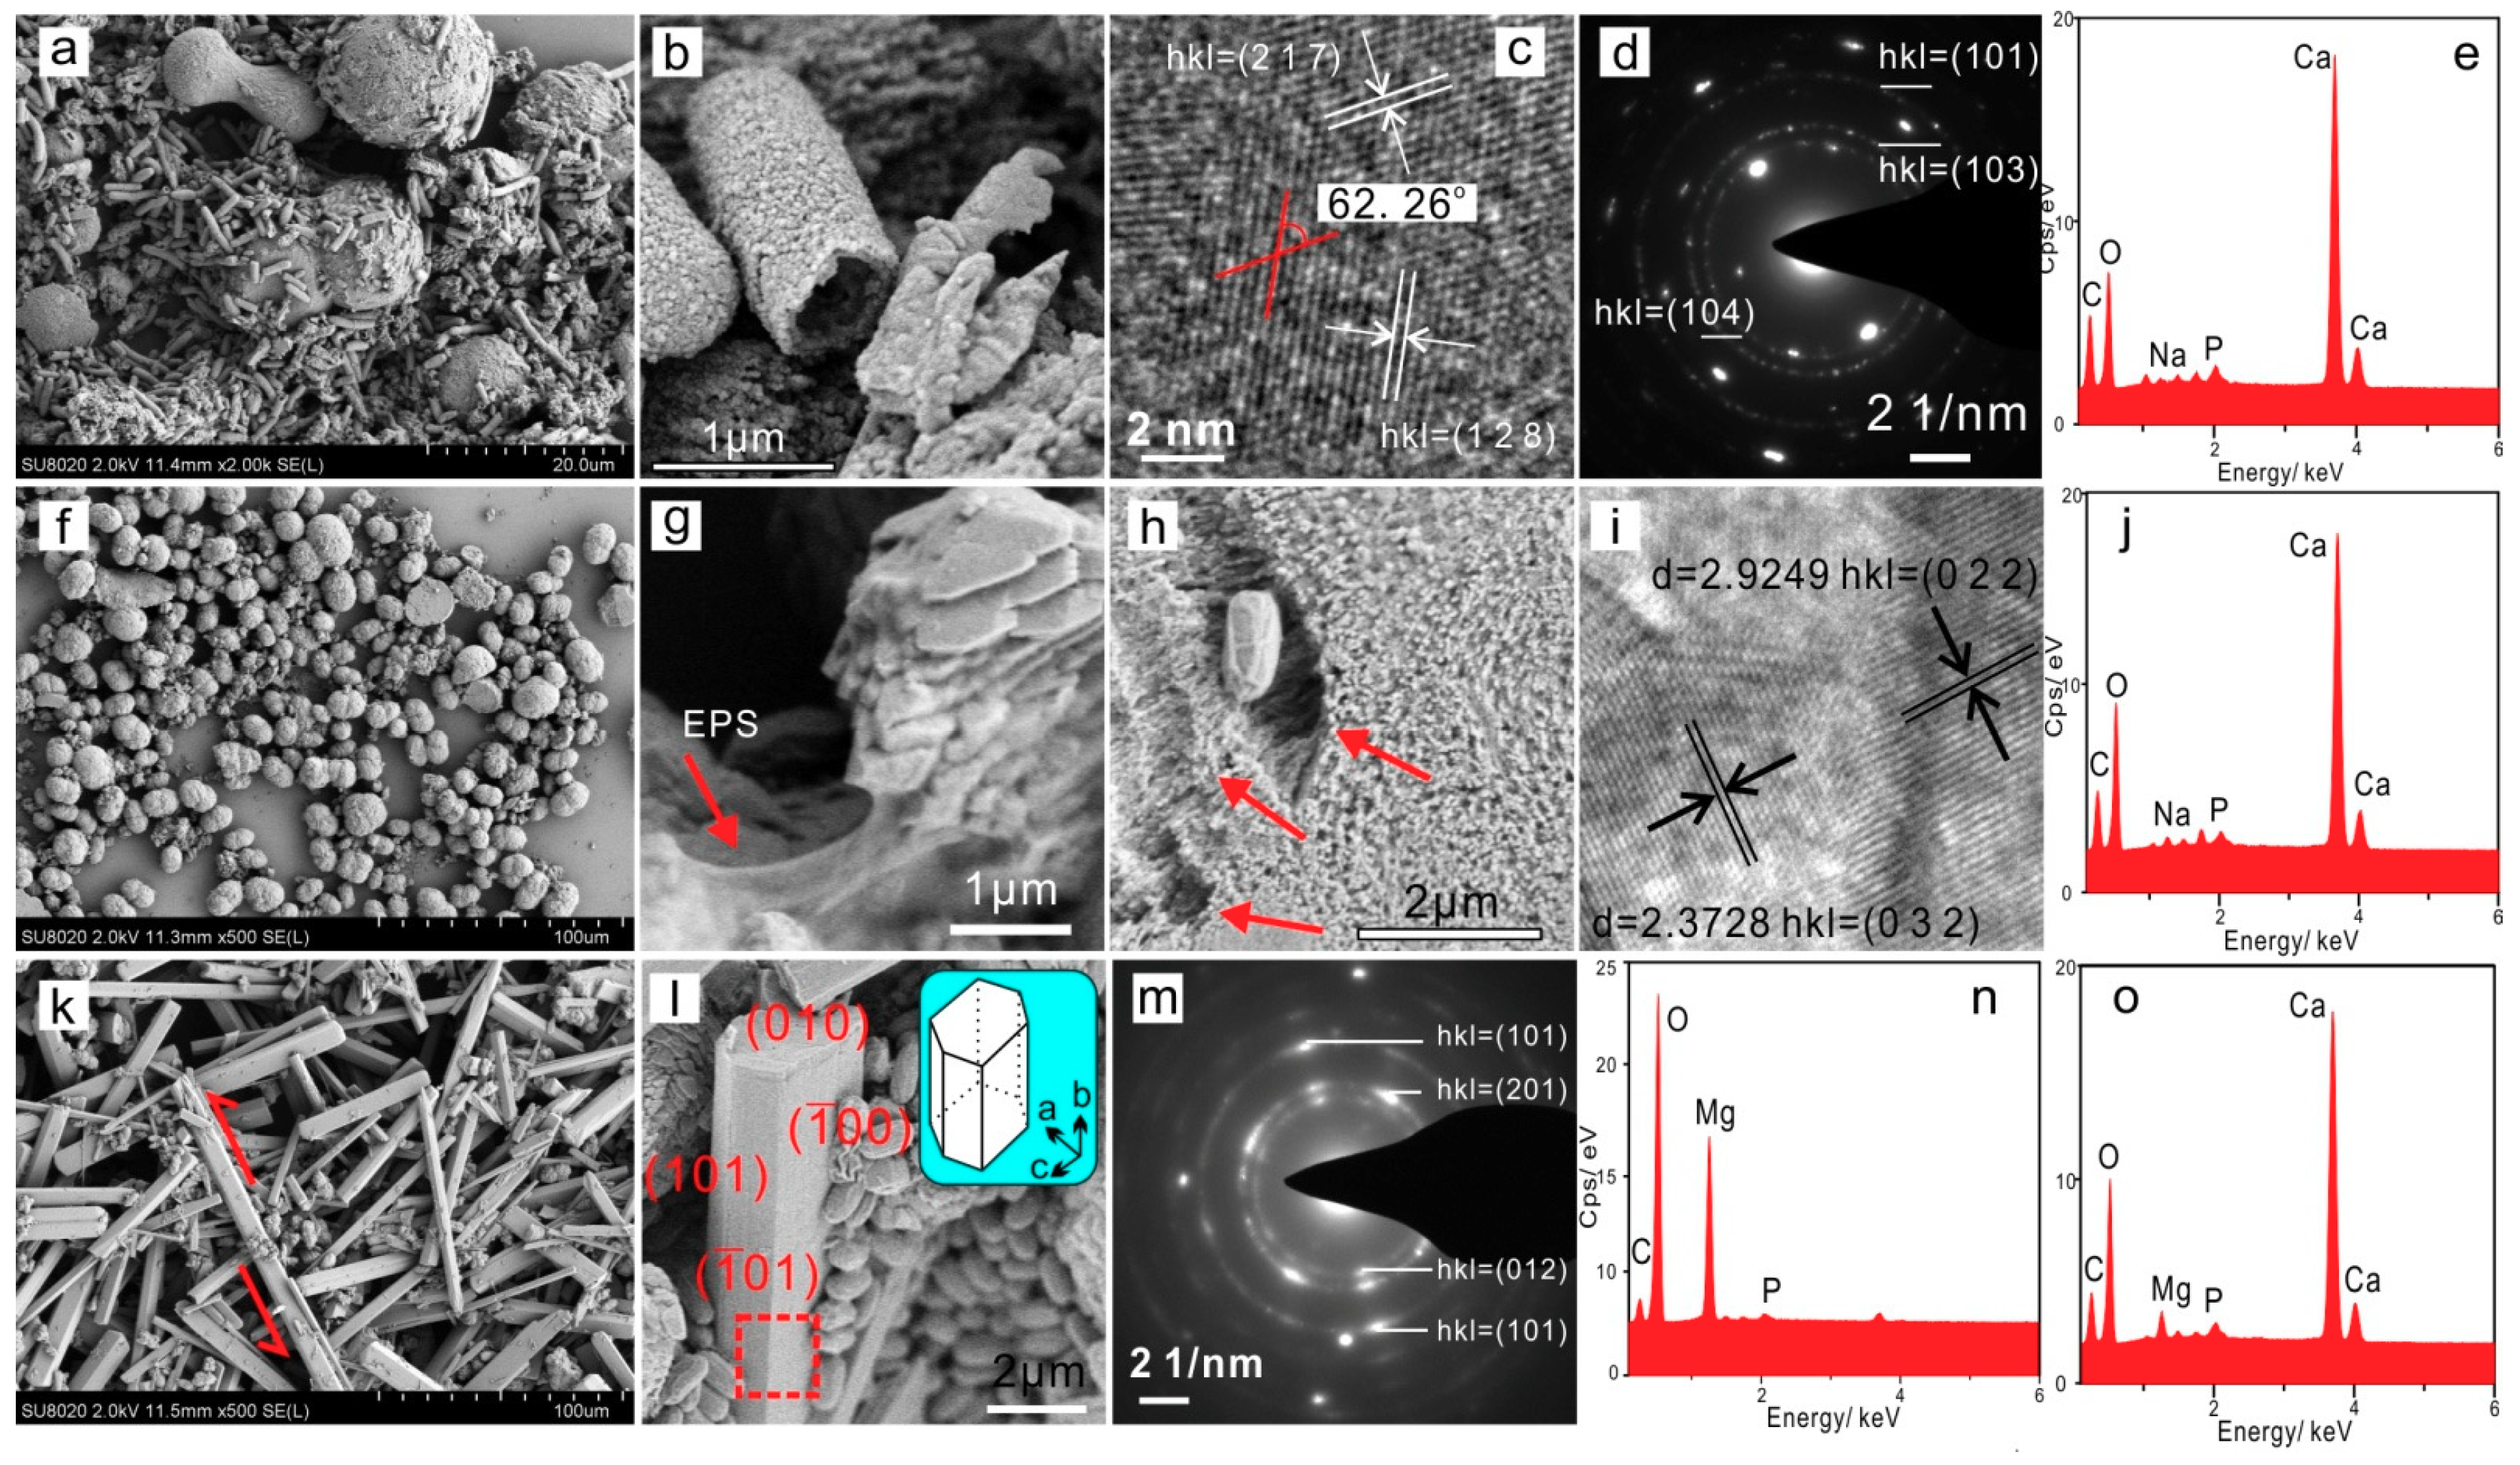
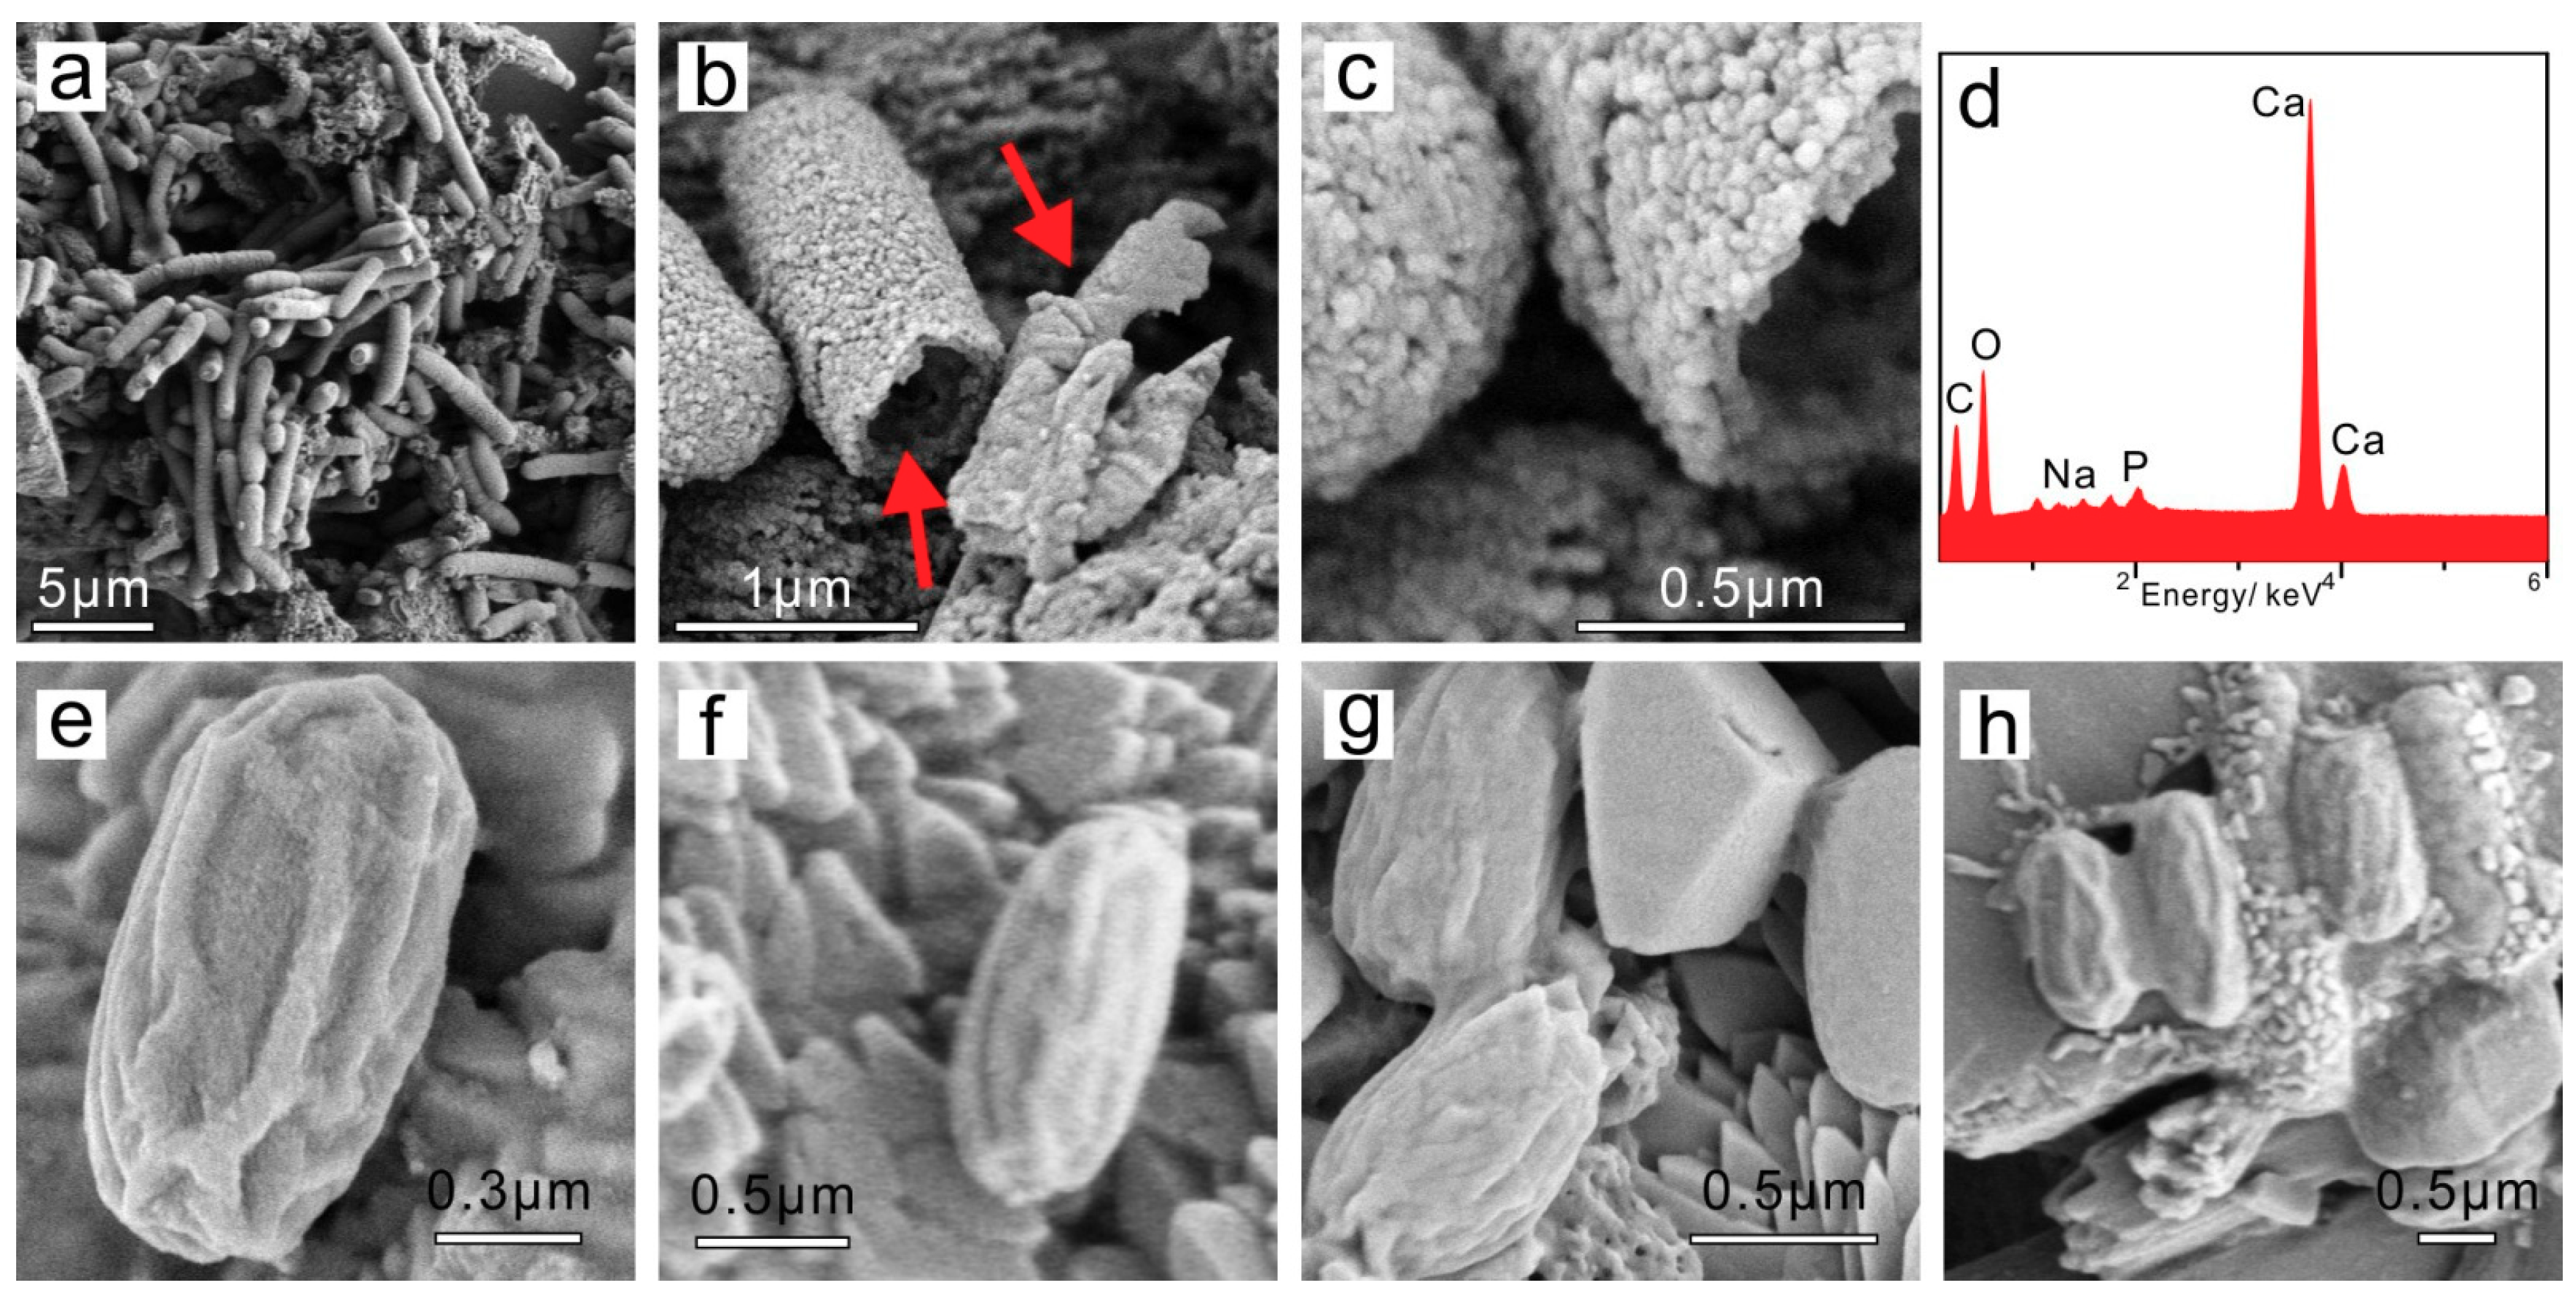
3.4.1. Extracellular Biominerals

At the Mg/Ca ratio of 0, the minerals in the experimental group were calcite (95%) and vaterite (5%) (Figure 5 and Figure S4), and had a spherical and dumbbell morphology (Figure 6a), which mainly contained C, O, Ca, and P elements (Figure 6e). In the biotic calcite crystal, (217) lattice fringes were in contact with (128) lattice fringes at an angle of about 62.26°((217)(128)), indicating that there were many dislocations due to the involvement of SRB2 (Figure 6c and Figure S5). This change in crystal structure was one of the signs that proved the biogenesis of the minerals. Interestingly, the bacterial cell in the experimental group was surrounded by a mineralized shell with a chemical composition of CaCO3 (Figure 6b). Vaterite is a type of unstable anhydrous calcium carbonate, and easily transforms into the most stable calcite [46]. However, when organic factors take part in the formation process of vaterite, this stability increases [47]. Figure 5 and Figure 6d show the presence of vaterite. According to the above references, we could infer that the organic factor SRB2 bacteria in the experimental group may be one reason why vaterite became more stable. The exterior structure of the bacterium could influence the mineralization process. It has been reported that the decrease of nucleation energy caused by the functional groups on the bacterial surface could induce the mineralization process more easily [48]. Additionally, organic matters secreted by the bacteria played a key role in the regulation of the mineral morphology and phases [45,49,50]. A number of studies have confirmed that some amino acids have an ability to promote the formation of vaterite crystals [51,52,53,54]. Therefore, in this study, amino acids on the peptidoglycan of the SRB2 bacterial cell wall may have had a close relationship with the formation of vaterite at the Mg/Ca molar ratio of 0.
At Mg/Ca ratios of 6 and 8, the minerals were ellipsoid-shaped monohydrocalcite (100%, Figure S5b,c) with a rough surface (Figure 5f,i), which mainly contained C, O, Ca and P elements (Figure 6j). EPS and the survived bacterial cell could be clearly recognized (Figure 6g,h).
At Mg/Ca ratios of 10 and 12, a mixture of columnar nesquehonite and ellipsoid-shaped monohydrocalcite (Figure 5 and Figure 6k–m) was formed. The mass ratio of nesquehonite increased from 85.5% to 90.5% when the Mg/Ca ratio changed from 10 to 12, and that of monohydrocalcite decreased from 14.5% to 9.5% (Figure S5d,e). (002) preferred orientated nesquehonite (Figure 5) was the other characteristics that proved the biogenesis of minerals, resulting in significant elongation morphology (Figure 6k). The elemental composition of nesquehonite included C, O, Mg, and P, and that of monohydrocalcite consisted of C, O, and Ca in addition to a little Mg and P (Figure 6n,o).
The nucleation and growth of the nesquehonite crystal was promoted because of the existence of the SRB2 bacteria due to the fact that SRB2 bacteria increased the pH value of the culture medium from 7.2 to 9.2. Microorganisms often promote the formation of highly supersaturated microenvironments to facilitate the precipitation of carbonates. Furthermore, the EPS of bacterial cells could absorb Ca2+, Mg2+, or other metallic cations to act as the nucleation sites, even when supersaturation has not been reached in the surrounding environment [55]. Nucleation and growth of the nesquehonite crystals occurred in an organic environment rich in SRB2 bacteria and metabolites, indicating that microbial mediation is an active process and can influence the morphology and crystal structure.
In fact, the mineral precipitation process mediated by organic components occupies an important position in both present and ancient environments [56,57,58,59,60,61,62,63,64,65,66,67,68,69,70]. The adsorption of Ca2+ and Mg2+ ions on the bacterial cell surface is the initial step of biomineralization. The ion adsorption ability of bacteria is mainly caused by the surface charge and zeta-potential [71]. It has been reported that different functional groups on the surface of bacteria such as hydroxyl, carboxyl, phosphoryl, and amide groups can contribute to this nucleation process [48,49]. In a previous study, it was found that some bacteria can preferentially adsorb Mg2+ on their membranes to induce the formation of dolomite, and others adsorb Ca2+ to induce calcite [29]. However, in our study, the mineral formed by SRB2 bacteria was not dolomite, but nesquehonite. With the increasing Mg2+ ion concentration, SRB2 could break down the hydrated membrane around the Mg2+ ion [43] to promote the nucleation of Mg2+ on the cell surface, leading to the formation of nesquehonite. The extracellular nucleation process not only contributed to the precipitation of Mg2+ ions on the cell surface, but also to that of Ca2+ ions. With increasing Mg/Ca ratios, Mg2+ ions took up more nucleation sites than the Ca2+ ions, leading to the formation of the nesquehonite mineral.

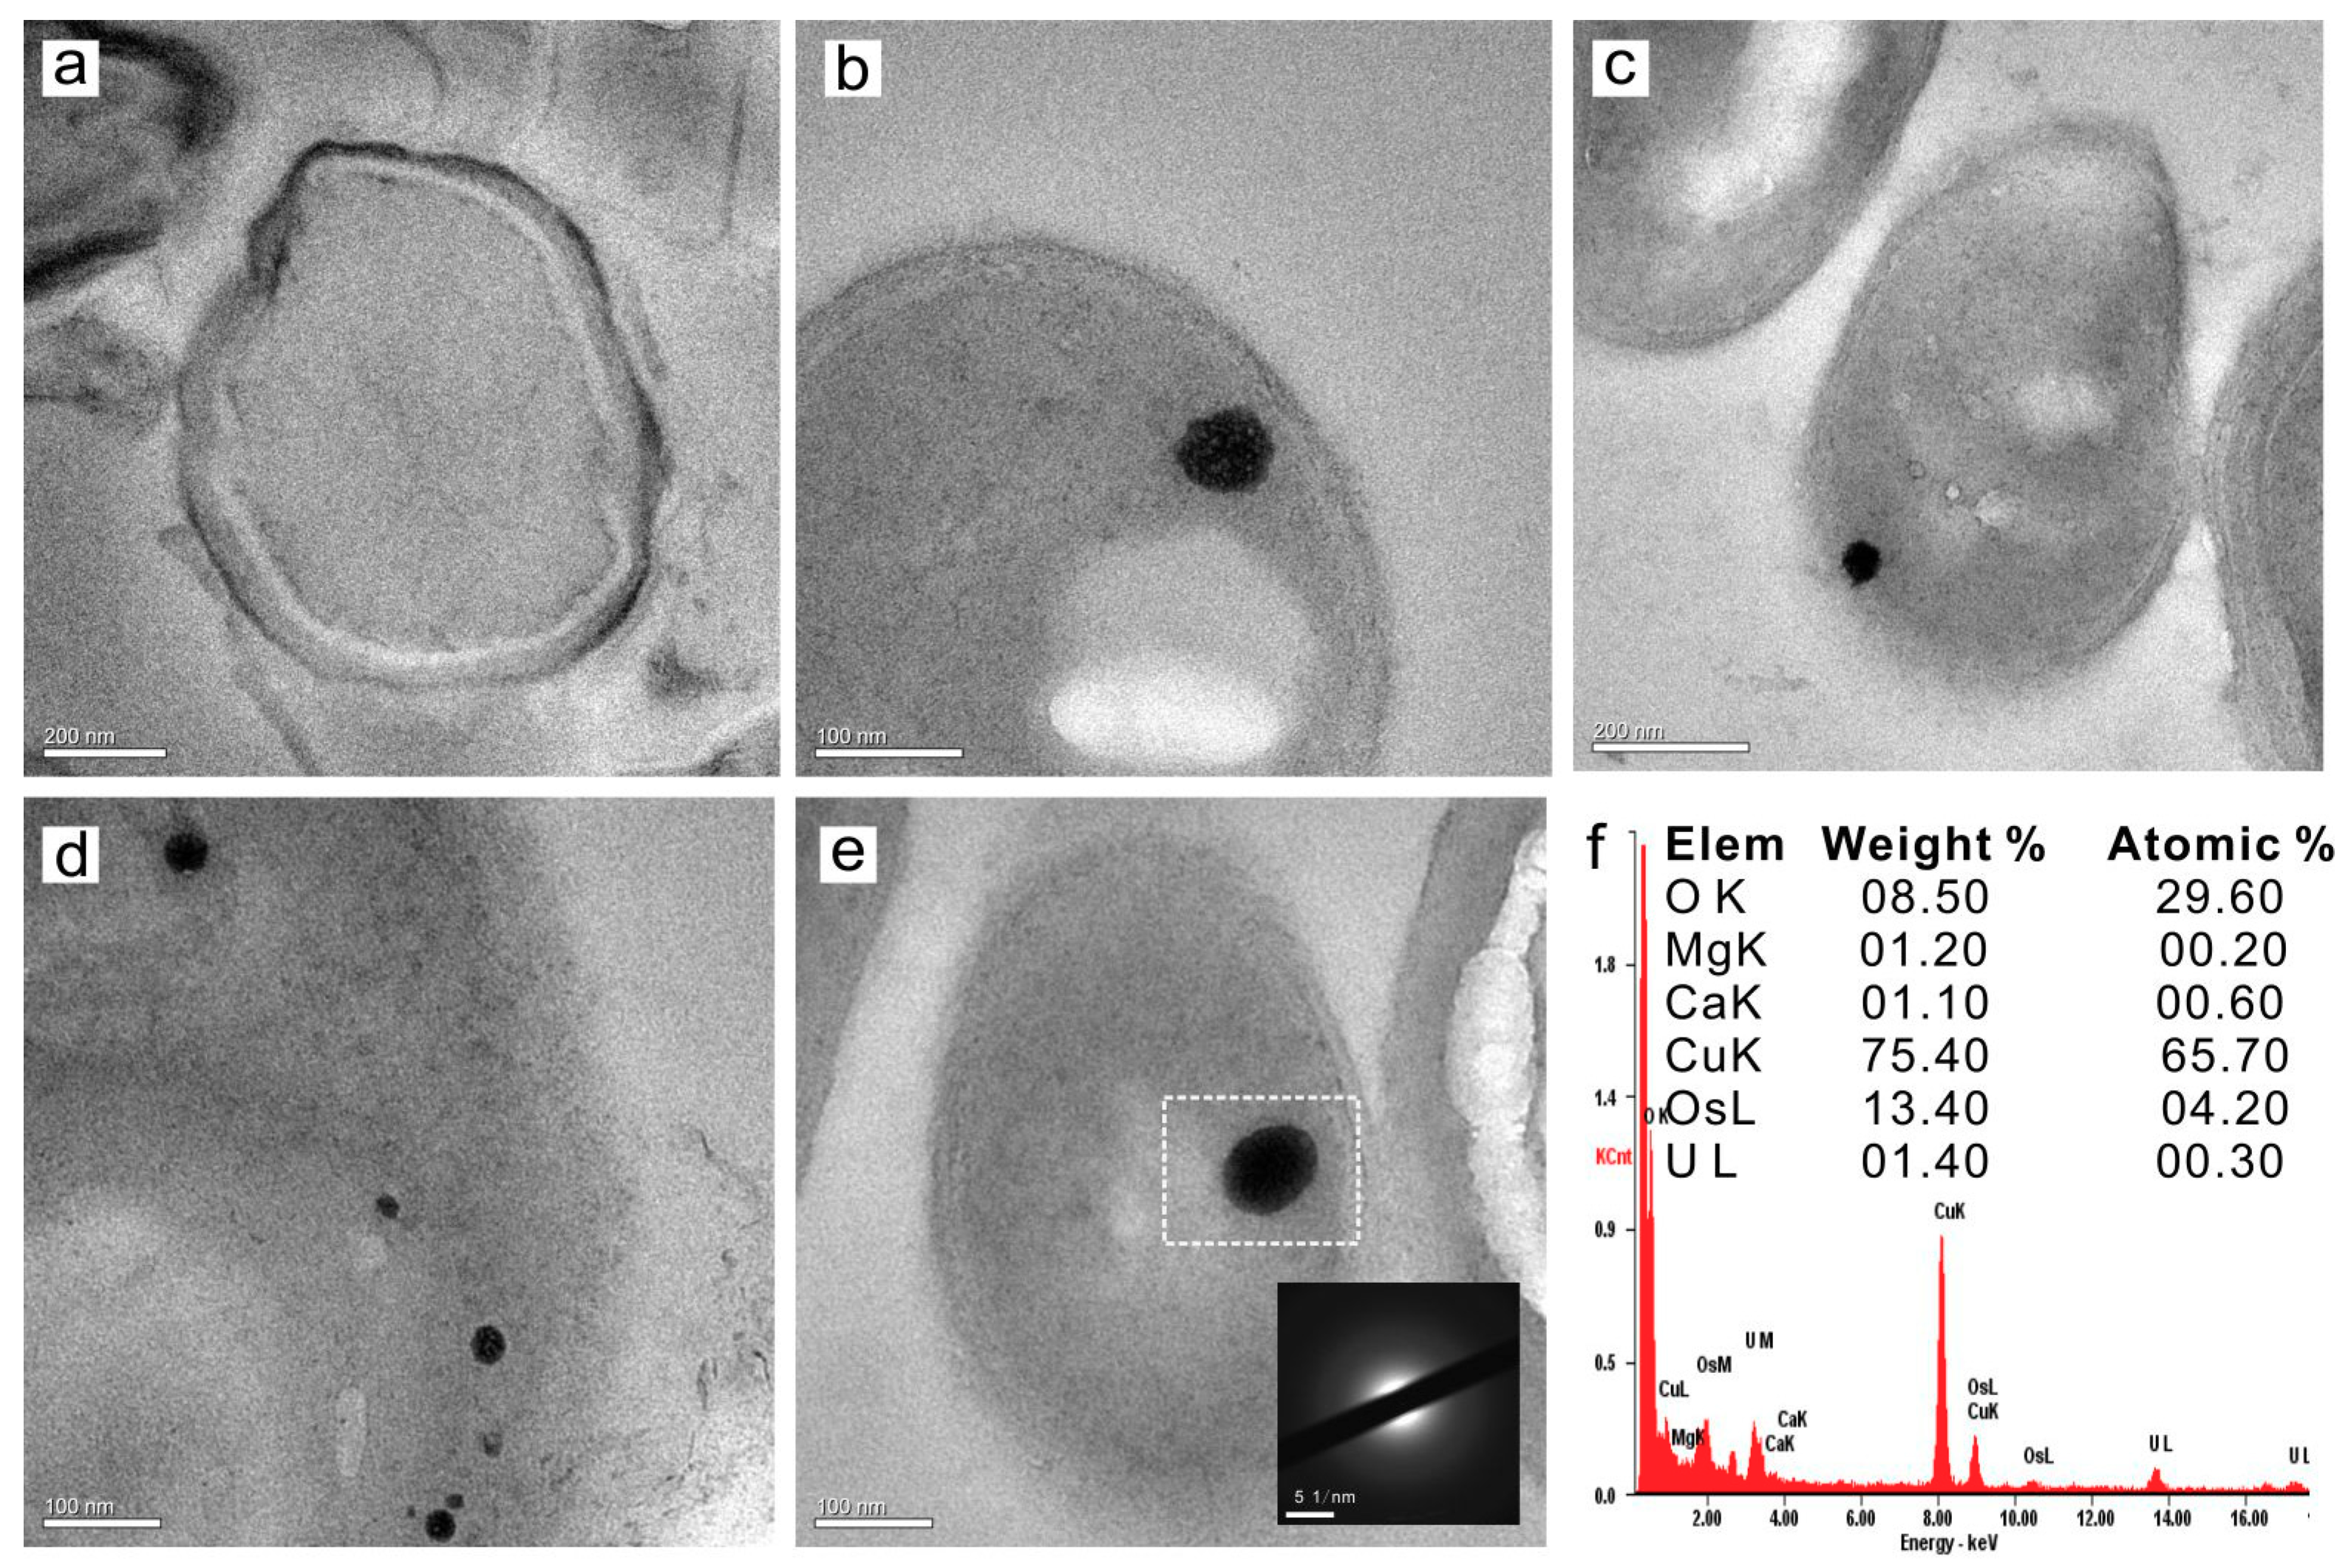
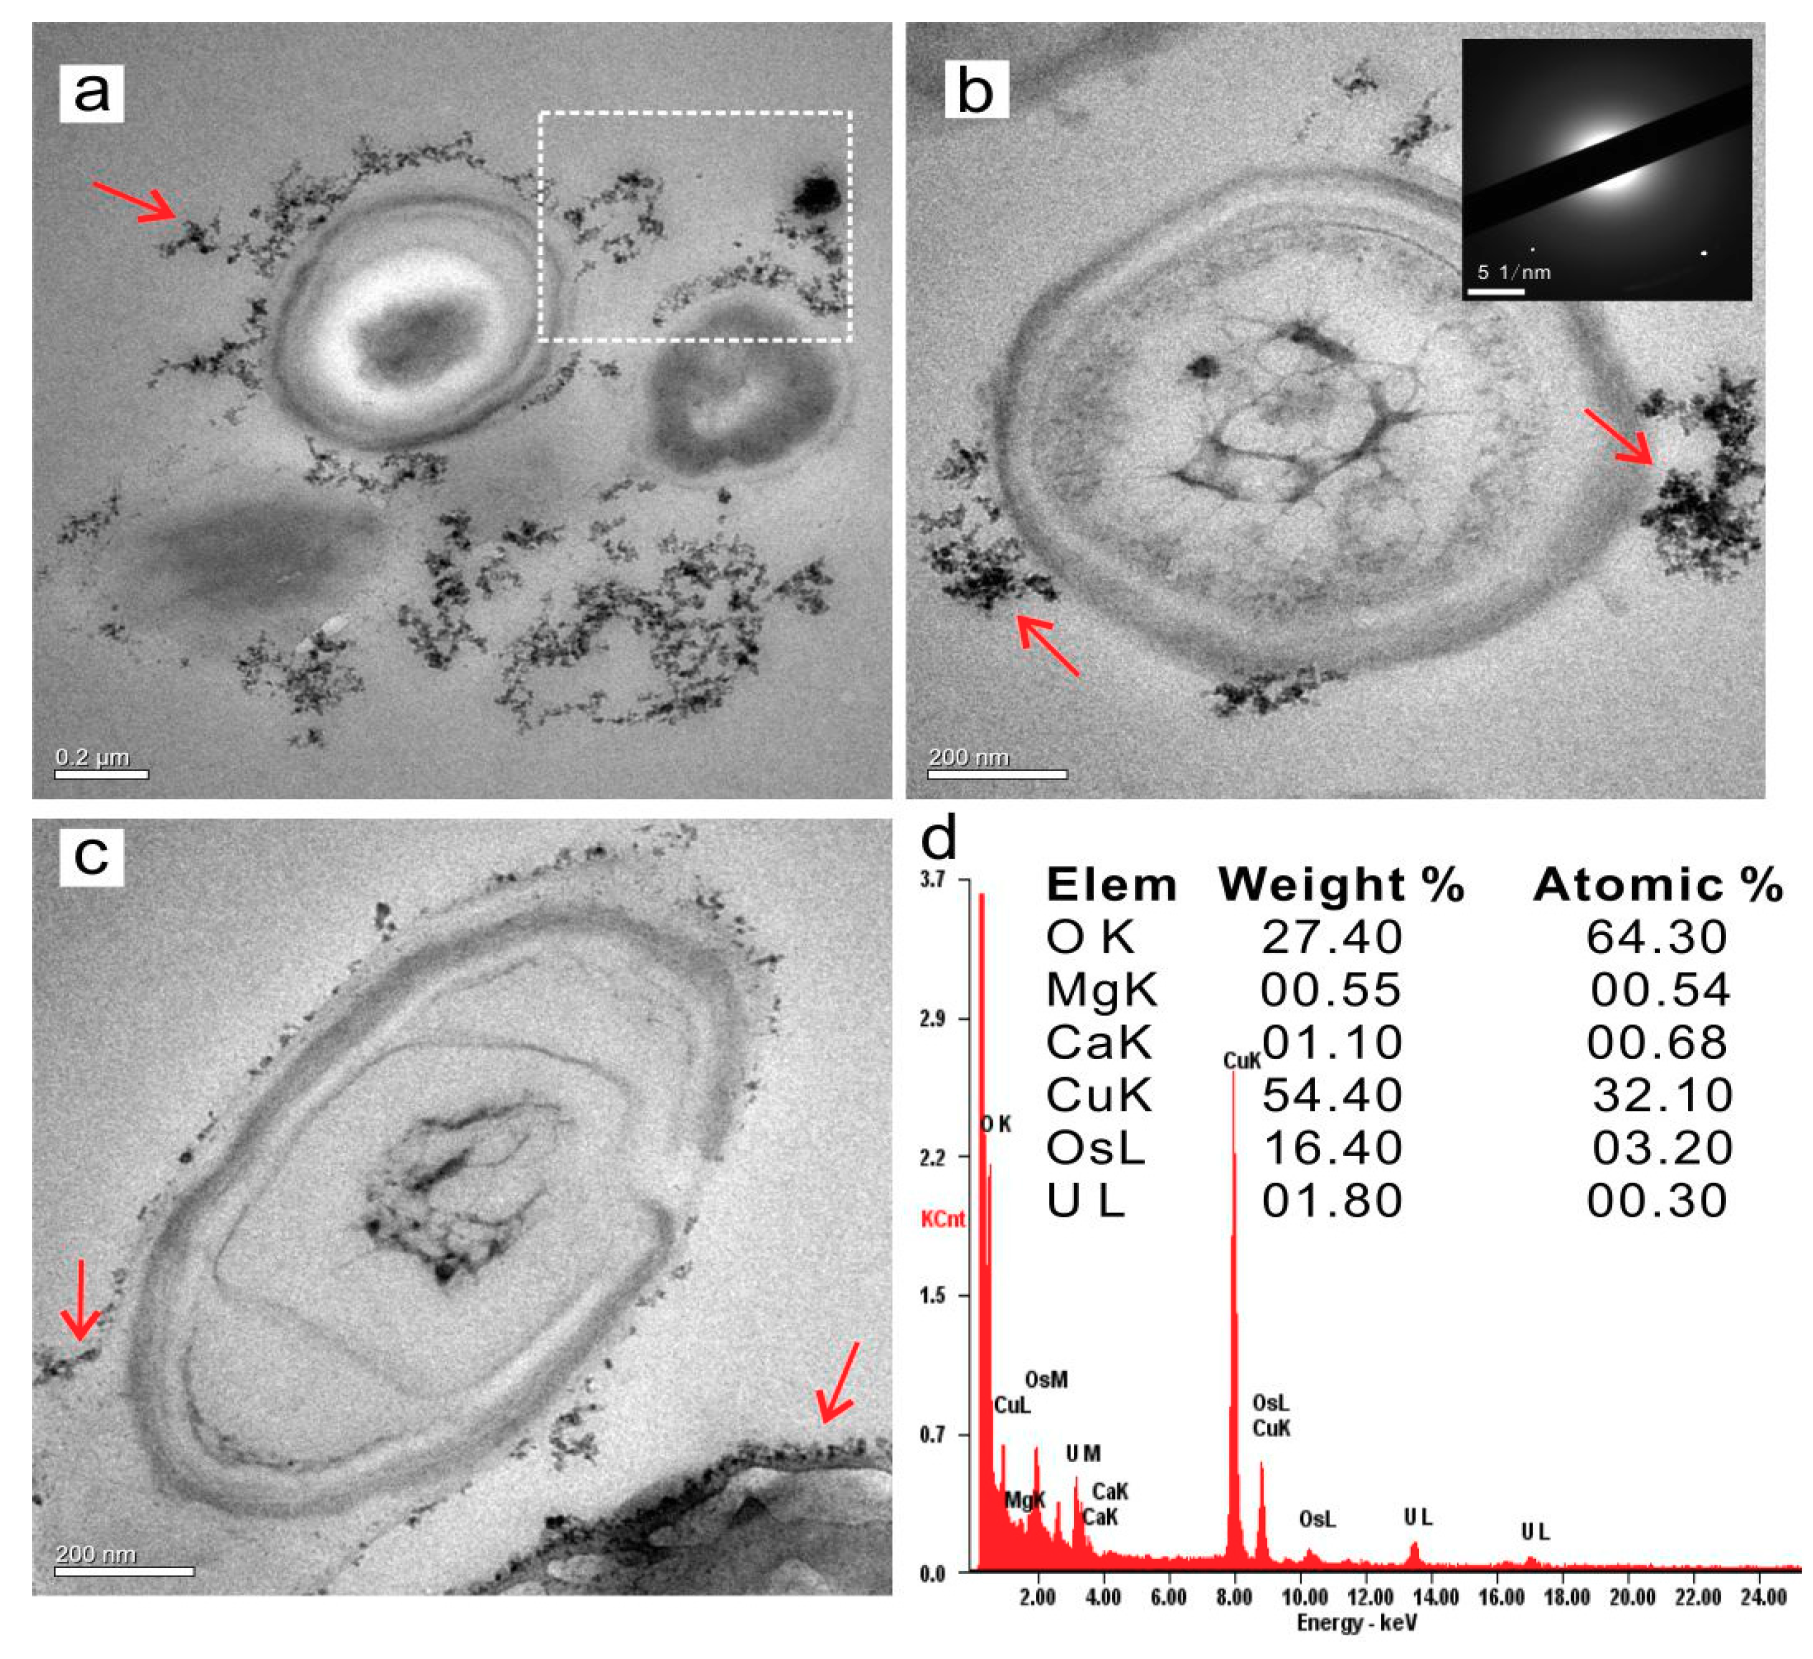
3.4.2. Intracellular Amorphous Inclusions

If green fluorescence can be emitted when using Fluo-3AM as an indicator of the Ca2+ ion, the presence of Ca2+ inside the cells can be determined. However, one thing to note is that the cells themselves do not emit fluorescence. The results showed that the cells emitting green fluorescence at different Mg/Ca molar ratios (Figure 7a–e), indicating that there was a large number of Ca2+ ions inside the cells. The control group (Figure 7f) without Fluo-3AM could not emit the green fluorescence, suggesting that the cells themselves did not emit spontaneous fluorescence. The fluorescence intensity of Ca2+ inside the cell decreased from 130 cps to 90 cps when the Mg/Ca ratio increased from 0 to 12 (Figure 7g), namely, the intracellular Ca2+ concentration decreased with increasing Mg/Ca ratios, indicating that Mg2+ ions could interfere with the transport of Ca2+ ions from the outside to inside the cell. The reason may be that, with increasing Mg2+ concentration (from 0 to 0.12 M), more Mg2+ ions could enter the cell by diffusion through ion channels due to the smaller size of Mg2+ than that of Ca2+ ions. Mg2+ ions can occupy the sites of Ca2+ ions in the Ca2+ channel, resulting in a decrease in the fluorescence intensity of intracellular Ca2+ ions. Therefore, the decrease of intracellular Ca2+ fluorescence intensity was the result of increasing Mg/Ca molar ratios.
In fact, higher concentrations of calcium and magnesium ions are toxic to cells, so cells actively limit calcium and magnesium ions to certain areas (such as vacuoles in plant cells) when these ions enter the cell, resulting in calcium and magnesium concentrations several orders of magnitude higher than in other areas that leads to the formation of amorphous minerals [72]. There were many intracellular nanometer-scaled inclusions (Figure 8b–e) without any crystalline structure (Figure 8e, inset) in the cells of SRB2, while there were no intracellular inclusions in cells cultured in the medium without any calcium and magnesium (Figure 8a). The EDS results revealed that the area mainly contained C, O, Ca, and Mg elements (U and Os came from the fixing agent) (Figure 8f).
Microbial intracellular mineralization is a very important process, and even very common in some types of microorganisms [72]. The results of this experiment demonstrated that the presence of intracellular inclusions containing Ca and Mg in SRB2 bacteria also contributed to the decrease in Ca2+ and Mg2+ ions concentrations. In fact, for many microorganisms, extracellular and intracellular biomineralization can occur at the same time [23,45,49,72]. It has been found that many organelles, even nucleic acid, can be involved in the intracellular biomineralization process [73]. Phosphorous groups in the cell also contribute to the absorption of Ca2+ and Mg2+, resulting in intracellular biomineralization [74]. It is well known that Magnetospirillum gryphiswaltz produces intracellular magnetite nanocrystals and that the biomineralization of magnetite nanocrystals requires several magnetosome-associated proteins. Generally speaking, intracellular Ca2+ and Mg2+ ions cannot reach a very high concentration due to the need for information transmission and life activities. Additionally, the study revealed that intracellular precipitation may be caused by the relatively worse ability to adjust pH and ion concentration in some special area of cells [72]. Therefore, it could be concluded that the intracellular biomineralization of SRB2 also contributed to the decrease of Ca2+ and Mg2+ ion concentrations in the medium. In the environment where both the Ca2+ and Mg2+ ions were present, there would be competition in transport from the outside to inside the cell. In the process, more Mg2+ ions took up the sites of Ca2+ ions in SRB2 cells, and the fluorescence intensity of intracellular Ca2+ ions also declined. The decreased Ca2+ and Mg2+ ions caused by a single SRB2 cell may be tiny, however, the number of SRB2 cells was very large, thus, the intracellular biomineralization induced by SRB2 also played a great role in the precipitation of Ca2+ and Mg2+ ions.
We assumed that the average volume of a single cell was Vs, the average radius of the inclusions was r1, the total number of cells in the medium was N, the average number of inclusions in a cell was n, the density of the inclusion was ρ, and the molar mass of inclusions was M. It was approximately considered that 1 mol of the inclusions contained 1 mol of calcium and magnesium ions, respectively.
Thus, the total volume of inclusions was ((2)–(7)):
V = v s · N · n
v s = 4 3 π r 1 3
N = O D m a x · 8 · 10 8
V = 4 3 π r 3 · O D m a x · 8 · 10 8 · n = 1.06 · 10 9 · π r 3 · O D m a x · n
The total moles of inclusions are:
ω = V · ρ M
ω 1 = 1.06 · 10 9 · π r 3 · O D m a x · n · ρ M = 1.29 · 10 9 mol
where r1 = 20 nm; r2 = 1 μm; γmax = 90 nM, ODmax = 1.1; n = 1; ρ = 2.93 g/cm3 (typical ACC density [75]); and M = 100.1 g/mol (typical ACC molar mass [75]). The results of the EDS showed that the inclusions contained basically the same calcium and magnesium ions. In addition to the calcium and magnesium ions that were immobilized in the inclusions, the free ions inside the cells also needed to be calculated. According to the published data on Bacillus subtilis [76], we set the maximum value of intracellular calcium ions concentration as 90 nM, while the maximum concentration of magnesium ions was 10 mM [77].
The total volume of the cells is:
V c e l l = 4 3 π r 2 3 · N
The number of moles of intracellular free calcium ions is:
ω 2 = γ m a x · V c e l l = γ m a x · 4 3 π r 2 3 · N = 3.31 · 10 13   mol
The number of moles of intracellular free magnesium ions is:
ω 3 = γ m a x · V c e l l = γ m a x · 4 3 π r 2 3 · N = 3.68 · 10 11   mol
where r2 = 1 μm; γmax of Ca2+ = 90 nM; γmax of Mg2+ = 10 mM; and ODmax = 1.1. Based on the intracellular calcium ion fluorescence intensity, we can see that the concentration of intracellular calcium and magnesium ions varies under different culture conditions (Figure 7). The calculations limit the maximum amount of calcium and magnesium ions that can be precipitated by the cells. For calcium ions, the maximum amount of precipitation occurs when the Mg/Ca ratio was zero. For magnesium ions, the maximum precipitation amount occurred when the Mg/Ca ratio was 12. The calculated results show that the intracellular process also contributes to the precipitation of calcium and magnesium ions as shown in Equations (8)–(10).

3.5. The Mechanism of Ca2+, Mg2+ Bio-Precipitation Induced by SRB2

In order to further understand the process of microbially induced bio-precipitation of carbonate minerals and the role of microbial organic matter in the process of biomineral formation, the stable carbon isotope composition of biotic minerals, abiotic minerals, organic and inorganic components in the medium was analyzed. Furthermore, FTIR analysis of the biominerals was performed, and at the same time, the bacterial EPS were extracted to analyze the amino acid composition.

3.5.1. Carbon Source for Bio-Precipitation

It can be seen from Table 1 that the carbon isotope values (δ13C, PDB) of the biominerals ranged from −16.12‰ to −18.01‰. The carbon isotope values of abiotic minerals at a Mg/Ca ratio of 0 (pH = 8.0, 9.2) were basically the same as those of the inorganic components NaHCO3 and Na2CO3 (especially Na2CO3), indicating that the carbon sources of abiotic minerals were all derived from Na2CO3 (~13‰). At the same time, it can be seen that the isotope values of the biotic minerals were more negative than those of the abiotic minerals and the inorganic components, which indicates that the carbon sources of the microbially induced biominerals are complex.
The isotope value of atmospheric carbon dioxide was approximately −8‰ and the organic compounds in the culture medium had a δ13C value of −18‰–−21‰. The isotope values for the biominerals ranged between the value of atmospheric carbon dioxide and those of the organic components, indicating that the biominerals had complex carbon sources and the decomposition of organic matter caused by SRB2 bacteria may play an important role in the stable carbon isotope composition. Due to the more negative carbon isotope values of the biominerals, the carbon was more likely to derive from the degradation and utilization of organic matter in the medium by SRB2 bacteria. The process of carbon in the organic matter transported to the biominerals involved both intracellular and extracellular processes. The microorganism degraded the organic matters containing polypeptide in the medium to smaller molecules that could be transported into the cell to supply the carbon and nitrogen resources for bacterial metabolism. Under the action of bacterial respiration, these smaller molecules of organic substances could be transformed into the metabolites, the most common product of which was carbon dioxide. This is because this carbon dioxide came not from the air, but from the metabolism of organic matter by microorganisms. The high concentration of carbon dioxide released by SRB2 was rapidly converted into CO32− and HCO3 under the action of extracellular carbonic anhydrase. CO32− and HCO3 ions combined with calcium ions under alkaline conditions could form minerals rapidly by relying on EPS as the nucleation sites. This result further explains the reason for the more negative carbon isotope values of the biominerals than those of the inorganic minerals.

3.5.2. Nucleation Sites of Extracellular Biominerals

Interestingly, the mineralized shell with a chemical composition of CaCO3 was found to surround the bacterial cell (Figure 9). SRB2 bacteria play an important role in the formation of these mineralized shells. The components and structures of the cell surface strongly influenced the final result of the mineralization process. It has been reported that the decrease of nucleation energy caused by the functional groups on the bacterial surface could induce the mineralization process more easily [42]. Perhaps, this was the main reason for the formation of the mineralized shells. In fact, the occurrence of the mineralized shell surrounding the cell also suggests that the EPS of SRB2 bacteria could act as nucleation sites. From the ultrathin slices of SRB2, it was also found that the mineral particles on the EPS, with an elemental composition of Ca, Mg, O, and C (Os and U came from the fixation process, Figure 10), had a weak crystalline structure due to the presence of the diffraction spots (Figure 10b, inset). This point also confirmed the fact that EPS acted as the nucleation sites.
It has already been verified that the EPS secreted by microorganisms can serve as the nucleation sites for biominerals [79]. These organic matters can promote the transportation of electrons and protons between the bacteria and the ambient environment [80,81]. Therefore, there would be a large number of microcrystalline minerals precipitated on the EPS after adsorbing the Ca2+, Mg2+, HCO3, and CO32− ions [37,82]. The microcrystalline CaCO3 particles gradually grew and were piled together to form the carbonate mineral shell, and then the SRB2 bacterium was wrapped; however, the bacterium was still alive due to a hole present in the terminal of the shell that enabled the bacterium to communicate with the environment (Figure 9a). The mineralization process driven by the mineral nucleation on the EPS can make the microorganism itself be encased by a carbonate layer [83,84]. In this study, SRB2 bacteria were surrounded by rod-shaped shells composed of a large number of nanometer microcrystalline minerals (Figure 9b). The inner diameter of the fractured mineral shell was approximately 0.5 μm, consistent with the width of a SRB2 bacterium. Figure 9d clearly shows that these mineral shells were composed of numerous nanometer-sized mineral grains. The reason for the shrinkage of the SRB2 cell might be related to the high concentration of salt, which can make the cells lose water to shrink.

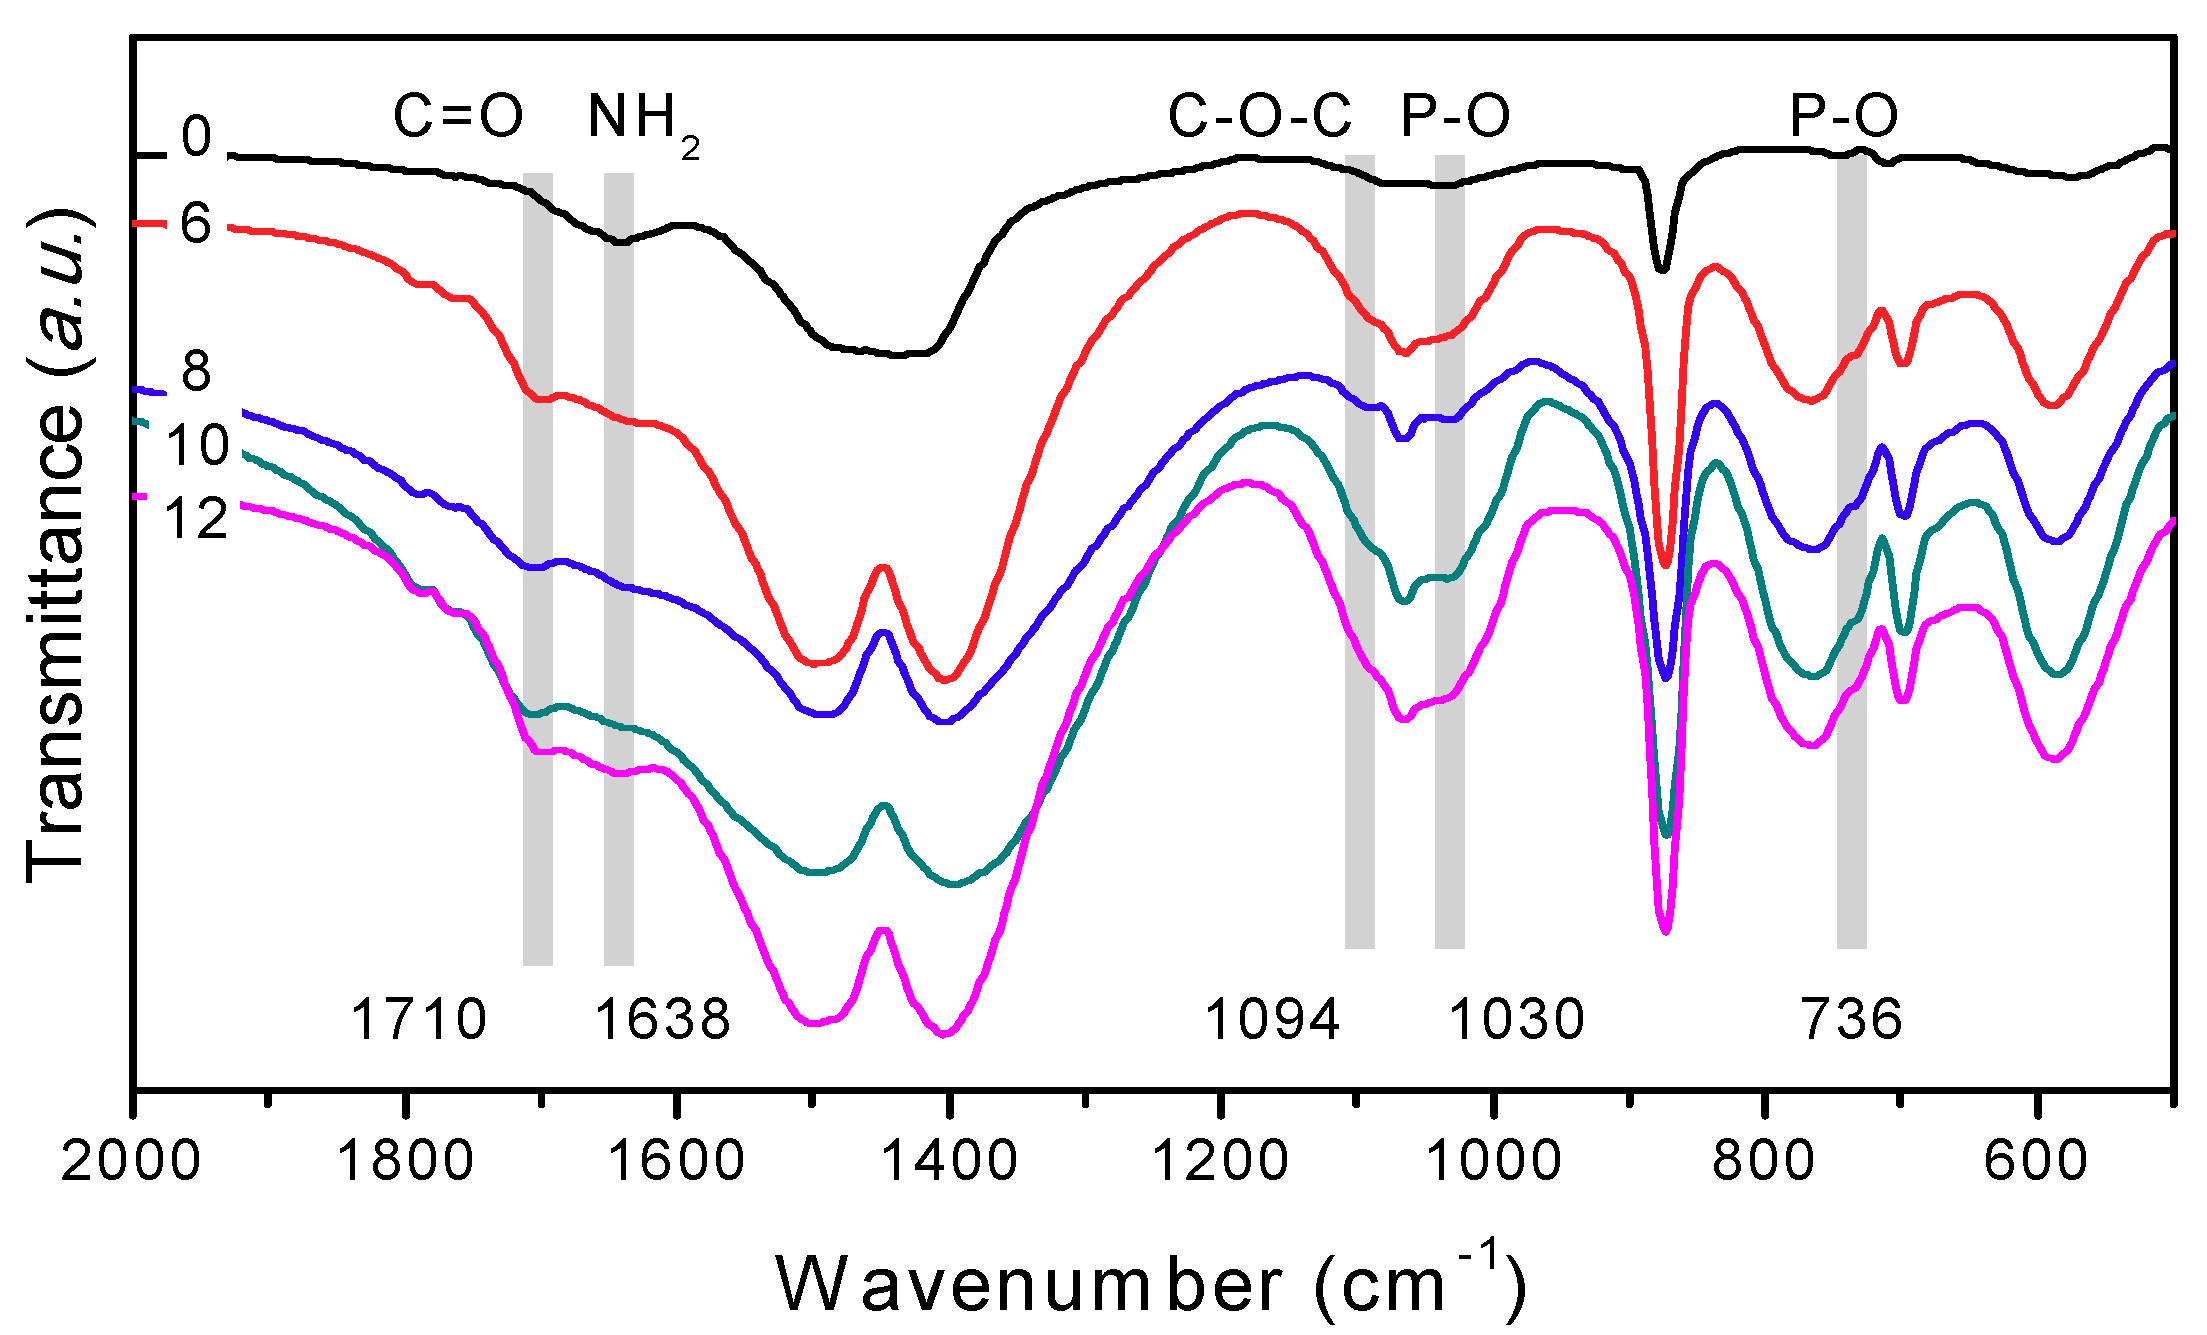
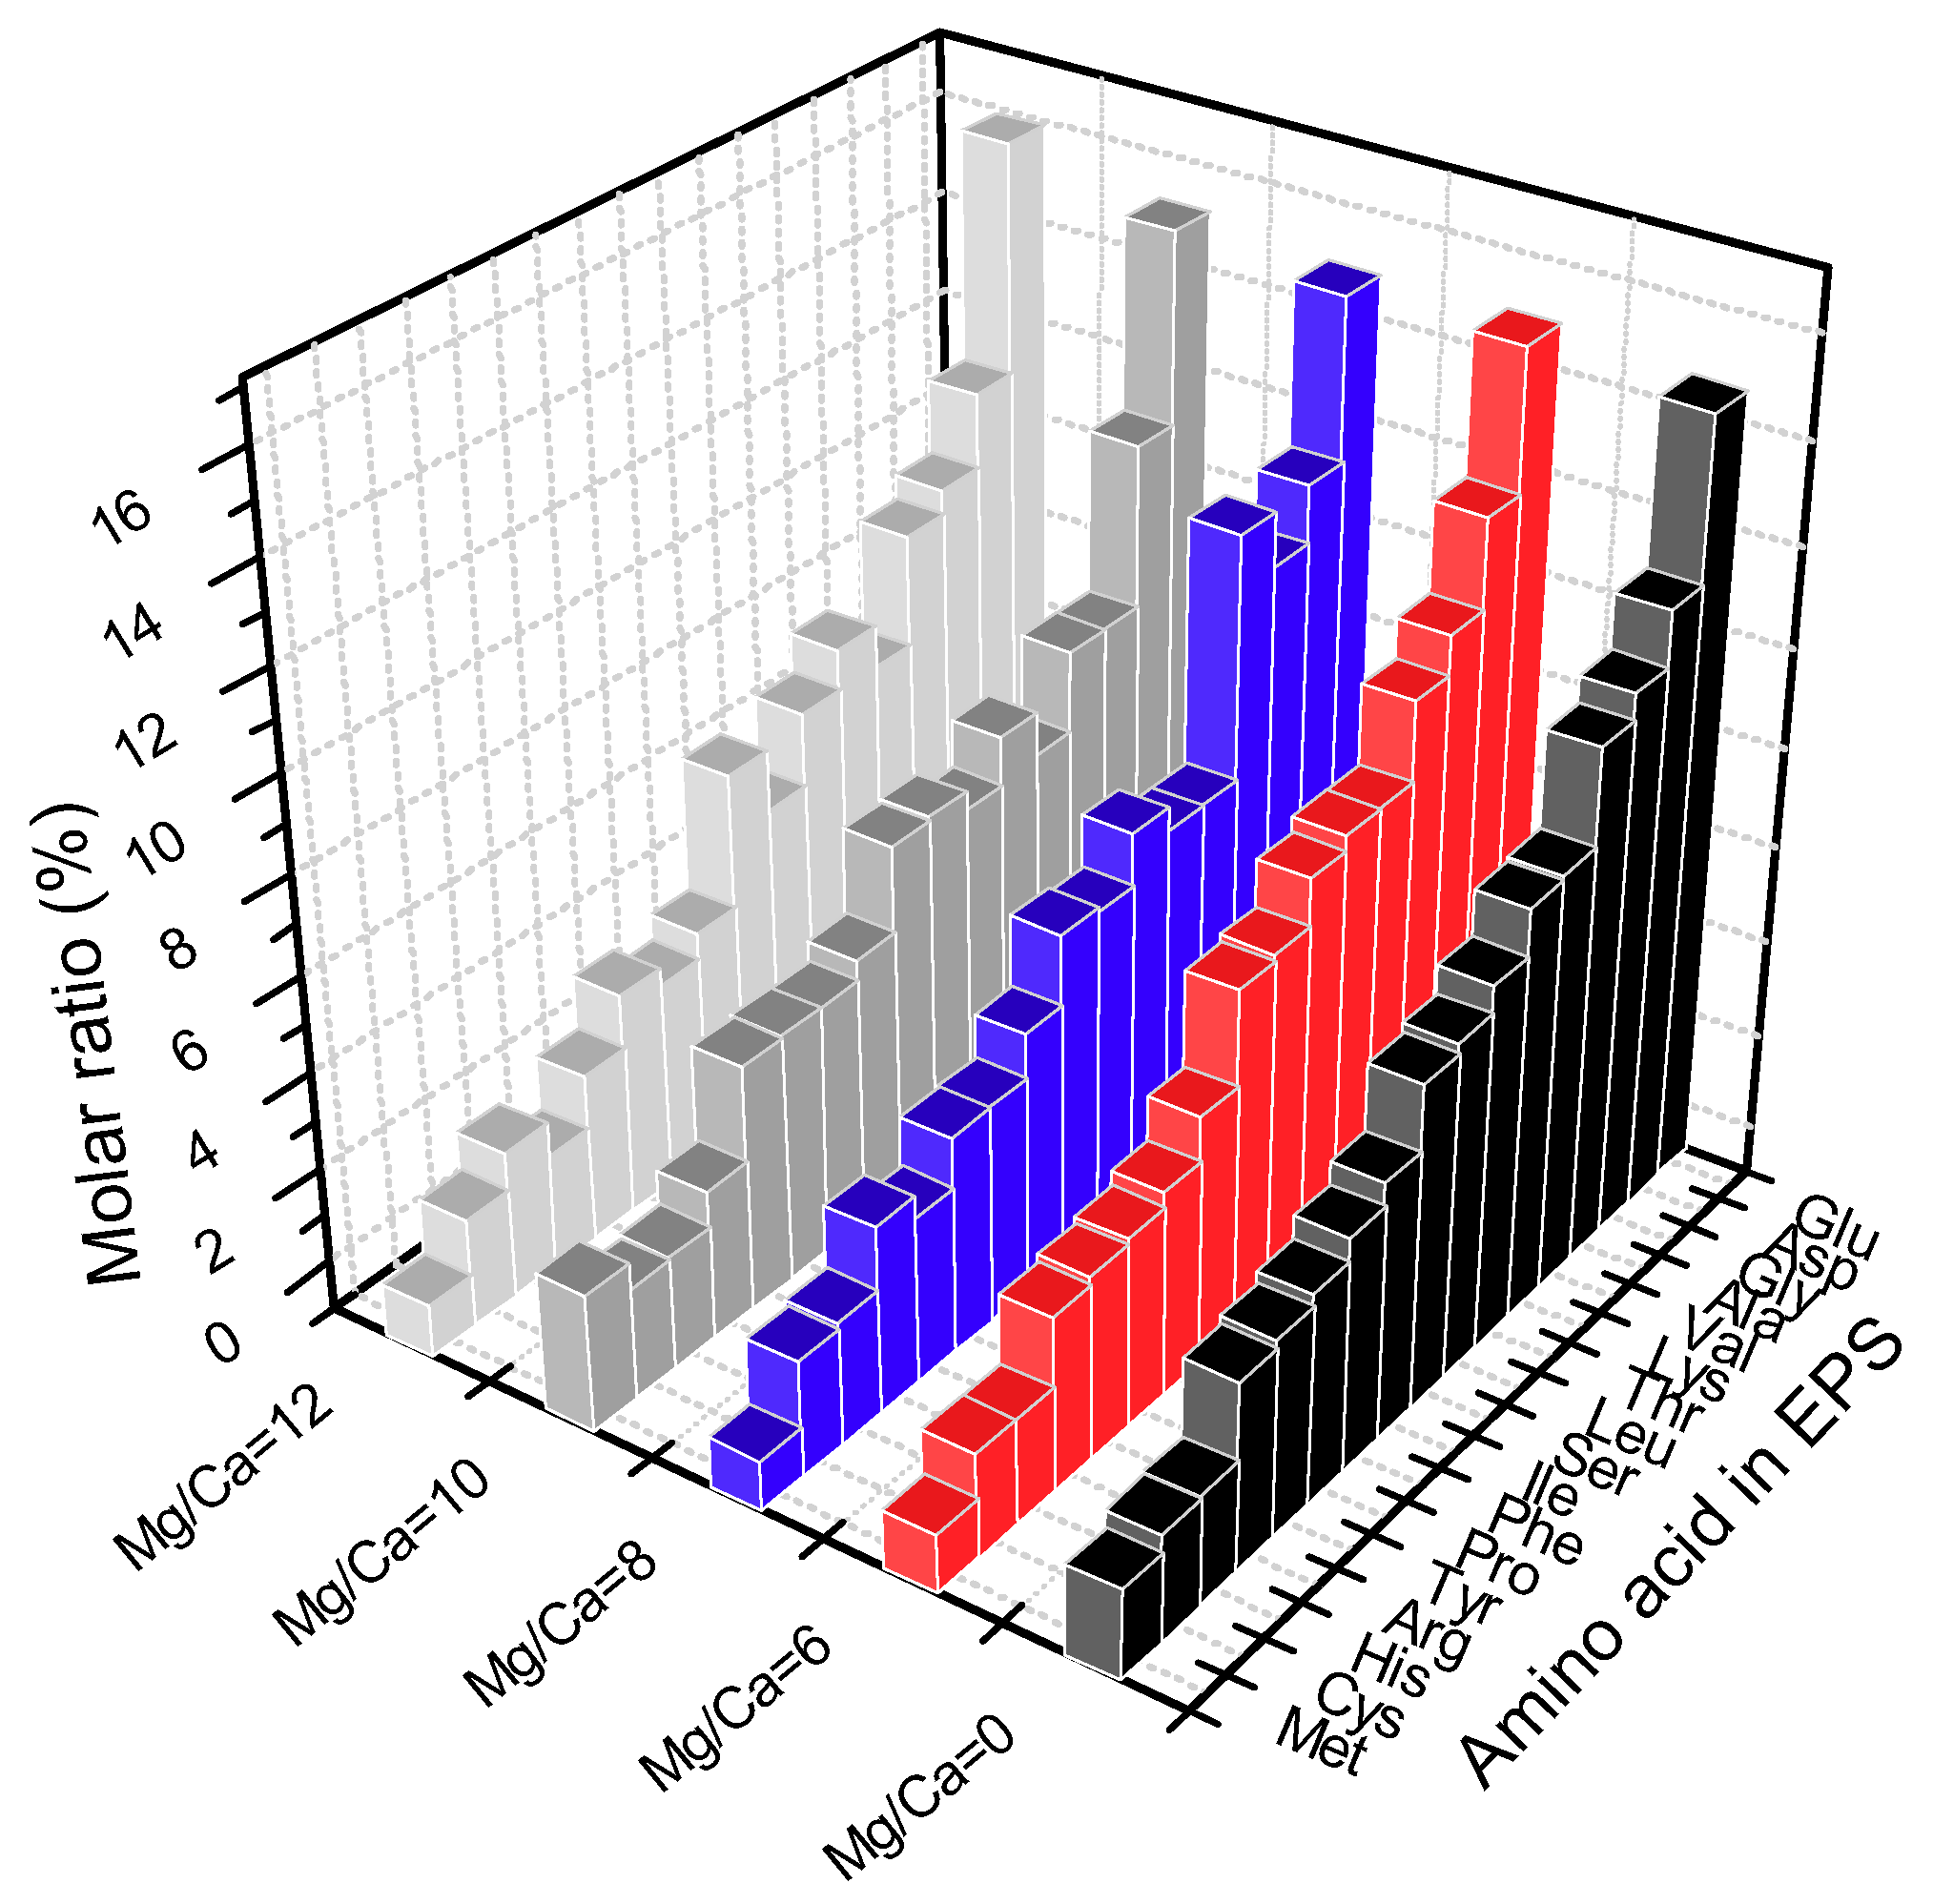
3.5.3. Precipitation Controlled by Amino Acids and Organic Functional Groups

Figure 11 shows the FTIR spectra of the biominerals induced by SRB2 after 300 h of cultivation at different Mg/Ca molar ratios. Aside from the characteristic peaks of the biominerals (Figure S7), many organic functional groups could also be found, as seen in Figure 11, including C=O (1710 cm−1), C–O–C (1091 cm−1), and P–O (1030, 736 cm−1), which may have originated from the EPS, metabolites, and the bacterium itself. These organic molecules were incorporated into the mineral during the process of crystal nucleation and growth. In fact, in previous studies, it was found that the functional groups of organic matters had an obvious influence on the formation of minerals [85], and also influenced the morphology. Some organic functional groups (hydroxyl, carboxyl, phosphoryl, and amide groups) contributed to the combination of metal ions and EPS.
In fact, Ca2+ and Mg2+ ions are usually wrapped by water molecules, and once the combination energy barrier of the water molecules was overcome, the Ca2+ and Mg2+ ions could be precipitated. There is also competition for nucleation sites between Mg2+ and Ca2+. According to the higher combination energy between Mg2+ and water molecules of 351.5 kcal mol−1 [85], Mg2+ is more difficult to be precipitated when compared with Ca2+ (264.3 kcal mol−1) [43]. At the same time, Mg2+ ions are also hard to bind with CO32− ions due to the limitations of the lattice structure, thus the formation of magnesium carbonate crystals is difficult. Fortunately, many functional groups such as C=O and C–N also make great contributions to this biomineralization process [50,85,86]. Carboxyl and phosphate groups usually have negative charges. The water molecules can be replaced by these functional groups to free the wrapped Ca2+ and Mg2+ ions. Additionally, the life activity of SRB2 creates an alkaline microenvironment around the cell, where under these circumstances, the deprotonation of the carboxyl groups is easier. Consequently, metal ions (Ca2+ and Mg2+) are more easily adsorbed on these groups.
EPS are an important source of organic functional groups, as shown in Figure 12, where 17 types of amino acids were detected in every experimental group including Glu, Asp, Gly, Ala, Val, Lys, Thr, Leu, Ser, Ile, Phe, Pro, Tyr, Arg, His, Cys, and Met. It can be seen in Figure 2c that the pH values increased to 9.0 at 200 h, but the isoelectric points of all kinds of amino acids (His 7.59, Pro 6.3, Thr 6.16, Ile 6.02, Ala 6, Leu5.98, Gly 5.97, Val 5.96, Met 5.74, Ser 5.68, Tyr 5.68, Phe 5.48, Cys 5.05, Glu 3.22, Asp 2.77), except for arginine (10.76) and lysine (9.74) were less than the final pH value. That is to say, most amino acids are negatively charged in such alkaline conditions [49,79]. These negatively charged amino acids could absorb a large number of calcium and magnesium ions into the bacteria’s EPS through electrostatic attraction, while the positively charged amino acids (Arg and Lys) could adsorb carbonate and bicarbonate ions in solution, thus the carbonate minerals could be nucleated on the EPS. These amino acids promoted the adsorption and aggregation of Ca2+, Mg2+, CO32−, and HCO3 ions on the cell surface, resulting in the formation of the bacterial mineralized shells and the precipitation of metal ions.
Therefore, the SRB2 bacteria provided suitable sites for the adsorption of metal ions (Ca2+ and Mg2+) and the nucleation of minerals. These functional groups from the EPS not only accelerated the precipitation of Ca2+ and Mg2+, but also served as the molecular template to change the morphology of minerals (preferred orientation of nesquehonite). In this way, functional groups such as P=O and C=O play an important role in the extracellular biomineralization of carbonate minerals.

4. Implications for Microbial Desalination and Biomineralization

In a pure inorganic environment without the participation of microorganisms, magnesium carbonate crystals are difficult to form. The most typical example is that neither dolomite nor magnesite can be precipitated directly in the aseptic natural system at the Earth’s surface. No minerals observed by the naked eye in our control groups also proved this viewpoint. However, more nesquehonite deposits can also be found in the modern natural environment. In the past, some research has suggested that the formation of nesquehonite was related to organic components, but a few studies have linked that with microbial activity. The current mainstream views about the question of what makes Mg2+ ions difficult to be precipitated as magnesium-rich carbonate minerals are as follows. (1) The high binding energy between magnesium ions and water molecules is a huge obstacle to their entry into the mineral lattice [43]. In competition with calcium ions or other metal cations for nucleation sites, magnesium ions are often at a disadvantage due to their close association with water molecules. (2) Limitations of the mineral’s own lattice structure in the formation of magnesium-rich carbonate minerals. The special structure of the Mg–O octahedron makes it difficult to maintain stable and sustained growth. (3) Demanding requirements for the deposition environment [82]. These magnesium-rich carbonate minerals require higher saturation and higher ionic strength for sustained and stable growth.
Our study revealed that microorganisms could cause the rapid precipitation of Ca2+ and Mg2+ in aqueous solutions, leading to the formation of calcite, vaterite, monohydrocalcite, and nesquehonite. The EPS secreted by microorganisms reduced the binding energy of Mg2+ with water molecules, thus making it easier to enter the mineral lattice. Not only that, but in this process, organic components that participates in the process of mineral growth may change the crystal structure of the restricted mineral to a certain extent, making it more suitable for sustained and stable growth. The most important thing is that the life activities of microorganisms could change the micro-environment, facilitating the precipitation of minerals.

5. Conclusions

In the present experiment, we demonstrated that a newly isolated bacterial strain B. licheniformis SRB2 could induce intracellular and extracellular biomineralization. The final concentration of Ca2+ and Mg2+ in the experimental group was much lower than that in the control group at different Mg/Ca molar ratios due to the existence of SRB2 bacteria. SRB2 bacteria released ammonia and CA to increase the pH values and elevate the concentrations of HCO3 and CO32− ions, thus promoting the bio-precipitation of Ca2+ and Mg2+ ions. With increasing Mg/Ca ratios, the composition of amino acids in the EPS also changed, mainly reflected in the marked increase in the proportion of negatively charged amino acids. The mineral phases (calcite, vaterite, monohydrocalcite, and nesquehonite) and crystallographic features (especially the preferred orientation) were controlled by the biomolecules and the functional groups. The extra and intracellular biomineralization contributed greatly to the bio-precipitation of Ca2+ (96%) and Mg2+ (50%) in ambient solution. Therefore, the present experiment provides references for understanding the mechanism of microbial desalination for the removal of Ca2+ and Mg2+ ions. Furthermore, it has an important guiding significance in explaining the formation of nesquehonite and other carbonate minerals in the natural and ancient earth surface environment.

Supplementary Materials

The following are available online at https://www.mdpi.com/2075-163X/9/9/526/s1, Figure S1: Physiological and biochemical characteristics of SRB2. (a) Colony morphology on plates; (b) Bacteria and extracellular polymers substances in SEM view; c Gram staining (purple, positive); d Ammonia test (positive).; Figure S2: Growth curves of SRB2 in culture medium with various NaCl concentrations (1%, 2%, 3% and 4%).; Figure S3: SEM results showing dramatic difference in morphologies of precipitates between the abiotic and biotic group.; Figure S4: EDX-mapping of C, Ca, O and Mg in precipitates formed in abiotic control experiments with different Mg/Ca ratios and pH values; Figure S5: Rietveld refinement of XRD data in the experimental groups. (a) Mg/Ca = 0; (b) Mg/Ca = 6; (c) Mg/Ca = 8; (d) Mg/Ca = 10; (e) Mg/Ca = 12.; Figure S6: Images of HRTEM and SAED for minerals in the experimental groups for 12 days of cultivation. ((a) and (b): calcite and vaterite at Mg/Ca molar ratio 0; (c) and (d): monohydrocalcite at Mg/Ca molar ratios 6 and 8, respectively; (e) and (f): nesquehonite and monohydrocalcite at Mg/Ca molar ratio 10, respectively; (g) and (h): nesquehonite and monohydrocalcite at Mg/Ca molar ratio 12, respectively. (a)–(e), and (g), HRTEM; (b), (f), and (h), SAED).; Figure S7. FTIR analyses of the characteristic organic functional groups in the minerals induced by B. licheniformis SRB2 strain at different Mg/Ca molar ratios.

Author Contributions

Y.Z. (Yanyang Zhao), H.Z., and Y.Z. (Yifan Zhao) did the isolation and culture of SRB2. Z.H. and H.Y. organized the laboratory experiments. Z.H., M.H., and J.Z. carried out the XRD analysis. Y.Z. (Yanyang Zhao), M.H., and G.M. carried out the AAS and FTIR analysis. M.E.T. helped draft the manuscript. All authors read and approved the final manuscript.

Funding

This work was supported by the National Natural Science Foundation of China(41972108, U1663201, 41772095, 41702131), the Laboratory for Marine Mineral Resources, Qingdao National Laboratory for Marine Science and Technology (MMRZZ201804), the Taishan Scholar Talent Team Support Plan for Advanced & Unique Discipline Areas, Major Scientific and Technological Innovation Projects of Shandong Province (2017CXGC1602, 2017CXGC1603), the Natural Science Foundation of Shandong Province (ZR2019MD027, ZR2017BD001), the SDUST Research Fund (2015TDJH101), the Scientific and Technological Innovation Project Financially Supported by Qingdao National Laboratory for Marine Science and Technology (No. 2016ASKJ13).

Conflicts of Interest

The authors declare that they have no conflicts of interest.

References

  1. Harvie, C.E.; Eugster, H.P.; Weare, J.H. Mineral equilibria in the six-component seawater system, Na-K-Mg-Ca-SO4-Cl-H2O at 25°C. II: Compositions of the saturated solutions. Geochim. Cosmochim. Acta 1982, 46, 1603–1618. [Google Scholar] [CrossRef]
  2. Valladares Linares, R.; Li, Z.; Yangali-Quintanilla, V.; Ghaffour, N.; Amy, G.; Leiknes, T.; Vrouwenvelder, J.S. Life cycle cost of a hybrid forward osmosis—Low pressure reverse osmosis system for seawater desalination and wastewater recovery. Water Res. 2016, 88, 225–234. [Google Scholar] [CrossRef] [PubMed]
  3. Arias, D.; Cisternas, L.A.; Rivas, M. Biomineralization of calcium and magnesium crystals from seawater by halotolerant bacteria isolated from Atacama Salar (Chile). Desalination 2017, 405, 1–9. [Google Scholar] [CrossRef]
  4. Elimelech, M.; Phillip, W.A. The Future of Seawater Desalination: Energy, Technology, and the Environment. Science 2011, 333, 712. [Google Scholar] [CrossRef] [PubMed]
  5. Zhang, C.; Zhong, L.; Fu, X.; Zhao, Z. Managing Scarce Water Resources in China’s Coal Power Industry. Environ. Manag. 2016, 57, 1188–1203. [Google Scholar] [CrossRef] [PubMed]
  6. Zheng, X.; Chen, D.; Wang, Q.; Zhang, Z. Seawater desalination in China: Retrospect and prospect. Chem. Eng. J. 2014, 242, 404–413. [Google Scholar] [CrossRef]
  7. Zarzo, D.; Campos, E.; Terrero, P. Spanish experience in desalination for agriculture. Desalin. Water Treat. 2013, 51, 53–66. [Google Scholar] [CrossRef]
  8. Amy, G.; Ghaffour, N.; Li, Z.; Francis, L.; Linares, R.V.; Missimer, T.; Lattemann, S. Membrane-based seawater desalination: Present and future prospects. Desalination 2017, 401, 16–21. [Google Scholar] [CrossRef]
  9. Yüksel, S.; Kabay, N.; Yüksel, M. Removal of bisphenol A (BPA) from water by various nanofiltration (NF) and reverse osmosis (RO) membranes. J. Hazard. Mater. 2013, 263, 307–310. [Google Scholar] [CrossRef]
  10. Valero, F.; Arbós, R. Desalination of brackish river water using Electrodialysis Reversal (EDR): Control of the THMs formation in the Barcelona (NE Spain) area. Desalination 2010, 253, 170–174. [Google Scholar] [CrossRef]
  11. Ge, Q.; Wang, P.; Wan, C.; Chung, T.-S. Polyelectrolyte-Promoted Forward Osmosis–Membrane Distillation (FO–MD) Hybrid Process for Dye Wastewater Treatment. Environ. Sci. Technol. 2012, 46, 6236–6243. [Google Scholar] [CrossRef] [PubMed]
  12. Winter, D.; Koschikowski, J.; Wieghaus, M. Desalination using membrane distillation: Experimental studies on full scale spiral wound modules. J. Membr. Sci. 2011, 375, 104–112. [Google Scholar] [CrossRef]
  13. Chen, X.; Xia, X.; Liang, P.; Cao, X.; Sun, H.; Huang, X. Stacked Microbial Desalination Cells to Enhance Water Desalination Efficiency. Environ. Sci. Technol. 2011, 45, 2465–2470. [Google Scholar] [CrossRef] [PubMed]
  14. Hakizimana, J.N.; Gourich, B.; Vial, C.; Drogui, P.; Oumani, A.; Naja, J.; Hilali, L. Assessment of hardness, microorganism and organic matter removal from seawater by electrocoagulation as a pretreatment of desalination by reverse osmosis. Desalination 2016, 393, 90–101. [Google Scholar] [CrossRef]
  15. Ping, Q.; Huang, Z.; Dosoretz, C.; He, Z. Integrated experimental investigation and mathematical modeling of brackish water desalination and wastewater treatment in microbial desalination cells. Water Res. 2015, 77, 13–23. [Google Scholar] [CrossRef] [PubMed]
  16. Ping, Q.; Zhang, C.; Chen, X.; Zhang, B.; Huang, Z.; He, Z. Mathematical Model of Dynamic Behavior of Microbial Desalination Cells for Simultaneous Wastewater Treatment and Water Desalination. Environ. Sci. Technol. 2014, 48, 13010–13019. [Google Scholar] [CrossRef] [PubMed]
  17. Han, Z.; Yan, H.; Zhao, H.; Zhou, S.; Han, M.; Meng, X.; Zhang, Y.; Zhao, Y.; Sun, B.; Yao, C.; et al. Bio-precipitation of Calcite with Preferential Orientation Induced by Synechocystis sp. PCC6803. Geomicrobiol. J. 2014, 31, 884–899. [Google Scholar] [CrossRef]
  18. Kiskira, K.; Papirio, S.; van Hullebusch, E.D.; Esposito, G. Fe(II)-mediated autotrophic denitrification: A new bioprocess for iron bioprecipitation/biorecovery and simultaneous treatment of nitrate-containing wastewaters. Int. Biodeterior. Biodegrad. 2017, 119, 631–648. [Google Scholar] [CrossRef]
  19. Silva-Castro, G.A.; Uad, I.; Gonzalez-Martinez, A.; Rivadeneyra, A.; Gonzalez-Lopez, J.; Rivadeneyra, M.A. Bioprecipitation of Calcium Carbonate Crystals by Bacteria Isolated from Saline Environments Grown in Culture Media Amended with Seawater and Real Brine. Biomed Res. Int. 2015, 2015, 12. [Google Scholar] [CrossRef]
  20. Minas, K.; Karunakaran, E.; Bond, T.; Gandy, C.; Honsbein, A.; Madsen, M.; Amezaga, J.; Amtmann, A.; Templeton, M.R.; Biggs, C.A.; et al. Biodesalination: An emerging technology for targeted removal of Na+ and Cl− from seawater by cyanobacteria. Desalin. Water Treat. 2015, 55, 2647–2668. [Google Scholar] [CrossRef]
  21. Jacobson, K.S.; Drew, D.M.; He, Z. Efficient salt removal in a continuously operated upflow microbial desalination cell with an air cathode. Bioresour. Technol. 2011, 102, 376–380. [Google Scholar] [CrossRef] [PubMed]
  22. Cao, X.; Huang, X.; Liang, P.; Xiao, K.; Zhou, Y.; Zhang, X.; Logan, B.E. A New Method for Water Desalination Using Microbial Desalination Cells. Environ. Sci Technol. 2009, 43, 7148–7152. [Google Scholar] [CrossRef] [PubMed]
  23. Han, Z.; Zhao, Y.; Yan, H.; Zhao, H.; Han, M.; Sun, B.; Meng, R.; Zhuang, D.; Li, D.; Gao, J.W.; et al. The characterization of intracellular and extracellular biomineralization induced by Synechocystis sp. PCC6803 cultured under low Mg/Ca ratios conditions. Geomicrobiol. J. 2017, 34, 362–373. [Google Scholar] [CrossRef]
  24. Han, Z.; Zhao, Y.; Yan, H.; Zhao, H.; Han, M.; Sun, B.; Sun, X.; Hou, F.; Sun, H.; Han, L.J.; et al. Struvite precipitation induced by a novel sulfate-reducing bacterium Acinetobacter calcoaceticus SRB4 isolated from river sediment. Geomicrobiol. J. 2015, 32, 868–877. [Google Scholar] [CrossRef]
  25. Falagán, C.; Yusta, I.; Sánchez-España, J.; Johnson, D.B. Biologically-induced precipitation of aluminium in synthetic acid mine water. Miner. Eng. 2017, 106, 79–85. [Google Scholar] [CrossRef]
  26. Weiner, S.; Dove, P.M. An overview of biomineralization processes and the problem of the vital effect. Rev. Miner. Geochem. 2003, 54, 1–29. [Google Scholar] [CrossRef]
  27. Pentecost, A. Significance of the biomineralizing microniche in a lyngbya (cyanobacterium) travertine. Geomicrobiol. J. 1995, 13, 213–222. [Google Scholar] [CrossRef]
  28. Chough, S.K.; Lee, H.S.; Woo, J.; Chen, J.; Choi, D.K.; Lee, S.-B.; Kang, I.; Park, T.-Y.; Han, Z. Cambrian stratigraphy of the North China Platform: Revisiting principal sections in Shandong Province, China. Geosci. J. 2010, 14, 235–268. [Google Scholar] [CrossRef]
  29. Van Lith, Y.; Warthmann, R.; Vasconcelos, C.; McKenzie, J.A. Sulphate-reducing bacteria induce low-temperature Ca-dolomite and high Mg-calcite formation. Geobiology 2003, 1, 71–79. [Google Scholar] [CrossRef]
  30. Kajander, E.O.; Çiftçioglu, N. Nanobacteria: An alternative mechanism for pathogenic intra- and extracellular calcification and stone formation. Proc. Natl. Acad. Sci. USA 1998, 95, 8274. [Google Scholar] [CrossRef]
  31. Dhami, N.K.; Reddy, M.S.; Mukherjee, A. Biomineralization of calcium carbonates and their engineered applications: A review. Front. Microbiol. 2013, 4. [Google Scholar] [CrossRef] [PubMed]
  32. Warren, L.A.; Maurice, P.A.; Parmar, N.; Ferris, F.G. Microbially Mediated Calcium Carbonate Precipitation: Implications for Interpreting Calcite Precipitation and for Solid-Phase Capture of Inorganic Contaminants. Geomicrobiol. J. 2001, 18, 93–115. [Google Scholar] [CrossRef]
  33. Zhao, Y.; Lu, Z.; Liu, J.; Hu, S. Flora characteristics of Chenier Wetland in Bohai Bay and biogeographic relations with adjacent wetlands. Front. Earth Sci. 2017, 11, 620–628. [Google Scholar] [CrossRef]
  34. Chen, Y.; Steele-MacInnis, M.; Ge, Y.; Zhou, Z.; Zhou, Y. Synthetic saline-aqueous and hydrocarbon fluid inclusions trapped in calcite at temperatures and pressures relevant to hydrocarbon basins: A reconnaissance study. Mar. Pet. Geol 2016, 76, 88–97. [Google Scholar] [CrossRef]
  35. Cheng, B.; Wang, T.G.; Chen, Z.; Chang, X.; Yang, F. Biodegradation and possible source of Silurian and Carboniferous reservoir bitumens from the Halahatang sub-depression, Tarim Basin, NW China. Mar. Pet. Geol. 2016, 78, 236–246. [Google Scholar] [CrossRef]
  36. Guo, J.; Zhai, P.; Wu, L.; Cribb, M.; Li, Z.; Ma, Z.; Wang, F.; Chu, D.; Wang, P.; Zhang, J. Diurnal variation and the influential factors of precipitation from surface and satellite measurements in Tibet. Int. J. Clim. 2014, 34, 2940–2956. [Google Scholar] [CrossRef]
  37. Deng, S.; Dong, H.; Lv, G.; Jiang, H.; Yu, B.; Bishop, M.E. Microbial dolomite precipitation using sulfate reducing and halophilic bacteria: Results from Qinghai Lake, Tibetan Plateau, NW China. Chem. Geol. 2010, 278, 151–159. [Google Scholar] [CrossRef]
  38. Lee, J.-H.; Chen, J.; Chough, S.K. Paleoenvironmental implications of an extensive maceriate microbialite bed in the Furongian Chaomidian Formation, Shandong Province, China. Palaeogeogr. Palaeoclimatol. Palaeoecol. 2010, 297, 621–632. [Google Scholar] [CrossRef]
  39. Yang, R.; Fan, A.; Han, Z.; Chi, N.; Han, Y. Characteristics and genesis of microbial lumps in the Maozhuang Stage (Cambrian Series 2), Shandong Province, China. Sci. China Earth Sci. 2013, 56, 494–503. [Google Scholar] [CrossRef]
  40. Li, F.; Jing, X.; Zou, C.; Zhang, H.; Xiang, F. Facies analysis of the Callovian–Oxfordian carbonates in the northeastern Amu Darya Basin, southeastern Turkmenistan. Mar. Pet. Geol. 2017, 88, 359–380. [Google Scholar] [CrossRef]
  41. Yang, W.; Liu, Y.; Feng, Q.; Lin, J.; Zhou, D.; Wang, D. Sedimentary evidence of Early–Late Permian mid-latitude continental climate variability, southern Bogda Mountains, NW China. Palaeogeogr. Palaeoclim. Palaeoecol. 2007, 252, 239–258. [Google Scholar] [CrossRef]
  42. Spadafora, A.; Perri, E.; Mckenzie, J.A.; Vasconcelos, C. Microbial biomineralization processes forming modern Ca:Mg carbonate stromatolites. Sedimentology 2010, 57, 27–40. [Google Scholar] [CrossRef]
  43. Qiu, X.; Wang, H.; Yao, Y.; Duan, Y. High salinity facilitates dolomite precipitation mediated by Haloferax volcanii DS52. Earth Planet. Sci. Lett 2017, 472, 197–205. [Google Scholar] [CrossRef]
  44. Qiu, X.; Yao, Y.; Wang, H.; Shen, A.; Zhang, J. Halophilic Archaea Mediate the Formation of Proto-Dolomite in Solutions With Various Sulfate Concentrations and Salinities. Front. Microbiol. 2019, 10. [Google Scholar] [CrossRef] [PubMed]
  45. Han, Z.; Yu, W.; Zhao, H.; Zhao, Y.; Tucker, E.M.; Yan, H. The Significant Roles of Mg/Ca Ratio, Cl− and SO42− in Carbonate Mineral Precipitation by the Halophile Staphylococcus epidermis Y2. Minerals 2018, 8, 594. [Google Scholar] [CrossRef]
  46. Suzuki, M.; Nagasawa, H.; Kogure, T. Synthesis and Structure of Hollow Calcite Particles. Cryst. Growth Des. 2006, 6, 2004–2006. [Google Scholar] [CrossRef]
  47. Daskalakis, M.I.; Magoulas, A.; Kotoulas, G.; Katsikis, I.; Bakolas, A.; Karageorgis, A.P.; Mavridou, A.; Doulia, D.; Rigas, F. Cupriavidus metallidurans biomineralization ability and its application as a bioconsolidation enhancer for ornamental marble stone. Appl. Microbiol. Biotechnol. 2014, 98, 6871–6883. [Google Scholar] [CrossRef] [PubMed]
  48. Tourney, J.; Ngwenya, B.T. The role of bacterial extracellular polymeric substances in geomicrobiology. Chem. Geol. 2014, 386, 115–132. [Google Scholar] [CrossRef]
  49. Han, Z.; Gao, X.; Zhao, H.; Tucker, E.M.; Zhao, Y.; Bi, Z.; Pan, J.; Wu, G.; Yan, H. Extracellular and Intracellular Biomineralization Induced by Bacillus licheniformis DB1-9 at Different Mg/Ca Molar Ratios. Minerals 2018, 8, 585. [Google Scholar] [CrossRef]
  50. Han, Z.; Li, D.; Zhao, H.; Yan, H.; Li, P. Precipitation of Carbonate Minerals Induced by the Halophilic Chromohalobacter Israelensis under High Salt Concentrations: Implications for Natural Environments. Minerals 2017, 7, 95. [Google Scholar] [CrossRef]
  51. Manoli, F.; Dalas, E. Calcium carbonate crystallization in the presence of glutamic acid. J. Cryst. Growth 2001, 222, 293–297. [Google Scholar] [CrossRef]
  52. Malkaj, P.; Dalas, E. Calcium Carbonate Crystallization in the Presence of Aspartic Acid. Cryst. Growth Des. 2004, 4, 721–723. [Google Scholar] [CrossRef]
  53. Xie, A.-J.; Shen, Y.-H.; Zhang, C.-Y.; Yuan, Z.-W.; Zhu, X.-M.; Yang, Y.-M. Crystal growth of calcium carbonate with various morphologies in different amino acid systems. J. Cryst Growth 2005, 285, 436–443. [Google Scholar] [CrossRef]
  54. Wolf, S.E.; Loges, N.; Mathiasch, B.; Panthöfer, M.; Mey, I.; Janshoff, A.; Tremel, W. Phase Selection of Calcium Carbonate through the Chirality of Adsorbed Amino Acids. Angew. Chem. Int. Ed. 2007, 46, 5618–5623. [Google Scholar] [CrossRef] [PubMed]
  55. Rodriguez-Blanco, J.D.; Shaw, S.; Bots, P.; Roncal-Herrero, T.; Benning, L.G. The role of Mg in the crystallization of monohydrocalcite. Geochim. Cosmochim. Acta 2014, 127, 204–220. [Google Scholar] [CrossRef]
  56. Ma, P.; Wang, C.; Lv, D.; Li, Y.; Yi, L. Controls on deposition of aquatic and terrestrial organic matter in the lacustrine Namling–Oiyug basin (Oligocene–Miocene, southern Tibet). Int. J. Coal Geol. 2015, 149, 108–117. [Google Scholar] [CrossRef]
  57. Yang, R.; van Loon, A.J.; Jin, X.; Jin, Z.; Han, Z.; Fan, A.; Liu, Q. From divergent to convergent plates: Resulting facies shifts along the southern and western margins of the Sino-Korean Plate during the Ordovician. J. Geodyn. 2018. [Google Scholar] [CrossRef]
  58. Perri, E.; Tucker, M.; Slowakiewicz, M.; Whitaker, F.; Bowen, L.; Perrotta, I. Carbonate and silicate biomineralization in a hypersaline microbial mat (Mesaieed sabkha, Qatar): Roles of bacteria, extracellular polymeric substances and viruses. Sedimentology 2017, 65. [Google Scholar] [CrossRef]
  59. Chen, J.; Chough, S.K.; Lee, J.H.; Han, Z. Sequence-stratigraphic comparison of the upper Cambrian Series 3 to Furongian succession between the Shandong region, China and the Taebaek area, Korea: high variability of bounding surfaces in an epeiric platform. Geosci. J. 2012, 16, 357–379. [Google Scholar] [CrossRef]
  60. Zhang, X.L.; Feng, Q.; Sun, P.; LI, W. Characteristics of High-Gamma-Ray Sandstone Reservoirs for Yanchang Formation in Ordos Basin. Chin. J. Geophys. 2010, 53, 154–163. [Google Scholar] [CrossRef]
  61. Qiu, X.; Liu, C.; Mao, G.; Deng, Y.; Wang, F.; Wang, J. Late Triassic tuff intervals in the Ordos basin, Central China: Their depositional, petrographic, geochemical characteristics and regional implications. J. Asian Earth Sci 2014, 80, 148–160. [Google Scholar] [CrossRef]
  62. Lv, D.; Chen, J. Depositional environments and sequence stratigraphy of the Late Carboniferous−Early Permian coal-bearing successions (Shandong Province, China): Sequence development in an epicontinental basin. J. Asian Earth Sci. 2014, 79, 16–30. [Google Scholar] [CrossRef]
  63. Fan, A.; Yang, R.; Van Loon, A.J.; Yin, W.; Han, Z.; Zavala, C. Classification of gravity-flow deposits and their significance for unconventional petroleum exploration, with a case study from the Triassic Yanchang Formation (southern Ordos Basin, China). J. Asian Earth Sci. 2018, 161, 57–73. [Google Scholar] [CrossRef]
  64. Yin, S.; Lv, D.; Jin, L.; Ding, W. Experimental analysis and application of the effect of stress on continental shale reservoir brittleness. J. Geophys. Eng. 2018, 15, 478–494. [Google Scholar] [CrossRef] [Green Version]
  65. Wang, Y.; Yang, R.; Song, M.; Lenhardt, N.; Wang, X.; Zhang, X.; Yang, S.; Wang, J.; Cao, H. Characteristics, controls and geological models of hydrocarbon accumulation in the Carboniferous volcanic reservoirs of the Chunfeng Oilfield, Junggar Basin, northwestern China. Mar. Pet. Geol. 2018, 94, 65–79. [Google Scholar] [CrossRef] [Green Version]
  66. Bian, X.; Wang, Z.-F.; Ding, G.-Q.; Cao, Y.-P. Compressibility of cemented dredged clay at high water content with super-absorbent polymer. Eng. Geol. 2016, 208, 198–205. [Google Scholar] [CrossRef]
  67. Chang, X.; Wang, T.G.; Li, Q.; Cheng, B.; Tao, X. Geochemistry and possible origin of petroleum in Palaeozoic reservoirs from Halahatang Depression. J. Asian Earth Sci. 2013, 74, 129–141. [Google Scholar] [CrossRef]
  68. Xu, Y.; Shen, X.; Chen, N.; Yang, C.; Wang, Q. Evaluation of reservoir connectivity using whole-oil gas chromatographic fingerprint technology: A case study from the Es33 reservoir in the Nanpu Sag, China. Pet. Sci. 2012, 9, 290–294. [Google Scholar] [CrossRef] [Green Version]
  69. Xu, Y.; Lu, M. Microbially enhanced oil recovery at simulated reservoir conditions by use of engineered bacteria. J. Pet. Sci. Eng. 2011, 78, 233–238. [Google Scholar] [CrossRef]
  70. Lv, D.; Li, Z.; Chen, J.; Liu, H.; Guo, J.; Shang, L. Characteristics of the Permian coal-formed gas sandstone reservoirs in Bohai Bay Basin and the adjacent areas, North China. J. Pet. Sci. Eng. 2011, 78, 516–528. [Google Scholar] [CrossRef]
  71. Ding, H.-P.; Xin, G.-Q.; Chen, K.-C.; Zhang, M.; Liu, Q.; Hao, J.; Liu, H.-G. Silver dendritic nanostructures formed at the solid/liquid interface via electroless deposition. Colloid. Surf. A Physicochem. Eng. Asp. 2010, 353, 166–171. [Google Scholar] [CrossRef]
  72. Benzerara, K.; Skouri-Panet, F.; Li, J.; Férard, C.; Gugger, M.; Laurent, T.; Couradeau, E.; Ragon, M.; Cosmidis, J.; Menguy, N. Intracellular Ca-carbonate biomineralization is widespread in cyanobacteria. Proc. Natl. Acad. Sci. USA 2014, 111, 10933–10938. [Google Scholar] [CrossRef] [PubMed] [Green Version]
  73. Barabesi, C.; Galizzi, A.; Mastromei, G.; Rossi, M.; Tamburini, E.; Perito, B.J.J.o.b. Bacillus subtilis gene cluster involved in calcium carbonate biomineralization. J. Bacteriol. 2007, 189, 228–235. [Google Scholar] [CrossRef] [PubMed]
  74. Boonrungsiman, S.; Gentleman, E.; Carzaniga, R.; Evans, N.D.; McComb, D.W.; Porter, A.E.; Stevens, M.M. The role of intracellular calcium phosphate in osteoblast-mediated bone apatite formation. Proc. Natl. Acad. Sci. USA 2012, 109, 14170. [Google Scholar] [CrossRef] [PubMed]
  75. Mass, T.; Giuffre, A.J.; Sun, C.-Y.; Stifler, C.A.; Frazier, M.J.; Neder, M.; Tamura, N.; Stan, C.V.; Marcus, M.A.; Gilbert, P.U.P.A. Amorphous calcium carbonate particles form coral skeletons. Proc. Natl. Acad. Sci. USA 2017, 114, 7670–7678. [Google Scholar] [CrossRef] [PubMed]
  76. Herbaud, M.-L.; Guiseppi, A.; Denizot, F.; Haiech, J.; Kilhoffer, M.-C. Calcium signalling in Bacillus subtilis. Biochim. Biophys. Acta (BBA)-Mol. Cell Res. 1998, 1448, 212–226. [Google Scholar] [CrossRef] [Green Version]
  77. Van Dijk-Salkinoja, M.S.; Stoof, T.J.; Planta, R.J. The Distribution of Polysomes, Ribosomes and Ribosomal Subunits in Exponential-Phase Cells of Bacillus licheniformis. Eur. J. Biochem. 1970, 12, 474–482. [Google Scholar] [CrossRef] [PubMed]
  78. Sánchez-Román, M.; Romanek, C.S.; Fernández-Remolar, D.C.; Sánchez-Navas, A.; McKenzie, J.A.; Pibernat, R.A.; Vasconcelos, C. Aerobic biomineralization of Mg-rich carbonates: Implications for natural environments. Chem. Geol. 2011, 281, 143–150. [Google Scholar] [CrossRef]
  79. Zhuang, D.; Yan, H.; Tucker, M.E.; Zhao, H.; Han, Z.; Zhao, Y.; Sun, B.; Li, D.; Pan, J.; Zhao, Y.; et al. Calcite precipitation induced by Bacillus cereus MRR2 cultured at different Ca2+ concentrations: Further insights into biotic and abiotic calcite. Chem. Geol. 2018, 500, 64–87. [Google Scholar] [CrossRef]
  80. Bontognali, T.R.; McKenzie, J.A.; Warthmann, R.J.; Vasconcelos, C.J.T.N. Microbially influenced formation of Mg-calcite and Ca-dolomite in the presence of exopolymeric substances produced by sulphate-reducing bacteria. Terra. Nova. 2014, 26, 72–77. [Google Scholar] [CrossRef]
  81. Sancho-Tomás, M.; Fermani, S.; Reggi, M.; García-Ruiz, J.M.; Gómez-Morales, J.; Falini, G. Polypeptide effect on Mg2+ hydration inferred from CaCO3 formation: A biomineralization study by counter-diffusion. Cryst. Eng. Comm. 2016, 18, 3265–3272. [Google Scholar] [CrossRef]
  82. Han, Z.; Meng, R.; Yan, H.; Zhao, H.; Han, M.; Zhao, Y.; Sun, B.; Sun, Y.; Wang, J.; Zhuang, D.J.C.; et al. Calcium carbonate precipitation by Synechocystis sp. PCC6803 at different Mg/Ca molar ratios under the laboratory condition. Carbonate. Evaporite. 2017, 32, 561–575. [Google Scholar] [CrossRef]
  83. Stocks-Fischer, S.; Galinat, J.K.; Bang, S.S. Microbiological precipitation of CaCO3. Soil Biol. Biochem. 1999, 31, 1563–1571. [Google Scholar] [CrossRef]
  84. Riding, R. Microbial carbonates: The geological record of calcified bacterial–algal mats and biofilms. Sedimentology 2000, 47, 179–214. [Google Scholar] [CrossRef]
  85. Zhang, Y.; Dawe, R.A. Influence of Mg2+ on the kinetics of calcite precipitation and calcite crystal morphology. Chem. Geol. 2000, 163, 129–138. [Google Scholar] [CrossRef]
  86. Han, Z.; Wang, J.; Zhao, H.; Tucker, M.E.; Zhao, Y.; Wu, G.; Zhou, J.; Yin, J.; Zhang, H.; Zhang, X.; et al. Mechanism of Biomineralization Induced by Bacillus subtilis J2 and Characteristics of the Biominerals. Minerals 2019, 9, 218. [Google Scholar] [CrossRef]
Figure 1. The phylogenetic tree constructed with a neighbor-joining method based on the sequence alignment of bacterial 16S rDNA.
Minerals 09 00526 g001
Figure 2. Physiological and biochemical characteristics of SRB2. (a) Growth curve of SRB2 and the ammonium concentration; (b) CA activity, and the concentration of carbonate and bicarbonate ions; (c) pH in the control and experimental group, pH based on the NaHCO3 + Na2CO3 solution and NH4+ concentration.
Minerals 09 00526 g002
Figure 3. Ca2+ concentration (a); Mg2+ concentration (b); and electroconductivity (c) in the medium inoculated with SRB2 bacteria.
Minerals 09 00526 g003
Figure 4. Precipitation ratio (a) and precipitation rate (b) of Ca2+ and Mg2+ ions.
Minerals 09 00526 g004
Figure 5. X-ray diffraction analyses of the biominerals cultured for 12 days at different Mg/Ca molar ratios.
Minerals 09 00526 g005
Figure 6. Scanning electron microscope, energy spectrum, high resolution transmission electron microscope, and selected area electron diffraction images of the minerals cultured for 12 days in the experimental groups at Mg/Ca ratios of 0 (ae), 6 (f), 8 (gj), 10 (k), and 12 (lo).
Minerals 09 00526 g006
Figure 7. Analyses of intracellular Ca2+ fluorescence intensity. (ae) SRB2 bacteria stained with Fluo-3AM and analyzed by laser scanning microscopy at Mg/Ca molar ratios of 0, 6, 8, 10, and 12, respectively; (f) SRB2 bacteria without staining with Fluo-3AM analyzed by laser scanning microscopy; (g) Intracellular Ca2+ fluorescence intensity of SRB2 bacteria analyzed by a fluorescence spectrophotometer.
Minerals 09 00526 g007
Figure 8. High resolution transmission electron microscope, selected area electron diffraction, and energy spectrum analyses of ultrathin slices of B. licheniformis SRB2. (a), SRB2 seed; (be), Mg/Ca molar ratios of 6, 8, 10, and 12, respectively; inset in (e), SAED image; (f), EDS analysis of intracellular inclusion.
Minerals 09 00526 g008
Figure 9. Scanning electron microscope images of the mineralized shells and SRB2 bacteria in the culture medium at different Mg/Ca molar ratios. (ac) Mg/Ca = 0; (d) EDS analysis; (eh) Mg/Ca = 6, 8, 10, and 12, respectively.
Minerals 09 00526 g009
Figure 10. Weak crystalline minerals on the extracellular polymeric substances of SRB2. (ac) Minerals on EPS of bacteria at Mg/Ca = 6, 10, and 12, respectively; the inset in (b) is the SAED image, showing the weak crystalline structure of the minerals on EPS; (d) EDS analysis of the selected area.
Minerals 09 00526 g010
Figure 11. Fourier transform infrared analyses of the organic functional groups from biominerals at different Mg/Ca ratios.
Minerals 09 00526 g011
Figure 12. Amino acids in the EPS of SRB2 cells in different culture media with various Mg/Ca ratios.
Minerals 09 00526 g012
Table 1. δ13CPDB (‰) values for minerals and organic compounds in the experimental groups.
Mg/Ca BiomineralAbiotic MineralBeef ExtractTryptoneNaHCO3Na2CO3Air [78]
0−16.54 ± 0.12−13.25 ± 0.22−18.14 ± 0.11−21.52 ± 0.13−14.25 ± 0.09−13.36 ± 0.12−8
6−17.55 ± 0.05-
8−17.38 ± 0.08-
10−18.01 ± 0.13-
12−16.12 ± 0.62-

