Root Cause Identification of Machining Error Based on Statistical Process Control and Fault Diagnosis of Machine Tools


Abstract
1. Introduction
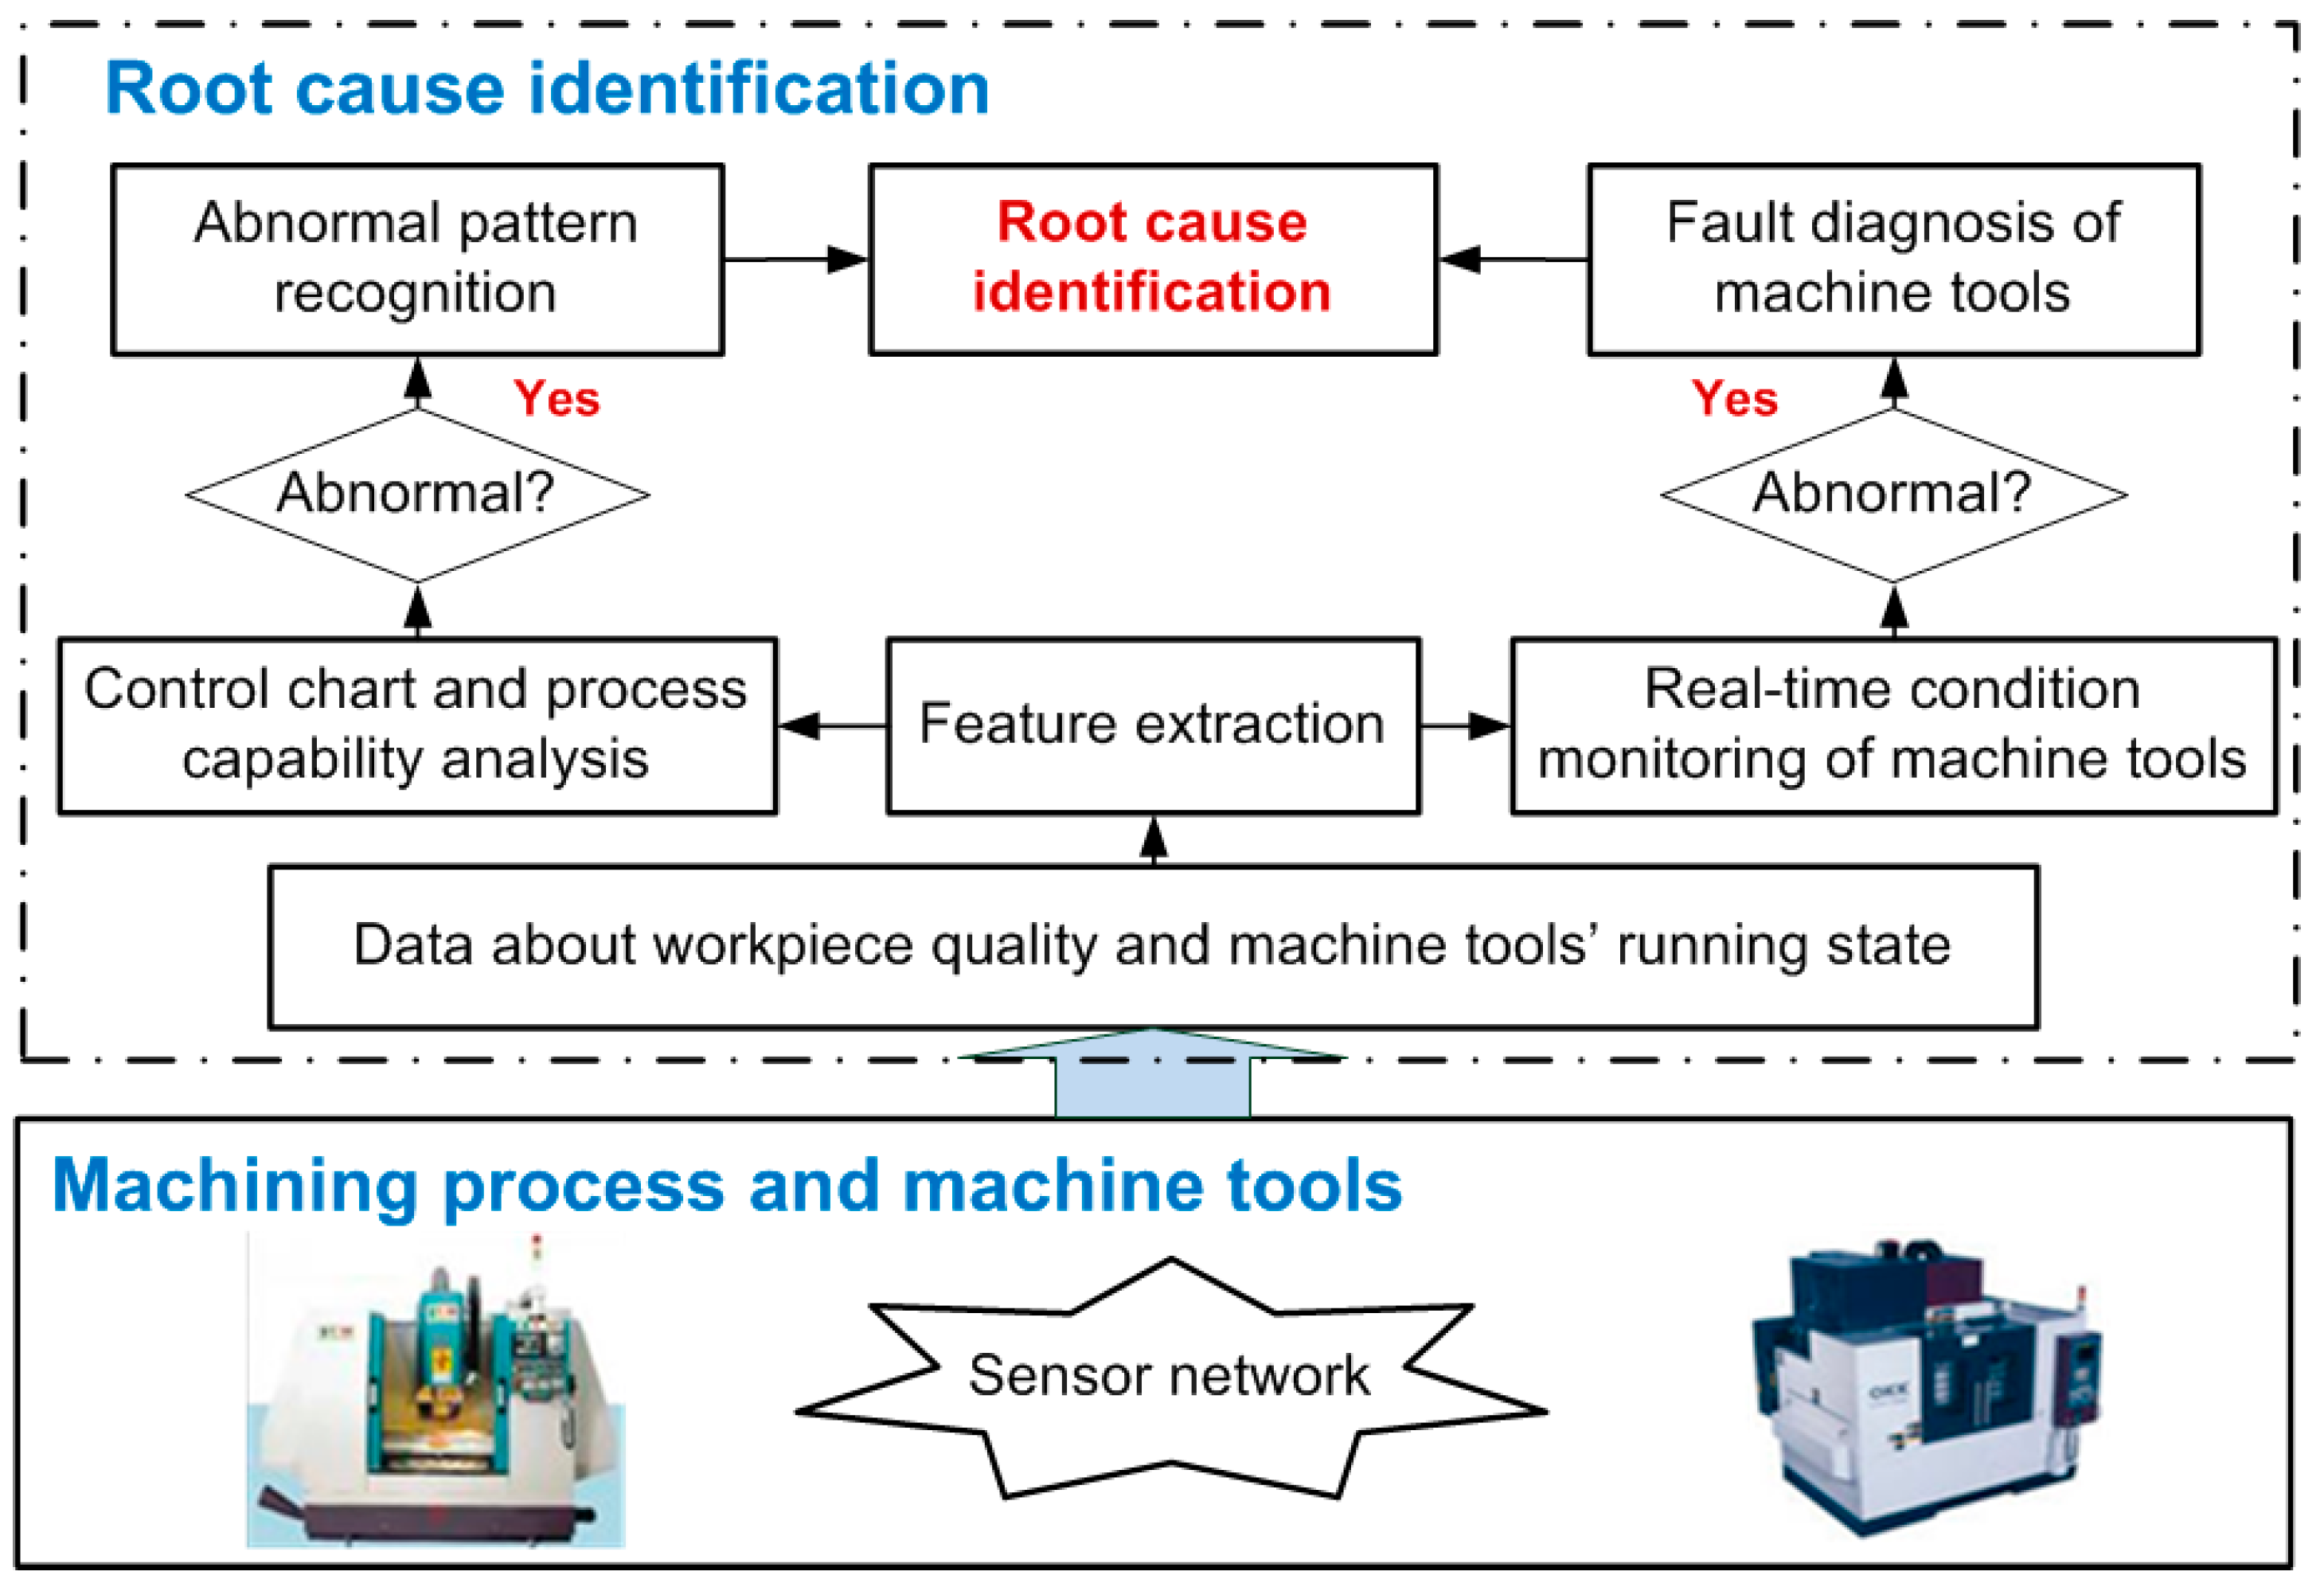
2. The Root Cause Identification Method Based on Statistical Process Control and Fault Diagnosis
3. Application
3.1. Control Charts and Process Capability Analysis
- (1)
- These 24 data are divided into six groups (i.e., K = 6) and there are four data in each group, then calculate the distance of each group:
- (2)
- Calculate the upper and lower boundary value of each group and determine the occurrence frequency and frequency density, as shown in Table 3. The distance between every two adjacent groups is h = 3.
- (3)
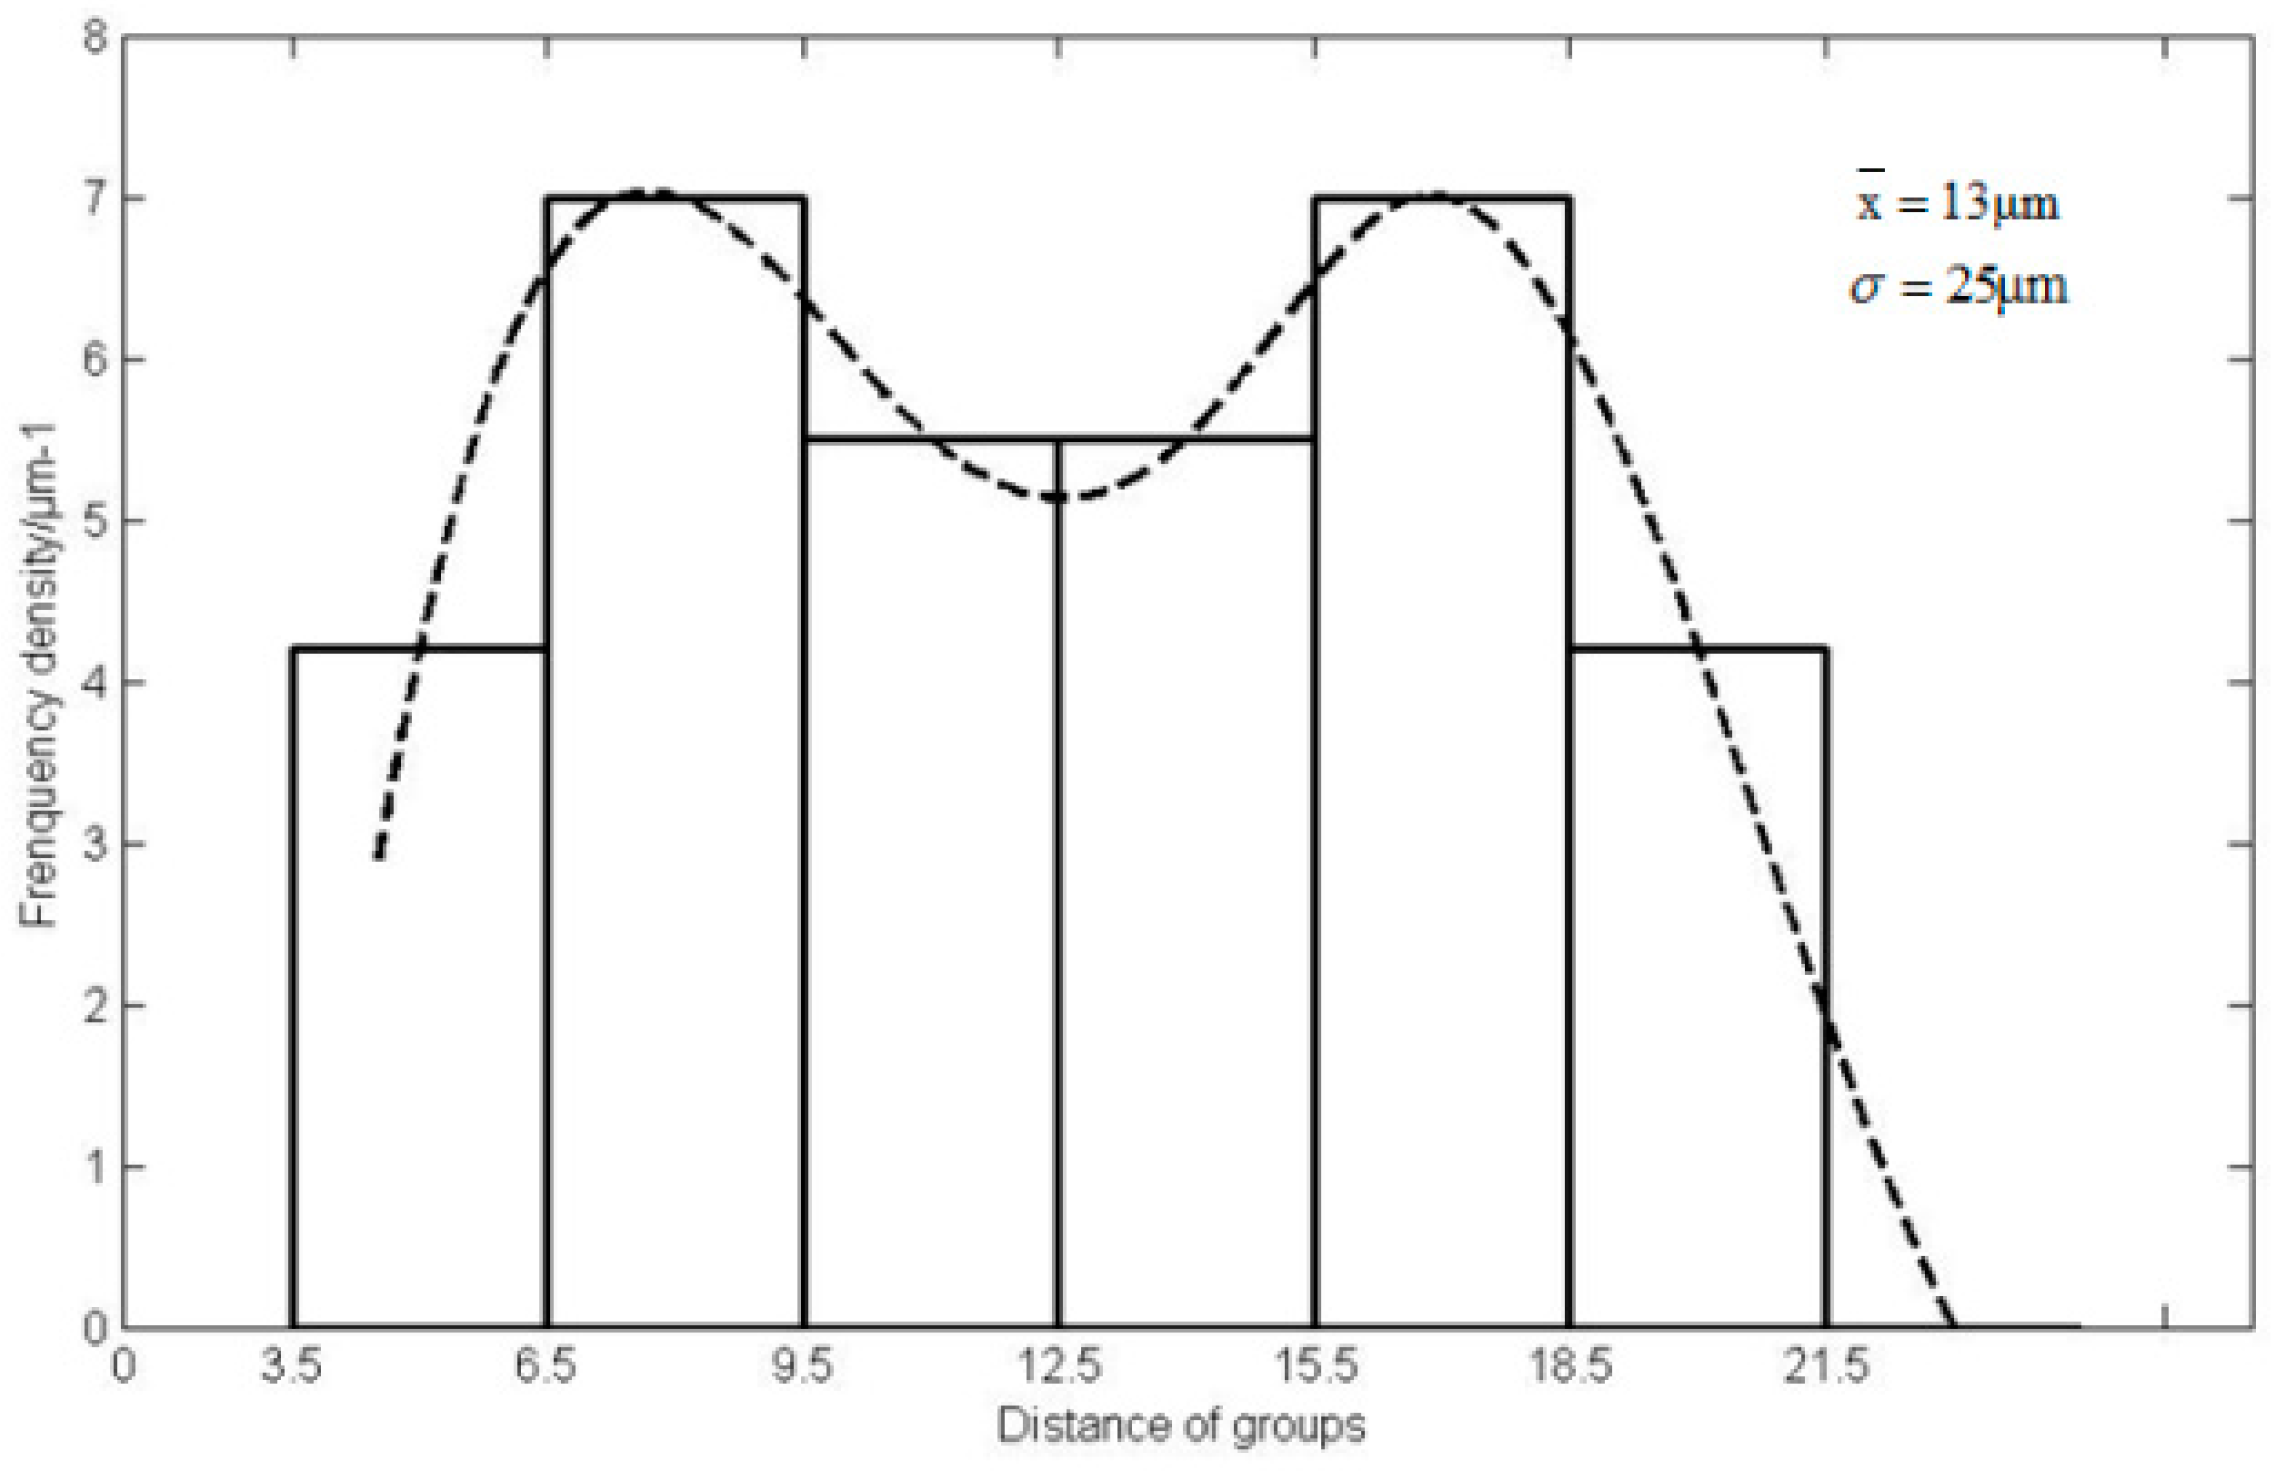
- Calculate the process capability index Cp and standard deviation σ.The mean of the measured coaxiality is:The standard deviation of the measured coaxiality is:The maximum of the measured coaxiality is:The process capability index is:Since , the process capability is insufficient.
- (4)
- Draw the control distribution chart using frequency density as the ordinate and the distance of groups as the abscissa, as shown in Figure 3.
3.2. Analysis of Root Cause
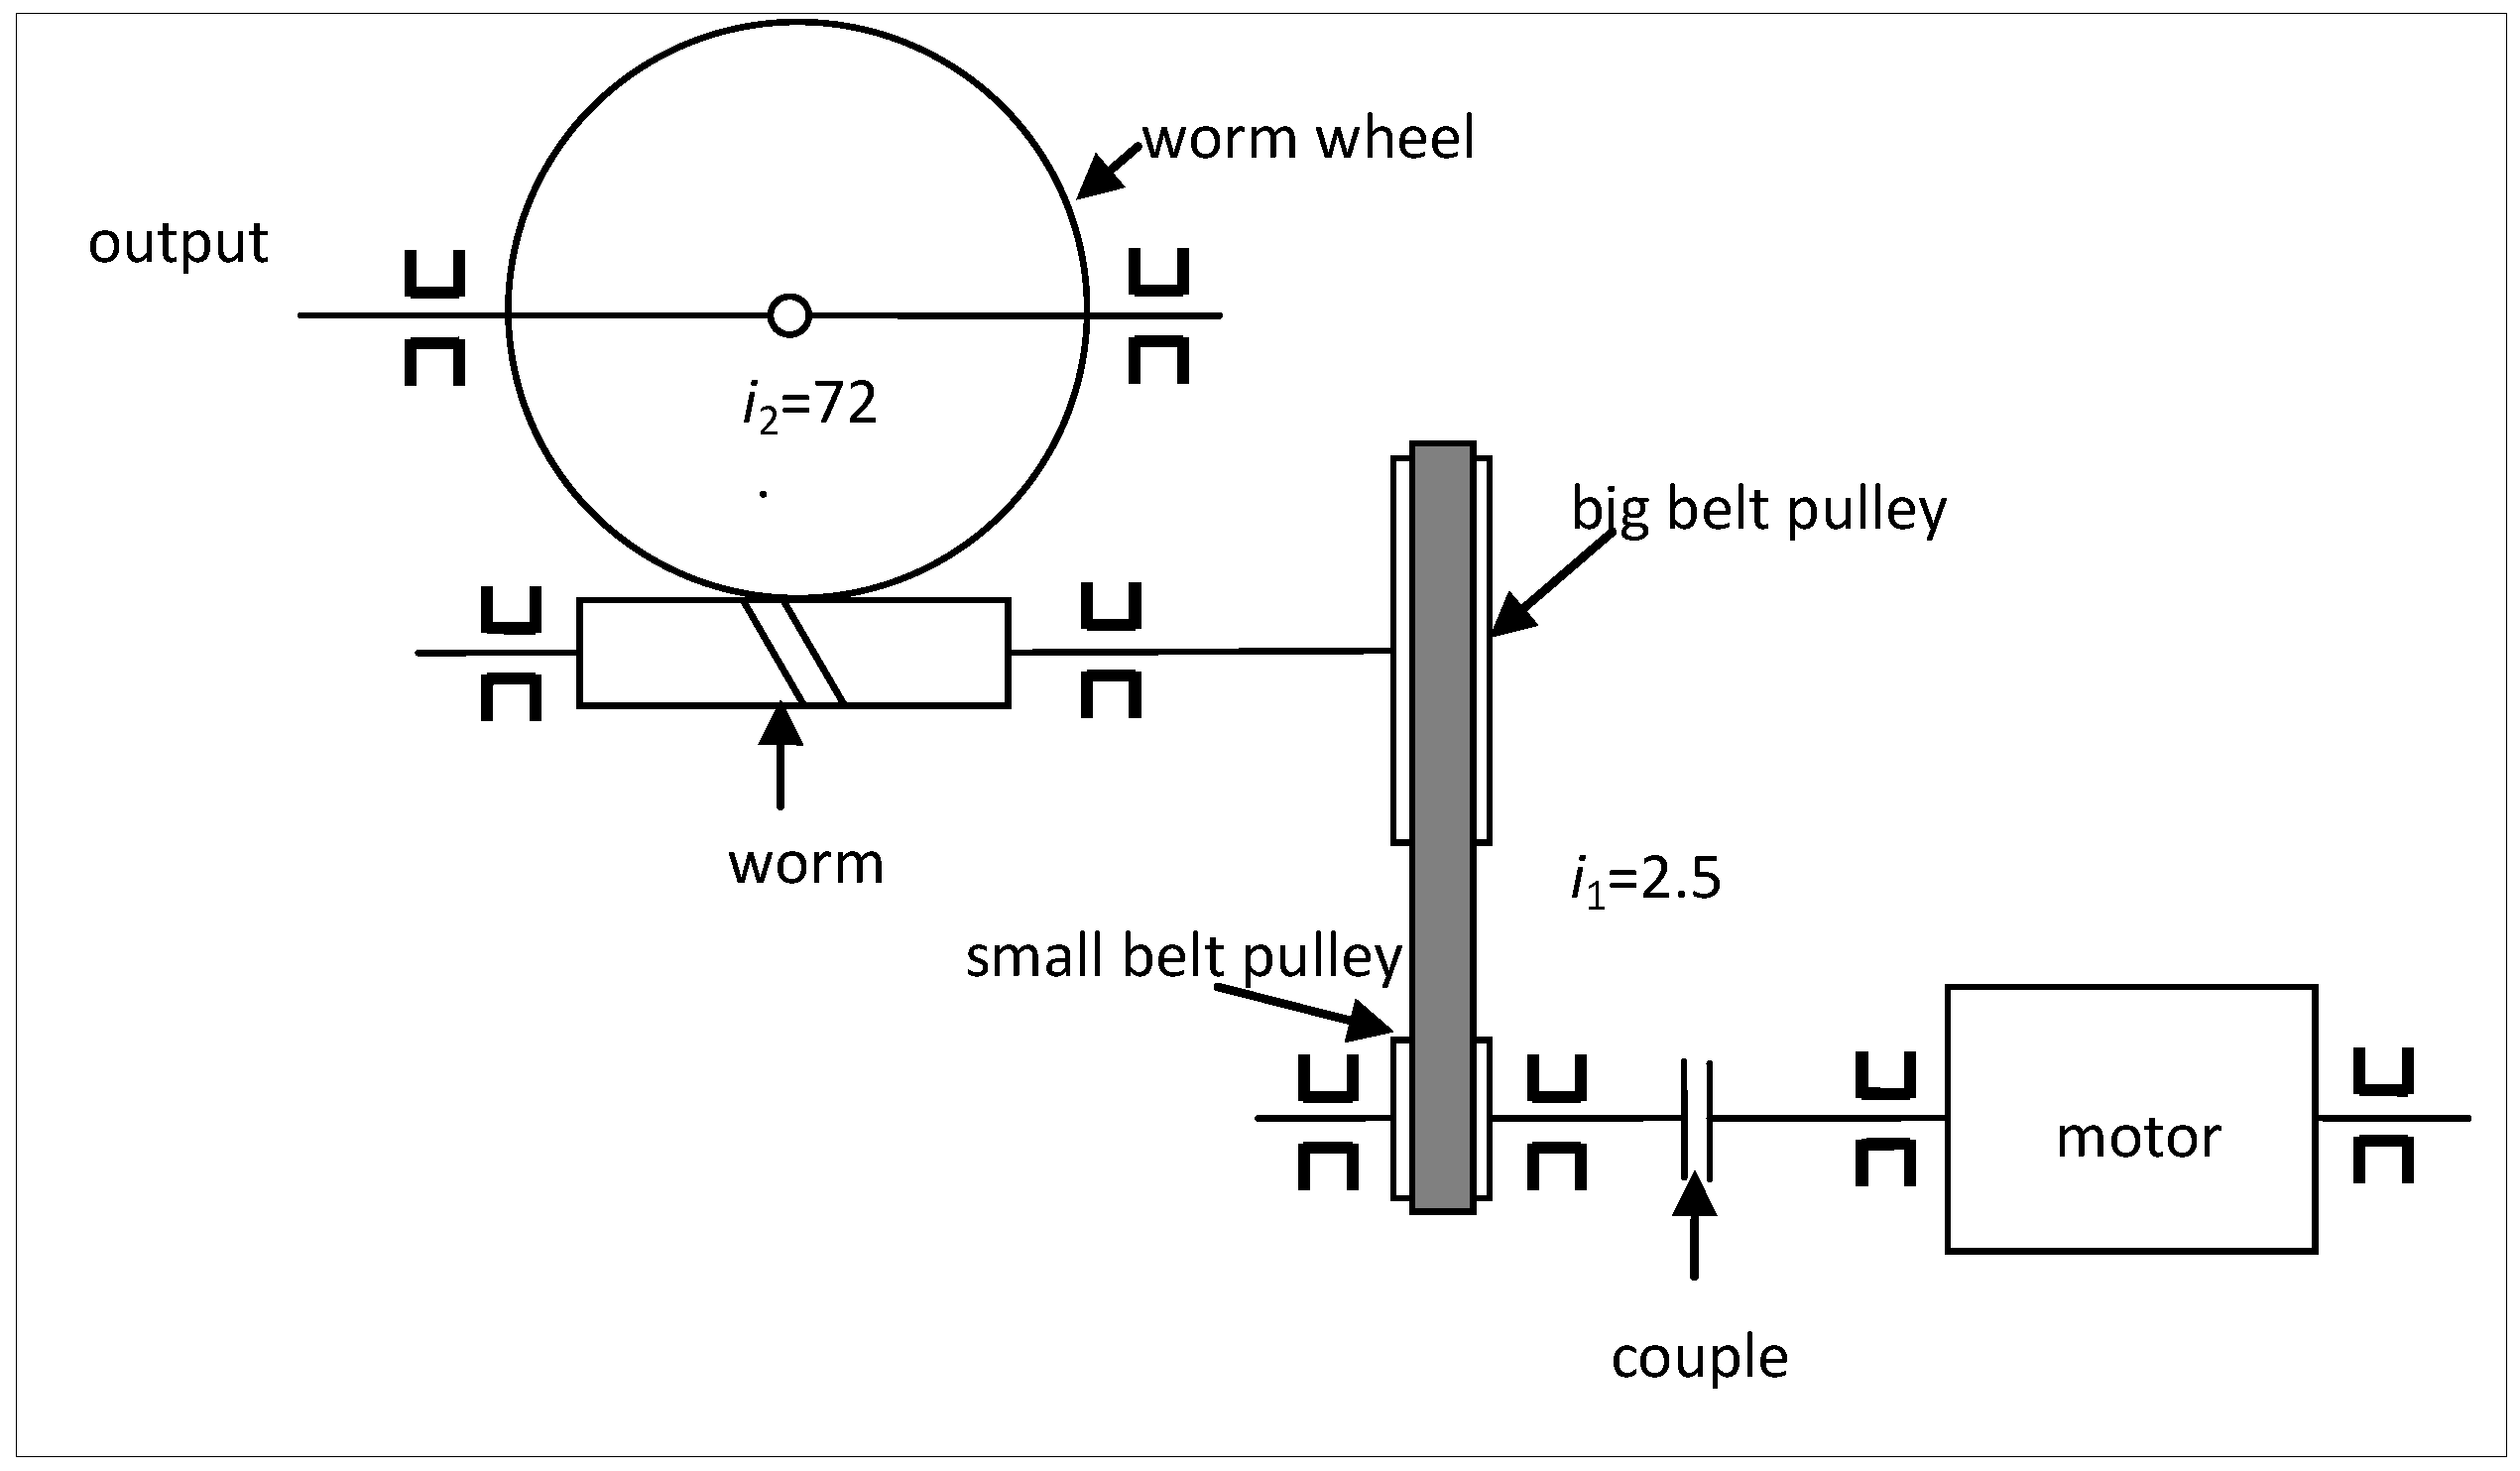
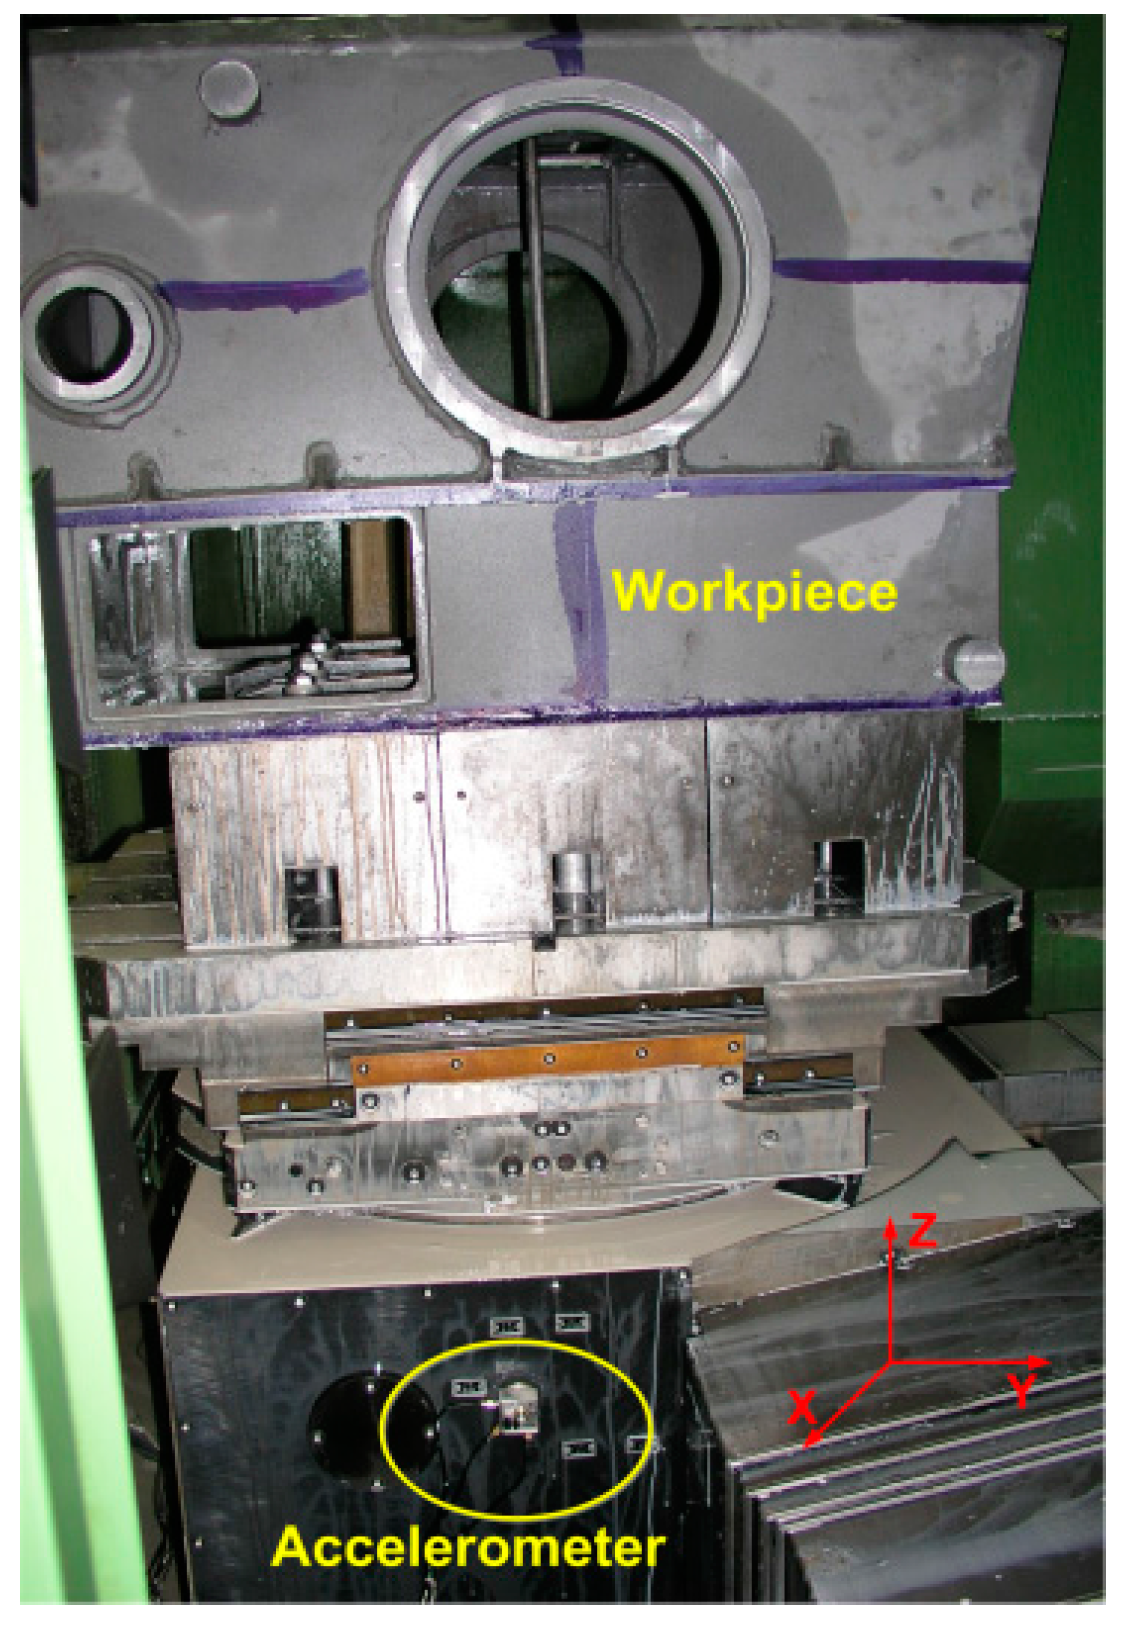
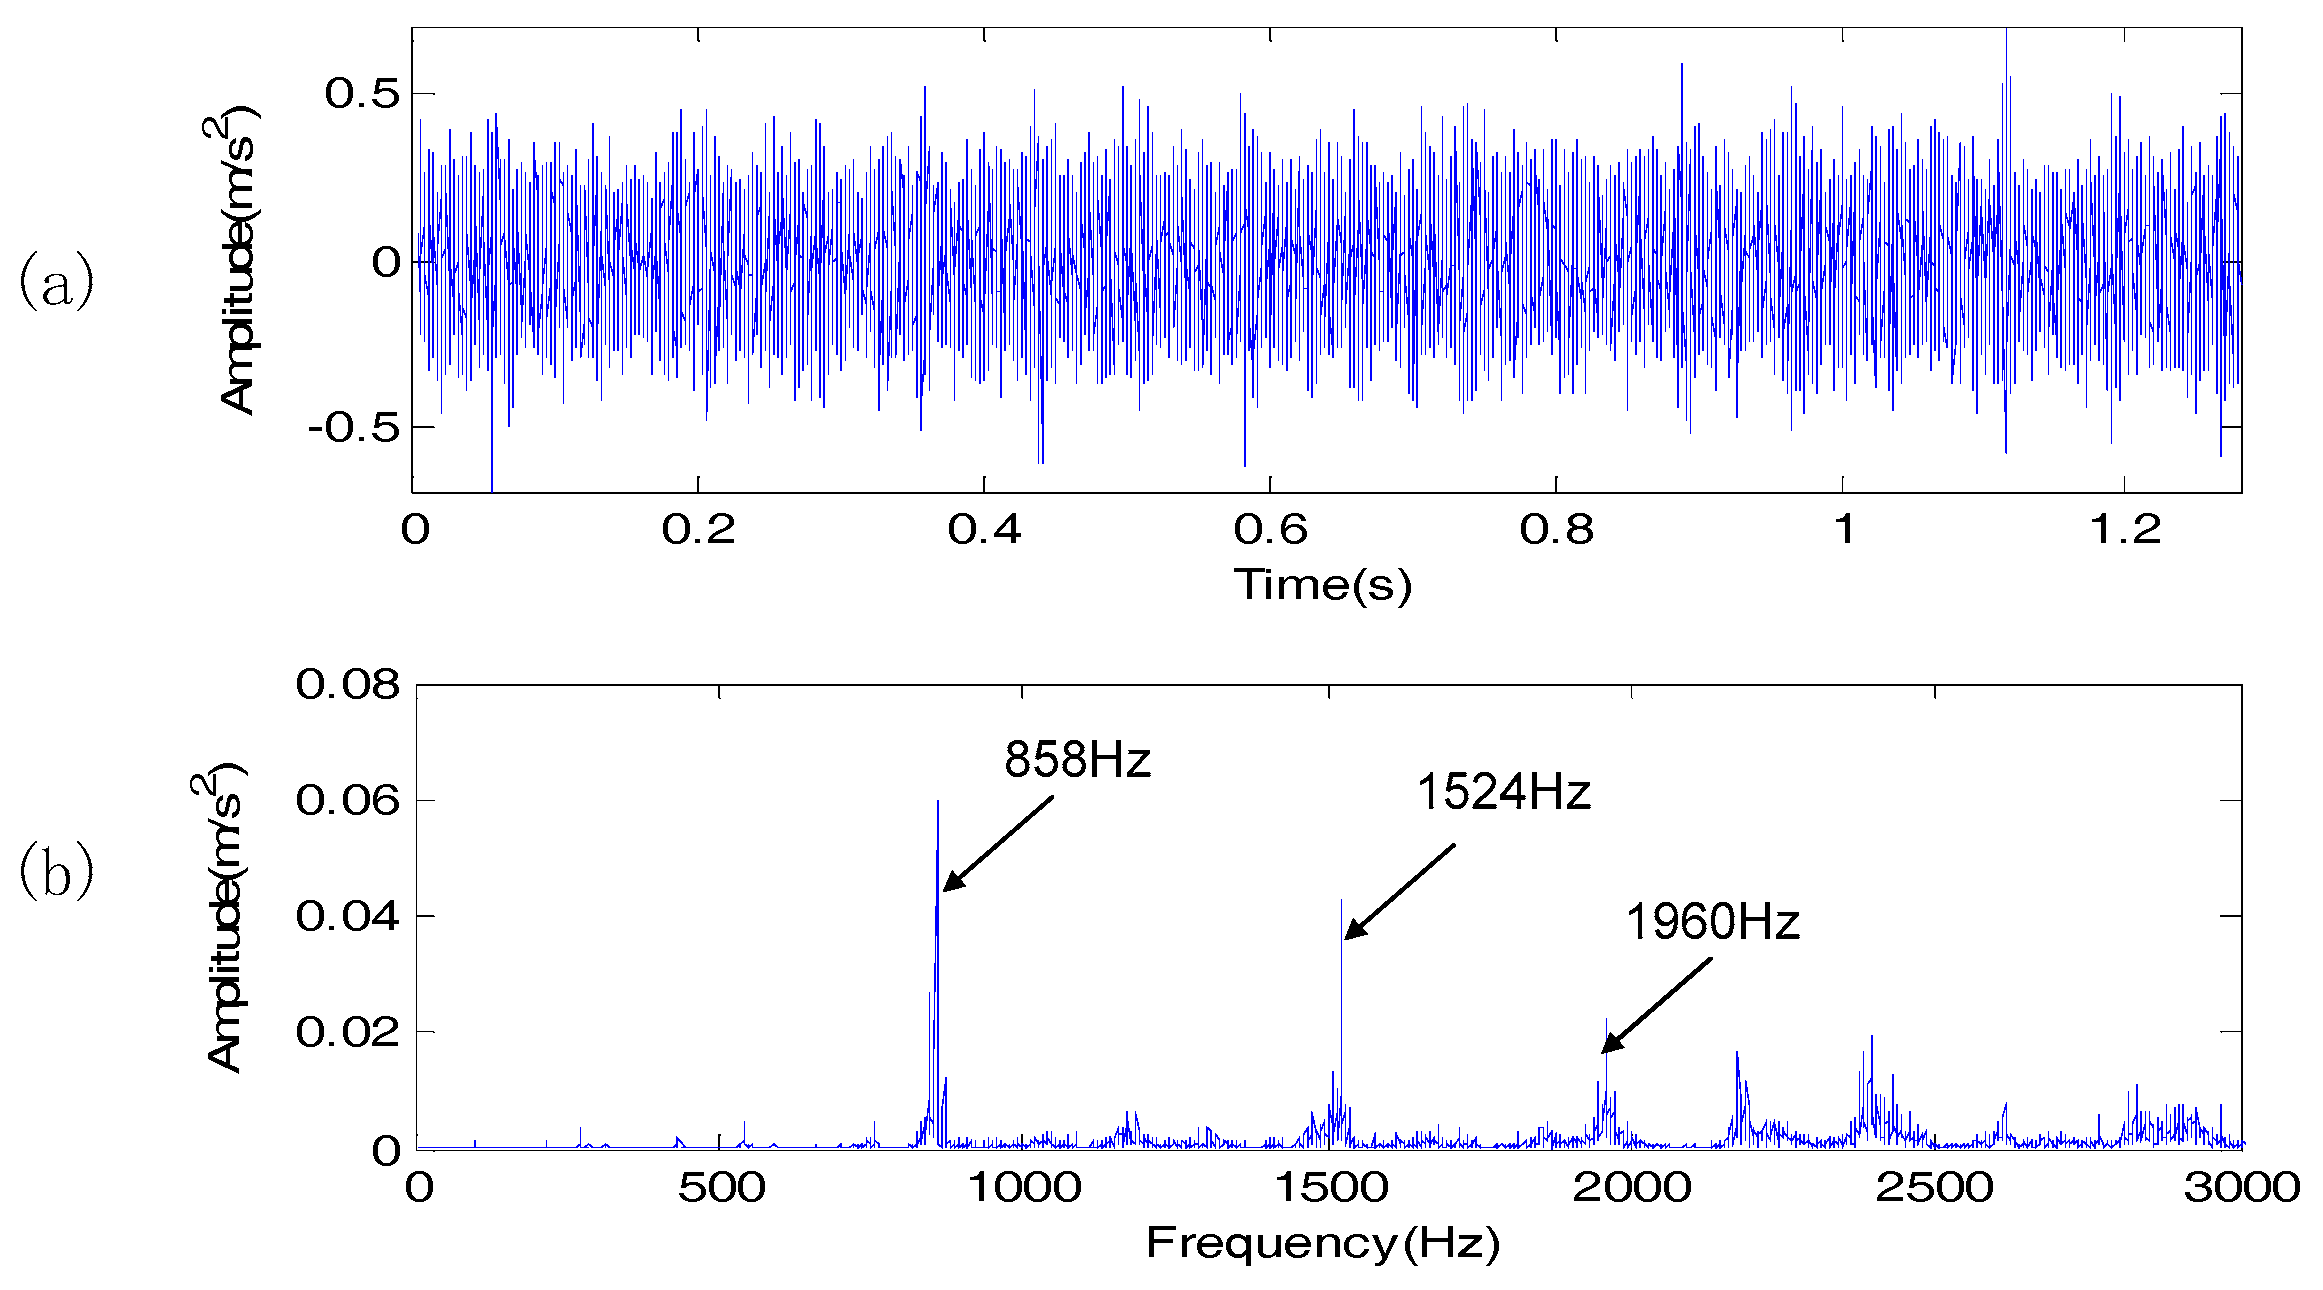
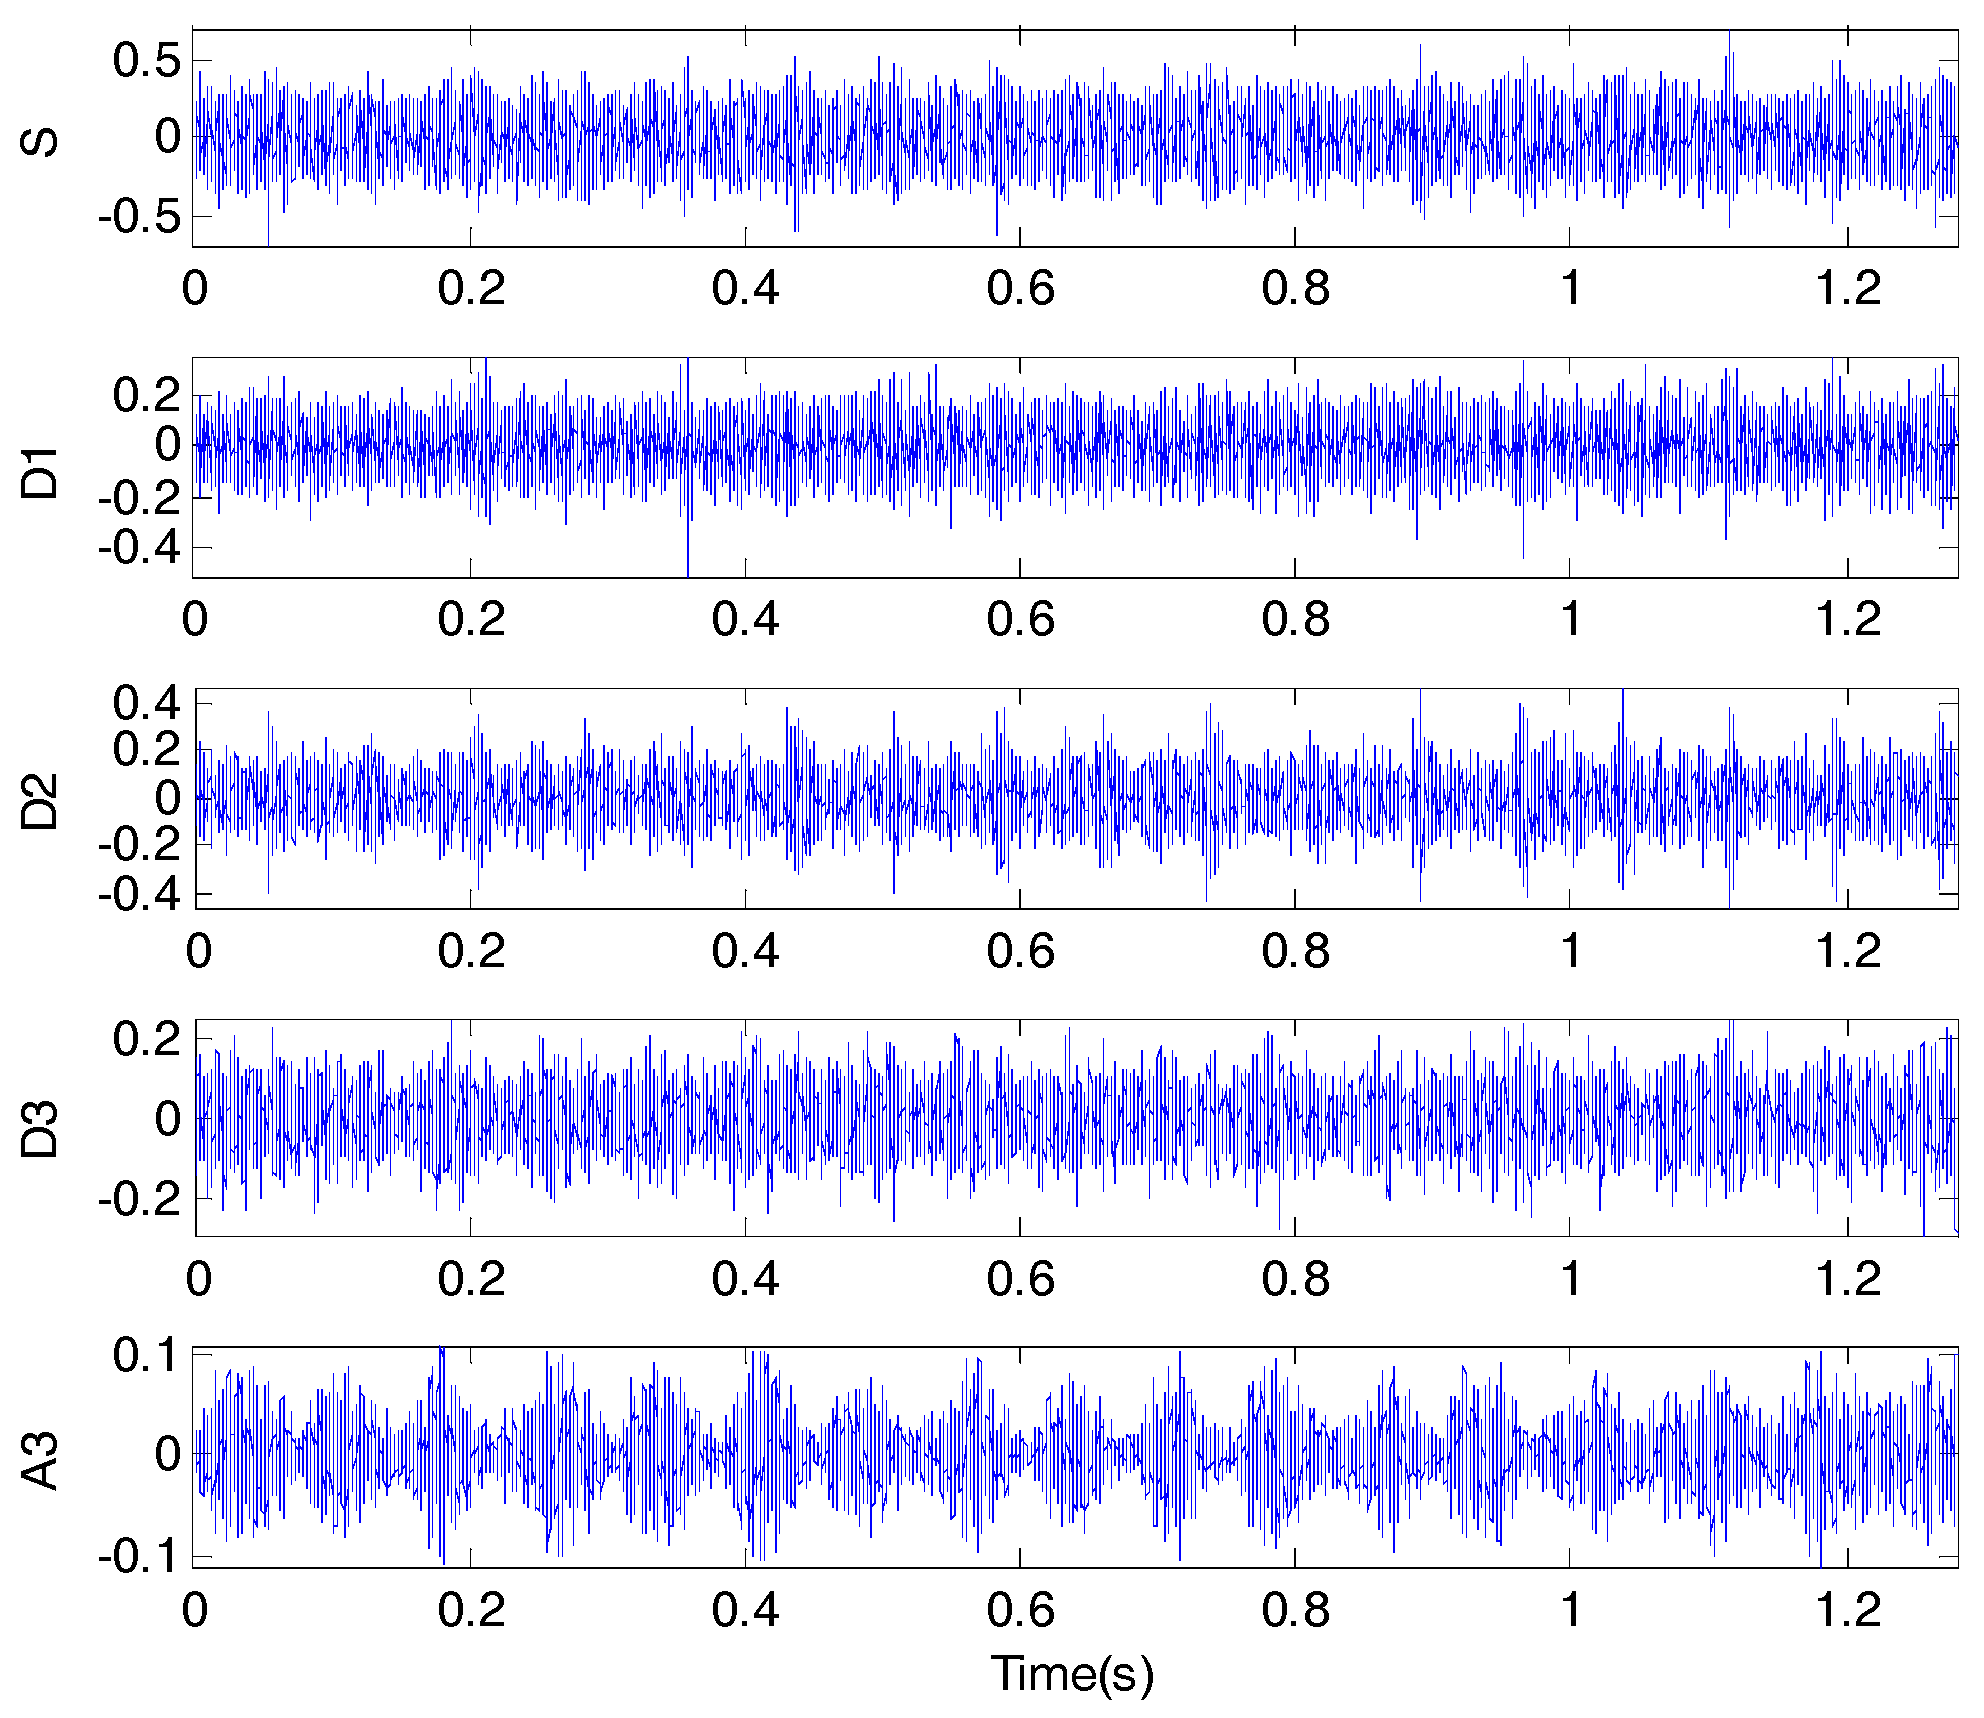
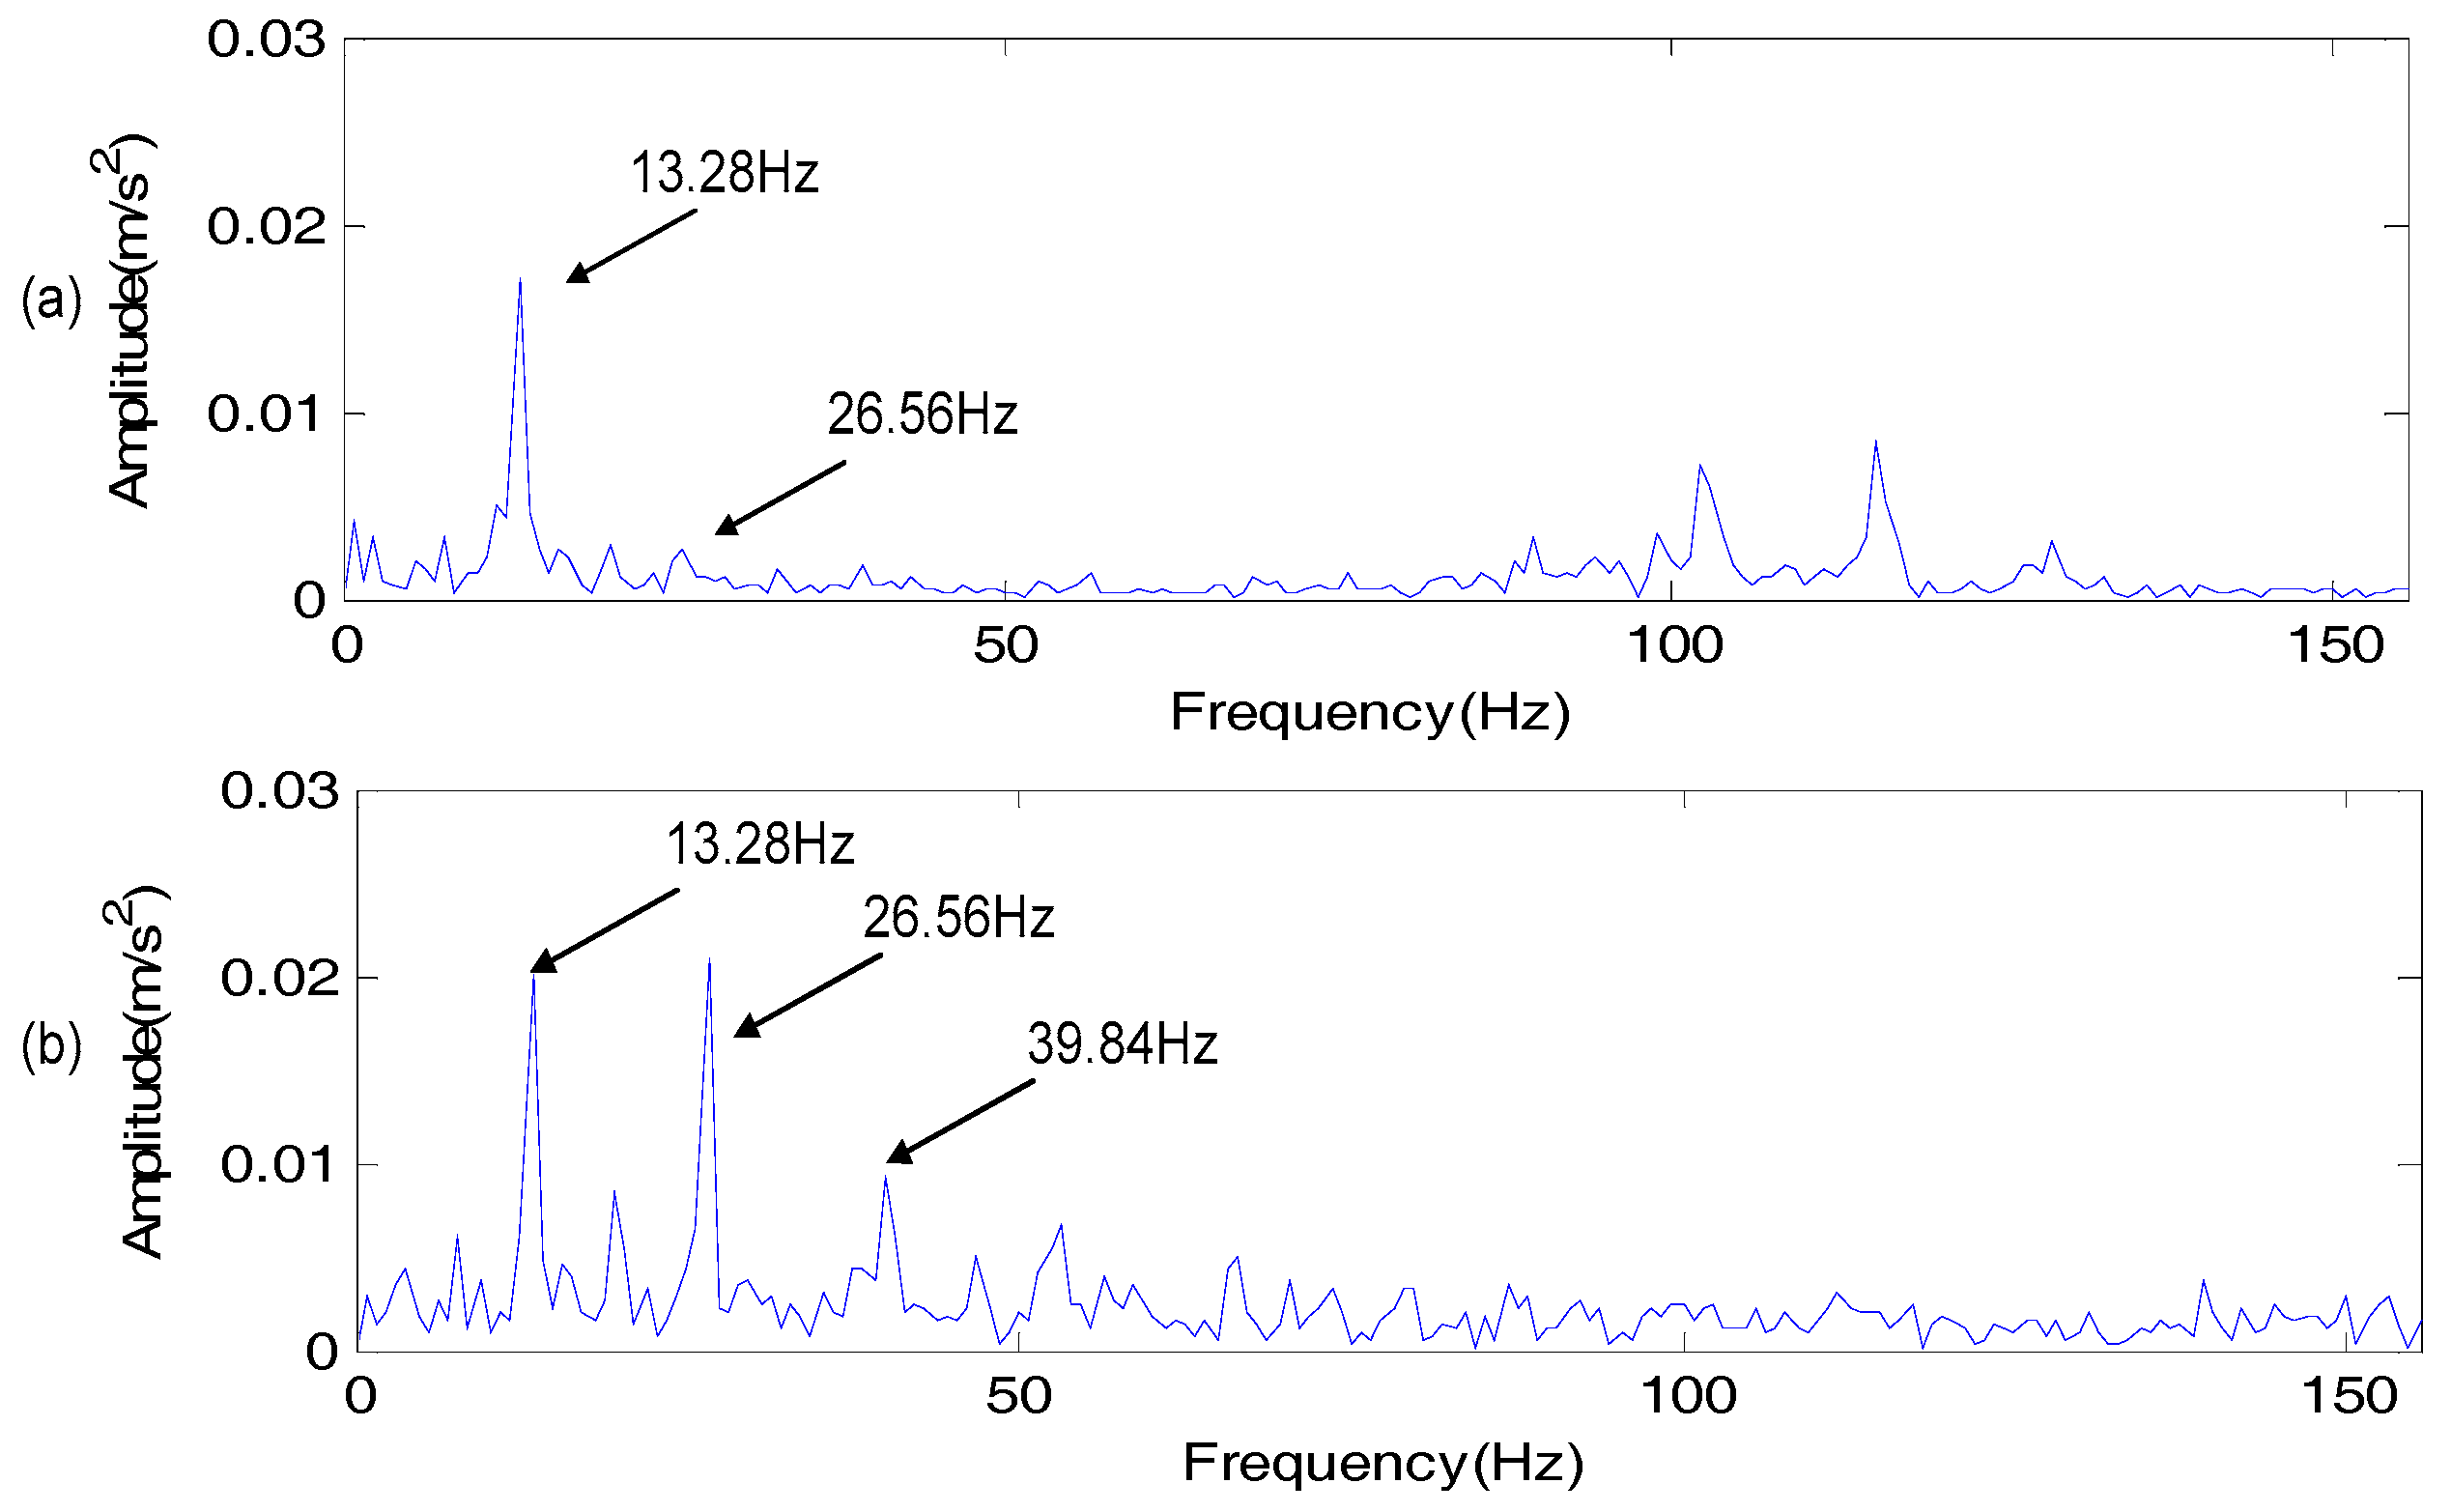
3.3. Condition Monitoring and Fault Diagnosis of the Rotary Work Table
- (1)
- The rotating frequency of the worm wheel: about 0.18 Hz
- (2)
- The rotating frequency of the worm: 13.2 Hz
- (3)
- The rotating frequency of the big pulley: 13.2 Hz
- (4)
- The rotating frequency of the small pulley: 33 Hz
- (5)
- The rotating frequency of the servo motor: 33 Hz
4. Conclusions
Acknowledgments
Author Contributions
Conflicts of Interest
References
- Du, S.C.; Lv, J.; Xi, L.F. A robust approach for root causes identification in machining processes using hybrid learning algorithm and engineering knowledge. J. Intell. Manuf. 2012, 23, 1833–1847. [Google Scholar] [CrossRef]
- Atashgar, K.; Noorossana, R. An integrating approach to root cause analysis of a bivariate mean vector with a linear trend disturbance. Int. J. Adv. Manuf. Technol. 2011, 52, 407–420. [Google Scholar] [CrossRef]
- Guh, R.-S. On-line identification and quantification of mean shifts in bivariate processes using a neural network-based approach. Qual. Reliab. Eng. Int. 2007, 23, 367–385. [Google Scholar] [CrossRef]
- Dey, S.; Stori, J.A. A bayesian network approach to root cause diagnosis of process variations. Int. J. Mach. Tools Manuf. 2005, 45, 75–91. [Google Scholar] [CrossRef]
- Liu, J.L.; Chen, D.S. Fault detection and identification using modified bayesian classification on pca subspace. Ind. Eng. Chem. Res. 2009, 48, 3059–3077. [Google Scholar] [CrossRef]
- Yu, J.; Rashid, M.M. A novel dynamic bayesian network-based networked process monitoring approach for fault detection, propagation identification, and root cause diagnosis. Aiche J. 2013, 59, 2348–2365. [Google Scholar] [CrossRef]
- Ding, Y.; Shi, J.J.; Ceglarek, D. Diagnosability analysis of multi-station manufacturing processes. J. Dyn. Syst. Meas. Control-Trans. Asme 2002, 124, 1–13. [Google Scholar] [CrossRef]
- Djurdjanovic, D.; Ni, J. Dimensional errors of fixtures, locating and measurement datum features in the stream of variation modeling in machining. J. Manuf. Sci. Eng. 2003, 125, 716–730. [Google Scholar] [CrossRef]
- Zhang, F.P.; Lu, J.P.; Tang, S.Y.; Sun, H.F.; Jiao, L. Locating error considering dimensional errors modeling for multistation manufacturing system. Chin. J. Mech. Eng. 2010, 23, 765–773. [Google Scholar] [CrossRef]
- Grasso, M.; Colosimo, B.M.; Moroni, G. The Use of Adaptive pca-Based Condition Monitoring Methods in Machining Processes; American Society Mechanical Engineers: New York, NY, USA, 2012; pp. 133–140. [Google Scholar]
- Liu, H.Q.; Lian, L.N.; Li, B.; Mao, X.Y.; Yuan, S.B.; Peng, F.Y. An approach based on singular spectrum analysis and the mahalanobis distance for tool breakage detection. Proc. Inst. Mech. Eng. Part C-J. Eng. Mech. Eng. Sci. 2014, 228, 3505–3516. [Google Scholar] [CrossRef]
- Ritou, M.; Garnier, S.; Furet, B.; Hascoet, J.Y. Angular approach combined to mechanical model for tool breakage detection by eddy current sensors. Mech. Syst. Signal Proc. 2014, 44, 211–220. [Google Scholar] [CrossRef]
- Azmi, A.I. Monitoring of tool wear using measured machining forces and neuro-fuzzy modelling approaches during machining of gfrp composites. Adv. Eng. Softw. 2015, 82, 53–64. [Google Scholar] [CrossRef]
- Nouni, M.; Fussell, B.K.; Ziniti, B.L.; Linder, E. Real-time tool wear monitoring in milling using a cutting condition independent method. Int. J. Mach. Tools Manuf. 2015, 89, 1–13. [Google Scholar]
- Cao, H.; Chen, X.; Zi, Y.; Ding, F.; Huaxin, C.; Jiyong, T.; Zhengjia, H. End milling tool breakage detection using lifting scheme and mahalanobis distance. Int. J. Mach. Tools Manuf. 2008, 48, 141–151. [Google Scholar] [CrossRef]
- Chen, X.; Li, B.; Cao, H.; He, Z. The condition monitoring and performance evaluating of digital manufacturing process. In Proceedings of the First International Conference Intelligent Robotics and Applications, Wuhan, China, 15–17 October 2008; pp. 593–603. [Google Scholar]
- Cao, H.R.; Li, B.; He, Z.J. Study on modeling of digital machining process and its condition monitoring & diagnosis method. In Precision Engineering and Non-Traditional Machining; Wang, J.H., Zhang, C.F., Jin, X., Zou, J.L., Eds.; Trans Tech Publications Ltd.: Stafa-Zurich, Switzerland, 2012; Volume 411, pp. 622–625. [Google Scholar]
- Law, L.-S.; Kim, J.H.; Liew, W.Y.H.; Lee, S.-K. An approach based on wavelet packet decomposition and hilbert–huang transform (wpd–hht) for spindle bearings condition monitoring. Mech. Syst. Signal Proc. 2012, 33, 197–211. [Google Scholar] [CrossRef]
- Cao, H.; Zhou, K.; Chen, X. Chatter identification in end milling process based on eemd and nonlinear dimensionless indicators. Int. J. Mach. Tools Manuf. 2015, 92, 52–59. [Google Scholar] [CrossRef]
- Cao, H.; Lei, Y.; He, Z. Chatter identification in end milling process using wavelet packets and hilbert–huang transform. Int. J. Mach. Tools Manuf. 2013, 69, 11–19. [Google Scholar] [CrossRef]
- Cao, H.; Zhang, X.; Chen, X. The concept and progress of intelligent spindles: A review. Int. J. Mach. Tools Manuf. 2017, 112, 21–52. [Google Scholar] [CrossRef]


| Sequence | Process Steps | Quality Requirements |
|---|---|---|
| 1 | Mill a hole with the size of Φ198H10 | Unilateral allowance is 1 mm |
| 2 | Rotate the work table with 180° and mill a hole with the size of Φ198H10 | Coaxiality ≤ Φ0.03 mm |
| 3 | Annealing and release internal stress | |
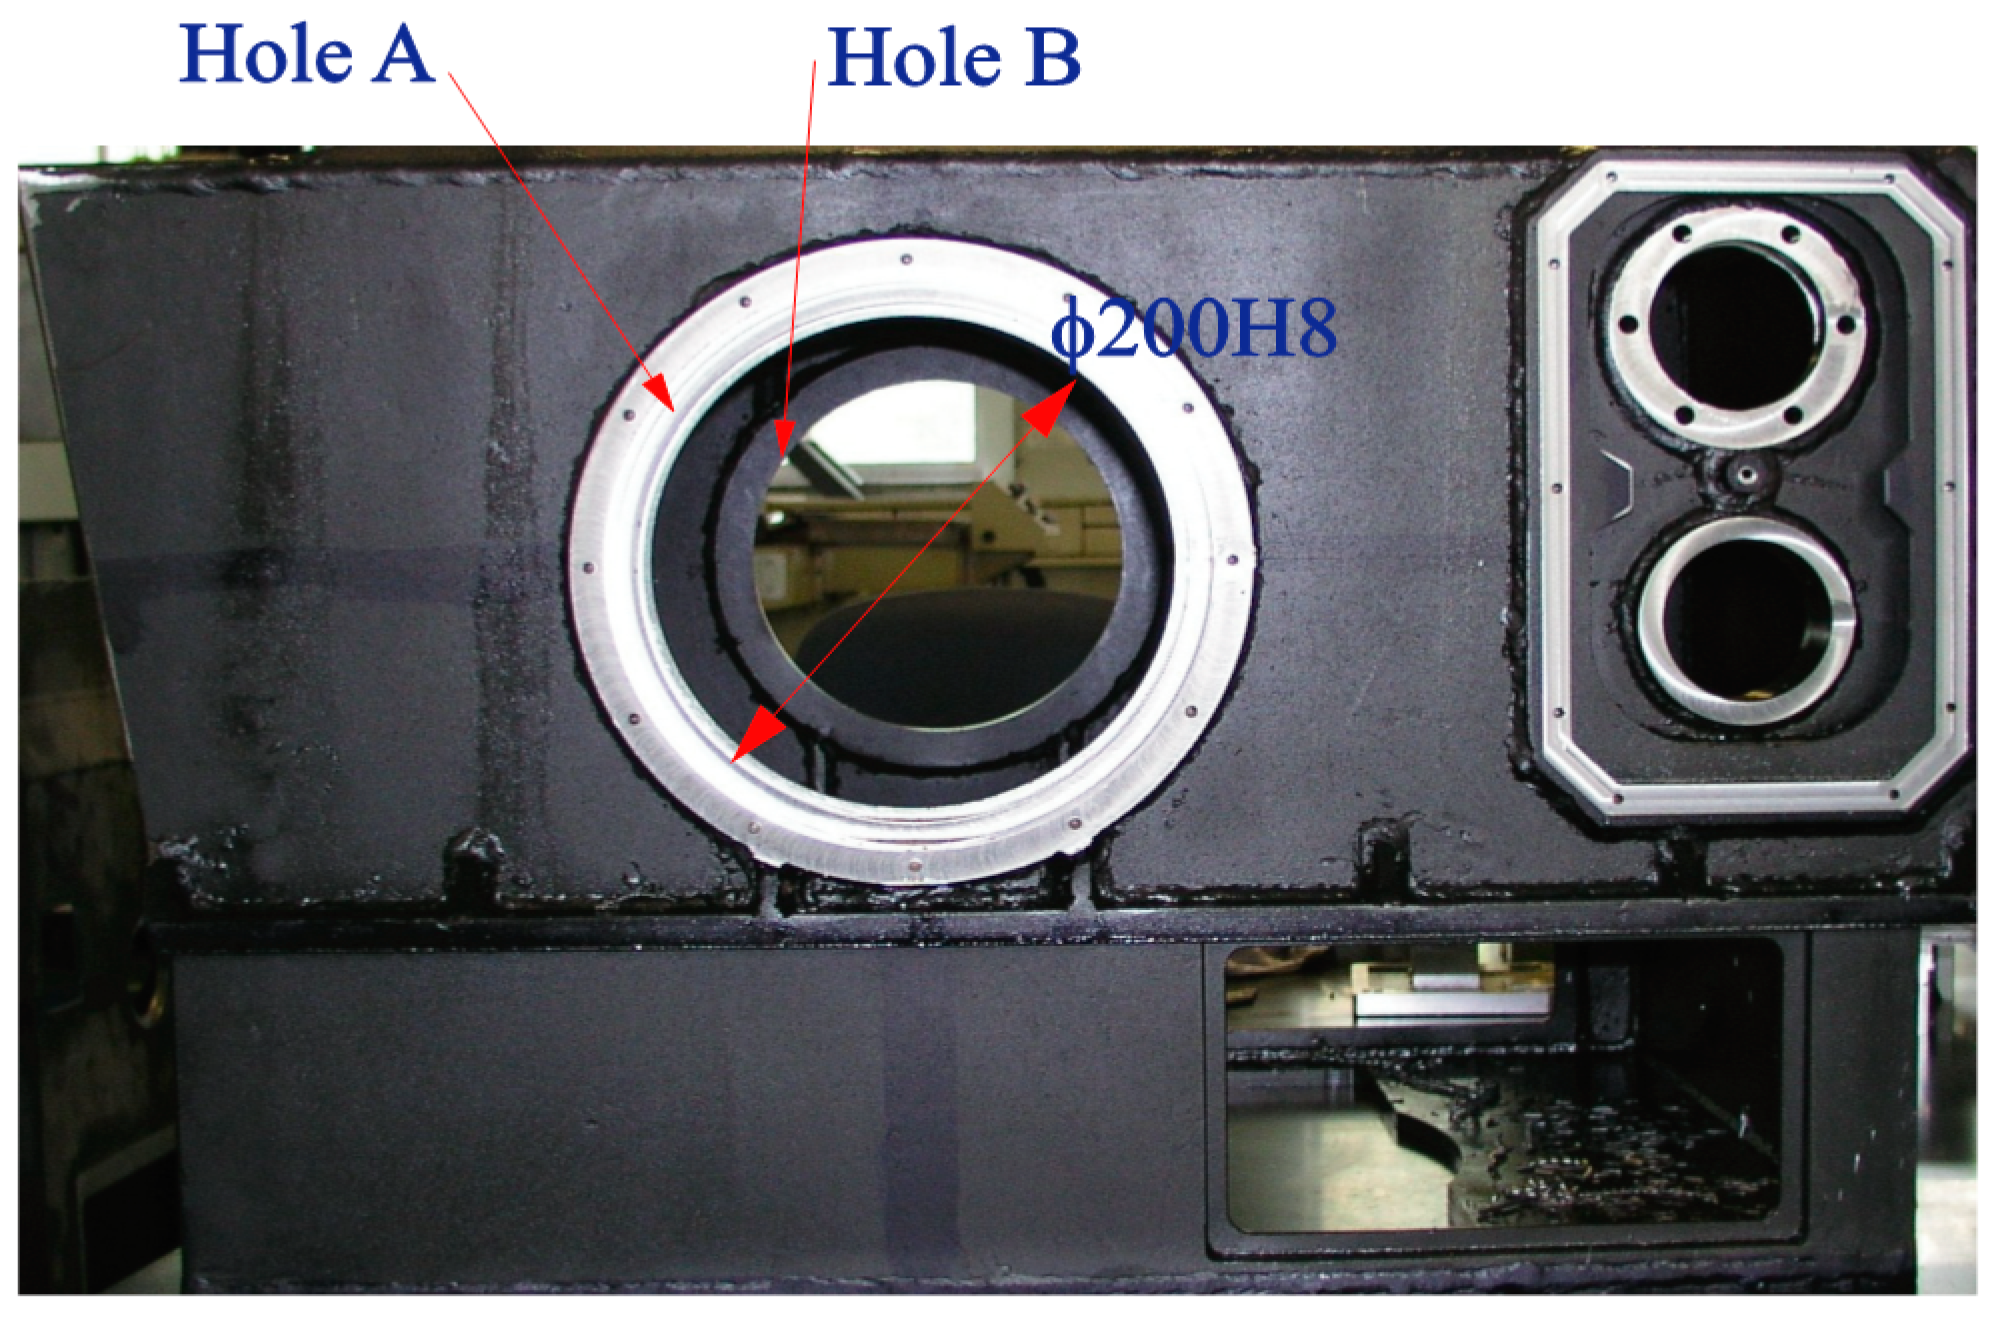
| 4 | Mill a hole with the size of Φ200H8 | Cylindricity ≤ 0.01 mm |
| 5 | Rotate the work table with 180° and mill a hole with the size of Φ200H8 | Coaxiality ≤ Φ0.01 mm |
| Sequence of Workpiece | Coaxiality/μm | Sequence of Workpiece | Coaxiality/μm |
|---|---|---|---|
| 1 | 5 | 13 | 13 |
| 2 | 15 | 14 | 12 |
| 3 | 16 | 15 | 13 |
| 4 | 17 | 16 | 9 |
| 5 | 7 | 17 | 10 |
| 6 | 5 | 18 | 11 |
| 7 | 20 | 19 | 8 |
| 8 | 19 | 20 | 6 |
| 9 | 18 | 21 | 13 |
| 10 | 20 | 22 | 9 |
| 11 | 11 | 23 | 17 |
| 12 | 9 | 24 | 18 |
| Group Number | Group Limit/μm | Central Value/μm | Frequency | Frequency/% | Frequency Density/μm−1 |
|---|---|---|---|---|---|
| 1 | 3.5~6.5 | 5 | 3 | 12.5 | 4.2 |
| 2 | 6.5~9.5 | 8 | 5 | 20.8 | 7 |
| 3 | 9.5~12.5 | 11 | 4 | 16.6 | 5.5 |
| 4 | 12.5~15.5 | 14 | 4 | 16.6 | 5.5 |
| 5 | 15.5~18.5 | 17 | 5 | 20.8 | 7 |
| 6 | 18.5~21.5 | 20 | 3 | 12.5 | 4.2 |
© 2017 by the authors. Licensee MDPI, Basel, Switzerland. This article is an open access article distributed under the terms and conditions of the Creative Commons Attribution (CC BY) license (http://creativecommons.org/licenses/by/4.0/).
Share and Cite
Cao, H.; Li, D.; Yue, Y. Root Cause Identification of Machining Error Based on Statistical Process Control and Fault Diagnosis of Machine Tools. Machines 2017, 5, 20. https://doi.org/10.3390/machines5030020
Cao H, Li D, Yue Y. Root Cause Identification of Machining Error Based on Statistical Process Control and Fault Diagnosis of Machine Tools. Machines. 2017; 5(3):20. https://doi.org/10.3390/machines5030020
Chicago/Turabian StyleCao, Hongrui, Denghui Li, and Yiting Yue. 2017. "Root Cause Identification of Machining Error Based on Statistical Process Control and Fault Diagnosis of Machine Tools" Machines 5, no. 3: 20. https://doi.org/10.3390/machines5030020
APA StyleCao, H., Li, D., & Yue, Y. (2017). Root Cause Identification of Machining Error Based on Statistical Process Control and Fault Diagnosis of Machine Tools. Machines, 5(3), 20. https://doi.org/10.3390/machines5030020