Article

Quantification of a Low-Cost Stretchable Conductive Sensor Using an Expansion/Contraction Simulator Machine: A Step towards Validation of a Noninvasive Cardiac and Respiration Monitoring Prototype

by
Elham Shabani Varaki
*,
Paul P. Breen
and
Gaetano D. Gargiulo
The MARCS Institute, Western Sydney University, Sydney 2750, Australia
*
Author to whom correspondence should be addressed.
Machines 2017, 5(4), 22; https://doi.org/10.3390/machines5040022
Submission received: 18 May 2017 / Revised: 29 September 2017 / Accepted: 1 October 2017 / Published: 6 October 2017

Abstract

:
The use of wearable sensors in health monitoring is increasing dramatically, largely due to their convenience and low-cost. Understanding the accuracy of any given sensor is paramount to avoid potential misdiagnosis. Commercially available electro-resistive band (ERB) sensors have been integrated into several newly developed wearable devices with a view to using these sensors to monitor a range of respiratory and cardiovascular metrics. Quantification of the ERBs is a necessary to step towards validation of these prototypes, as it provides valuable information, which could be exploited for compensation and ultimately, for improvement of their performance. Here, we present an analysis of the ERB sensors using an expansion/contraction simulator machine. Using the developed rig, the characteristics of four ERBs were compared with a linear displacement sensor (string potentiometer) during continuous use over the course of four-and-a-half days to investigate the error and nonlinearity of the ERBs. The analysis of the recorded data includes calculation and comparison of the total harmonic distortions of the two sensors to quantify ERB nonlinearity. Moreover, comparisons between the peak-to-peak voltages and signal-to-noise ratios of the ERB and string potentiometer demonstrate the effect nonlinearity on these factors. This paper demonstrates the nonlinearity of ERBs and highlights the implications for their use in practice.

1. Introduction

Wearable sensors have recently attracted a lot of attention as their deployment in biomedical applications has generated new possibilities for health monitoring, treatment assessment, early detection of health disorders, prevention of their complications, and ultimately a reduction in health care costs [1,2].
While traditional health care systems are often limited to use within the clinical environment, wearable sensors can be embedded in ordinary clothing enabling convenient, low-cost implementations in home and community settings [3]. Stretchable electro-resistive sensors have shown potential for use as wearable strain sensors fulfilling the requirements of future technology, particularly in the monitoring of human activity and personal healthcare [4,5]. Consequently, a great deal of effort has been recently dedicated to the development and characterization of such sensors. Generally, stretchable electro-resistive sensors incorporate two main components, an integrated conductive component (e.g., carbon black, graphene, nanowires) and a flexible support material (e.g., silicon based elastomers, rubber based elastomers) [4]. These sensors operate through their mechanical deformation, inducing changes in the resistance of the sensor, which ultimately can be monitored as an electrical signal [4]. However, these sensors may respond differently depending on their material and fabrication. For example, stretchable electro-resistive sensors have a diverse range of gauge factors varying by orders of magnitude i.e., 1 [6,7,8,9], 10 [8,10,11,12,13,14], 100 [15,16,17], 1000 [18], and up to 1,000,000 [19]. Other characteristics such as the linearity, hysteresis, and frequency response of the stretchable electro-resistive sensors may also vary from one to another. A careful understanding of these characteristics is crucial for appropriate use of such sensors. For instance, nonlinearity of the sensor may result to requirement of a more complicated calibration process [4]. Two recent reviews have included highly informative details in regards to the performance and applications of different stretchable electro-resistive strain sensors [4,5]. According to the existing literature, several of the recently introduced stretchable sensors can be used for different health monitoring application. For instance, Yamada et al. reported stretchable electro-resistive carbon nanotube sensors which could be used either on skin or clothing such as stockings, bandages, and gloves to detect various types of motions including limb movement, breathing, and speech [6]. Amjadi et al. also reported a highly stretchable electro-resistive sensor made up of silver nanowire and a silicon-based organic polymer (Polydimethylsiloxane) and demonstrated that the sensor could be used in finger motion detection [8]. Blond et al. introduced graphene rubber electro-resistive sensors and demonstrated the potential of this sensor in the detection of finger/forearm movement; speech; and monitoring of heart rate, breathing, and arterial pulse [20]. Stretchable electro-resistive sensors can be used on skin and or clothing, providing ubiquitous use and in a wide range of applications. Therefore, many more stretchable electro-resistive have been reported [4,5]. However, these sensors have only recently been developed, and many of them are not commercially available yet.
Commercially available conductive rubber cord stretch sensors, also known as electro-resistive band (ERB) sensors, are normally used for robotic applications and more recently, they have been used as wearable sensors to capture a range of bio-signals [21,22,23,24,25]. ERB sensors (available from Adafruit, NY, USA) are made of highly elastic carbon black impregnated rubber and are sold with a length of 1 m and a thickness of 2 mm. The ERBs have a defined resistance at rest (~15 ohms/cm) and their resistance increases as they are stretched. These sensors are cheap, waterproof, and are easily sewn into fabric, making them ideal for use as wearable sensors, e.g., embedded in a T-shirt or knee support [22,24]. This paper focuses on the quantification of the ERB sensors.
The ERB sensors were originally created as electromagnetic field (EMF) gaskets and have been used as displacement sensors in robotic applications [26]. More recently, we have explored the use of these sensors in several prototype devices with the intention of measuring cardiac stroke volume, respiration tidal volume [21,22], and changes in peripheral blood flow [23,24,25]. This previous work provided some promising results suggesting that these low-cost ERBs were capable of providing valuable clinical information and could lead to a viable solution for continuous and noninvasive measurement of respiration, cardiac function, and peripheral vascular competence. However, characterization of ERB sensors is necessary to provide a precise pre-calibration of the sensor and/or appropriate post-hoc analysis of the data generated. Investigation of the sensor behavior during expansion and contraction is a prerequisite to compensate for the possible nonlinearities, which may be detrimental to accuracy and performance. More generally, there is a need for careful quantification of these ERB sensors to fully understand their characteristics and define the possible biases and error that may be associated with their use. This characterization will be of interest to other users and developers incorporating this type of sensor into their devices.
In this initial work, we describe an expansion/contraction rig that simulates the stretch that would typically be experienced by an ERB if worn on the chest to capture respiration. We tested these bands continuously over the course of four-and-a-half days and compared the measurements to a string potentiometer. Our aim was to capture sufficient data from the ERBs over time, compare these to a gold standard measurement and determine if it may be possible to compensate for the predicted non-linearity of the ERBs system.

2. Materials and Methods

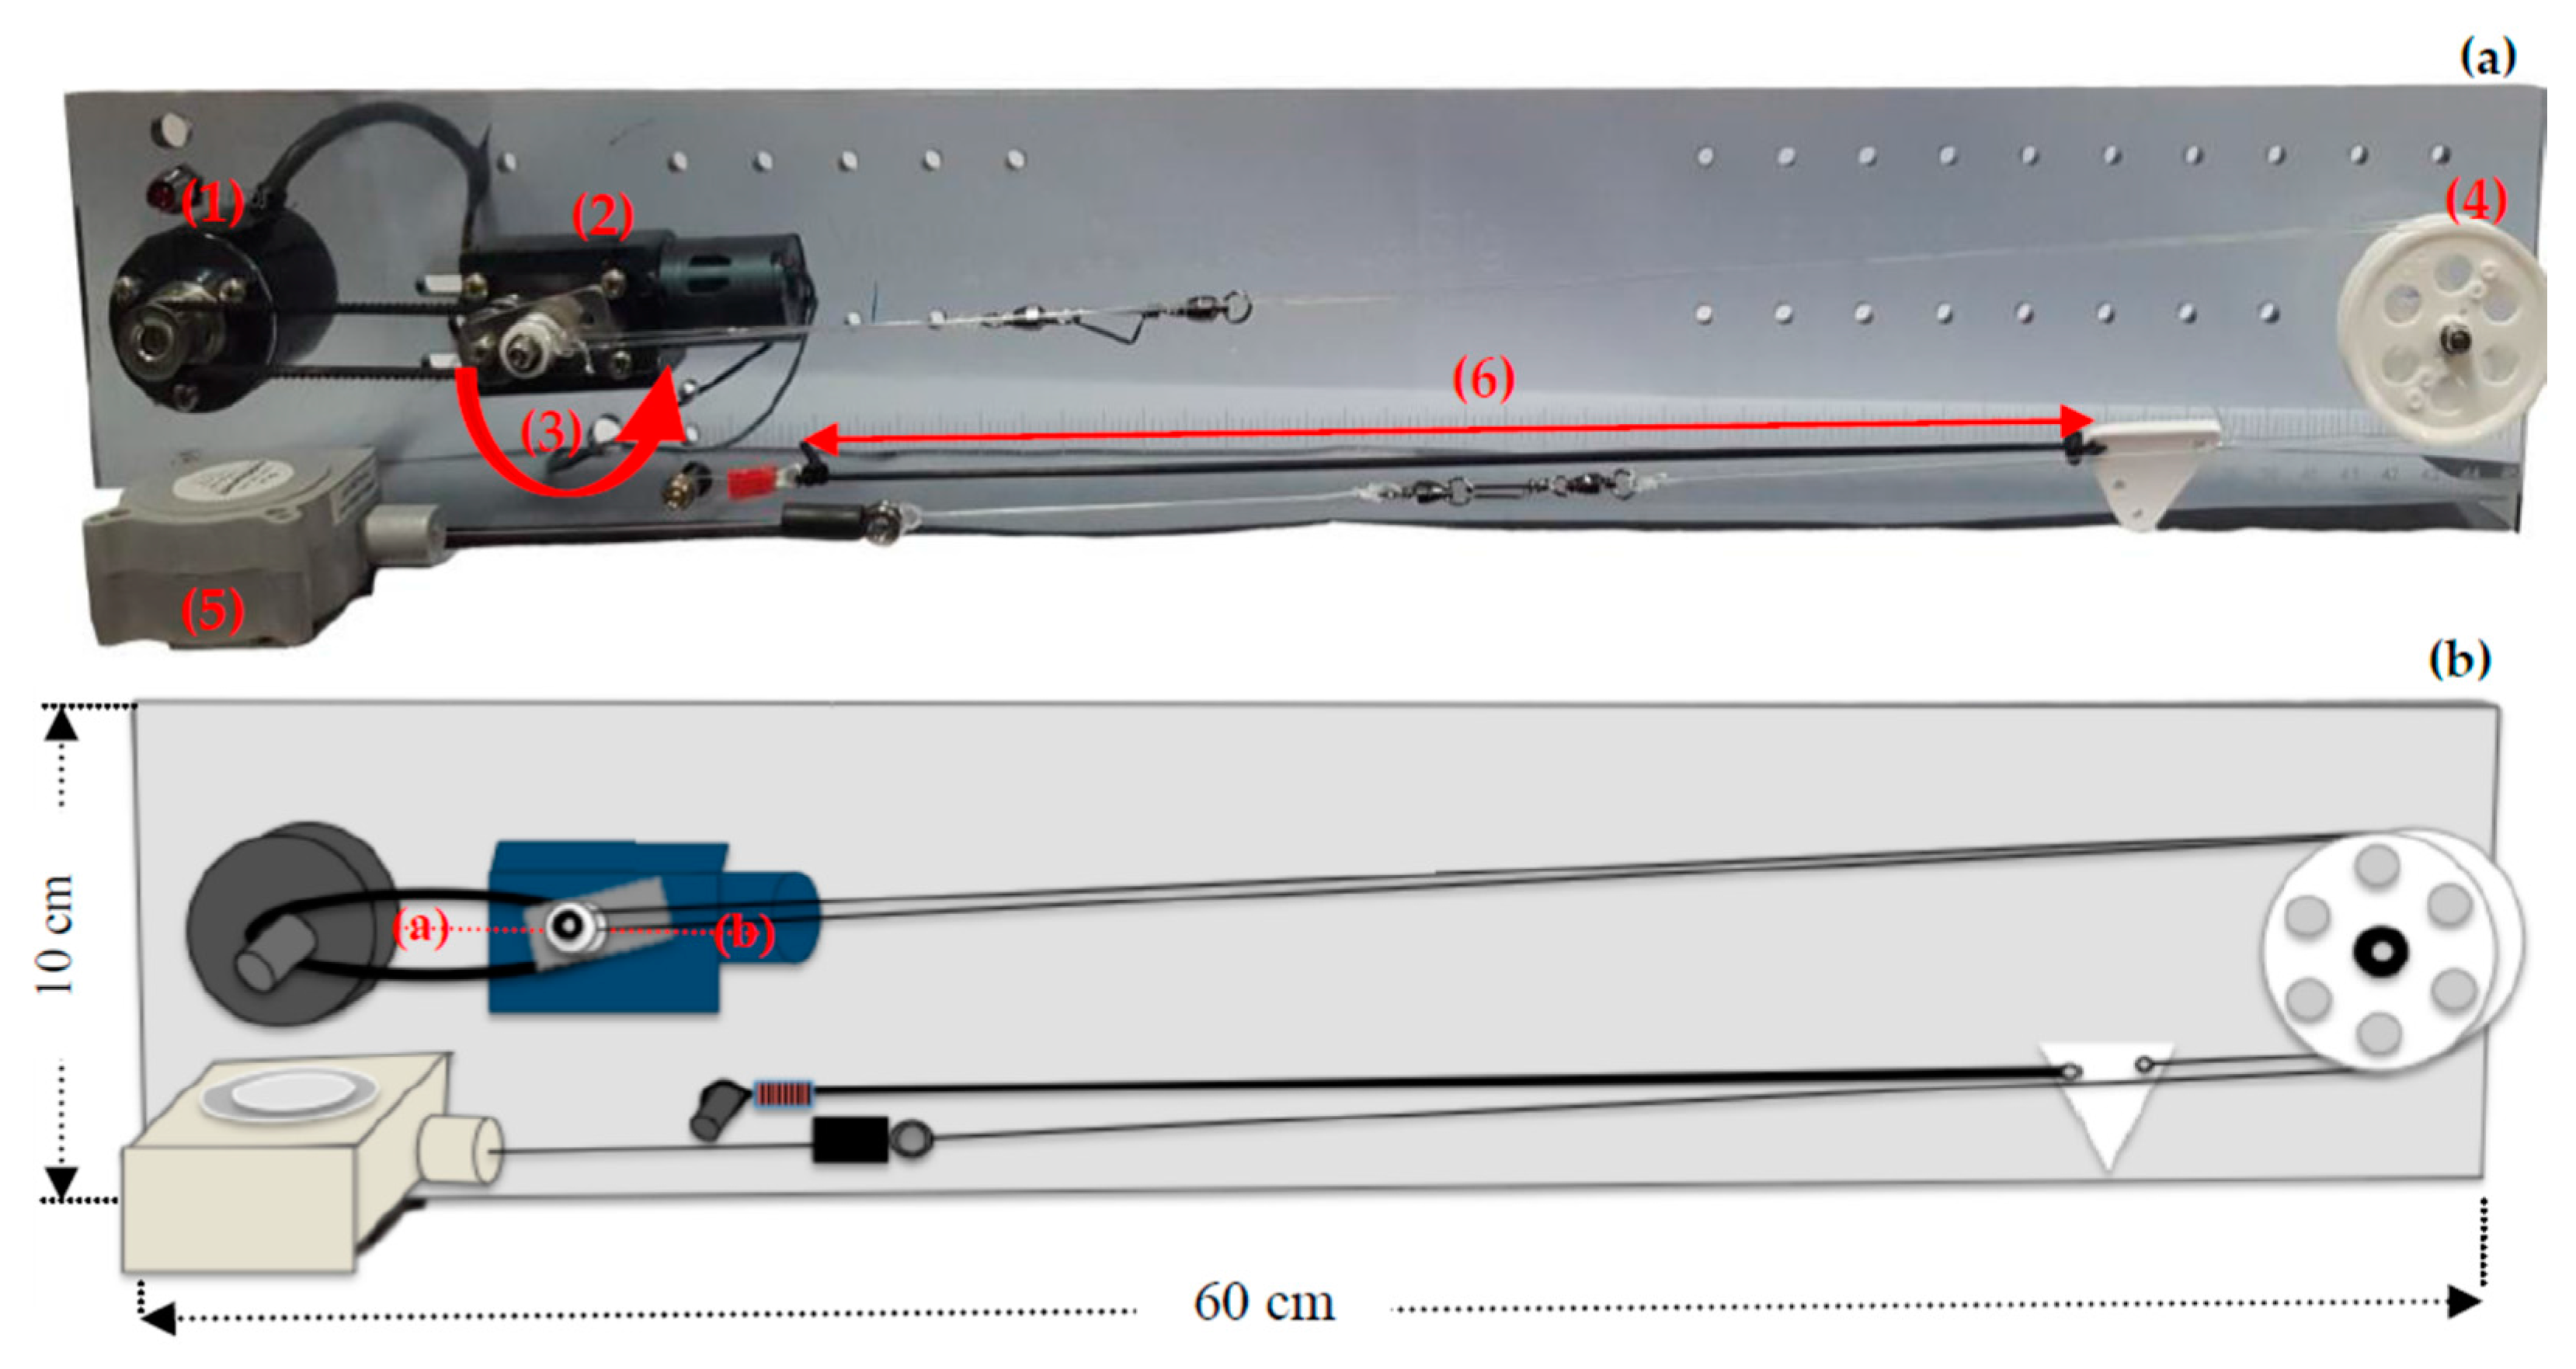
2.1. Expansion/Contraction Simulator Machine

In order to investigate the existence of possible nonlinear characteristics of the ERB sensor, a commercially available linear displacement sensor—a string potentiometer (SP)—was used as a comparison reference. To have a more informative comparison between the ERB and the SP, simultaneous expansion and contraction of both sensors were required over an extended period of time. Therefore, we developed a rig to enable simultaneous expansions/contractions of both sensors.
This rig was formed on a platform mounted with a DC gear motor (JGY-370-12 v-12 RPM, ASLONG, Shenzhen, China), rotary encoder (E6B2-CWZ6C, OMRON, Osaka, Japan), and string potentiometer (SP1-4, Celesco, Chatsworth, ON, Canada) with a full stroke range of 120 mm (Figure 1a). The rotary encoder and the motor were linked together to capture motor position by a 1:1 timing belt. A metal arm was attached to the shaft of the DC motor. Two pulleys were used to connect the metal arm to the SP and the ERB independently enabling a smooth periodic expansion/contraction (see Figure 1b). Using this system, the ERB and the SP sensors were expanded when the metal arm reached position (a) and the sensors were fully contracted when the metal arm reached position (b). Therefore, the rotary motion of the metal arm resulted in sinusoidal stretching pattern for both sensors. Of note, the use of two pulleys prevented both sensors affecting each other and enabled simultaneous but independent expansions/contractions of the two sensors.
The DC motor was powered by a DC power supply with a voltage of 10 V and the rotary encoder was powered using the 5 V output of the USB-X-Series NI USB-6343 (National Instruments, Austin, TX, USA), which also acquired the data. The ERB and the SP were polarized by a small DC current generated using a REF200 by TI [27]. The resultant voltages across the ERB and SP were amplified using two pairs of instrumentation and differential amplifiers (INA118 and OPA129) prior to acquisition.

2.2. Data Acquisition

Four ERBs, all with a length of 292 ± 0.5 mm were used for a comparison against the SP. For each of the four ERBs, the sensor was placed in the rig and pre-stretched 10 ± 0.5 mm to avoid any slack when fully contracted. The ERB and SP were stretched 28 ± 0.5 mm (13% of its resting length) when fully expanded by the motor, similar to the maximum stretch experienced when previously used for monitoring respiration [21,22].
The rig was operated continuously with an average speed of 8.77 rpm for each band over four-and-a-half days and was set to acquire an epoch of data once an hour. Therefore, 108 epochs of data were collected for each band. All data were acquired with a sampling rate of 20 kHz with an acquisition duration of 15 s, which guaranteed the capture of at least one full rotation of the motor. A much lower sampling rate would have been sufficient to acquire data from the ERBs and the SP but we required a high sampling rate as we intended to use the rotary encoder data to provide a precise interpolation of the sinusoidal expansion/contraction cycle. This interpolation was required to provide a ground truth for confirming the linearity of the reference sensor (SP) used in our quantification.

2.3. Data Analysis

To eliminate high frequency noise, we used a steep low-pass filter derived from modification of a filter which we had earlier implemented for post-processing of physiological signals [24]. Therefore, all acquired data underwent a 50th order software non-causal (zero phase lag) IIR low-pass filter (implemented using MATLAB) with a cutoff frequency of 10 Hz. Assuming the bands were linear and the rig was perfect, we would have expected a perfect sine wave as the output voltage of the ERB during a complete expansion/contraction (one full cycle of the motor). This is because when a mono frequency sinusoidal wave is applied to a linear system, a sinusoidal wave with the same frequency component appears as the output [28]. In contrast, inputting a mono frequency sinusoidal wave to a nonlinear system results in generation of a multi-frequency wave, which contains the fundamental frequency component of the input signal and an associated range of harmonics. The existence of harmonics at the output of a system with a mono frequency input may then be seen as representative of the system’s nonlinearity. Total harmonic distortion (THD) is widely used for quantification of the level of nonlinearity due to its sensitivity to the level of harmonics and nonlinear effects in electromechanical systems [28]. Therefore, we calculated the THD of each ERB recording to determine the similarity of the output voltage to a perfect sine wave and so to quantify the level of nonlinearity. However, as no rig could be perfect and instead could be expected to cause some systemic errors, we also calculated the THD of the SP recording to provide a comparative reference. The THD values were calculated using the known THD definition in which the root sum squared of the harmonics of a waveform is divided by its fundamental frequency.
Additionally, the signal-to-noise ratio (SNR) and the peak-to-peak voltage of the SP and the ERB data were also calculated and compared. To calculate the SNR, the maximum frequency component of each recording was considered as the signal and remaining frequency components were considered as noise. All data were normalized between 0 and 1 before calculating THD and SNR.

3. Results

A representative single low-pass filtered recording acquired from one ERB and the SP during a full cycle is shown in Figure 2. It is immediately clear that the ERB deviates substantially from the SP signal, with a nonlinearity clearly visible in the voltage recording of the ERB during contraction (Figure 2). Figure 3 demonstrates a comparison of normalized ERB and SP data. A clear difference exists in the shape of both recordings.

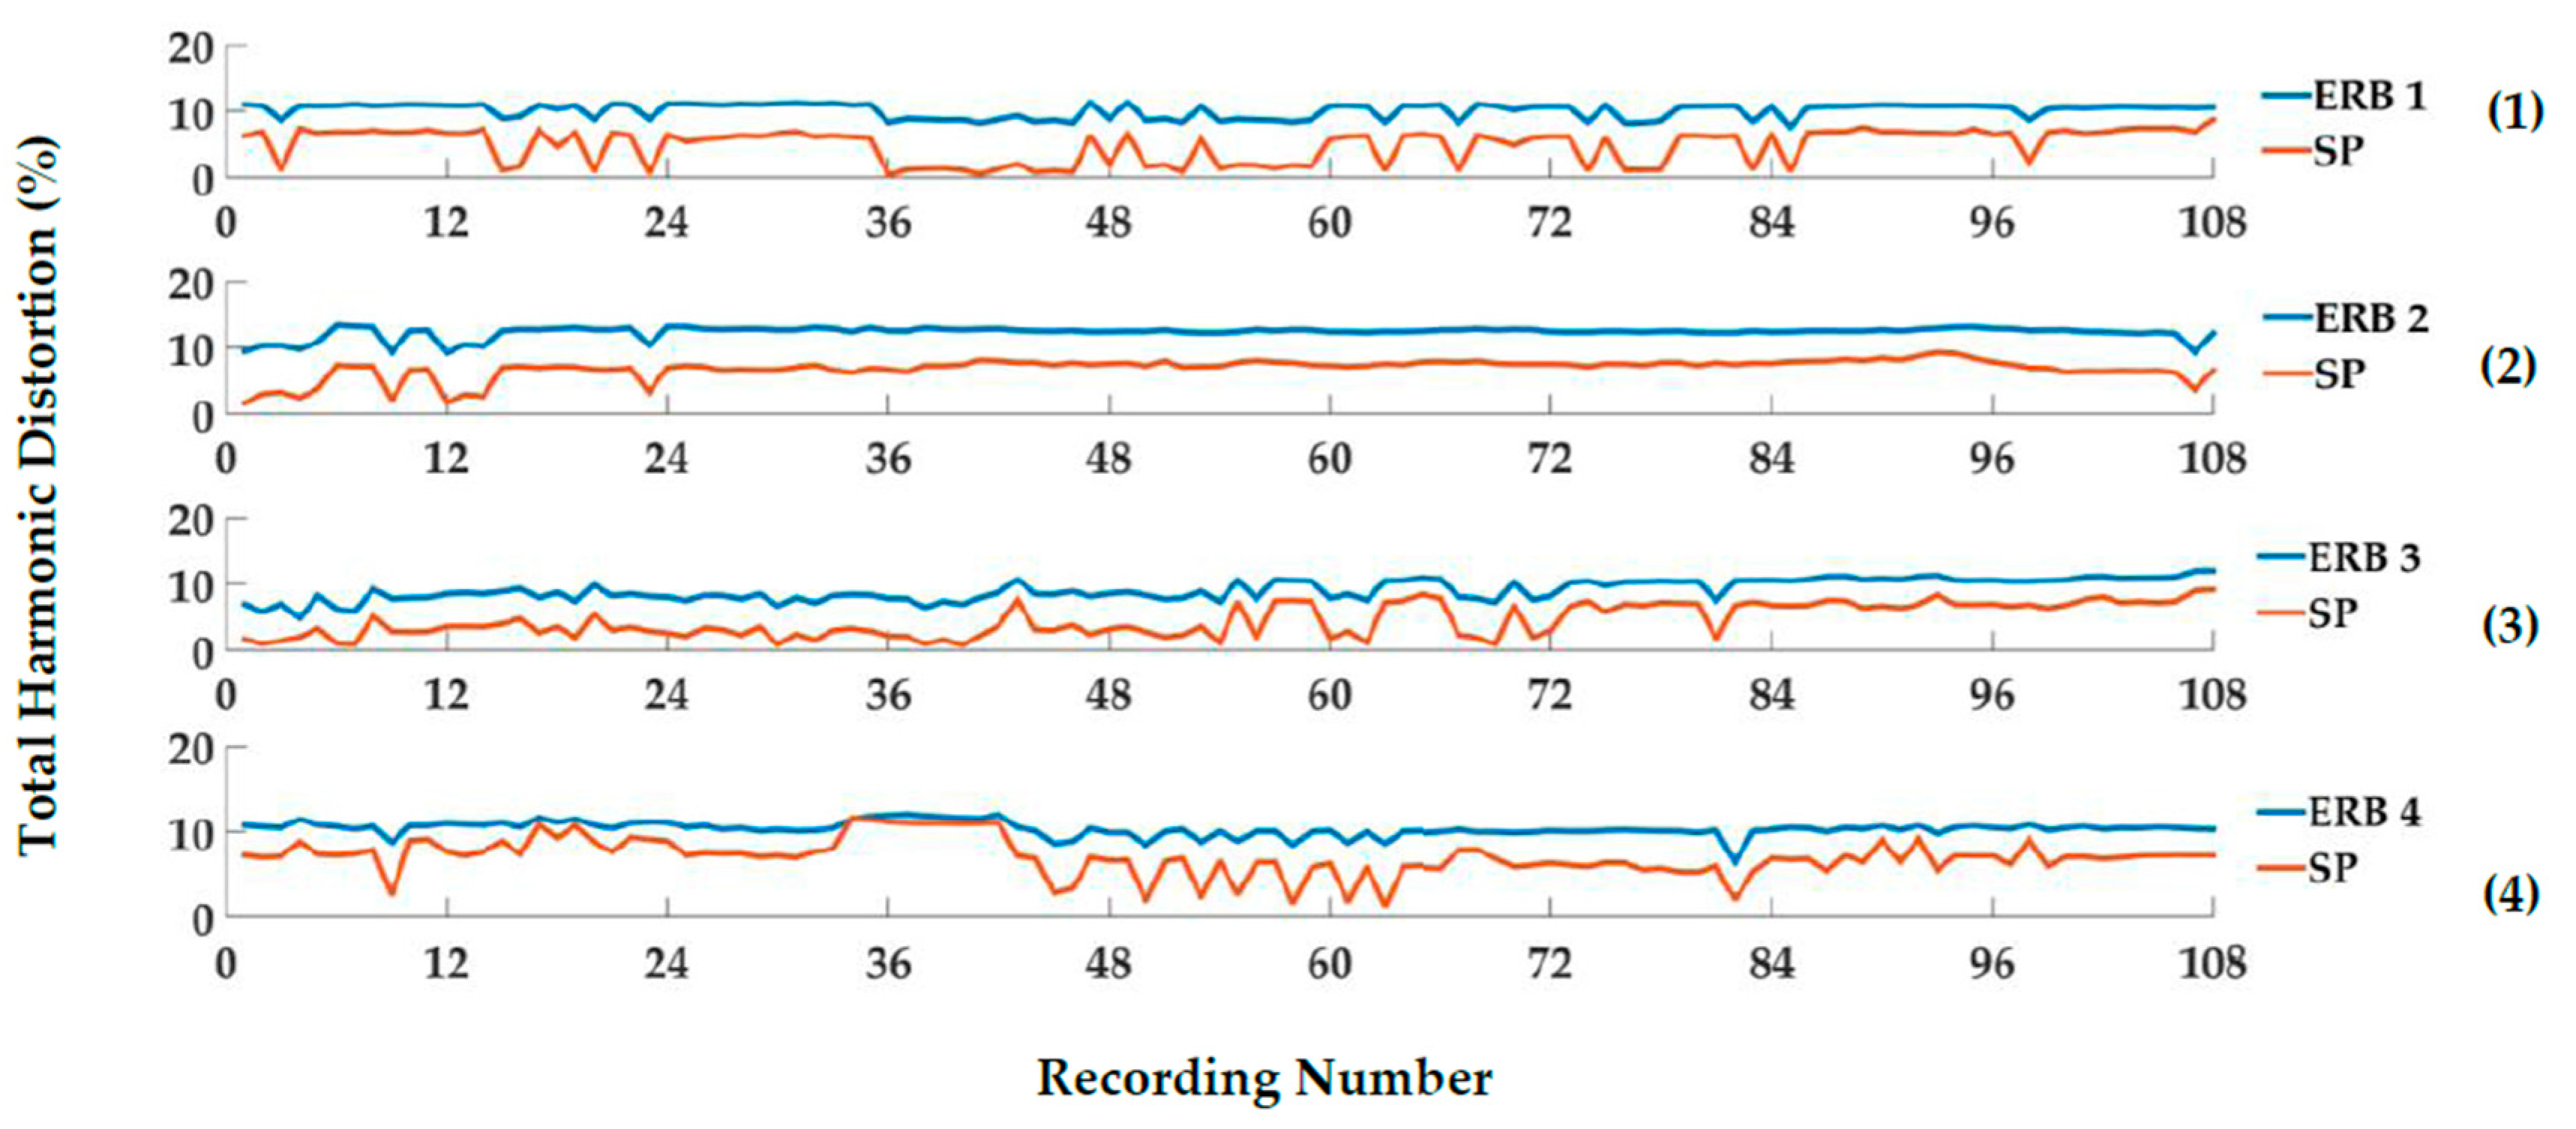
3.1. Total Harmonic Distortion (THD) Comparison

The ERB voltage signal (Figure 2) clearly demonstrates the ERB sensor nonlinearity. The THD of the band data and THD of the linear sensor (SP) during repeated simultaneous expansion/contraction are shown in Figure 4. As the bands and the SP are pulled simultaneously, artifacts occur during the rotation of the motor affect both sensors. While a THD of both sensors follow a similar trend, higher THD values are observed for the ERBs compared with those of the SP. The difference in THD values may be expected due to additional distortion during ERB contraction.
Table 1 summarizes the THD comparison between the ERBs and the SP. The nonzero values of the SP signals indicate that the rig does not produce a perfect sinusoidal cycle. This emphasizes that the nonlinearity of ERBs can result in more than a 50% increase in the THD calculated over four-and-a-half days recording.

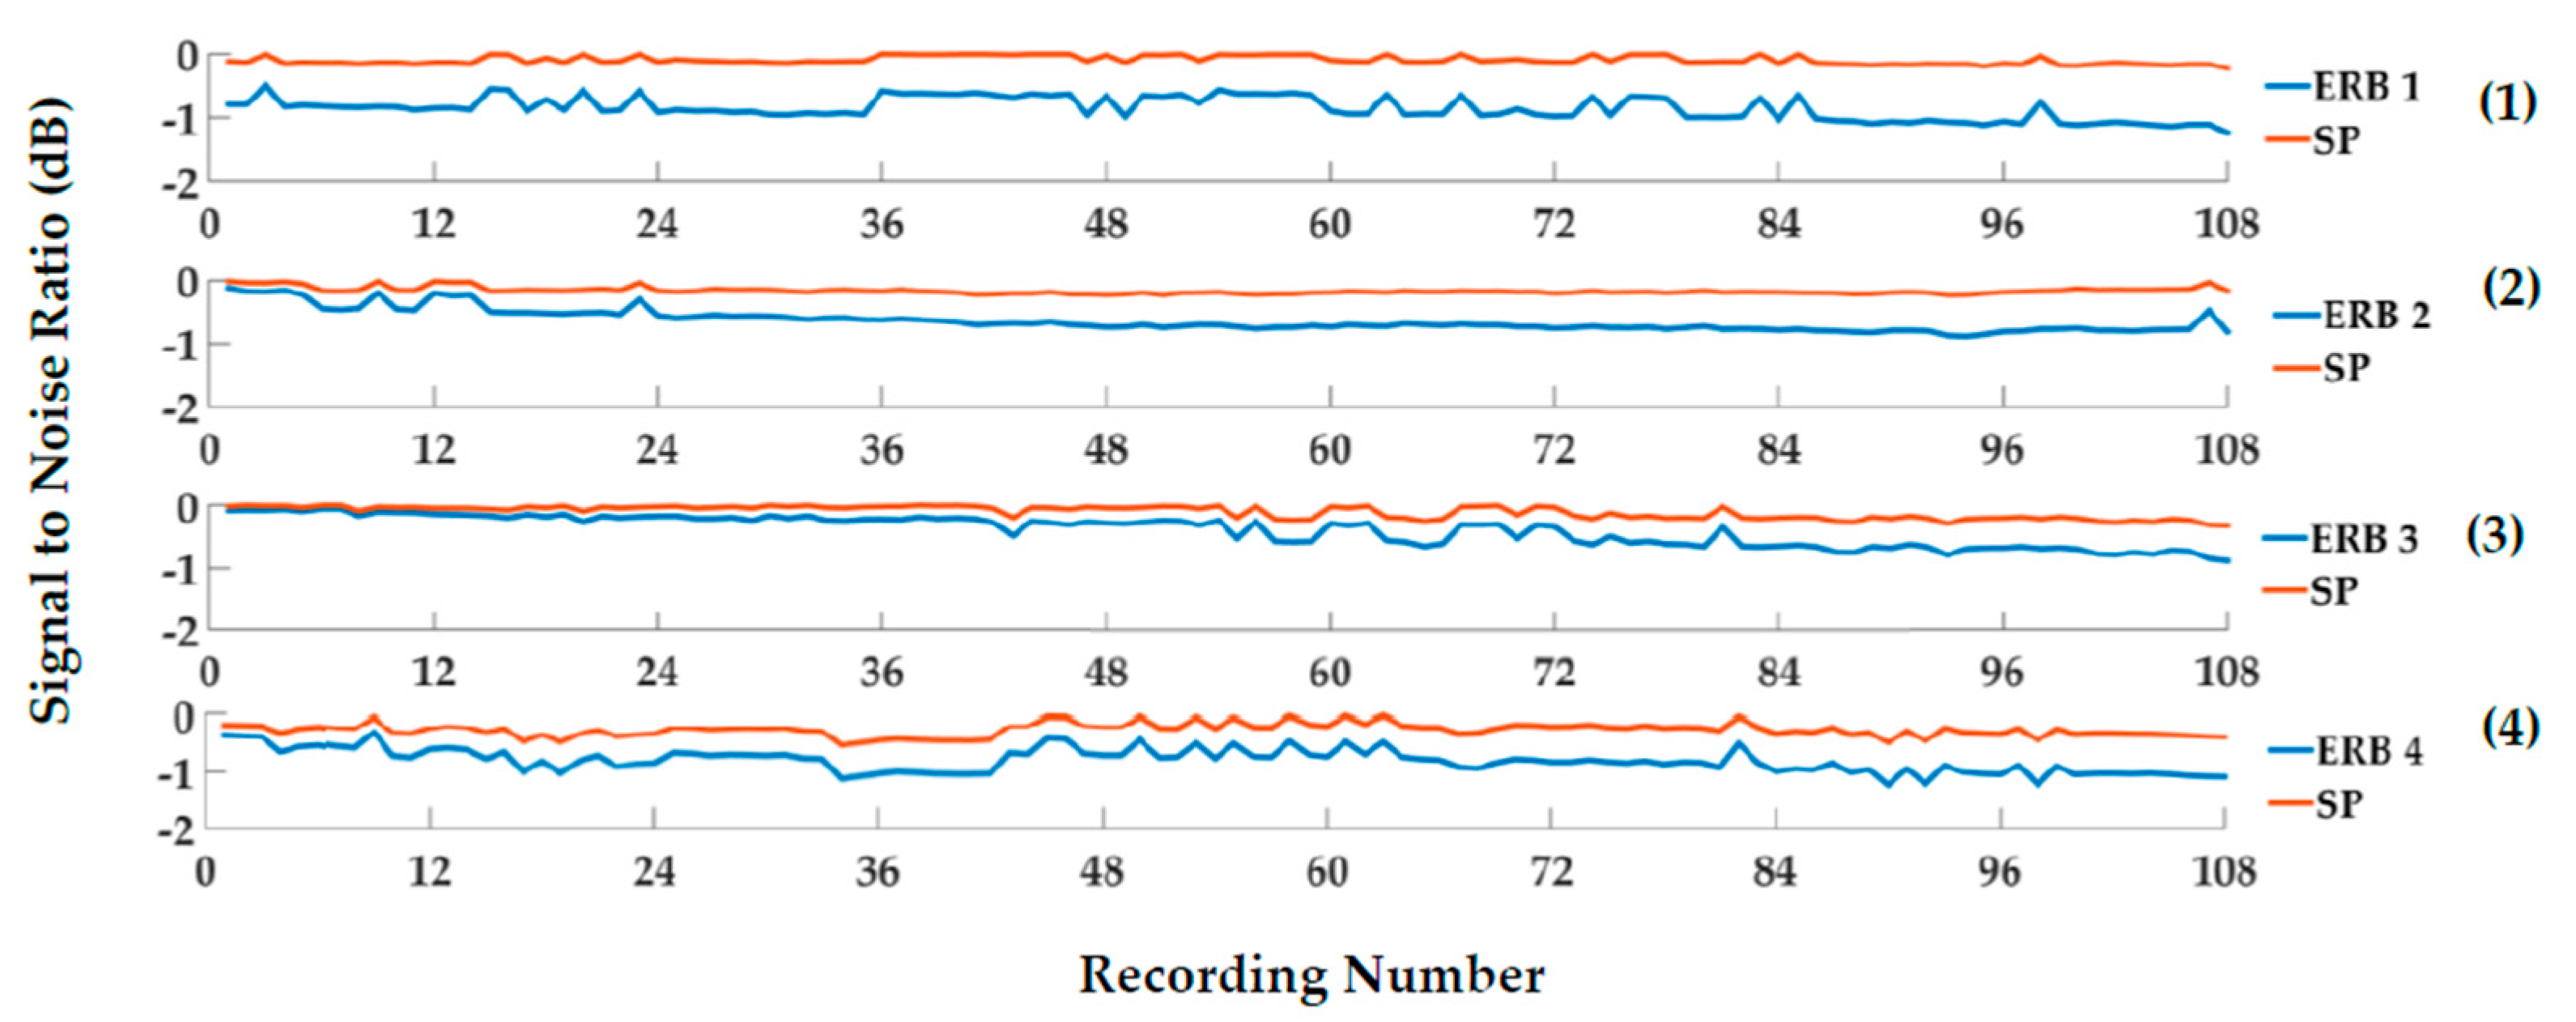
3.2. Signal-to-Noise Ratio Comparison

The signal to noise ratio of all ERBs and the SP are calculated and compared (Figure 5). Similar to the visual correlation seen in the trend of the THD of the two sensors, SNR trends of the bands and the SP are quite similar. As expected, the SNR values of the SP are higher than those of the ERBs, confirming that the ERBs are further affected by additional noise/artifact due to the intrinsic nonlinear behavior of the bands.
A summary of SNR values of the two sensors is provided in Table 2, showing that the mean SNR of the ERBs are from 0.25 dB (Experiment 3) to 0.63 dB (Experiment 1) lower than the SNR values of the SP (in the same experiment). The difference in the SNR values of the two sensors further demonstrates the need for compensation of ERB’s nonlinear behavior, as this would lead to a considerable increase in SNR and ultimately, enabling a more accurate measurement with the ERBs.

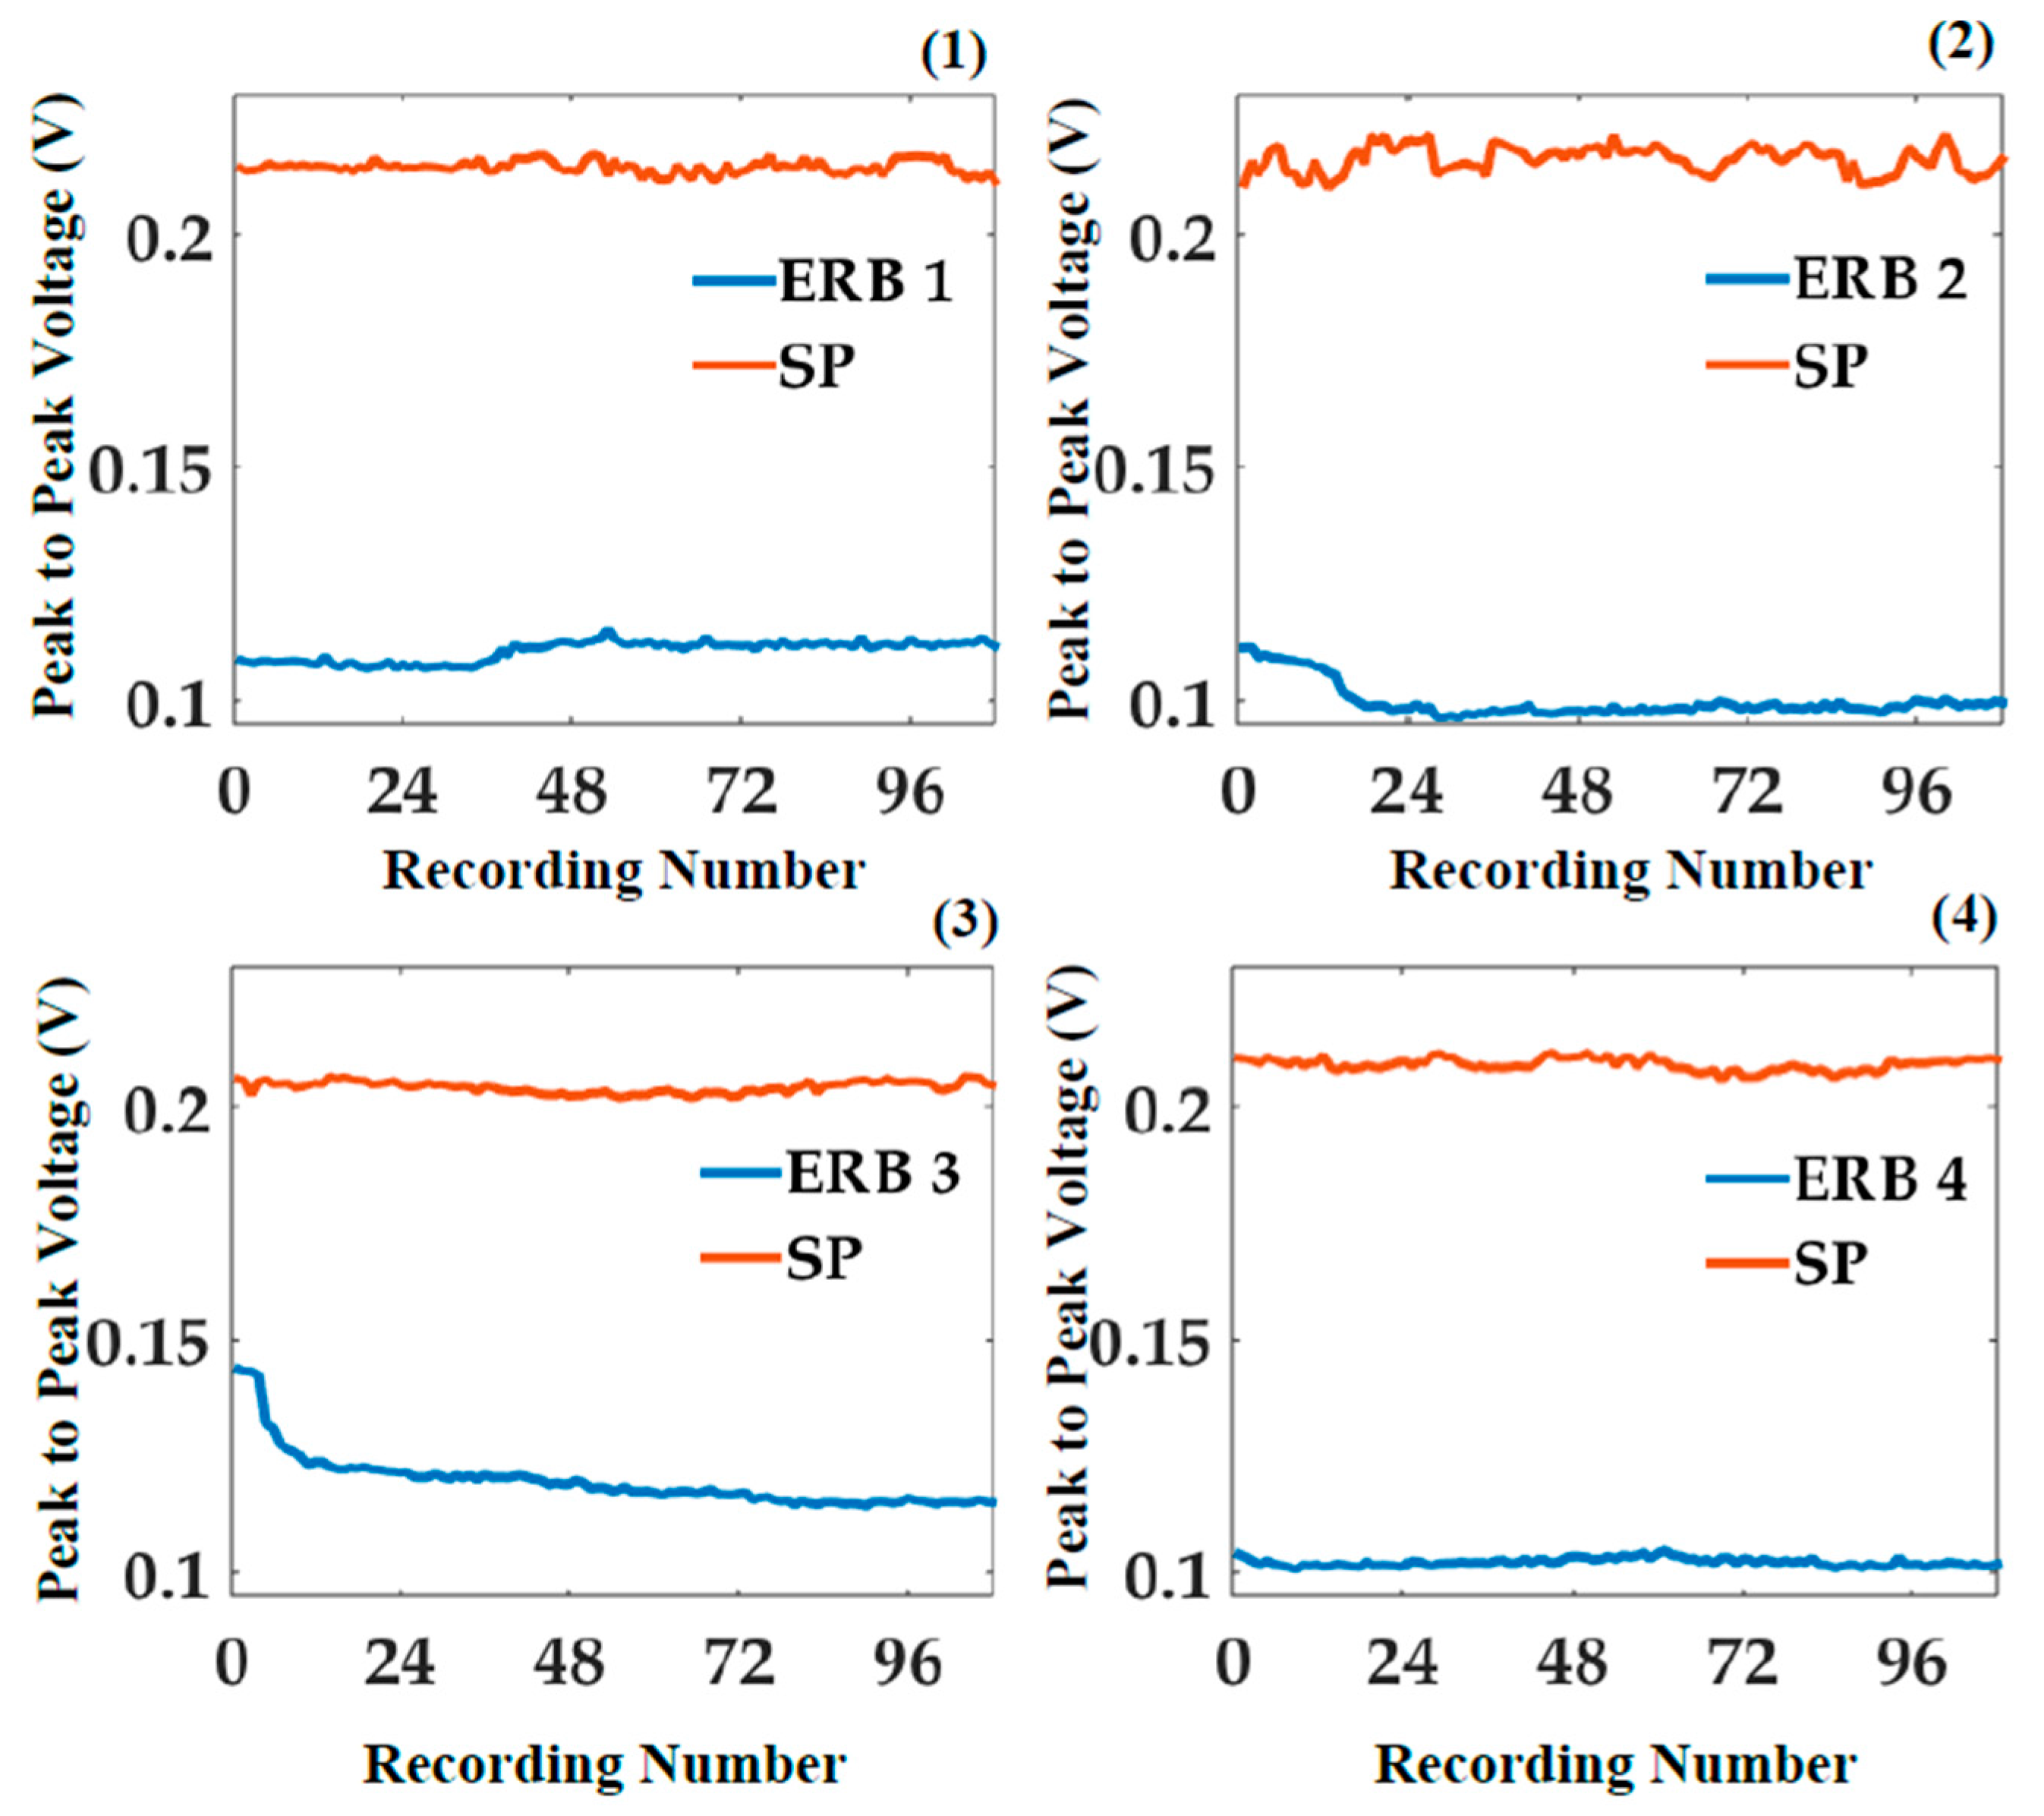
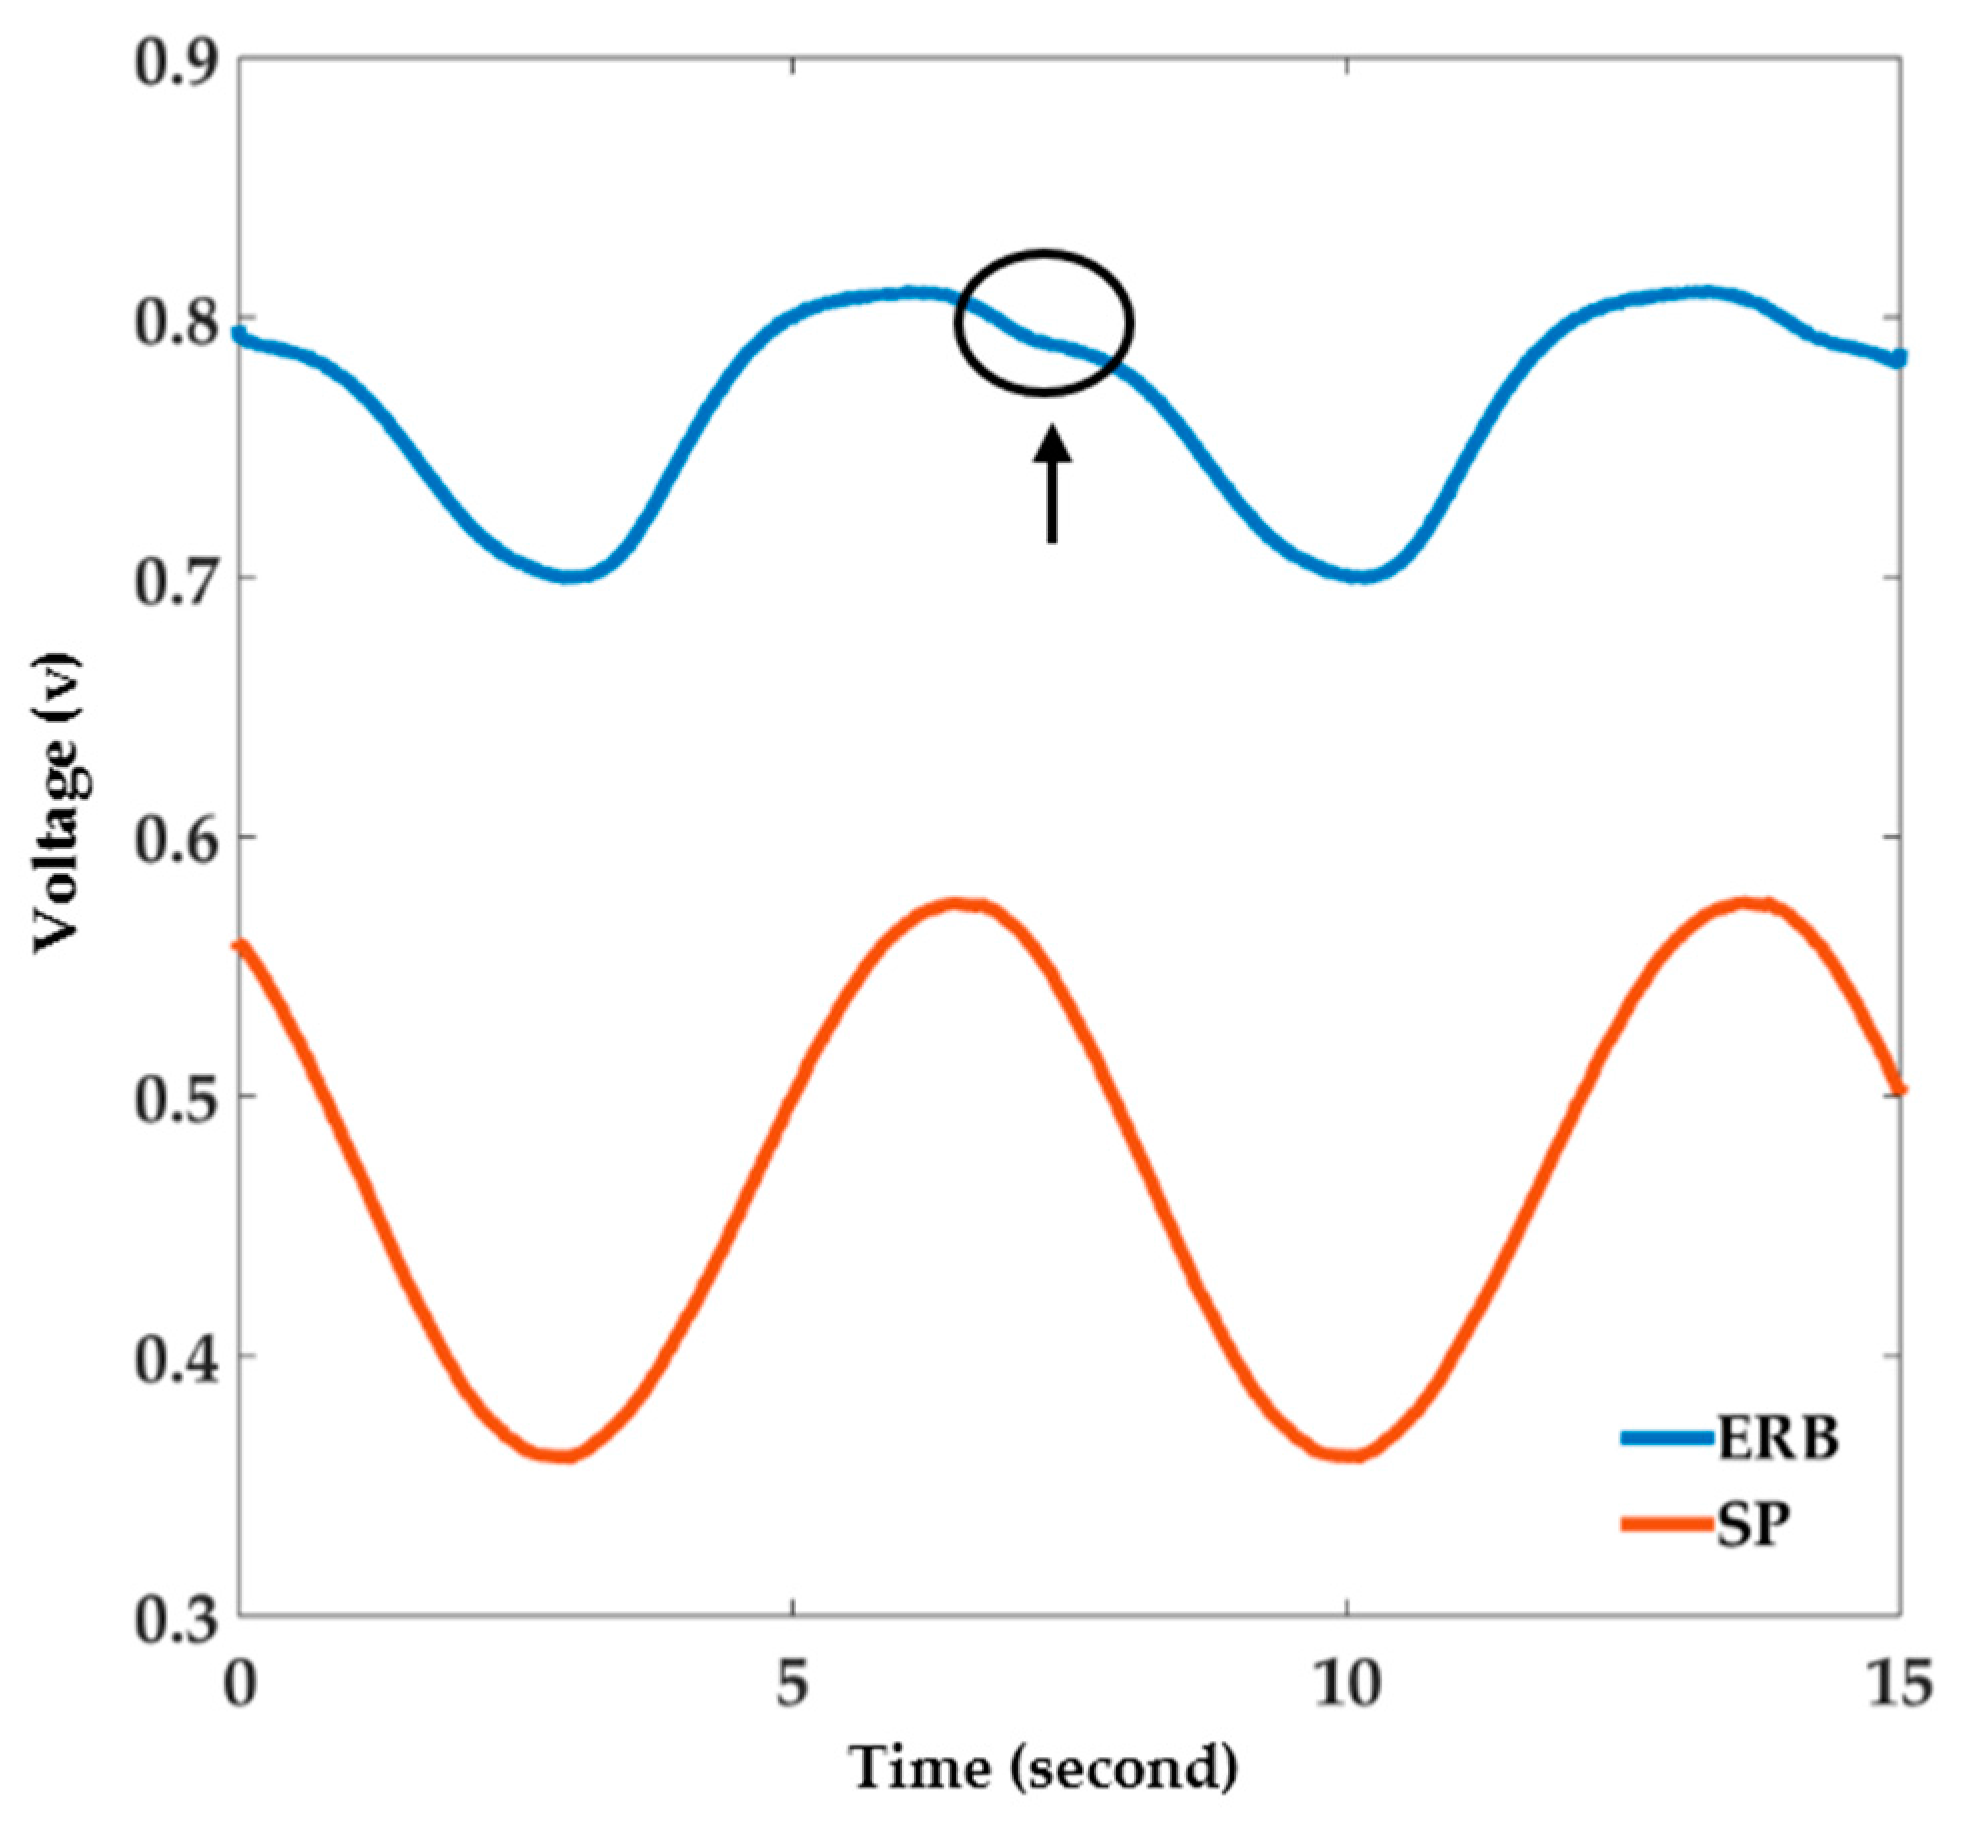
3.3. Peak-to-Peak Comparison

The peak-to-peak voltage of all ERBs and the SP for all recordings are shown in Figure 6. While the SP data remained roughly constant during the whole recording for all experiments, a small drift was found in the peak-to-peak voltage of each ERB. The initial drift in the ERB peak-to-peak voltage is small and it disappears after about 40 h.

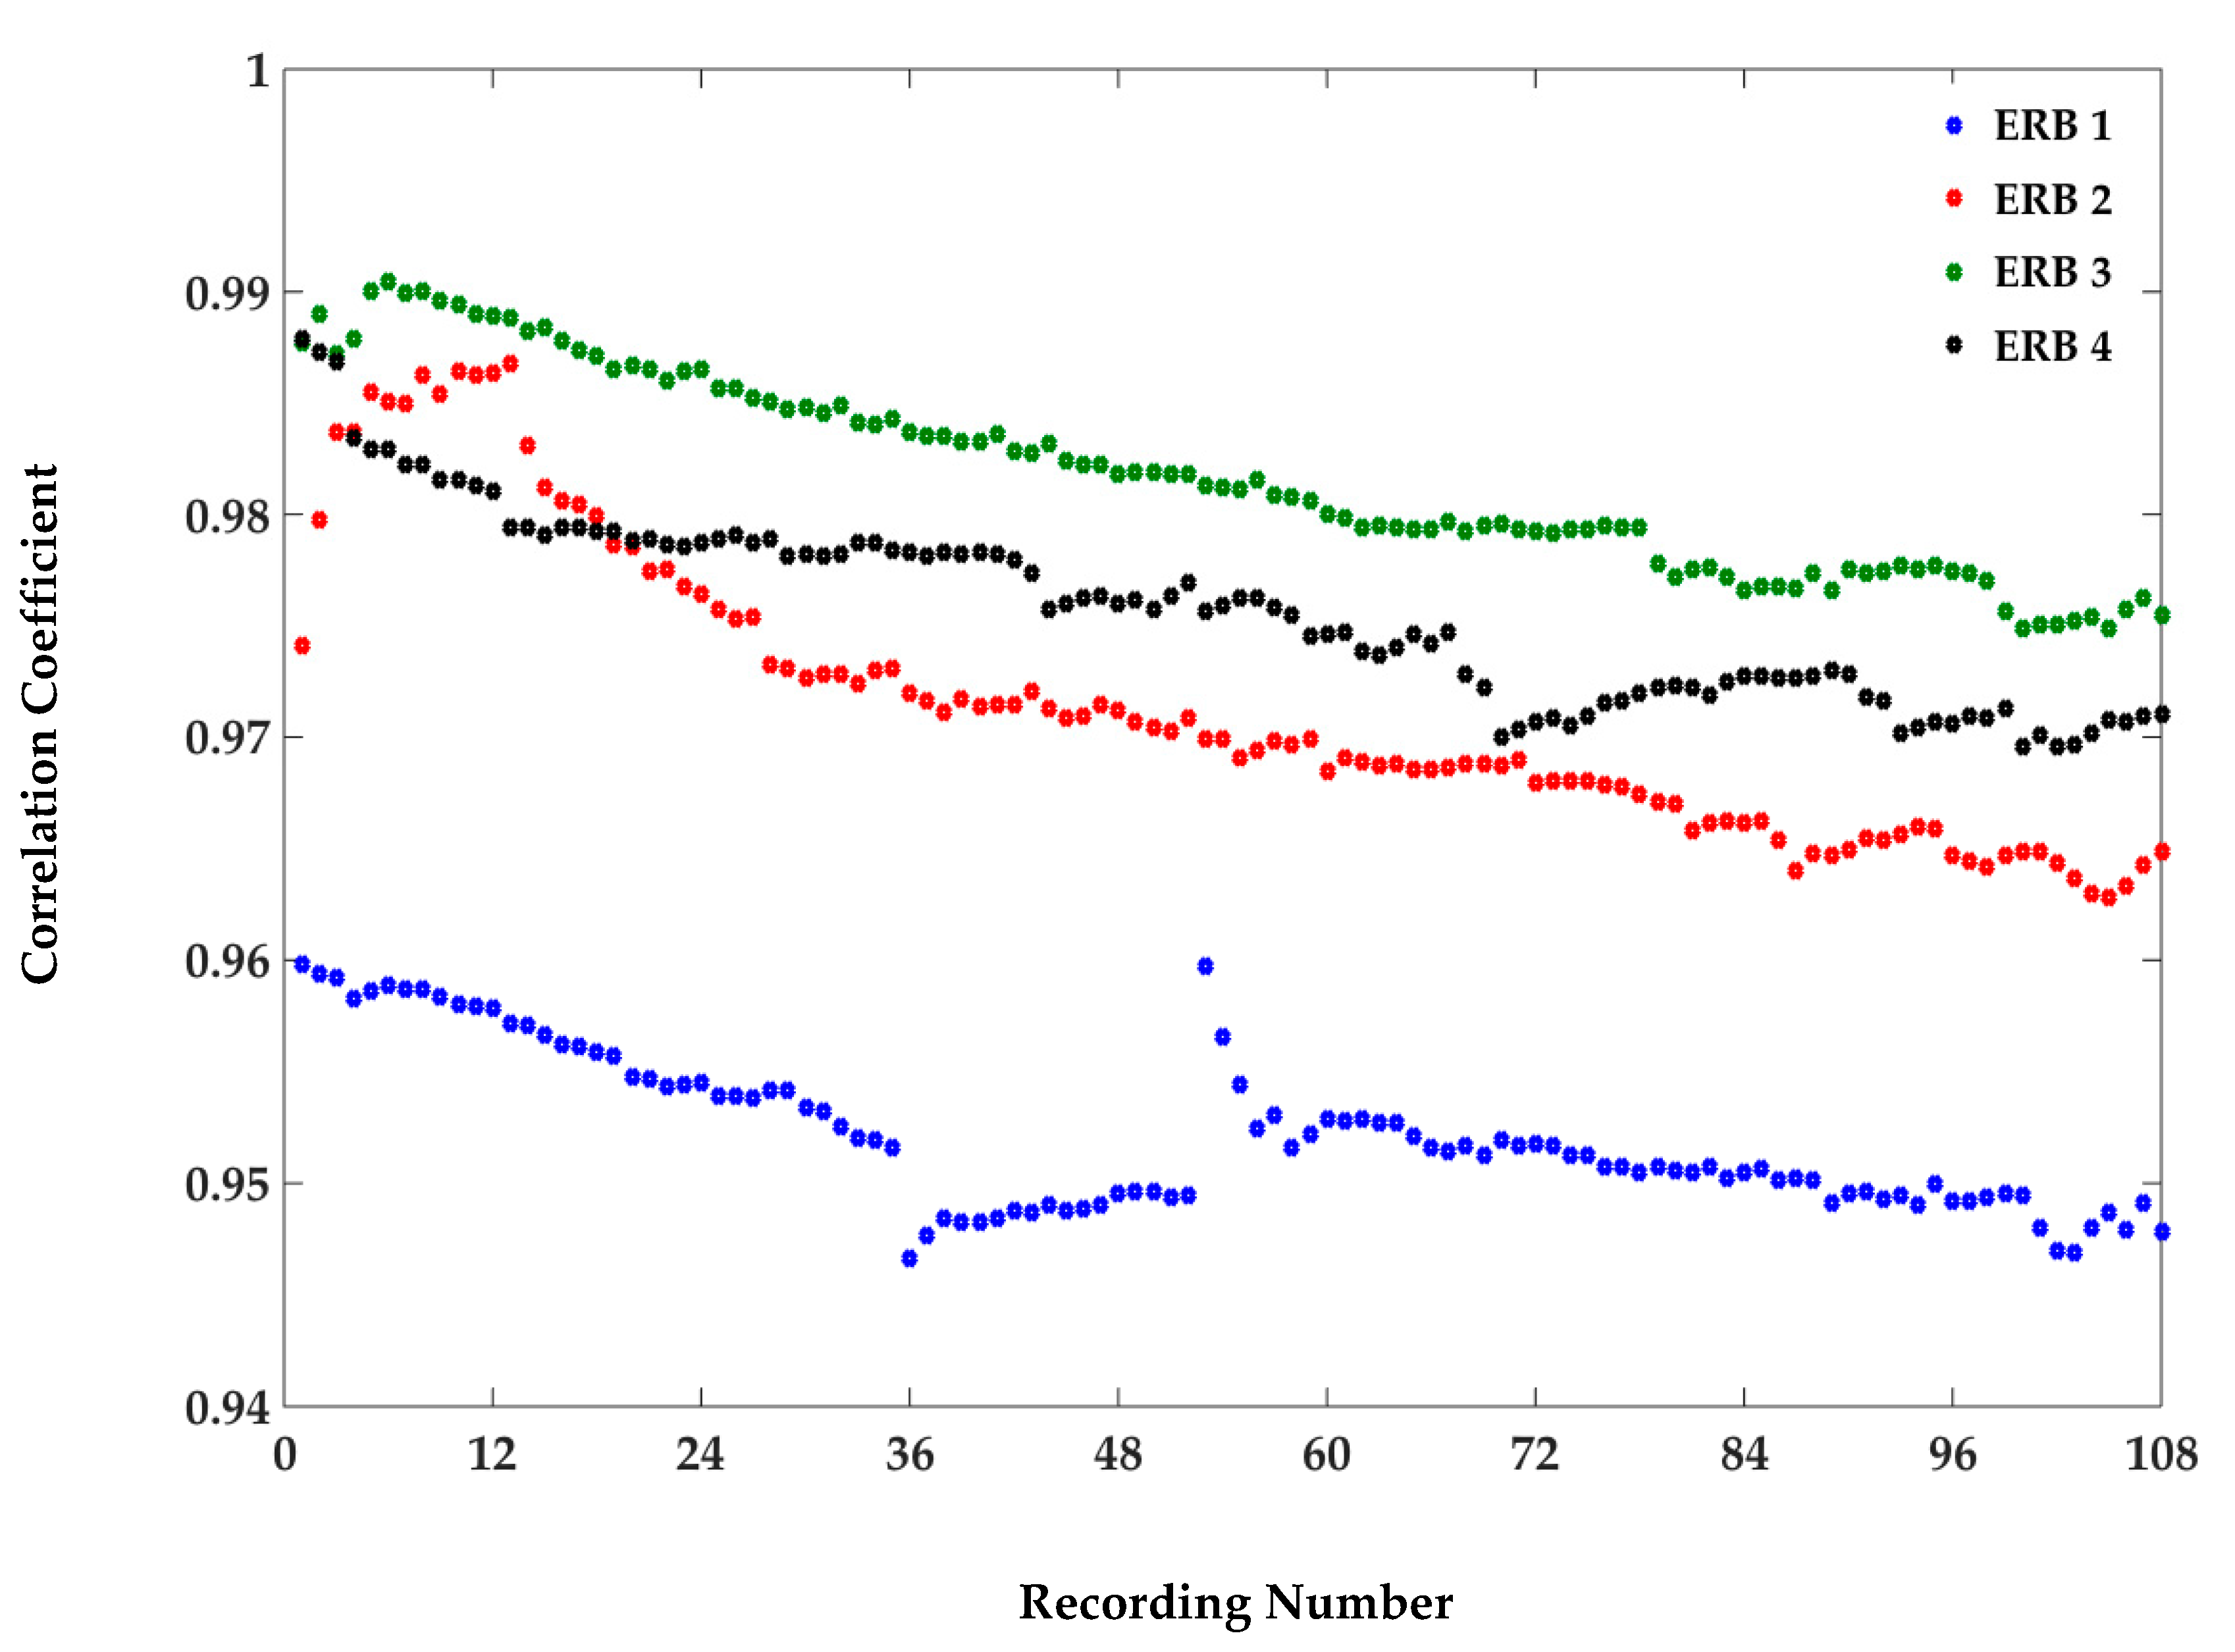
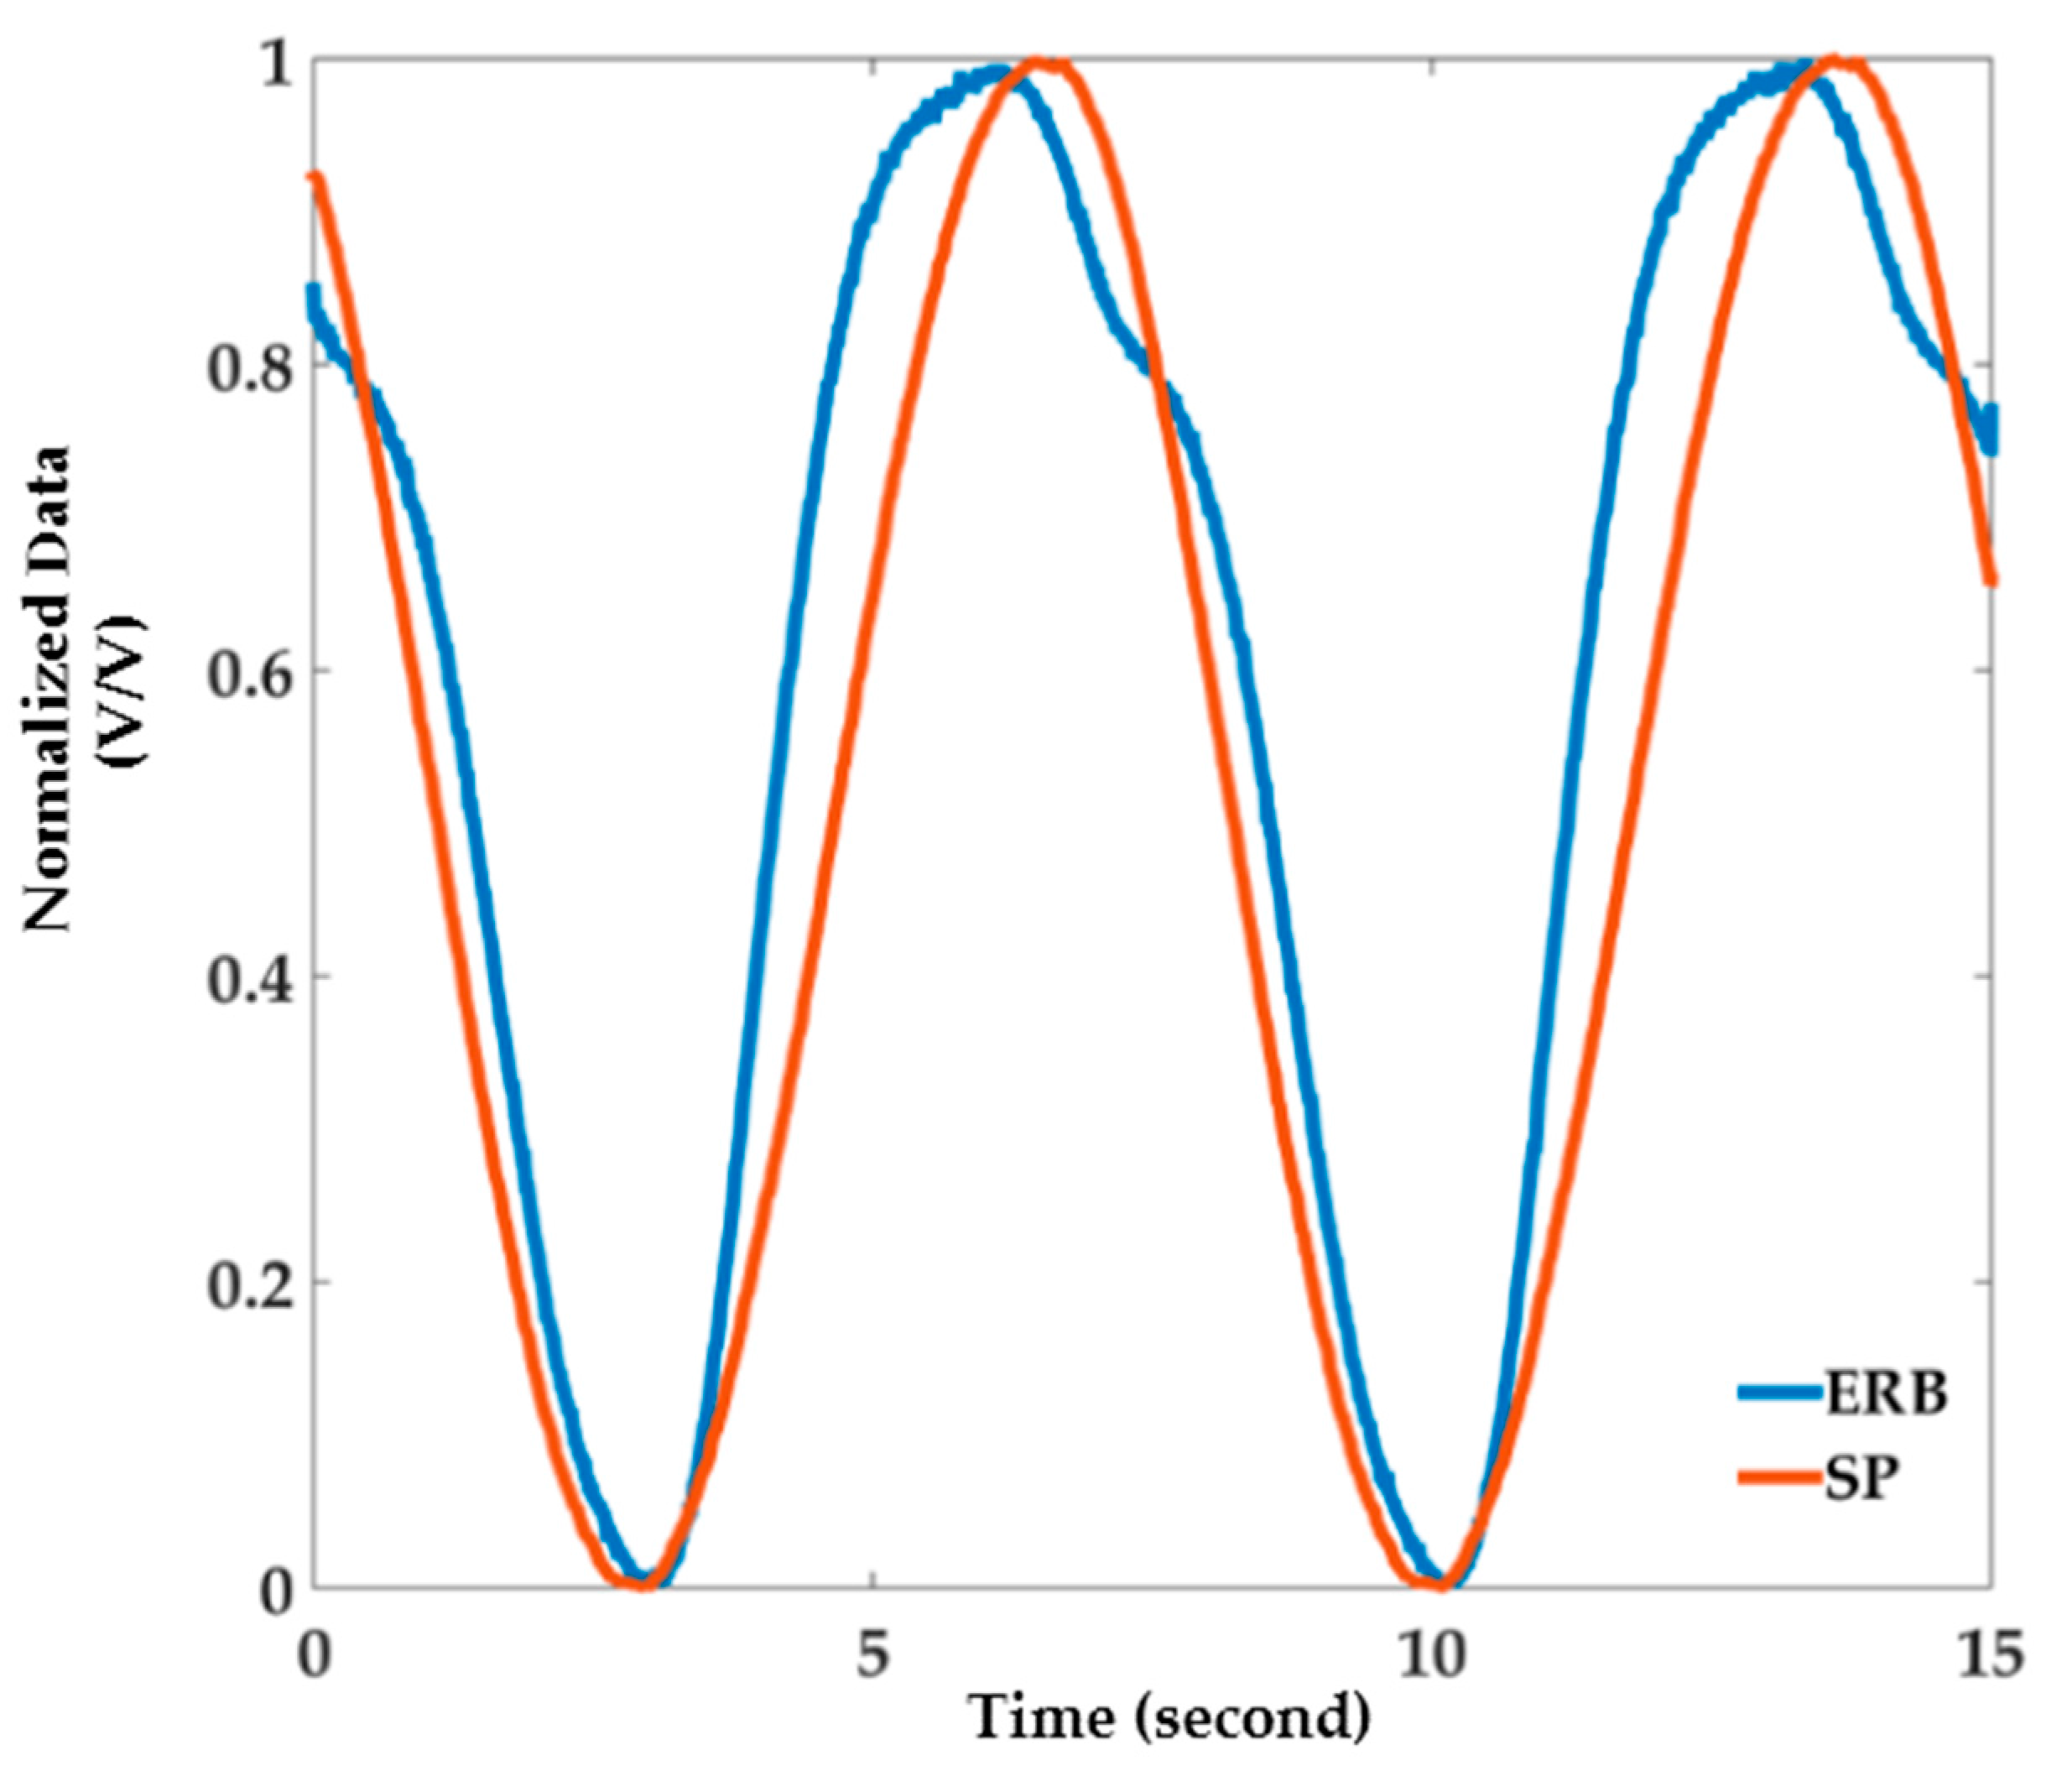
3.4. Correlation Coefficient

The band data and the SP data were correlated to quantify the overall similarity of the band’s behavior to a linear sensor’s (SP’s) behavior. The mean correlation value calculated for the four bands ranged from 0.95 (Band 1) to 0.98 (Band 3), and the overall average value of correlation coefficient for all recordings was found to be 0.97 showing strong similarity between the two sensors. Moreover, the variation of the correlation between the ERB and the SP data was investigated over time (Figure 7). For each band, the correlation coefficient was calculated between the recorded band data and the SP data. Since 108 epochs of data were recorded for each band, 108 correlation coefficient values were calculated for each band during its continuous simultaneous expansion/contraction over the course of four-and-a-half days. As seen in Figure 7, a drift tendency was also found for correlation of the ERB and the SP data over time. The observed drift may refer to the deterioration of the ERB sensors over time.

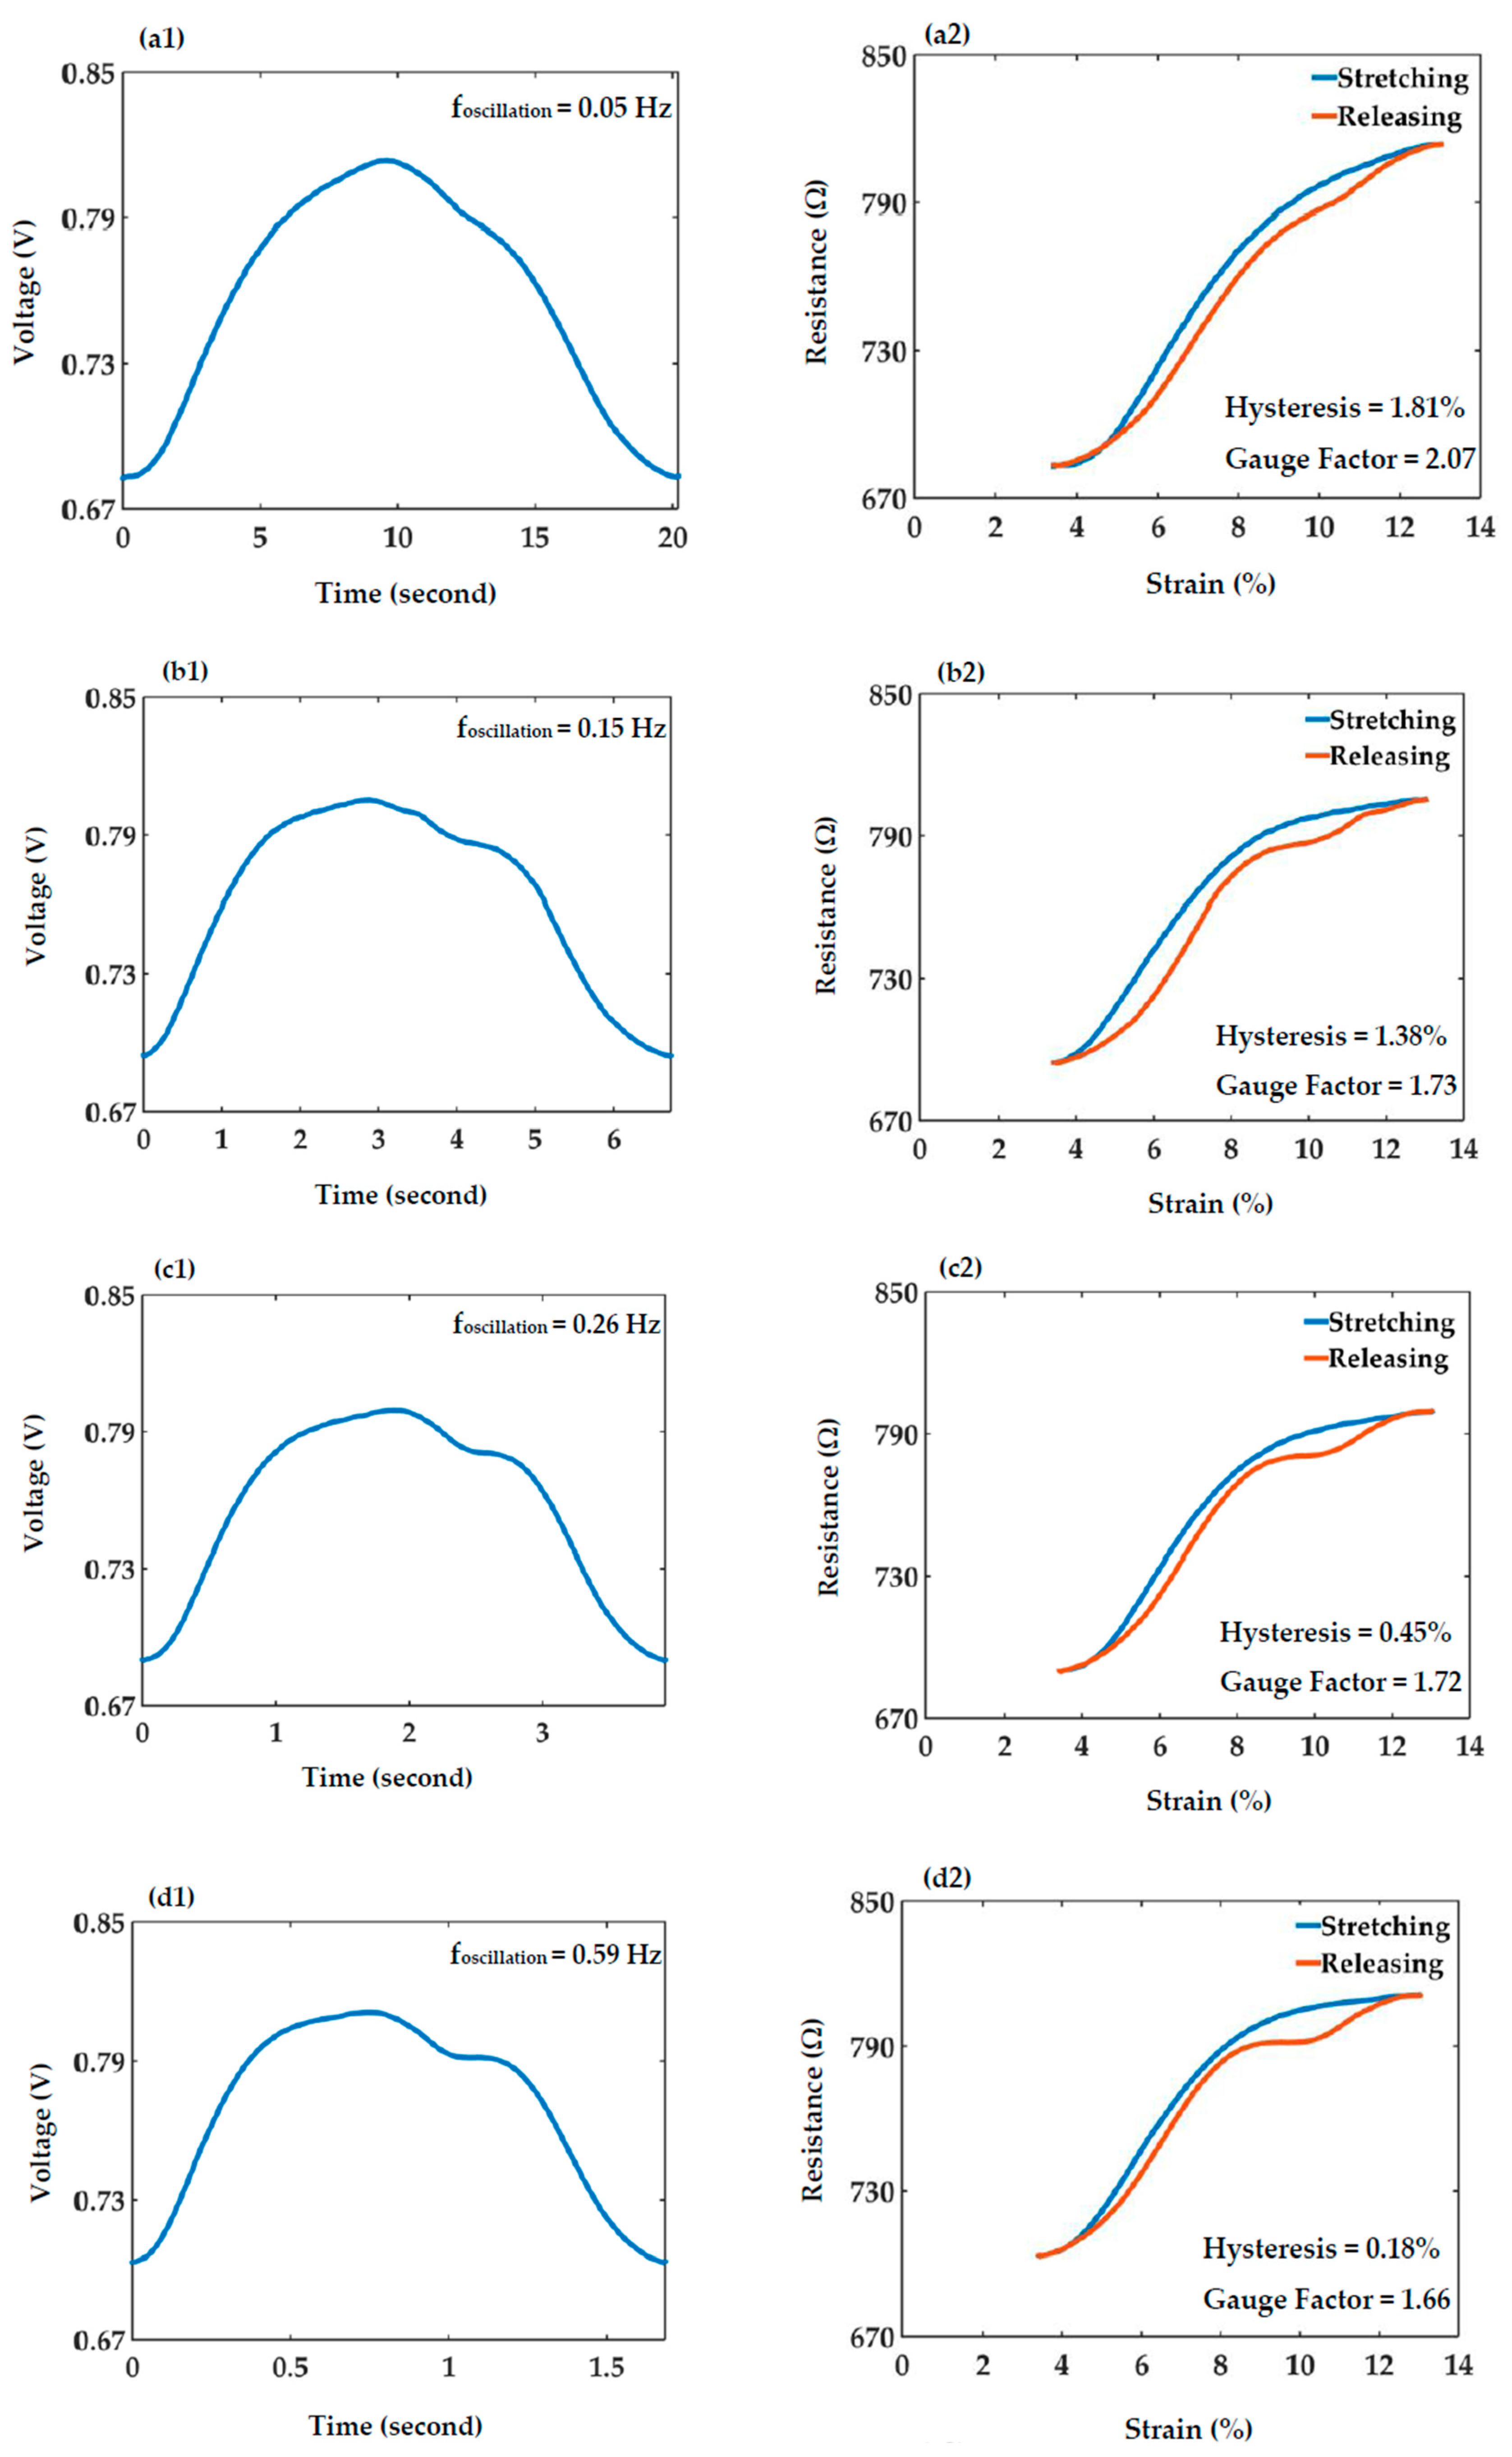
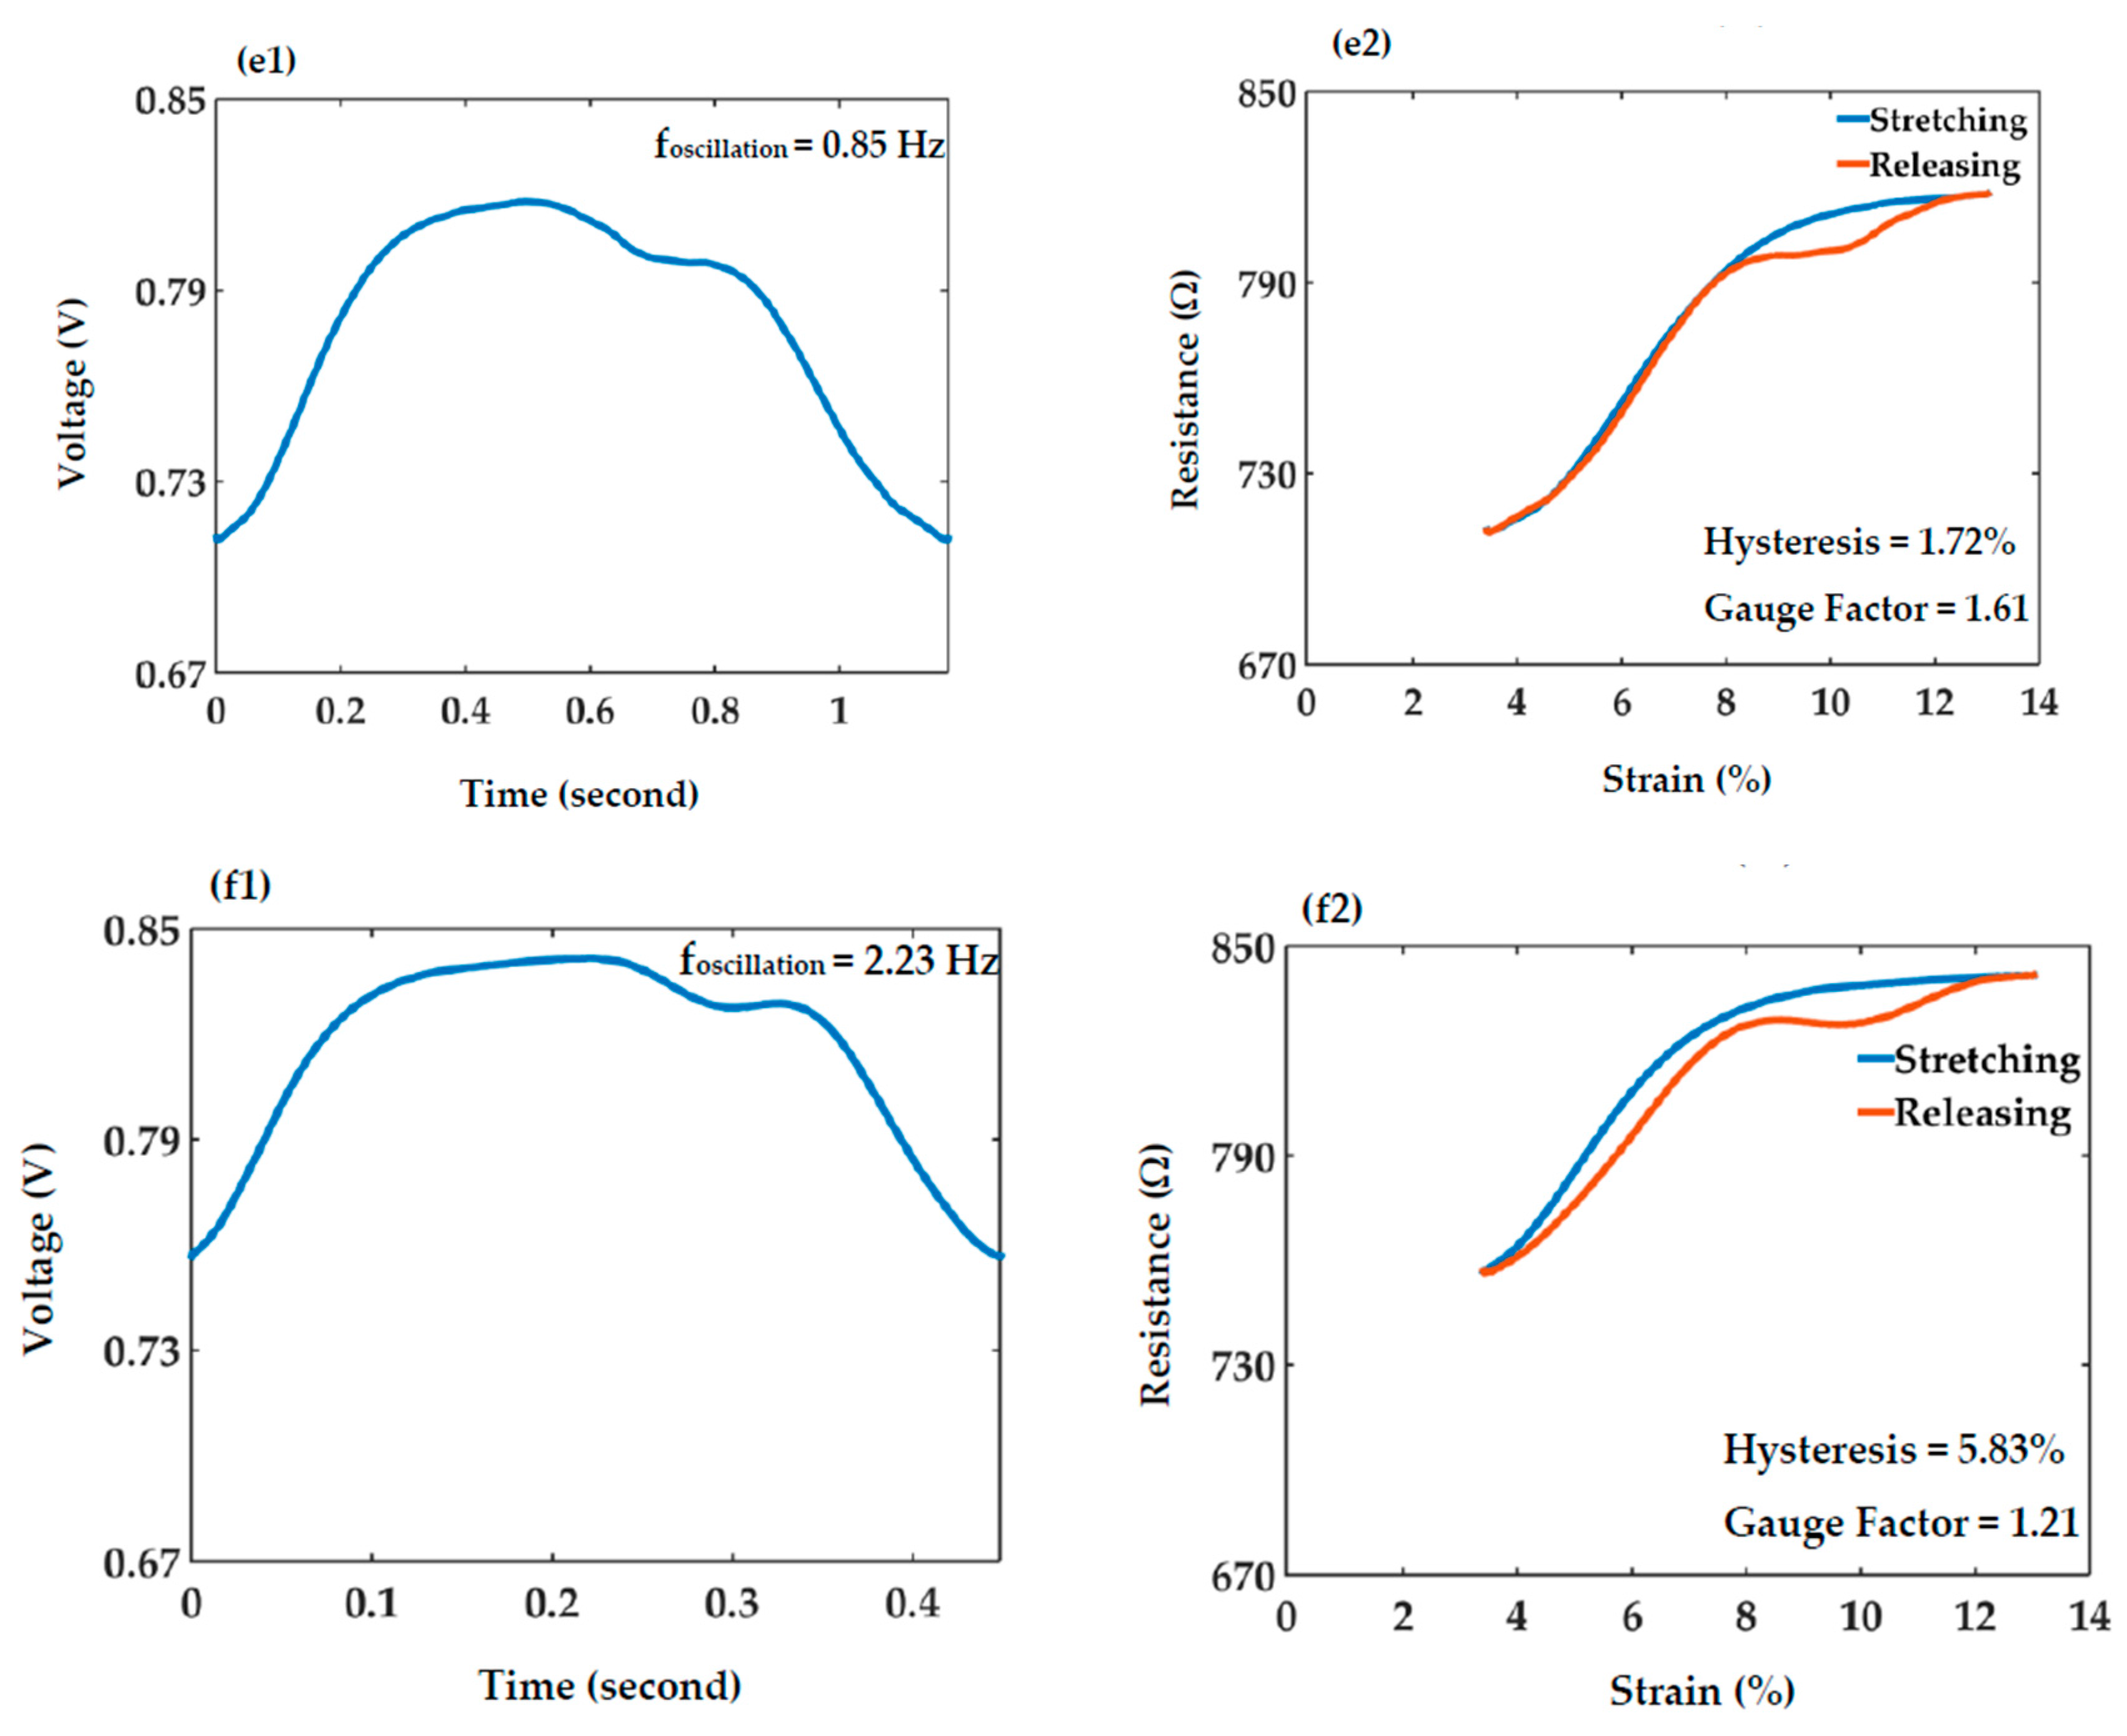
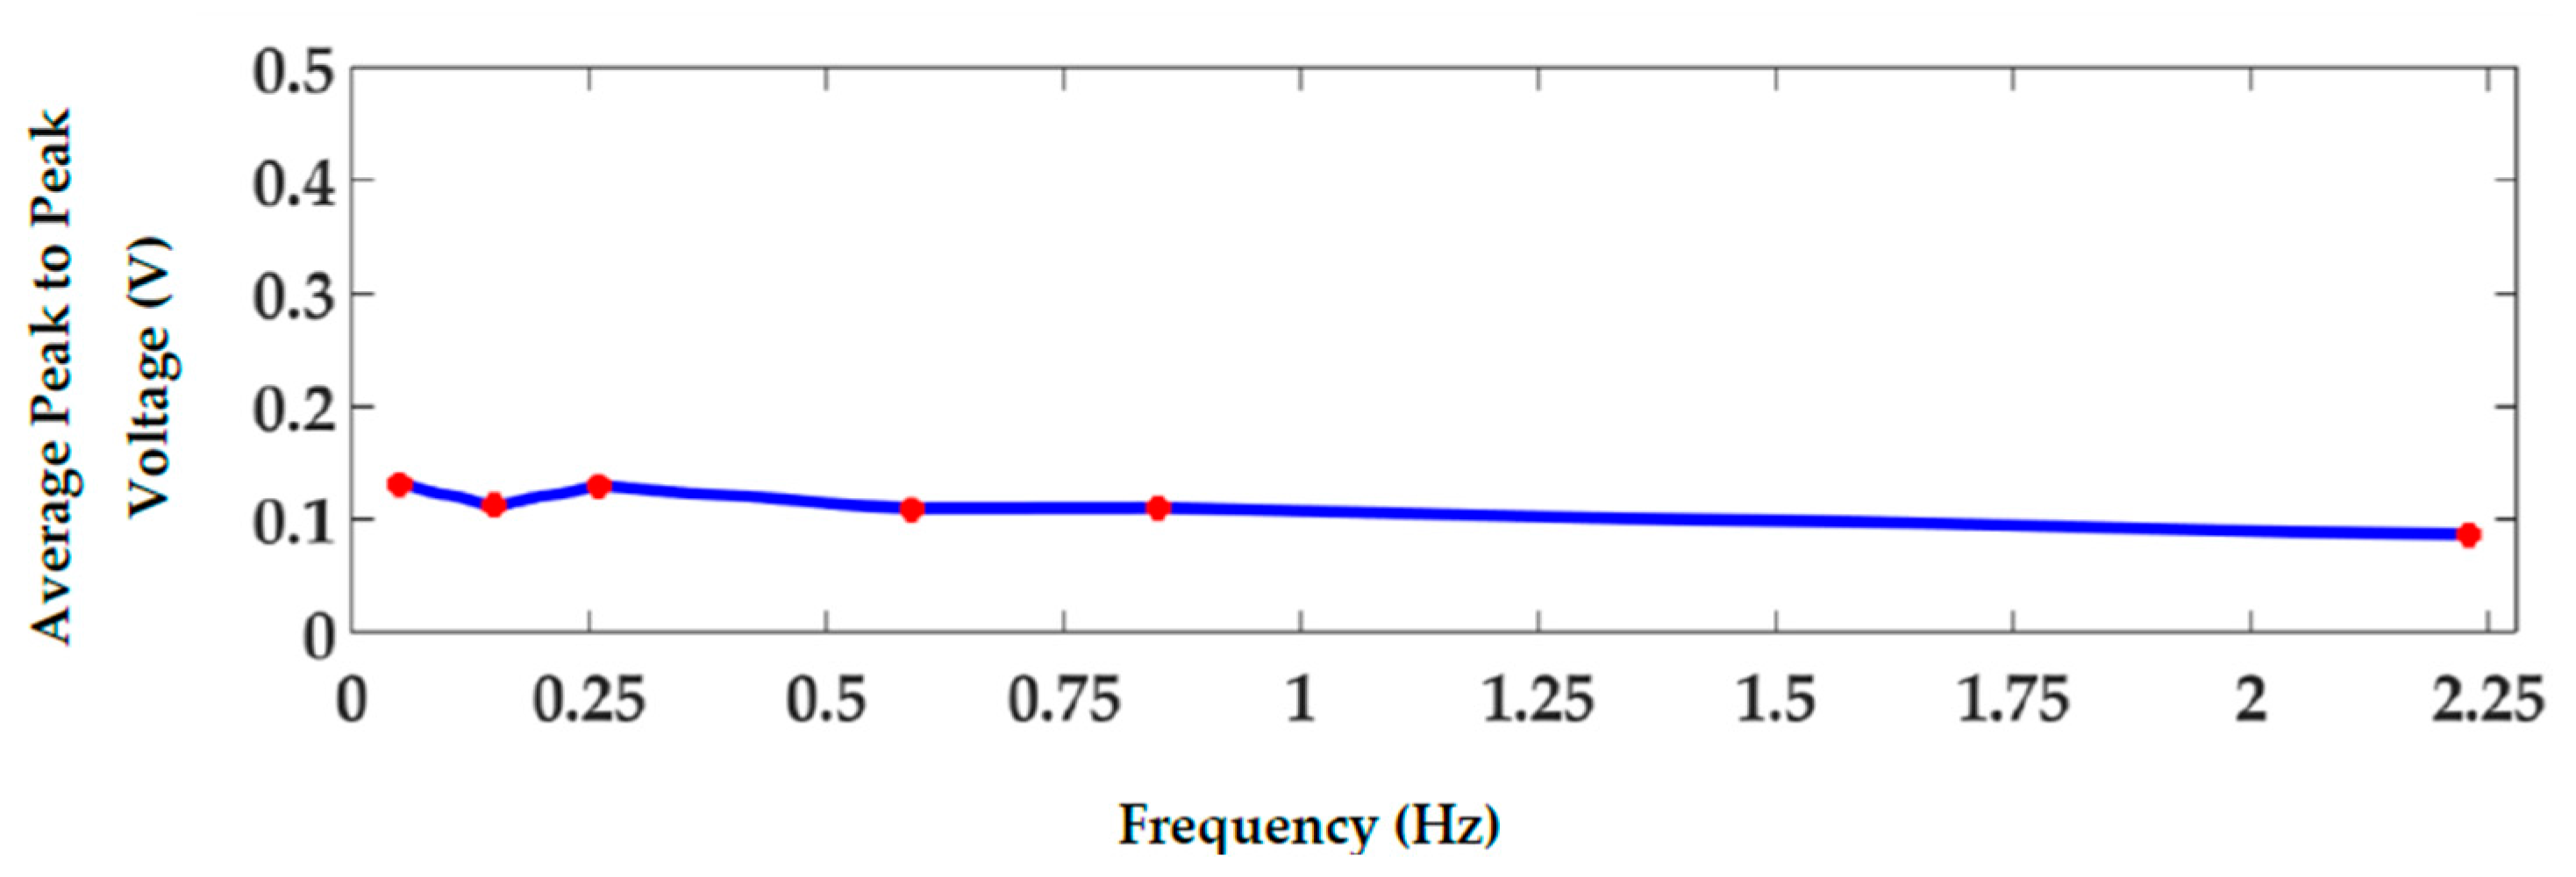
3.5. Frequency Response

To investigate the behavior of the ERB sensors for different oscillation frequencies, the speed of expansions/contractions was changed. This change was applied either by changing the voltage of the power supply which fed the DC motor or by replacing the motor with a faster/slower one. Fifty cycles of expansions/contractions were recorded continuously for each oscillation frequency. The average temporal response was calculated for each of the operated oscillation frequencies (Figure 8(a1,b1,c1,d1,e1,f1)). Then, each average temporal response was used to measure hysteresis behavior of the ERB for the operated frequency (Figure 8(a2,b2,c2,d2,e2,f2)). Generally, electro-resistive type strain sensors have been reported to show hysteresis, especially during under large strains [4]. The sensing performance of strain sensors under dynamic loads can become nonreversible when they show large hysteresis behavior [4]. Therefore, hysteresis can become an important factor for the use of such sensors in most of the wearable applications where the sensor experiences dynamic loads [4]. Figure 8(a2,b2,c2,d2,e2,f2) demonstrates that the hysteresis behavior and the amount the hysteresis varies for different oscillations.
The sensitivity of strain, known as gauge factor, was also measured for the ERB sensor operated at different oscillation frequencies. This was calculated by using the average temporal responses and simply dividing the relative change in resistance of the ERB sensor by the relative change in the length of the sensor. Figure 8(a2,b2,c2,d2,e2,f2) illustrates that the ERB’s gauge factor decreases as the oscillation frequency increases. However, the reduction in sensitivity slightly affects the peak-to-peak voltage of the ERB sensor. Figure 9 shows the average peak-to-peak voltage calculated at six different oscillation frequencies and it emphasizes that the variation of the average peak-to-peak voltage is negligible when the ERB is expanded/contracted with a frequency ranging between 0.05 Hz to 2.23 Hz.

3.6. Comparison to Rotary Encoder

The spring potentiometer was also compared to the rotary encoder. Although the exploited reference sensor (SP) in this work is commercially sold as a linear displacement sensor, we further validated its linearity by comparing 200 SP recordings with the sinusoidal wave interpolated using the rotary encoder data. The comparison illustrated that the SP recordings differ slightly from the interpolated wave from the rotary encoder. Figure 10 presents the sinusoidal wave derived from the rotary encoder data with maximum error bars from at 30° steps in an interval of 0° to 360°. Although we aimed to have the expansions/contractions of the two sensors at a constant speed during the whole experiment, our rotary encoder data shows that the speed of the motor changed slightly from one recording to another. Table 3 summarizes the speed variations of the motor during the data acquisition. Nonetheless, as the comparisons of interest were between the ERB and SP, the assessment of these remains valid.

4. Discussion

This work has highlighted a number of important factors that will impact the use of ERBs in wearable devices for accurate measurement of respiration or blood volume changes. Primarily, it is evident that the response during expansion and contraction are not the same and substantial nonlinearities exist. Secondly, the presence of baseline drift during the first 40 h exists; however, this disappears with time and hence may be obscured during use.
The ERB sensors consist of conductive fibers coupled to each other. When the sensor is stretched, these fibers decouple, leading to an increase in impedance. A linear stretch–impedance response would require conductive fiber decoupling (and recoupling) to be linear with stretch. It is likely that this is not the case and difference in the rate of coupling/recoupling of fibers is further responsible for the discrepancy in impedance response during stretch and relaxation. Furthermore, the baseline shift over time is likely due to the creation of microcracks in the ERB material when first used [4]. The results shown here (Figure 6) suggest that once the material is repetitively strained over a period of time the baseline stabilizes substantially.
The non-linear behavior of these ERBs does not exclude their use in the proposed medical applications, but it will need to be accounted for using some transfer function. The difficulty here is the stability of the non-linearity, which would need to be consistent over time for the transfer function to be accurately applied. Should a unique transfer function be required for each sensor, then the process may become quite a burden if translated to a commercial device. Similarly, the baseline drift observed may require the ERBs to be cycled in a rig similar to the one described here in order to achieve a stable response.
Of course, it should be noted that the sensor does not always required to be fully pre-calibrated when used, for example, to continuously monitor tidal volume. Indeed, in our previous work we did not calibrate the sensor directly but instead calibrated the shirt versus recordings from a spirometer [21,22]. As the signal from the shirt is already nonlinearly related to the spirometer readings, it is not a major impediment that the sensor itself is nonlinear as a careful calibration procedure can accommodate all nonlinearities simultaneously.
A number of limitations of this work are evident. Primarily, the rig could be improved as it exhibited minute vibration in both the ERB and SP recording during stretch/relaxation. These appear to be largely due to physical vibration of the sensors and movement of the pulleys over time. However, this rig was sufficient to highlight high level observations of nonlinearities. We are currently developing a new, more accurate and reliable system for these purposes. Future work will focus on establishing if nonlinear behavior at all frequencies and lengths of stretch may be removed using a single transfer function.

5. Conclusions

An expansion/contraction simulator machine was developed to investigate the characteristics of commercially available electro-resistive band (ERB) sensors. We have exploited the ERBs as wearable sensors for measuring air/blood volume changes in several newly developed monitoring prototypes. To assess the linearity/nonlinearity behavior of the ERBs, we expanded/contracted this sensor and a linear displacement sensor (string potentiometer) simultaneously. The nonlinear behavior of the ERBs appeared as a notch on its voltage output and comparison between THD values of the ERBs and the string potentiometer quantified the observed nonlinearity of the ERBs. Further analysis of the ERB data found an initial drift in their peak-to-peak voltage output, and decreased SNR values compared to that derived for the spring potentiometer. The quantification of the ERBs presented in this paper is a starting point in the development of compensating mechanisms for the nonlinear behavior of ERBs.

Acknowledgments

Authors wish to thank the office of Research Engagement, Development and Innovation at Western Sydney University for the support given throughout the duration of this project.

Author Contributions

E.S. performed data collection, data analysis, and wrote the manuscript; P.P.B. and G.D.G. both contributed to the experiment design and evaluation of the manuscript.

Conflicts of Interest

Authors G. D. Gargiulo and P. P. Breen have received a Cooperative Research Centre grant (CRC-P) for the commercial development of the device described in references [21,22]. Also, the same authors are listed as inventors on the PCT patents PCT/AU2014/050379 and PCT/AU2014/050380 related to the technology described in references [21,22].

References

  1. Deshmukh, S.D.; Shilaskar, S.N. Wearable sensors and patient monitoring system: A Review. In Proceedings of the 2015 International Conference on Pervasive Computing (ICPC), Pune, India, 8–10 January 2015; pp. 1–3. [Google Scholar]
  2. Pantelopoulos, A.; Bourbakis, N. A Survey on Werable Sensor-Based Systems for Health Monitoring and Prognosis. IEEE Trans. Syst. Man Cybern.—Part C Appl. Rev. 2010, 40, 1–12. [Google Scholar] [CrossRef]
  3. Zhang, T.; Lu, J.; Hu, F.; Hao, Q. Bluetooth low energy for wearable sensor-based healthcare systems. In Proceedings of the 2014 IEEE Healthcare Innovation Conference (HIC), Seattle, WA, USA, 8–10 Octorber 2014; pp. 251–254. [Google Scholar]
  4. Amjadi, M.; Kyung, K.-U.; Park, I.; Sitti, M. Stretchable, Skin-Mountable, and Wearable Strain Sensors and Their Potential Applications: A Review. Adv. Funct. Mater. 2016, 26, 1678–1698. [Google Scholar] [CrossRef]
  5. Trung, T.Q.; Lee, N.-E. Flexible and Stretchable Physical Sensor Integrated Platforms for Wearable Human-Activity Monitoringand Personal Healthcare. Adv. Mater. 2016, 28, 4338–4372. [Google Scholar] [CrossRef] [PubMed]
  6. Yamada, T.; Hayamizu, Y.; Yamamoto, Y.; Yomogida, Y.; Izadi-Najafabadi, A.; Futaba, D.N.; Hata, K. A stretchable carbon nanotube strain sensor for human-motion detection. Nat. Nanotechnol. 2011, 6, 296–301. [Google Scholar] [CrossRef] [PubMed]
  7. Amjadi, M.; Yoon, Y.J.; Park, I. Ultra-stretchable and skin-mountable strain sensors using carbon nanotubes-Ecoflex nanocomposites. Nanotechnology 2015, 26, 375501. [Google Scholar] [CrossRef] [PubMed]
  8. Amjadi, M.; Pichitpajongkit, A.; Lee, S.; Ryu, S.; Park, I. Highly Stretchable and Sensitive Strain Sensor Based on Silver-Elastomer Nanocomposite. ACS Nano 2014, 8, 5154–5163. [Google Scholar] [CrossRef] [PubMed]
  9. Muth, J.T.; Vogt, D.M.; Truby, R.L.; Mengüç, Y.; Kolesky, D.B.; Wood, R.J.; Lewis, J.A. Embedded 3D Printing of Strain Sensors within Highly Stretchable Elastomers. Adv. Mater. 2014, 26, 6307–6312. [Google Scholar] [CrossRef] [PubMed]
  10. Lu, N.; Lu, C.; Yang, S.; Rogers, J. Highly Sensitive Skin-Mountable Strain Gauges Based Entirely on Elastomers. Adv. Funct. Mater. 2012, 22, 4044–4050. [Google Scholar] [CrossRef]
  11. Jeong, Y.R.; Park, H.; Jin, S.W.; Hong, S.Y.; Lee, S.S.; Ha, J.S. Highly Stretchable and Sensitive Strain Sensors Using Fragmentized Graphene Foam. Adv. Funct. Mater. 2015, 25, 4228–4236. [Google Scholar] [CrossRef]
  12. Mattmann, C.; Clemens, F.; Tröster, G. Sensor for measuring strain in textile. Sensors 2008, 8, 3719–3732. [Google Scholar] [CrossRef] [PubMed]
  13. Boland, C.S.; Khan, U.; Backes, C.; O’Neill, A.; McCauley, J.; Duane, S.; Shanker, R.; Liu, Y.; Jurewicz, I.; Dalton, A.B.; et al. Sensitive, High-Strain, High-Rate Bodily Motion Sensors Based on Graphene–Rubber Composites. ACS Nano 2014, 8, 8819–8830. [Google Scholar] [CrossRef] [PubMed]
  14. Gong, S.; Lai, D.T.H.; Su, B.; Si, K.J.; Ma, Z.; Yap, L.W.; Guo, P.; Cheng, W. Highly Stretchy Black Gold E-Skin Nanopatches as Highly Sensitive Wearable Biomedical Sensors. Adv. Electron. Mater. 2015, 1, 1400063. [Google Scholar] [CrossRef]
  15. Xiao, X.; Yuan, L.; Zhong, J.; Ding, T.; Liu, Y.; Cai, Z.; Rong, Y.; Han, H.; Zhou, J.; Wang, Z.L. High-strain sensors based on ZnO nanowire/polystyrene hybridized flexible films. Adv. Mater. 2011, 23, 5440–5444. [Google Scholar] [CrossRef] [PubMed]
  16. Ding, Y.; Yang, J.; Tolle, C.R.; Zhu, Z. A highly stretchable strain sensor based on electrospun carbon nanofibers for human motion monitoring. RSC Adv. 2016, 6, 79114–79120. [Google Scholar] [CrossRef]
  17. Roh, E.; Hwang, B.; Kim, D.; Kim, B.; Lee, N. Stretchable, Transparent, Ultrasensitive, and Patchable Strain Sensor for Human–Machine Interfaces Comprising a Nanohybrid of Carbon Nanotubes and Conductive Elastomers. ACS Nano 2015, 9, 6252–6261. [Google Scholar] [CrossRef] [PubMed]
  18. Kang, D.; Pikhitsa, P.V.; Choi, Y.W.; Lee, C.; Shin, S.S.; Piao, L.; Park, B.; Suh, K.-Y.; Kim, T.; Choi, M. Ultrasensitive mechanical crack-based sensor inspired by the spider sensory system. Nature 2014, 516, 222–226. [Google Scholar] [CrossRef] [PubMed]
  19. Li, X.; Zhang, R.; Yu, W.; Wang, K.; Wei, J.; Wu, D.; Cao, A.; Li, Z.; Cheng, Y.; Zheng, Q.; et al. Stretchable and highly sensitive graphene-on-polymer strain sensors. Sci. Rep. 2012, 2, 870. [Google Scholar] [CrossRef] [PubMed]
  20. Boland, C.S.; Khan, U.; Ryan, G.; Barwich, S.; Charifou, R.; Harvey, A.; Backes, C.; Li, Z.; Ferreira, M.S.; Mobius, M.E.; et al. Sensitive electromechanical sensors using viscoelastic graphene-polymer nanocomposites. Science 2016, 354, 1257–1260. [Google Scholar] [CrossRef] [PubMed]
  21. Gargiulo, G.D.; O’Loughlin, A.; Breen, P.P. Electro-resistive bands for non-invasive cardiac and respiration monitoring, a feasibility study. Physiol. Meas. 2015, 36, N35–N49. [Google Scholar] [CrossRef] [PubMed]
  22. Gargiulo, G.D.; Gunawardana, U.; O’Loughlin, A.; Sadozai, M.; Varaki, E.S.; Breen, P.P. A Wearable Contactless Sensor Suitable for Continuous Simultaneous Monitoring of Respiration and Cardiac Activity. J. Sens. 2015, 2015, 1–6. [Google Scholar] [CrossRef]
  23. Breen, P.P.; Gargiulo, G.D. Hemodynamic monitor for rapid, cost-effective assessment of peripheral vascular function. IEEE Eng. Med. Biol. Soc. Annu. Conf. 2014, 2014, 4795–4798. [Google Scholar]
  24. ShabaniVaraki, E.; Breen, P.P.; Gargiulo, G.D. HeMo: Towards an inexpensive wearable peripheral blood flow monitoring device. In Proceedings of the 2015 IEEE Biomedical Circuits and Systems Conference (BioCAS), Atlanta, GA, USA, 22–24 Octorber 2015; pp. 1–4. [Google Scholar]
  25. Shabani Varaki, E.; Gargiulo, G.; Breen, P. Towards Low-Cost Non-Invasive Assessment of Peripheral Vascular Function. Hear. Lung Circ. 2016, 25, S23–S24. [Google Scholar] [CrossRef]
  26. Bifulco, P.; Esposito, D.; Gargiulo, G.D.; Savino, S.; Niola, V.; Iuppariello, L.; Cesarelli, M. A stretchable, conductive rubber sensor to detect muscle contraction for prosthetic hand control. In Proceedings of the IEEE International Conference on E-Health and Bioengineering, Sinaia, Romania, 22–24 June 2017; pp. 173–176. [Google Scholar]
  27. Burr-Brown/Texas Instruments REF200. Dual Curr. Source/Curr. Sink 2009, 6133, 1–19.
  28. Giner-Sanz, J.J.; Ortega, E.M.; Pérez-Herranz, V. Total harmonic distortion based method for linearity assessment in electrochemical systems in the context of EIS. Electrochim. Acta 2015, 186, 598–612. [Google Scholar] [CrossRef]
Figure 1. Panel a: picture of the expansion/contraction simulator machine. (1) is the rotary encoder; (2) is the motor; (3) shows the direction of rotation of motor’s arm; (4) refers to the pulley system; (5) is the string potentiometer; (6) is an electro-resistive band; Panel b: Diagram of the expansion/contraction simulator machine. Maximum stretch of the ERB and the SP sensors occurs when the metal arm of the DC motor reaches position (a); minimum stretch occurs at position (b).
Machines 05 00022 g001
Figure 2. ERB voltage versus SP voltage for one recording. The circled area highlights the ERB contraction nonlinearity.
Machines 05 00022 g002
Figure 3. Normalized ERB voltage versus Normalized SP voltage.
Machines 05 00022 g003
Figure 4. Total harmonic distortion of the ERBs and the SP. (1) to (4) refer to the different ERBs.
Machines 05 00022 g004
Figure 5. Signal to noise ratio of the ERBs and the SP. (1) to (4) refer to different ERBs.
Machines 05 00022 g005
Figure 6. Peak-to-peak voltage comparison of the ERBs and the SP. (1) to (4) refer to the different ERBs.
Machines 05 00022 g006
Figure 7. Correlation coefficient of the ERB and the SP sensor for 108 recordings. Different colors refer to different band used in the experiment.
Machines 05 00022 g007
Figure 8. (a1,b1,c1,d1,e1,f1) show the average temporal response calculated for oscillation frequencies of 0.05 Hz, 0.15 Hz, 0.26 Hz, 0.59 Hz, 0.85 Hz, 2.23 Hz respectively; (a2,b2,c2,d2,e2,f2) show the hysteresis behavior of the ERB sensor for oscillation frequencies of 0.05 Hz, 0.15 Hz, 0.26 Hz, 0.59 Hz, 0.85 Hz, 2.23 Hz respectively. Hysteresis is calculated at the midpoint of minimum and maximum strain. Gauge factors are also calculated for each oscillation frequency.
Machines 05 00022 g008aMachines 05 00022 g008b
Figure 9. Average peak-to-peak voltage plotted versus frequency at which the ERB is expanded/contracted. The points which were actually measured are marked as red.
Machines 05 00022 g009
Figure 10. Blue refers to normalized interpolated sinusoidal wave derived from the rotary encoder data. Red refers to average of 200 SP recordings. The error bar at each point refers to the maximum difference of the SP recordings from the interpolated wave at that point. Maximum upper error is 15.8% and maximum lower error is 17.45%.
Machines 05 00022 g010
Table 1. THD Comparison Summary.
Experiment%Mean ± SD ERB THD%Mean ± SD SP THD
110.11 ± 1.094.87 ± 2.57
212.36 ± 0.876.9 ± 1.53
39.07 ± 1.564.51 ± 2.47
410.45 ± 0.827.13 ± 2.17
Table 2. SNR Comparison Summary.
ExperimentMean ± SD (dB) ERB SNRMean ± SD (dB) SP SNR
1−0.85 ± 0.18−0.09 ± 0.06
2−0.65 ± 0.18−0.16 ± 0.05
3−0.4 ± 0.24−0.11 ± 0.09
4−0.81 ± 0.21−0.27 ± 0.12
Table 3. Statistical Parameters of Motor Speed.
ExperimentMinMaxMeanSD
18.33 rpm8.93 rpm8.62 rpm0.10 rpm
28.56 rpm9.32 rpm8.97 rpm0.15 rpm
38.67 rpm9.37 rpm8.95 rpm0.13 rpm
48.75 rpm9.49 rpm9.03 rpm0.14 rpm

