
Activation of a Rhythmic Lower Limb Movement Pattern during the Use of a Multimodal Brain–Computer Interface: A Case Study of a Clinically Complete Spinal Cord Injury
 , ,
, ,  , ,
, ,  ,
,
Abstract
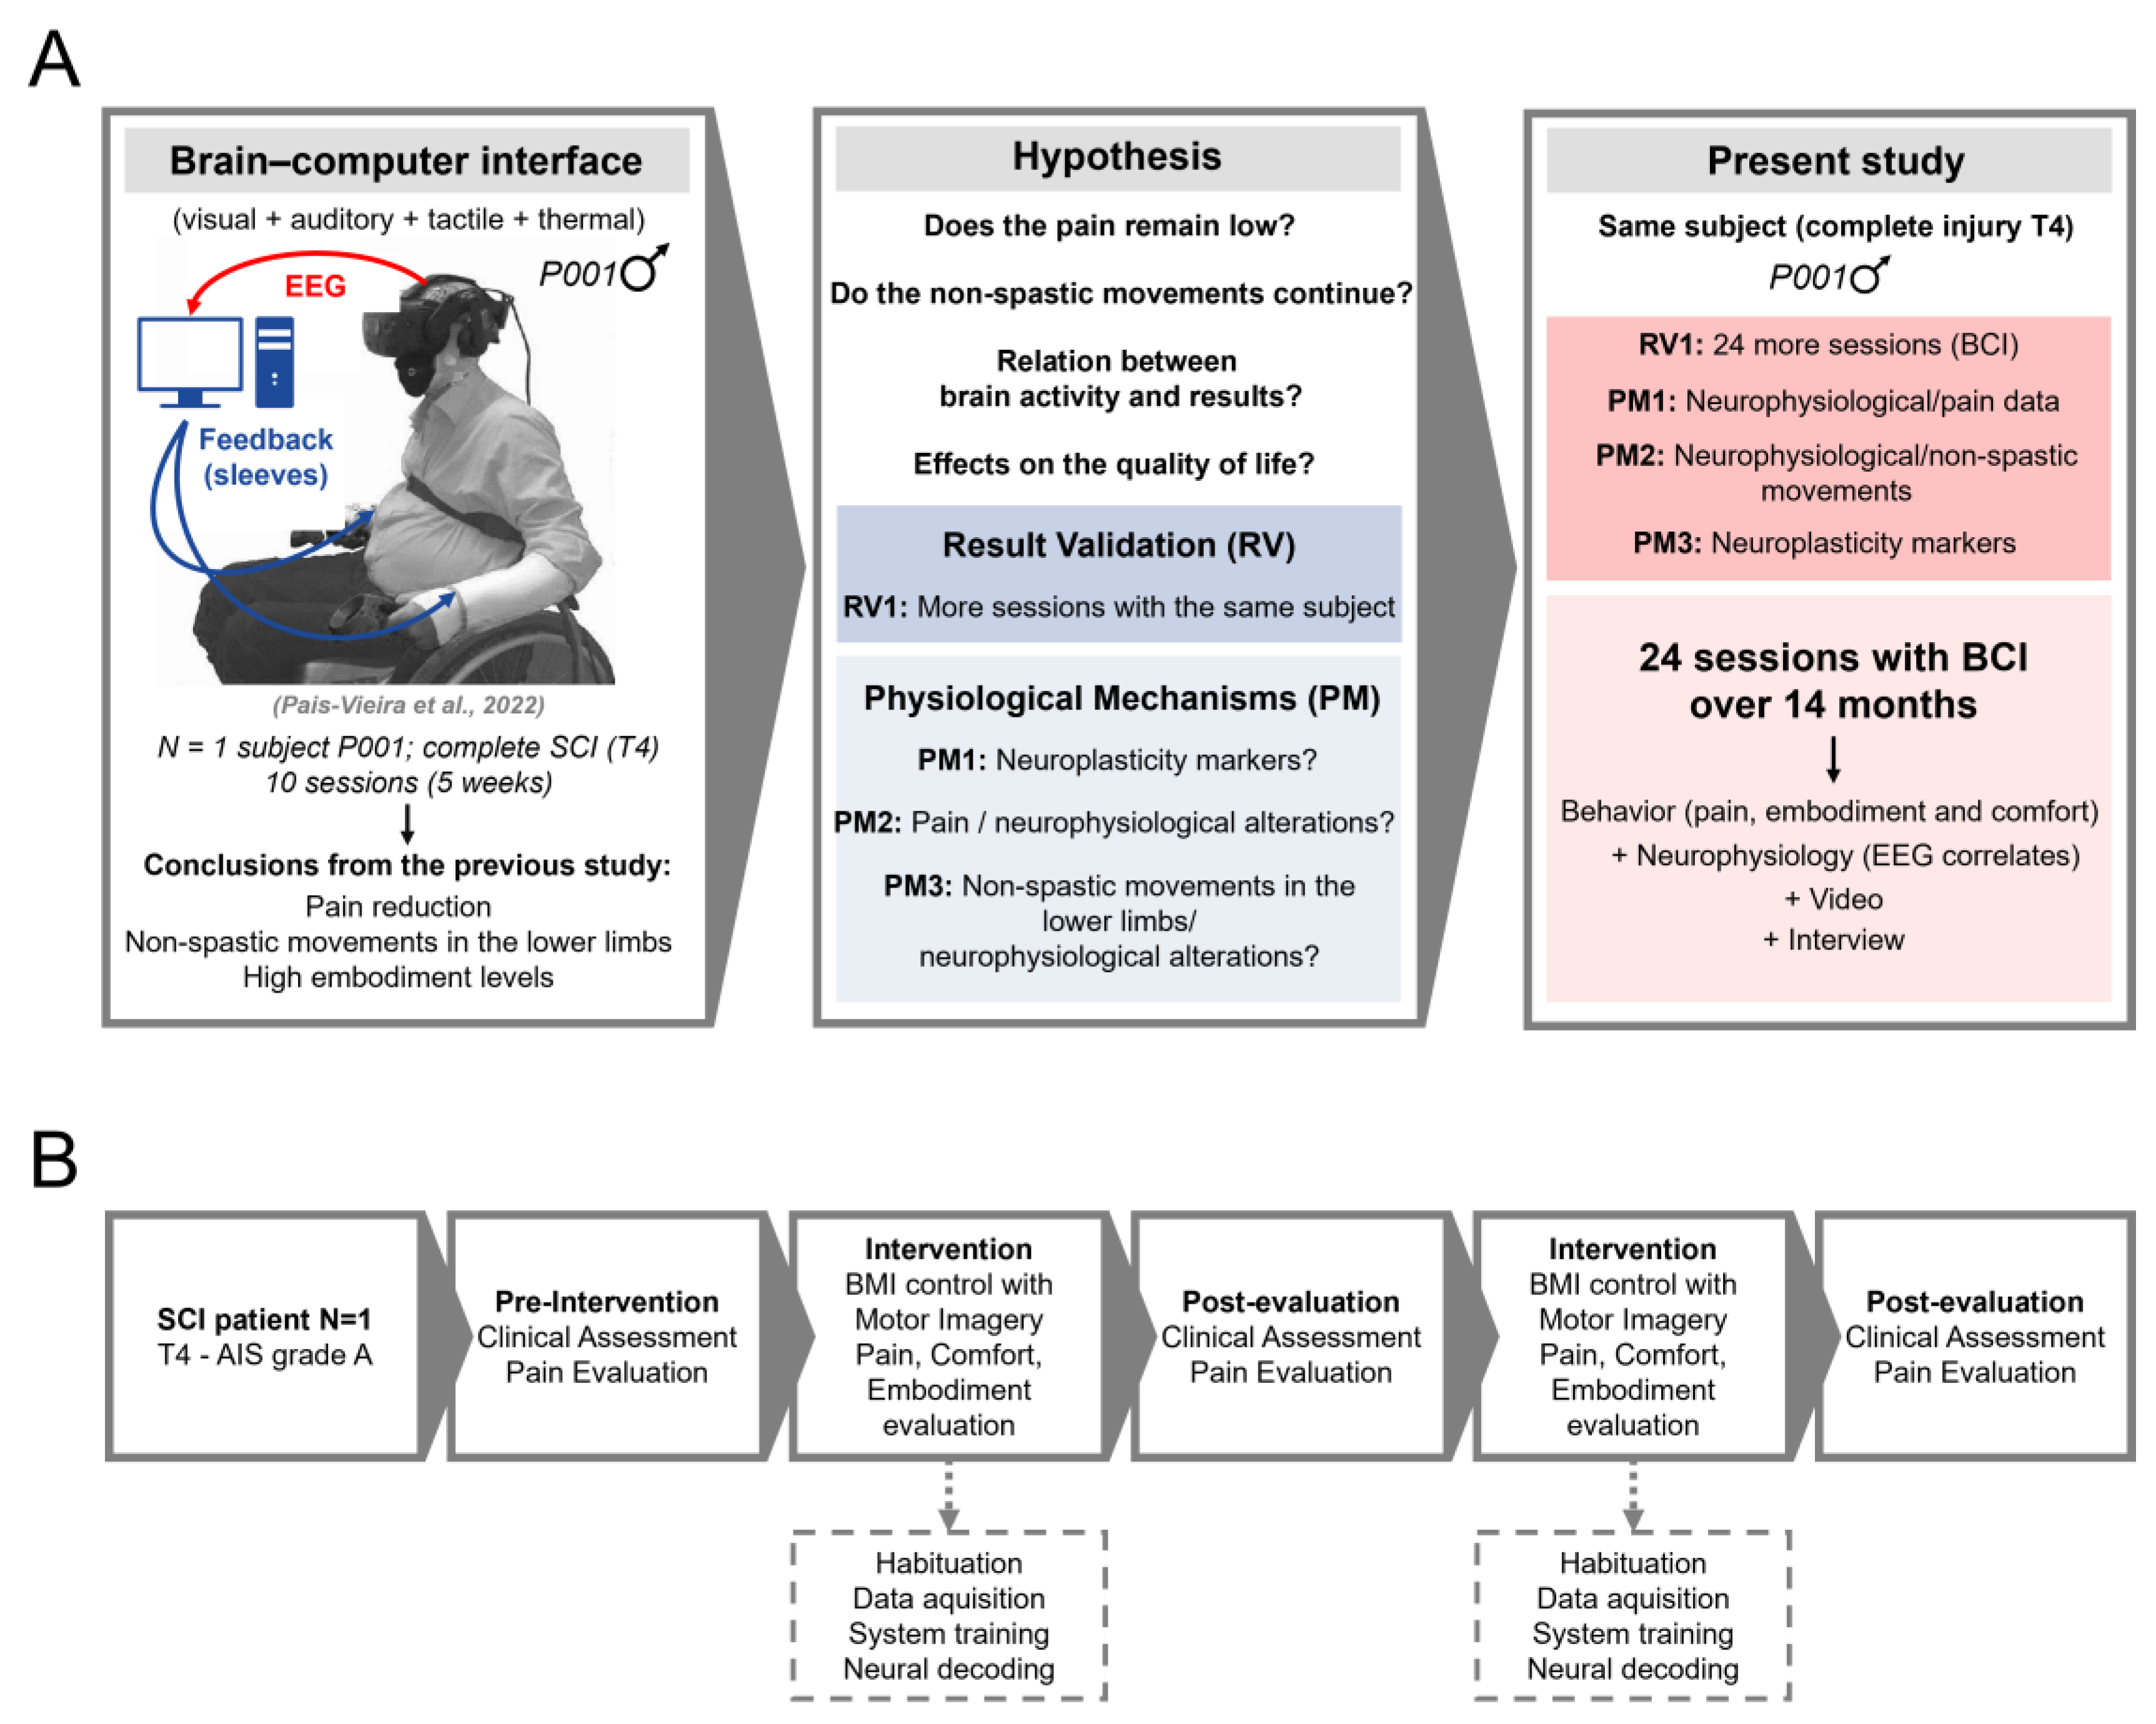
:1. Introduction
2. Materials and Methods
2.1. Patient, Ethics Approval, and Consent to Participate
2.2. VR and BCI Systems
2.3. Intervention and Sessions
2.4. Evaluation of Embodiment, Comfort, Pain, and AIS Scale
2.5. VR Environment
2.6. Interaction with the VR Environment
2.7. Electroencephalography Recordings and Analysis
2.8. Statistical Analysis
3. Results
3.1. Number of Clinical Assessments
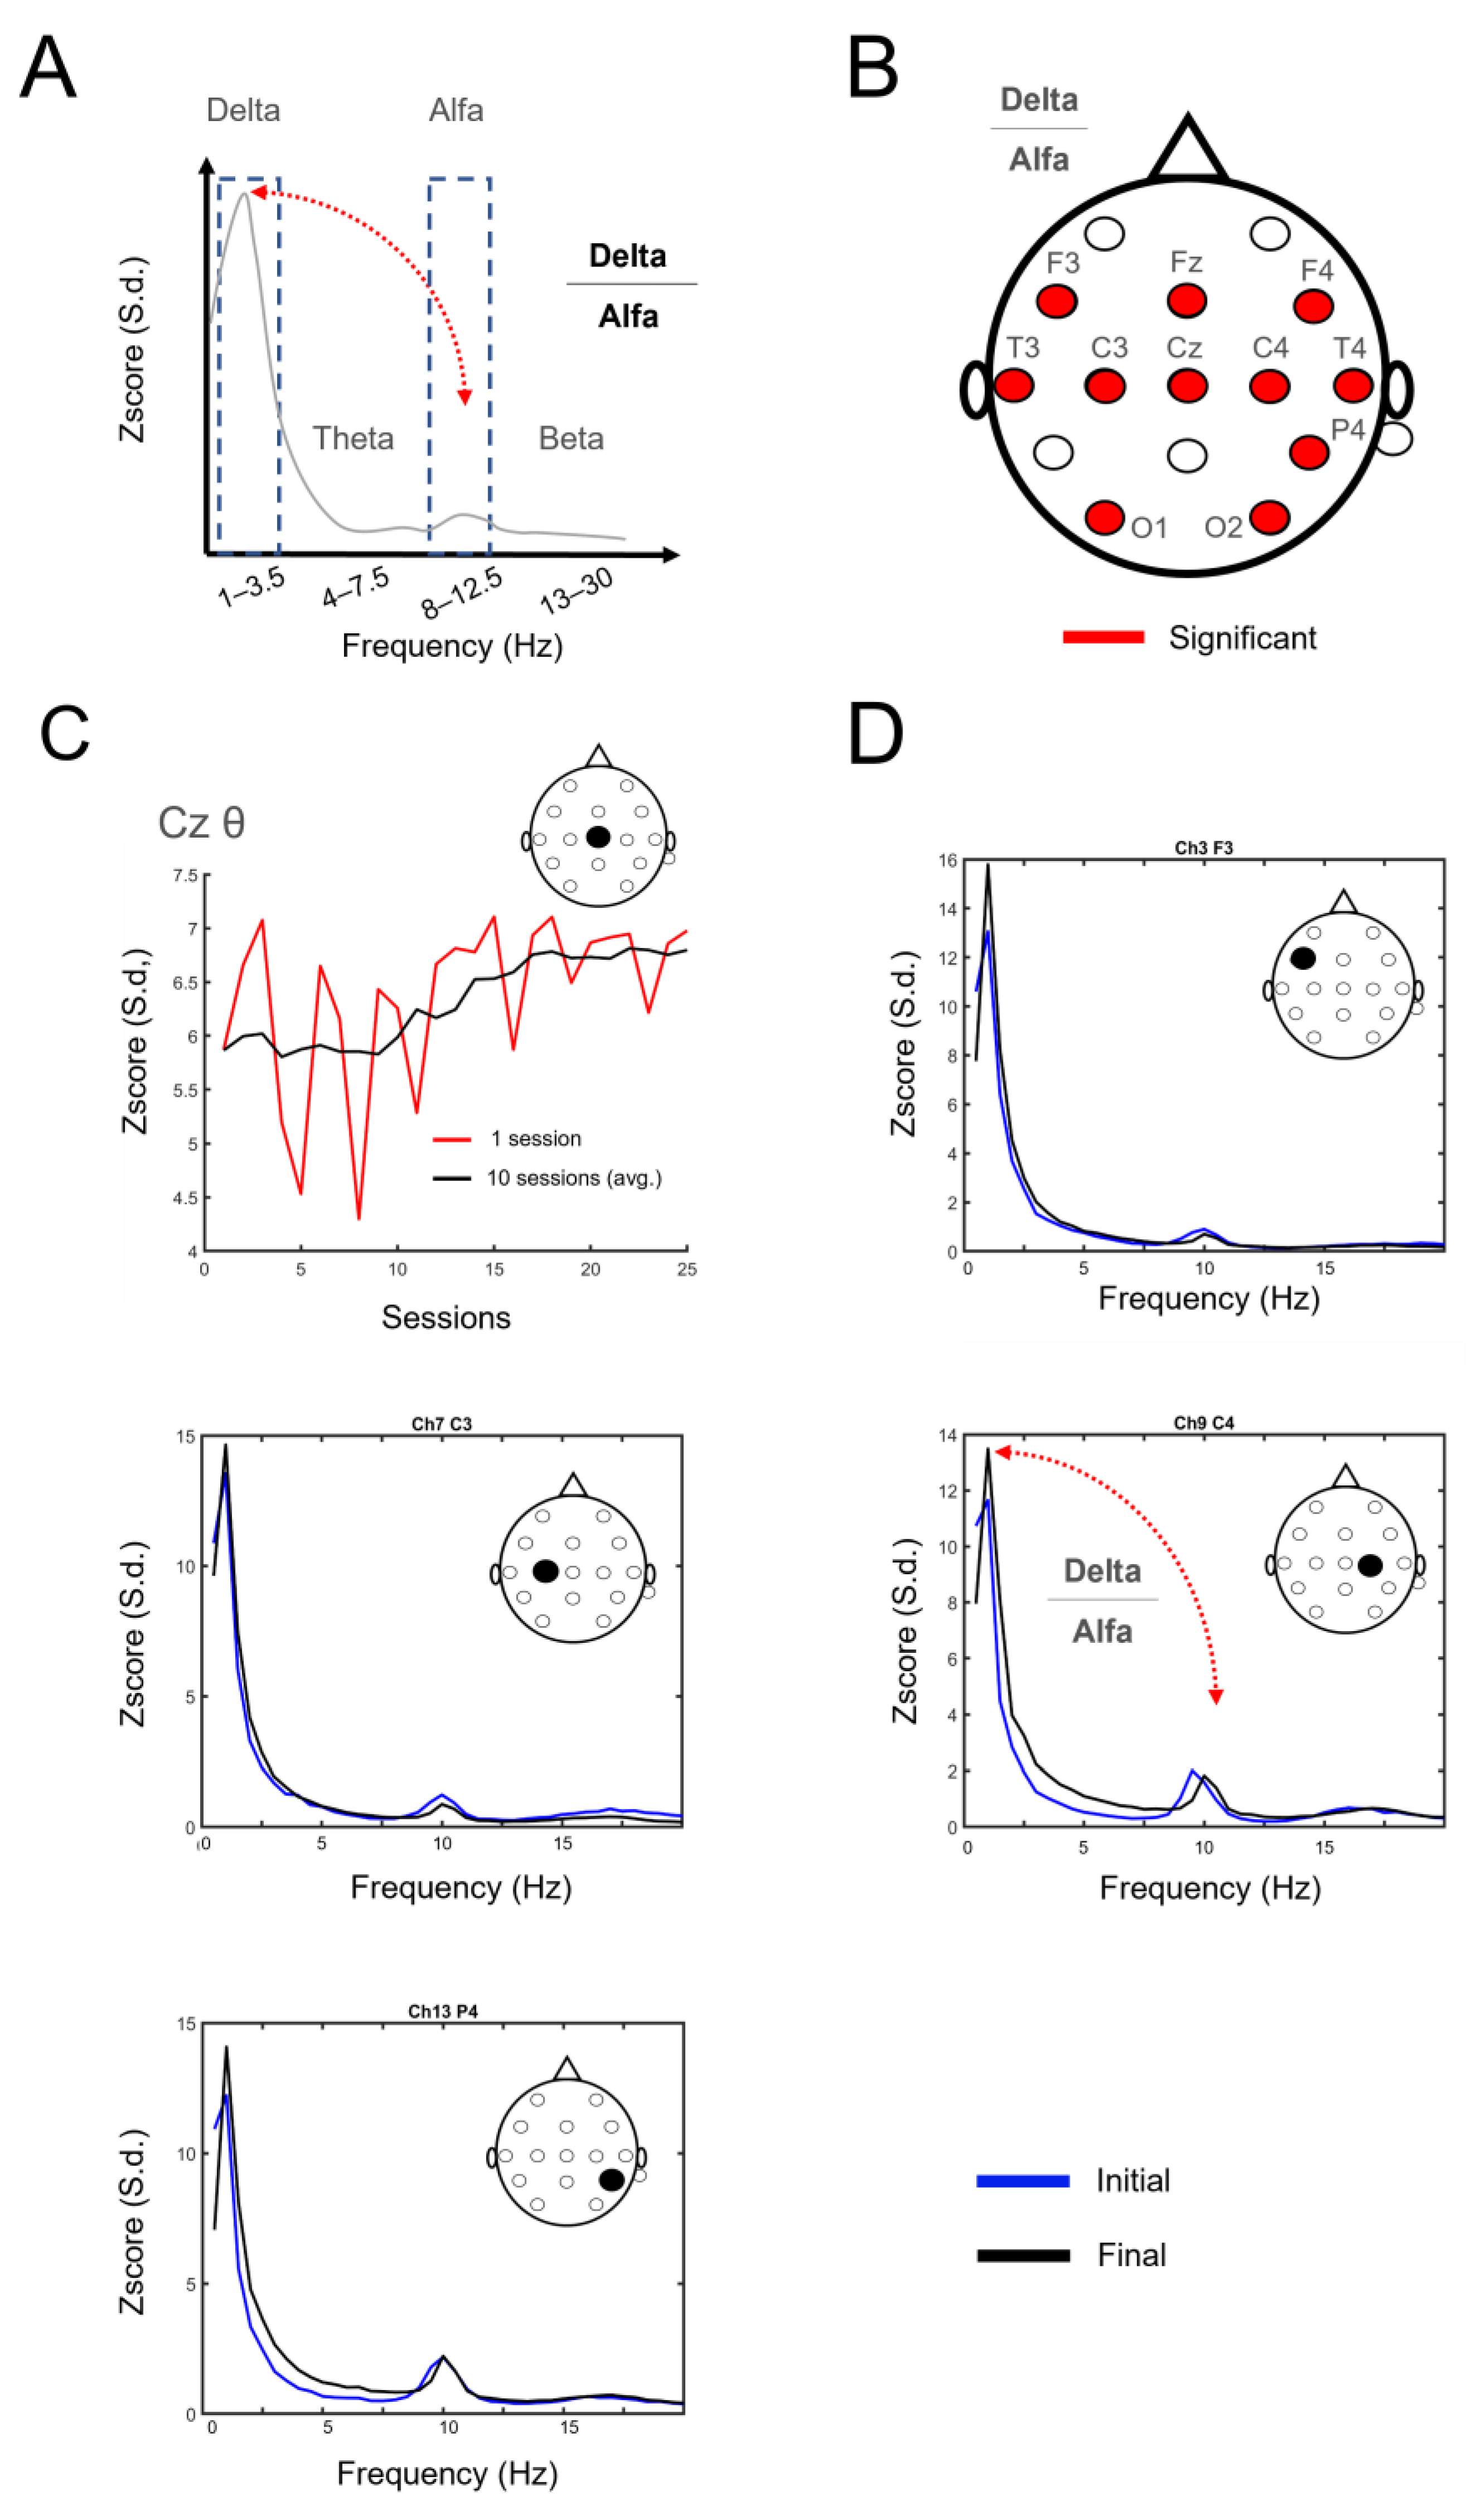
3.2. Electrophysiological Changes Suggestive of Neuroplasticity
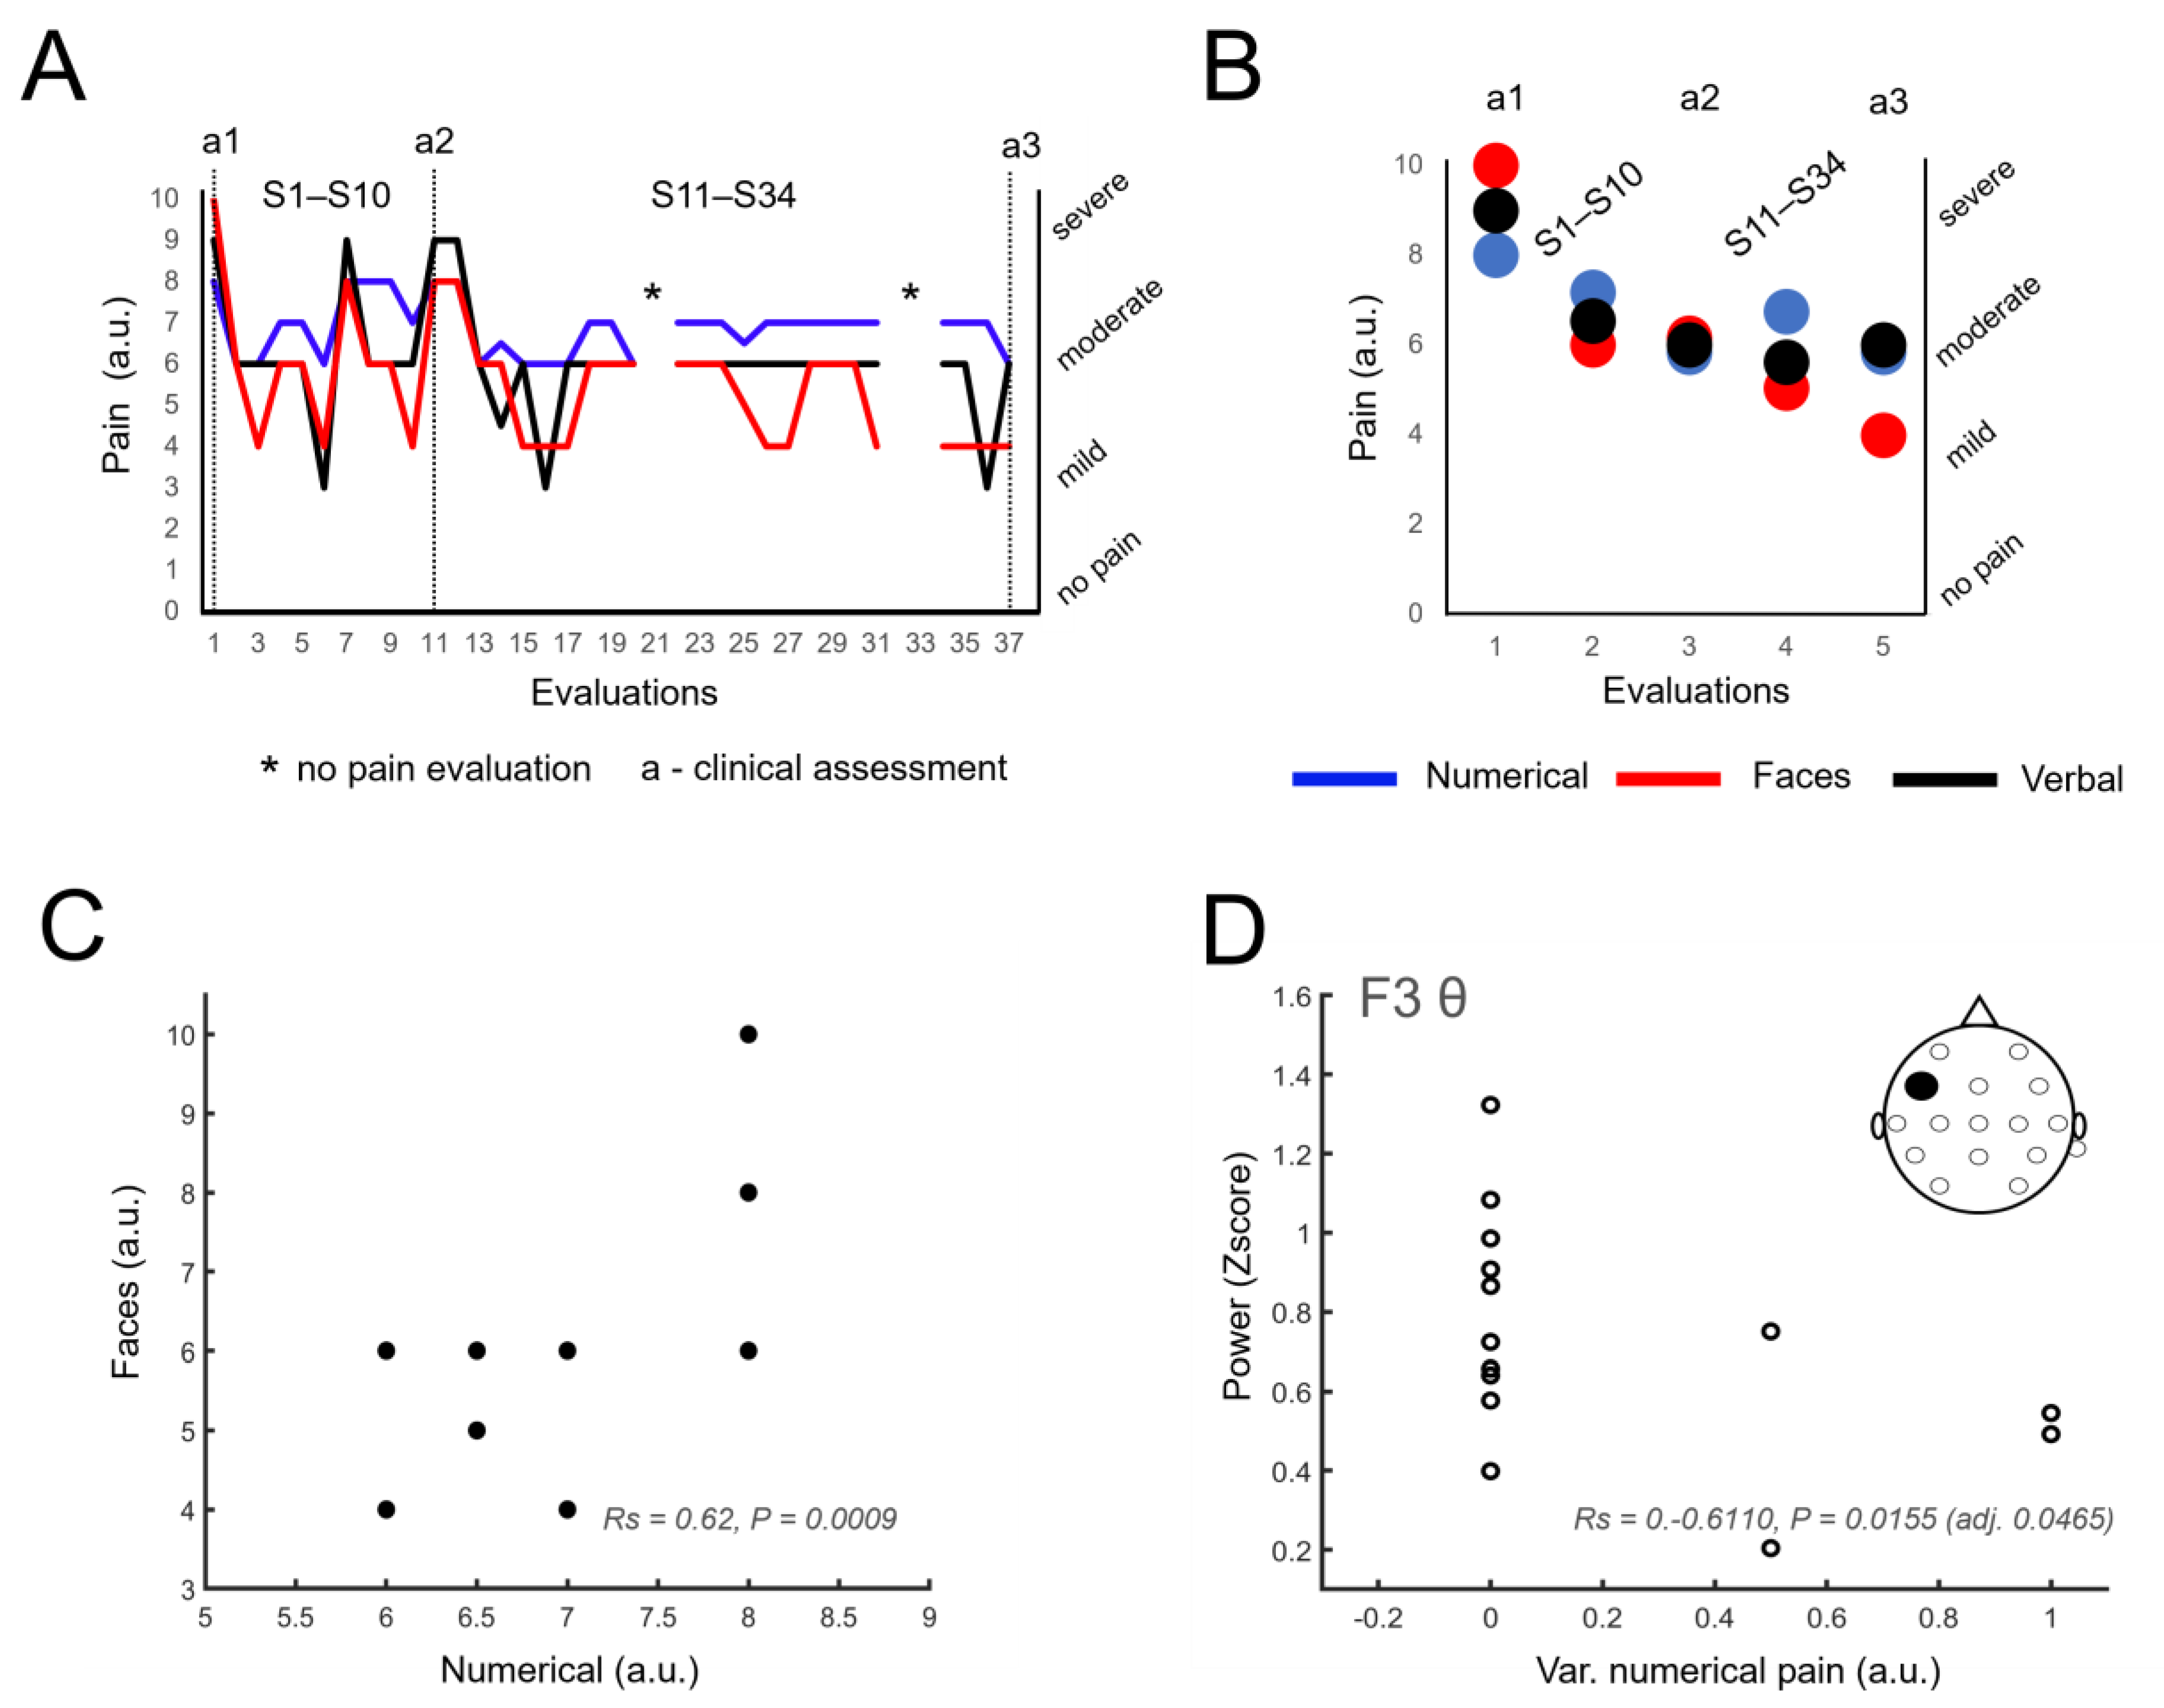
3.3. Sustained Reduction of Pain Levels
3.4. Identification of Neural Correlates of Pain
3.5. Other Information Related to Pain
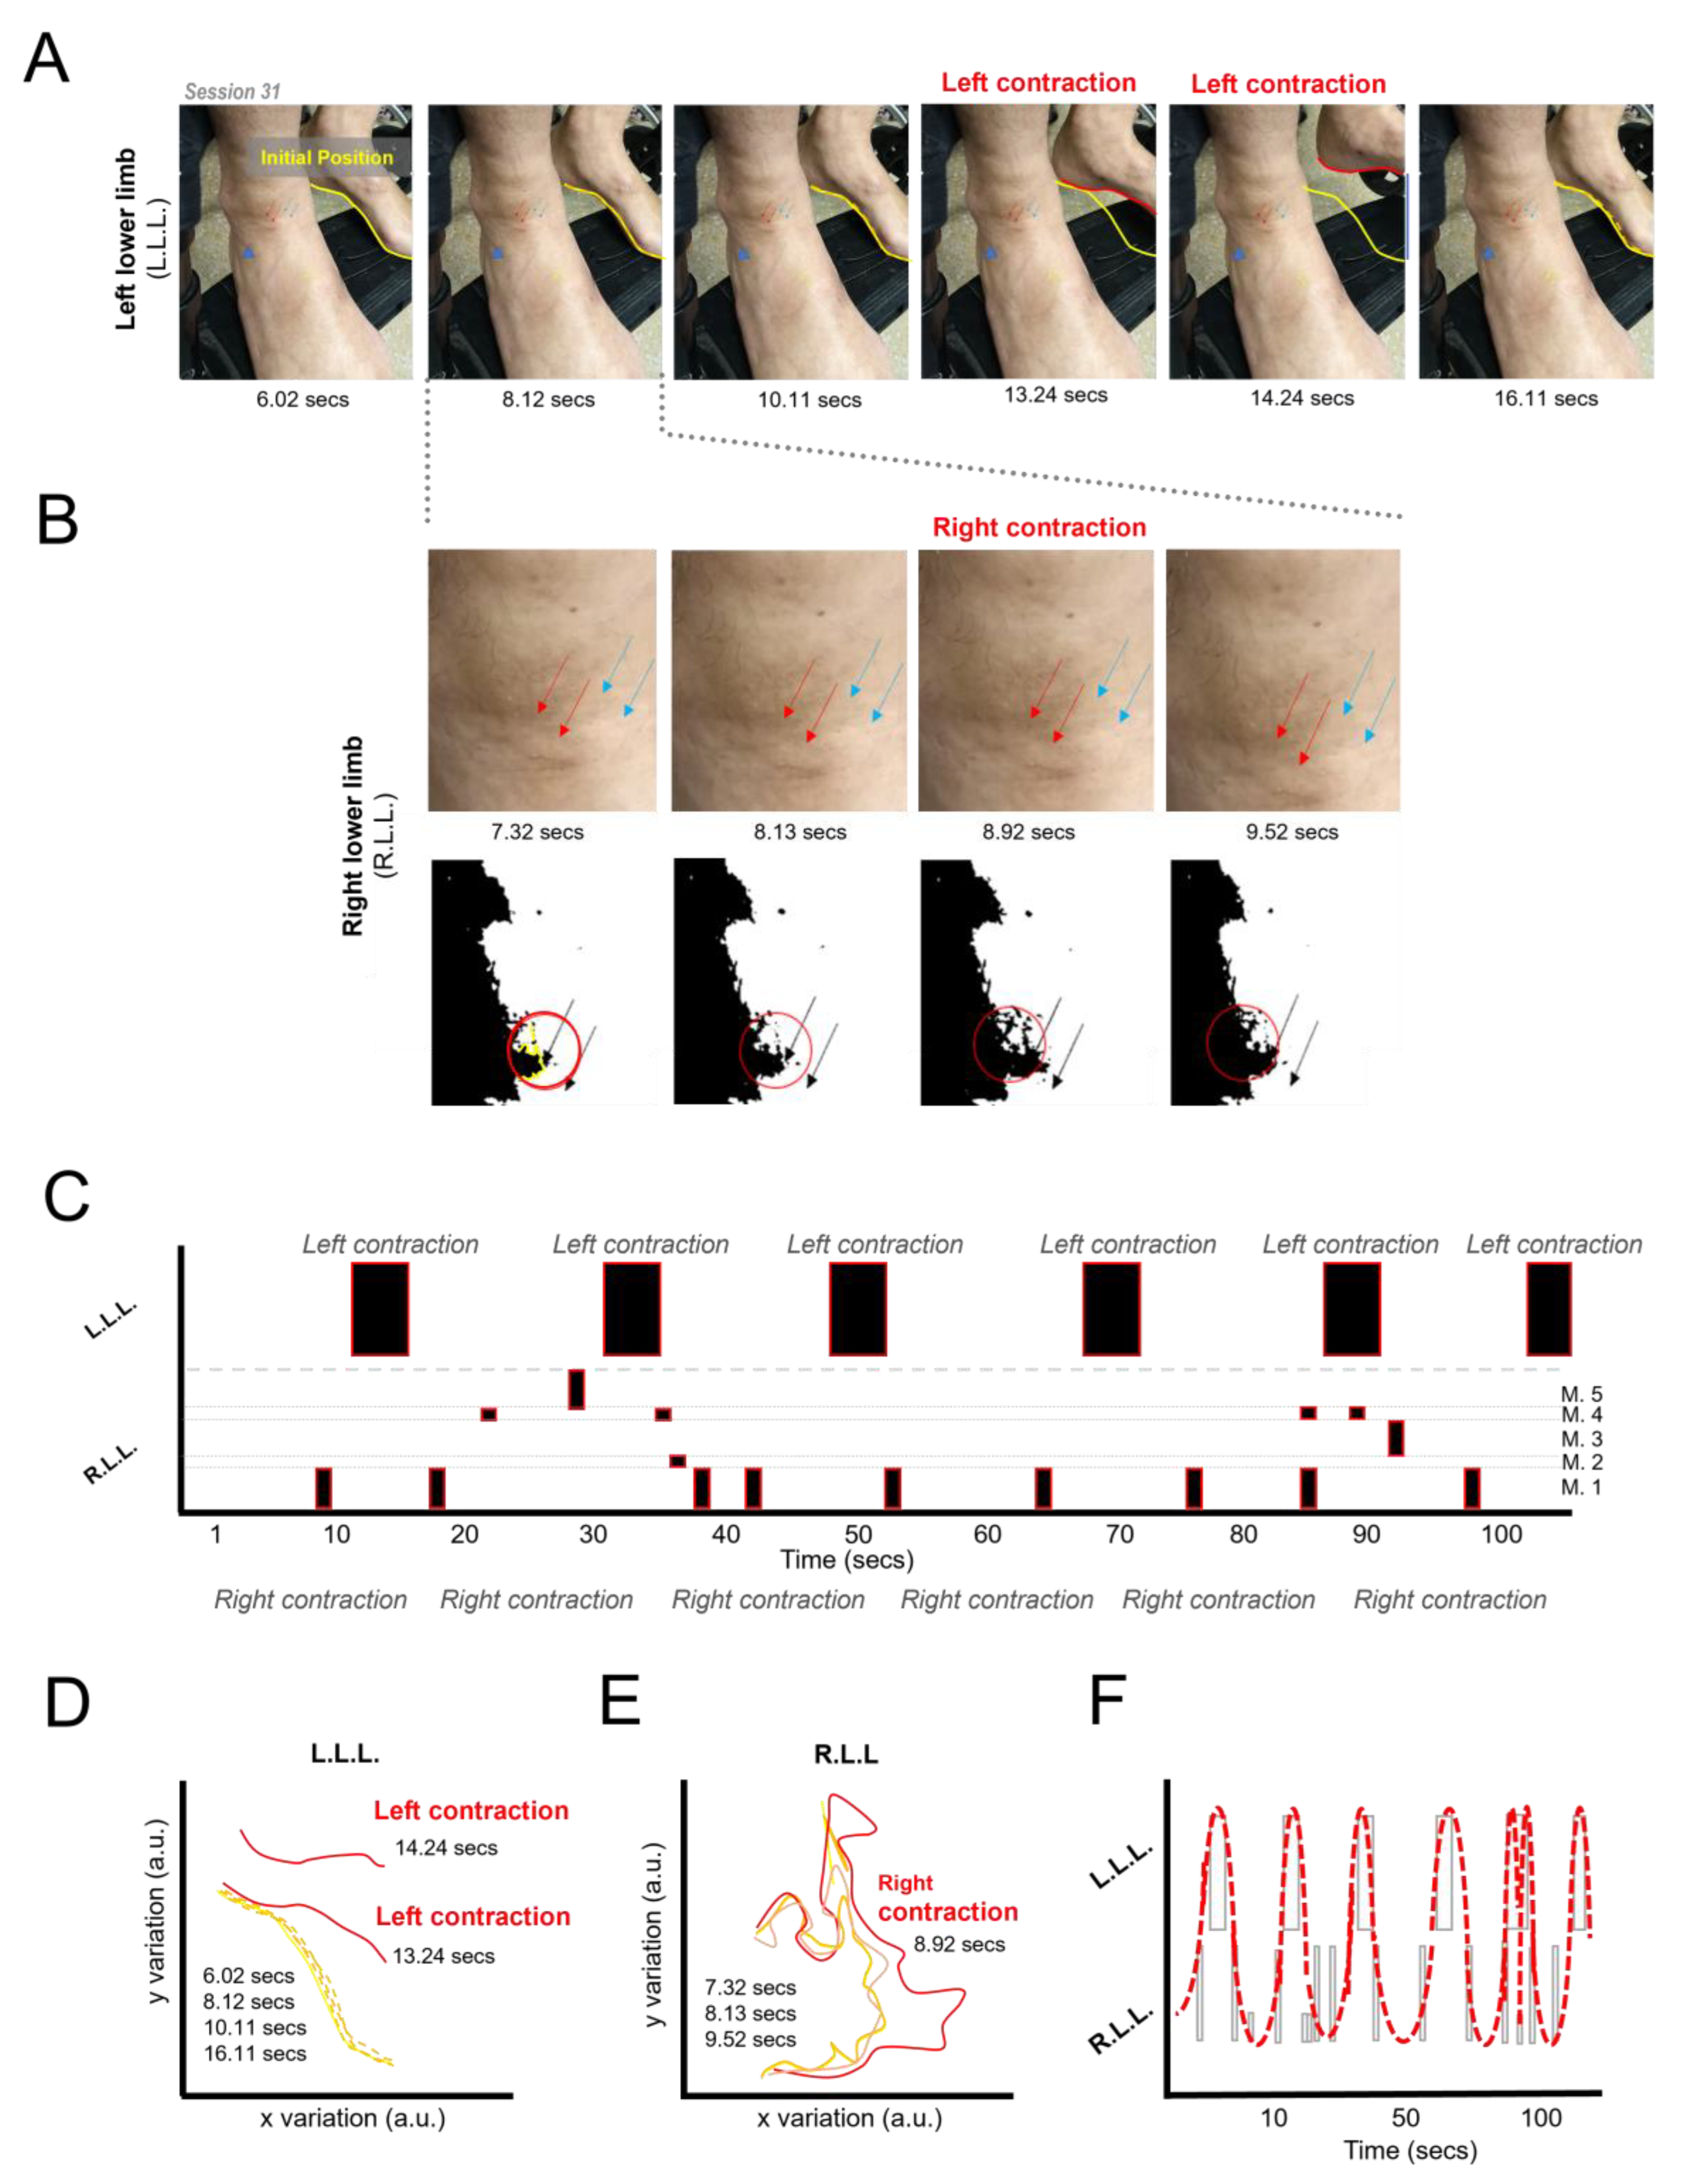
3.6. Induction of Lower Limb Movement Patterns
3.7. Control Manipulations Related to the Generation of Movements of the Lower Limbs
3.8. Additional Findings
3.8.1. Reports of Thermal Sensations in the Lower Limbs
3.8.2. Patient Engagement
4. Discussion
4.1. Sustained Pain Reduction and Neural Correlates
4.2. Induction of Alternating Movements of the Lower Limbs
4.3. Thermal Sensations
4.4. Relevant Psychosocial Effects
4.5. Clinical Results and AIS Scale
4.6. Technical Aspects
5. Conclusions
Supplementary Materials
Author Contributions
Funding
Institutional Review Board Statement
Informed Consent Statement
Data Availability Statement
Acknowledgments
Conflicts of Interest
References
- Dijkers, M. Quality of life after spinal cord injury: A meta analysis of the effects of disablement components. Spinal Cord. 1997, 35, 829–840. [Google Scholar] [CrossRef]
- De Bruin, E.D.; Frey-Rindova, P.; Herzog, R.E.; Dietz, V.; Dambacher, M.A.; Stüssi, E. Changes of tibia bone properties after spinal cord injury: Effects of early intervention. Arch. Phys. Med. Rehabil. 1999, 80, 214–220. [Google Scholar] [CrossRef] [PubMed]
- Ahuja, C.S.; Wilson, J.R.; Nori, S.; Kotter, M.R.N.; Druschel, C.; Curt, A.; Fehlings, M.G. Traumatic spinal cord injury. Nat. Rev. Dis. Primers 2017, 3, 17018. [Google Scholar] [CrossRef]
- Alizadeh, A.; Dyck, S.M.; Karimi-Abdolrezaee, S. Traumatic Spinal Cord Injury: An Overview of Pathophysiology, Models and Acute Injury Mechanisms. Front. Neurol. 2019, 10, 441408. [Google Scholar] [CrossRef] [PubMed]
- Donati, A.R.C.; Shokur, S.; Morya, E.; Campos, D.S.F.; Moioli, R.C.; Gitti, C.M.; Augusto, P.B.; Tripodi, S.; Pires, C.G.; Pereira, G.A. Long-Term Training with a Brain-Machine Interface-Based Gait Protocol Induces Partial Neurological Recovery in Paraplegic Patients. Sci. Rep. 2016, 6, 30383. [Google Scholar] [CrossRef]
- Shokur, S.; Gallo, S.; Moioli, R.C.; Donati, A.R.C.; Morya, E.; Bleuler, H.; Nicolelis, M.A. Assimilation of virtual legs and perception of floor texture by complete paraplegic patients receiving artificial tactile feedback. Sci. Rep. 2016, 6, 32293. [Google Scholar] [CrossRef] [PubMed]
- Shokur, S.; Donati, A.R.C.; Campos, D.S.F.; Gitti, C.; Bao, G.; Fischer, D.; Almeida, S.; Braga, V.A.; Augusto, P.; Petty, C.; et al. Training with brain-machine interfaces, visuo-tactile feedback and assisted locomotion improves sensorimotor, visceral, and psychological signs in chronic paraplegic patients. PLoS ONE 2018, 13, e0206464. [Google Scholar] [CrossRef]
- Selfslagh, A.; Shokur, S.; Campos, D.S.F.; Donati, A.R.C.; Almeida, S.; Yamauti, S.Y.; Coelho, D.B.; Bouri, M.; Nicolelis, M.A. Non-invasive, Brain-controlled Functional Electrical Stimulation for Locomotion Rehabilitation in Individuals with Paraplegia. Sci. Rep. 2019, 9, 6782. [Google Scholar] [CrossRef]
- Benabid, A.L.; Costecalde, T.; Eliseyev, A.; Charvet, G.; Verney, A.; Karakas, S.; Foerster, M.; Lambert, A.; Morinière, B.; Abroug, N.; et al. An exoskeleton controlled by an epidural wireless brain–machine interface in a tetraplegic patient: A proof-of-concept demonstration. Lancet Neurol. 2019, 18, 1112–1122. [Google Scholar] [CrossRef]
- Pais-Vieira, C.; Gaspar, P.; Matos, D.; Alves, L.P.; da Cruz, B.M.; Azevedo, M.J.; Gago, M.; Poleri, T.; Perrotta, A.; Pais-Vieira, M. Embodiment Comfort Levels During Motor Imagery Training Combined With Immersive Virtual Reality in a Spinal Cord Injury Patient. Front. Hum. Neurosci. 2022, 16, 909112. [Google Scholar] [CrossRef]
- Anderson, M.A.; Squair, J.W.; Gautier, M.; Hutson, T.H.; Kathe, C.; Barraud, Q.; Bloch, J.; Courtine, G. Natural and targeted circuit reorganization after spinal cord injury. Nat. Neurosci. 2022, 25, 1584–1596. [Google Scholar] [CrossRef]
- João Tomás, D.; Pais-Vieira, M.; Pais-Vieira, C. Sensorial Feedback Contribution to the Sense of Embodiment in Brain–Machine Interfaces: A Systematic Review. Appl. Sci. 2023, 13, 13011. [Google Scholar] [CrossRef]
- Renard, Y.; Lotte, F.; Gibert, G.; Congedo, M.; Maby, E.; Delannoy, V.; Bertrand, O.; Lécuyer, A. OpenViBE: An open-source software platform to design, test, and use brain-computer interfaces in real and virtual environments. Presence 2010, 19, 35–53. [Google Scholar] [CrossRef]
- Xu, W.; Wang, J.; Jia, Z.; Hong, Z.; Li, Y.; Lin, Y. Multi-Level Spatial-Temporal Adaptation Network for Motor Imagery Classification. In Proceedings of the ICASSP 2022—2022 IEEE International Conference on Acoustics, Speech and Signal Processing (ICASSP), Singapore, 23–27 May 2022; pp. 1251–1255. [Google Scholar]
- Liu, S.; An, L.; Zhang, C.; Jia, Z. A Spatial-Temporal Transformer based on Domain Generalization for Motor Imagery Classification. In Proceedings of the 2023 IEEE International Conference on Systems, Man, and Cybernetics (SMC), Honolulu, HI, USA, 1–4 October 2023; pp. 3789–3794. [Google Scholar]
- Tao, W.; Wang, Z.; Wong, C.M.; Jia, Z.; Li, C.; Chen, X.; Chen, C.P.; Wan, F. ADFCNN: Attention-Based Dual-Scale Fusion Convolutional Neural Network for Motor Imagery Brain-Computer Interface. IEEE Trans. Neural Syst. Rehabil. Eng. 2024, 32, 154–165. [Google Scholar] [CrossRef] [PubMed]
- Gomes, J.C.; Marques, V.; de Brito, C.; Nascimento, Y.; Miranda, G.; Córdula, N.; Fragoso, C.; Torcarte, A.; Santana, M.A.; Moreno, G.; et al. Machine Learning for Detection and Classification of Motor Imagery in Electroencephalographic Signals. In Biomedical Signal Processing: A Modern Approach; CRC Press: Boca Raton, FL, USA, 2023; pp. 149–171. Available online: https://www.taylorfrancis.com/chapters/edit/10.1201/9781003201137-9/machine-learning-detection-classification-motor-imagery-electroencephalographic-signals-juliana-gomes-vanessa-marques-caio-de-brito-yasmin-nascimento-gabriel-miranda-nath%C3%A1lia-c%C3%B3rdula-camila-fragoso-arianne-torcarte-ma%C3%ADra-santana-giselle-moreno-wellington-pinheiro-dos-santos (accessed on 4 March 2024).
- Lorach, H.; Galvez, A.; Spagnolo, V.; Martel, F.; Karakas, S.; Intering, N.; Vat, M.; Faivre, O.; Harte, C.; Komi, S.; et al. Walking naturally after spinal cord injury using a brain–spine interface. Nature 2023, 618, 126–133. [Google Scholar] [CrossRef] [PubMed]
- Jensen, M.P.; Sherlin, L.H.; Gertz, K.J.; Braden, A.L.; Kupper, A.E.; Gianas, A.; Howe, J.D.; Hakimian, S. Brain EEG activity correlates of chronic pain in persons with spinal cord injury: Clinical implications. Spinal Cord 2013, 51, 55–58. [Google Scholar] [CrossRef]
- Lenggenhager, B.; Scivoletto, G.; Molinari, M.; Pazzaglia, M. Restoring tactile awareness through the rubber hand illusion in cervical spinal cord injury. Neurorehabil. Neural Repair 2013, 27, 704–708. [Google Scholar] [CrossRef] [PubMed]
- Pozeg, P.; Palluel, E.; Ronchi, R.; Solcà, M.; Al-Khodairy, A.W.; Jordan, X.; Kassouha, A.; Blanke, O. Virtual reality improves embodiment and neuropathic pain caused by spinal cord injury. Neurology 2017, 89, 1894–1903. [Google Scholar] [CrossRef] [PubMed]
- Kilteni, K.; Groten, R.; Slater, M. The Sense of Embodiment in virtual reality. Presence Teleoperators Virtual Environ. 2012, 21, 373–387. [Google Scholar] [CrossRef]
- Kilteni, K.; Ehrsson, H.H. Body ownership determines the attenuation of self-generated tactile sensations. Proc. Natl. Acad. Sci. USA 2017, 114, 8426–8431. [Google Scholar] [CrossRef]
- Pazzaglia, M.; Galli, G.; Lewis, J.W.; Scivoletto, G.; Giannini, A.M.; Molinari, M. Embodying functionally relevant action sounds in patients with spinal cord injury. Sci. Rep. 2018, 8, 15641. [Google Scholar] [CrossRef]
- Arzy, S.; Thut, G.; Mohr, C.; Michel, C.M.; Blanke, O. Neural Basis of Embodiment: Distinct Contributions of Temporoparietal Junction and Extrastriate Body Area. J. Neurosci. 2006, 26, 8074–8081. [Google Scholar] [CrossRef]
- Bekrater-Bodmann, R.; Foell, J.; Diers, M.; Kamping, S.; Rance, M.; Kirsch, P.; Trojan, J.; Fuchs, X.; Bach, F.; Çakmak, H.K.; et al. The importance of synchrony and temporal order of visual and tactile input for illusory limb ownership experiences—An FMRI study applying virtual reality. PLoS ONE 2014, 9, e87013. [Google Scholar] [CrossRef] [PubMed]
- Braun, N.; Debener, S.; Spychala, N.; Bongartz, E.; Sörös, P.; Müller, H.H.O.; Philipsen, A. The senses of agency and ownership: A review. Front. Psychol. 2018, 9, 334248. [Google Scholar] [CrossRef] [PubMed]
- Schettler, A.; Raja, V.; Anderson, M.L. The Embodiment of Objects: Review, Analysis, and Future Directions. Front. Neurosci. 2019, 13, 1332. [Google Scholar] [CrossRef]
- Rao, I.S.; Kayser, C. Neurophysiological Correlates of the Rubber Hand Illusion in Late Evoked and Alpha/Beta Band Activity. Front. Hum. Neurosci. 2017, 11, 377. [Google Scholar] [CrossRef] [PubMed]
- Casula, E.P.; Tieri, G.; Rocchi, L.; Pezzetta, R.; Maiella, M.; Pavone, E.F.; Aglioti, S.M.; Koch, G. Feeling of Ownership over an Embodied Avatar’s Hand Brings About Fast Changes of Fronto-Parietal Cortical Dynamics. J. Neurosci. 2022, 42, 692–701. [Google Scholar] [CrossRef] [PubMed]
- Vuckovic, A.; Jajrees, M.; Purcell, M.; Berry, H.; Fraser, M. Electroencephalographic Predictors of Neuropathic Pain in Subacute Spinal Cord Injury. J. Pain 2018, 19, 1256.e1–1256.e17. [Google Scholar] [CrossRef]
- Boord, P.; Siddall, P.J.; Tran, Y.; Herbert, D.; Middleton, J.; Craig, A. Electroencephalographic slowing and reduced reactivity in neuropathic pain following spinal cord injury. Spinal Cord 2007, 46, 118–123. [Google Scholar] [CrossRef] [PubMed]
- Harkema, S.J.; Dobkin, B.H.; Edgerton, V.R. Pattern Generators in Locomotion: Implications for Recovery of Walking after Spinal Cord Injury. Top. Spinal Cord Inj. Rehabil. 2000, 6, 82–96. [Google Scholar] [CrossRef]
- Grasso, R.; Ivanenko, Y.P.; Zago, M.; Molinari, M.; Scivoletto, G.; Castellano, V.; Macellari, V.; Lacquaniti, F. Distributed plasticity of locomotor pattern generators in spinal cord injured patients. Brain 2004, 127 Pt 5, 1019–1034. [Google Scholar] [CrossRef]
- Minassian, K.; Hofstoetter, U.S.; Dzeladini, F.; Guertin, P.A.; Ijspeert, A. The Human Central Pattern Generator for Locomotion: Does It Exist and Contribute to Walking? Neuroscientist 2017, 23, 649–663. [Google Scholar] [CrossRef]
- Ditunno, J.F.; Young, W.; Donovan, W.H.; Creasey, G. The international standards booklet for neurological and functional classification of spinal cord injury. American Spinal Injury Association. Paraplegia 1994, 32, 70–80. [Google Scholar] [CrossRef]
- Perrotta, A.; Cardoso, J.; Gaspar, P.; Alves, L.P.; Pais-Vieira, C.; Matos, D.; Pais-Vieira, M. Thertact-System: A Virtual Reality Exoskeleton Gait Training Simulator Controlled by Brain-Computer Interface. In Information Systems Development, Organizational Aspects and Societal Trends (ISD2023 Proceedings); Instituto Superior Técnico: Lisbon, Portugal, 2023. [Google Scholar]
- Peck, T.C.; Gonzalez-Franco, M. Avatar Embodiment. A Stand. Questionnaire. Front. Virtual Real. 2021, 1, 575943. [Google Scholar] [CrossRef]
- Gallagher, E.J.; Liebman, M.; Bijur, P.E. Prospective validation of clinically important changes in pain severity measured on a visual analog scale. Ann. Emerg. Med. 2001, 38, 633–638. [Google Scholar] [CrossRef]
- Collins, S.L.; Moore, R.A.; McQuay, H.J. The visual analogue pain intensity scale: What is moderate pain in millimetres? Pain 1997, 72, 95–97. [Google Scholar] [CrossRef]
- Bijur, P.E.; Latimer, C.T.; Gallagher, E.J. Validation of a verbally administered numerical rating scale of acute pain for use in the emergency department. Acad. Emerg. Med. 2003, 10, 390–392. [Google Scholar] [CrossRef]
- Kennedy, R.S.; Lane, N.E.; Berbaum, K.S.; Lilienthal, M.G. Simulator Sickness Questionnaire: An Enhanced Method for Quantifying Simulator Sickness. Int. J. Aviat. Psychol. 1993, 3, 203–220. [Google Scholar] [CrossRef]
- Regan, E.C.; Price, K.R. The frequency of occurrence and severity of side-effects of immersion virtual reality. Aviat. Space Environ. Med. 1994, 65, 527–530. [Google Scholar] [PubMed]
- Myles, P.S.; Troedel, S.; Boquest, M.; Reeves, M. The pain visual analog scale: Is it linear or nonlinear? Anesth. Analg. 1999, 89, 1517–1520. [Google Scholar] [CrossRef] [PubMed]
- Calancie, B. Spinal Myoclonus After Spinal Cord Injury. J. Spinal Cord Med. 2006, 29, 413. [Google Scholar] [CrossRef] [PubMed]
- George, L.K. Sociological Perspectives on Life Transitions. Annu. Rev. Sociol. 1993, 19, 353–373. [Google Scholar] [CrossRef]
- Ngan, S.; Toth, C. The influence of Chinook winds and other weather patterns upon neuropathic pain. Pain Med. 2011, 12, 1523–1531. [Google Scholar] [CrossRef]
- Heyn, J.; Kiesewetter, I.; Uenze, B.; Christoph, R.; Baumann, N.; Mihatsch, L.; Luchting, B. Seasonal impact on the outcome of multidisciplinary pain therapy. Chronobiol. Int. 2023, 40, 400–406. [Google Scholar] [CrossRef]
- Wade, J.B.; Hart, R.P.; Wade, J.H.; Bajaj, J.S.; Price, D.D. The Relationship between Marital Status and Psychological Resilience in Chronic Pain. Pain Res. Treat. 2013, 2013, 928473. [Google Scholar] [CrossRef]
- Zolezzi, D.M.; Alonso-Valerdi, L.M.; Ibarra-Zarate, D.I. EEG frequency band analysis in chronic neuropathic pain: A linear and nonlinear approach to classify pain severity. Comput. Methods Programs Biomed. 2023, 230, 107349. [Google Scholar] [CrossRef] [PubMed]
- Gustin, S.M.; Bolding, M.; Willoughby, W.; Anam, M.; Shum, C.; Rumble, D.; Mark, V.W.; Mitchell, L.; Cowan, R.E.; Richardson, E.; et al. Cortical Mechanisms Underlying Immersive Interactive Virtual Walking Treatment for Amelioration of Neuropathic Pain after Spinal Cord Injury: Findings from a Preliminary Investigation of Thalamic Inhibitory Function. J. Clin. Med. 2023, 12, 5743. [Google Scholar] [CrossRef]
- Sarnthein, J.; Stern, J.; Aufenberg, C.; Rousson, V.; Jeanmonod, D. Increased EEG power and slowed dominant frequency in patients with neurogenic pain. Brain 2006, 129 Pt 1, 55–64. [Google Scholar] [CrossRef]
- Marder, E.; Bucher, D. Central pattern generators and the control of rhythmic movements. Curr. Biol. 2001, 11, R986–R996. [Google Scholar] [CrossRef]
- Scivoletto, G.; Ivanenko, Y.; Morganti, B.; Grasso, R.; Zago, M.; Lacquaniti, F.; Ditunno, J.; Molinari, M. Plasticity of spinal centers in spinal cord injury patients: New concepts for gait evaluation and training. Neurorehabil. Neural Repair 2007, 21, 358–365. [Google Scholar] [CrossRef]
- Ijspeert, A.J. Central pattern generators for locomotion control in animals and robots: A review. Neural Netw. 2008, 21, 642–653. [Google Scholar] [CrossRef] [PubMed]
- Rho, G.; Callara, A.L.; Bernardi, G.; Scilingo, E.P.; Greco, A. EEG cortical activity and connectivity correlates of early sympathetic response during cold pressor test. Sci. Rep. 2023, 13, 1338. [Google Scholar] [CrossRef] [PubMed]
- Roberts, T.T.; Leonard, G.R.; Cepela, D.J. Classifications In Brief: American Spinal Injury Association (ASIA) Impairment Scale. Clin. Orthop. Relat. Res. 2017, 475, 1499. [Google Scholar] [CrossRef]
- Sherwood, A.M.; Dimitrijevic, M.R.; Barry McKay, W. Evidence of subclinical brain influence in clinically complete spinal cord injury: Discomplete SCI. J. Neurol. Sci. 1992, 110, 90–98. [Google Scholar] [CrossRef]
- Wahlgren, C.; Levi, R.; Thorell, O.; Amezcua, S.; Thordstein, M. Prevalence of discomplete sensorimotor spinal cord injury as evidenced by neurophysiological methods: A cross-sectional study. J. Rehabil. Med. 2021, 53, jrm00156. [Google Scholar] [CrossRef]
- Parks, E.L.; Geha, P.Y.; Baliki, M.N.; Katz, J.; Schnitzer, T.J.; Apkarian, A.V. Brain activity for chronic knee osteoarthritis: Dissociating evoked pain from spontaneous pain. Eur. J. Pain 2011, 15, 843.e1–843.e14. [Google Scholar]

| Session | Limb Mov. | Stress | Engagement | Cold Feet | Additional Notes | |
|---|---|---|---|---|---|---|
| Initial (previous study) | 1 | No | No | Yes | No | N/A |
| 2 | No | No | Yes | No | N/A | |
| 3 | No | No | Yes | No | N/A | |
| 4 | No | No | Yes | No | N/A | |
| 5 | No | No | Yes | No | N/A | |
| 6 | No | No | Yes | No | N/A | |
| 7 | No | No | Yes | No | N/A | |
| 8 | No | No | Yes | No | N/A | |
| 9 | Yes: R | No | Yes | No | N/A | |
| 10 | Yes: L | No | Yes | No | N/A | |
| Final (present study) | 11 | No | Yes | Yes | No | Arrived late. Dry mouth. |
| 12 | No | No | Yes | No | Good news at work. Reported less pain. | |
| 13 | Yes: L | No/yes | Yes | Yes | Reported cold feet. Session interrupted to drink water. | |
| 14 | Yes: L | No | Yes | No | Reported lower pain levels at home. Movement started before the session. Reported having used a different mental strategy. | |
| 15 | No, then L (see notes) | Yes | Yes | Yes | Arrived very late and was slightly anxious. After the session, was placed in water scenario. Reported cold feet. Lower limb movements started. | |
| 16 | No | Yes | Yes | No | Anxious. Reported problems sleeping. Technical problems. | |
| 17 | No | Yes | No | No | Technical problems. | |
| 18 | Yes: L | No/yes | Yes | No | Light choking (saliva). Session interrupted. | |
| 19 | No | Yes | Yes | No | Moderate choking (saliva). Session interrupted. Participant taken to the emergency room for evaluation. | |
| 20 | Yes: L?R? | No | Yes | No | Movement started as soon as the participant entered the VR environment. Slightly anxious about the possibility of choking on saliva. Movement side not annotated in session notes. | |
| 21 | Yes: R, L/R, R | No | Yes | Yes | No change in scenario nor session interrupted due to cold feet (not uncomfortable). Right limb movement, but once presented alternated movement in both limbs. | |
| 22 | Yes: L | No | Yes | No | Movement amplitude increased throughout session. | |
| 23 | Yes: R | No/yes? | Yes | Yes | Movement amplitude increased throughout the session. Became uncomfortable with cold feet. | |
| 24 | Yes: L | No | Yes | No | Movements starting during acquisition phase. | |
| 25 | Yes: R | No | Yes | No | Small technical problem. | |
| 26 | No | Yes | Yes | No | Technical problems. Light choking (saliva). Session interrupted. | |
| 27 | No | Yes | Yes | No | Arrived very late. Light choking (saliva). Session interrupted. | |
| 28 | Yes: L | No | Yes | Yes | Reported cold feet. Not anxious about the possibility of chocking on saliva. | |
| 29 | No | Yes | No/yes | Yes | EEG failed. Instructed initially to not use motor imagery (no movement). Then, instructed to use motor imagery (reported cold feet, but no movements occurred). | |
| 30 | Yes: R | No | Yes | No | N/A [file with session notes lost] | |
| 31 | Yes: L/µR | No | Yes | No | Small technical problem. Left lower limb with micro-movements on the right. | |
| 32 | Yes: µR | No | Yes | No | Micro-movements on the right lower limb. | |
| 33 | No | Yes? | No? | Yes | Reported cold feet. Was worried about travelling on the following day. | |
| 34 | Yes: L/µR | No/yes? | No? | No | Left limb macro-movements with amplitude increasing throughout the session. Micro-movements on the right lower limb. Halfway reported that sweat was distracting him from the task (30 °C outside). |
Disclaimer/Publisher’s Note: The statements, opinions and data contained in all publications are solely those of the individual author(s) and contributor(s) and not of MDPI and/or the editor(s). MDPI and/or the editor(s) disclaim responsibility for any injury to people or property resulting from any ideas, methods, instructions or products referred to in the content. |
© 2024 by the authors. Licensee MDPI, Basel, Switzerland. This article is an open access article distributed under the terms and conditions of the Creative Commons Attribution (CC BY) license (https://creativecommons.org/licenses/by/4.0/).
Share and Cite
Pais-Vieira, C.; Figueiredo, J.G.; Perrotta, A.; Matos, D.; Aguiar, M.; Ramos, J.; Gato, M.; Poleri, T.; Pais-Vieira, M. Activation of a Rhythmic Lower Limb Movement Pattern during the Use of a Multimodal Brain–Computer Interface: A Case Study of a Clinically Complete Spinal Cord Injury. Life 2024, 14, 396. https://doi.org/10.3390/life14030396
Pais-Vieira C, Figueiredo JG, Perrotta A, Matos D, Aguiar M, Ramos J, Gato M, Poleri T, Pais-Vieira M. Activation of a Rhythmic Lower Limb Movement Pattern during the Use of a Multimodal Brain–Computer Interface: A Case Study of a Clinically Complete Spinal Cord Injury. Life. 2024; 14(3):396. https://doi.org/10.3390/life14030396
Chicago/Turabian StylePais-Vieira, Carla, José Gabriel Figueiredo, André Perrotta, Demétrio Matos, Mafalda Aguiar, Júlia Ramos, Márcia Gato, Tânia Poleri, and Miguel Pais-Vieira. 2024. "Activation of a Rhythmic Lower Limb Movement Pattern during the Use of a Multimodal Brain–Computer Interface: A Case Study of a Clinically Complete Spinal Cord Injury" Life 14, no. 3: 396. https://doi.org/10.3390/life14030396