Article

Synthetic Light Curve Design for Pulsating Binary Stars to Compare the Efficiency in the Detection of Periodicities

by
Aldana Alberici Adam
1,*,†,
Gunther F. Avila Marín
2,
Alejandra Christen
2 and
Lydia Sonia Cidale
1,3
1
Instituto de Astrofísica de La Plata, La Plata B1900FWA, Argentina
2
Instituto de Estadística, Universidad de Valparaíso, Valparaíso 2340000, Chile
3
Facultad de Ciencias Astronómicas y Geofísicas, La Plata B1900FWA, Argentina
*
Author to whom correspondence should be addressed.
Current address: Observatorio Astronómico, Paseo del Bosque, La Plata B1900FWA, Argentina.
Galaxies 2023, 11(3), 69; https://doi.org/10.3390/galaxies11030069
Submission received: 25 March 2023 / Revised: 19 May 2023 / Accepted: 22 May 2023 / Published: 31 May 2023
(This article belongs to the Special Issue Theory and Observation of Active B-type Stars)

Abstract

:
B supergiant stars pulsate in regular and quasi-regular oscillations resulting in intricate light variations that might conceal their binary nature. To discuss possible observational bias in a light curve, we performed a simulation design of a binary star affected by sinusoidal functions emulating pulsation phenomena. The Period04 tool and the WaveletComp package of R were used for this purpose. Thirty-two models were analysed based on a combination of two values on each of the k = 6 variables, such as multiple pulsations, the amplitude of the pulsation, the pulsation frequency, the beating phenomenon, the light-time effect, and regular or quasi-regular periods. These synthetic models, unlike others, consider an ARMA (1, 1) statistical noise, irregular sampling, and a gap of about 4 days. Comparing Morlet wavelet with Fourier methods, we observed that the orbital period and its harmonics were well detected in most cases. Although the Fourier method provided more accurate period detection, the wavelet analysis found it more times. Periods seen with the wavelet method have a shift due to the slightly irregular time scale used. The pulsation period hitting rate depends on the wave amplitude and frequency with respect to eclipse depth and orbital period. None of the methods was able to distinguish accurate periods leading to a beating phenomenon when they were longer than the orbital period, resulting, in both cases, in an intermediate value. When the beating period was shorter, the Fourier analysis found it in all cases except for unsolved quasi-regular periods. Overall, the Morlet wavelet analysis performance was lower than the Fourier analysis. Considering the strengths and disadvantages found in these methods, we recommend using at least two diagnosis tools for a detailed time series data analysis to obtain confident results. Moreover, a fine-tuning of trial periods by applying phase diagrams would be helpful for recovering accurate values. The combined analysis could reduce observational bias in searching binaries using photometric techniques.

1. Introduction

Observational surveys of massive stars of spectral type O show that most are forming binary systems [1,2,3]. Studies carried out in the region of 30 Dor also show that the binarity frequencies among dwarf and giant B-type stars agree with those of the O-type stars [4,5]. However, in contrast with the high binary incidence among dwarf massive stars, binary systems with B supergiant components are very rare. Barbá et al. [6] reported a noticeable sharp drop in the number of spectroscopic binaries between the supergiants of spectral types O9.7 and B0. These authors attributed this peculiarity to observational bias but suggested also discussing the action of possible evolutive scenarios such as binary mergers, binary disruptions, etc., to explain this effect.
On the other hand, massive stars pulsate in regular and quasi-regular (strange modes) oscillations (cf. [7]). They may show β Cephei type modes (low-order p and g modes) and Slowly Pulsating B (SPB) type variability (high-order g modes) [8,9]. Strange modes might also be excited with long periods, of the order of hours or days [10,11,12,13]. The pulsation mechanism is, in general, well understood (e.g., the κ mechanism, ϵ mechanism, or strange-mode instabilities) but for other groups, such as the γ Dor stars, roAp stars, and S Dor stars, no consensus has yet been reached [14]. These pulsations are revealed by photometric variations that can be identified by asteroseismological methods, while in the stellar spectrum, they generate variability in the broadening of the line profiles [15,16]. However, when pulsating stars are found in binary systems, their luminosity variations are modulated by the orbital motion [17]. This is the light-time effect, equivalent to a periodic Doppler shift of the pulsation frequency. Therefore, these effects generate complex patterns in the light curves that could make it difficult to detect or estimate periods or even conceal a binary detection.
The importance behind the detection of pulsating stars in massive binary systems lies in their impact on the study of the mass discrepancy problem, the theory of stellar interiors, and the verification of stellar evolution models [18], as they allow the masses of each component to be measured accurately and independently.
The search for periodicities is one of the most basic tasks in time series data analysis. It is a crucial feature for classifying variable stars and deriving stellar parameters. It is usually solved using an estimation function called a periodogram. Various types of periodograms are used in practice; for example, the Lomb–Scargle periodogram [19,20] is a known algorithm for detecting periodic signals in unevenly and regularly sampled time series. When periodic or quasi-periodic fluctuations arise in an interrupted or transient event [21], the wavelet transform is well suited for detecting changes in the parameters of signals due to its characteristic of focusing on a limited time interval of the data [22]. Nevertheless, the wavelet analysis is appropriate for time series with regular sampling. Today this problem has been partially addressed since satellite missions (Kepler, TESS, among others) provide photometric data of pulsating stars and binary systems with almost fixed cadences of a few seconds or minutes. Hence, using techniques for regularly sampled data is pertinent in this context [21,23,24,25].
On the other hand, it is well-known that power spectra can often be misleading. The performance of many different methods for period detection and estimation in light curves has been tested in the literature, for example by Graham et al. [26]. Those authors examined a huge number of sources from three datasets (CRTS, MACHO, ASAS) and ran the data through eleven different algorithms such as the Fourier transform, Lomb–Scargle, phase dispersion minimisation, among others. The study of different observed light curves showed that, at best, period-finding algorithms could retrieve the period of a regularly periodic object with a reasonable degree of accuracy in only about 50 % of cases. However, the situation is much worse for stellar objects with semi-periodic, quasi-periodic or multi-periodic variability; typically, only around 10– 20 % of the cases are the periods successfully recovered, evidencing the low level of accuracy for most of the methods, as shown in Figure 19 given by Graham et al. [26]. Although the authors performed an excellent comparative study among many methods for period searching, it still has the disadvantage that the authentic periods of the signal could be miss-detected because, even when they are accurate, they might be inexact. Based on this weakness, it is necessary to explore simulation designs for which the true values of the periods are known but compare the performance of a method not analysed in the above work, such as wavelet analysis, with the revisited Fourier analysis. This is the primary goal of the work.
In addition, one of the usual drawbacks when analysing observed data is the noise level of the signal, which generates consequently noisy periodograms. Thus, specific peaks in a periodogram might be spurious and not due to the presence of any real periodic phenomena [27,28]. Other drawbacks can also arise, for example, when the sample data are not evenly spaced in time. This situation is very frequent in the case of astronomical observations, where the data are out of phase in time due to various natural phenomena. It is well known that these non-equispaced data produce the so-called alias [29], i.e., false periods, where it is difficult to discern which peak of the periodogram is the real one and which is its alias. Unfortunately, simple and rigorous methods are unavailable to solve the alias discrimination task. In practice, we need to have prior information about the phenomenon under investigation to discuss the number and reliability of the possible periods. For example, for binary systems, the half period is often the most significant peak in a periodogram [26].
In summary, for a thorough analysis of the light curves of massive stars, it is necessary to have (i) a valid mathematical model to describe the time series, (ii) a period analysis tool that supports the detection of variable frequencies, and (iii) a homogeneous time distribution of the data to ensure a stable solution. Although the Fourier transformation provides a confident signal frequency spectrum, we often lose information about when this frequency happens. An alternative method is the wavelet analysis [30,31,32] that allows searching for local periods in a given window of time to obtain both frequency and time resolution.
In this work, we proposed to use a simulation design developed to study how different periodic or quasi-periodic simulated phenomena are reproduced in a wavelet analysis scalogram and a Fourier periodogram. For comparison purposes, we generated multi-periodic synthetic light curves (with pre-fixed periods) for a binary system with a pulsating companion. These synthetic models, unlike others, consider a statistical noise, a gap, and a slightly irregular sampling. In addition, phenomena such as beating and light time effects were also emulated. We obtained surprising and interesting results that will be useful in future studies of the periodicities of light curves and which have possible implications for the low incidence rate of binary systems among B supergiants.
Section 2 introduces the simulation design by detailing the variables and their features. Section 3 briefly describes the time series analysis methods used. Section 4 shows the results obtained from the wavelet and Fourier analyses. Section 5 discusses our results in the context of the expected objectives and future work. Finally, Appendix A shows the complete frequency list for each model and all the periodograms resulting from the Fourier analysis. Appendix B shows the list of periods detected for the synthetic light curves with the wavelet analysis and the power spectrum for each one.

2. Simulation Design

In statistics, the area of experimental designs is concerned with finding the design that best helps to determine and study the factors that influence a given variable. There are many different types of designs: the factorial, fractional factorial, block, Latin square, and nested designs, among others [33,34]. Factorial designs are those in which experiments corresponding to all possible combinations of the “levels” or values of the factors or measurements of interest are carried out. The 2 k designs are factorial designs with k factors or variables for which only two levels or values are considered for each. These designs with few values for each factor are often used when it is desired to determine which factors are affecting a certain process or phenomenon. Extreme values of quantitative variables (such as temperature or concentration) or extreme categories of qualitative variables (such as the presence-absence of an attribute, among other possibilities) are considered for the levels. This type of design makes it possible to determine which factors or variables really influence the change or variation of the process or phenomenon. They are used in the first stage of the study when many variables are known about a process, and it is desired to determine its most influential factors. Once the relevant factors have been determined, it is possible to move on to a more exhaustive design, which considers more levels or values for each factor or even a more complex design. Each power-of-2 design considers 2 k different runs, which can be a considerable amount depending on the number k. Because it is not always feasible to perform 2 k experiments or runs, one can consider fractional factorial designs (e.g., 2 k p ), which consist of running only a fraction of the total amount of runs given by 2 k / 2 p . Therefore, it is important to optimally select this fraction. For this purpose, the fraction of the design is chosen in a way that allows obtaining a complete factorial design when p factors are discarded, for instance, because they are considered negligible after running the experiment. In this case, the number of factors p to be removed agrees with the power p in the denominator of 2 k / 2 p . This methodology is based on the belief that if one considers a large number of variables, only a smaller number is relevant, and it does not produce significant variations in the phenomenon. In a later step, the remaining executions could be carried out to obtain a complete 2 k design.
One of the most important uses of fractional factorial experiments is in factor- screening1 [33,34]. Furthermore, one of the benefits of using a statistical methodology is to be able to have hypothesis tests that will give us ways to quantify the significance of the findings. In this work, a fractional factorial design was used to establish the models to be simulated and underlined through Fourier and wavelet analysis. The design is detailed in the following section.

Designs of Synthetic Light Curves

In this stage, instead of performing a real experiment, we considered using numerical simulations of light curves to know in advance the result that we should find and thus be able to make a diagnosis of the goodness of each of the methods, Fourier analysis and wavelet analysis, to be used to detect periodicity. In the context of this research, we performed the simulations of synthetic light curves of a pulsating star in an eclipsing binary system. To build them, we used the photometric data of a known binary, HD 19,356, obtained by the TESS (Transiting Exoplanet Survey Satellite) mission [35] with a temporal resolution of 120 s and a gap of about 4 days. Then, to obtain the synthetic light curve, we modelled the data with the software PHOEBE (PHysics Of Eclipsing BinariEs) [36,37], adopting the orbital period of 2.87 days corresponding to the selected binary system [38]. The resulting synthetic curve, referred to as model No. 0, is shown in Figure 1. This model will be the basis for the complete simulation design.
As the time series of many physical processes show stochastic and auto-correlated properties [39,40], we contaminated the synthetic curves with an ARMA (1, 1) noise [41]. Simulations of light curves with ARMA noise have already been used by authors such as Caceres et al. [40], Caceres et al. [42] to study different phenomena, such as exoplanetary transits. According to these authors, autoregressive modelling is more effective after minimising systematic variations due to instrumental or atmospheric conditions. Alberici [37] performed numerical simulations of light curves with three different types of stochastic processes to model noise: two stationary, a Gaussian process (white noise), an ARMA (1, 1) process (dependent of the past), and a non-stationary GARCH (1, 1) process (also dependent of the past). This author independently tested the Fourier and wavelet analysis and found no difference among the diverse types of noise models when they were analyzed with the same techniques.
Therefore, according to Alberici [37] and Caceres et al. [40], Caceres et al. [42], we opted for using an ARMA (1, 1) noise model, which has some dependence on the prior values, for the random fluctuation of the star luminosity [40]. The ARMA processes were used in this work to model the synthetic light curves, considered without systematic effects. The magnitude of the variability of the ARMA process was determined at a low value for simplicity, and it is left for future work to perform a study with higher variability of the noise process (i.e., where the variability of the luminosity could affect the detection of the binary star eclipse or pulsations, for example).
Therefore, a simulation design was planned with six variables and two categories (factors) each, defined as follows:
1.
Beating phenomenon ( X 1 ).
Beating is the periodic variation in amplitude at a certain wave point due to the superposition of two waves having slightly different frequencies f i and f j , producing a time disturbance between constructive and destructive interference. For simplicity, we considered two waves of equal amplitude, A, and wave number, k, but with slightly different angular frequencies:
y i ( x , t ) = A c o s ( k x ω i t ) , y j ( x , t ) = A c o s ( k x ω j t ) .
The resulting wave is the sum of y i + y j , which gives
y ( x , t ) = 2 A c o s ω i ω j 2 t c o s k x ω i + ω j 2 t ,
where
ω = 2 π f .
Simulations with and without beating phenomena were considered.
2.
Period of the pulsation ( X 2 ).
In this variable, we explored the effects on the light curve considering regular pulsation cycles with a period longer or shorter than the binary’s orbital period.
3.
Amplitude of the pulsation with respect to the depth of the primary eclipse ( X 3 ).
Two categories were considered for this variable. The first is that the pulsation amplitude is 20% of the depth of the primary eclipse, which we call a large amplitude. The second is that the pulsation amplitude is 4% of the depth of the primary eclipse, referred to as a small amplitude. The values of the amplitudes of the pulsations were chosen in this way because they agree with those observed in TESS light curves of some pulsating binary stars [43].
4.
Number of pulsation periods ( X 4 ).
Scenarios where the light curve is affected by simultaneously one or two pulsation periods were considered.
5.
Light-time effect ( X 5 ).
This scenario considers a star in a binary system that pulsates sinusoidally with a single frequency. Its luminosity varies with time as a consequence of this pulsation. However, the orbital motion of the star leads to a periodic variation of the distance between the observer and the star, so the phase of the observed luminosity variation also varies with the orbital period [17]. The light-time effect leads to frequency multiplets in the Fourier spectra for pulsating binary stars. To model this effect in our synthetic light curves, we relied on the simplest case of a pulsating binary star with a circular orbital motion. Furthermore, to emulate the splitting of the pulsation period, we proceeded to affect the curve with three sinusoidal pulsations: the intrinsic pulsation frequency of the star and two additional oscillation frequencies due to the light-time effect, where the spacing between each of them and the intrinsic frequency of the pulsation is equal to the orbital frequency (for more details see [17]).
Let P o be the orbital period of the star and P p the period of the pulsation, then the multiple components of the luminosity variations will have the following frequencies:
f + = 1 P o + 1 P p , f = 1 P o 1 P p .
Furthermore, the amplitudes and phases of the multiple components can be used to derive meaningful information about the orbital elements and the radial velocity curve. Scenarios with and without the light-time effect were considered in this work.
6.
Quasi-regular pulsations ( X 6 ).
Let us now consider a set of harmonic oscillators. Periodic motion means that there must be some time τ at which all the different oscillators have completed an integer number of cycles, i.e.:
ω 0 τ = 2 π n 0 , ω 1 τ = 2 π n 1 , ω 2 τ = 2 π n 2 ,
This means that all n k are integers; therefore, the quotient ω i / ω j must be a rational number. If, by contrast, it is irrational, any oscillator i or j might not complete an integer number of cycles in the time τ , giving rise to quasi-periodic pulsations (QPP). This kind of behaviour is a common feature in the solar atmosphere and flare stars where the flaring energy is released by magnetic reconnection (cf. [44]). Quasi-periodic pulsations are also observed in the α Cyg variables and are attributed to strange-mode oscillations [45,46]. A star oscillating with some periodic phenomenon would appear in a power spectrum as a peak at precisely that frequency (Dirac- δ function). Otherwise, it will appear as a broader (sometimes Lorentz-shaped) peak.
Simulations with and without quasi-regular periods were considered.
Since we have defined X i variables (with i = 1 , , 6 ) and each has two levels or categories, the total design is 2 6 = 64 models. Since the design is optimal, we can consider only a fraction of the total design without losing information about the variables involved. Thus, in this work, we analysed 2 6 / 2 1 = 32 models. The design parameter model is defined in Table 1.

3. Time Series Analysis Methods

Signals were differentiated into stationary and non-stationary. The first ones were localised in the time since their frequencies did not vary. The spectral analysis of this type of signal was carried out using the Fourier transform, which allows its decomposition into infinite sinusoidal terms, transforming the signal from the time base to the frequency base and back again. When switching from the frequency domain to the time domain, valuable information is lost, which, due to the stationary nature of the signal, is irrelevant. However, in non-stationary signals, i.e., those whose frequencies vary with time, the loss of information becomes very relevant, and it is difficult to determine when a frequency change occurs [47]. This is why wavelet analysis is presented as a tool to obtain a detailed decomposition and reconstruction of signals with abrupt changes, using a multi-resolution analysis with windows of a variable length adapted to the change in frequency of the signal. This is the main property of the wavelet, as it minimises the computational cost of the analysis by not needing infinite terms. Moreover, it improves the detail of the detection by allowing the use of long time intervals in those segments where greater precision is required at low frequencies and smaller intervals where information is required at high frequencies. Unlike Fourier, where the basis functions are sines and cosines of infinite length, in the wavelet analysis, the basis functions are localised functions in frequency and time [48]. Thus, they are a suitable method for studying quasi-regular, transient and discontinuous phenomena, such as light curves of binary stars.
The software used to carry out data analysis are detailed below.

3.1. The Period04 Tool

The Period04 tool [49] is a hybrid program, written in Java and C++, dedicated to the statistical analysis of large astronomical time series which contain gaps or missing data over a significant time interval. The program allows the extraction of individual frequencies from the multi-periodic content of the time series through an analysis based on the Discrete Fourier Transform (DFT). The light curves were fitted using the formula:
χ ( t ) = Z + A i sin [ 2 π ( f i t + ϕ i ) ] ,
where Z is the zero-point, A i is the amplitude, f i is the frequency, and ϕ i is the corresponding phase.

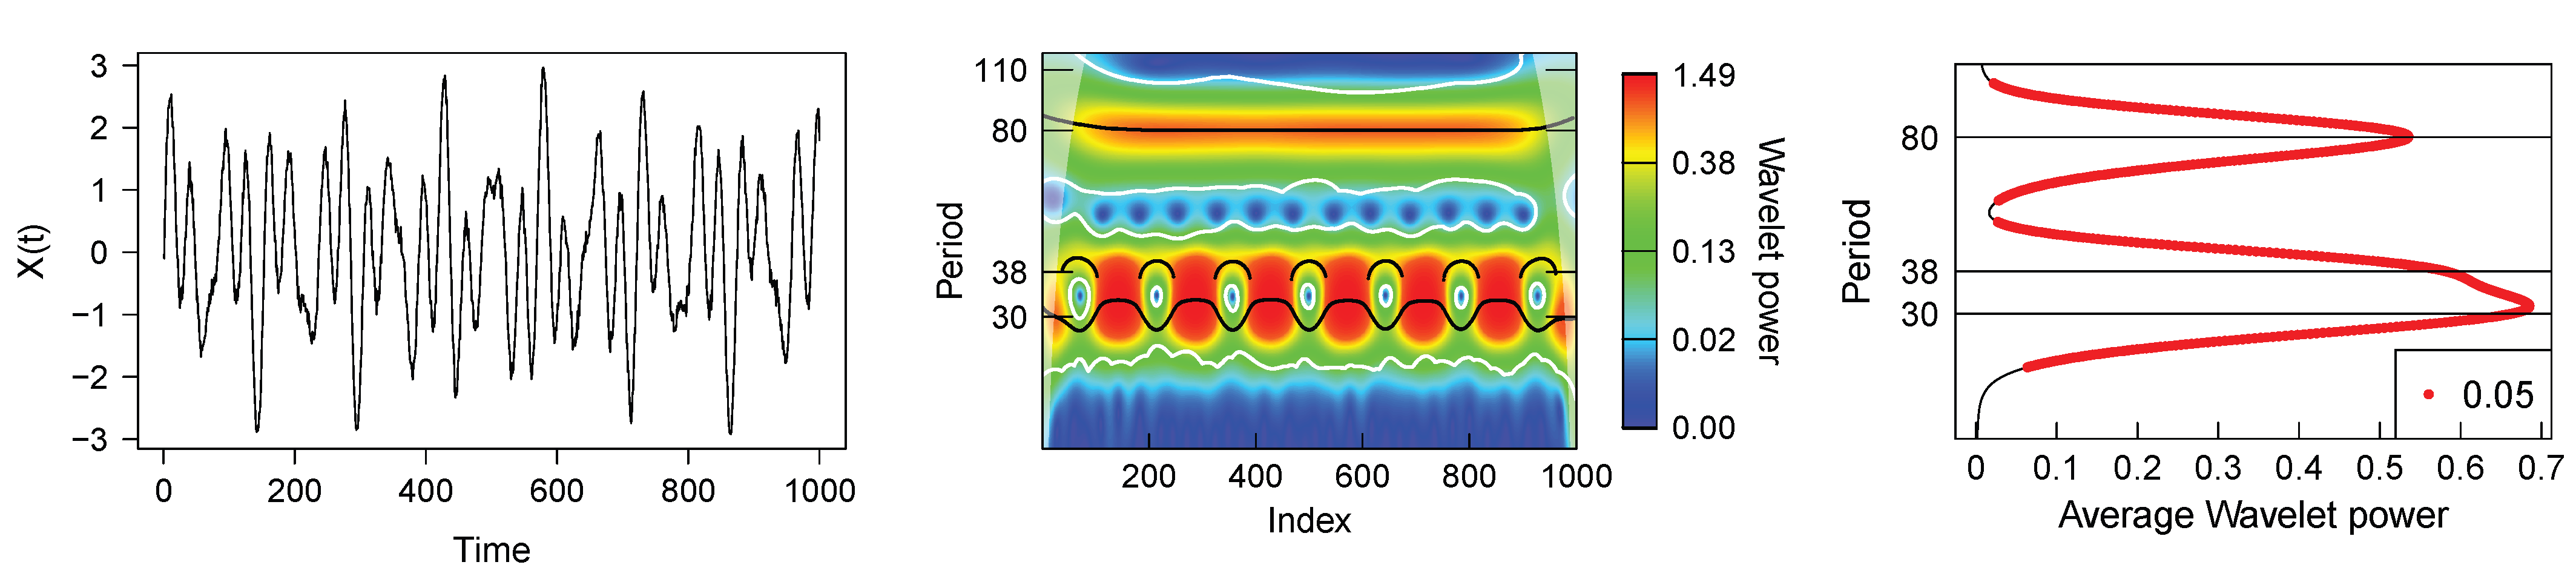
3.2. The WaveletComp Package

WaveletComp is an R package [50,51,52] for continuous time series analysis based on the Morlet wavelet family [32]. This family of wavelets leads to a wavelet transform of the time series. The transform can be separated into real and imaginary parts, thus providing information about the local amplitude and instantaneous phase of any periodic process over time.
The Morlet “mother” wavelet [32], in the version implemented by WaveletComp, is:
ϕ ( t ) = π 1 / 4 e i ω t e t 2 / 2 .
In this frame, the angular frequency ω is set to 6 [51], therefore the relation between the wavelet scale, a obtained with wavelet analysis, and the “equivalent Fourier period” [53] is given by:
1 f = 4 π a ω + 2 + ω 2 ,
where
1 f 1.033 a if ω = 6 .
This correction is given directly by the WaveletComp package.
The Morlet wavelet transform of a time series f ( t ) is defined as the convolution of the series with a set of “daughter wavelets” generated by the mother wavelet through translations in time, τ , and dilatations in frequency, a, being:
W ( τ , a ) = x t 1 a ϕ * ( t τ a ) ,
where ϕ * denotes the complex conjugate function.
The local amplitude of any periodic component of the series can be expressed as:
Ampl ( τ , a ) = 1 a W ( τ , a ) .
Then, the square of the amplitude can be interpreted as the energy density of the wave in the time-frequency domain and is called the wavelet power spectrum:
Power ( τ , a ) = 1 a 2 W ( τ , a ) 2 .
This power spectrum is represented by a scalogram, see Figure 2, where a color code, from blue (low power) to red (high power), is used to indicate the power spectrum range. Maximum probability values are represented with black lines. White lines delimit probability regions with a 0.1 significance level against a white noise null. The WaveletComp package returns by default a scalogram whose axes are period vs index (ordinate and abscissa, respectively), where index refers to the amount of data in the time series and is directly related to the time axis of the series. More information can be obtained from the average wavelet power over time, which will depend on how many cycles a certain period completes in the series and not only on the magnitude of the wavelet power. The red curve represents values with a significance level less than or equal to 0.05, all of which differ from white noise. The values with the highest average powers indicate the most relevant periods for the signal. A practical example of wavelet analysis for multi-periodic time series with periods 30, 38, and 80 is shown in Figure 2. Periods 30 and 38 generate a beating effect in the series due to their proximity. All periods with higher power are detected with solid black lines in the scalogram, and the significance decreases towards nearby periods. The color code on the right-hand sidebar indicates a higher significance for the period 30 and decreases until the period 80 (see central panel). This is due to the number of cycles each period completes in the time range of the series. In the right panel, on the average wavelet power plot, periods 30 and 38 are more difficult to identify individually, unlike period 80, although they show a striking feature in the scalogram over the entire timeline identifying the presence of the beating. The results show the mixing effect produced in power obtained with the wavelet analysis for nearby periods. In agreement with the power spectrum, the maximum average wavelet power is around period 30 and decreases for longer periods.
Estimating the spectral power using the continuous wavelet transform of a non-periodic time series can generate false spectral structures at the beginning and the end of the wavelet spectrum [54]. This is a known problem in the periodogram analysis caused by replacing the integrals over an infinite continuous signal by finite sums [55]. The “zero padding” method is used to solve this problem, which completes with zero values on both edges of the time series after a sample mean is removed. Then, the wavelet spectrum is estimated [53,54]. One of the drawbacks of applying this method is that it produces discontinuities at the edges of the wavelet spectrum. The region of the wavelet spectrum where padding effects become important is known as the cone of influence (COI) [53]. Therefore, the portions of the wavelet spectrum between the time axis and the COI should be considered unreliable because statistical significance tests in that region cannot be trusted [53,56]. Additionally, wavelet analysis performed with the WaveletComp package can only produce accurate results if the time series is equispaced.

3.3. Period Detection Criteria

To identify the periods detected with both tools in the synthetic light curves, the following selection criteria were established:
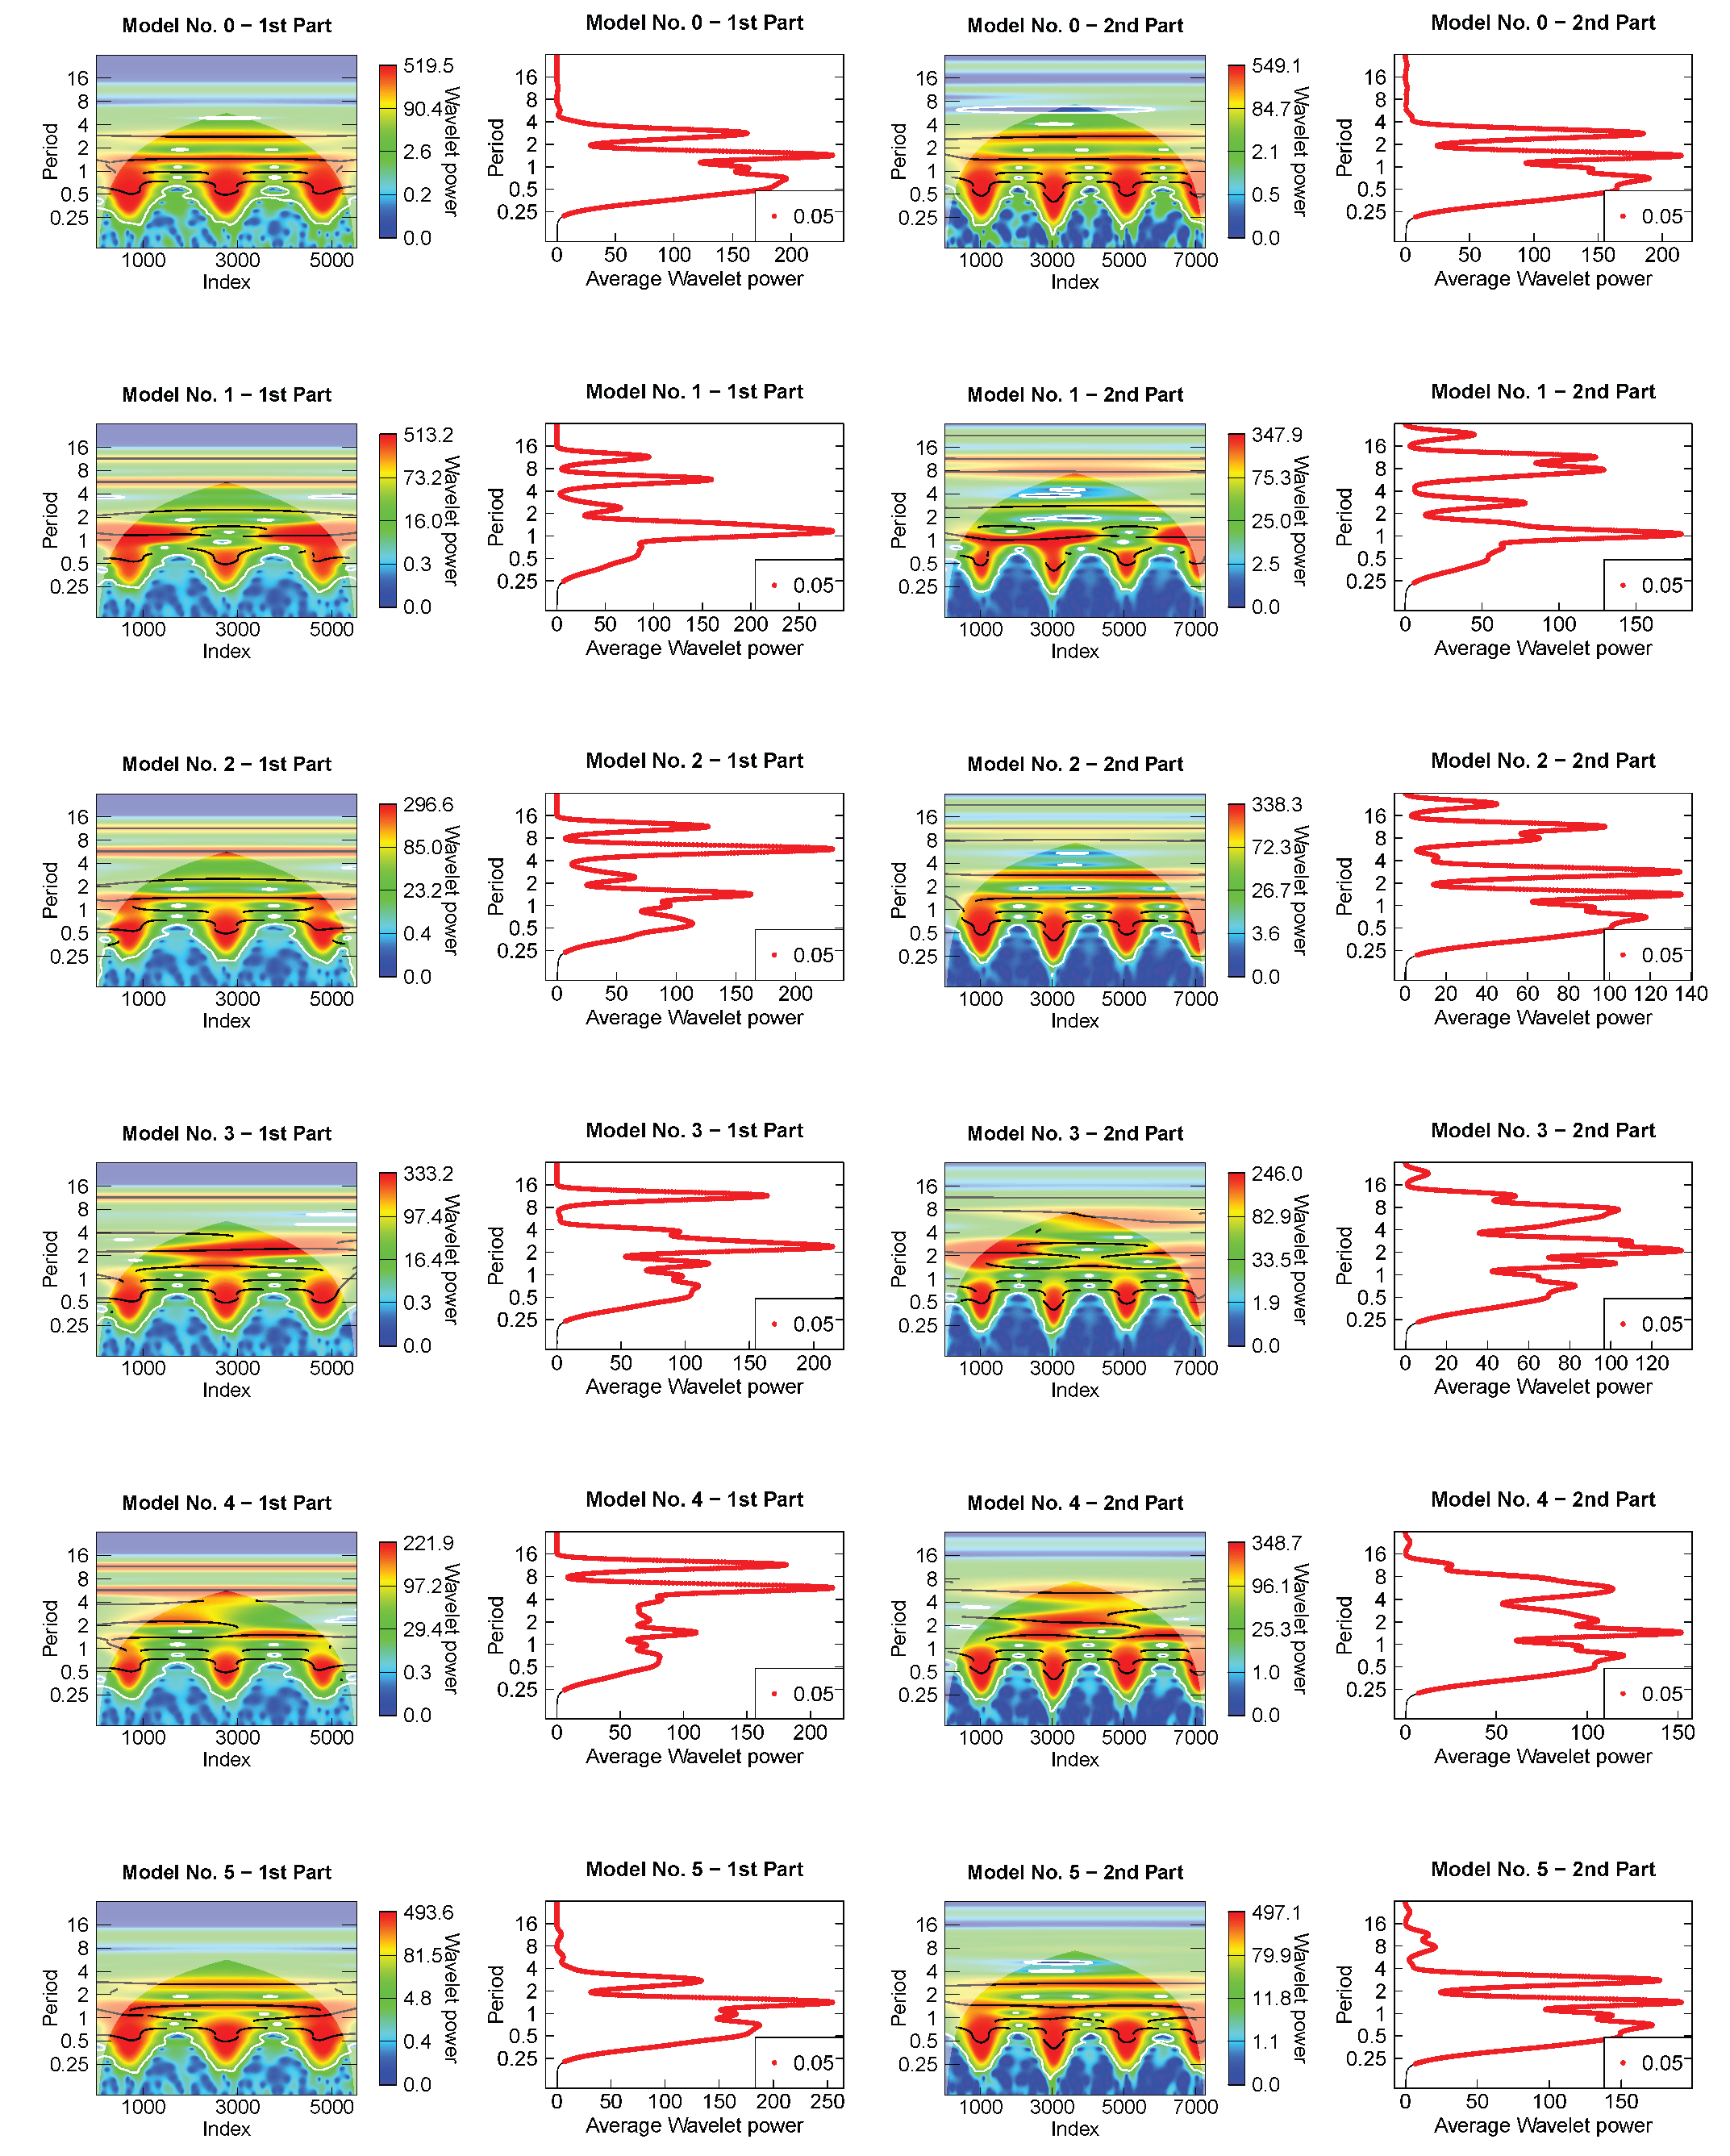
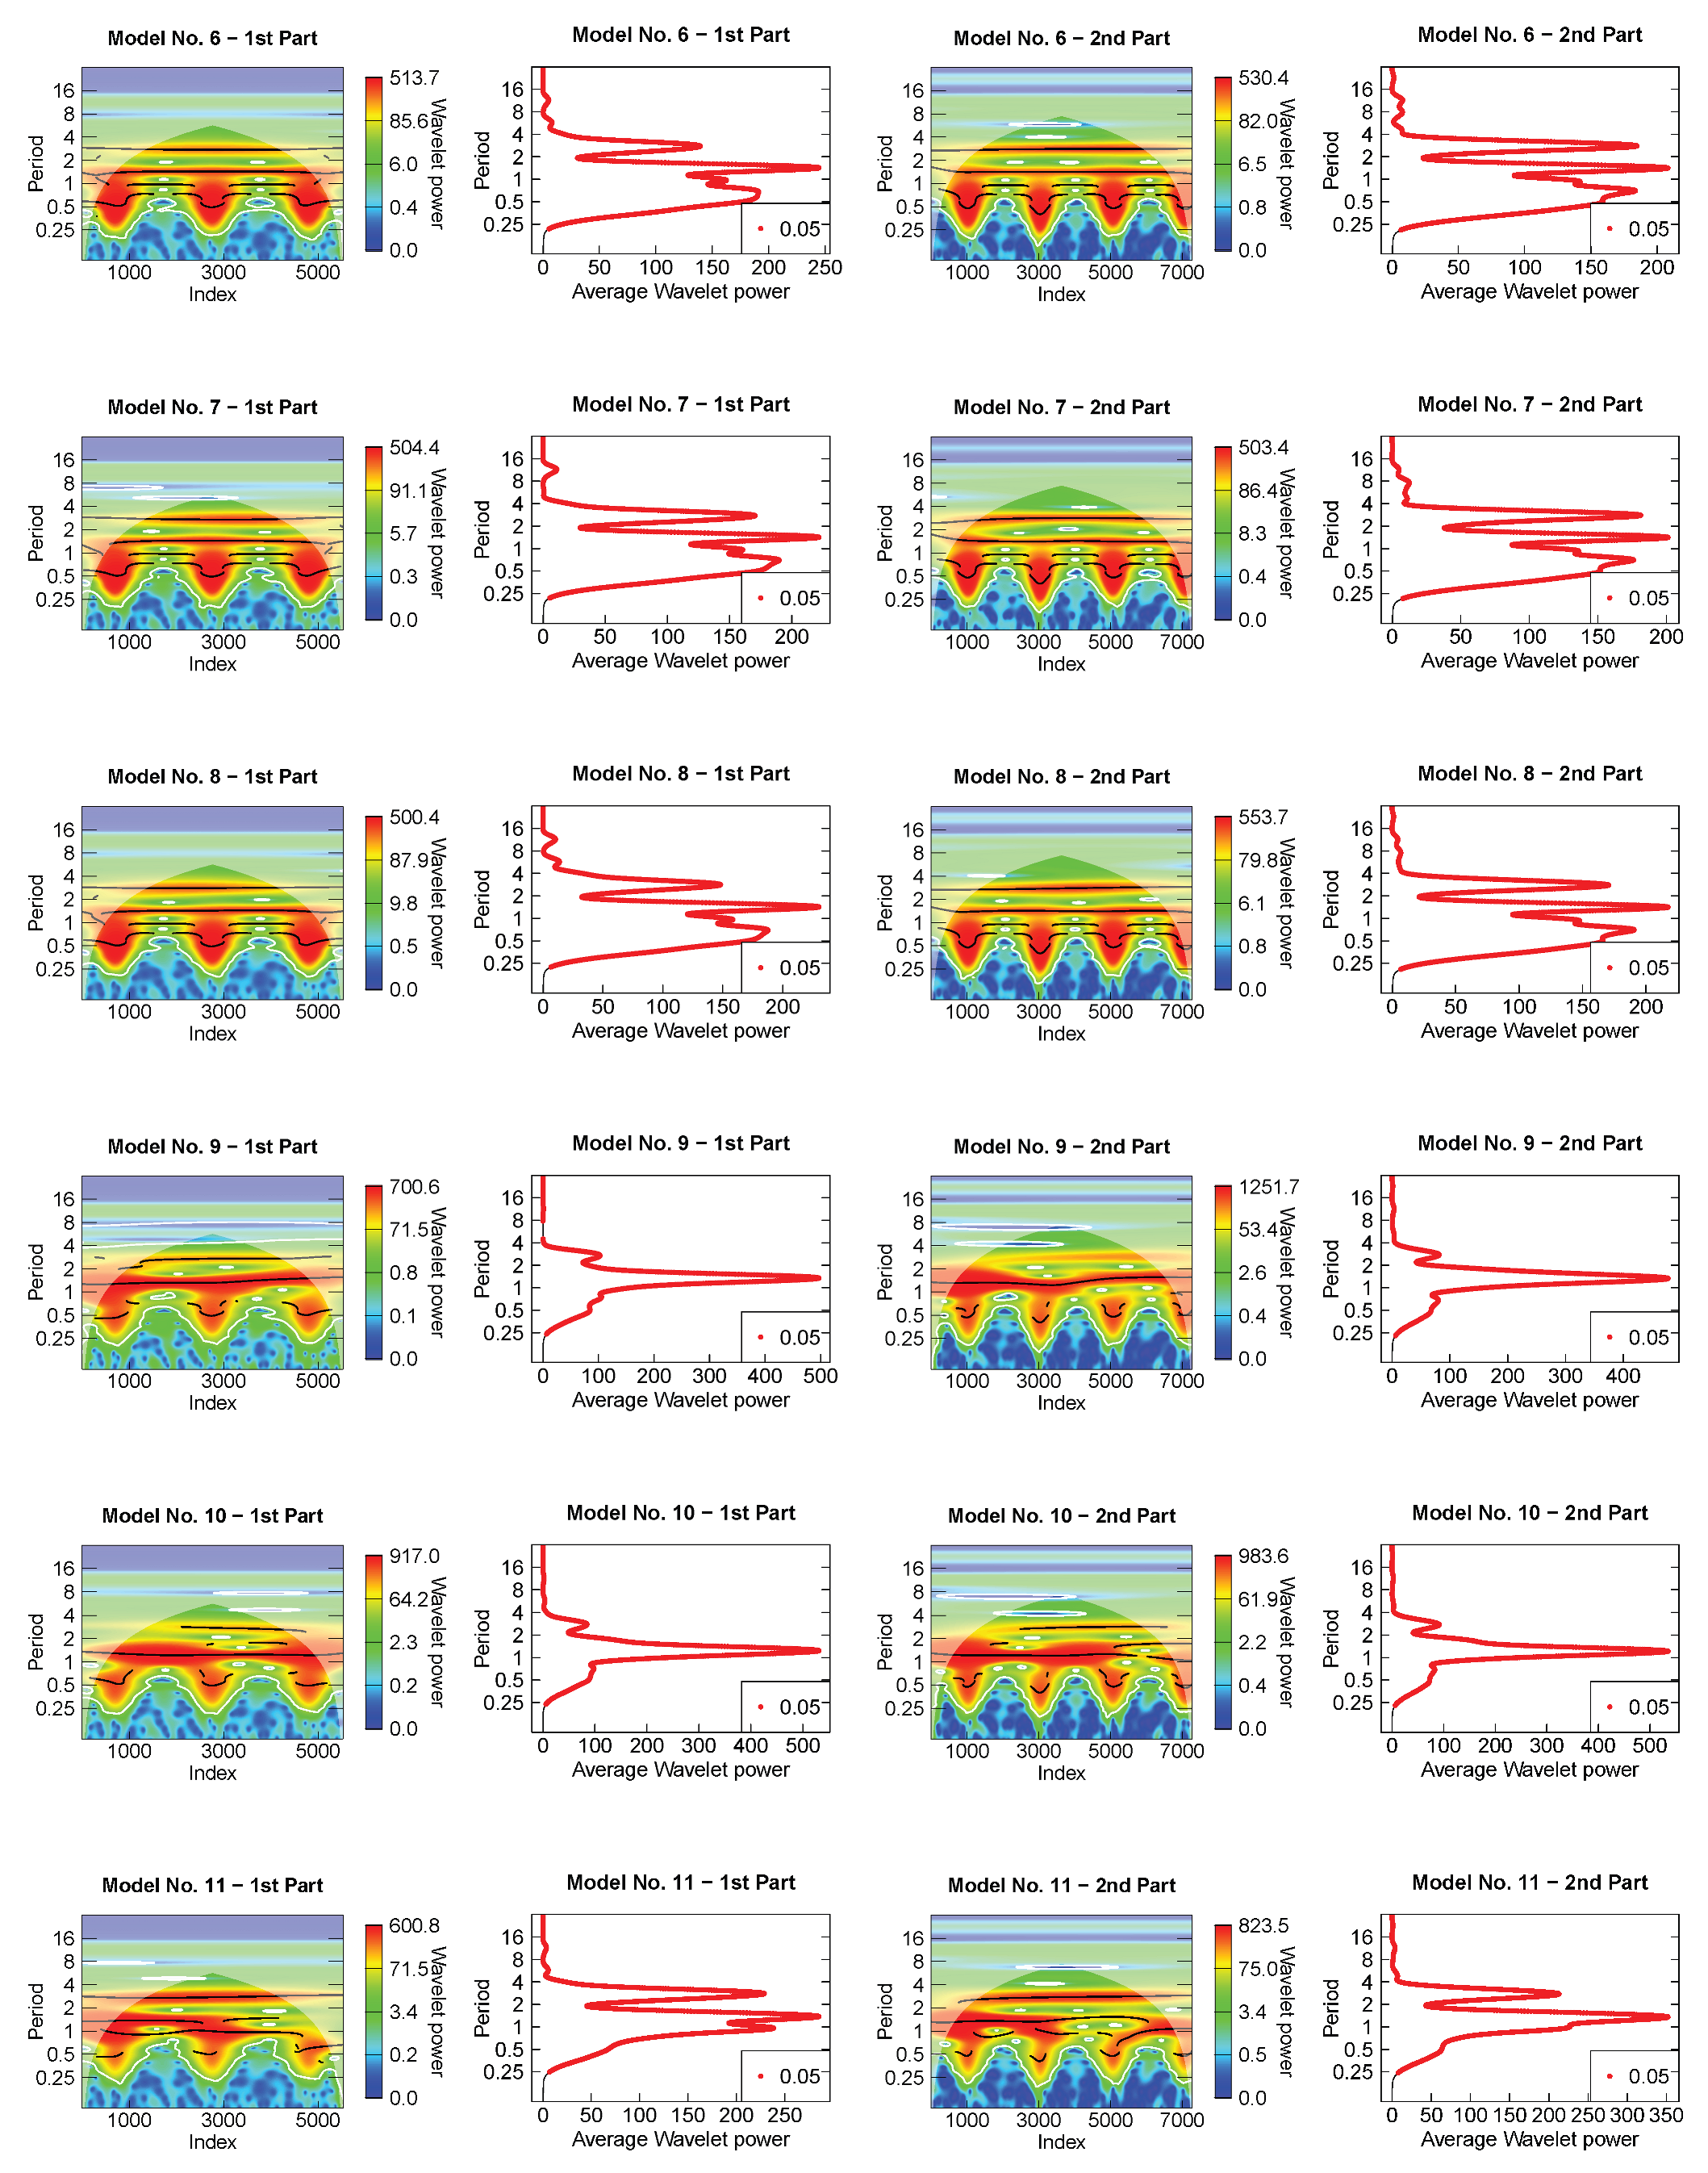
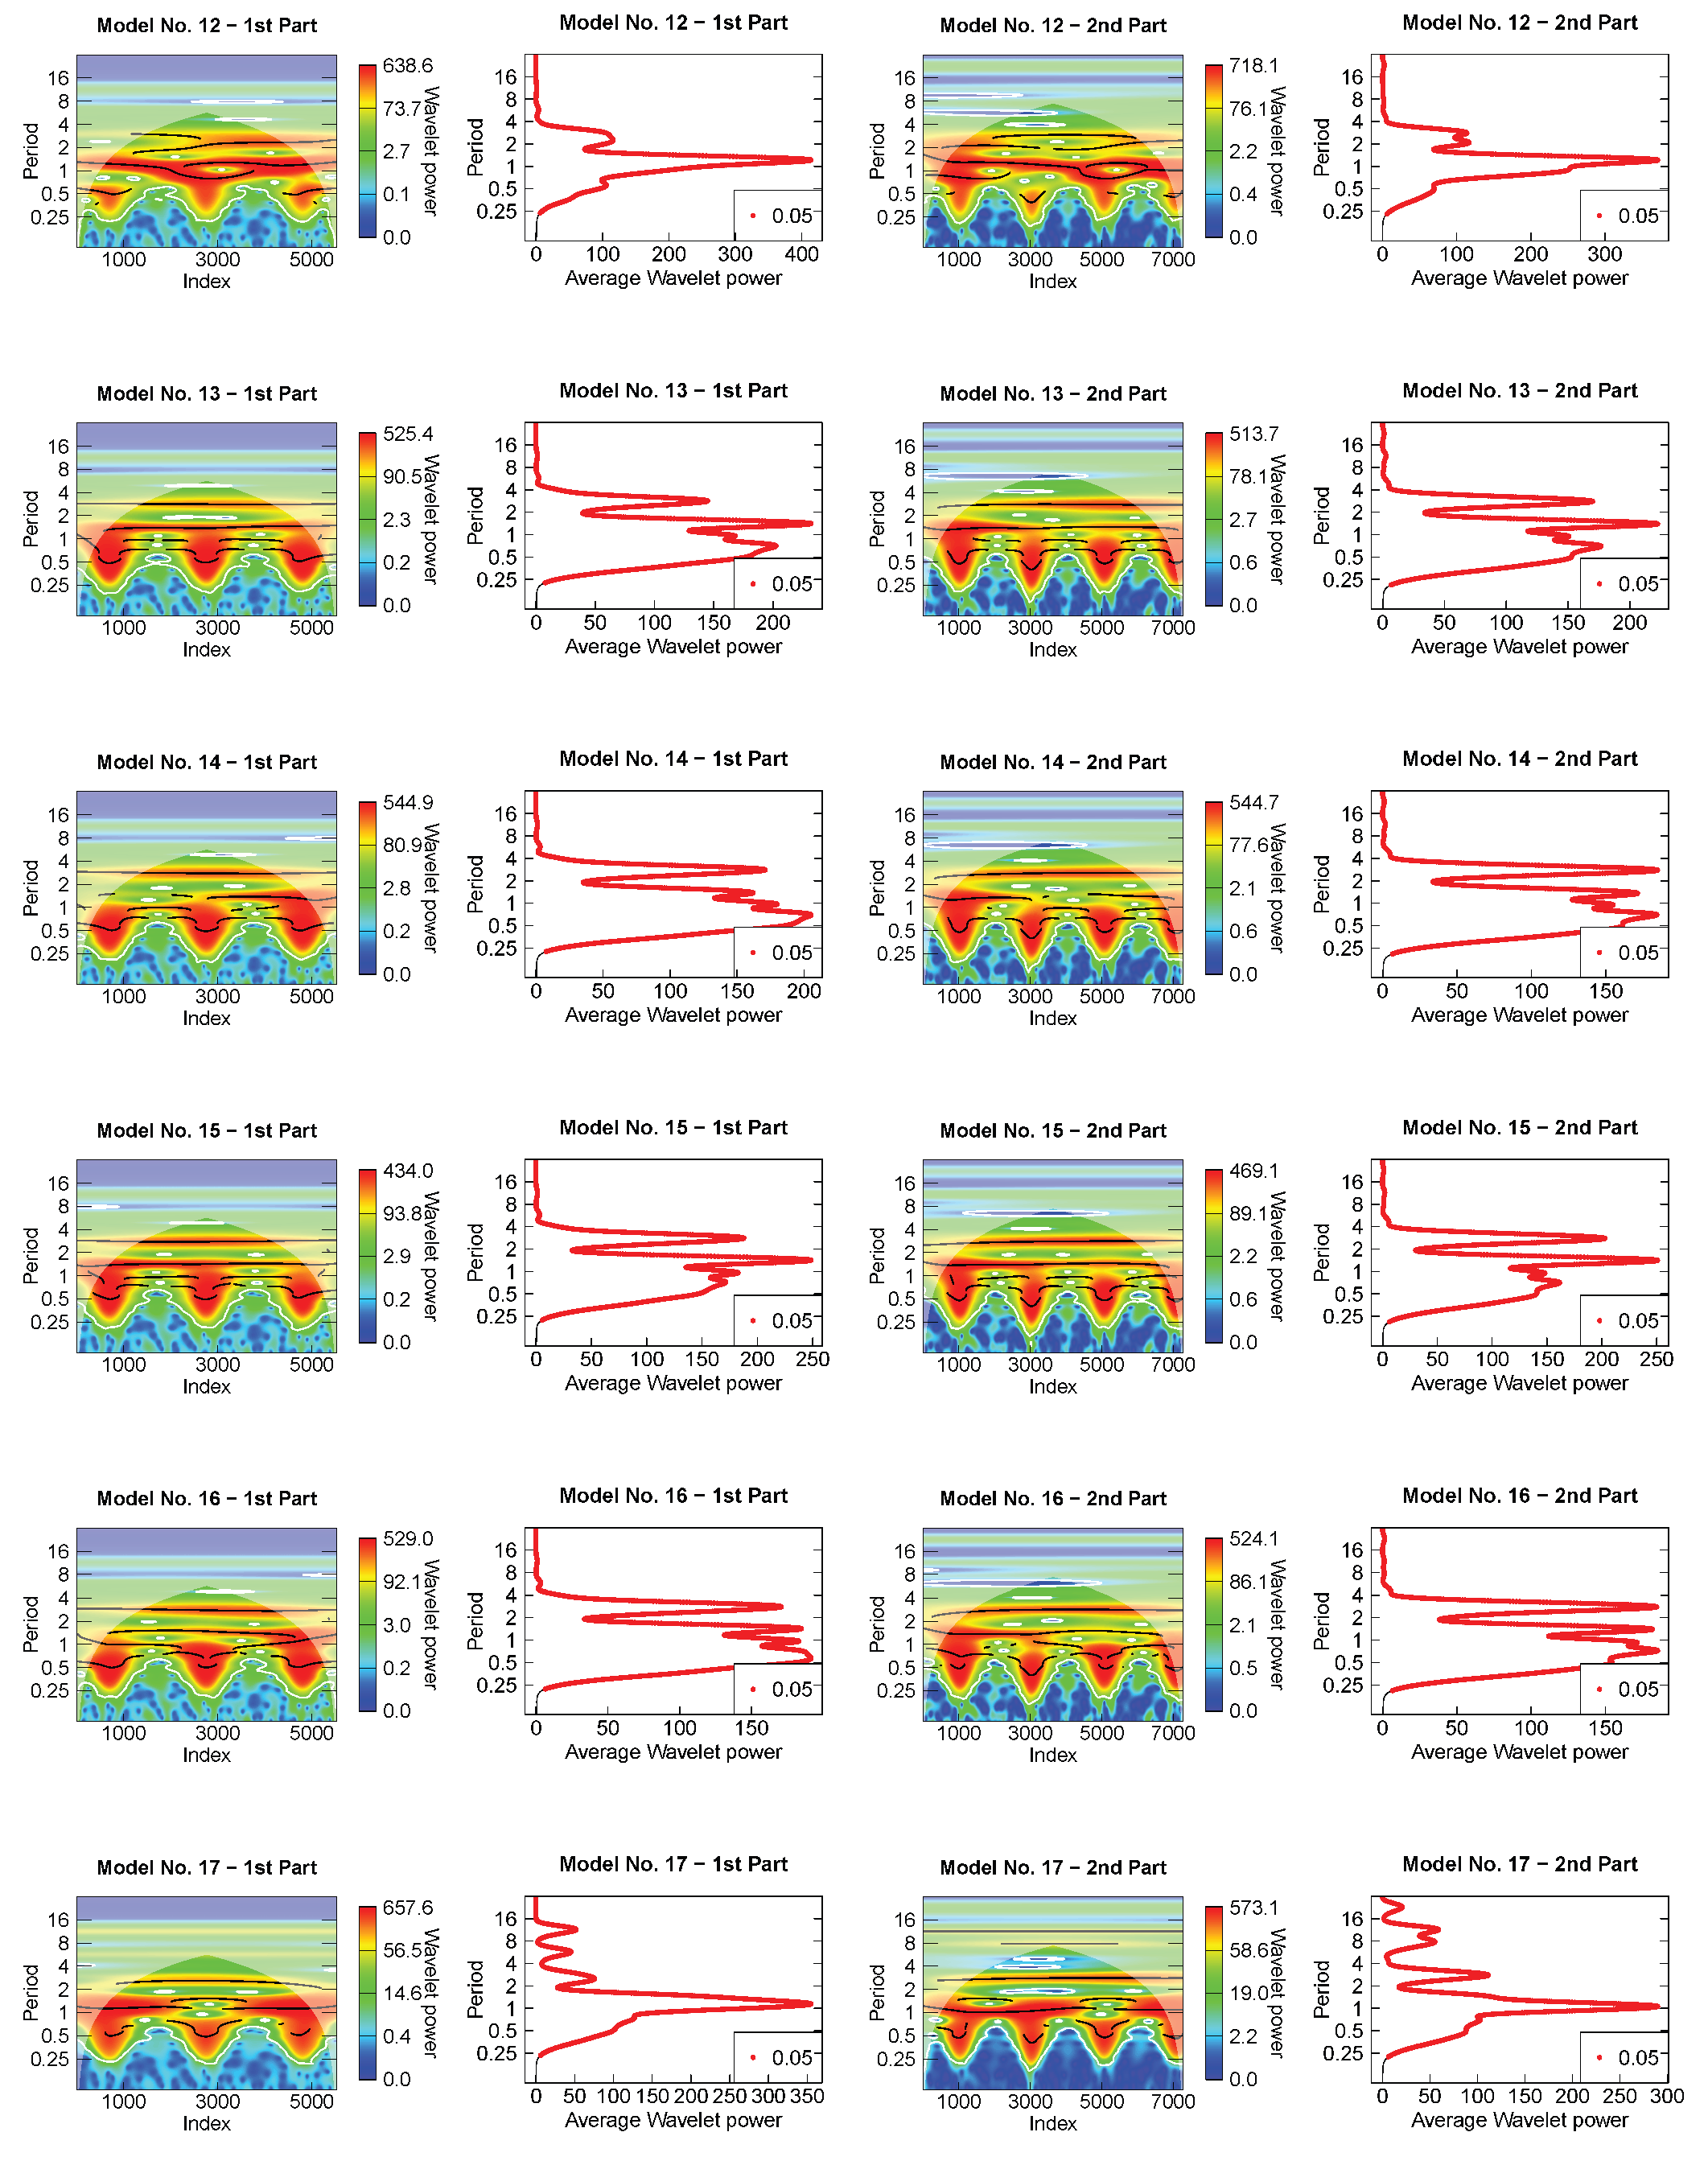
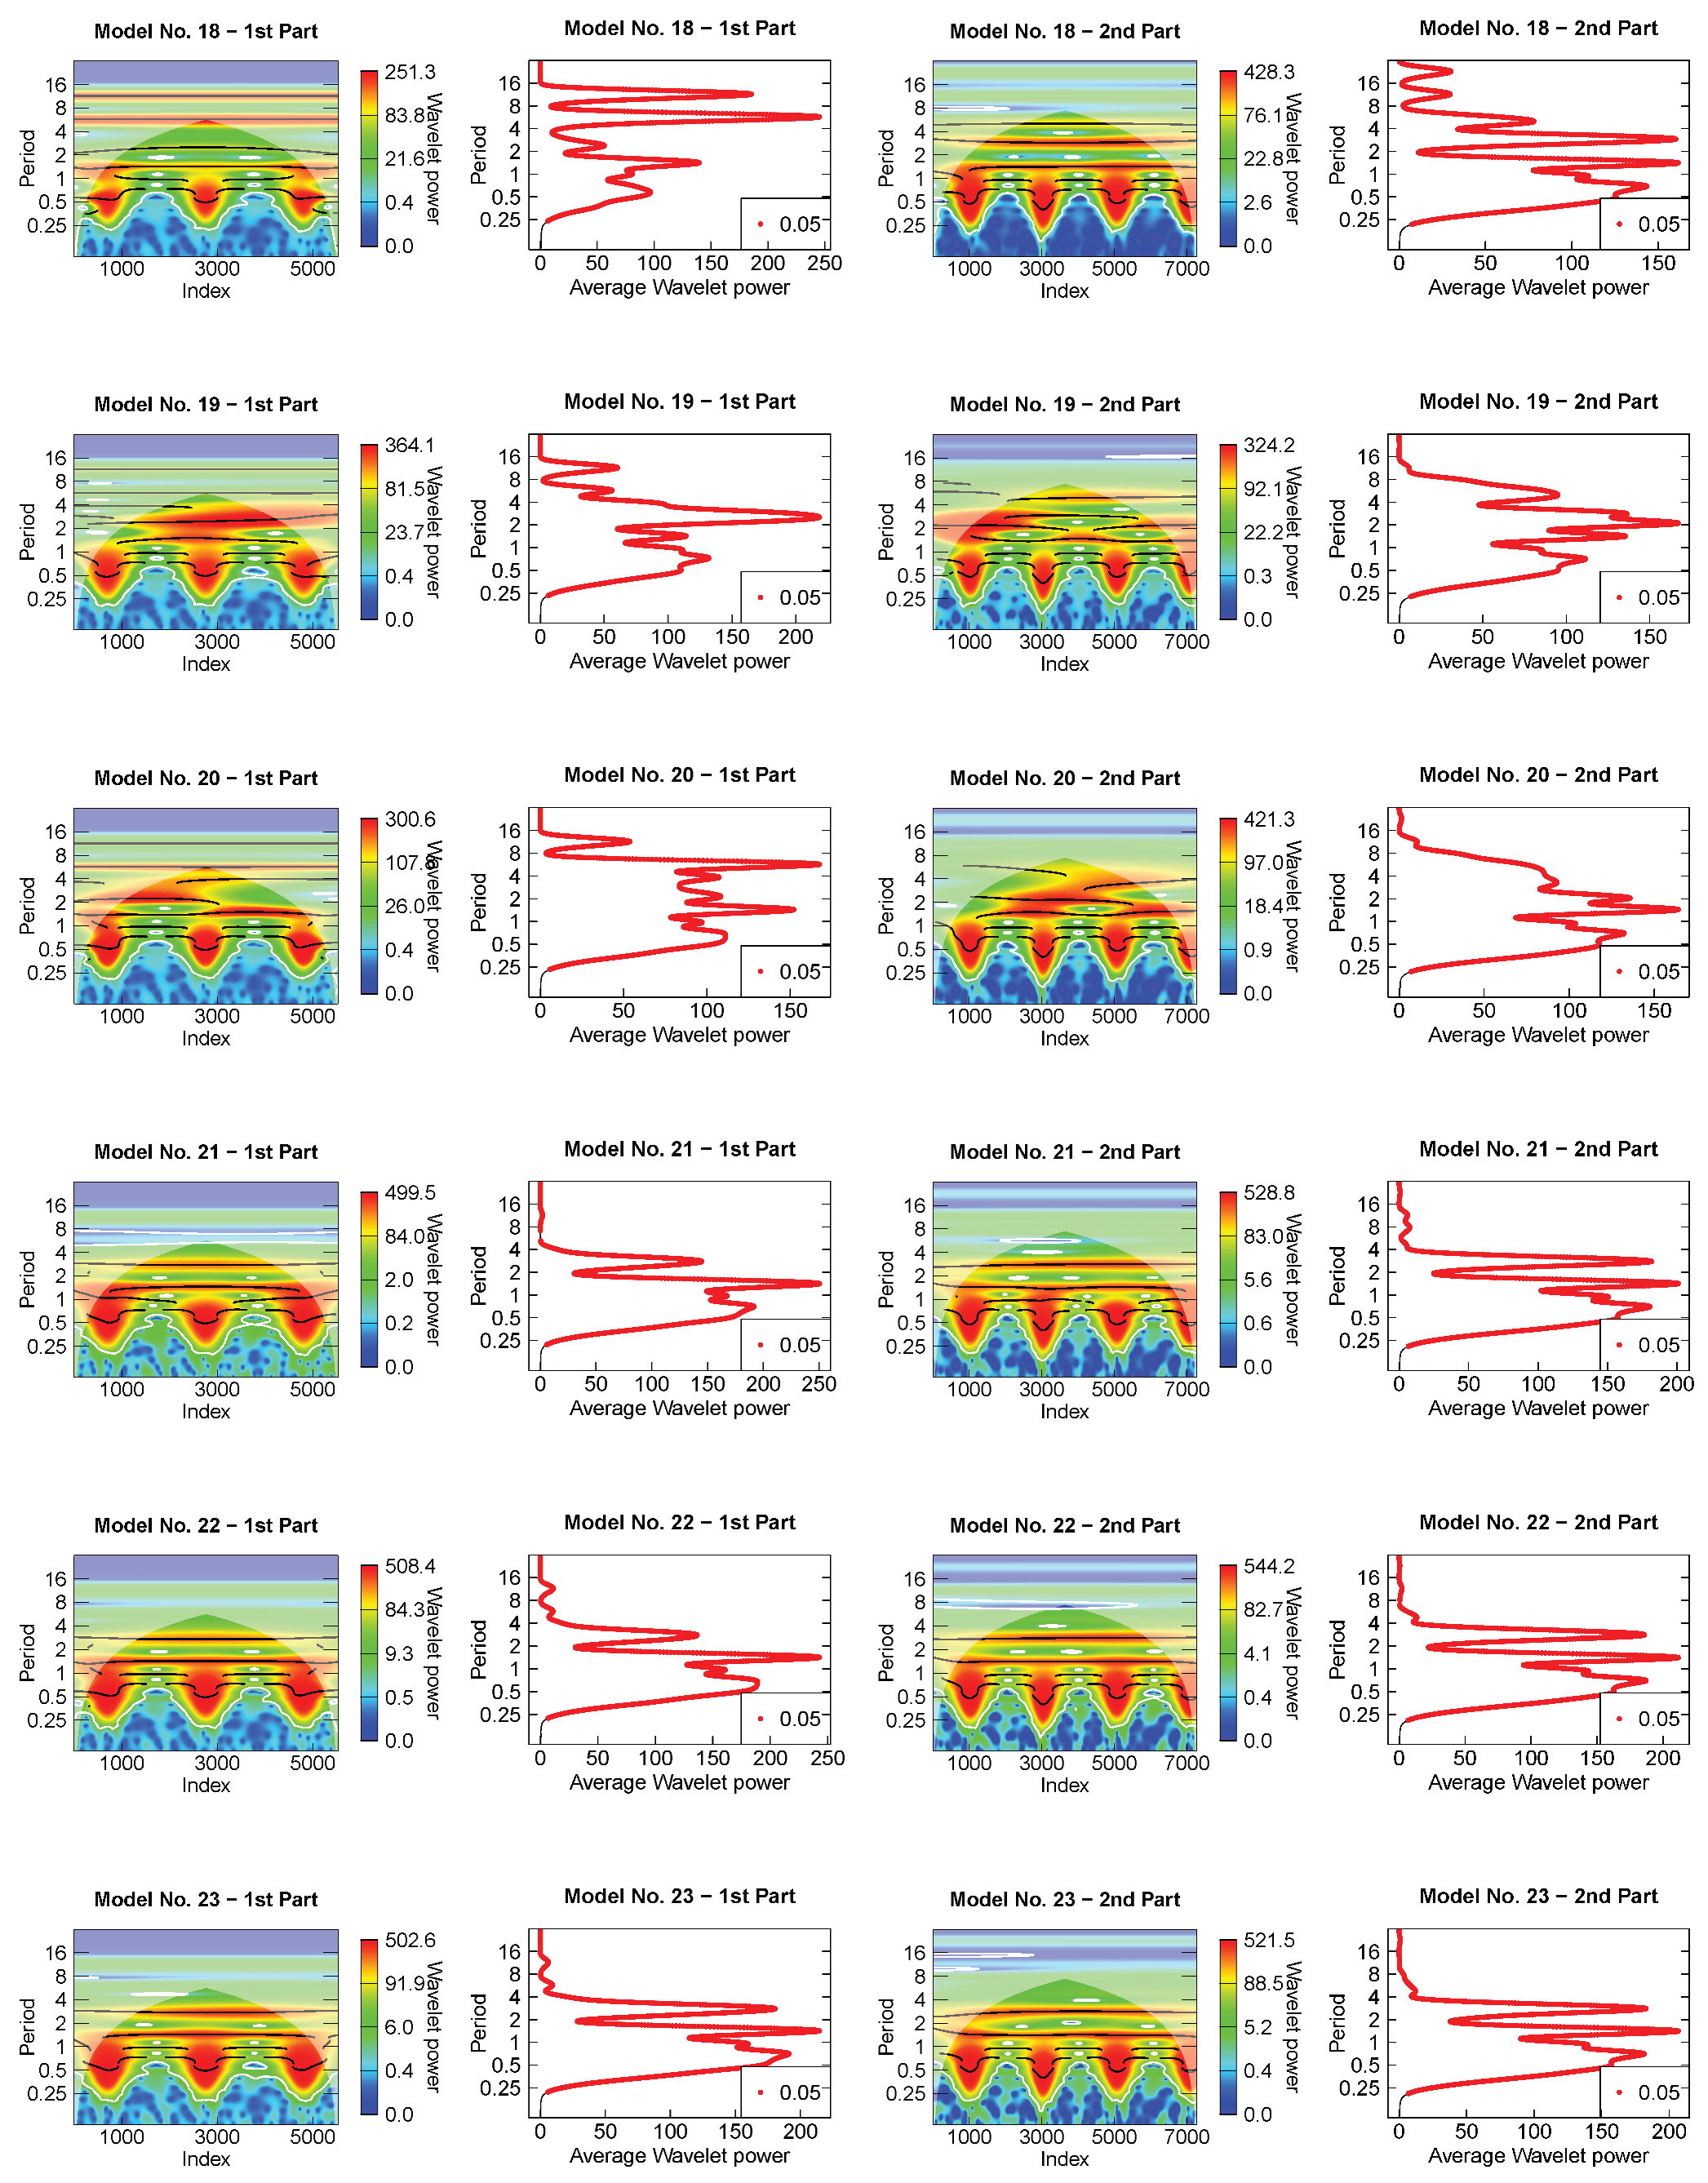
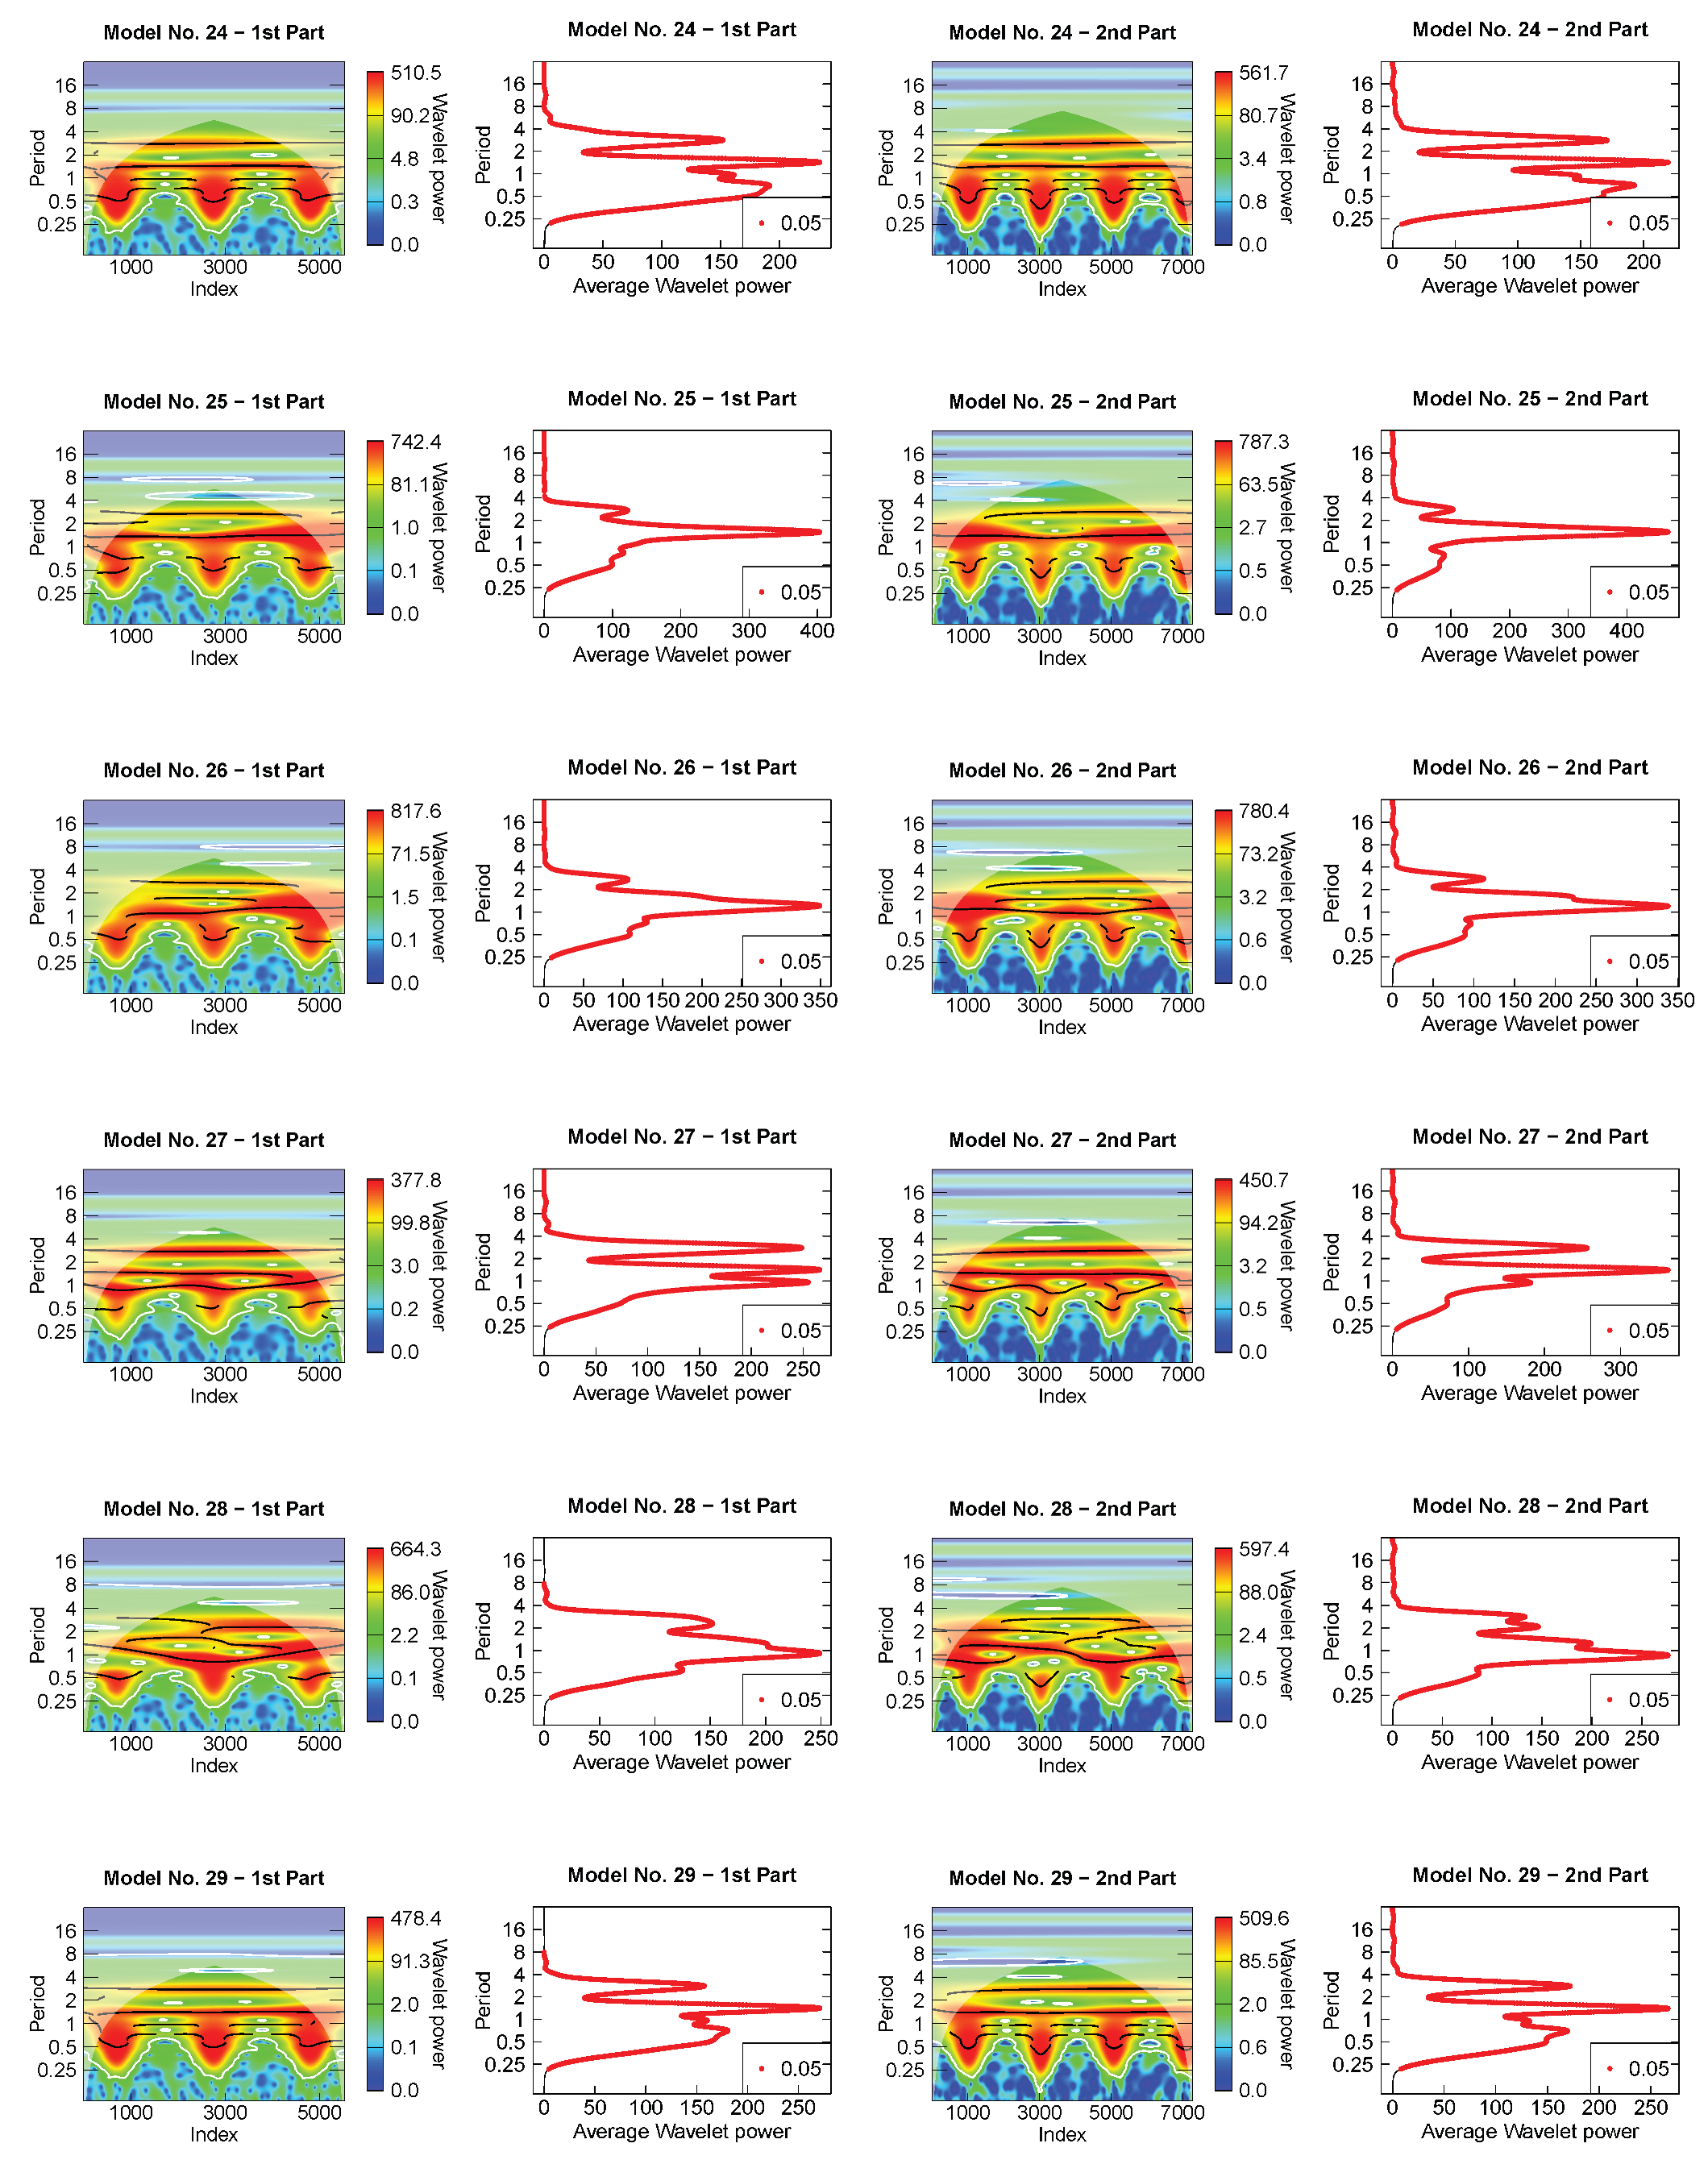
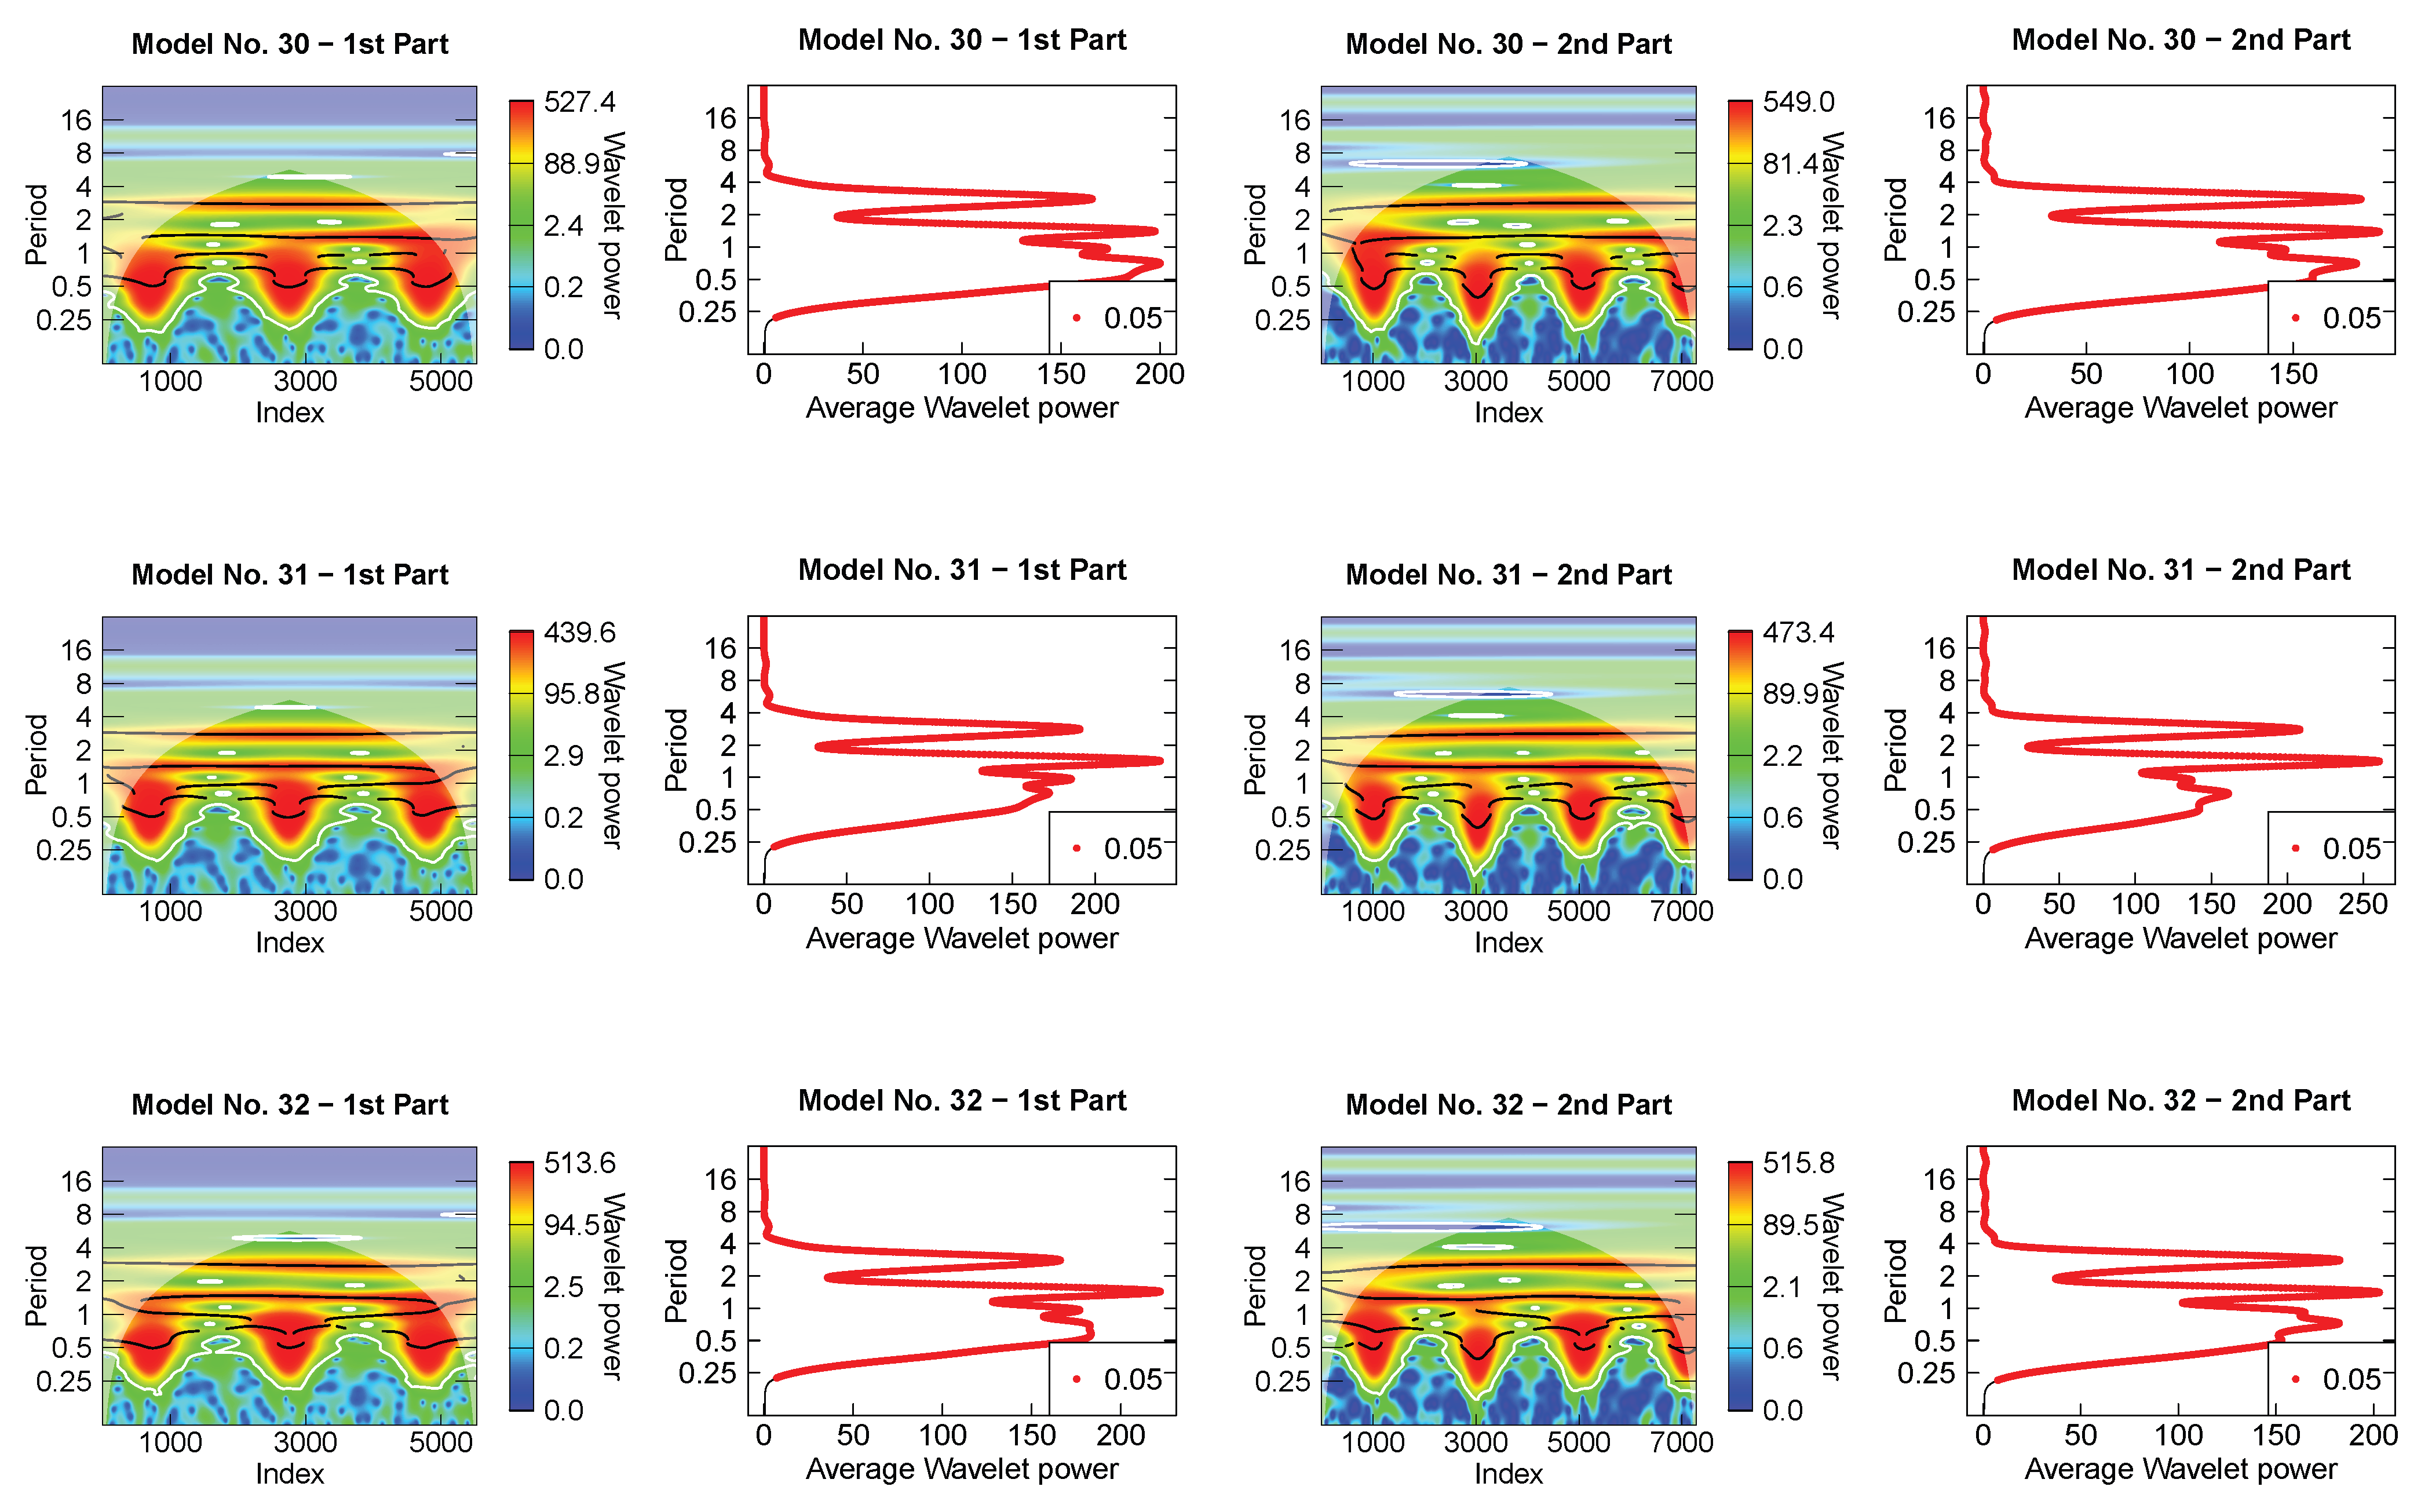
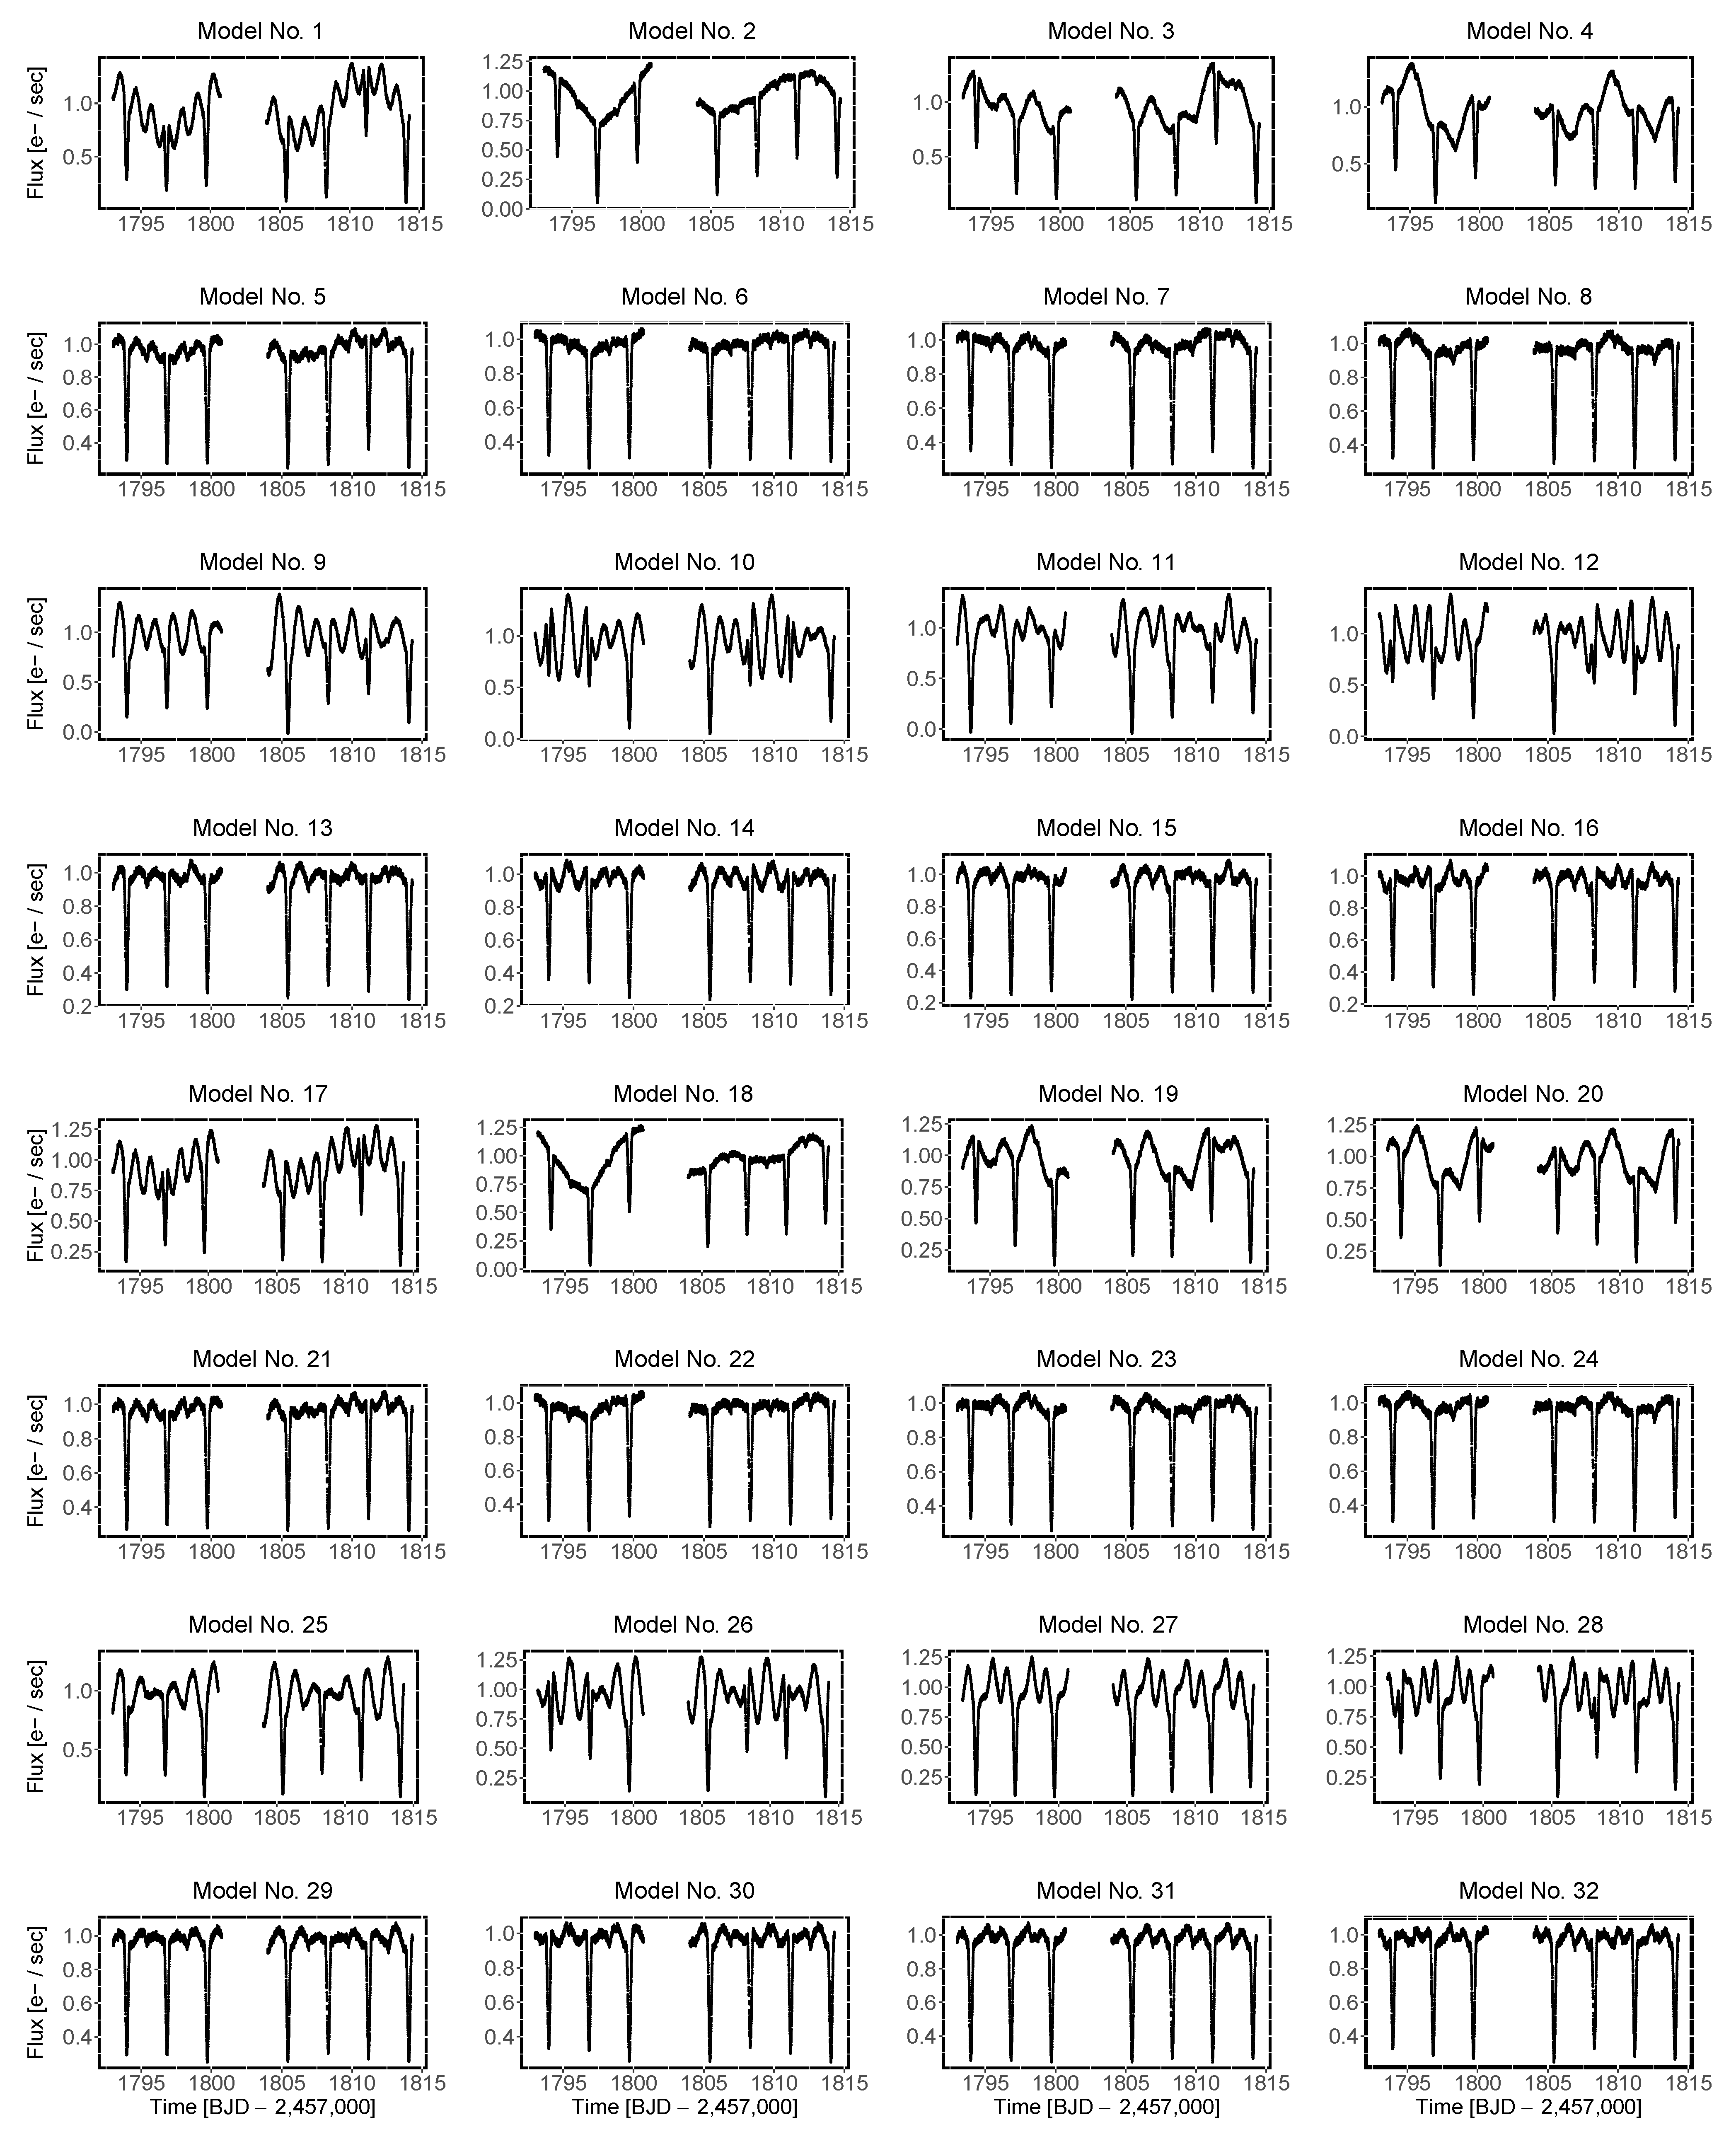
  • For the wavelet analysis, each light-curve model was separated into two parts because they present a discontinuity (or a gap) in the time sequence (see Figure 3). For all periods that showed a maximum average wavelet power greater than 10, the mean value of each period across time and its standard deviation were calculated as suggested by Roesch and Schmidbauer [51]. The latter was used as a measurement uncertainty of the period. They were considered more or less significant according to the color code of the scalogram, even those outside the cone of influence, since there is a significant improvement in the reconstruction of the light curves when considering those periods as well [37]. The period’s harmonics were identified for all independent periods. For the harmonics of the orbital period, we searched for the values included in the intervals with endpoints given by P h ± FWHM / 2 (see Table A2), where P h is an harmonic in the Model No. 0 and FWHM / 2 = 2 log ( 2 ) * σ P h , being FWHM the full width at half maximum of a normal distribution with standard deviation σ P h at any expectation value.
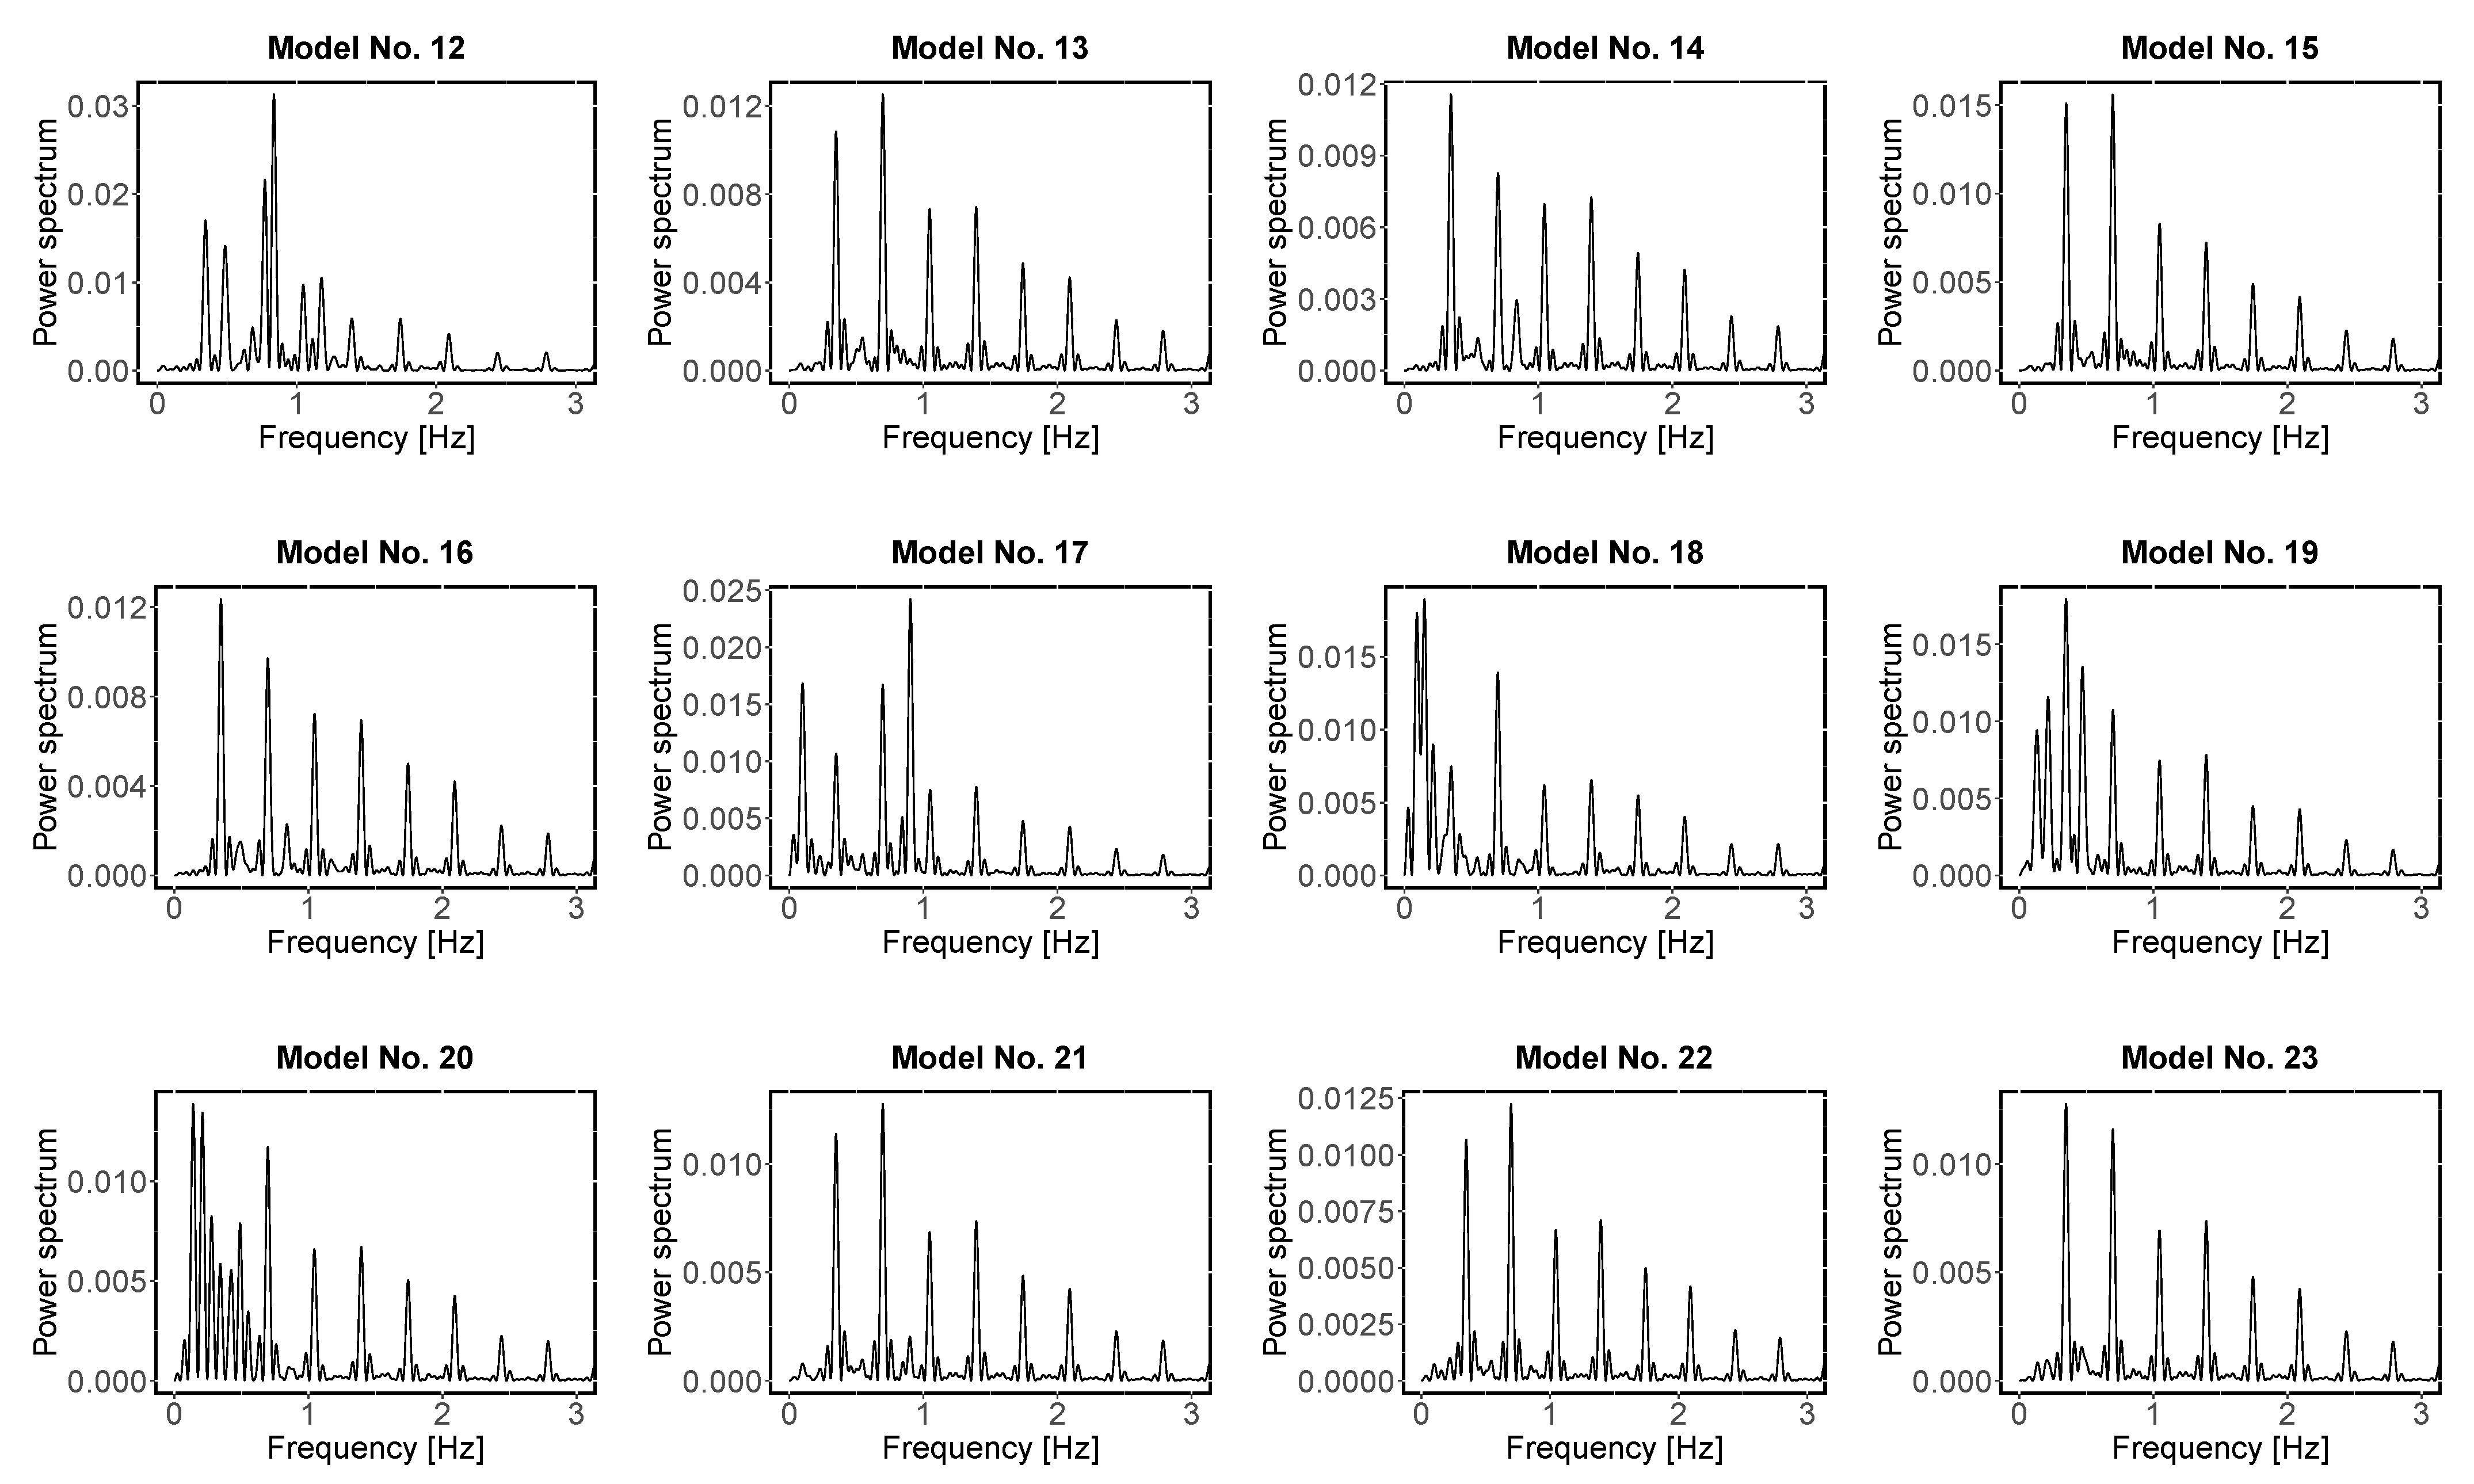
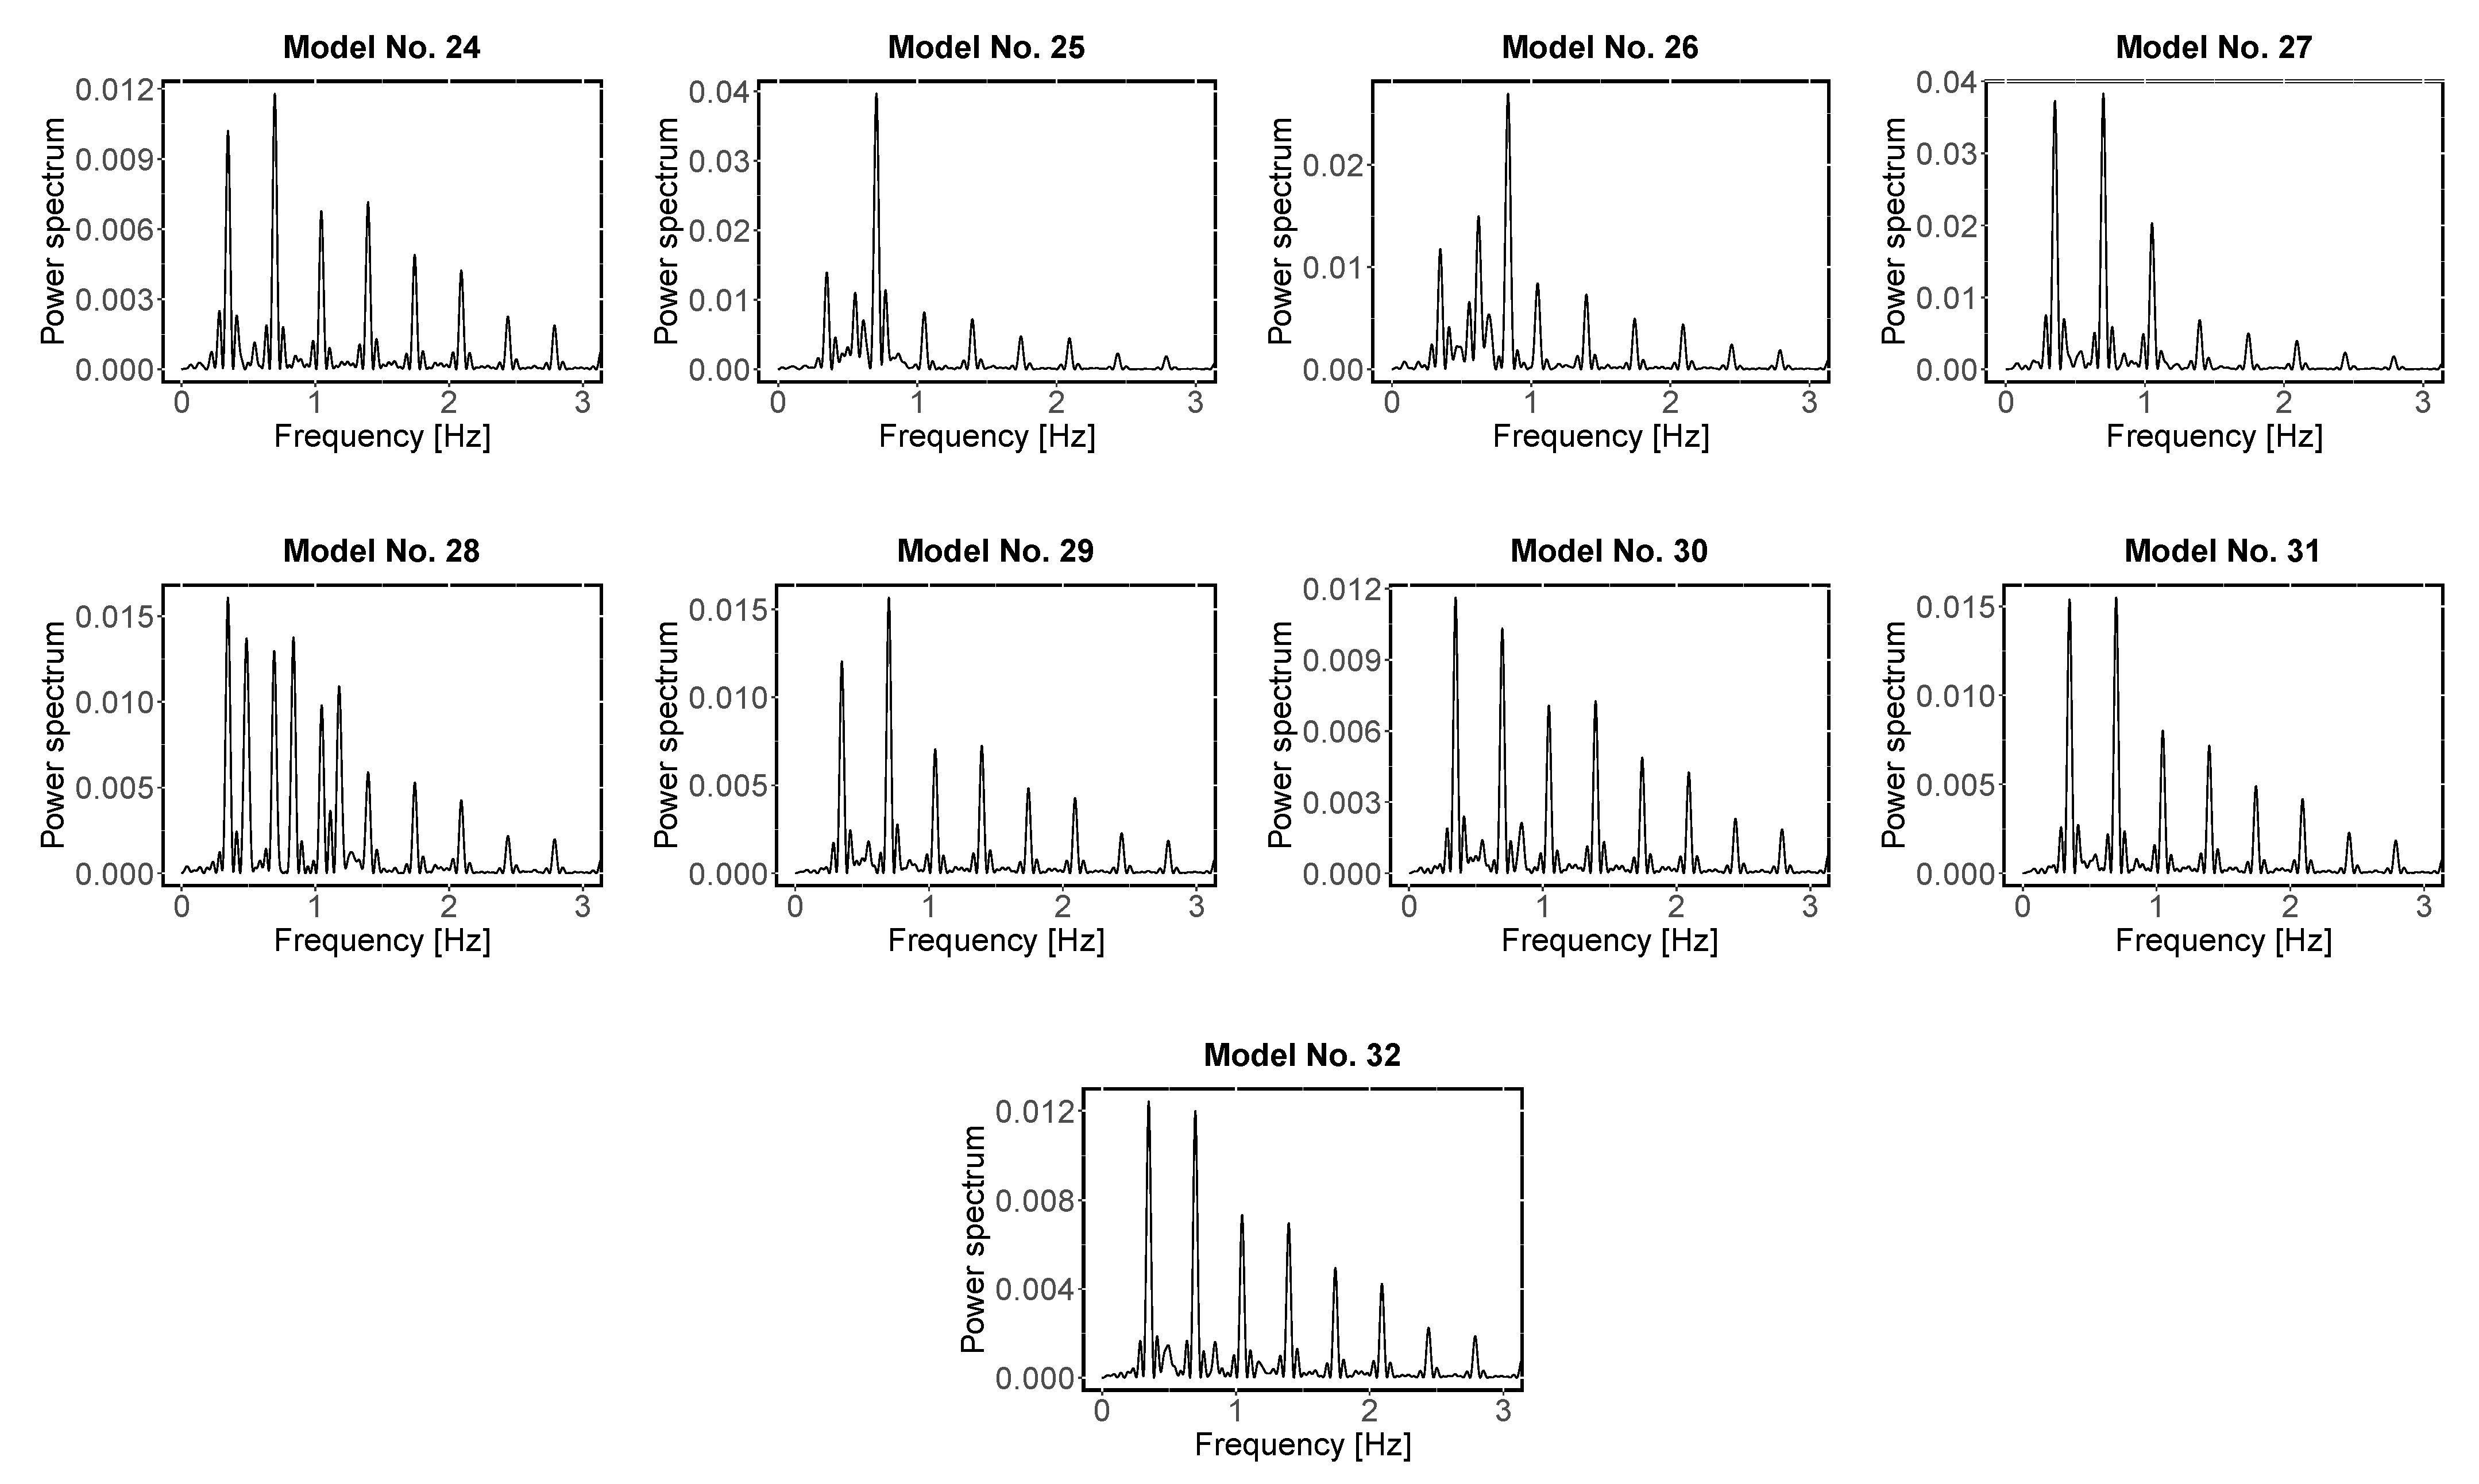
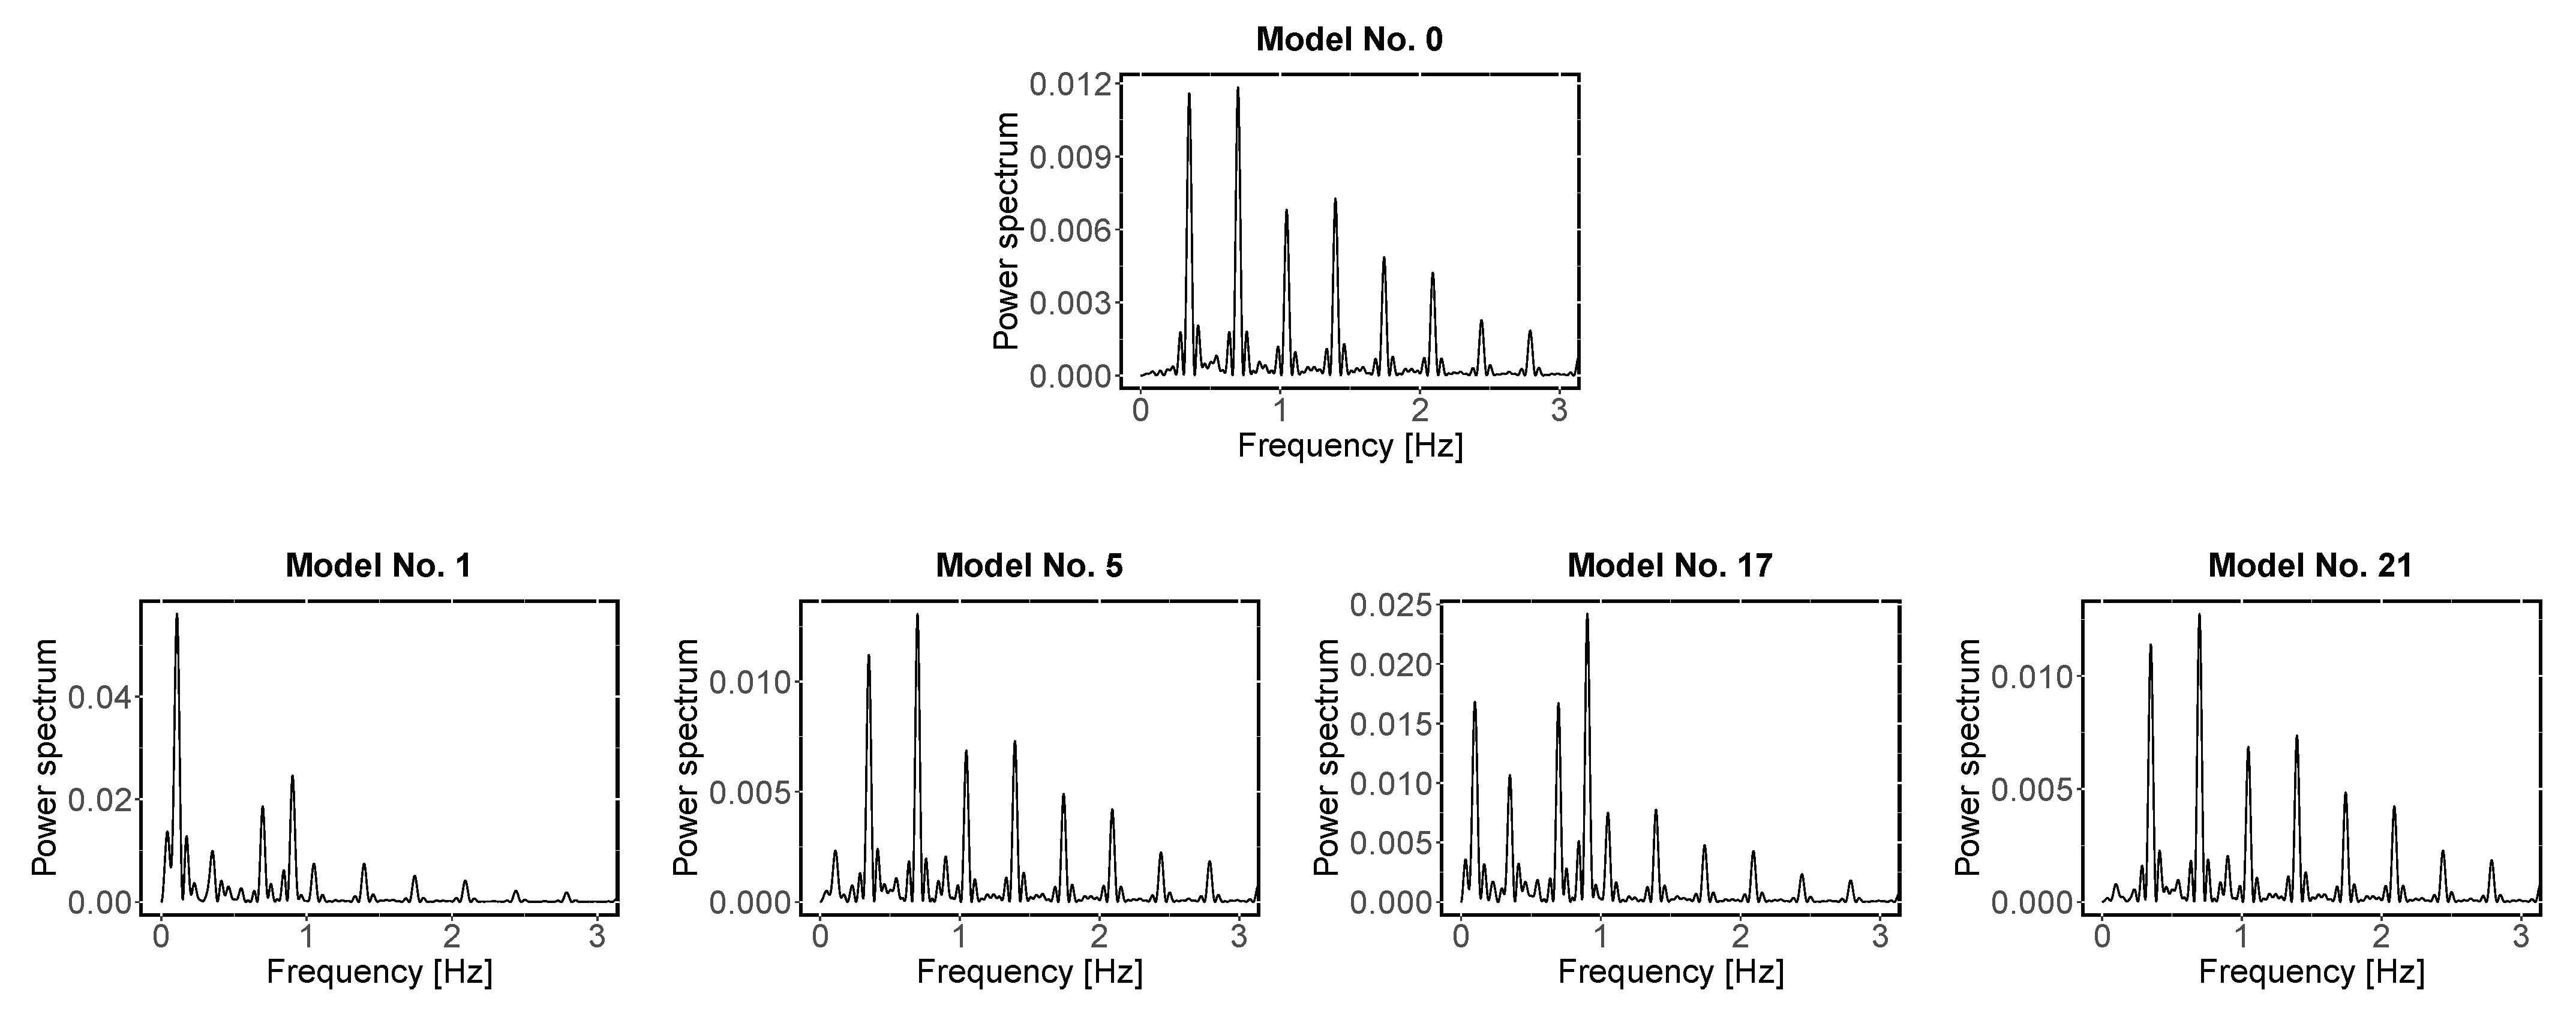
  • In the Fourier analysis, frequencies with a signal/noise ratio ≥ 5 were selected [57]. Then, the uncertainties of the frequencies were calculated following a nonlinear least squares fitting procedure available in the software [49]. According to Bognár, Zs. et al. [58] and Lenz and Breger [49], we accepted a peak as a combination of frequencies if the amplitudes of the main frequencies were greater than that of their presumed combination term and the difference between the observed and predicted frequency was not greater than the Rayleigh resolution criterion of the data sample. Once the independent frequencies were selected, we reported the corresponding periods.

4. Results

Each synthetic light curve generated with the design model of Table 1 is shown in Figure 3. These curves were analysed using the wavelet and Fourier analysis. To give a detailed description of the results obtained and how they are interpreted, we selected a group of four models with specific characteristics in common and compared them with Model No. 0 (shown in Figure 1). For the remaining 28 models, we will comment on the general results obtained, following the same analysis criteria. The results for the complete set of models are in Appendix A and Appendix B.
Table 2 lists the independent periods detected for Models No. 0, 1, 5, 17, and 21 with each method and their corresponding errors. Among these five models, the magnitude of the pulsation amplitude, the presence or absence of the beating phenomenon, and the values of the pulsation periods vary. The respective wavelet power spectrum, average wavelet power, and periodograms are illustrated in Figure 4 and Figure 5.
For Model No. 0, the wavelet and Fourier analysis recognises the binary’s orbital period as a fundamental frequency and finds its harmonics. The wavelet scalogram for both parts of the curve shows a structure (seen as “faces”) at the position of the minima of the light curve, also reproducing the eclipses of the binary (compare the timeline and structures of Figure 1 and Figure 4). However, the period detected by the wavelet tool is systematically slightly shorter than the original orbital period. This shift could be related to the fact that the time scale, adopted from a TESS light curve observation, is not completely equispaced.
When examining the wavelet power diagrams for Model No. 1, we noticed some differences from Model No. 0, particularly in the features that identify the eclipses. For example, it loses detail in finding harmonics with periods 1.43 and 0.95 days, maybe due to the size of pulsation amplitude ( 20 % ). Even so, it finds the binary 2.87 days period with an error of 0.09 , although in the second part of the curve and with much lower power than in Model No. 0. Additionally, a period of about 1.15 days is found, and its trace shows a sinusoidal modulation in the scalogram. Although it could be a spurious value, we associated this period as an independent value, likely with a harmonic of 8.96 or 10 days ( 8 × 1.15 = 9.2 ), where the value 8.96 days were artificially introduced to obtain the beating. However, this shift could be due to three near pulsation periods: 3e, 8.96 , and 10 days. Furthermore, a period of 7.852 days is also present with high power and could be related to the 3e days period. Even though the wavelet analysis does not find those exact values, the software likely detects the presence of significant periods in that range.
Model No. 5 is affected by the same pulsation periods as Model No. 1 but with a smaller amplitude. Therefore, the model’s scalogram and power diagram show a lower significance, but the same periods and scalogram features are maintained. As shown in Figure 2, the wavelet analysis performed with the WaveletComp package presents complications in differentiating nearby periods, particularly cases with a beating, such as Models No. 1 and 5, resulting in an intermediate value.
When analysing Model No. 17, we observed that the structures present in the scalogram are very similar to those of Model No. 1, both with a pulsation amplitude of 20% with respect to the depth of the primary eclipse. Since they share two periods, the 7.9 days period and the harmonic of 1.15 days, they could be related to the periods of 3e and 10 days.
Finally, the scalogram and average wavelet power of Model No. 21 is very similar to that found in Model No. 5 since they share two pulsations with amplitudes of 4%. However, in this case, it detects the binary period and another with a 7.92 days period, but with lower power than in Model No. 5.
The periodograms resulting from the Fourier analysis show remarkable similarities between the models affected by low-amplitude pulsations regardless of the periods involved. This is particularly seen in models No. 5 and 21. At the same time, slight variations are observed with respect to model No. 0. The pattern changes markedly for models No. 17 and 21, as seen in Figure 5). A similar situation occurs with models No. 6–8.
Quasi-periodic oscillations decrease the power of detection of the Fourier Transform method, tending not to detect them. The Period04 tool accurately sees the fundamental frequency of the binary orbital motion ( P orb = 2.87 ± 0.01 days) and its harmonics in all cases. However, it observes two pulsation periods with a significant error close to P = 10 days, detected as 9.26 days and 12.9 days in Model No. 1 and 9.47 days in Model No. 5. The 9.26 days (or 9.47 days) period could be likely related to the beating phenomenon with P = 8.96 or the pulsation with P = 10 days, or a mix of both. This is supported because, for example, the period 9.26 days also appears in Model No. 2 (see Appendix A) that has regular oscillations (with P = 7 days and P = 10 days, and a beating of 7.7 days), but in this case, the period 7 days is inexactly seen as P = 6.657 days (see also Model No. 6). Similarly to the wavelet analysis, a period of 1.1 days ( f = 0.9036 days 1 ) is present in Models No. 1 and 17. Models with the same set of parameters but low amplitude oscillations (i.e., Models No. 5 and 21) behave similarly. Model No. 21, similar to Model No. 17, detects an accurate period for P = 10 days.
Generally, the orbital period is well-detected in most models with Fourier analysis; only a few detect half of the period (i.e., Models No. 4, 11, 20, and 27). These models present regular oscillations with short periods or have a quasi-regular period 2 . The latter is similar to the half-orbital period. Models with quasi-regular pulsations show more dispersion of values, mainly when the time light effect is included. The Fourier analysis finds all periods in 14 models (Models No. 10, 12, 14, 16–19, 21–23, 26, 28, 30 and 32), 9 of which have low pulse amplitude ( 4 % ).
On the other hand, the wavelet analysis found the binary’s period satisfactorily, although it underestimated the value with an average of 2.81 days (of 31 models), which suggests a period shift of 0.06 days. Concerning the rest of the periods, this method found an equal or smaller number of periods than the Fourier analysis. Although the mean value has a systematic error, its variance is similar to that obtained with the Fourier method. It detected a few periods, mainly in models with low pulsation amplitude and where the period values coincide with a harmonic of the binary’s orbital period. However, it found all periods in four models (Models No. 17, 18, 26 and 28). These have a high pulsation amplitude ( 20 % ) and absence of beating phenomenon.
A comparison of the methods is shown in Figure 6. The boxplots of the hit ratios of all the prefixed periods obtained by wavelet and Fourier analysis are in the left and right panels, respectively. We see that the median percentages (thick black line inside the box) are much lower for the wavelet analysis (<0.4) than for the Fourier analysis (about 0.8).
Figure 7 presents a boxplot comparison for both techniques, of the hit ratio segmented by the categories of five of the variables included in the simulation design: beating phenomenon ( X 1 ), period of the pulsation ( X 2 ), amplitude of the pulsation ( X 3 ), number of pulsations periods ( X 4 ), quasi-regular pulsations ( X 6 ), calculated with a wavelet and Fourier analysis, respectively. Since we were dealing with the half-model design, the result does not provide information about one variable.
Regarding the results obtained for the wavelet analysis, we can observe that the variable that influences its performance the most is the pulsation amplitude. At low amplitude, it is difficult to detect the intrinsic period of the model. The presence of the beating phenomenon and the fact that the period of the pulsation is quasi-regular also have some influence. The hit ratio increases when the pulsation period is greater than the orbital period and when there is more than one pulsation (see Figure 7). The analysis of the variance of the percentage of hits of a quasi-periodic oscillation with a large pulsation amplitude (i.e., 20 % ) finds the period only the 55 % of the time. While for a regular oscillation, it detects the period 85 % of the time. Instead, if the pulsation amplitude is low, it finds the period about 30 % of the time in both cases. Quasi-regular or regular period detection is also affected by their interaction with the orbital period, depending if they are shorter or longer than it. The regular period detection rate varies from 60 % (for shorter periods) to 50 % (for longer periods) and for quasi-regular periods from 65 % to 30 % .
Unlike wavelet analysis, Fourier analysis is unaffected by the pulsation amplitude. The proportion of detected periods (an approximate value) increases if the period pulsation is longer than the orbital one, but they are more accurate when it is shorter (see Figure 7). The presence of beating and quasi-period decreases the detection capability a little. In both cases, the medians (thick black line in the box) is about 75 % , which changes to 100 % without the phenomenon. From an analysis of the variance of the hit ratio, we obtain that if the pulsation period is shorter than the orbital period, the presence of the beat phenomenon improves period detection ( 70 % vs 80 % ). Otherwise, if the pulsation period is longer, the presence of this effect worsens it ( 95 % vs 75 % ). Quasi-regular or regular period detection is also affected by their interaction with the orbital period, depending if they are shorter or longer than it. The period detection rate for regular oscillations varies from 100 % (for shorter periods) to 80 % (for longer periods) and for quasi-regular periods from 50 % to 85 % . For pulsation periods longer than orbital periods, the performance is similar.

5. Discussion and Conclusions

It is widely known that power spectra can be misleading and frequently lead to inaccurate conclusions. For this reason, many works present a comparative analysis of popular algorithms applicable to period searching. Sometimes the study of one particular light curve with various numerical methods resulted in a high dispersion or undetected periods as reported by Graham et al. [26] and Distefano et al. [59].
The objective of the current work was to evaluate the response of two methods, based on the Morlet wavelet function and continuous Fourier transform, in the production of bias, alias, or shifts in period detection using a simulation design with pre-fixed and known periods. For this purpose, we performed a simulation design of synthetic light curves of a pulsating star in an eclipsing binary system with an orbital period of 2.87 days. It is a 2 k p -statistical design with k = 6 variables, in which the beating phenomenon and the light-time effect were considered. Of the total design method, only one-half was executed. The 32 time series models were analysed using the WaveletComp and Period04 tools. Although many time series analysis tools are available, the application of such a large simulation design to more than two techniques would be unattainable.
The obtained synthetic light curves, shown in Figure 3, present similarities with the light curves of pulsating binary stars obtained with the TESS mission (see Figure 8) in shape and cadence. Among them, we can highlight the similarity between HD 152,248 with model No. 9, TIC 80,042,405 with model No. 27, and TIC 97,467,902 with models with low amplitudes with respect to the depth of the primary eclipse (models No. 5–8, 13–16, 21–24, 29–32).
Comparing both applied methods, we observed that the orbital period and its harmonics were well detected in most models. Even though the Fourier method provided more accurate period detection, the wavelet analysis found it more times. When estimating the orbital period, the WaveletComp package trends to provide a low period value or period shift of approximately 0.06 days in all the models, but this has a similar dispersion to the orbital period obtained from the Fourier analysis. In agreement with this finding, Foster [22] also reported through numerical simulations that for a simple sinusoid, the maximum frequency obtained with wavelet analysis has an offset with respect to the signal frequency, which can be compensated. This author also commented that under irregular sampling, the detection of the period by the wavelet analysis varies with time, making it difficult to give an exact value of the same, especially with the increase in missing data in the sampling, which can reach up to 20 % at high frequencies or find spurious periods at low frequencies. Although we considered “almost” a regular sampling, it may be that some of the still sampling irregularity present in the timeline scale selected from TESS observations has affected the performance of the WaveletComp package.
As shown in the previous section, pulsation amplitude is a very powerful variable in period detection. In the case of the wavelet analysis, more satisfactory results are found recovering the periods of the pulsations with large amplitudes. On the other hand, the Fourier analysis did not show difficulties in recognising the periods when the amplitude is low, but they were detected with significantly lower power than models with large amplitudes.
Neither tool was able to distinguish accurately the periods leading to a beating phenomenon when they were longer than the orbital period, resulting in both cases in an intermediate value. However, when the beating was formed by periodic pulsations shorter than the orbital period, the Fourier analysis found it in all cases, but quasi-regular periods remained unresolved. Concerning the beating period 2 , it is necessary to remember that this period coincided (unfortunately, but possible in a real scenario) with the first harmonic of the selected orbital period of 1.43 days. Therefore, when a value of 1.4 days was detected, it was considered the harmonic of the orbital period. If the values set in the simulation design were unknown, it would be impossible to distinguish between them. The same holds for the 0.94 days period. By analogy, wavelet analysis does not detect these periods either.
Finally, the wavelet power spectrum revealed in all models a particular structure located at the position of the primary eclipses of the binary in the synthetic light curve, even showing the instant of time in which they occur. Then, if a similar structure is found in a real data set, it could indicate binarity. In addition, as mentioned before, several harmonics of the orbital period were detected by both tools, which is also an indicator of binarity.
In general, the Fourier analysis by means Period04 tool had a higher proportion of periods correctly and accurately detected than the analysis performed with the WaveletComp package. However, the discrepancy could be attributed to the less information available in the latter when performing the period analysis since splitting the light curve into two parts was necessary. Despite the high cadence, the TESS data outside the large gap also present a slightly irregular sampling, which affects the analysis. Furthermore, this package uses a somewhat coarse resolution level, preventing it from accurately determining the periods encountered. Foster [22] also found some kind of asymmetry in period detections, with more values at low frequencies and suppression at high frequencies.
Considering the period hit rate analysed using synthetic light curves for eclipsing binaries, a bias in detecting some pulsation periods (beating phenomenon and light time effects) in multi-periodic light curves would be expected. The hit rate depends on the amplitude and frequency of the pulsation with respect to eclipse depth and orbital period. The situation would be more unfavourable for purely elliptical double stars, partial eclipses, or systems influenced by the gravitational attraction of a third body that might behave similarly to a sinusoidal pulsation. In some cases, only a light modulation could likely be acting because the binary orbit is not aligned with the observer’s direction. In these cases, the period hit rate would be lower, masking the binary detection, for example, among B supergiants.
Although the recovery of all pre-fixed periods was not feasible using WaveletComp and Period04, valuable insights were obtained regarding how each technique responds to the various modelled situations. For instance, we observed that WaveletComp can only detect an intermediate value when confronted with two close periods due to the poor spectral resolution of this package. Additionally, we have noted that Period04 fails to recognise quasi-regular periods, but has good accuracy in detecting high-frequency oscillations. Furthermore, we found with both tools structures that indicate binarity (in the periodograms and scalograms), information that will be very useful when performing these analyses on the light curves of binary star candidates, among other findings.
Considering the advantages and disadvantages of the techniques analysed, we recommend using at least two diagnosis tools to conduct a detailed analysis of time series data to obtain confident results. Additionally, a second criterion should be considered to test the accuracy of the found frequencies or periods since the methods might find a harmonic, inaccurate period, or spurious value. Particularly, the wavelet method might predict only a harmonic of the true period. Since approximated values were detected with at least one method, a fine-tuning of trial periods around a certain percentage of its value, by applying phase diagrams, would help to recover accurate values.
Evaluating the behaviour of other tools based on wavelets that do not have this weakness (e.g., Weighted wavelet Z-transform (WWZ) [22]) is one of the goals to follow. This method also enables an improvement in the resolution of the period searches, allowing a high degree of accuracy. In addition, considering even more realistic models or observed light curves that present a gap and time-varying periods would allow us to take full advantage of the main feature of wavelet analysis.

Author Contributions

Formal analysis, A.A.A., G.F.A.M., A.C. and L.S.C.; Investigation, A.A.A., G.F.A.M., A.C. and L.S.C.; Methodology, A.A.A., G.F.A.M., A.C. and L.S.C.; Writing—original draft, A.A.A.; Writing—review & editing, G.F.A.M., A.C. and L.S.C. All authors have read and agreed to the published version of the manuscript.

Funding

This project has received funding from the European Union’s Framework Programme for Research and Innovation Horizon 2020 (2014-2020) under the Marie Skłodowska-Curie Grant Agreement No. 823734. AA and LC thanks financial support from CONICET (PIP 1337) and the Universidad Nacional de La Plata (Programa de Incentivos 11/G160), Argentina. AC and GA acknowledges support from Centro de Estudios Atmosféricos y Astroestadística (CEAAS), Universidad de Valparaíso.

Data Availability Statement

Not applicable.

Conflicts of Interest

The authors declare no conflict of interest.

Abbreviations

The following abbreviations are used in this manuscript:
TESSTransiting Exoplanet Survey Satellite
PHOEBEPHysics Of Eclipsing BinariEs

Appendix A. Fourier Analysis Results

For each synthetic light curve, the frequencies with a signal/noise ratio ≥ 5 and their errors, are listed in Table A1. The fixed listed periods of the design models are listed in column 2. It does not include the period of the binary system (2.87 days) present in all the models, except for model No. 0, where is the only period present. Columns 3 and 4 list the frequency and the corresponding period in days. Column 5 indicates the independent frequencies found and the linear relationship among them. The respective periodograms are shown in Figure A1 and Figure A2.
Table A1. Fourier analysis results reporting the significant frequencies and harmonics. The detect independent frequencies are highlighted in blue. The symbol e is the Euler number.
ModelFixed Period Values [Days]Frequencies
[Days 1 ]
Indep. Period
[Days]
Comment
No. 02.870.6970 ± 4 × 10 4 2 f 1
0.3473 ± 4 × 10 4 2.878 ± 3 × 10 3 f 1
1.3941 ± 3 × 10 4 4 f 1
1.0467 ± 6 × 10 4 3 f 1
2.0912 ± 7 × 10 4 6 f 1
1.7419 ± 5 × 10 4 5 f 1
2.4386 ± 1 × 10 4 7 f 1
2.7883 ± 2 × 10 4 8 f 1
3.1380 ± 1 × 10 4 9 f 1
3.4824 ± 3 × 10 4 10 f 1
No. 13e–8.96–100.1079 ± 2 × 10 4 9.262 ± 1.3 × 10 2 f 1
0.9036 ± 3 × 10 4 1.106 ± 2 × 10 3 f 2
0.3473 ± 4 × 10 4 2.878 ± 3 × 10 3 f 3
0.6970 ± 4 × 10 4 2 f 3
1.3941 ± 5 × 10 4 4 f 3
1.0467 ± 6 × 10 4 3 f 3
2.0935 ± 7 × 10 4 6 f 3
1.7438 ± 7 × 10 4 5 f 3
2.4409 ± 9 × 10 4 7 f 3
2.7883 ± 1.1 × 10 3 8 f 3
0.0774 ± 1.3 × 10 3 12.911 ± 1 × 10 3 f 4
3.1380 ± 1.6 × 10 3 9 f 3
No. 27–7.70–100.1079 ± 2 × 10 4 9.262 ± 1 × 10 3 f 1
0.6970 ± 3 × 10 4 2 f 2
0.3473 ± 3 × 10 4 2.878 ± 1 × 10 3 f 2
1.3941 ± 4 × 10 4 4 f 2
1.0467 ± 5 × 10 4 3 f 2
2.0935 ± 6 × 10 4 6 f 2
1.7438 ± 6 × 10 4 5 f 2
0.1502 ± 6 × 10 4 6.657 ± 2 × 10 3 f 3
2.4409 ± 8 × 10 4 7 f 2
2.7883 ± 9 × 10 4 8 f 2
No. 33e–2.12–4.42–8.960.1173 ± 2 × 10 4 8.521 ± 1 × 10 3 f 1
0.3497 ± 3 × 10 4 2.859 ± 1 × 10 3 f 2
0.2182 ± 3 × 10 4 4.581 ± 1 × 10 3 f 3
0.6970 ± 3 × 10 4 2 f 2
0.4717 ± 3 × 10 4 2.179 ± 2 × 10 3 f 4
1.3941 ± 4 × 10 4 4 f 2
1.0467 ± 5 × 10 4 3 f 2
2.0935 ± 6 × 10 4 6 f 2
1.7438 ± 6 × 10 4 5 f 2
2.4385 ± 8 × 10 4 7 f 2
2.7883 ± 9 × 10 4 8 f 2
0.0821 ± 1.2 × 10 3 12.173 ± 1 × 10 3 f 5
No. 47–2.03–4.86–7.700.1338 ± 2 × 10 4 7.475 ± 1 × 10 3 f 1
0.6971 ± 5 × 10 4 1.435 ± 1 × 10 3 f 2
0.2793 ± 4 × 10 4 2 f 1
0.4228 ± 4 × 10 4 2.367 ± 2 × 10 3 f 3
1.3942 ± 5 × 10 4 2 f 2
1.0468 ± 5 × 10 4 3 / 2 f 2
1.7438 ± 6 × 10 4 5 / 2 f 2
2.0912 ± 6 × 10 4 3 f 2
0.0962 ± 6 × 10 4 10.391 ± 6 × 10 3 f 4
0.5632 ± 1 × 10 4 4 f 1
2.4385 ± 1 × 10 4 7 / 2 f 2
2.7883 ± 1 × 10 4 4 f 2
No. 53e–8.96–100.6970 ± 3.8 × 10 3 2 f 1
0.3497 ± 3.6 × 10 3 2.859 ± 3 × 10 3 f 1
1.3941 ± 4.7 × 10 3 4 f 1
1.0468 ± 5 × 10 3 3 f 1
2.0912 ± 6.2 × 10 3 6 f 1
1.7439 ± 1 × 10 4 5 f 1
0.1056 ± 7 × 10 3 9.467 ± 3 × 10 3 f 2
2.4409 ± 8.6 × 10 3 7 f 1
2.7883 ± 9.6 × 10 3 8 f 1
0.9083 ± 1.35 × 10 2 1.100 ± 1 × 10 3 f 3
3.1380 ± 1.49 × 10 2 9 f 1
No. 67–7.70–100.6970 ± 3.7 × 10 3 2 f 1
0.3497 ± 3 × 10 4 2.859 ± 3 × 10 3 f 1
1.3941 ± 4 × 10 4 4 f 1
1.0467 ± 4 × 10 4 3 f 1
2.0912 ± 6 × 10 4 6 f 1
1.7438 ± 6 × 10 4 5 f 1
2.4409 ± 8 × 10 4 7 f 1
2.7883 ± 9 × 10 4 9.468 ± 3 × 10 3 f 2
3.1380 ± 1.4 × 10 3 9 f 1
0.1502 ± 3.1 × 10 3 6.657 ± 1 × 10 3 f 3
No. 73e–2.12–4.42–8.960.3497 ± 3 × 10 4 2.859 ± 3 × 10 3 f 1
0.6970 ± 3 × 10 4 2 f 1
1.3941 ± 4 × 10 4 4 f 1
1.0467 ± 5 × 10 4 3 f 1
2.0912 ± 6 × 10 4 6 f 1
1.7438 ± 6 × 10 4 5 f 1
2.4409 ± 8 × 10 4 7 f 1
2.7883 ± 9 × 10 4 8 f 1
0.1150 ± 1.1 × 10 3 8.695 ± 8 × 10 3 f 2
3.1380 ± 1 × 10 4 9 f 1
0.2206 ± 3 × 10 4 4.532 ± 7 × 10 3 f 3
0.4717 ± 3 × 10 4 2.119 ± 3 × 10 3 f 4
No. 87–2.03–4.86–7.700.6970 ± 3 × 10 4 2 f 1
0.3473 ± 3 × 10 4 2.859 ± 3 × 10 3 f 1
1.3941 ± 4 × 10 4 4 f 1
1.0467 ± 5 × 10 4 3 f 1
2.0912 ± 6 × 10 4 6 f 1
1.7438 ± 6 × 10 4 5 f 1
2.4409 ± 8 × 10 4 7 f 1
2.7883 ± 9 × 10 4 8 f 1
0.1361 ± 1.2 × 10 3 7.345 ± 6 × 10 3 f 2
3.1380 ± 1.4 × 10 3 9 f 1
0.4905 ± 3.1 × 10 3 2.038 ± 4 × 10 3 f 3
0.2112 ± 3 × 10 4 4.734 ± 3 × 10 3 f 4
No. 9 2 –1.27–1.60.7017 ± 4 × 10 4 2 f 3
0.6196 ± 8 × 10 4 1.613 ± 2 × 10 3 f 1
0.7909 ± 8 × 10 4 1.264 ± 1 × 10 3 f 2
0.3473 ± 1 × 10 3 2.878 ± 8 × 10 3 f 3
1.3941 ± 1.3 × 10 3 4 f 3
1.0468 ± 1.4 × 10 3 3 f 3
2.0936 ± 1.7 × 10 3 6 f 3
1.7439 ± 1.7 × 10 3 5 f 3
2.4386 ± 2.4 × 10 3 7 f 3
2.7883 ± 2.7 × 10 3 8 f 3
3.1380 ± 4.1 × 10 3 9 f 3
No. 101.2–1.32–1.60.8308 ± 4 × 10 4 1.203 ± 1 × 10 3 f 1
0.3473 ± 7 × 10 4 2.878 ± 6 × 10 3 f 2
0.6243 ± 5 × 10 4 1.601 ± 1 × 10 3 f 3
1.3941 ± 9 × 10 4 4 f 2
0.7416 ± 5 × 10 4 1.348 ± 1 × 10 3 f 4
1.0468 ± 1 × 10 4 3 f 2
2.0912 ± 1 × 10 4 6 f 2
1.7415 ± 1 × 10 4 5 f 2
2.7883 ± 1 × 10 4 8 f 2
2.4386 ± 1 × 10 4 7 f 2
No. 11 2 –0.94–2.78–1.270.6970 ± 4 × 10 4 1.434 ± 1 × 10 3 2 f 1
0.3544 ± 4 × 10 4 2.821 ± 3 × 10 3 f 1
1.0515 ± 5 × 10 4 0.951 ± 1 × 10 3 3 f 1
0.7886 ± 5 × 10 4 1.268 ± 1 × 10 3 f 2
1.3941 ± 9 × 10 4 4 f 1
2.0936 ± 1 × 10 4 6 f 1
1.7415 ± 1 × 10 4 5 f 1
2.4386 ± 1 × 10 4 7 f 1
2.7883 ± 2 × 10 4 8 f 1
No. 121.2–0.84–2.06–1.320.8355 ± 7 × 10 4 1.196 ± 1 × 10 3 f 1
0.3473 ± 8 × 10 4 2.878 ± 6 × 10 3 f 2
0.4858 ± 8 × 10 4 2.058 ± 3 × 10 3 f 3
1.1759 ± 8 × 10 4 0.850 ± 1 × 10 3 f 4
1.3918 ± 1 × 10 4 4 f 2
1.0468 ± 1 × 10 4 3 f 2
0.7011 ± 1 × 10 4 2 f 2
2.0912 ± 1 × 10 4 6 f 2
1.7415 ± 1 × 10 4 5 f 2
2.4409 ± 2 × 10 4 7 f 2
2.7883 ± 2 × 10 4 8 f 2
0.7440 ± 2 × 10 4 1.344 ± 1 × 10 3 f 5
3.1380 ± 3 × 10 4 9 f 2
No. 13 2 –1.27–1.60.6970 ± 4 × 10 4 2 f 1
0.3473 ± 4 × 10 4 2.878 ± 3 × 10 3 f 1
1.3941 ± 5 × 10 4 4 f 1
1.0468 ± 6 × 10 4 3 f 1
2.0912 ± 7 × 10 4 6 f 1
1.7439 ± 7 × 10 4 5 f 1
2.4386 ± 1 × 10 4 7 f 1
2.7883 ± 1 × 10 4 8 f 1
3.1380 ± 1 × 10 4 9 f 1
0.6219 ± 1 × 10 4 1.607 ± 4 × 10 3 f 2
3.4854 ± 2 × 10 4 10 f 1
0.7909 ± 1 × 10 4 1.264 ± 2 × 10 3 f 3
No. 141.2–1.32–1.60.3473 ± 4 × 10 4 2.878 ± 3 × 10 3 f 1
1.3941 ± 5 × 10 4 4 f 1
0.6994 ± 4 × 10 4 2 f 1
1.0467 ± 5 × 10 4 3 f 1
2.0912 ± 7 × 10 4 6 f 1
1.7438 ± 7 × 10 4 5 f 1
2.4409 ± 1 × 10 4 7 f 1
0.8332 ± 1 × 10 4 1.200 ± 1 × 10 3 f 2
2.7883 ± 1 × 10 4 8 f 1
3.1380 ± 1 × 10 4 9 f 1
3.4853 ± 2 × 10 4 10 f 1
0.6290 ± 1 × 10 4 1.589 ± 4 × 10 3 f 3
0.7557 ± 2 × 10 4 1.323 ± 3 × 10 3 f 4
No. 15 2 –0.94–2.78–1.270.6970 ± 4 × 10 4 2 f 1
0.3497 ± 4 × 10 4 2.8594 ± 3 × 10 4 f 1
1.3941 ± 6 × 10 4 4 f 1
1.0468 ± 6 × 10 4 3 f 1
2.0912 ± 9 × 10 4 6 f 1
1.7439 ± 8 × 10 4 5 f 1
2.4409 ± 1 × 10 4 7 f 1
2.7883 ± 1 × 10 4 8 f 1
3.1380 ± 2 × 10 4 9 f 1
0.7886 ± 2 × 10 4 1.268 ± 1 × 10 3 f 2
3.4854 ± 2 × 10 4 10 f 1
No. 161.2–0.84–2.06–1.320.3473 ± 5 × 10 4 2.878 ± 3 × 10 3 f 1
0.6970 ± 5 × 10 4 2 f 1
1.3941 ± 6 × 10 4 4 f 1
1.0467 ± 7 × 10 4 3 f 1
2.0912 ± 8 × 10 4 6 f 1
1.7438 ± 8 × 10 4 5 f 1
2.4409 ± 1 × 10 4 7 f 1
2.7883 ± 1 × 10 4 8 f 1
0.8308 ± 2 × 10 4 1.203 ± 1 × 10 3 f 2
3.1380 ± 2 × 10 4 9 f 1
3.4853 ± 2 × 10 4 10 f 1
0.4881 ± 2 × 10 4 2.048 ± 5 × 10 3 f 3
1.1805 ± 2 × 10 4 0.847 ± 1 × 10 3 f 4
0.7510 ± 2 × 10 4 1.331 ± 3 × 10 3 f 5
No. 173e–100.9036 ± 4 × 10 4 1.106 ± 2 × 10 3 f 1
0.0985 ± 4 × 10 4 10.144 ± 4 × 10 3 f 2
0.6970 ± 6 × 10 4 2 f 3
0.3497 ± 6 × 10 4 2.859 ± 1 × 10 3 f 3
1.3941 ± 7 × 10 4 4 f 3
1.0468 ± 8 × 10 4 3 f 3
2.0912 ± 1 × 10 4 6 f 3
1.7439 ± 1 × 10 4 5 f 3
2.4409 ± 1 × 10 4 7 f 3
2.7883 ± 2 × 10 4 8 f 3
3.1380 ± 2 × 10 4 9 f 3
No. 187–100.1502 ± 4 × 10 4 6.657 ± 1 × 10 3 f 1
0.1009 ± 4 × 10 4 9.908 ± 4 × 10 3 f 2
0.6979 ± 6 × 10 4 2 f 3
0.3473 ± 5 × 10 4 2.878 ± 1 × 10 3 f 3
1.3941 ± 7 × 10 4 4 f 3
1.0468 ± 8 × 10 4 3 f 3
2.0912 ± 9 × 10 4 6 f 3
1.7439 ± 9 × 10 4 5 f 3
2.4409 ± 1 × 10 4 7 f 3
2.7883 ± 1 × 10 4 8 f 3
3.1380 ± 2 × 10 4 9 f 3
No. 193e–2.12–4.420.3497 ± 6 × 10 4 2.878 ± 3 × 10 3 f 1
0.2182 ± 7 × 10 4 4.581 ± 1 × 10 3 f 2
0.4717 ± 7 × 10 4 2.119 ± 3 × 10 3 f 3
0.6970 ± 7 × 10 4 2 f 1
0.1173 ± 7 × 10 4 8.521 ± 5 × 10 3 f 4
1.3941 ± 8 × 10 4 4 f 1
1.0467 ± 9 × 10 4 3 f 1
2.0935 ± 1 × 10 4 6 f 1
1.7438 ± 1 × 10 4 5 f 1
2.4385 ± 1 × 10 4 7 f 1
2.7883 ± 2 × 10 4 8 f 1
3.1380 ± 2 × 10 4 9 f 1
No. 207–2.03–4.860.1408 ± 1 × 10 4 7.101 ± 5 × 10 3 f 1
0.6970 ± 1 × 10 4 1.434 ± 2 × 10 3 f 2
0.2792 ± 1 × 10 4 2 f 1
0.4224 ± 9 × 10 4 3 f 1
1.3941 ± 1 × 10 4 2 f 2
1.0467 ± 1 × 10 4 3 / 2 f 2
1.7438 ± 1 × 10 4 5 / 2 f 2
2.0912 ± 2 × 10 4 3 f 2
0.5609 ± 1 × 10 4 4 f 1
2.4409 ± 2 × 10 4 7 / 2 f 2
2.7883 ± 2 × 10 4 4 f 2
0.2041 ± 1 × 10 4 4.897 ± 3 × 10 3 f 3
No. 213e–100.6970 ± 5 × 10 4 2 f 1
0.3473 ± 4 × 10 4 2.878 ± 4 × 10 3 f 1
1.3941 ± 6 × 10 4 4 f 1
1.0467 ± 6 × 10 4 3 f 1
2.0912 ± 8 × 10 4 6 f 1
1.7438 ± 8 × 10 4 5 f 1
2.4409 ± 1 × 10 4 7 f 1
2.7883 ± 1 × 10 4 8 f 1
0.9059 ± 1 × 10 4 1.103 ± 1 × 10 3 f 2
3.1380 ± 2 × 10 4 9 f 1
0.0985 ± 1 × 10 4 10.144 ± 1.8 × 10 3 f 3
No. 227–100.6970 ± 5 × 10 4 2 f 1
0.3473 ± 4 × 10 4 2.878 ± 4 × 10 3 f 1
1.3941 ± 6 × 10 4 4 f 1
1.0467 ± 6 × 10 4 3 f 1
2.0912 ± 8 × 10 4 6 f 1
1.7438 ± 8 × 10 4 5 f 1
2.4409 ± 1 × 10 4 7 f 1
2.7883 ± 1 × 10 4 8 f 1
0.1478 ± 1 × 10 4 6.762 ± 8 × 10 3 f 2
3.1380 ± 2 × 10 4 9 f 1
0.1009 ± 1 × 10 4 9.908 ± 1.7 × 10 3 f 3
No. 233e–2.12–4.420.3473 ± 4 × 10 4 2.878 ± 4 × 10 3 f 1
0.6970 ± 5 × 10 4 2 f 1
1.3941 ± 6 × 10 4 4 f 1
1.0467 ± 6 × 10 4 3 f 1
2.0912 ± 8 × 10 4 6 f 1
1.7438 ± 8 × 10 4 5 f 1
2.4409 ± 1 × 10 4 7 f 1
2.7883 ± 1 × 10 4 8 f 1
3.1380 ± 2 × 10 4 9 f 1
0.2182 ± 2 × 10 4 4.581 ± 5 × 10 3 f 2
0.4717 ± 3 × 10 4 2.119 ± 1 × 10 3 f 3
0.1173 ± 3 × 10 4 8.521 ± 1.8 × 10 3 f 4
No. 247–2.03–4.860.6970 ± 7 × 10 4 2 f 1
0.3473 ± 7 × 10 4 2.878 ± 1 × 10 3 f 1
1.3941 ± 9 × 10 4 4 f 1
1.0467 ± 1 × 10 4 3 f 1
2.0912 ± 1 × 10 4 6 f 1
1.7438 ± 1 × 10 4 5 f 1
2.4409 ± 2 × 10 4 7 f 1
2.7883 ± 2 × 10 4 8 f 1
3.1380 ± 3 × 10 4 9 f 1
0.1408 ± 3 × 10 4 7.101 ± 1.6 × 10 3 f 2
0.4881 ± 3 × 10 4 2.048 ± 2 × 10 3 f 3
No. 25 2 –1.60.7064 ± 2 × 10 4 2 f 2
0.6243 ± 4 × 10 4 1.601 ± 1 × 10 3 f 1
0.3473 ± 5 × 10 4 2.878 ± 3 × 10 3 f 2
1.3941 ± 7 × 10 4 4 f 2
1.0444 ± 7 × 10 4 3 f 2
2.0912 ± 9 × 10 4 6 f 2
1.7438 ± 9 × 10 4 5 f 2
2.4409 ± 1 × 10 4 7 f 2
2.7883 ± 1 × 10 4 8 f 2
No. 261.2–1.60.8332 ± 4 × 10 4 1.200 ± 1 × 10 3 f 1
0.3473 ± 6 × 10 4 2.878 ± 4 × 10 3 f 2
0.6219 ± 4 × 10 4 1.607 ± 1 × 10 3 f 3
1.3941 ± 7 × 10 4 4 f 2
0.6970 ± 6 × 10 4 2 f 2
1.0467 ± 8 × 10 4 3 f 2
2.0912 ± 1 × 10 4 6 f 2
1.7438 ± 1 × 10 4 5 f 2
2.4409 ± 1 × 10 4 7 f 2
2.7883 ± 1 × 10 4 8 f 2
3.1380 ± 2 × 10 4 9 f 2
No. 27 2 –0.94–2.780.7017 ± 5 × 10 4 2 f 1
0.3544 ± 4 × 10 4 2.821 ± 3 × 10 3 f 1
1.0514 ± 6 × 10 4 0.951 ± 1 × 10 3 3 f 1
1.3941 ± 1 × 10 4 4 f 1
2.0912 ± 1 × 10 4 6 f 1
1.7438 ± 2 × 10 4 5 f 1
2.4409 ± 2 × 10 4 7 f 1
2.7883 ± 2 × 10 4 8 f 1
3.1380 ± 3 × 10 4 9 f 1
No. 281.2–0.84–2.060.3473 ± 6 × 10 4 2.878 ± 4 × 10 3 f 1
0.8355 ± 6 × 10 4 1.196 ± 1 × 10 3 f 2
1.1782 ± 6 × 10 4 0.848 ± 1 × 10 3 f 3
0.4834 ± 6 × 10 4 2.068 ± 2 × 10 3 f 4
0.6970 ± 6 × 10 4 2 f 1
1.3941 ± 8 × 10 4 4 f 1
1.0467 ± 8 × 10 4 3 f 1
2.0912 ± 1 × 10 4 6 f 1
1.7438 ± 1 × 10 4 5 f 1
2.4409 ± 1 × 10 4 7 f 1
2.7883 ± 2 × 10 4 8 f 1
3.1380 ± 3 × 10 4 9 f 1
No. 29 2 –1.60.3473 ± 4 × 10 4 2.878 ± 3 × 10 3 f 1
0.6994 ± 4 × 10 4 2 f 1
1.3941 ± 6 × 10 4 4 f 1
1.0468 ± 6 × 10 4 3 f 1
2.0912 ± 8 × 10 4 6 f 1
1.7439 ± 8 × 10 4 5 f 1
2.4409 ± 1 × 10 4 7 f 1
2.7883 ± 1 × 10 4 8 f 1
3.1380 ± 2 × 10 4 9 f 1
0.6243 ± 1 × 10 4 1.601 ± 4 × 10 3 f 2
No. 301.2–1.60.3473 ± 4 × 10 4 2.878 ± 3 × 10 3 f 1
0.6970 ± 5 × 10 4 2 f 1
1.3941 ± 6 × 10 4 4 f 1
1.0467 ± 6 × 10 4 3 f 1
2.0912 ± 8 × 10 4 6 f 1
1.7438 ± 8 × 10 4 5 f 1
2.4409 ± 1 × 10 4 7 f 1
2.7883 ± 1 × 10 4 8 f 1
0.8332 ± 2 × 10 4 1.200 ± 2 × 10 3 f 2
3.1380 ± 2 × 10 4 9 f 1
0.6243 ± 2 × 10 4 1.601 ± 3 × 10 3 f 3
No. 31 2 –0.94–2.780.3497 ± 4 × 10 4 2.859 ± 3 × 10 3 f 1
0.6994 ± 4 × 10 4 2 f 1
1.3941 ± 6 × 10 4 4 f 1
1.0468 ± 6 × 10 4 3 f 1
2.0912 ± 8 × 10 4 6 f 1
1.7439 ± 8 × 10 4 5 f 1
2.4409 ± 1 × 10 4 7 f 1
2.7883 ± 1 × 10 4 8 f 1
3.1380 ± 2 × 10 4 9 f 1
No. 321.2–0.84–2.060.3473 ± 5 × 10 4 2.878 ± 4 × 10 3 f 1
0.6947 ± 5 × 10 4 2 f 1
1.3941 ± 6 × 10 4 4 f 1
1.0467 ± 7 × 10 4 3 f 1
2.0912 ± 9 × 10 4 6 f 1
1.7438 ± 8 × 10 4 5 f 1
2.4409 ± 1 × 10 4 7 f 1
2.7883 ± 1 × 10 4 8 f 1
3.1380 ± 2 × 10 4 9 f 1
3.4853 ± 2 × 10 4 10 f 1
1.1805 ± 3 × 10 4 0.847 ± 1 × 10 3 f 2
0.4834 ± 3 × 10 4 2.068 ± 1 × 10 2 f 3
0.8332 ± 3 × 10 4 1.200 ± 3 × 10 3 f 4
Figure A1. Periodograms obtained from the Fourier analysis for models No. 0 to No. 23.
Galaxies 11 00069 g0a1aGalaxies 11 00069 g0a1b
Figure A2. Periodograms obtained from the Fourier analysis for models No. 24 to No. 32.
Galaxies 11 00069 g0a2

Appendix B. Wavelet Analysis Results

The periods detected for each synthetic light curve with the wavelet analysis, and their errors, are listed in Table A2. The list of set periods in the simulation design is listed in column 2. It does not include the period of the binary system (2.87 days) present in all the models, except for model No. 0, where is the only period present. Columns 3 and 4 lists the periods present in the first and second parts of the curve. Column 5 indicates the independent periods found and the linear relationship among them. The wavelet power spectrum and the average wavelet power are illustrated in Figure A3, Figure A4, Figure A5, Figure A6, Figure A7 and Figure A8.
Table A2. Wavelet analysis results reporting the significant periods and harmonics. The detected independent periods are highlighted in blue. The symbol e is the Euler number.
ModelFixed Period Values
[Days]
Periods
[Days]
Comment
First PartSecond Part
No. 02.870.548 ± 2.9 × 10 2 0.539 ± 7.3 × 10 2 P 1 / 5
0.728 ± 1.62 × 10 1 0.72 ± 5.4 × 10 2 P 1 / 4
0.979 ± 1.52 × 10 2 0.943 ± 2.3 × 10 2 P 1 / 3
1.43 ± 2.28 × 10 1 1.442 ± 3.8 × 10 2 P 1 / 2
2.785 ± 2.4 × 10 2 2.811 ± 7.2 × 10 2 P 1
No. 13e–8.96–10 0.549 ± 1.9 × 10 2 0.52 ± 5.9 × 10 2 P 1 / 5
0.740 ± 1.5 × 10 1 0.726 ± 1.74 × 10 1 P 1 / 4
1.168 ± 2.8 × 10 2 1.132 ± 1.83 × 10 1 P 2
1.403 ± 5.4 × 10 2 1.472 ± 1.34 × 10 1 P 1 / 2
2.347 ± 1.23 × 10 1 2 P 2
2.787 ± 6.1 × 10 2 P 1
5.719 ± 8 × 10 3 2 P 1
7.852 ± 3.6 × 10 2 P 3
11.435 ± 0 × 10 0 11.551 ± 2.3 × 10 2 4 P 1
22.998 ± 0 × 10 0 8 P 1
No. 27–7.70–10 0.380 ± 1.5 × 10 2 P 3
0.522 ± 4.4 × 10 2 P 1 / 5
0.644 ± 1.18 × 10 1 0.681 ± 1.0 × 10 1 P 1 / 4
0.999 ± 4.0 × 10 2 0.951 ± 3.5 × 10 2 P 1 / 3
1.400 ± 3.7 × 10 2 1.419 ± 9.6 × 10 2 P 1 / 2
2.380 ± 1.20 × 10 1 P 2
2.867 ± 2.1 × 10 2 P 1
4.464 ± 8.5 × 10 2 P 4
5.712 ± 0 × 10 0 2 P 1
8.094 ± 1.11 × 10 1 P 5
11.426 ± 0 × 10 0 11.572 ± 1.5 × 10 2 4 P 1
23.190 ± 0 × 10 0 8 P 1
No. 33e–2.12–4.42–8.96 0.554 ± 4.4 × 10 2 0.541 ± 6.7 × 10 2 P 1 / 5
0.754 ± 2.18 × 10 1 0.731 ± 1.86 × 10 1 P 1 / 4
0.950 ± 7.4 × 10 2 0.937 ± 6.6 × 10 2 P 1 / 3
1.416 ± 2.71 × 10 1 1.464 ± 8.2 × 10 2 P 1 / 2
2.158 ± 1.91 × 10 1 P 3
2.372 ± 7.0 × 10 2 P 2
2.825 ± 8.6 × 10 2 P 1
3.730 ± 1.83 × 10 1 P 4
6.362 ± 5.21 × 10 1 3 P 3
7.360 ± 7.74 × 10 1 2 P 4
11.435 ± 0 × 10 0 11.513 ± 4.5 × 10 2 4 P 1
23.190 ± 0 × 10 0 8 P 1
No. 47–2.03–4.86–7.70 0.557 ± 3.3 × 10 2 0.556 ± 1.03 × 10 1 P 1 / 5
0.723 ± 1.83 × 10 1 0.696 ± 1.0 × 10 1 P 1 / 4
1.003 ± 1.99 × 10 1 0.940 ± 7.6 × 10 2 P 1 / 3
1.422 ± 5.6 × 10 2 1.440 ± 1.08 × 10 1 P 1 / 2
2.027 ± 1.73 × 10 1 P 3
2.257 ± 4.85 × 10 1 P 2
2.892 ± 2.61 × 10 1 P 1
4.038 ± 5.30 × 10 1 2 P 3
5.709 ± 8 × 10 3 5.590 ± 2.16 × 10 1 2 P 1
11.419 ± 0 × 10 0 11.470 ± 5.8 × 10 2 4 P 1
No. 53e–8.96–10 0.582 ± 6.1 × 10 2 0.520 ± 4.5 × 10 2 P 1 / 5
0.751 ± 2.04 × 10 1 0.697 ± 4.3 × 10 2 P 1 / 4
0.989 ± 5.3 × 10 2 0.989 ± 1.64 × 10 1 P 1 / 3
1.370 ± 8 × 10 2 1.441 ± 5.6 × 10 2 P 1 / 2
2.761 ± 6 × 10 2 2.812 ± 4.8 × 10 2 P 1
5.680 ± 3.8 × 10 2 2 P 1
7.865 ± 4.6 × 10 2 P 2
11.419 ± 0 × 10 0 11.532 ± 3.3 × 10 2 4 P 1
No. 67–7.70–10 0.577 ± 6.1 × 10 2 0.565 ± 1.08 × 10 1 P 1 / 5
0.722 ± 1.34 × 10 1 0.688 ± 6.1 × 10 2 P 1 / 4
0.972 ± 1.12 × 10 1 0.941 ± 2.5 × 10 2 P 1 / 3
1.405 ± 3.7 × 10 2 1.436 ± 2 × 10 2 P 1 / 2
2.780 ± 5.2 × 10 2 2.823 ± 5.1 × 10 2 P 1
No. 73e–2.12–4.42–8.96 0.571 ± 5.9 × 10 2 0.547 ± 8.3 × 10 2 P 1 / 5
0.729 ± 1.96 × 10 1 0.692 ± 6.9 × 10 2 P 1 / 4
0.952 ± 4.3 × 10 2 0.938 ± 3.1 × 10 2 P 1 / 3
1.397 ± 4.8 × 10 2 1.438 ± 2.9 × 10 2 P 1 / 2
2.767 ± 6.6 × 10 2 2.794 ± 9.2 × 10 2 P 1
No. 87–2.03–4.86–7.70 0.551 ± 2.6 × 10 2 0.546 ± 8.9 × 10 2 P 1 / 5
0.706 ± 1.64 × 10 1 0.689 ± 5.9 × 10 2 P 1 / 4
0.960 ± 9.0 × 10 2 0.939 ± 3.3 × 10 2 P 1 / 3
1.407 ± 3.5 × 10 2 1.437 ± 2.7 × 10 2 P 1 / 2
2.825 ± 3.0 × 10 2 2.823 ± 8.4 × 10 2 P 1
No. 9 2 –1.27–1.6 0.524 ± 4.1 × 10 2 0.554 ± 1.22 × 10 1 P 1 / 5
0.735 ± 1.52 × 10 1 0.681 ± 5.7 × 10 2 P 1 / 4
1.346 ± 5.8 × 10 2 1.410 ± 1.19 × 10 1 P 1 / 2
2.831 ± 5.94 × 10 1 2.773 ± 1.25 × 10 1 P 1
No. 101.2–1.32–1.6 0.535 ± 3.1 × 10 2 0.500 ± 3.0 × 10 2 P 1 / 5
0.766 ± 1.75 × 10 1 0.671 ± 4.6 × 10 2 P 1 / 4
1.246 ± 3.2 × 10 2 1.219 ± 5.9 × 10 2 P 3
1.702 ± 3.8 × 10 2 P 2
2.745 ± 1.84 × 10 1 2.781 ± 1.00 × 10 1 P 1
No. 11 2 –0.94–2.78–1.27 0.512 ± 2.3 × 10 2 0.505 ± 2.6 × 10 2 P 1 / 5
0.651 ± 1.6 × 10 2 P 1 / 4
0.959 ± 4.7 × 10 2 0.949 ± 3.9 × 10 2 P 1 / 3
1.380 ± 4.6 × 10 2 1.406 ± 8.1 × 10 2 P 1 / 2
2.789 ± 8.1 × 10 2 2.763 ± 1.37 × 10 1 P 1
No. 121.2–0.84–2.06–1.32 0.380 ± 1.6 × 10 2 P 4
0.524 ± 1.5 × 10 2 0.502 ± 3.8 × 10 2 P 1 / 5
0.953 ± 7.2 × 10 2 0.900 ± 6.8 × 10 2 P 1 / 3
1.211 ± 5.3 × 10 2 1.249 ± 9.7 × 10 2 P 3
2.099 ± 2.2 × 10 1 2.136 ± 1.5 × 10 1 P 2
2.751 ± 1.9 × 10 1 2.797 ± 1.33 × 10 1 P 1
No. 13 2 –1.27–1.6 0.546 ± 2.8 × 10 2 0.512 ± 3.3 × 10 2 P 1 / 5
0.696 ± 3.9 × 10 2 0.687 ± 4.7 × 10 2 P 1 / 4
0.952 ± 6.0 × 10 3 0.949 ± 6.0 × 10 3 P 1 / 3
1.397 ± 6.5 × 10 2 1.409 ± 3.7 × 10 2 P 1 / 2
2.831 ± 2.8 × 10 2 2.805 ± 7.9 × 10 2 P 1
No. 141.2–1.32–1.6 0.547 ± 2.5 × 10 2 0.514 ± 3.7 × 10 2 P 1 / 5
0.704 ± 5.0 × 10 3 0.689 ± 5.3 × 10 2 P 1 / 4
0.976 ± 5.1 × 10 2 0.971 ± 3.8 × 10 2 P 1 / 3
1.385 ± 8.0 × 10 3 1.404 ± 5.3 × 10 2 P 1 / 2
2.811 ± 4.4 × 10 2 2.784 ± 1.19 × 10 1 P 1
No. 15 2 –0.94–2.78–1.27 0.551 ± 2.9 × 10 2 0.520 ± 4.3 × 10 2 P 1 / 5
0.738 ± 1.91 × 10 1 0.706 ± 1.52 × 10 1 P 1 / 4
0.974 ± 1.72 × 10 1 0.964 ± 1.15 × 10 1 P 1 / 3
1.408 ± 3.0 × 10 2 1.438 ± 1.52 × 10 1 P 1 / 2
2.809 ± 4.1 × 10 2 2.796 ± 9.7 × 10 2 P 1
No. 161.2–0.84–2.06–1.32 0.544 ± 2.4 × 10 2 0.527 ± 6.5 × 10 2 P 1 / 5
0.686 ± 1.26 × 10 1 0.788 ± 2.25 × 10 1 P 1 / 4
1.028 ± 2.33 × 10 1 0.946 ± 7.6 × 10 2 P 1 / 3
1.436 ± 2.1 × 10 1 1.429 ± 7.2 × 10 2 P 1 / 2
2.803 ± 7.0 × 10 2 2.791 ± 1.19 × 10 1 P 1
No. 173e–10 0.558 ± 5.6 × 10 2 0.535 ± 1.08 × 10 1 P 1 / 5
0.792 ± 1.88 × 10 1 0.704 ± 1.13 × 10 1 P 1 / 4
1.150 ± 2.3 × 10 2 1.131 ± 1.84 × 10 1 P 3
1.472 ± 7.6 × 10 2 P 1 / 2
2.506 ± 5.8 × 10 2 P 2
2.809 ± 6.7 × 10 2 P 1
5.712 ± 0 × 10 0 2 P 1
7.928 ± 6.1 × 10 2 P 4
11.435 ± 0 × 10 0 11.553 ± 2.4 × 10 2 4 P 1
22.998 ± 0 × 10 0 8 P 1
No. 187–10 0.388 ± 2.7 × 10 2 P 3
0.498 ± 3.3 × 10 2 P 1 / 5
0.634 ± 9.7 × 10 2 0.674 ± 5.6 × 10 2 P 1 / 4
0.983 ± 2.1 × 10 2 0.954 ± 7.2 × 10 2 P 1 / 3
1.401 ± 3.3 × 10 2 1.411 ± 4.9 × 10 2 P 1 / 2
2.361 ± 1.31 × 10 1 P 2
2.983 ± 6.1 × 10 2 P 1
5.697 ± 0 × 10 0 5.065 ± 5.8 × 10 2 2 P 1
11.413 ± 0 × 10 0 11.590 ± 0 × 10 0 4 P 1
23.192 ± 0 × 10 0 8 P 1
No. 193e–2.12–4.42 0.551 ± 1.17 × 10 1 0.514 ± 2.70 × 10 2 P 1 / 5
0.722 ± 1.15 × 10 1 0.696 ± 9.80 × 10 2 P 1 / 4
0.931 ± 4.60 × 10 2 0.937 ± 6.40 × 10 2 P 1 / 3
1.390 ± 7.80 × 10 2 1.460 ± 7.00 × 10 2 P 1 / 2
2.151 ± 8.90 × 10 2 P 2
2.710 ± 2.91 × 10 1 2.840 ± 4.70 × 10 1 P 1
3.772 ± 8.60 × 10 2 P 3
5.703 ± 3.70 × 10 2 6.108 ± 2.04 × 10 1 2 P 1
11.442 ± 0 × 10 0 11.418 ± 1.40 × 10 2 4 P 1
No. 207–2.03–4.86 0.570 ± 5.3 × 10 2 0.506 ± 3.1 × 10 2 P 1 / 3
0.707 ± 1.67 × 10 1 0.679 ± 1.04 × 10 1 P 1 / 2
1.020 ± 2.10 × 10 1 0.960 ± 1.0 × 10 2 2 P 1 / 3
1.422 ± 4.9 × 10 2 1.455 ± 7.5 × 10 2 P 1
2.056 ± 1.49 × 10 1 2.149 ± 1.29 × 10 1 P 2
3.772 ± 2.11 × 10 1 3.351 ± 1.78 × 10 1 P 3
5.702 ± 1.4 × 10 2 5.050 ± 6.25 × 10 1 4 P 1
11.442 ± 0.0 × 10 1 11.427 ± 1.6 × 10 2 8 P 1
No. 213e–10 0.572 ± 5.7 × 10 2 0.512 ± 2.0 × 10 2 P 1 / 5
0.745 ± 1.87 × 10 1 0.680 ± 1.14 × 10 1 P 1 / 4
1.033 ± 1.95 × 10 1 1.083 ± 3.44 × 10 1 P 1 / 3
1.382 ± 6.3 × 10 2 1.438 ± 4.0 × 10 2 P 1 / 2
2.789 ± 4.7 × 10 2 2.814 ± 5.9 × 10 2 P 1
7.924 ± 6.2 × 10 2 P 2
No. 227–10 0.524 ± 8 × 10 3 0.518 ± 2.6 × 10 2 P 1 / 5
0.736 ± 2.23 × 10 1 0.682 ± 1.03 × 10 1 P 1 / 4
0.987 ± 1.75 × 10 1 0.955 ± 1.37 × 10 1 P 1 / 3
1.405 ± 3.4 × 10 2 1.434 ± 2.3 × 10 2 P 1 / 2
2.775 ± 5.2 × 10 2 2.845 ± 4.5 × 10 2 P 1
4.772 ± 1.23 × 10 1 P 2
No. 233e–2.12–4.42 0.542 ± 2.3 × 10 2 0.520 ± 4.2 × 10 2 P 1 / 5
0.707 ± 1.09 × 10 1 0.690 ± 7.4 × 10 2 P 1 / 4
0.954 ± 2.3 × 10 2 0.947 ± 1.7 × 10 2 P 1 / 3
1.412 ± 1.75 × 10 1 1.437 ± 2.7 × 10 2 P 1 / 2
2.791 ± 5.3 × 10 2 2.790 ± 1.16 × 10 1 P 1
No. 247–2.03–4.86 0.557 ± 3.5 × 10 2 0.520 ± 4.2 × 10 2 P 1 / 5
0.726 ± 2.05 × 10 1 0.689 ± 6.7 × 10 2 P 1 / 4
0.962 ± 6.4 × 10 2 0.947 ± 1.15 × 10 1 P 1 / 3
1.413 ± 2.3 × 10 2 1.435 ± 2.5 × 10 2 P 1 / 2
2.823 ± 3.1 × 10 2 2.835 ± 8.9 × 10 2 P 1
No. 25 2 –1.6 0.519 ± 3.3 × 10 2 0.526 ± 7.5 × 10 2 P 1 / 5
0.670 ± 5.8 × 10 2 P 1 / 4
0.836 ± 2.61 × 10 1 P 3
0.978 ± 3.4 × 10 2 P 1 / 3
1.380 ± 3.8 × 10 2 1.411 ± 4.5 × 10 2 P 1 / 2
2.061 ± 2.84 × 10 1 P 2
2.808 ± 5.14 × 10 1 2.840 ± 5.85 × 10 1 P 1
No. 261.2–1.6 0.522 ± 3.6 × 10 2 0.507 ± 2.7 × 10 2 P 1 / 5
0.742 ± 1.79 × 10 1 0.751 ± 2.59 × 10 1 P 1 / 4
1.182 ± 1.04 × 10 1 P 3
1.347 ± 4.32 × 10 1 P 1 / 2
1.894 ± 7.0 × 10 1 1.637 ± 7.8 × 10 2 P 2
2.724 ± 2.19 × 10 1 2.748 ± 1.57 × 10 1 P 1
No. 27 2 –0.94–2.78 0.555 ± 1.09 × 10 1 0.533 ± 9.8 × 10 2 P 1 / 5
1.045 ± 2.74 × 10 1 0.967 ± 1.4 × 10 1 P 1 / 3
1.407 ± 6.1 × 10 2 1.417 ± 6.6 × 10 2 P 1 / 2
2.793 ± 5.3 × 10 2 2.779 ± 1.11 × 10 1 P 1
No. 281.2–0.84–2.06 0.56 ± 9.4 × 10 2 0.519 ± 8.7 × 10 2 P 1 / 5
0.903 ± 8 × 10 2 P 1 / 3
1.141 ± 3.67 × 10 1 P 4
1.553 ± 5.44 × 10 1 P 1 / 2
1.74 ± 6.92 × 10 1 P 3
2.237 ± 4.93 × 10 1 P 2
2.629 ± 4.37 × 10 1 2.813 ± 1.16 × 10 1 P 1
No. 29 2 –1.6 0.542 ± 2.4 × 10 2 0.535 ± 7.2 × 10 2 P 1 / 5
0.742 ± 1.95 × 10 1 0.685 ± 6.6 × 10 2 P 1 / 4
0.989 ± 1.87 × 10 1 0.971 ± 1.58 × 10 1 P 1 / 3
1.466 ± 2.65 × 10 1 1.425 ± 2.5 × 10 2 P 1 / 2
2.799 ± 4.2 × 10 2 2.796 ± 9.5 × 10 2 P 1
No. 301.2–1.6 0.542 ± 2.4 × 10 2 0.526 ± 5.9 × 10 2 P 1 / 5
0.714 ± 1.64 × 10 1 0.715 ± 3.6 × 10 2 P 1 / 4
0.969 ± 1.44 × 10 1 0.959 ± 1.17 × 10 1 P 1 / 3
1.409 ± 1.70 × 10 1 1.403 ± 4.2 × 10 2 P 1 / 2
2.804 ± 4.2 × 10 2 2.791 ± 1.07 × 10 1 P 1
No. 31 2 –0.94–2.78 0.545 ± 2.2 × 10 2 0.526 ± 5.9 × 10 2 P 1 / 5
0.723 ± 1.67 × 10 1 0.705 ± 1.18 × 10 1 P 1 / 4
0.984 ± 1.64 × 10 1 0.962 ± 1.28 × 10 1 P 1 / 3
1.405 ± 4.0 × 10 2 1.436 ± 4.3 × 10 2 P 1 / 2
2.810 ± 3.7 × 10 2 2.801 ± 8.5 × 10 2 P 1
No. 321.2–0.84–2.06 0.543 ± 2.3 × 10 2 0.525 ± 6.2 × 10 2 P 1 / 5
0.742 ± 2.2 × 10 1 0.735 ± 1.31 × 10 1 P 1 / 4
0.967 ± 4.1 × 10 2 0.941 ± 4.1 × 10 2 P 1 / 3
1.488 ± 3.29 × 10 1 1.435 ± 7.1 × 10 2 P 1 / 2
2.798 ± 6.5 × 10 2 2.791 ± 1.25 × 10 1 P 1
Figure A3. Results of the wavelet analysis for models No. 0 to No. 5. From left to right the wavelet power spectrum and the average wavelet power for the first and second part of each synthetic curve.
Galaxies 11 00069 g0a3
Figure A4. Results of the wavelet analysis for models No. 6 to No. 11. From left to right the wavelet power spectrum and the average wavelet power for the first and second part of each synthetic curve.
Galaxies 11 00069 g0a4
Figure A5. Results of the wavelet analysis for models No. 12 to No. 17. From left to right the wavelet power spectrum and the average wavelet power for the first and second part of each synthetic curve.
Galaxies 11 00069 g0a5
Figure A6. Results of the wavelet analysis for models No. 18 to No. 23. From left to right the wavelet power spectrum and the average wavelet power for the first and second part of each synthetic curve.
Galaxies 11 00069 g0a6
Figure A7. Results of the wavelet analysis for models No. 24 to No. 29. From left to right the wavelet power spectrum and the average wavelet power for the first and second part of each synthetic curve.
Galaxies 11 00069 g0a7
Figure A8. Results of the wavelet analysis for models No. 30 to No. 32. From left to right the wavelet power spectrum and the average wavelet power for the first and second part of each synthetic curve.
Galaxies 11 00069 g0a8

Note

1
The search for the most important factors that may be varied in a simulated system.

References

  1. Sana, H.; de Mink, S.E.; de Koter, A.; Langer, N.; Evans, C.J.; Gieles, M.; Gosset, E.; Izzard, R.G.; Le Bouquin, J.B.; Schneider, F.R.N. Binary Interaction Dominates the Evolution of Massive Stars. Science 2012, 337, 444. [Google Scholar] [CrossRef]
  2. Mason, B.D.; Hartkopf, W.I.; Henry, T.J.; Jao, W.C.; Subasavage, J.; Riedel, A.; Winters, J. Nearby Dwarf Stars: Duplicity, Binarity, and Masses. Noao Propos. 2009, 2009B-0044, 44. [Google Scholar]
  3. Sana, H.; Le Bouquin, J.B.; Lacour, S.; Berger, J.P.; Duvert, G.; Gauchet, L.; Norris, B.; Olofsson, J.; Pickel, D.; Zins, G.; et al. Southern Massive Stars at High Angular Resolution: Observational Campaign and Companion Detection. Astrophys. J. Suppl. Ser. 2014, 215, 15. [Google Scholar] [CrossRef]
  4. Dunstall, P.R.; Dufton, P.L.; Sana, H.; Evans, C.J.; Howarth, I.D.; Simón-Díaz, S.; de Mink, S.E.; Langer, N.; Maíz Apellániz, J.; Taylor, W.D. The VLT-FLAMES Tarantula Survey. XXII. Multiplicity properties of the B-type stars. Astron. Astrophys. 2015, 580, A93. [Google Scholar] [CrossRef]
  5. Villaseñor, J.I.; Taylor, W.D.; Evans, C.J.; Ramírez-Agudelo, O.H.; Sana, H.; Almeida, L.A.; de Mink, S.E.; Dufton, P.L.; Langer, N. The B-type binaries characterization programme I. Orbital solutions for the 30 Doradus population. Mon. Not. R. Astron. Soc. 2021, 507, 5348–5375. [Google Scholar] [CrossRef]
  6. Barbá, R.H.; Gamen, R.; Arias, J.I.; Morrell, N.I. OWN Survey: A spectroscopic monitoring of Southern Galactic O and WN-type stars. In Proceedings of the The Lives and Death-Throes of Massive Stars; Eldridge, J.J., Bray, J.C., McClelland, L.A.S., Xiao, L., Eds.; Cambridge University Press: Cambridge, UK, 2017; Volume 329, pp. 89–96. [Google Scholar] [CrossRef]
  7. Godart, M.; Grotsch-Noels, A.; Dupret, M.A. Pulsations in hot supergiants. In Proceedings of the Precision Asteroseismology; Guzik, J.A., Chaplin, W.J., Handler, G., Pigulski, A., Eds.; Cambridge University Press: Cambridge, UK, 2014; Volume 301, pp. 313–320. [Google Scholar] [CrossRef]
  8. Saio, H.; Kuschnig, R.; Gautschy, A.; Cameron, C.; Walker, G.A.H.; Matthews, J.M.; Guenther, D.B.; Moffat, A.F.J.; Rucinski, S.M.; Sasselov, D.; et al. MOSTDetectsg- andp-Modes in the B Supergiant HD 163899 (B2 Ib/II). Astrophys. J. 2006, 650, 1111–1118. [Google Scholar] [CrossRef]
  9. Mennickent, R.E.; Kołaczkowski, Z.; Soszyński, I.; Cabezas, M.; Garrido, H.E. The SMC B-type supergiant AzV322: A g-mode pulsator with a circumstellar disc. Mon. Not. R. Astron. Soc. 2018, 473, 4055–4063. [Google Scholar] [CrossRef]
  10. Glatzel, W. Nonlinear strange-mode pulsations. Commun. Asteroseismol. 2009, 158, 252. [Google Scholar]
  11. Godart, M.; Dupret, M.A.; Noels, A.; Aerts, C.; Simón-Díaz, S.; Lefever, K.; Puls, J.; Montalban, J.; Ventura, P. Pulsations in massive stars: Effect of the atmosphere on the strange mode pulsations. In Proceedings of the Active OB Stars: Structure, Evolution, Mass Loss, and Critical Limits; Neiner, C., Wade, G., Meynet, G., Peters, G., Eds.; Cambridge University Press: Cambridge, UK, 2011; Volume 272, pp. 503–504. [Google Scholar] [CrossRef]
  12. Kraus, M.; Haucke, M.; Cidale, L.S.; Venero, R.O.J.; Nickeler, D.H.; Németh, P.; Niemczura, E.; Tomić, S.; Aret, A.; Kubát, J.; et al. Interplay between pulsations and mass loss in the blue supergiant 55 Cygnus = HD 198 478. Astron. Astrophys. 2015, 581, A75. [Google Scholar] [CrossRef]
  13. Yadav, A.P.; Glatzel, W. Stability analysis, non-linear pulsations and mass loss of models for 55 Cygni (HD 198478). Mon. Not. R. Astron. Soc. 2016, 457, 4330–4339. [Google Scholar] [CrossRef]
  14. Sterken, C. Some thoughts on pulsation and binarity. Astrophys. Space Sci. 2006, 304, 139–143. [Google Scholar] [CrossRef]
  15. Simón-Díaz, S.; Herrero, A.; Uytterhoeven, K.; Castro, N.; Aerts, C.; Puls, J. Observational Evidence for a Correlation Between Macroturbulent Broadening and Line-profile Variations in OB Supergiants. Astrophys. J. Lett. 2010, 720, L174–L178. [Google Scholar] [CrossRef]
  16. Aerts, C.; Puls, J.; Godart, M.; Dupret, M.A. Collective pulsational velocity broadening due to gravity modes as a physical explanation for macroturbulence in hot massive stars. Astron. Astrophys. 2009, 508, 409–419. [Google Scholar] [CrossRef]
  17. Shibahashi, H.; Kurtz, D.W. FM stars: A Fourier view of pulsating binary stars, a new technique for measuring radial velocities photometrically. Mon. Not. R. Astron. Soc. 2012, 422, 738–752. [Google Scholar] [CrossRef]
  18. Murphy, S. Pulsating stars in binary systems: A review. arXiv 2018. [Google Scholar] [CrossRef]
  19. Lomb, N.R. Least-Squares Frequency Analysis of Unequally Spaced Data. Astrophys. Space Sci. 1976, 39, 447–462. [Google Scholar] [CrossRef]
  20. Scargle, J.D. Studies in astronomical time series analysis. II. Statistical aspects of spectral analysis of unevenly spaced data. Astrophys. J. Part 1 1982, 263, 835–853. [Google Scholar] [CrossRef]
  21. Hübner, M.; Huppenkothen, D.; Lasky, P.D.; Inglis, A.R. Pitfalls of Periodograms: The Nonstationarity Bias in the Analysis of Quasiperiodic Oscillations. Astrophys. J. Suppl. Ser. 2022, 259, 32. [Google Scholar] [CrossRef]
  22. Foster, G. Wavelets for period analysis of unevenly sampled time series. Astron. J. 1996, 112, 1709–1729. [Google Scholar] [CrossRef]
  23. López-Santiago, J. On the use of wavelets to reveal oscillatory patterns in stellar flare emission. Philos. Trans. R. Soc. Lond. Ser. A 2018, 376, 20170253. [Google Scholar] [CrossRef]
  24. Zhou, A.Y.; Hintz, E.G.; Schoonmaker, J.N.; Rodríguez, E.; Costa, V.; Lopez-Gonzalez, M.J.; Smith, H.A.; Sanders, N.; Monninger, G.; Pagel, L. A Pulsational Time-evolution Study for the δ Scuti Star AN Lyncis. arXiv 2017. [Google Scholar] [CrossRef]
  25. Bravo, J.P.; Roque, S.; Estrela, R.; Leã o, I.C.; Medeiros, J.R.D. Wavelets: A powerful tool for studying rotation, activity, and pulsation in Kepler and CoRoT stellar light curves. Astron. Astrophys. 2014, 568, A34. [Google Scholar] [CrossRef]
  26. Graham, M.J.; Drake, A.J.; Djorgovski, S.G.; Mahabal, A.A.; Donalek, C.; Duan, V.; Maker, A. A comparison of period finding algorithms. Mon. Not. R. Astron. Soc. 2013, 434, 3423–3444. [Google Scholar] [CrossRef]
  27. Frescura, F.A.M.; Engelbrecht, C.A.; Frank, B.S. Significance of periodogram peaks and a pulsation mode analysis of the Beta Cephei star V403 Car. Mon. Not. R. Astron. Soc. Mon. Not. R. Astron. Soc. 2008, 388, 1693–1707. [Google Scholar] [CrossRef]
  28. Votruba, V.; Koubský, P.; Korčáková, D.; Hroch, F. False periods in complex chaotic systems. Astron. Astrophys. 2009, 496, 217–222. [Google Scholar] [CrossRef]
  29. Baluev, R.V. Distinguishing between a true period and its alias, and other tasks of model discrimination. Mon. Not. R. Astron. Soc. 2012, 422, 2372–2385. [Google Scholar] [CrossRef]
  30. Misiti, M.; Misiti, Y.; Oppenheim, G.; Poggi, J.M. Wavelets and Their Applications; Iste: London, UK, 2007. [Google Scholar]
  31. Stéphane, M. Discrete Revolution. In A Wavelet Tour of Signal Processing; Elsevier: Amsterdam, The Netherlands, 2009; pp. 59–88. [Google Scholar]
  32. Daubechies, I. Ten Lectures on Wavelets; CBMS-NSF Regional Conference Series in Applied Mathematics, Society for Industrial and Applied Mathematics; Society for Industrial and Applied Mathematics: Philadelphia, PA, USA, 1992. [Google Scholar]
  33. Montgomery, D.C. Design and Analysis of Experiments; John Wiley and Sons (WIE): Brisbane, Australia, 2000. [Google Scholar]
  34. Box, G.E.P.; Hunter, J.S.; Hunter, W.G. Statistics for Experimenters, 2nd ed.; Wiley Series in Probability and Statistics; Wiley-Blackwell: Chichester, UK, 2005. [Google Scholar]
  35. Ricker, G.R.; Winn, J.N.; Vanderspek, R.; Latham, D.W.; Bakos, G.Á.; Bean, J.L.; Berta-Thompson, Z.K.; Brown, T.M.; Buchhave, L.; Butler, N.R.; et al. Transiting Exoplanet Survey Satellite (TESS); SPIE: Bellingham, WA, USA, 2014; Volume 9143, p. 914320. [Google Scholar] [CrossRef]
  36. Kallrath, J.; Milone, E.F. TheWilson–Devinney Program: Extensions and Applications. In Eclipsing Binary Stars: Modeling and Analysis; Springer New York: New York, NY, USA, 2009; pp. 305–330. [Google Scholar] [CrossRef]
  37. Alberici, A.A. Uso Del anáLisis Wavelet Para La Detección De Períodos En Curvas De Luz. Master’s Thesis, Facultad de Ciencias Astronómicas y Geofísicas, Buenos Aires, Argentina, 2022. [Google Scholar]
  38. Wecht, K. Determination of Mass Loss and Mass Transfer Rates of Algol (Beta Persei) from the Analysis of Absorption Lines in the UV Spectra Obtained by the IUE Satellite. Doctoral Dissertation, Cornell University, Bethlehem, PA, USA, 2006. [Google Scholar]
  39. Feigelson, E.D.; Babu, G.J.; Caceres, G.A. Autoregressive times series methods for time domain astronomy. Front. Phys. 2018, 6, 80. [Google Scholar] [CrossRef]
  40. Caceres, G.A.; Feigelson, E.D.; Babu, G.J.; Bahamonde, N.; Christen, A.; Bertin, K.; Meza, C.; Curé, M. Autoregressive Planet Search: Application to the Kepler Mission. Astron. J. 2019, 158, 58. [Google Scholar] [CrossRef]
  41. Whittle, P. Hypothesis Testing in Time Series Analysis; Almqvist & Wiksell: Stockholm, Sweden, 1951. [Google Scholar]
  42. Caceres, G.A.; Feigelson, E.D.; Babu, G.J.; Bahamonde, N.; Christen, A.; Bertin, K.; Meza, C.; Curé, M. Autoregressive Planet Search: Methodology. Astron. J. 2019, 158, 57. [Google Scholar] [CrossRef]
  43. Shi, X.; Qian, S.; Li, L. New Pulsating Stars Detected in EA-type Eclipsing-binary Systems Based on TESS Data. Astrophys. J. 2022, 259, 50. [Google Scholar] [CrossRef]
  44. McLaughlin, J.A.; Nakariakov, V.M.; Dominique, M.; Jelínek, P.; Takasao, S. Modelling Quasi-Periodic Pulsations in Solar and Stellar Flares. Space Sci. Rev. 2018, 214, 45. [Google Scholar] [CrossRef]
  45. van Leeuwen, F.; van Genderen, A.M.; Zegelaar, I. HIPPARCOS photometry of 24 variable massive stars (alpha Cygni variables). Astron. Astrophys. Suppl. Ser. 1998, 128, 117–129. [Google Scholar] [CrossRef]
  46. Saio, H.; Georgy, C.; Meynet, G. Strange-Mode Instability for Micro-Variations in Luminous Blue Variables. arXiv 2013. [Google Scholar] [CrossRef]
  47. Nieto, N.; Orozco, D.M. El uso de la transformada wavelet discreta en la reconstrucción de señales senosoidales. Sci. Tech. 2008, 14, 381–386. [Google Scholar]
  48. Castro, L.; Castro, S. Wavelets y Sus Aplicaciones; Universidad Nacional de Colombia: Bogota, Colombia, 1995. [Google Scholar]
  49. Lenz, P.; Breger, M. Period04 User Guide. Commun. Asteroseismol. 2005, 146, 53–136. [Google Scholar] [CrossRef]
  50. Contreras, J.M.; Molina Portillo, E.; Arteaga Cezón, P. Introducción a La Programación Estadística Con R Para Profesores. 2010. Available online: https://1library.co/document/z14pk5dz-introducci%C3%B3n-programaci%C3%B3n-estad%C3%ADstica-profesores-contreras-garc%C3%ADa-portillo-arteaga.html (accessed on 1 May 2023).
  51. Roesch, A.; Schmidbauer, H. WaveletComp: ComputationalWavelet Analysis. R Package Version 1.1. 2018. Available online: https://cran.r-project.org/web/packages/WaveletComp/index.html (accessed on 1 May 2023).
  52. Polanco-Martinez, J.M. Análisis espectral de wavelet: Una concisa revisión. Rev. Climatol. 2022, 22, 51–95. [Google Scholar]
  53. Torrence, C.; Compo, G.P. A Practical Guide to Wavelet Analysis. Bull. Am. Meteorol. Soc. 1998, 79, 61–78. [Google Scholar] [CrossRef]
  54. Meyers, S.D.; Kelly, B.G.; O’Brien, J.J. An Introduction to Wavelet Analysis in Oceanography and Meteorology: With Application to the Dispersion of Yanai Waves. Mon. Weather Rev. 1993, 121, 2858–2866. [Google Scholar] [CrossRef]
  55. Deeming, T.J. Fourier Analysis with Unequally-Spaced Data. Astrophys. Space Sci. 1975, 36, 137–158. [Google Scholar] [CrossRef]
  56. Grinsted, A.; Moore, J.C.; Jevrejeva, S. Application of the cross wavelet transform and wavelet coherence to geophysical time series. Nonlinear Process. Geophys. 2004, 11, 561–566. [Google Scholar] [CrossRef]
  57. Baran, A.S.; Koen, C. A Detection Threshold in the Amplitude Spectra Calculated from TESS Time-Series Data. Acta Astron. 2021, 71, 113–121. [Google Scholar] [CrossRef]
  58. Bognár, Z.; Lampens, P.; Frémat, Y.; Southworth, J.; Sódor, Á.; De Cat, P.; Isaacson, H.T.; Marcy, G.W.; Ciardi, D.R.; Gilliland, R.L.; et al. KIC3489: A genuine adusScuti Kepler hybrid pulsator with transit events. Astron. Astrophys. 2015, 581, A77. [Google Scholar] [CrossRef]
  59. Distefano, E.; Lanzafame, A.C.; Lanza, A.F.; Messina, S.; Korn, A.J.; Eriksson, K.; Cuypers, J. Determination of rotation periods in solar-like stars with irregular sampling: The Gaia case. Mon. Not. R. Astron. Soc. 2012, 421, 2774–2785. [Google Scholar] [CrossRef]
Figure 1. Synthetic light curve of an eclipsing binary affected by ARMA (1, 1) noise.
Galaxies 11 00069 g001
Figure 2. Example of applying wavelet analysis for a multi-periodic time series. Left panel: sinusoidal series with periods 30, 38, and 80. Central panel: Scalogram or wavelet power spectrum of the series. The top in the color code indicates a higher significance for periods. Periods with a higher power are detected with solid black lines. Right panel: average wavelet power of the series in logarithm scale. In this diagram, the beating periods 30 and 38 are more difficult to identify individually, unlike period 80, but they show a striking feature in the scalogram. Although all the periods represented in red have a significance level less than or equal to 0.05, the most relevant ones, about 30, 38, and 80, are the three highest average wavelet power. They were obtained using the WaveletComp Monte Carlo sampling-based test.
Galaxies 11 00069 g002
Figure 3. Synthetic light curves obtained from the simulation design. The model number is placed according to the list in Table 1.
Galaxies 11 00069 g003
Figure 4. Results of the wavelet analysis for Model No. 0, 1, 5, 17, and 21. From left to right, the wavelet power spectrum and the average wavelet power for the second part of each synthetic light curve.
Galaxies 11 00069 g004
Figure 5. Periodograms obtained for the models No. 0, 1, 5, 17, and 21.
Galaxies 11 00069 g005
Figure 6. Comparison between the proportion of correctness of the original period obtained by wavelet (cyan) and Fourier (grey) analysis. The thick solid black line represents the median of the data, and the red symbol stands for an outlier or extreme value.
Galaxies 11 00069 g006
Figure 7. Boxplots of hit ratio of the original periods with the wavelet (cyan) and Fourier (grey) analysis for each variable involved. The thick solid black line represents the median of the data, and the red symbol stands for an outlier or extreme value. The hit rate is on the y-axis and the two categories (indicated by 1 and 1) for each variable are shown on x-axis: beating phenomenon (absence/presence), period of the pulsation (minor/major), amplitude of the pulsation ( 4 % , 20 % ), number of pulsations periods (1/2), and quasi-regular pulsations (absence/presence).
Galaxies 11 00069 g007
Figure 8. Light curves obtained by TESS of pulsating binary stars.
Galaxies 11 00069 g008
Table 1. Simulation design features. The table lists the phenomena, properties, and periods fixed to simulate the pulsations in each model. The light-time effect and the beating phenomenon generate periods that are labeled with the indices “t” and “b”, respectively. In all cases, these effects are present only in the lowest pulsation period.
ModelBeating
Phenomena
Light Time
Effect
Relation to the
Orbital Period
N . of
Pul.
Quasi-Regular
Periods
Amplitude a
[%]
Fixed Period Values c
[Days]
No. 1YesNoHigher2Yes203e–8.96 b –10
No. 2YesNoHigher2No207– 7.70 b –10
No. 3YesYesHigher1Yes203e–2.12 t –4.42 t –8.96 b
No. 4YesYesHigher1No207–2.03 t –4.86 t –7.70 b
No. 5YesNoHigher2Yes43e–8.96 b –10
No. 6YesNoHigher2No47– 7.70 b –10
No. 7YesYesHigher1Yes43e–2.12 t –4.42 t –8.96 b
No. 8YesYesHigher1No47–2.03 t –4.86 t –7.70 b
No. 9YesNoLower2Yes20 2 –1.27 b –1.6
No. 10YesNoLower2No201.2– 1.32 b –1.6
No. 11YesYesLower1Yes20 2 –0.94 t –2.78 t –1.27 b
No. 12YesYesLower1No201.2–0.84 t –2.06 t –1.32 b
No. 13YesNoLower2Yes4 2 –1.27 b –1.6
No. 14YesNoLower2No41.2–1.32 b –1.6
No. 15YesYesLower1Yes4 2 –0.94 t –2.78 t –1.27 b
No. 16YesYesLower1No41.2–0.84 t –2.06 t –1.32 b
No. 17NoNoHigher2Yes203e–10
No. 18NoNoHigher2No207–10
No. 19NoYesHigher1Yes203e–2.12 t –4.42 t
No. 20NoYesHigher1No207–2.03 t –4.86 t
No. 21NoNoHigher2Yes43e–10
No. 22NoNoHigher2No47–10
No. 23NoYesHigher1Yes43e–2.12 t –4.42 t
No. 24NoYesHigher1No47–2.03 t –4.86 t
No. 25NoNoLower2Yes20 2 –1.6
No. 26NoNoLower2No201.2–1.6
No. 27NoYesLower1Yes20 2 –0.94 t –2.78 t
No. 28NoYesLower1No201.2–0.84 t –2.06 t
No. 29NoNoLower2Yes4 2 –1.6
No. 30NoNoLower2No41.2–1.6
No. 31NoYesLower1Yes4 2 – 0.94 t –2.78 t
No. 32NoYesLower1No41.2–0.84 t –2.06 t
a The pulsation amplitude is with respect to the depth of the primary eclipse. c e: Euler number.
Table 2. Comparison of Models No. 0, 1, 5, 17 and 21 with similar properties. The independent periods detected with wavelet (w) and Fourier (F) analysis are provided and their corresponding errors. For the periods obtained with the wavelet analysis, the weighted average with respect to the amount of data for each part of the curve is listed.
ModelInput Period
[Days]
Amplitude
[%]
Detected Period (w)
[Days]
Detected Period (F)
[Days]
No. 02.872.790 ± 0.0512.878 ± 0.003
No. 110
8.96
3e
2.87
20

7.852 ± 0.036
2.787 ± 0.061
1.147 ± 0.105
12.911 ± 0.001
9.262 ± 0.013

2.878 ± 0.003
1.106 ± 0.002
No. 5 4
7.865 ± 0.046
2.812 ± 0.048
9.467 ± 0.003

2.859 ± 0.003
1.100 ± 0.001
No. 1710
3e
2.87
20
7.928 ± 0.061
2.809 ± 0.067
2.506 ± 0.058
1.139 ± 0.103
10.144 ± 0.004

2.859 ± 0.001

1.106 ± 0.002
No. 21 4
7.924 ± 0.062
2.803 ± 0.053
10.144 ± 0.018

2.878 ± 0.004
1.103 ± 0.001
Disclaimer/Publisher’s Note: The statements, opinions and data contained in all publications are solely those of the individual author(s) and contributor(s) and not of MDPI and/or the editor(s). MDPI and/or the editor(s) disclaim responsibility for any injury to people or property resulting from any ideas, methods, instructions or products referred to in the content.

