Article

Characterization of Bars Induced by Interactions

by
Inma Martinez-Valpuesta
1,2,*,
José Alfonso López Aguerri
1,2 and
César González-García
3
1
Instituto de Astrofísica de Canarias, E-38205 La Laguna, Tenerif, Spain
2
Dpto. Astrofísica, Universidad de La Laguna, E-38206 La Laguna, Tenerife, Spain
3
Instituto de Ciencias del Patrimonio, CSIC, Santiago de Compostela 15704, A Coruña, Spain
*
Author to whom correspondence should be addressed.
Galaxies 2016, 4(2), 7; https://doi.org/10.3390/galaxies4020007
Submission received: 15 October 2015 / Revised: 6 May 2016 / Accepted: 19 May 2016 / Published: 25 May 2016

Abstract

:
Whether the formation of bars is triggered by interactions or by internal processes has been discussed for many decades. In this work, we study differences between both mechanisms by means of numerical simulations. We relate our analysis to fly-by interactions in different mass groups or clusters according to the velocity of the encounters. We find that once the bar is created, the interaction does not much affect its evolution. We also find that bars can be triggered purely by a slow interaction. Those bars affected or triggered by interaction stay for a longer time in the slow regime, i.e., the corotation radius is more than 1.4 times the bar radius.

1. Introduction

In this work we present a detailed study on how the environment affects the evolution of disk galaxies. Certain internal processes such as bar formation can be driven also by interactions. Bars are ellipsoidal-like features presented in a large fraction of discs in galaxies. They have strong influence on the dynamics of discs of galaxies. In particular, the presence of bars has an influence in the form of angular momentum exchange [1]. They are also related with gas inflow and star formation events [2]. The growth and feeding of central supermassive black holes in galaxies are also driven by bars [3,4]. Are there any external influences in the formation and evolution of bars? What is the "nature" vs. "nurture" of bars? Which is the role played by the environment in the bar formation and evolution? There are examples in the Universe of isolated galaxy pairs showing prominent bar features [5]. These cases point towards the influence of the environment on the bar formation and is confirmed in larger galaxy samples. Thus, the pioneering work from [6] found a large fraction of barred galaxies in the central region of the Coma cluster indicating that tidal interactions trigger bar formation. Similar results were also found in other samples, especially for early-type galaxies. Recently, [7] showed that the effect of the environment on the bar formation depends on the mass of the galaxy. They proposed that interactions trigger bar formation in massive galaxies that are stable enough to keep their cold disks even in galaxy clusters. In contrast, the disk of low-mass halos are heated by interactions inhibiting the bar formation. By means of numerical simulations we explore the differences of these resulting bars in groups and clusters in comparison with those in isolation. We will focus on the three observational parameters which mainly characterize bars in galaxies: the bar length, the bar strength and the pattern speed.

2. Simulations and Methodology

Our work is based on N-body numerical simulations run with an improved version of the FTM4-4 code [8], using the potential solver falcON [9]. In this work we use two initial simulations in isolation. In one, the initial conditions such as the disk are unstable to bar formation [10] (bar case), and the other one is set up in such a way to be stable to bar formation(no bar case). The main difference in the initial conditions is the mass ratio between dark matter halo and disk, based on [11] (see also Martinez-Valpuesta et al. 2016). We perform simulations of interactions with these isolated galaxies by means of the impulse approximation, reproducing 1:1 fly-bys. In this way, there is basically no time for the systems to react during the encounter, and all the effects develop after the interaction has taken place. We have two types of interactions depending on the velocity of the encounter, fast (2000 km/s) and slow (500 km/s).
We analyse the outcome of the fly-bys focusing on bar parameters such as strength, size, pattern speed and rotation parameter R = R C R / R b a r . Strength is calculated as the amplitude of the second coefficient in the Fourier decomposition normalized by the axisymmetric density. The bar size is computed by ellipse fitting. The R is a relative measure of bar speed, and is used to determine if bars are fast ( R < 1 . 4 ) or slow ( R > 1 . 4 ).

3. Results and Discussion
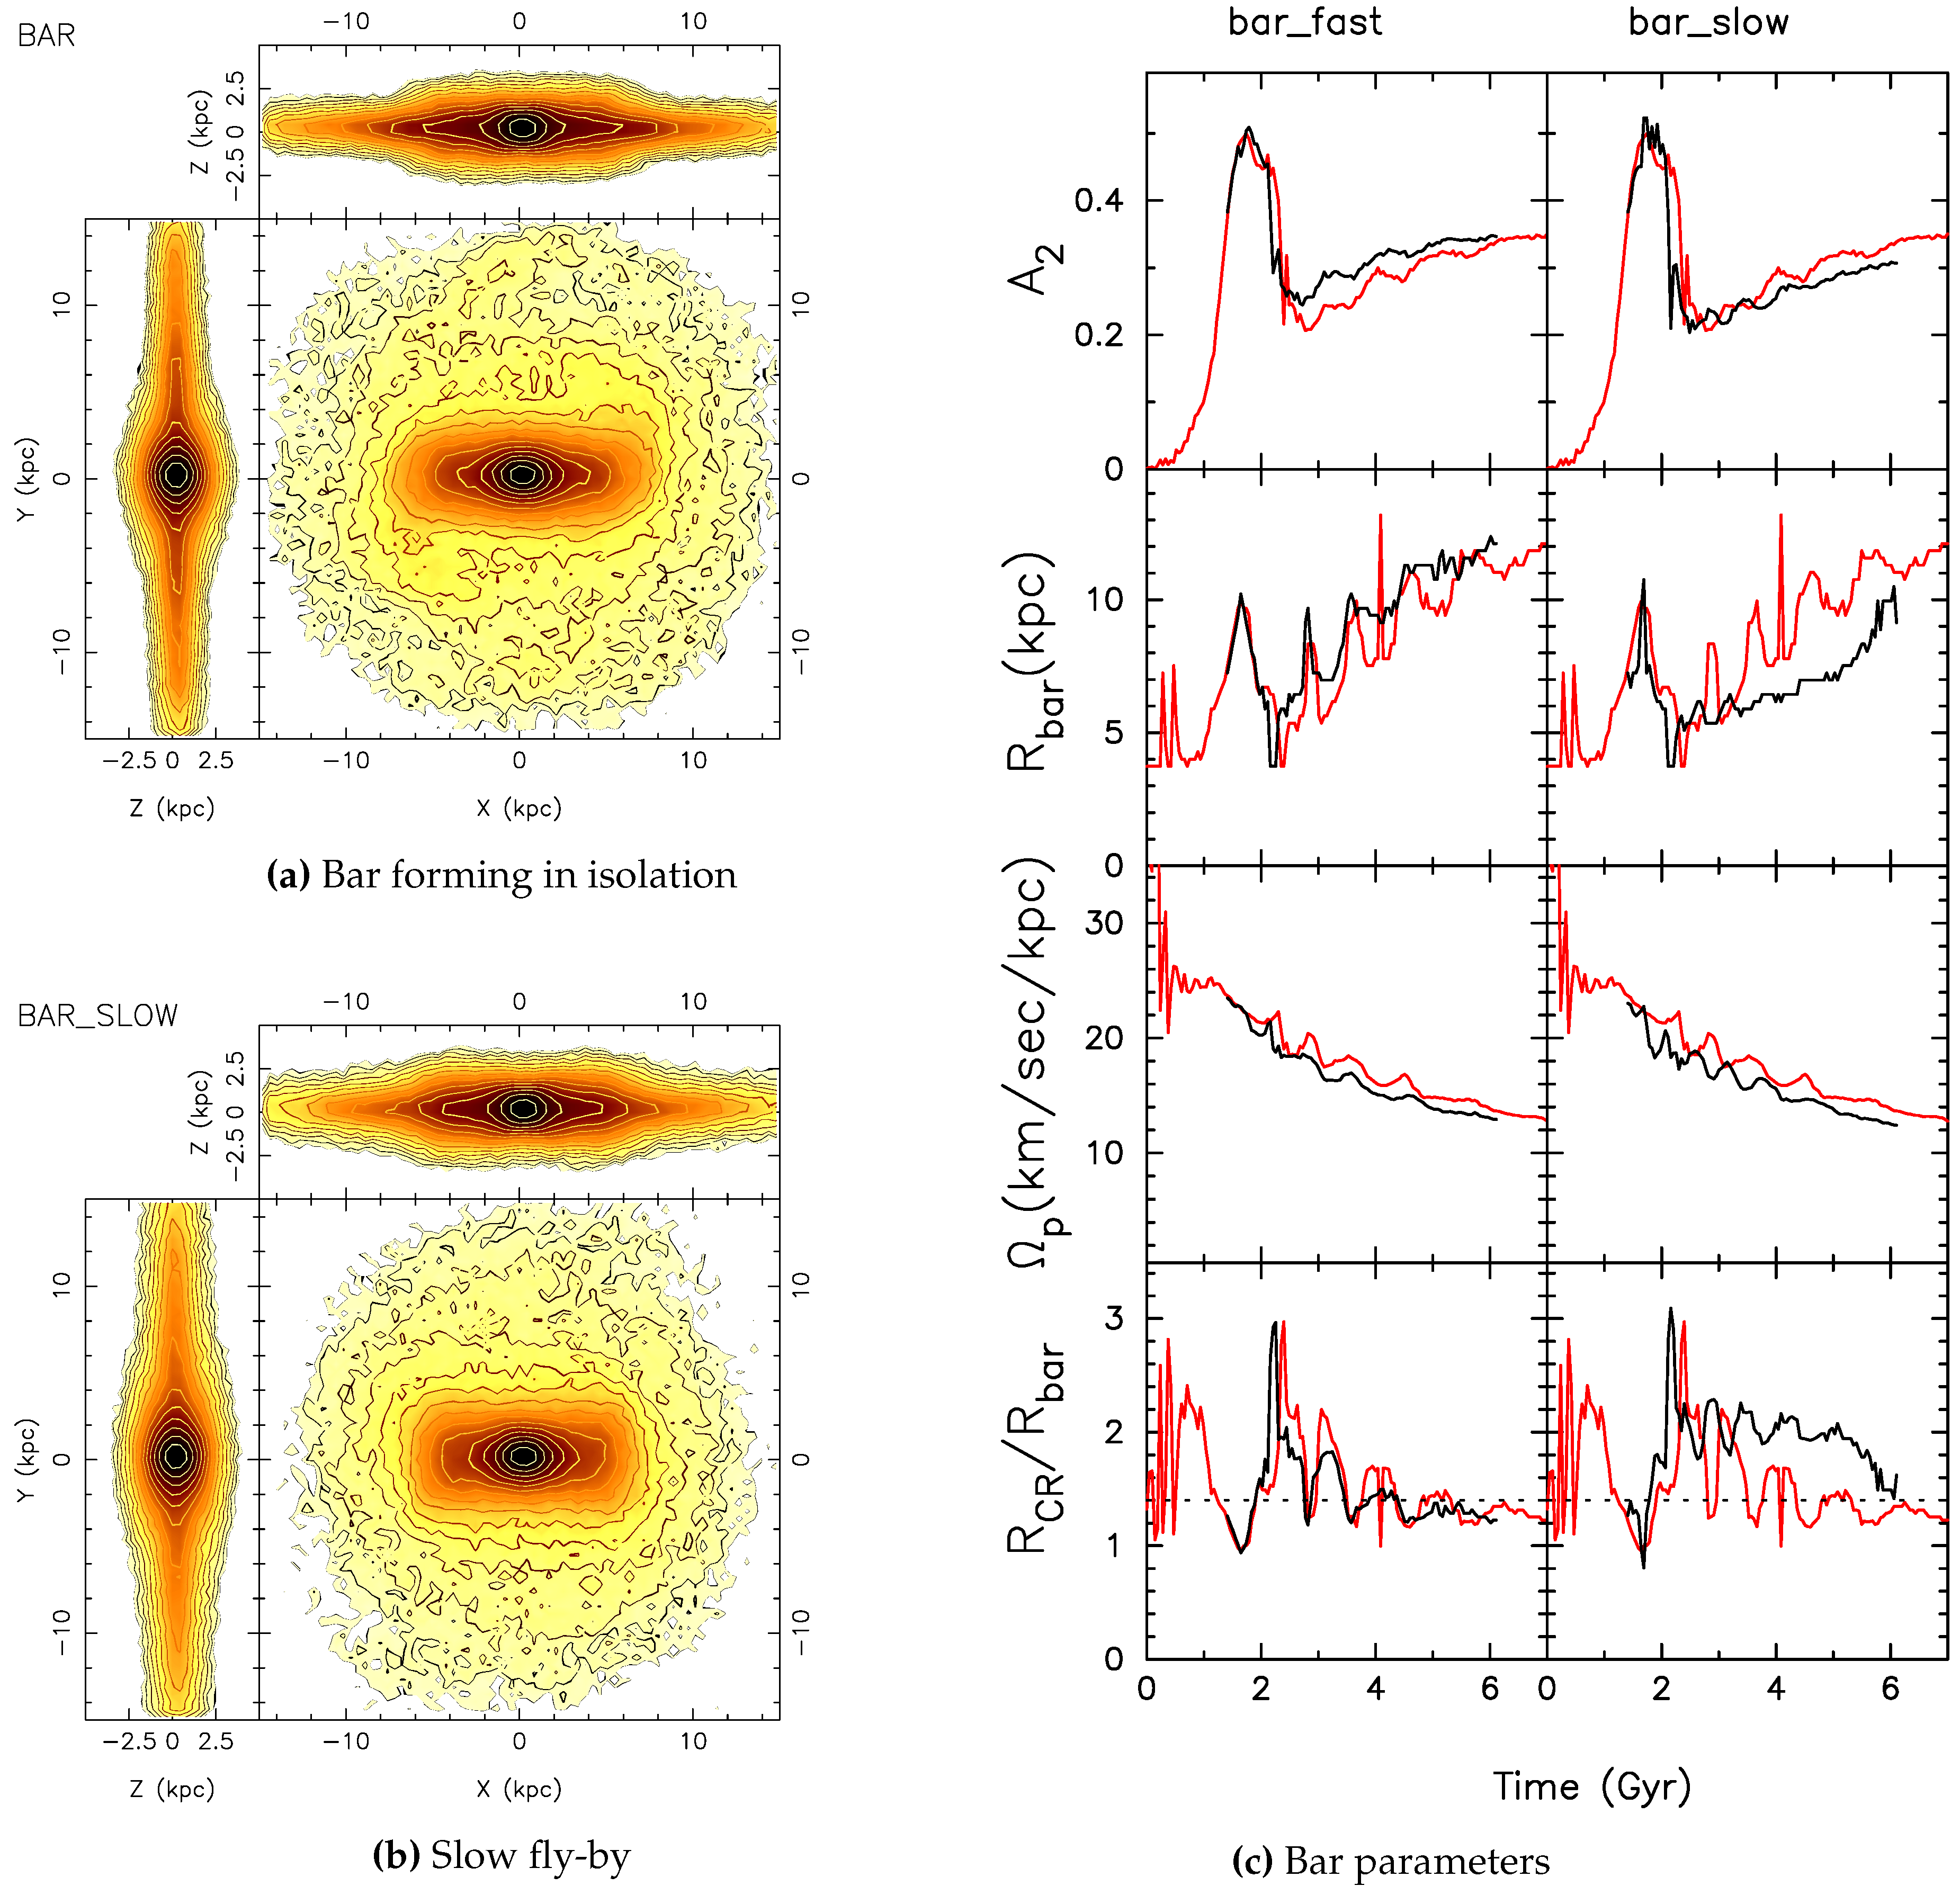
After a first look to the evolution of the resulting galaxies after the perturbations, we appreciate how the fast interactions do not have a big effect on the original galaxy. As expected, the slow interactions, which we identify with encounters in groups of low mass, have a stronger effect on the galaxy.

3.1. Bar Case

We now focus on the set of simulations with the galaxy developing a bar in isolation and the corresponding interactions (Figure 1). The resulting density distributions after the fast and the slow interaction show, as in the isolated case, a strong bar in the face-on view. When seen edge-on the bar shows a boxy/peanut structure. The boxy/peanut bulge develops in both cases after the buckling event.
In the slow interaction the bar becomes more boxy in the face-on view (see Figure 1a,b). In the case of the fast encounter, not shown here, the bar becomes longer than in the isolated case.
The main parameters of the bar are almost unchanged with respect to the isolated case (Figure 1c). We can see a small difference for the fast encounter where the bar is ∼10% longer. For the slow encounter, we find that the bar is shorter and also slower in absolute (Ω) and in relative terms ( R ).

3.2. No Bar Case

The density map for the simulation originally stable to bar formation shows an axisymmetric structure (Figure 2a). However, when we show the simulation after the fly-by, the galaxy is not axisymmetric and a bar structure is clearly seen (Figure 2b). The galaxy shows a strong and long bar when seen face-on, and a peanut structure when seen edge-on. This bar grows in amplitude and length fast after the encounter (see Figure 2c). The properties of the resulting bar depend also on the velocity of the encounter: slower encounters have stronger effects, and therefore produce stronger bars.
Focussing on the strong bar created purely by the slow interaction, we find that it is slower in dynamical terms ( R > 1 . 4 ) than those created in isolation as already seen in [12,13]. In fact, the slow encounter produces a bar that stays slow for more than 4 Gyr. The bar increases in size but it does not slow down in absolute terms (pattern speed, Ω), as a consequence the bar slowly approaches the standard regime of R = 1 . 2 .

4. Conclusions

We present in this work some preliminary results based on N-body numerical simulations of interactions of disk galaxies and how they determine or not the faith of galactic bars. We summarize our preliminary conclusions as:
  • If the galaxy is robust in forming a strong bar in isolation, the interaction is not able to prevent it. The interaction is also not able to strongly change the general evolution of bar parameters.
  • Conversely, if the galaxy is not able to form the bar in isolation, a slow interaction is able to develop a strong bar in the galaxy.
  • Bars fully triggered or affected by interactions are in general slower than those created intrinsically by pure dynamical instabilities. In particular, they can stay in the slow regime for 4 Gyr after the maximum of the encounter.
In future work we will explore a bigger range of interactions and we will look in more detail at the differences in the photometric and dynamical properties of the resulting bars for those triggered fully by the interactions and those intrinsically driven. We will also explore in detail the possible caveats arising from the simulations set-up and the impulse approximation (Martinez-Valpuesta et al. 2016).

Acknowledgments

Inma Martinez-Valpuesta thanks support from the MINECO through grants AYA2013-46886-P and AYA2014-583308-P.

Author Contributions

The order in the authors list represents the contribution to this work from more to less.

Conflicts of Interest

The authors declare no conflict of interest.

References

  1. Athanassoula, E. Dynamical evolution driven by bars and interactions: Input from numerical simulations. Astrophysics 2002, 281, 39–47. [Google Scholar]
  2. Aguerri, J.A.L. A strong correlation between bar strength and global star forming activity in isolated barred galaxies. Astron. Astrophys. 1999, 351, 43–46. [Google Scholar]
  3. Shlosman, I.; Begelman, M.C.; Frank, J. The fuelling of active galactic nuclei. Nature 1990, 345, 679–686. [Google Scholar] [CrossRef]
  4. Corsini, E.M.; Debattista, V.P.; Aguerri, J.A.L. Direct Confirmation of Two Pattern Speeds in the Double-barred Galaxy NGC 2950. Astrophysics 2003, 599, L29–L32. [Google Scholar] [CrossRef]
  5. Fuentes-Carrera, I.; Rosado, M.; Amram, P.; Dultzin-Hacyan, D.; Cruz-González, I.; Salo, H.; Laurikainen, E.; Bernal, A.; Ambrocio-Cruz, P.; Le Coarer, E. The isolated interacting galaxy pair NGC 5426/27 (Arp 271). Astron. Astrophys. 2004, 415, 451–469. [Google Scholar] [CrossRef]
  6. Thompson, L.A. Bar instabilities in Coma cluster galaxies. Astrophys. J. 1981, 244, L43–L45. [Google Scholar] [CrossRef]
  7. Méndez-Abreu, J.; Sánchez-Janssen, R.; Aguerri, J.A.L.; Corsini, E.M.; Zarattini, S. The Nature and Nurture of Bars and Disks. Astrophysics 2012, 761, L6. [Google Scholar] [CrossRef]
  8. Heller, C.H.; Shlosman, I. Fueling nuclear activity in disk galaxies: Starbursts and monsters. Astrophysics 1994, 424, 84–105. [Google Scholar] [CrossRef]
  9. Dehnen, W. A Hierarchical Force Calculation Algorithm. Comput. Phys. 2002, 179, 27–42. [Google Scholar] [CrossRef]
  10. Martinez-Valpuesta, I.; Gerhard, O. Unifying A Boxy Bulge and Planar Long Bar in the Milky Way. Astrophysics 2011, 734, L20. [Google Scholar] [CrossRef]
  11. Fall, S.M.; Efstathiou, G. Formation and rotation of disc galaxies with haloes. Astrophysics 1980, 193, 189–206. [Google Scholar] [CrossRef]
  12. Miwa, T.; Noguchi, M. Dynamical Properties of Tidally Induced Galactic Bars. Astrophys. J. 1998, 499, 149–166. [Google Scholar] [CrossRef]
  13. Łokas, E.L.; Athanassoula, E.; Debattista, V.P.; Valluri, M.; Pino, A.D.; Semczuk, M.; Gajda, G.; Kowalczyk, K. Adventures of a tidally induced bar. Astrophysics 2014, 445, 1339–1350. [Google Scholar]
Figure 1. Left: Stellar density maps in three spatial projections of the simulation with bar in isolation (bar case). The original simulation is plotted on the top left, and below we plot the resulting galaxy after the slow interaction. The time shown is τ = 4 . 18 Gyr, in both cases, i.e., after the big drop in bar strength, related to the bar buckling, and sometime to give the bar time to resume its evolution. Right: Time evolution of bar parameters for the fast and slow encounter. The red line represents the evolution of the original galaxy in isolation. (a): Bar forming in isolation; (b): Slow fly-by; (c): Bar parameters.
Galaxies 04 00007 g001
Figure 2. Left: Stellar density maps in three spatial projections of the simulation with no bar in isolation (no bar case). The original simulation is plotted on the top left, and below we plot the resulting galaxy after the slow interaction. The time shown is τ = 4 . 18 Gyr. Right: Time evolution of bar parameters for the fast and slow encounter. The red line represents the evolution of the original galaxy in isolation. (a): No bar forming in isolation; (b): Slow fly-by; (c): Bar parameters.
Galaxies 04 00007 g002

