
Intra-Day Simultaneous Optical Monitoring of S5 0716+714

1
Department of Astronomy, Beijing Normal University, Beijing 100875, China
2
Department of Astronomy, Physics School, Peking University, Beijing 100871, China
3
Kavli Institute for Astronomy and Astrophysics (KIAA), Peking University, Beijing 100871, China
*
Author to whom correspondence should be addressed.
Galaxies 2016, 4(3), 25; https://doi.org/10.3390/galaxies4030025
Submission received: 14 July 2016
/
Revised: 31 August 2016
/
Accepted: 31 August 2016
/
Published: 6 September 2016
(This article belongs to the Special Issue Blazars through Sharp Multi-wavelength Eyes)
Abstract
:We present the results of simultaneous optical multi-color observations of BL Lac object 0716+714 in November 2014 and February 2016. The intra-day variability (IDV) varies from 0.04 to 0.3 mags. Both achromatic and bluer-when-brighter (BWB) color behaviors were detected. A probable quasi-periodic oscillation overlapping on a significant flare was also observed. We used the interpolated cross-correlation function to calculate time lags between light curves in different bands. Variations in the B and R lagging behind that in the I band were found, which corresponds with anti-clockwise loops on the color-magnitude diagrams.
1. Introduction
S5 0716+714 (RA = 07:21:53.4, Dec = 71:20:36, epoch = J2000) is one of the brightest BL Lac objects in the northern sky. It’s redshift was estimated by Nilsson et al. [1] as , and recently limited by Danforth et al. [2] as . It is also one of the best-studied low-frequency-peaked BL Lac object (LBL) with violent variations at different wavelengths from radio to γ-ray and on different time scales from several minutes to decades.
The color behavior and the spectral evolution of blazars are basic issues in the physical processes that occur in jets. A loop-like path in the color-magnitude diagram can be caused by acceleration and cooling processes of particles in the jet (e.g., [3,4]). It is also consistent with time lags between different optical bands. Aiming to find these lags precisely, we monitored S5 0716+714 with high temporal resolution.
2. Observation and Data Reduction
We performed observations with three telescopes in Xinglong Station of the National Astronomical Observatories of China (NAOC), of which the diameters are 60 cm, 80 cm and 85 cm respectively. We observed three days from 1 to 3 November in 2014 (JD 2456963 to 2456965) and two days from 16 to 17 February in 2016 (JD 2457435 to 2457436). The details of observation are listed in Table 1. Before each observation, computer clocks of three telescopes were synchronized by the GPS satellite clock in NAOC to avoid system times lags among telescopes.
We conducted the data reduction procedure with IRAF. The photometry aperture radii were set as 1.5 times the full width at half-maximum (FWHM) of the stellar images. The inner radius and width of the sky annuli are set as 5 and 2 times the FWHM. Magnitudes of comparison stars were given by Villata et al. [5] and Ghisellini et al. [6]. Several combinations of stars with non-variable differential light curves were selected. Among these stars, one star with brightness close to the object was adopted as photometry check star and others as comparison stars.
3. Results
3.1. Light Curves
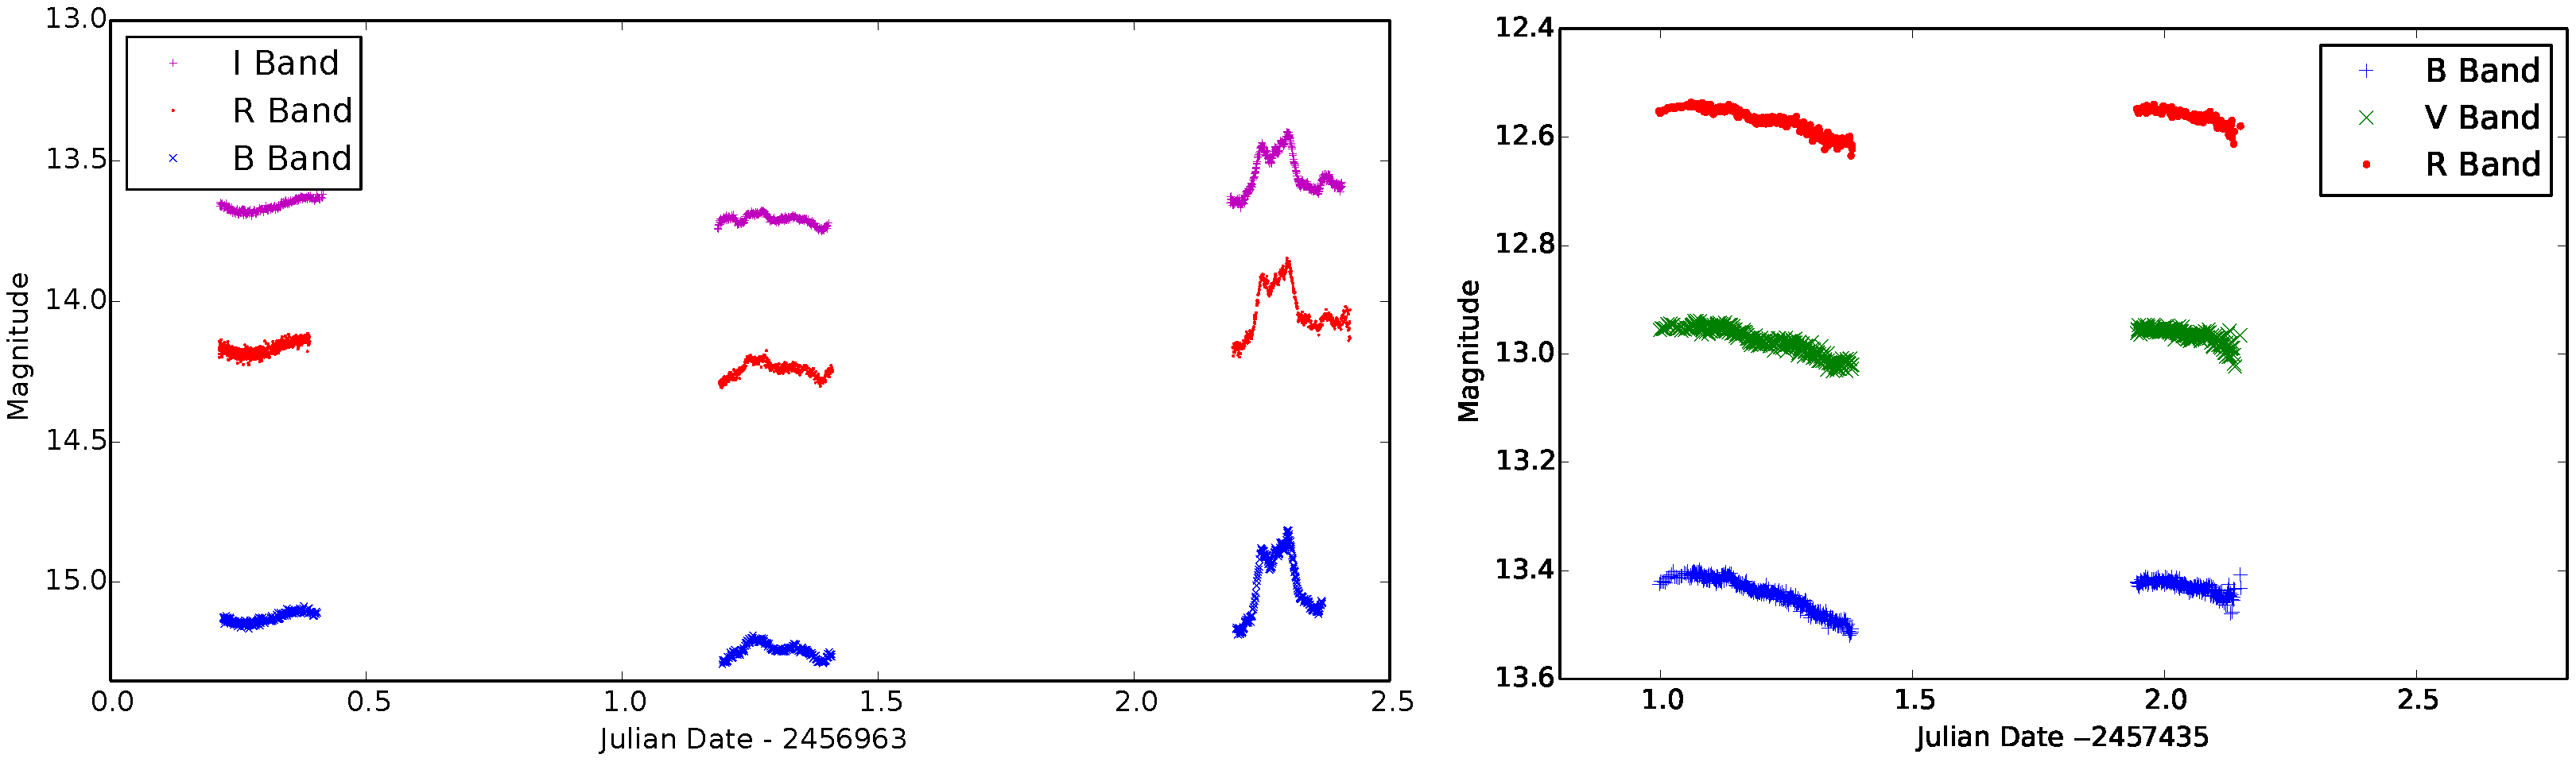
To verify the IDV of S5 0716+714, we adopted two very robust statistical tests recommended by de Diego [7]: one-way analysis of variance (ANOVA) and test. All 15 light curves pass the one-way ANOVA test and 13 light curves pass the test. This incompatibility can be ascribed to the discrepancy of power of these methods, thus, we can conclude that IDV can be found in all data we observed. The overall light curves are plotted in Figure 1.
In JD 2456963, a one period sinusoidal-like light curve was observed. The time interval between minimum and maximum of the variation is about 2.6 h, and the variation in the I band is about 0.08 mags. Unfortunately, we didn’t observe the subsequent light curve so we can’t make sure whether it is a genuine sinusoidal light curve. This pattern of light curves has been discovered by Wu et al. [8]. On JD 2456964, two small flares can be seen in the B and R band. However there’s another flare in the I band whose cause is still unclear. But it should not be attributed to our data reduction. On JD 2456965, an extremely violent light curve was captured. The changing rate of magnitude in the B band reaches 0.347 mags·h−1, which is close to the highest record in the R band of 0.38 mags·h−1 [9] and exceeds Dai et al.’s [10] 0.106 mags·h−1 and Nesci et al.’s [11] 0.16 mags·h−1. Besides, the light curve on that day shows a double-peak shape overlapped by three sub-flares, and quasi-periodic oscillations (QPO) was detected. On JD 2457435 and JD 2457436, light curves were monotonically linearly decreasing. No micro-flare was found on those two nights.
3.2. Quasi-Periodic Oscillations
On JD 2456965, all three light curves present QPOs (see left panel of Figure 2). The time intervals between those five sub-flares are 10.14, 25.47, 17.62 and 17.62 min respectively. In order to detect the period of QPOs, we adopt program REDFIT [12] to calculate the Lomb-Scargle periodogram of our unevenly spaced light curve and estimate the red noise spectrum. The results are plotted in the right panel of Figure 2. Two peaks exceed 99% confidence level, and the 0.05 min−1 peak is close to time intervals observed by the naked eye. Here we can say a 20 min period is detected, which coincides with 25 min observed by Gupta et al. [13] and 15 min observed by Rani et al. [14].
3.3. Cross-Correlation Analysis
Time lags between variations in different electromagnetic wave regions are well investigated in the literature. However, the optical inter-band lags are less commonly recorded. Here we carried out cross-correlation of light curves in different bands using the interpolated cross-correlation function (ICCF) to calculate time lags. The uncertainty of lag is estimated by the flux randomization/random subset selection (FR/RSS) method, 5000 Monte Carlo realizations were applied. More details of this method can be found in Peterson et al. [15].
The results are listed in Table 2. On JD 2456965, it is plausible that variations in the B and R band lagged those in the I band. On other days, results are within uncertainties.
3.4. Color Behavior
To study the spectral variation, we plotted color-magnitude diagrams for each separate night in Figure 3. The magnitudes are binned with a size of 8 min. Data points of the orphan flare in the I band on JD 2456964 are excluded.
On JD 2456963 and 2457437, all six color-magnitude diagrams exhibit achromatic color behavior. On JD 2456964 and 2457437, marginal color variation was seen. Significant BWB trends can be found in diagrams on JD 2456965, along with an anti-clockwise loop that corresponds with time lags observed between different bands.
4. Discussion and Conclusions
In the time lag detection, some factors can cause pseudo results: systematic time lags among clocks in computers of different telescopes, low temporal resolution and low signal-to-noise ratio. Here, as we mentioned in Section 2, we synchronized all computer clocks of telescopes before each observation. Hence, asynchrony among telescopes can be ruled out. On JD 2456965, temporal resolutions of the I band the R band reached 40 s, which are less than the time lag. Additionally, most of photometry errors in our observation are less than 1 percent. This high signal-to-noise ratio makes the results more reliable. Besides, anti-clockwise loops in color-magnitude diagrams match the results that the variation in the I band led variations in the R and B bands.
We observed the BL Lac object S5 0716+714 at multiple bands simultaneously on five nights in November 2014 and February 2016. In November 2014, our temporal resolution reached ≤80 s. Our main results are as follows:
- (1)
- IDV was detected on all five days. On JD 2456965, the fastest changing rate of magnitude in the B band reached 0.347 mags·h−1.
- (2)
- Both achromatic and BWB chromatisms were found in our observations.
- (3)
- Sinusoidal-like light curves were observed on JD 2456963 with achromatic variations and no time lags between different bands, which could be interpreted by a geometrical effect model.
- (4)
- A significant BWB trend, QPOs and plausible inter-band lags were detected in the dramatic variation on JD 2456965. The fastest changing rate of magnitude in the B band reached 0.35 mags·h−1.
Acknowledgments
We thank the anonymous reviewers for their valuable comments and suggestions that helped to improve this paper. Our work has been supported by the National Basic Research Programme of China 973 Programme 2013CB834900; Chinese National Natural Science Foundation grants 11273006, 11173016, U1531242 and 11073023; and the fundamental research funds for the central universities and Beijing Normal University.
Author Contributions
Xiaoyuan Zhang wrote the paper, and did part of observation and data reduction; Jianghua Wu planned the observation, and is responsible for some discussions; Zhongyi Man did part of observation and data reduction.
Conflicts of Interest
The authors declare no conflict of interest.
References
- Nilsson, K.; Pursimo, T.; Sillanpää, A.; Takalo, L.O.; Lindfors, E. Detection of the host galaxy of S5 0716+714. Astron. Astrophys. 2008, 487, L29–L32. [Google Scholar] [CrossRef]
- Danforth, C.W.; Nalewajko, K.; France, K.; Keeney, B.A. A fast flare and direct redshift constraint in far-ultraviolet spectra of the blazar S5 0716+714. Astrophys. J. 2013, 764, 57–63. [Google Scholar] [CrossRef]
- Chiaberge, M.; Ghisellini, G. Rapid variability in the synchrotron self-Compton model for blazars. Mon. Not. R. Astron. Soc. 1999, 306, 551–560. [Google Scholar] [CrossRef]
- Kirk, J.G.; Rieger, F.M.; Mastichiadis, A. Particle acceleration and synchrotron emission in blazar jets. Astron. Astrophys. 1998, 333, 452–458. [Google Scholar]
- Villata, M.; Raiteri, C.M.; Lanteri, L.; Sobrito, G.; Cavallone, M. BVR photometry of comparison stars in selected blazar fields. I. Photometric sequences for 10 BL Lacertae objects. Astron. Astrophys. Suppl. 1998, 130, 305–310. [Google Scholar] [CrossRef]
- Ghisellini, G.; Villata, M.; Raiteri, C.M.; Bosio, S.; de Francesco, G.; Latini, G.; Maesano, M.; Massaro, E.; Montagni, F.; Nesci, R.; et al. Optical-IUE observations of the gamma-ray loud BL Lacertae object S5 0716+714: Data and interpretation. Astron. Astrophys. 1997, 327, 61–71. [Google Scholar]
- De Diego, J.A. Testing tests on active galactic nucleus microvariability. Astron. J. 2010, 139, 1269–1282. [Google Scholar] [CrossRef]
- Wu, J.H.; Peng, B.; Zhou, X.; Ma, J.; Jiang, Z.J.; Chen, J.S. Optical monitoring of BL Lacertae object S5 0716+714 with high temporal resolution. Astron. J. 2005, 129, 1818–1826. [Google Scholar] [CrossRef]
- Chandra, S.; Baliyan, K.S.; Ganesh, S.; Joshi, U.C. Rapid optical variability in blazar S5 0716+71 during March 2010. Astrophys. J. 2011, 731, 118. [Google Scholar] [CrossRef]
- Dai, Y.; Wu, J.; Zhu, Z.H.; Zhou, X.; Ma, J.; Yuan, Q.R.; Wang, L.Z. Seven-year multi-color optical monitoring of BL Lacertae object S5 0716+714. Astrophys. J. Suppl. 2013, 204, 22–30. [Google Scholar] [CrossRef]
- Nesci, R.; Massaro, E.; Montagni, F. Intraday optical variability of S5 0716+714. Publ. Astron. Soc. Aust. 2002, 19, 143–146. [Google Scholar] [CrossRef]
- Schulz, M.; Mudelsee, M. REDFIT: Estimatingred-noise spectra directly from unevenly spaced paleoclimatic time series. Comput. Geosci. 2002, 28, 421–426. [Google Scholar] [CrossRef]
- Gupta, A.C.; Srivastava, A.K.; Wiita, P.J. Periodic oscillations in the intra-day optical light curves of the blazar S5 0716+714. Astrophys. J. 2009, 690, 216–223. [Google Scholar] [CrossRef]
- Rani, B.; Gupta, A.C.; Joshi, U.C.; Ganesh, S.; Wiita, P.J. Quasi-periodic oscillations of 15 min in the optical light curve of the BL Lac S5 0716+714. Astrophys. J. Lett. 2010, 719, 153–157. [Google Scholar] [CrossRef]
- Peterson, B.M.; Ferrarese, L.; Gilbert, K.M.; Kaspi, S.; Malkan, M.A.; Maoz, D.; Merritt, D.; Netzer, H.; Onken, C.A.; Pogge, R.W.; et al. Central masses and broad-line region sizes of active galactic nuclei. II. A homogeneous analysis of a large reverberation-mapping database. Astrophys. J. 2004, 613, 682–699. [Google Scholar] [CrossRef]
Figure 1.
Overall light curves of S5 0716+714 in November 2014 (left panel) and February 2016 (right panel).
Figure 1.
Overall light curves of S5 0716+714 in November 2014 (left panel) and February 2016 (right panel).

Figure 2.
(Left panel): Light curve in the B band on JD 2456965, five sub-flares are marked by vertical dashed lines; (Right panel): Lomb-Scargle periodogram of light curve on JD 2456965.
Figure 2.
(Left panel): Light curve in the B band on JD 2456965, five sub-flares are marked by vertical dashed lines; (Right panel): Lomb-Scargle periodogram of light curve on JD 2456965.

Figure 3.
Color-magnitude diagrams of each separate night.


Table 1.
Details of observations including observation date, telescope, filter, mean temporal resolution, time duration per night and amplitude of variation.
| JD | Telescope | Band | Temporal Resolution (s) | Time Duration (h) | Δm (mag) |
|---|---|---|---|---|---|
| 85 cm | B | 80 | 4.41 | 0.08 | |
| 2456963 | 60 cm | R | 19 | 4.25 | 0.11 |
| 80 cm | I | 67 | 4.83 | 0.07 | |
| 85 cm | B | 79 | 5.13 | 0.10 | |
| 2456964 | 60 cm | R | 44 | 5.5 | 0.15 |
| 80 cm | I | 69 | 5.48 | 0.12 | |
| 85 cm | B | 62 | 4.04 | 0.37 | |
| 2456965 | 60 cm | R | 39 | 5.52 | 0.35 |
| 80 cm | I | 40 | 5.25 | 0.27 | |
| B | 0.12 | ||||
| 2457435 | 85 cm | V | 113.8 | 9.17 | 0.09 |
| R | 0.10 | ||||
| B | 0.07 | ||||
| 2457436 | 85 cm | V | 100.1 | 4.95 | 0.08 |
| R | 0.07 |
| JD | B–R (min) | R–I (min) | B–I (min) |
|---|---|---|---|
| 2456963 | |||
| 2456964 | |||
| 2456965 | |||
| B–V | V–R | B–R | |
| 2457435 | |||
| 2457436 |
© 2016 by the authors; licensee MDPI, Basel, Switzerland. This article is an open access article distributed under the terms and conditions of the Creative Commons Attribution (CC-BY) license (http://creativecommons.org/licenses/by/4.0/).
Share and Cite
MDPI and ACS Style
Zhang, X.; Wu, J.; Man, Z. Intra-Day Simultaneous Optical Monitoring of S5 0716+714. Galaxies 2016, 4, 25. https://doi.org/10.3390/galaxies4030025
AMA Style
Zhang X, Wu J, Man Z. Intra-Day Simultaneous Optical Monitoring of S5 0716+714. Galaxies. 2016; 4(3):25. https://doi.org/10.3390/galaxies4030025
Chicago/Turabian StyleZhang, Xiaoyuan, Jianghua Wu, and Zhongyi Man. 2016. "Intra-Day Simultaneous Optical Monitoring of S5 0716+714" Galaxies 4, no. 3: 25. https://doi.org/10.3390/galaxies4030025
Note that from the first issue of 2016, this journal uses article numbers instead of page numbers. See further details here.