Article

The Radio/Gamma-Ray Connection from 120 MHz to 230 GHz

by
Marcello Giroletti
1,*,
Filippo D’Ammando
1,2,
Monica Orienti
1,
Rocco Lico
1,2 and
The Fermi-LAT Collaboration
1
1
INAF Istituto di Radioastronomia, via Gobetti 101, Bologna I-40129, Italy
2
Dipartimento di Fisica e Astronomia, Università di Bologna, via Ranzani 1, Bologna 40127, Italy
*
Author to whom correspondence should be addressed.
Galaxies 2016, 4(3), 30; https://doi.org/10.3390/galaxies4030030
Submission received: 14 July 2016 / Revised: 3 September 2016 / Accepted: 5 September 2016 / Published: 13 September 2016
(This article belongs to the Special Issue Blazars through Sharp Multi-wavelength Eyes)

Abstract

:
Radio loud active galactic nuclei are composed of different spatial features, each one characterized by different spectral properties in the radio band. Among them, blazars are the most common class of sources detected at gamma-rays by Fermi, and their radio emission is dominated by the flat spectrum compact core. In this contribution, we explore the connection between emission at high energy revealed by Fermi and at radio frequencies. Taking as a reference the strong and very highly significant correlation found between gamma rays and cm-λ radio emission, we explore the different behaviours found as we change the energy range in gamma rays and in radio, therefore changing the physical parameters of the zones involved in the emitted radiation. We find that the correlation weakens when we consider (1) gamma rays of energy above 10 GeV (except for high synchrotron peaked blazars) or (2) low frequency radio data taken by the Murchison Widefield Array; on the other hand, the correlation strengthens when we consider mm-λ data taken by Atacama Large Millimeter Array (ALMA).

1. Introduction

The existence, significance, and interpretation of a correlation between radio and gamma-ray emission in extragalactic sources has attracted interest from several authors over the last few decades [1,2,3,4,5,6,7,8].
The basic arguments favouring the existence of such a correlation go from purely theoretical reasoning, i.e., that emission in both bands naturally arises through processes involving a population of relativistic particles, to observational matters, such as the fact that radio loud (RL) active galactic nuclei (AGN) dominate the census of gamma-ray catalogues; they made up about one half of the historical EGRET third catalogue [9], and nearly 40% of the third Fermi Large Area Telescope (LAT) catalogue (3FGL, [10]), the largest and most recent compilation of gamma-ray sources. In more detail, 98% of the RL AGNs in the third catalogue of AGN detected by Fermi-LAT (3LAC, [11]) belong to the subclass of blazars, which are RL AGNs whose jet axis is closely aligned with our line of sight; this indicates that relativistic beaming is a key element in both the radio and high energy emission, suggesting a strong connection between the two domains. Finally, simple one-zone synchrotron self-Compton (SSC) models successfully reproduce the basic features of the broadband spectral energy distribution (SED) of several blazars (particularly of BL Lac flares, [12]), and radio luminosity itself was shown to govern the physical properties and radiation mechanisms in relativistic jets up to gamma rays in the early formulation of the blazar sequence framework [13,14].
On the other hand, there are several issues that suggest a much more complex picture. First, the gamma-ray variability time scales, in particular during flares, often reach short values, down to ∼1 h [15,16,17,18]. This indicates that the high energy emission region must be extremely compact and thus optically thick at radio frequency, because of the synchrotron self-absorption (SSA) mechanism. Indeed, dedicated systematic radio monitoring of gamma-ray blazars shows that there are very few sources in which there is a significant correlation between the light curves in the two regimes [19]; so-called “orphan” gamma-ray flares with no radio counterpart are also quite common [20,21,22]. Moreover, while it is true that most of the gamma-ray sources are RL AGNs, and in particular blazars, the opposite is definitely not true: Radio galaxies are very seldom detected in gamma rays, and even among blazars the detection rate at high energy is far from unity, both for luminous and not-so-luminous objects [23,24]. Therefore, while radio emission and beaming are necessary conditions for the presence of high energy radiation, they are not sufficient.
In this paper, we review some recent results and prospects about the existence and implications of such correlations, including the study of unidentified gamma-ray sources (UGS). In Section 2, we review the results based on Fermi and GHz-frequency radio data [1], which constitute the most comprehensive dataset ever used to address this topic. In the following sections, we consider variations of the data analysis as gamma-ray or radio data of different wavelengths are considered: in Section 3, we focus on sources detected at energies E > 10 GeV; in Section 4, on sources detected at radio frequencies as low as 120 MHz [25] by the Murchison Widefield Array (MWA); in Section 5, on sources detected as high as 230 GHz with the Atacama Large Millimeter Array (ALMA).

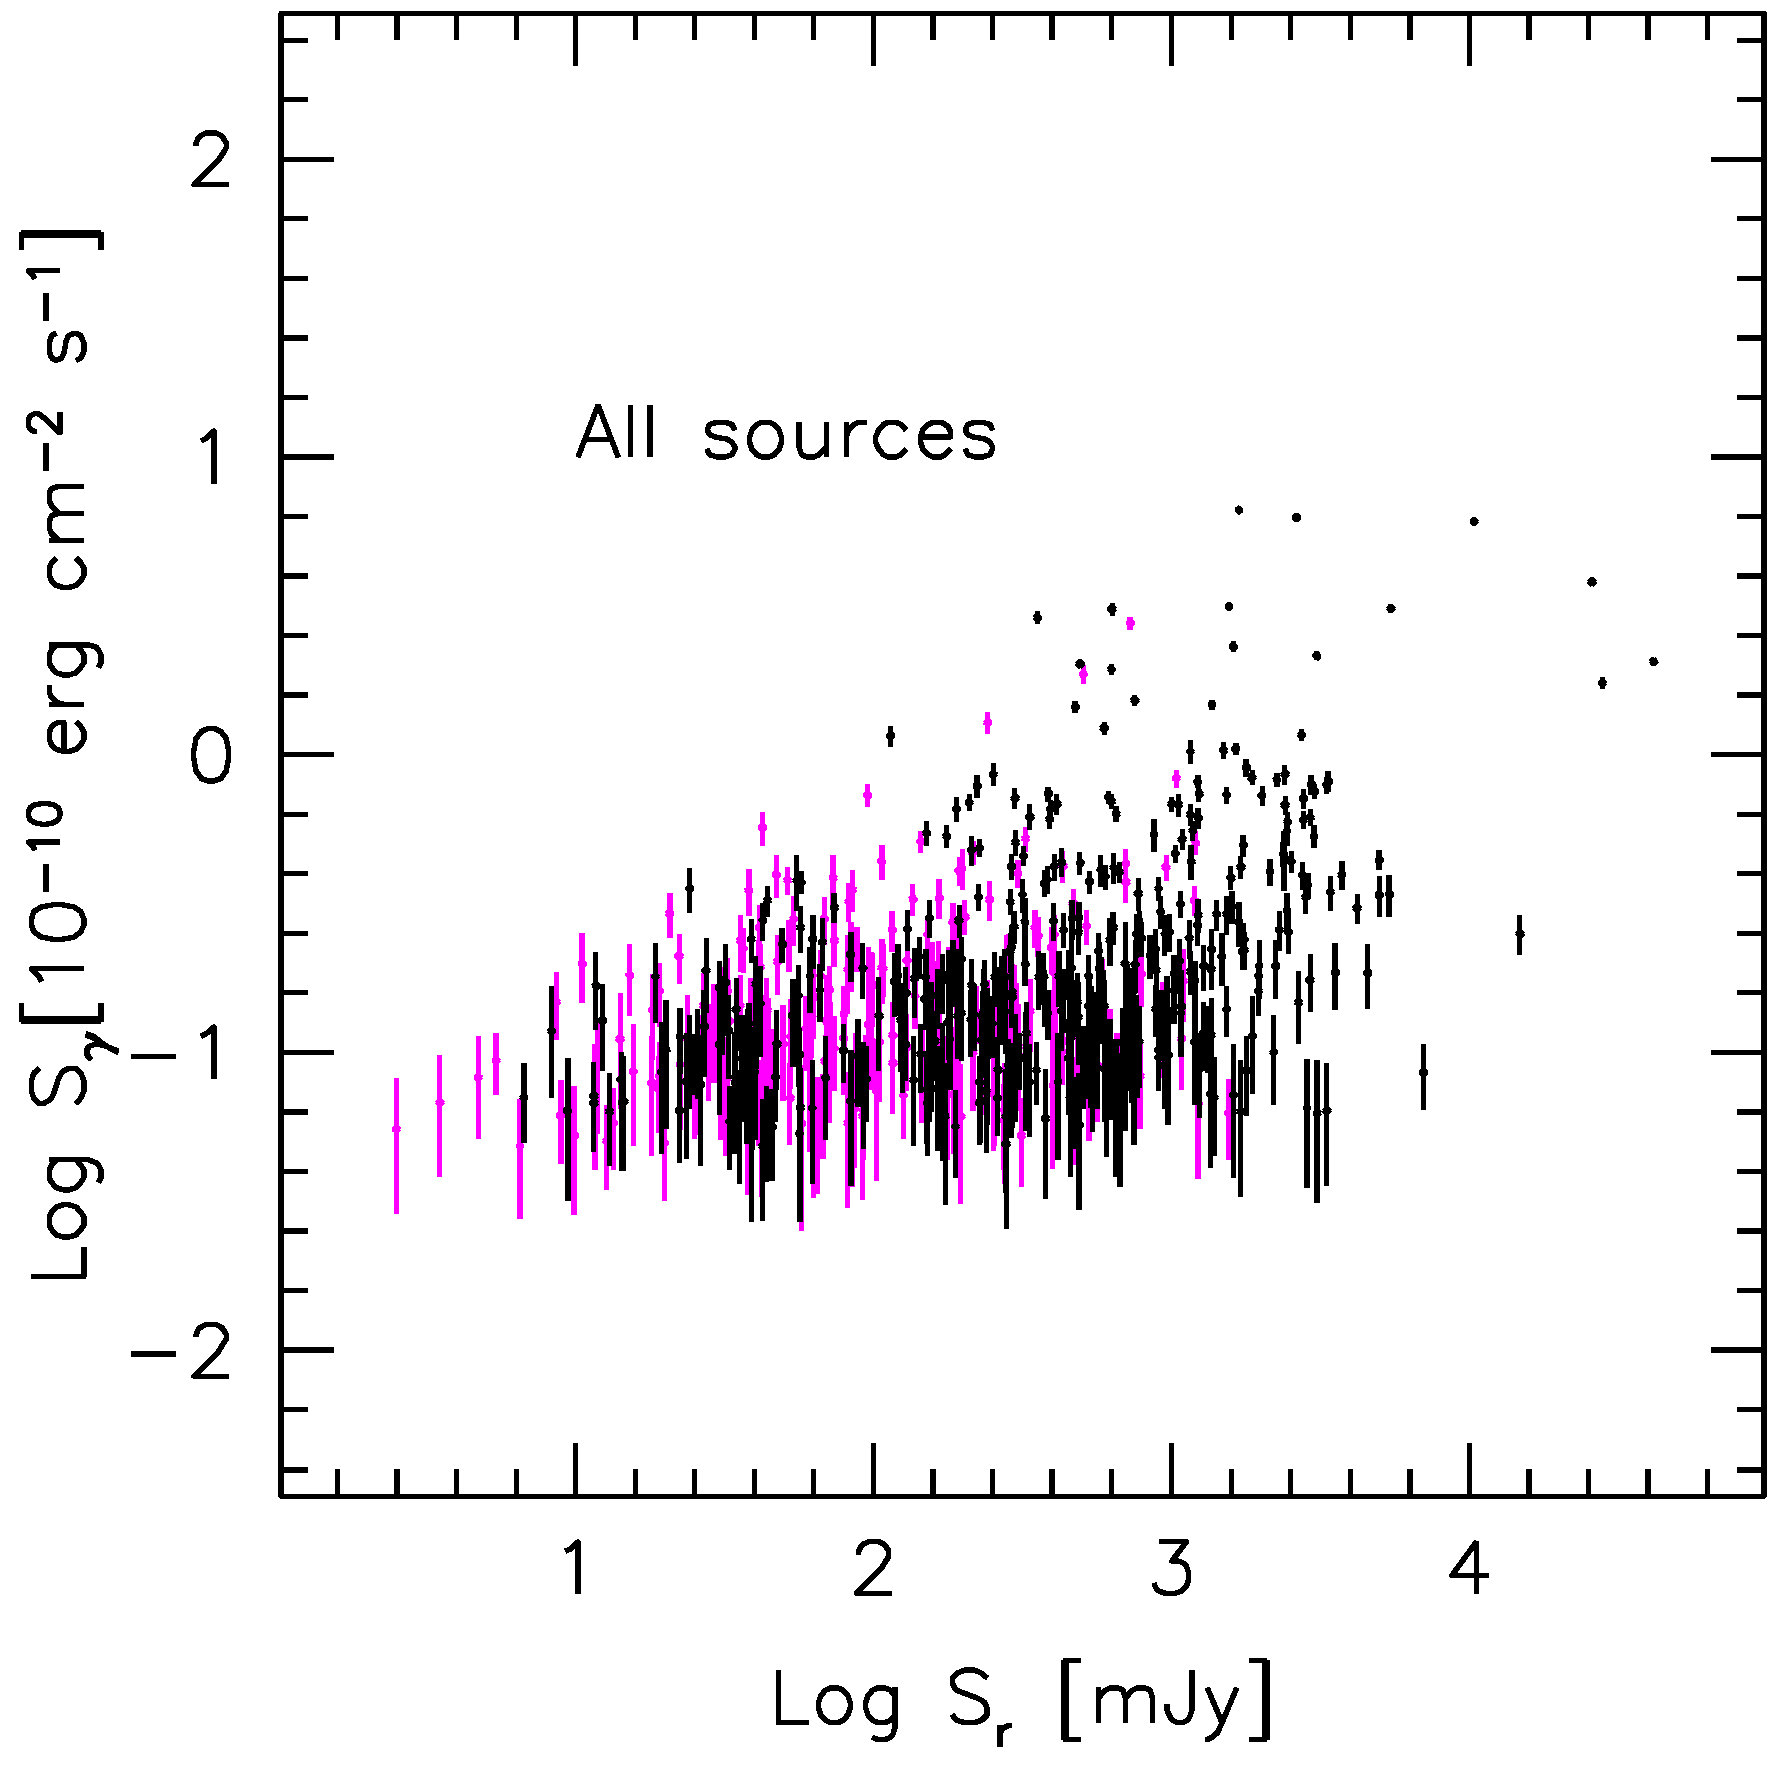
2. Radio-Gamma Ray Connection between ∼GHz and E > 100 MeV Data

The most comprehensive approach ever used for the assessment of the connection between radio and gamma-ray data in extragalactic radio sources was presented in [1]. In that work, we considered all 599 “clean” AGNs (i.e., gamma-ray sources with a single high confidence association and no analysis flag) contained in the first catalogue of AGN detected by Fermi-LAT (1LAC, [26]); this was not only the largest sample ever considered but also the one in which both blazar types (BL Lacs and flat spectrum radio quasars, FSRQ) were both adequately represented; most other works were limited to very bright sources, thus excluding most of the BL Lacs. Archival interferometric data with sub-arcsecond resolution in the GHz domain (typically, at 8 GHz) were available, as well as simultaneous 15 GHz data from the Owens Valley Radio Observatory (OVRO) monitoring project, at least for a subsample ([27] see also Pearson, this conference). Finally, a dedicated statistical analysis was developed in order to assess the significance of the correlation independent of the various biases that can occur in such kinds of studies [28]. The main results can be summarised as follows:
  • The entire 599-source sample shows a correlation characterised by a Pearson’s coefficient r = 0 . 47 (see Figure 1);
  • The chance probability of obtaining this value from two intrinsically uncorrelated quantities with the same dynamic range in flux density is smaller than 10 7 ;
  • Both BL Lacs and FSRQ considered separately display a strong and highly significant correlation; the correlation is stronger for BL Lacs ( r BLL = 0 . 62 vs. r FSRQ = 0 . 42 );
  • If we classify blazars according to the synchrotron component peak frequency as low-, intermediate-, high-synchrotron peaked blazars (LSP, ISP, HSP, respectively, for peak frequencies ν peak in Hz such that log ν peak < 14 , 14 < log ν peak 15 , log ν peak > 15 ), HSP blazars are the type that shows the strongest correlation;
  • If we consider gamma-ray data in sub-energy bands, we find that the energy band showing the strongest correlation with radio data increases from LSP (which have the strongest correlation when gamma rays of energy between 100 and 300 MeV are considered), to ISP, to HSP (which have the peak in the band between 1 and 3 GeV);
  • Considering the subset of OVRO-monitored sources, both the correlation strength r and significance P improve when considering simultaneous vs archival data (chance probability decreasing from 1 . 9 × 10 6 to 9 × 10 8 ); we note however that this sample contains “only” 161 sources.

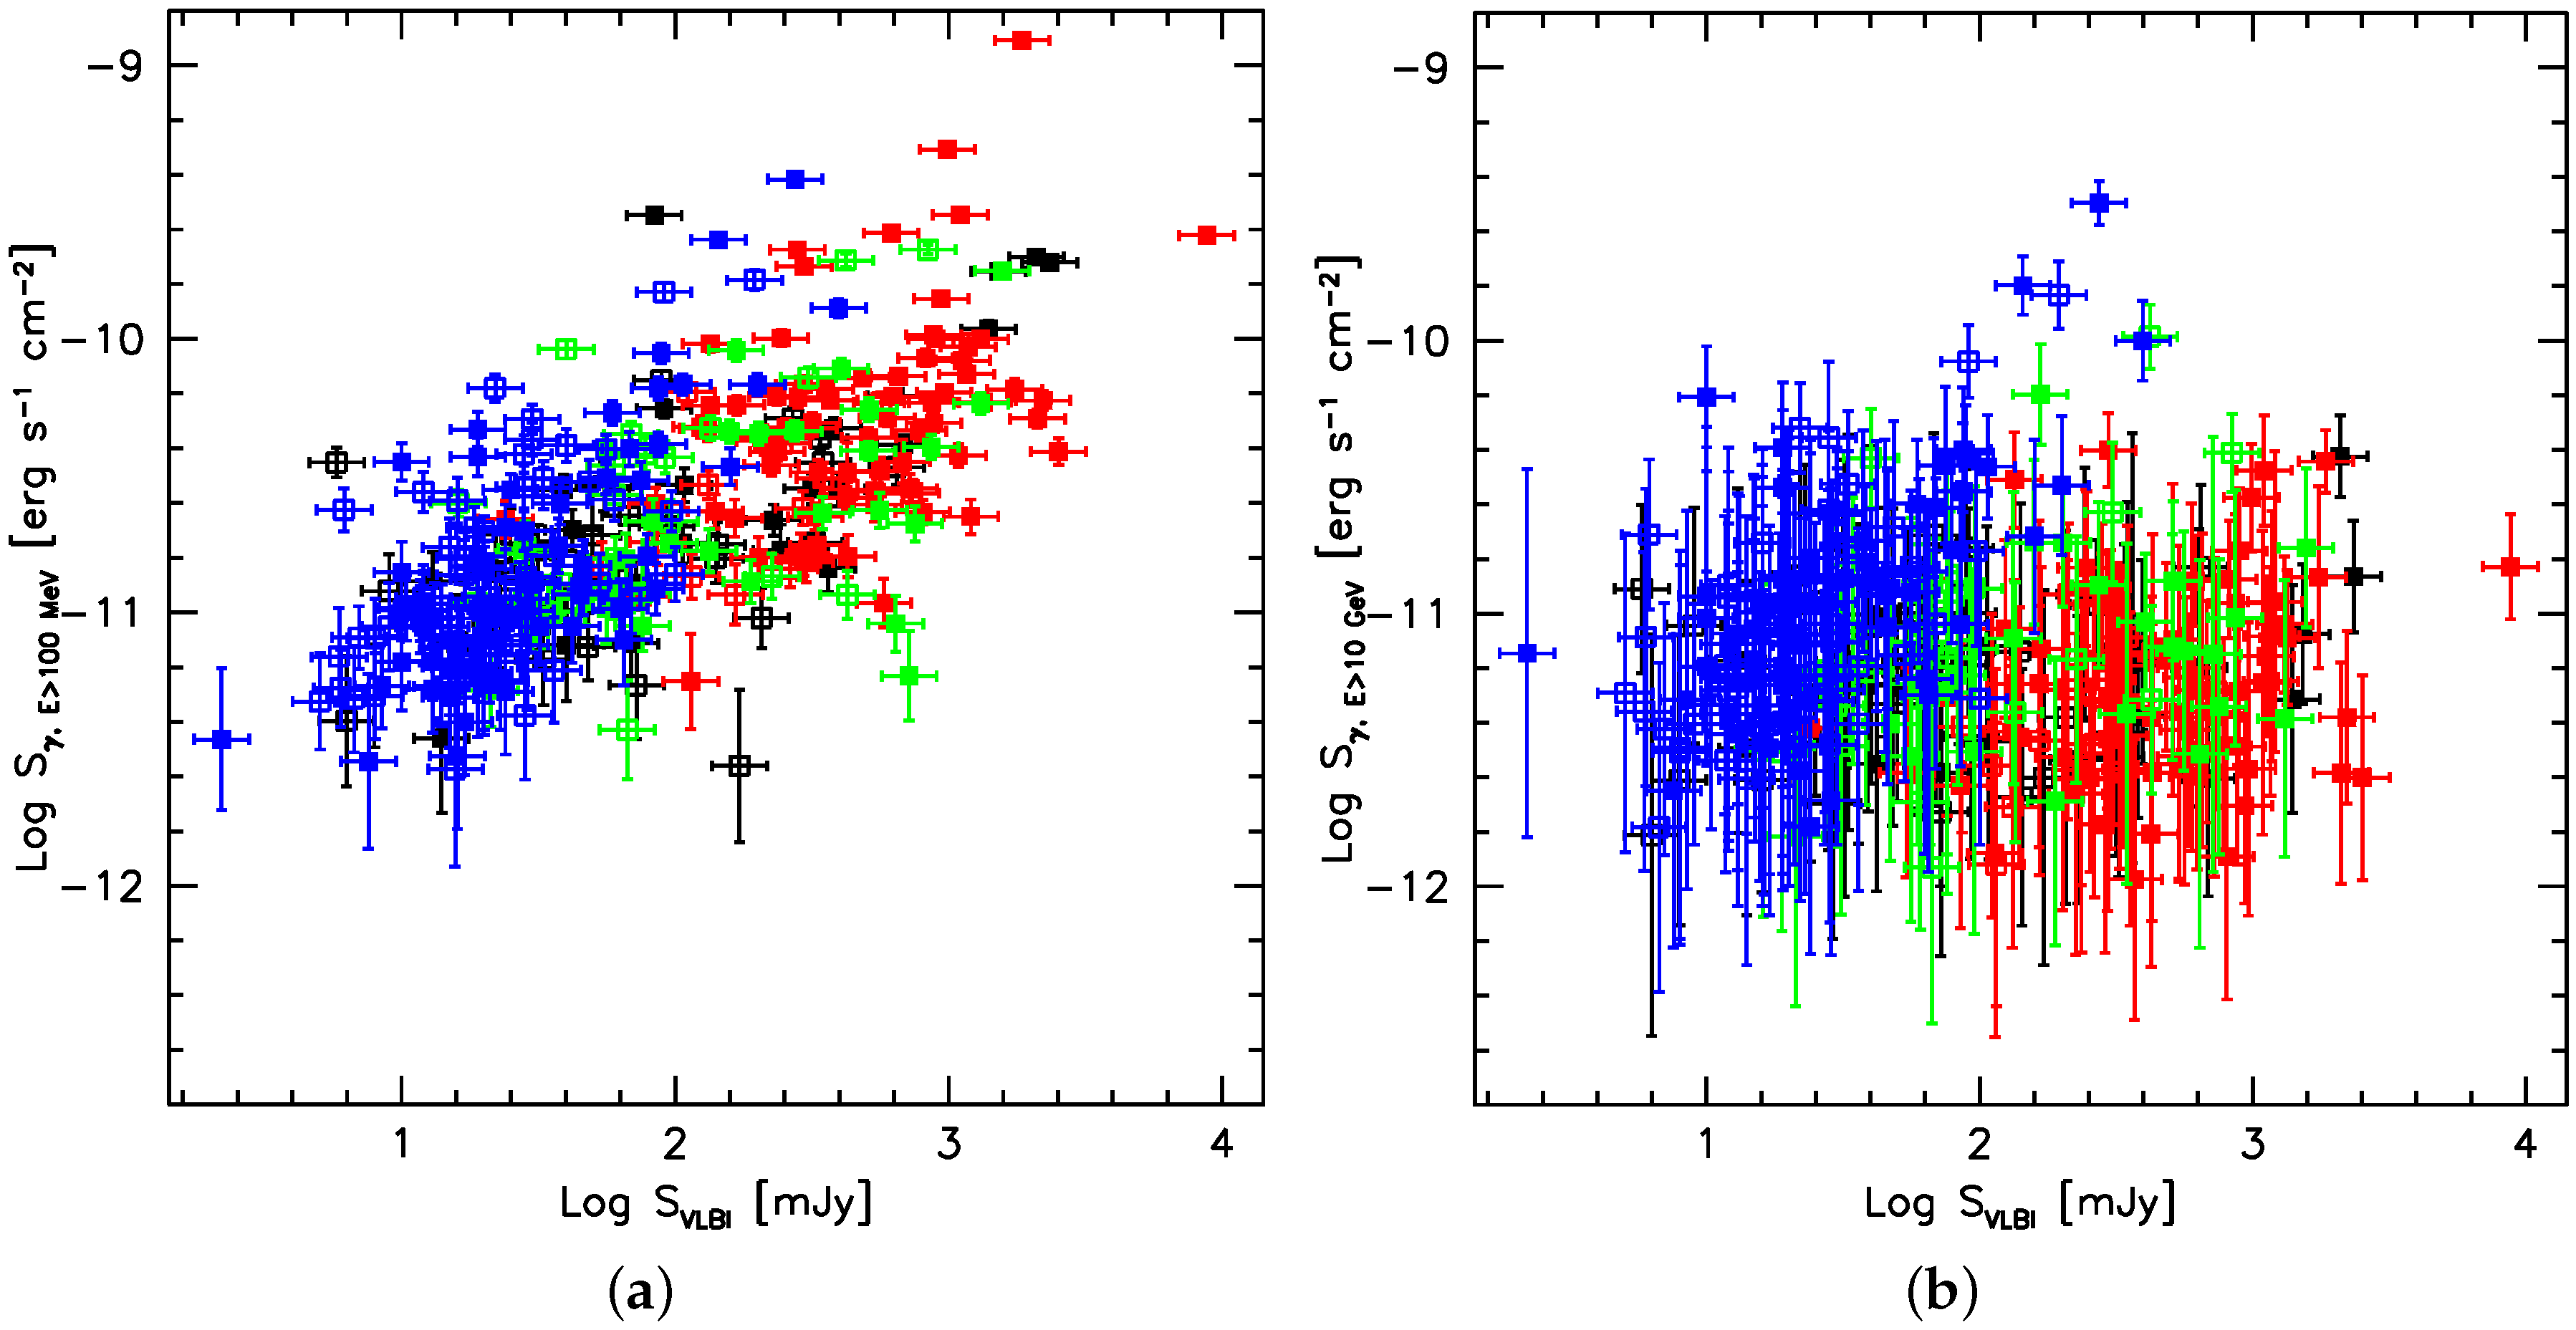
3. Radio-Gamma ray Connection between VLBI and E > 10 GeV Data

While the work of [1] demonstrated the existence of a strong and highly significant correlation between radio data and high energy gamma rays, the situation is far more open when we consider Very High Energy (VHE, E > 100 GeV) gamma rays. In this domain, observations are carried out in targeted mode with imaging atmospheric Cherenkov telescopes (IACT), so that no systematic and unbiased survey exists. Sources are often detected when they are in flaring states, and the optimization of the observing strategy naturally carries a selection bias in favour of sources physically similar to those already detected. Moreover, it is still true that all the classified extragalactic VHE sources are RL AGNs, yet their radio properties are far less extreme, with low-luminosity sources, and in particular HSP BL Lacs, being more frequently detected than higher bolometric luminosity ones, such as LSP BL Lacs and FSRQs.
In this sense, the first Fermi-LAT catalogue of sources above 10 GeV (1FHL, [29]) represents an ideal resource to try and connect the HE and VHE domains. The 2FHL (above 50 GeV, [30]) and the surveys that will be carried out with the Cherenkov Telescope Array (CTA) in the coming years will allow us to extend our understanding. The 1FHL is based on three years of Fermi-LAT survey data and it is as uniform and unbiased as possible. It contains 514 sources, 76% of which are AGN and 13% are UGS; the AGN fraction is larger than in 3FGL and the census leans towards extreme spectral type blazars (HSP, 41%). The fraction of UGS is lower, thanks to generally smaller positional uncertainty ellipses when higher energy photons are considered.
We are carrying out a project aimed at studying all the sources in the 1FHL with very long baseline interferometry (VLBI), in order to characterize the parsec scale properties of this population, which several works have highlighted to be rather peculiar [31,32,33,34,35]. Lico et al. [36] have presented new 5 GHz VLBI images for the less studied objects, proposing also associations for some of the UGS. Thanks to these new images, it is now possible to discuss the radio-gamma correlation for the sample (in particular, the northern subset) without any observational bias. If we consider the VLBI flux density and the 3FGL energy flux (i.e., the gamma-ray energy flux in the entire E > 100 MeV band), the sample shows a strong and highly significant correlation, with r = 0 . 73 and P chance < 10 6 , even stronger than what was presented in Section 2. This is likely due to the fact that VLBI observations filter out extended emission and provide a measurement of a jet region much closer to the gamma-ray zone.
However, when we consider gamma rays of energy E > 10 GeV, the correlation essentially vanishes, with r = 0 . 02 . Both weak (typically, BL Lacs) and bright (typically, FSRQs) radio sources have lower gamma-ray energy flux in this band, which is obvious as the band itself is narrower. However, the brightest sources have softer photon indexes, which results in a more pronounced decrease of the gamma-ray energy flux for these objects (Figure 2). As a consequence, no significant trend is observed. Only if we focus on the sub-class of HSP blazars, do we find evidence of a correlation between the two bands ( r = 0 . 60 , P chance = 0 . 0032 ).

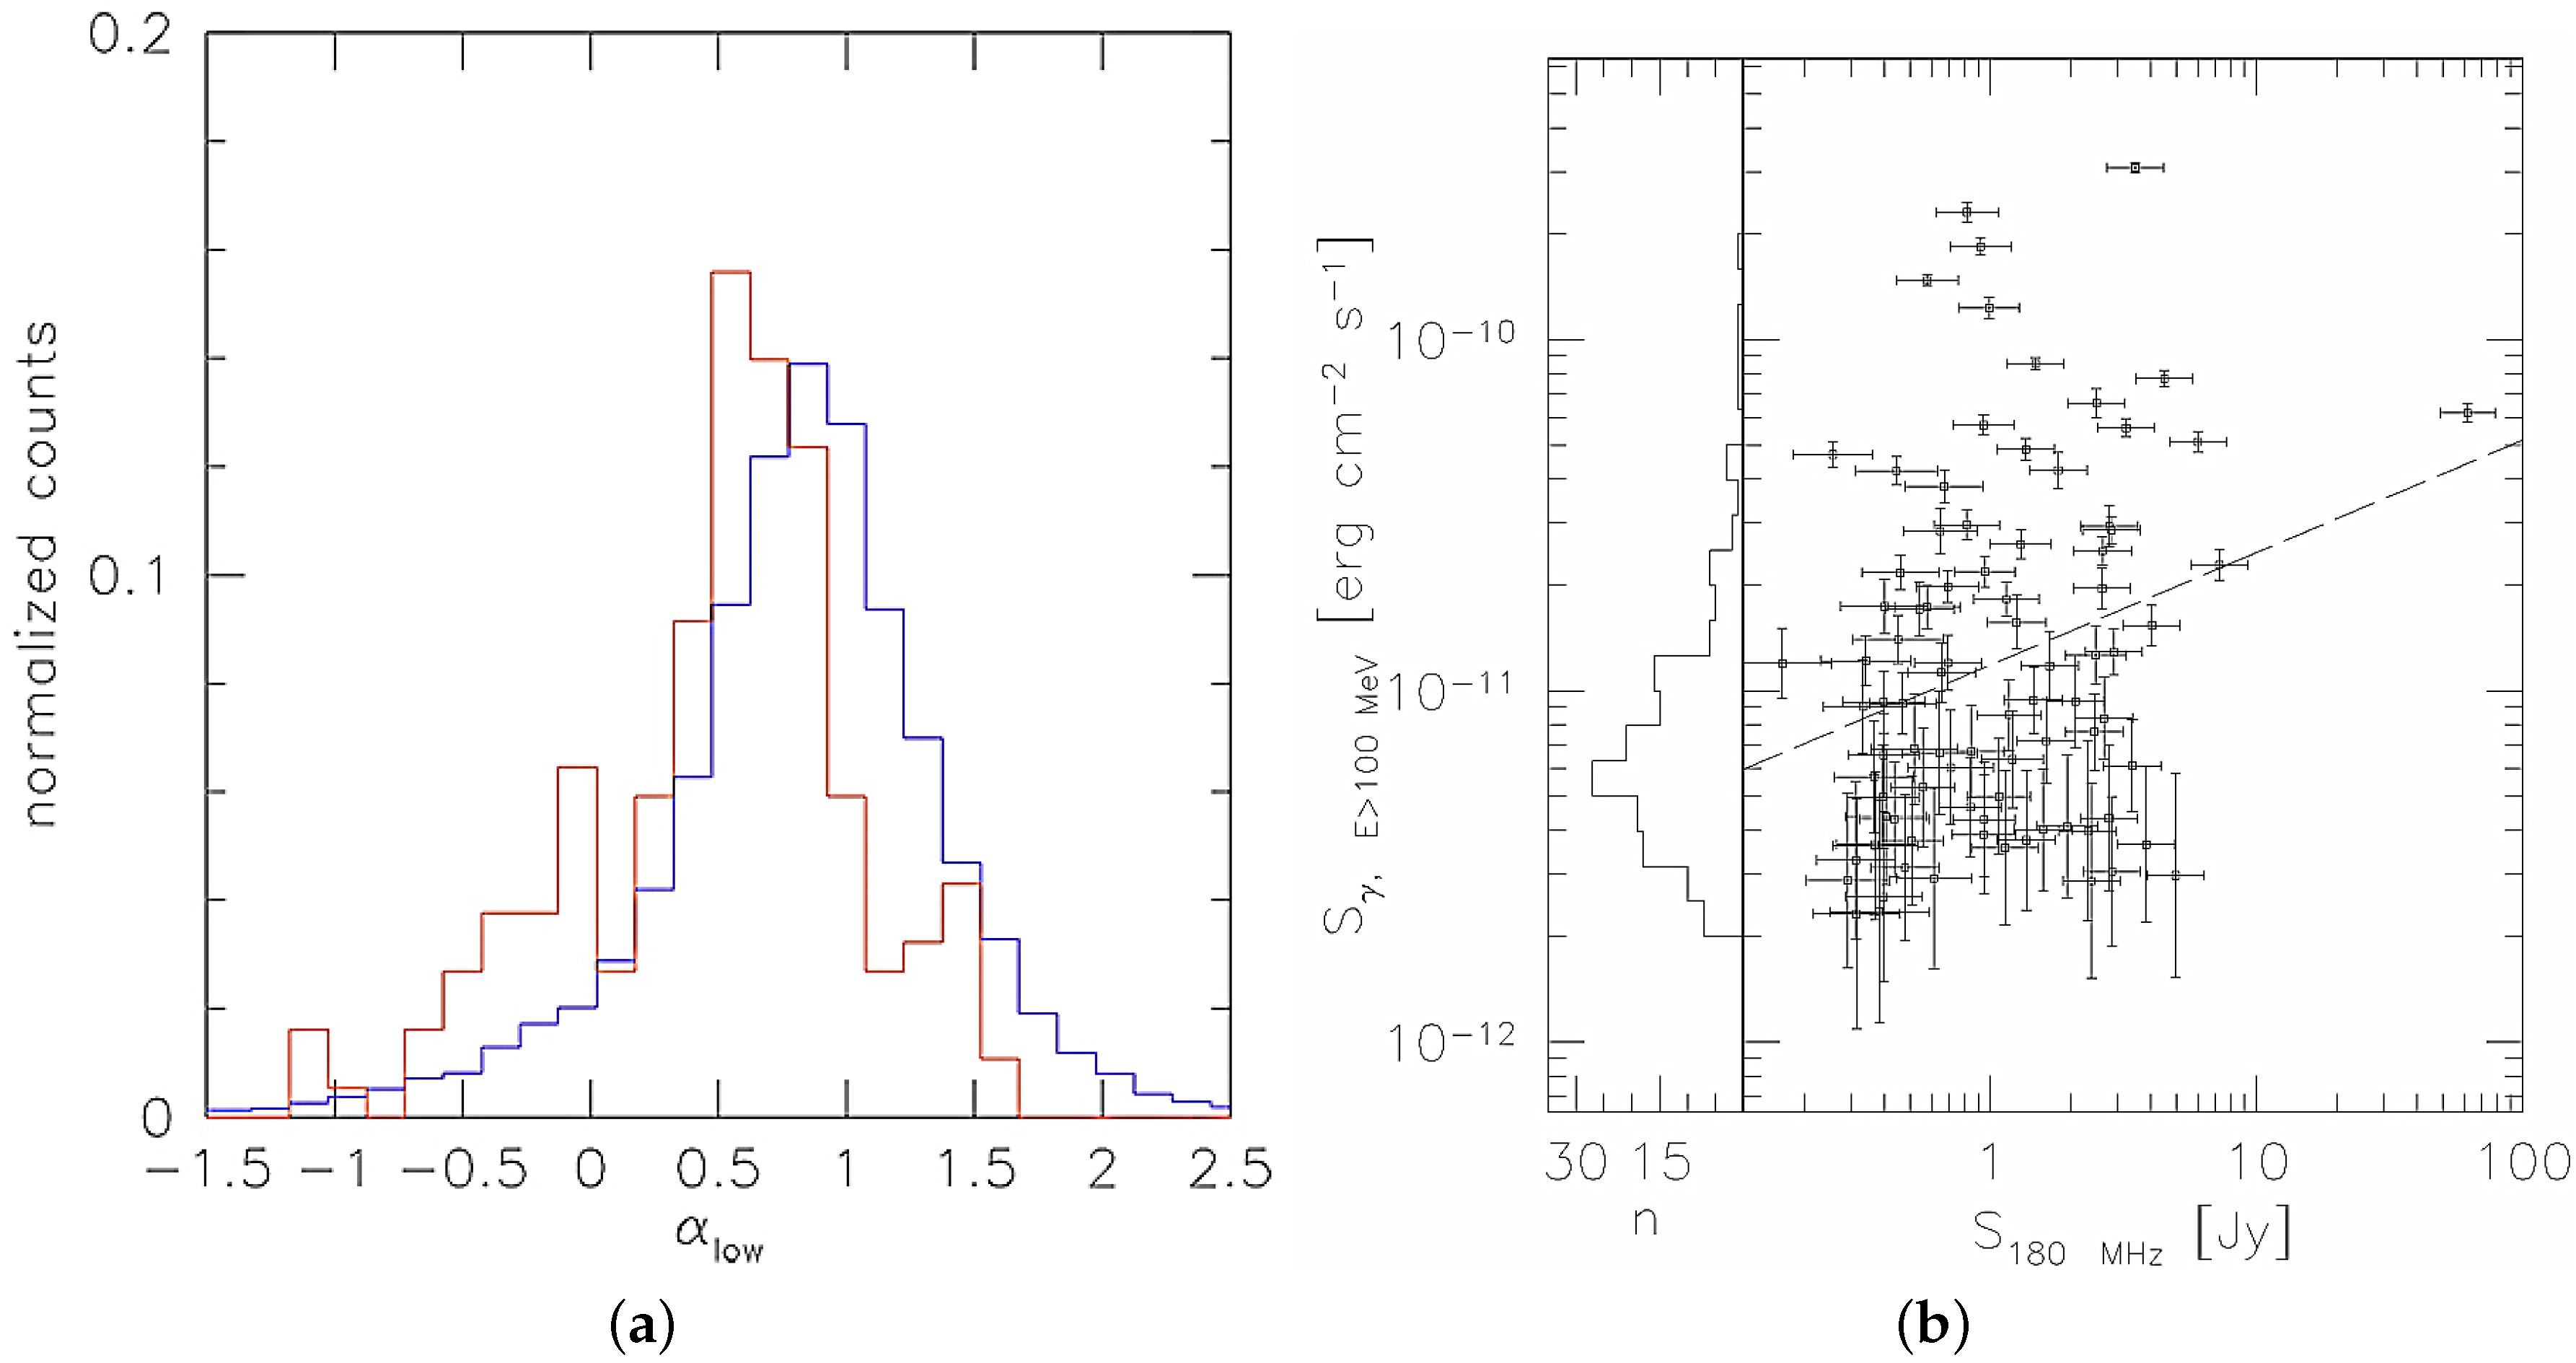
4. Radio-Gamma ray Connection between ∼100 MHz and E > 100 MeV Data

Although somehow counter-intuitively, low frequency observations have been shown to be useful in studying blazars and in classifying UGS [37,38,39]. The main reason is that UGSs are in general faint, and on the basis of the correlation demonstrated in [1], we can expect them to be associated with weak radio sources. Since weak radio sources are much more numerous than the bright ones, it is difficult to pinpoint the correct counterpart of a given UGS. It is therefore mandatory to add some physical information about the nature of the known gamma-ray sources and low frequency surveys are a relatively cheap way to obtain this information, e.g., by studying the radio spectral index.
The MWA [40] is the first operational Square Kilometer Array (SKA) precursor. It paves the way towards low frequency (<200 MHz) radio astronomy. A commissioning survey catalogue (MWACS , presented in [41]) includes ∼14,000 sources over 6100 deg 2 in the southern sky, with a 3 σ sensitivity of ∼120 mJy, a positional accuracy of ∼3 , flux density values at 120, 150, 180 MHz, and the corresponding spectral index (We define the spectral index α such that S ν ν α ) α low . We cross-correlated the MWACS with the fifth edition of the Roma BZCat [42], finding low frequency matches for 36% of all known blazars in the MWACS sky area: the detection rate is higher for FSRQs than for BL Lacs, and it is higher for gamma-ray blazars than for non-gamma-ray ones (see Table 1).
In terms of low frequency spectral indexes, blazars are flatter than the rest of the sources in MWACS, with α low , blazars = 0 . 51 ± 0 . 05 and α low , all = 0 . 81 ± 0 . 01 (Figure 3, left panel). Moreover, many sources whose ∼GHz flux densities are above 120 mJy are not detected in MWA, indicating that they must have inverted spectra between 120 MHz and ∼1 GHz. Taken together, these results indicate that the flat-spectrum core remains prominent also at low frequency.
On the other hand, a linear fit to the gamma-ray energy flux vs MWA flux density at 180 MHz shows no significant ( r = 0 . 26 , P chance = 0 . 27 ) correlation (Figure 3, right panel). This indicates that a substantial contribution from the non-beamed lobes enters in the total radio flux density. Assuming the lobes to have a spectral index α l = 0 . 81 (the MWACS mean spectral index for the non-blazar population) and the core to have α c = 0 . 096 (as indicated by the 1 GHz to 20 GHz spectral index of the MWACS blazars), we determined that the flux density ratio of the two components is S c / S l 0 . 5 , 3 . 5 , 27 at 120 MHz, 1 GHz, and 20 GHz, respectively.
A detailed presentation of this work can be found in [25]. Future deeper all-sky surveys with MWA and LOFAR [43] will further improve our detection rates and provide a clearer picture of the relative contribution of these components.

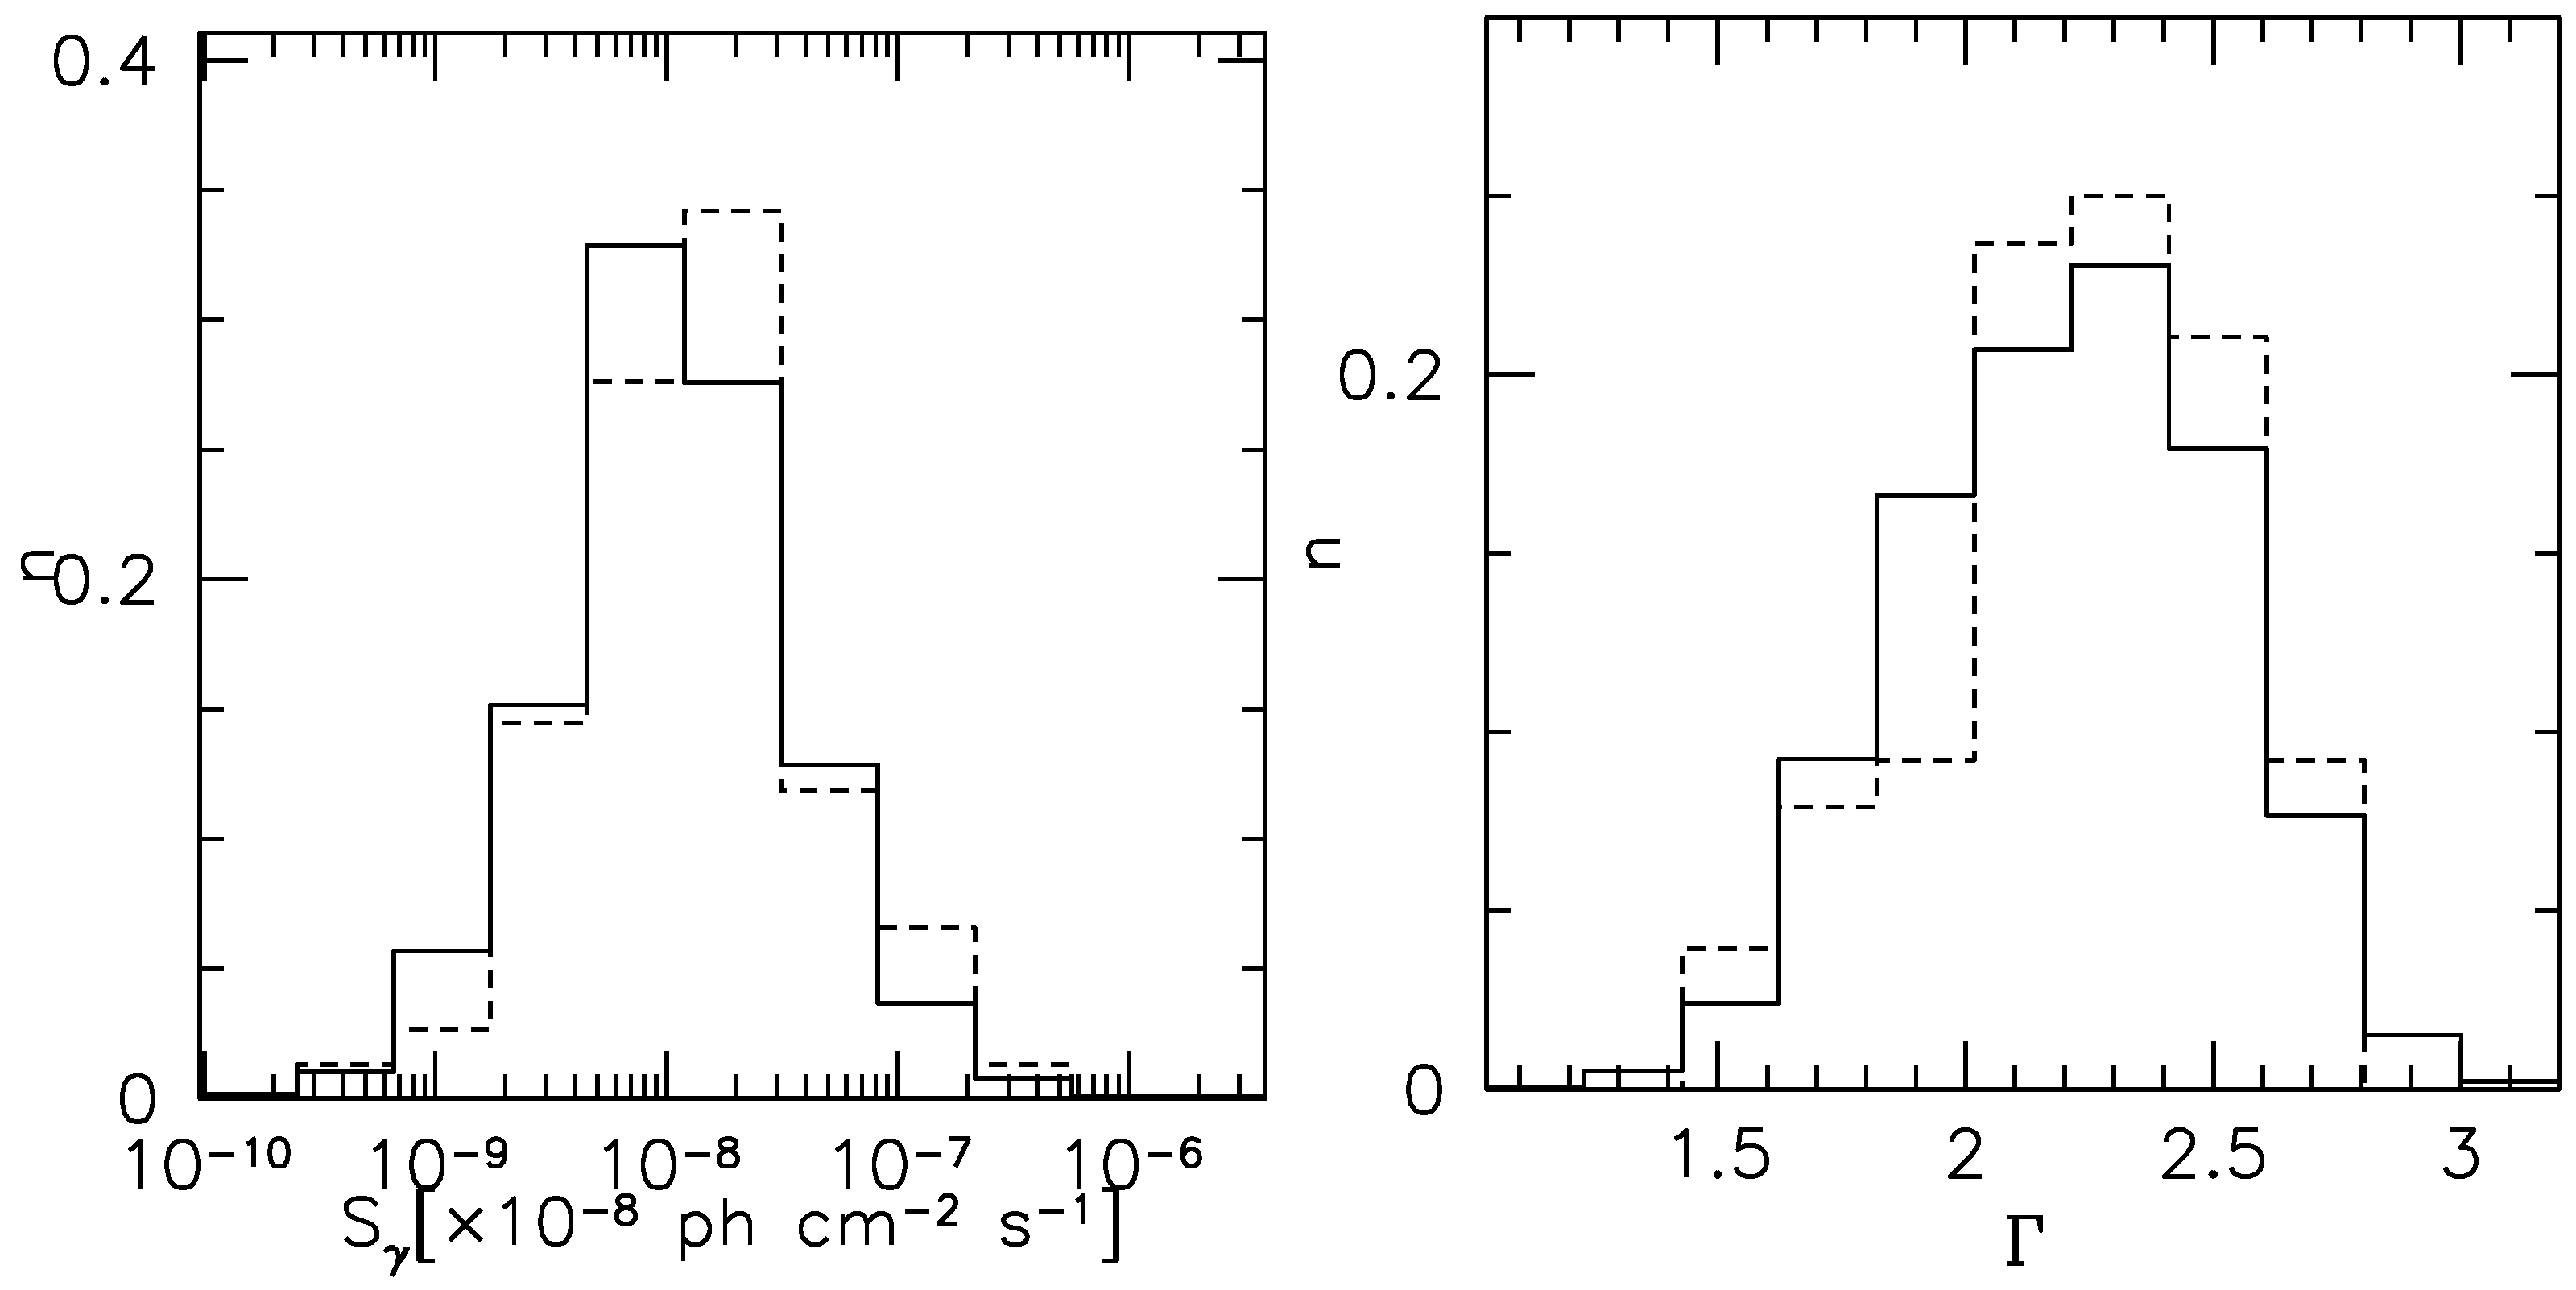
5. Radio-Gamma Ray Connection between 230 GHz and E > 100 MeV Data

Deep observations at high frequency are certainly more challenging to obtain for large samples, as the atmospheric conditions are more problematic and the instrument field of view is smaller. Since they provide crucial information about the most compact regions, it is however important to try to obtain millimetre data for as many sources as possible. For this reason, we selected a representative subsample of the 3LAC to be observed at 230 GHz with ALMA. This sample contains 77 sources, including 26 BL Lacs, 31 FSRQs, 16 blazars of uncertain type, 1 narrow-line Seyfert 1 galaxy, and 2 radio galaxies. In terms of SED-defined sub-classes, it contains 43, 14, and 18 blazars of the LSP, ISP, and HSP types. The gamma-ray flux and photon index distribution overlap strongly with those of the entire 3LAC, so that this sub-sample is suitable to represent the entire known gamma-ray blazar population (Figure 4).
The sources were observed in ALMA Cycle 3; all targets were detected, with rms noise generally in agreement with the predicted values of 0.3–0.5 mJy·beam 1 ; some exceptions were found for the brightest sources, due to dynamic range limitations. Flux densities range between just above 1 mJy and 6.5 Jy, for the core of Cen A.
A preliminary comparison of the ALMA and Fermi-LAT data already shows some interesting findings. The 230 GHz flux density and the E > 100 MeV energy flux are correlated with a coefficient r ALMA - LAT = 0 . 55 ; the correlation coefficient is significantly larger than what we find if we consider 1.4 GHz arcsecond-scale data, i.e., r NVSS - LAT = 0 . 39 . A more detailed analysis and discussion is in progress, including an assessment of the importance of comparing simultaneous data.

Acknowledgments

We thank the local organising committee for the great hospitality and for providing generous support to our participation. We acknowledge financial contribution from grant PRIN–INAF–2014. The Fermi LAT Collaboration acknowledges generous ongoing support from a number of agencies and institutes that have supported both the development and the operation of the LAT as well as scientific data analysis. These include the National Aeronautics and Space Administration and the Department of Energy in the United States, the Commissariat à l’Energie Atomique and the Centre National de la Recherche Scientifique/Institut National de Physique Nucléaire et de Physique des Particules in France, the Agenzia Spaziale Italiana and the Istituto Nazionale di Fisica Nucleare in Italy, the Ministry of Education, Culture, Sports, Science and Technology (MEXT), High Energy Accelerator Research Organization (KEK) and Japan Aerospace Exploration Agency (JAXA) in Japan, and the K. A. Wallenberg Foundation, the Swedish Research Council and the Swedish National Space Board in Sweden. Additional support for science analysis during the operations phase is gratefully acknowledged from the Istituto Nazionale di Astrofisica in Italy and the Centre National d’Études Spatiales in France. This scientific work makes use of the Murchison Radio-astronomy Observatory, operated by CSIRO. We acknowledge the Wajarri Yamatji people as the traditional owners of the Observatory site. Support for the operation of the MWA is provided by the Australian Government Department of Industry and Science and Department of Education (National Collaborative Research Infrastructure Strategy: NCRIS), under a contract to Curtin University administered by Astronomy Australia Limited. We acknowledge the iVEC Petabyte Data Store and the Initiative in Innovative Computing and the CUDA Center for Excellence sponsored by NVIDIA at Harvard University. This paper makes use of the following ALMA data: ADS/JAO.ALMA#2013.1.01342.S. ALMA is a partnership of ESO (representing its member states), NSF (USA) and NINS (Japan), together with NRC (Canada) and NSC and ASIAA (Taiwan), in cooperation with the Republic of Chile. The Joint ALMA Observatory is operated by ESO, AUI/NRAO and NAOJ. This work is based on observations obtained through the S6340 VLBA project, in the framework of the Fermi-NRAO cooperative agreement. The National Radio Astronomy Observatory is a facility of the National Science Foundation operated under cooperative agreement by Associated Universities, Inc.

Author Contributions

Marcello Giroletti led the analysis for the work presented in Section 2, Section 4, Section 5 and wrote the paper. Rocco Lico led the data reduction and analysis for the work in Section 3. Monica Orienti and Filippo D’Ammando contributed to the experiment design and interpretation in all sections.

Conflicts of Interest

The authors declare no conflict of interest.

References

  1. Ackermann, M.; Ajello, M.; Allafort, A.; Angelakis, E.; Axelsson, M.; Baldini, L.; Ballet, J.; Barbiellini, G.; Bastieri, D.; Bellazzini, R.; Berenji, B. The Radio/Gamma-Ray Connection in Active Galactic Nuclei in the Era of the Fermi Large Area Telescope. Astrophys. J. 2011, 741, 33. [Google Scholar] [CrossRef]
  2. Dondi, L.; Ghisellini, G. Gamma-ray-loud blazars and beaming. Mon. Not. R. Astron. Soc. 1995, 273, 583–595. [Google Scholar]
  3. Ghirlanda, G.; Ghisellini, G.; Tavecchio, F.; Foschini, L. Correlation of Fermi Large Area Telescope sources with the 20-GHz Australia Telescope Compact Array radio survey. Mon. Not. R. Astron. Soc. 2010, 407, 791–803. [Google Scholar] [CrossRef]
  4. Ghirlanda, G.; Ghisellini, G.; Tavecchio, F.; Foschini, L.; Bonnoli, G. The radio-γ-ray connection in Fermi blazars. Mon. Not. R. Astron. Soc. 2011, 413, 852–862. [Google Scholar] [CrossRef]
  5. Kovalev, Y.Y.; Aller, H.D.; Aller, M.F.; Homan, D.C.; Kadler, M.; Kellermann, K.I.; Kovalev, Y.A.; Lister, M.L.; McCormick, M.J.; Pushkarev, A.B.; Ros, E. The Relation Between AGN Gamma-Ray Emission and Parsec-Scale Radio Jets. Astrophys. J. 2009, 696, L17–L21. [Google Scholar] [CrossRef]
  6. Mahony, E.K.; Sadler, E.M.; Murphy, T.; Ekers, R.D.; Edwards, P.G.; Massardi, M. High-frequency Radio Properties of Sources in the Fermi-LAT 1 year Point Source Catalog. Astrophys. J. 2010, 718, 587–595. [Google Scholar] [CrossRef]
  7. Muecke, A.; Pohl, M.; Reich, P.; Reich, W.; Schlickeiser, R.; Fichtel, C.E.; Hartman, R.C.; Kanbach, G.; Kniffen, D.A.; Mayer-Hasselwander, H.A.; Merck, M. On the correlation between radio and gamma ray luminosities of active galactic nuclei. Astron. Astrophys. 1997, 320, 33–40. [Google Scholar]
  8. Padovani, P.; Ghisellini, G.; Fabian, A.C.; Celotti, A. Radio-loud AGN and the extragalactic gamma-ray background. Mon. Not. R. Astron. Soc. 1993, 260, L21–L24. [Google Scholar]
  9. Hartman, R.C.; Bertsch, D.L.; Bloom, S.D.; Chen, A.W.; Deines-Jones, P.; Esposito, J.A.; Fichtel, C.E.; Friedlander, D.P.; Hunter, S.D.; McDonald, L.M.; Sreekumar, P. The Third EGRET Catalog of High-Energy Gamma-Ray Sources. Astrophys. J. Suppl. Ser. 1999, 123, 79–202. [Google Scholar] [CrossRef]
  10. Acero, F.; Ackermann, M.; Ajello, M.; Albert, A.; Atwood, W.B.; Axelsson, M.; Baldini, L.; Ballet, J.; Barbiellini, G.; Bastieri, D.; Belfiore, A. Fermi Large Area Telescope Third Source Catalog. Astrophys. J. Suppl. Ser. 2015, 218, 23. [Google Scholar] [CrossRef]
  11. Ackermann, M.; Ajello, M.; Atwood, W.B.; Baldini, L.; Ballet, J.; Barbiellini, G.; Bastieri, D.; Gonzalez, J.B.; Bellazzini, R.; Bissaldi, E.; Blandford, R.D. The Third Catalog of Active Galactic Nuclei Detected by the Fermi Large Area Telescope. Astrophys. J. 2015, 810, 14. [Google Scholar] [CrossRef]
  12. Maraschi, L.; Fossati, G.; Tavecchio, F.; Chiappetti, L.; Celotti, A.; Ghisellini, G.; Grandi, P.; Pian, E.; Tagliaferri, G.; Treves, A.; Breslin, A.C. Simultaneous X-Ray and TEV Observations of a Rapid Flare from Markarian 421. Astrophys. J. 1999, 526, L81–L84. [Google Scholar] [CrossRef] [PubMed]
  13. Fossati, G.; Maraschi, L.; Celotti, A.; Comastri, A.; Ghisellini, G. A unifying view of the spectral energy distributions of blazars. Mon. Not. R. Astron. Soc. 1998, 299, 433–448. [Google Scholar] [CrossRef]
  14. Ghisellini, G.; Celotti, A.; Fossati, G.; Maraschi, L.; Comastri, A. A theoretical unifying scheme for gamma-ray bright blazars. Mon. Not. R. Astron. Soc. 1998, 301, 451–468. [Google Scholar] [CrossRef]
  15. Ackermann, M.; Ajello, M.; Baldini, L.; Ballet, J.; Barbiellini, G.; Bastieri, D.; Bechtol, K.; Bellazzini, R.; Berenji, B.; Blandford, R.D.; Bonamente, E. Fermi Gamma-ray Space Telescope Observations of Gamma-ray Outbursts from 3C 454.3 in 2009 December and 2010 April. Astrophys. J. 2010, 721, 1383–1396. [Google Scholar] [CrossRef]
  16. Foschini, L.; Bonnoli, G.; Ghisellini, G.; Tagliaferri, G.; Tavecchio, F.; Stamerra, A. Fermi/LAT detection of extraordinary variability in the gamma-ray emission of the blazar PKS 1510-089. Astron. Astrophys. 2013, 555, A138. [Google Scholar] [CrossRef]
  17. Hayashida, M.; Nalewajko, K.; Madejski, G.M.; Sikora, M.; Itoh, R.; Ajello, M.; Blandford, R.D.; Buson, S.; Chiang, J.; Fukazawa, Y.; Furniss, A.K. Rapid Variability of Blazar 3C 279 during Flaring States in 2013–2014 with Joint Fermi-LAT, NuSTAR, Swift, and Ground-Based Multiwavelength Observations. Astrophys. J. 2015, 807, 79. [Google Scholar] [CrossRef]
  18. Saito, S.; Stawarz, Ł.; Tanaka, Y.T.; Takahashi, T.; Madejski, G.; D’Ammando, F. Very Rapid High-amplitude Gamma-Ray Variability in Luminous Blazar PKS 1510-089 Studied with Fermi-LAT. Astrophys. J. 2013, 766, L11. [Google Scholar] [CrossRef]
  19. Max-Moerbeck, W.; Hovatta, T.; Richards, J. L.; King, O.G.; Pearson, T.J.; Readhead, A.C.S.; Reeves, R.; Shepherd, M.C.; Stevenson, M.A.; Angelakis, E.; et al. Time correlation between the radio and gamma-ray activity in blazars and the production site of the gamma-ray emission. Mon. Not. R. Astron. Soc. 2014, 445, 428–436. [Google Scholar] [CrossRef]
  20. Abdo, A.A.; Ackermann, M.; Agudo, I.; Ajello, M.; Allafort, A.; Aller, H.D.; Aller, M.F.; Antolini, E.; Arkharov, A.A.; Axelsson, M.; et al. Fermi Large Area Telescope and Multi-wavelength Observations of the Flaring Activity of PKS 1510-089 between 2008 September and 2009 June. Astrophys. J. 2010, 721, 1425–1447. [Google Scholar] [CrossRef]
  21. Spingola, C.; Dallacasa, D.; Orienti, M.; Giroletti, M.; McKean, J.P.; Cheung, C.C.; Hovatta, T.; Ciprini, S.; D’Ammando, F.; Falco, E.; et al. Radio follow-up of the γ-ray flaring gravitational lens JVAS B0218+357. Mon. Not. R. Astron. Soc. 2016, 457, 2263–2271. [Google Scholar] [CrossRef]
  22. Tavani, M.; Vittorini, V.; Cavaliere, A. An Emerging Class of Gamma-ray Flares from Blazars: Beyond One-zone Models. Astrophys. J. 2015, 814, 51. [Google Scholar] [CrossRef]
  23. Linford, J.D.; Taylor, G.B.; Romani, R.W.; Healey, S.E.; Helmboldt, J.F.; Readhead, A.C.S.; Reeves, R.; Richards, J.L.; Cotter, G. Characteristics of Gamma-ray Loud Blazars in the VLBA Imaging and Polarimetry Survey. Astrophys. J. 2011, 726, 16. [Google Scholar] [CrossRef]
  24. Lister, M.L.; Aller, M.F.; Aller, H.D.; Hovatta, T.; Max-Moerbeck, W.; Readhead, A.C.S.; Richards, J.L.; Ros, E. Why Have Many of the Brightest Radio-loud Blazars Not Been Detected in Gamma-Rays by Fermi? Astrophys. J. 2015, 810, L9. [Google Scholar] [CrossRef]
  25. Giroletti, M.; Massaro, F.; D’Abrusco, R.; Lico, R.; Burlon, D.; Hurley-Walker, N.; Johnston-Hollitt, M.; Morgan, J.; Pavlidou, V.; Bell, M.; et al. High-energy sources at low radio frequency: The Murchison Widefield Array view of Fermi blazars. Astron. Astrophys. 2016, 588, A141. [Google Scholar] [CrossRef]
  26. Abdo, A.A.; Ackermann, M.; Ajello, M.; Allafort, A.; Antolini, E.; Atwood, W.B.; Axelsson, M.; Baldini, L.; Ballet, J.; Barbiellini, G. The First Catalog of Active Galactic Nuclei Detected by the Fermi Large Area Telescope. Astrophys. J. 2010, 715, 429–457. [Google Scholar] [CrossRef]
  27. Richards, J.L.; Max-Moerbeck, W.; Pavlidou, V.; King, O.G.; Pearson, T.J.; Readhead, A.C.; Reeves, R.; Shepherd, M.C.; Stevenson, M.A.; Weintraub, L.C.; et al. Blazars in the Fermi Era: The OVRO 40 m Telescope Monitoring Program. Astrophys. J. Suppl. Ser. 2011, 194, 29. [Google Scholar] [CrossRef]
  28. Pavlidou, V.; Richards, J.L.; Max-Moerbeck, W.; King, O.G.; Pearson, T.J.; Readhead, A.C.S.; Reeves, R.; Stevenson, M.A.; Angelakis, E.; Fuhrmann, L.; et al. Assessing the Significance of Apparent Correlations between Radio and Gamma-Ray Blazar Fluxes. Astrophys. J. 2012, 751, 149. [Google Scholar] [CrossRef]
  29. Ackermann, M.; Ajello, M.; Allafort, A.; Atwood, W.B.; Baldini, L.; Ballet, J.; Barbiellini, G.; Bastieri, D.; Bechtol, K.; Belfiore, A.; et al. The First Fermi-LAT Catalog of Sources above 10 GeV. Astrophys. J. Suppl. Ser. 2013, 209, 34. [Google Scholar] [CrossRef]
  30. Ackermann, M.; Ajello, M.; Atwood, W.B.; Baldini, L.; Ballet, J.; Barbiellini, G.; Bastieri, D.; Gonzalez, J.B.; Bellazzini, R.; Bissaldi, E.; et al. 2FHL: The Second Catalog of Hard Fermi-LAT Sources. Astrophys. J. Suppl. Ser. 2016, 222, 5. [Google Scholar] [CrossRef]
  31. Giroletti, M.; Giovannini, G.; Feretti, L.; Cotton, W.D.; Edwards, P.G.; Lara, L.; Marscher, A.P.; Mattox, J.R.; Piner, B.G.; Venturi, T.; et al. Parsec-Scale Properties of Markarian 501. Astrophys. J. 2004, 600, 127–140. [Google Scholar] [CrossRef]
  32. Giroletti, M.; Giovannini, G.; Taylor, G.B.; Falomo, R. A Sample of Low-Redshift BL Lacertae Objects. II. EVN and MERLIN Data and Multiwavelength Analysis. Astrophys. J. 2006, 646, 801–814. [Google Scholar] [CrossRef]
  33. Lico, R.; Giroletti, M.; Orienti, M.; Giovannini, G.; Cotton, W.; Edwards, P.G.; Fuhrmann, L.; Krichbaum, T.P.; Sokolovsky, K.V.; Kovalev, Y.Y.; et al. VLBA monitoring of Mrk 421 at 15 GHz and 24 GHz during 2011. Astron. Astrophys. 2012, 545, A117. [Google Scholar] [CrossRef]
  34. Lico, R.; Giroletti, M.; Orienti, M.; Gómez, J.L.; Casadio, C.; D’Ammando, F.; Blasi, M.G.; Cotton, W.; Edwards, P.G.; Fuhrmann, L.; et al. Very Long Baseline polarimetry and the γ-ray connection in Markarian 421 during the broadband campaign in 2011. Astron. Astrophys. 2014, 571, A54. [Google Scholar] [CrossRef]
  35. Piner, B.G.; Edwards, P.G. First-epoch VLBA Imaging of 20 New TeV Blazars. Astrophys. J. 2014, 797, 25. [Google Scholar] [CrossRef]
  36. Lico, R.; Giroletti, M.; Orienti, M.; D’Ammando, F. VLBA observations of radio faint Fermi-LAT sources above 10 GeV. Astron. Astrophys. 2016. [Google Scholar] [CrossRef]
  37. Massaro, F.; D’Abrusco, R.; Giroletti, M.; Paggi, A.; Masetti, N.; Tosti, G.; Nori, M.; Funk, S. Unveiling the Nature of the Unidentified Gamma-Ray Sources. III. Gamma-Ray Blazar-like Counterparts at Low Radio Frequencies. Astrophys. J. Suppl. Ser. 2013, 207, 4. [Google Scholar] [CrossRef]
  38. Massaro, F.; Giroletti, M.; Paggi, A.; D’Abrusco, R.; Tosti, G.; Funk, S. Blazar Spectral Properties at 74 MHz. Astrophys. J. Suppl. Ser. 2013, 208, 15. [Google Scholar] [CrossRef]
  39. Nori, M.; Giroletti, M.; Massaro, F.; D’Abrusco, R.; Paggi, A.; Tosti, G.; Funk, S. Unveiling the Nature of Unidentified γ-Ray Sources. VI. γ-Ray Blazar Candidates in the WISH Survey and their Radio Properties. Astrophys. J. Suppl. Ser. 2014, 212, 3. [Google Scholar] [CrossRef]
  40. Tingay, S.J.; Goeke, R.; Bowman, J.D.; Emrich, D.; Ord, S.M.; Mitchell, D.A.; Morales, M.F.; Booler, T.; Crosse, B.; Wayth, R.B.; et al. The Murchison Widefield Array: The Square Kilometre Array Precursor at Low Radio Frequencies. Publ. Astron. Soc. Aust. 2013, 30, e007. [Google Scholar] [CrossRef]
  41. Hurley-Walker, N.; Morgan, J.; Wayth, R.B.; Hancock, P.J.; Bell, M.E.; Bernardi, G.; Bhat, R.; Briggs, F.; Deshpande, A.A.; Ewall-Wice, A.; et al. The Murchison Widefield Array Commissioning Survey: A Low-Frequency Catalogue of 14,110 Compact Radio Sources over 6100 Square Degrees. Publ. Astron. Soc. Aust. 2014, 31, e045. [Google Scholar] [CrossRef]
  42. Massaro, E.; Maselli, A.; Leto, C.; Marchegiani, P.; Perri, M.; Giommi, P.; Piranomonte, S. The 5th edition of the Roma-BZCAT. A short presentation. Astrophys. Space Sci. 2015, 357, 1–4. [Google Scholar] [CrossRef]
  43. Van Haarlem, M.P.; Wise, M.W.; Gunst, A.W.; Heald, G.; McKean, J.P.; Hessels, J.W.T.; De Bruyn, A.G.; Nijboer, R.; Swinbank, J.; Fallows, R.; et al. LOFAR: The LOw-Frequency ARray. Astron. Astrophys. 2013, 556, A2. [Google Scholar] [CrossRef]
Figure 1. Gamma-ray energy flux at E > 100 MeV vs 8 GHz radio flux density for the 1LAC sample. Adapted from [1]. Magenta symbols indicate sources without a measured redshift.
Galaxies 04 00030 g001
Figure 2. Gamma-ray energy flux at E > 100 MeV (a) or E > 10 GeV (b) vs. 5 GHz very long baseline interferometry (VLBI) flux density for the 1FHL sample. Blue: BL Lacs; red: flat spectrum radio quasars (FSRQs); green: blazars of uncertain type (BCU); black: misaligned active galactic nuclei (AGNs).
Galaxies 04 00030 g002
Figure 3. (a): Cumulative distribution function for the low frequency spectral index of the entire MWACS catalogue (red line) and the blazar subset (blue line); (b): Gamma-ray energy flux at E > 100 MeV vs. 120 MHz flux density (main panel) or upper limits (side histogram). Adapted from [25]. Reproduced with permission from Astronomy & Astrophysics, © ESO.
Galaxies 04 00030 g003
Figure 4. Gamma-ray photon flux and index distribution for the entire 3LAC (solid histogram) and the subset observed with ALMA (dashed histogram).
Galaxies 04 00030 g004
Table 1. Detection rates of blazars in the MWACS.
All BlazarsGamma-ray Blazars
ClassFraction%Fraction%
Total186/51736%79/17445%
FSRQ147/32745%52/7173%
BL Lacs23/15315%19/8722%
BCU16/3743%8/1650%

