Article

Multifrequency Study of the Blazar 3C 454.3

by
Ilhuiyolitzin Villicaña-Pedraza
1,*,
Francisco Carreto-Parra
2,3,
Alberto Carramiñana
4 and
Julio Saucedo-Morales
5
1
Departamento de Física Teórica, Universidad Autónoma de Madrid, Madrid 28049, Spain
2
Science Department, New Mexico State University, Las cruces, NM 88003, USA
3
Departament of science VV, El Paso Community College, El Paso, TX 79915, USA
4
Coordinación de Astrofísica, Instituto Nacional de Astrofísica, Óptica y Electrónica, Puebla 72840, México
5
Departamento de Investigación en Física, Universidad de Sonora, Hermosillo Sonora 83000, México
*
Author to whom correspondence should be addressed.
Galaxies 2017, 5(1), 3; https://doi.org/10.3390/galaxies5010003
Submission received: 15 July 2016 / Revised: 26 November 2016 / Accepted: 15 December 2016 / Published: 30 December 2016
(This article belongs to the Special Issue Blazars through Sharp Multi-wavelength Eyes)

Abstract

:
This work is devoted to multi-frequency studying of the blazar 3C 454.3. The study includes spectroscopic and photometric observations in the optical, IR, and gamma-ray bands. We investigate whether a correlation exists in the light curves at different wavelengths. We have carried out observations of the optical spectrum (from 4000 to 7000 Angstroms) between 2007 and 2009, and identified MgII [2800 Angstroms] and FeII emission line features. We have obtained optical magnitudes and color indices of the quasar and performed a correlation between the optical, IR, and gamma-ray light curves. We have found statistically significant correlations between the light curves at different wavelengths.

1. Introduction

3C 454.3 is a blazar classified as a high polarized quasar (HPQ) with a redshift of z = 0.859. This is one of the brightest blazars, and it has a strong variability at all frequencies observed across the spectral energy distribution (SED). It exhibits superluminal motion of its radio jet components. The AGILE space telescope found that at energies greater than 100 MeV, 3C 454.3 has a variable flux. Due to the high variability, this is known as “Crazy Diamond”.
A high activity was detected in 2007 by AGILE in gamma rays [1]. Gu et al. [2] concluded that the quasar contains a binary system of black holes with masses of 0.5–4 × 10 9 M⊙, and an Eddington luminosity that ranges from 6 × 10 46 to 5 × 10 47 erg/s [3]. Additionally, variability of the gamma-ray continuum has been observed by the Fermi Gamma-ray Space Telescope since its launch.
This work presents unpublished results from observed data—a light curve and a spectrum were created. Section 1 gives the observational information and the instruments used. Section 2 details the data reduction for the optical band. Section 3 presents the results obtained in this work. Section 4 contains a discussion of the results, and Section 5 draws the conclusions of our study.

2. Methods

2.1. Observations

Observations of the optical spectrum (4000 to 7000 Angstroms) and at near-infrared frequencies were carried out with the 2.1 m telescope of the Observatorio Astronomico Guillermo Haro (OAGH) in Mexico toward the blazar 3C 454.3 between 2007 and 2009 (Table 1). The observations were pointed at the position RA(J2000) = 22:53:57.748 DEC(J2000) = +16:08:54; Feige 66 was the calibration star. Public data from the FERMI Gamma-ray Space Telescope were obtained between 2008 and 2009.
A Boller and Chivens spectrograph was used with a 2.5 slit, and a Tektronix CCD (1024 × 1024 pixels of 24 μ m × 24 μ m). The spectrograph was mounted over a f/12 Cassegrain telescope equipped with a collimator, and a camera with focal lengths of 1080 mm and 465 mm. This also contained a reflection grid, which can change orientation with a micrometer every five minutes, a grating of 150 l/mm, a blaze angle of 3 in a spectral region of 4000–7000 Angstroms with an effective spectral resolution of 8–10 Angstroms, and a Versarray detector. A LFOSC spectrophotometer also was used. The optics accept a f/12 beam over a field of 4.0 × 4.0 for direct imaging at Cassegrain focus of the 2.1-m telescope of the OAGH; filters V, B, and R were used in photometry. The CANICA (Cananea Near-Infrared Camera) [4] camera has a spectral range of 0.85–2.40 μ m. The pixel scale of 0.32 /pixel allowed a total field of view of 5.5 × 5.5 of the sky. Filters J, H, and K were used in the IR band. A HeAr lamp comparison was used with the spectrograph to calibrate the wavelength. During the observations, the air mass was 1.022 and the seeing was 1.5 arcsecs. The observation time at each epoch was 1200 s for 3C 454.3 spectra, while it was 60 s for Feige 66.
Photometric observations with LFOSC were carried out toward 3C 454.3 at four epochs of 2009, but only three were used because one had CCD problems. Table 2 shows the observation information.

2.2. Data Reduction and Analysis

2.2.1. Spectroscopic Data

We used IRAF (Image Reduction and Analysis Facility) for reduction and calibration. We also employed a grid of CCD images to obtain the signal-to-noise ratio in order to get counts proportional to the observed flux.
In addition, a correction of cosmic rays was done. BIAS and dark currents of combined images were removed. Flats were taken, combined, normalized, and filtered every night to get the flat field. The subroutines imcombine, imarith, and response were used to calibrate the FLAT spectrum, while for the photometry, imfilter was used.
With the BIAS eliminated and the flat field ready, the cosmic rays from the images of the standard star and the blazar, the comparison lamp, and the principal object were removed. For this, we used the tasks imedit, identify, noao, twodespect, longlist, and reidentify. The images are more affected by cosmic rays toward 3C 454.3 using much longer exposures.
The spectral inclination was corrected with the fitcoords task. In addition, we calibrated the spectra in wavelength using the lamp with thetransform task, which converts pixels to Angstroms. To get better images, the background function was used. Using the subroutine apall, the aperture was extracted wherever there was a signal. Using the functions noao, onedspec, and standard, the standard star was calibrated. The sensibility curve and extinction function were constructed with the sensfunc task to get the one-dimensional spectrum of the source. Finally, by applying extinction corrections, flux calibration, and the calibrate task, the final spectra of the source and the standard star were obtained.
The instrumental resolution of the spectrum in the object can be determined from the spectral lines of the comparison HeAr lamps. First, the FWHM is obtained on every date of observation before the calibration of the wavelength, and the line width is measured in pixels (refer to Table 3).

2.2.2. Photometry Data

The object was observed three times with the same filter to get a better resolution of the image. Images of 3C454.3 in different filters were de-biased and normalized by corresponding flat fields using the tasks imexam and phot.

3. Results

Five epochs of the blazar 3C 454.3 were reduced from 2007 to 2009. At two epochs, the observations used the LFOSC spectrograph, but calibration problems were detected from this spectrograph, so this data was eliminated. Consequently, only the information obtained with the Boller and Chivens spectrographs will be presented in the rest of this article. The spectrum obtained in June 2008 (Figure 1) shows an emission line of MgII [2800]. The spectra obtained in 2008 were similar to those published in literature [13].

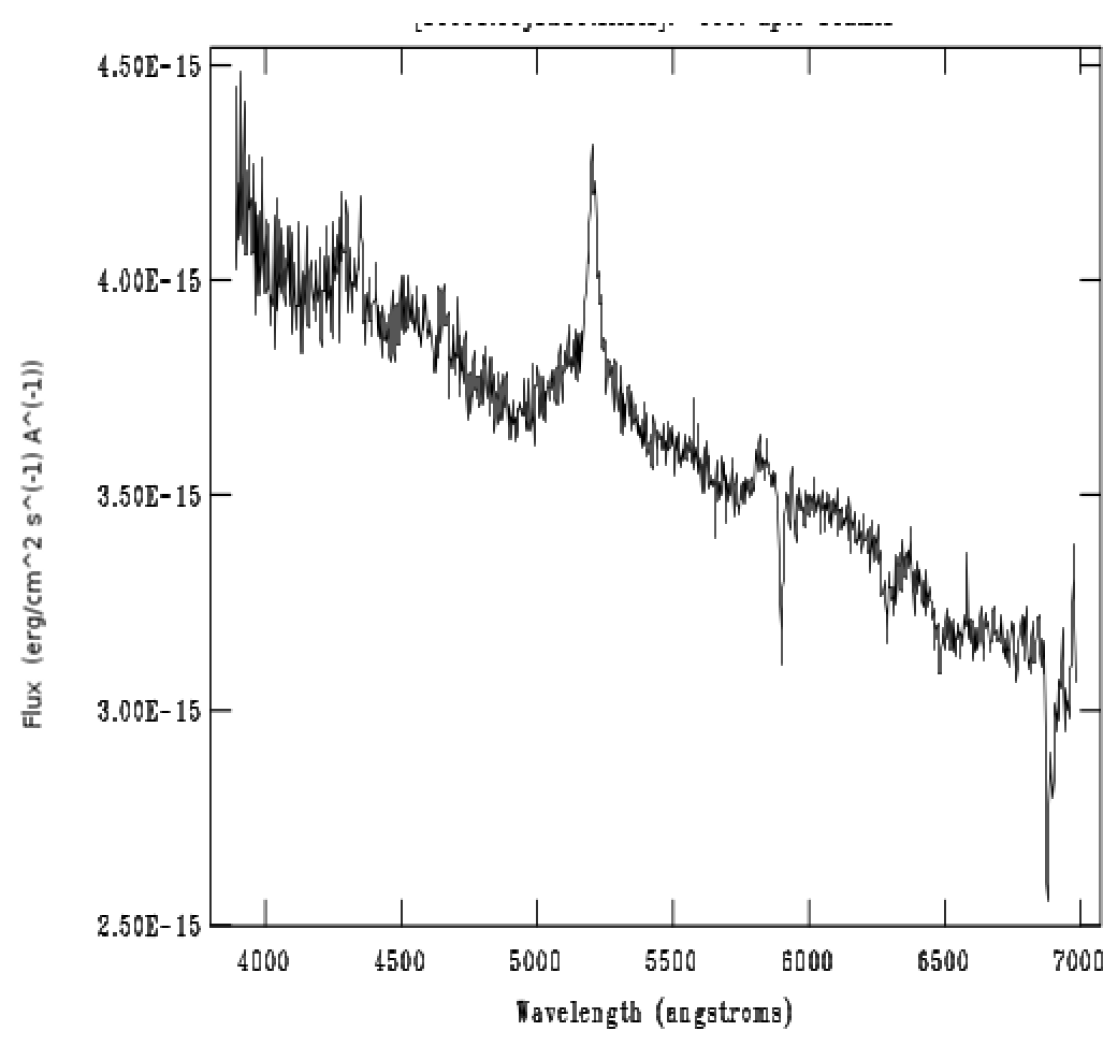
3.1. Corrections toward Spectra

Continuum Process

In order to obtain the continuum, the continuum task was used in IRAF (noao, onedspec) with the image corrected for redshift.
A visual analysis of the blazar 3C 454.3 spectrum was conducted by identifying three regions of FeII emission lines from λ = 2100 Å to λ = 2675 Å, λ = 2925 Å to λ = 3090 Å, and the MgII (λ = 2800 Å) region over the wings, similar to that measured by [11]. An average rms of 0.058 from the values of the rms obtained at each epoch: 0.026 (August 2007), 0.040 (June 2008), and 0.11 (November 2008). Using the rest and the observed frequencies, an average redshift of z = 0.85 was obtained.

3.2. Photometry Results

The method of differential photometry by Bruce L. Gary [5] calculates the magnitude from the apparent flux, the color sensitivity S of the star, and the zero point Z. The basic equation for this method is:
Mag = Z − 2.5Log(flux/g) − K’ × MA + S × StarColor,
where Z is the zero point, g is the exposition time, K the extinction, S is the color sensitivity, and MA the air mass. The color index is defined by using two filters. For example, C=V–R, where C is determined as a typical star, and C is approximately 0; the color term can be ignored if this is unknown. The zero points are presented in Table 4. The obtained results are shown in Table 5.

3.3. Correlations of Light Curves: IR vs. Gamma and Optical vs. IR

The blazar 3C 454.3 shows a strong variability correlation between the peak synchrotron component in IR, optical, UV waves, and the gamma ray component. These results suggest an increase in variability caused by changes in the number of energetic electrons inside a compact region in the jet [1]. The results presented here agree with [12,13], which did a similar work. For an extensive analysis, the results of this work were presented in the thesis of Villicaña-Pedraza in 2010 [9].

4. Discussion

From 2007 to 2009, five epochs were observed for spectroscopic analysis toward the blazar 3C 454.3 and the Feige 66 standard star. Three of them used the Boller and Chivens, and two used the LFOSC spectrophotometer. However, data from one epoch obtained with LFOSC was discarded due to bad spectral quality.
Four observations were done with a direct image using the LFOSC spectrophotometer. One of them was eliminated due to CCD problems. The photometric analysis—following the method of differential photometry by Bruce L. Gary and Hereford—agrees with the high variability of our source. Using our photometric results, a light curve correlation was found between the optical and public gamma and IR data.

5. Conclusions

Spectroscopic observations at five epochs were conducted from 2007 to 2009 for the blazar 3C 454.3. Two of these were eliminated due to bad quality spectra. Redshift corrections and a baseline continuum were made to obtain the corrected spectra. An emission line of MgII, FWHM, rms, velocity, and the contribution of FeII line were obtained for the final spectra. Photometric analysis was carried out toward the blazar 3C 454.3 at four epochs using a LFOSC spectrophotometer; data from one epoch was discarded due to CCD problems. Differential photometry was conducted using the method by Bruce L. Gary and Hereford. Values of flux and colors for 3C 454.3 in July, August, and September of 2009 were calculated. The light curve calculated in this work and the public data from 2008 to 2009 corroborate the existence of a high correlation of the light curve between the optical, IR, and gamma bands for the blazar 3C 454.3.

Acknowledgments

This work has been partially supported by the financial support from the National Institute of Astrophysical, Optical, and Electronic (INAOE). My gratitude to Carrasco L. for the IR information, and to NASA for the public information from the Fermi telescope. A special appreciation to Antonio Sanchez Ibarra, Carmen Mendiola, Hector P. Coiffier, Rocio P. Mendiola, K. Paola Tellez (and Pity). I want to thank the staff of the physical science and Astronomy Department of the Universidad de Sonora for their support in my years of progress. My gratitude to Luis Felipe Rodriguez from IRYA, Sergio Martin from ESO, Damian Mast from the Observatorio Astronomico de Cordoba, Angeles Diaz from Universidad Autonoma de Madrid, and Rolf Guesten from Max Planck for Radioastronomy for believing in me. I want to thank Hitomi Kamahara from the EPCC for all the proofreading of this paper.

Author Contributions

Villicaña-Pedraza and Carraminana did the observations, reduction and analysis; Saucedo-Morales was the supervisor and did a review of the results and methods; Carreto-Parra and Villicaña-Pedraza wrote the paper.

Conflicts of Interest

The authors declare no conflict of interest.

References

  1. Vercellone, S.; D’Ammando, F.; Vittorini, V.; Donnarumma, I.; Pucella, G.; Tavani, M.; Ferrari, A.; Raiteri, C.M.; Villata, M.; Romano, P.; et al. Multiwavelength Observations of 3C 454.3: Eighteen Months of Agile Monitoring of the ‘Crazy Diamond’. Astrophys. J. 2010, 712, 405. [Google Scholar] [CrossRef]
  2. Gu, M.; Cao, X.; Jiang, D.R. On the masses of black holes in radio-loud quasars. Mon. Not. R. Astron. Soc. 2001, 327, 1111–1115. [Google Scholar] [CrossRef]
  3. Khangulyan, D.V.; Barkov, M.V.; Bosch-Romon, V.; Aharonian, F.A.; Dorodnitsyn, A.V. Star-Jet Interactions and Gamma-Ray Outbursts from 3C454.3. Astrophys. J. 2013, 774, 113. [Google Scholar] [CrossRef]
  4. Recillas, E.; Carrasco, L.; Escobedo, G.A. NIR Studies of HGalaxies with CANICA. RMxAC 2005, 24, 45–47. Available online: http://citeweb.info/20051140208 (accessed on 15 December 2016). [Google Scholar]
  5. Bruce, L.G. CCD Transformation equations for use with single image (Differential) photometry. Available online: http://reductionism.net.seanic.net/CCD_TE/cte_alternative.html (accessed on 5 May 2010).
  6. Finding Charts for AGN. Available online: http://www.lsw.uni-heidelberg.de/projects/extragalactic/charts/ (accessed on 23 September 2009).
  7. Bonning, E.W.; Bailyn, C.; Urry, C.M.; Buxton, M.; Fossati, G.; Maraschi, L.; Coppi, P.; Scalzo, R.; Isler, J.; Kaptur, A. Correlated variability in the blazar 3C 454.3. Astrophys. J. 2010, 697, L81. [Google Scholar] [CrossRef]
  8. Raiteri, C.M.; Villata, M.; Chen, W.P.; Hsiao, W.-S.; Kurtanidze, O.M.; Nilsson, K.; Larionov, V.M.; Gurwell, M.A.; Agudo, I.; Aller, H.D.; et al. The high activity of 3C 454.3 in autumn 2007: Monitoring by the WEBT during the AGILE detection. Astron. Astrophys. 2008, 485, L17. [Google Scholar] [CrossRef]
  9. Villicaña-Pedraza, I. Specific results for 3C 454.3. Multifrequency Study of Extragalactic Sources of Gamma Rays. Thesis 2010. Available online: https://www.researchgate.net/publication/305228473_Multifrequency_study_of_extragalactic_sources_of_gamma_rays (accessed on 13 July 2016).
  10. Poggianti, B.M. K and evolutionary corrections from UV to IR. Astron. Astrophys. 1997, 122, 399. [Google Scholar] [CrossRef]
  11. Dunlop, J.S. Quasar Hosts and the Black Hole-Spheroid Connection. arXiv, 2004; arXiv:0304168. [Google Scholar]
  12. Patiño-Álvarez, V. A Multiwavelength Cross-Correlation Variability Study of Fermi-LAT Blazars. arXiv, 2013; arXiv:1303.1898. [Google Scholar]
  13. León-Tavares, J. Flare-Like Variability of the Mg II λ2800 Emission Line in the Γ-Ray Blazar 3C 454.3. Astrophys. J. 2013, 763, 36. [Google Scholar] [CrossRef]
  14. Véron-Cetty, M.-P.; Véron, P. A catalogue of quasars and active nuclei: 13th edition. Astron. Astrophys. 2010, 518, A10. [Google Scholar]
Figure 1. Spectrum of 3C 454.3 achieved in June 2008; the spectrum is given in the observer frame. A bright and intense emission line correspond to MgII [2800 Angstroms], absorption lines are telluric.
Galaxies 05 00003 g001
Table 1. Epoch of observations and the spectrograph used.
EpochSpectrograph
16 August 2007Boller and Chivens
30 June 2008Boller and Chivens
2 November 2008Boller and Chivens
16 June 2009LFOSC
13 September 2009LFOSC
Table 2. Photometric observations of the blazar 3C 454.3 at four epochs in 2009. The table shows the observation date, filter, the exposure time (ExpT), and notes about the night.
DateFilterExpT Notes
26 July 2009B120Not Photometric night
V90
R60
14 August 2009B120Not Photometric night
V10
R10
13 September 2009B120Not Photometric night
V30
R12
Table 3. Instrumental resolutions used in the observations. Different dispersion values associated with the same grid are due to the collimator calibration.
DateFWHM (pix)Grid (L/mm)Dispersion (Å/pix)Resolution (Å)
16 August 20071.0081502.72.72
30 June 20080.9411502.712.55
2 November 20081.4591502.693.92
Table 4. Zero point table for the 3C 454.3 blazar using B, V, and R filters at each epoch.
Date (JD 245)ZBZVZR
5039.7849422.904 ± 0.03423.421 ± 0.04323.095 ± 0.019
5059.7708323.564 ± 0.00124.144 ± 0.01524.536 ± 0.006
5088.8338222.887 ± 0.15124.395 ± 0.14923.949 ± 0.121
Table 5. Magnitudes B, V, and R with errors at each epoch obtained from differential photometry using the Bruce L. Gary and Hereford method.
DateMag B ± errMag V ± errMag R ± err
14 August 200916.437 ± 0.0115.760 ± 0.0315.276 ± 0.01
13 September 200915.601 ± 0.2614.904 ± 0.2614.267 ± 0.21

