Investigation of Similarity in the Spectra between Short- and Long-Duration Gamma-ray Bursts


Department of Physics andMathematics, College of Science and Engineering, Aoyama Gakuin University, 5-10-1 Fuchinobe, Chuo-ku, Sagamihara-shi, Kanagawa 252-5258, Japan
*
Author to whom correspondence should be addressed.
Galaxies 2018, 6(4), 106; https://doi.org/10.3390/galaxies6040106
Submission received: 8 August 2018
/
Revised: 25 September 2018
/
Accepted: 26 September 2018
/
Published: 3 October 2018
(This article belongs to the Special Issue Observations and Theory of Short GRBs at the Dawn of the Gravitational Wave Era)
Abstract
:We investigated the spectral properties of the prompt emission for short- and long-duration gamma-ray bursts (GRBs) using the Fermi Gamma-ray Burst Monitor data. In particular, we focused on comparing the spectral properties of short GRBs and the initial 2 s of long GRBs, motivated by the previous study of Ghirlanda et al. (2009). We confirmed the similarity in the low energy photon index between short GRBs and the initial 2 s of long GRBs. Since about a quarter of our spectra of both short GRBs and the initial 2 s of long GRBs show to be shallower than , it is difficult to understand in the context standard synchrotron emission.
1. Introduction
The origin of short-duration gamma-ray bursts (hereafter short GRBs) is receiving great attention in the field of astrophysics. During the second Laser Interferometer Gravitational wave Observatory and Virgo observation run in 2017, the first gravitational wave event from the merging neutron stars, GW 170817, was observed [1]. The Fermi Gamma-ray Space Telescope (Fermi) Gamma-ray Burst Monitor (GBM) and the Anti-Coincidence Shield (ACS) of the SPI spectrometer on board the INTernational Gamma-ray Astrophysics Laboratory (INTEGRAL) detected a possible short GRB 170817A about 1.7 s after the merger time [2]. GRB 170817A has the duration of s and the total radiation energy was 3–4 orders of magnitude lower than that of the typical short GRBs [3]. The origin of the weakness of GRB 170817A is still unclear. However, the recent X-ray e.g., [4,5] and radio e.g., [6] observations at the late phase suggest that the weak emission is consistent with an off-axis viewing effect (a weakened relativistic beaming effect; [7,8]) of a typical short GRB jet.
One of the well-known properties of short GRBs is the hardness of their spectra in the prompt emission. A short GRB tends to have a harder spectrum than a long duration GRB (hereafter long GRB) e.g., [9]. Ghirlanda et al. [10] show that the hardness of short GRBs is driven by a shallower (harder) low energy photon index compared to that of long GRBs rather than the peak energy in the F spectrum by the Compton Gamma-ray Observatory Burst And Transient Source Experiment (BATSE) sample. Further investigation with the much larger GRB sample confirmed this spectral difference between short GRBs and long GRBs [11]. Ghirlanda et al. [11] also pointed out that a spectrum of the initial part (the first 1–2 s of the emission) of a long GRB shows a similarity to a short GRB. Both and of short GRBs and the initial part of long GRBs have statistically similar distributions. This result indicates that a similar radiation process is involved between short and long GRBs.
The spectral evolution between long GRBs and short GRBs shows a similar behavior. Hakkila & Preece [12] resolved individual pulses during the prompt emission, and demonstrated the similarities of the pulse characteristics between long GRBs and short GRBs. They also suggested that the general spectral evolution seen over the burst episode can be understood by the hard-to-soft evolution of the individual pulse. According to Ghirlanda et al. [13], of time-resolved spectra of both long and short GRBs shows a positive correlation to the peak fluxes (or luminosity). Those previous works shed light on the similarity in the radiation process between long and short GRBs despite the different progenitors.
In this paper, we report the comparison of the spectral properties of a prompt emission between short and long GRBs by Fermi GBM data. The Fermi GBM possesses a large GRB sample with a good spectral coverage to derive the spectral parameters of a prompt emission for both short and long GRBs. It is worth investigating the similarity in the spectral properties between short and long GRBs reported by the BATSE sample using data of a different GRB instrument. In Section 2, we describe the investigation of a possible systematic error in the Fermi GBM data, the analysis method and the sample selection. We report the result of the comparisons of the prompt spectral parameters among short GRBs, long GRBs and the initial 2 s of long GRBs in Section 3. We discuss and summarize our results in Section 4. The quoted errors are at the 90% confidence level.
2. Analysis
The HEASOFT version 6.21 and the Fermi Science tool version v10r0p5 are used throughout the analysis. The spectrum of the Neil Gehrels Swift Observatory [14] Burst Alert Telescope [15] data is generated following the BAT analysis thread.1 The spectrum of Fermi GBM data is extracted from the Time-Tagged Event (TTE) data [16] using gtbin. The background spectrum is selected as a pre-burst interval in a duration that is 3–5-times longer than a source time interval depending on the stability of the background. The energy range of the spectral analysis is 15–150 keV for the Swift/BAT data. The energy range to be used in the spectral analysis of the Fermi GBM data is investigated in the following section. The energy response function of Fermi GRB is downloaded from the GBM triggered data archive2 for each GRB. The XSPEC version 12.9.1 software package was used for fitting the spectral data.
2.1. Identifying the Spectral Energy Range of the Fermi GBM Data
First, we investigate the energy range of the spectral data of the Fermi GBM by performing the joint spectral fit to the simultaneously detected bright GRBs with the Swift BAT. The Swift BAT has regularly performed the spectral calibration, collecting the Crab nebula data at the specific incident angles [17,18,19]. Furthermore, the spectral cross-calibration has been performed with the Konus–Wind and the Suzaku/WAM using the simultaneously detected bright GRBs [20]. Therefore, the systematic errors in the energy response function of the Swift BAT are well understood.
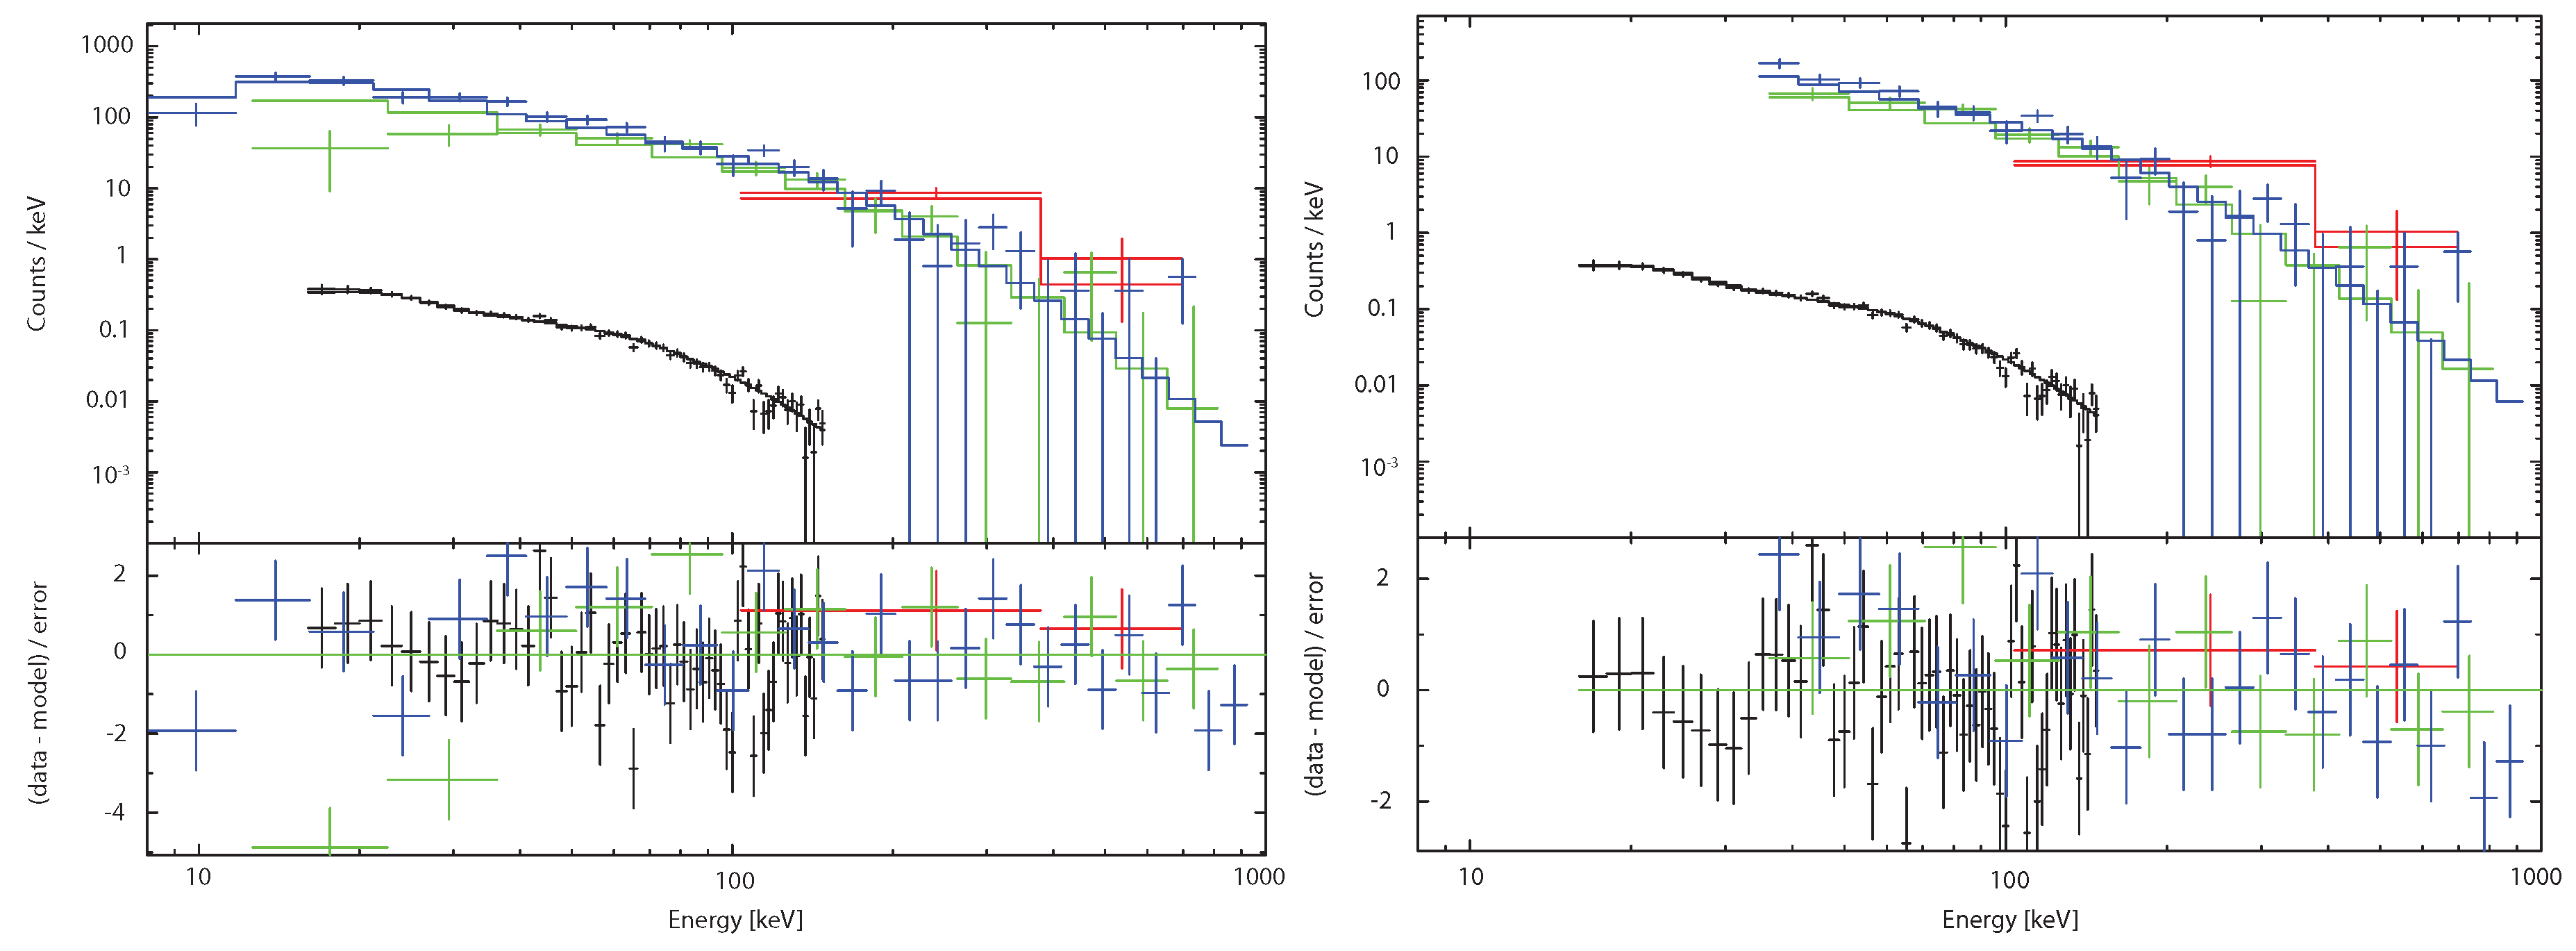
The joint spectral analyses of 37 simultaneously detected GRBs by the Fermi GBM and the Swift BAT were conducted. We used the standard energy range between 7 keV and 1 MeV for the Fermi GBM NaI instrument and between 150 keV and 40 MeV for the BGO instrument. Figure 1 shows an example of GRB 170705A. As can be seen in the left panel of Figure 1, there is a noticeable residual from the best fit model at the spectral bins between 7 keV and 30 keV in the Fermi GBM NaI data. The reduced of the fit is 1.561 in 102 degree of freedom. By ignoring the spectral bins below 30 keV in the Fermi GBM NaI data, the fit was significantly improved with the reduced of 1.067 in 81 degrees of freedom (right panel of Figure 1). We systematically investigated all 37 GRBs and confirmed that the reasonable joint fit was achieved using above 30 keV for the Fermi GBM NaI data. Therefore, based on this study, we decided to use the energy range between 30 keV and 1 MeV for the Fermi GBM NaI data. The standard energy range between 150 keV and 40 MeV is used for the Fermi GBM BGO data.
2.2. Preparation of the Data
We selected 60 short GRBs and 58 long GRBs detected by the Fermi GBM between 2008 and 2017. The selection criteria of long GRBs are that the peak photon flux in 64 ms reported in the Fermi GBM Burst Catalog [21,22,23] is >7.1 ph cm s and the derived spectral parameters are well constrained. We selected all short GRBs during this period with well constrained spectral parameters. The foreground spectral files are generated using gtbin specifying the interval for the time-averaged spectra of short and long GRBs. For the spectrum of the initial 2 s of long GRBs, we specified the 2 s window from the trigger time of the Fermi GBM. The background spectral files are generated using gtbin, specifying a pre-burst interval which is 3–5 times longer than a foreground interval. The data of two triggered NaI detectors and one BGO detector are used in the analysis. The data and the energy response files are downloaded from the Fermi GBM public data archive available through the Fermi Science Data Center.3 The spectral model used in the fit is a cutoff power-law (CPL) model:
where is the low energy photon index, is the peak energy in the F spectrum and is the normalization at 50 keV in units of photons cm s keV.
3. Results
Table 1, Table 2 and Table 3 summarize our GRB samples and derived spectral parameters based on a CPL model fit. Figure 2 shows the distribution of and between short GRBs and long GRBs (left panel), and the short GRBs and the initial 2 s of long GRBs (right panel). The distribution of for long GRBs tends to overlap at a steeper region (small ) of short GRBs, whereas distributes to a higher energy for short GRBs compared to that of long GRBs. On the other hand, the difference in becomes less evident between short GRBs and the initial 2 s of long GRBs.
Figure 3 shows a comparison of the histograms of between short GRBs and long GRBs (left panel), and short GRBs and the initial 2 s of long GRBs (right panel). The medians of are 240.5 keV, 479.7 keV and 278.6 keV for long GRBs, short GRBs and the initial 2 s of long GRBs, respectively. The Kolmogorov–Smirnov (K–S) test probabilities of between short GRBs and long GRBs, and short GRBs and the initial 2 s of long GRBs are and , respectively. Therefore, the K–S test shows that the distributions are drawn from a different population between short GRBs and long GRBs, as well as short GRBs and the initial 2 s of long GRBs.
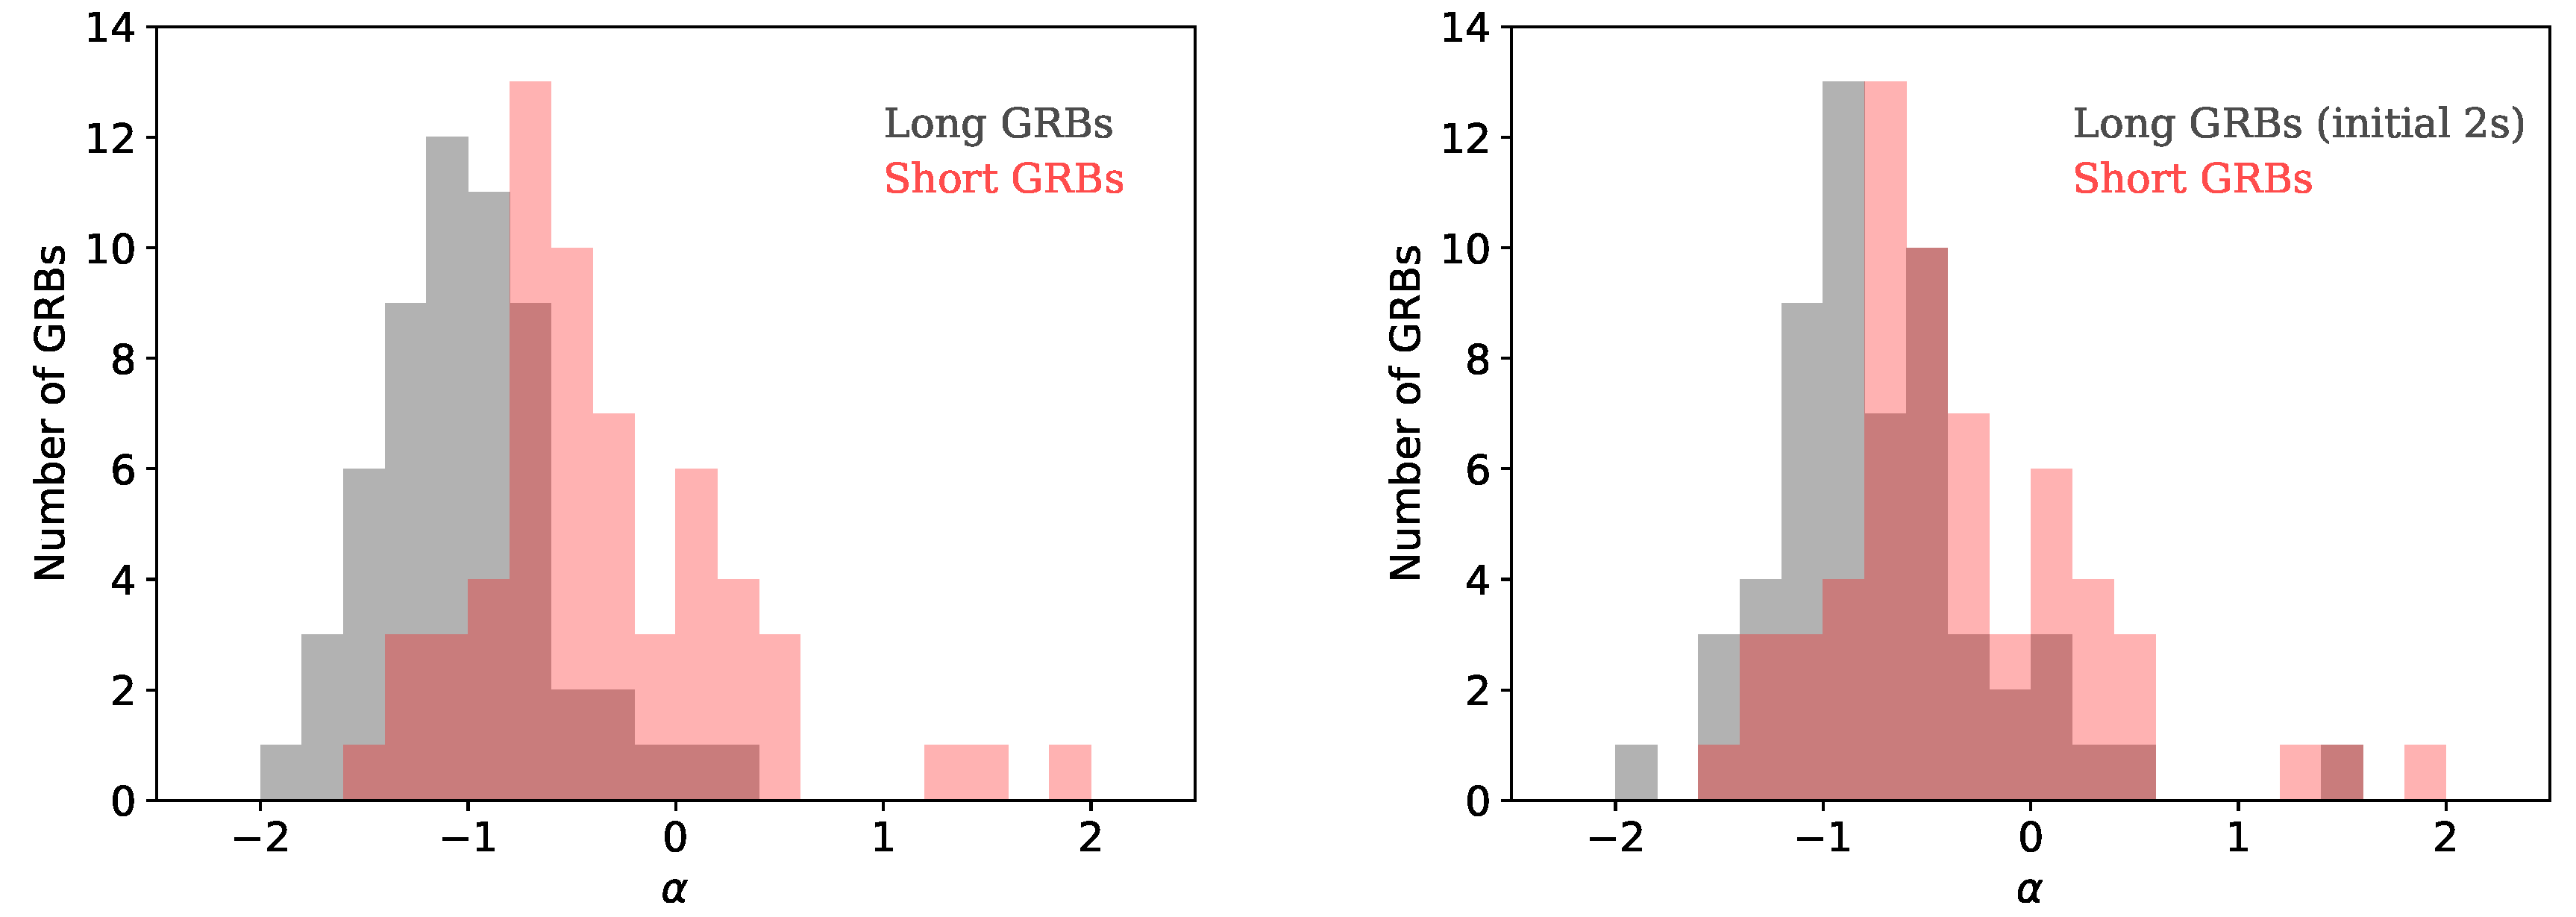
Figure 4 shows a comparison of the histograms of between short GRBs and long GRBs (left panel), and short GRBs and the initial 2 s of long GRBs (right panel). The medians of are , and for long GRBs, short GRBs and the initial 2 s of long GRBs, respectively. The median of of the initial 2 s of long GRBs becomes closer to the distribution of short GRBs. The K–S test probabilities of between short GRBs and long GRBs, and short GRBs and the initial 2 s of long GRBs are and , respectively. This statistical test shows that the distribution of short GRBs becomes closer to that of the initial 2 s of long GRBs.
In summary, the spectra of the initial 2 s of long GRBs show a flatter (harder) than those of the time-averaged spectra of long GRBs. The distribution of of the initial 2 s of long GRBs is closer to that of short GRBs. However, the distribution of of the initial 2 s of long GRBs is lower than that of short GRBs, and consistent with the distribution of long GRBs.
4. Discussion
Ghirlanda et al. [11] investigated the spectral properties of short and long GRBs using BATSE data. They found that short GRBs have a harder and a higher compared to those of long GRBs. Furthermore, they also found no difference in and between the initial 1–2 s of long GRB and short GRB spectra. Our independent analysis shows a systematically harder for the initial 2 s of long GRBs and their are closer to those of short GRBs. Although the distributions between short GRBs and the initial 2 s of long GRBs do not show a statistically significant similarity, the distribution of the initial 2 s of long GRBs shows a shift toward a high energy side (Figure 3). Our independent analysis based on the Fermi GBM data confirms the findings by Ghirlanda et al. [11].
The radiation process of a prompt GRB emission is described by synchrotron emission via fast cooling electrons. Therefore, there is a strong restriction on the allowed from to e.g., [24]. The limitation of a harder side of is . The previous study [25] showed that the spectra of 23% of the BATSE GRB samples violated the limit. According to our samples, about 9% of the time-averaged spectra of long GRBs violate the harder side of by taking into account the error on . On the other hand, 20% of short GRBs and 24% of the initial 2 s of long GRBs violate this limit. Since the similar fractions of the GRB spectra are violating the synchrotron limit for short GRBs and the initial 2 s of long GRBs, this might indicate that the similar radiation process, which is difficult to achieve by synchrotron emission, is involved in those spectra. Applying the K–S test to the distributions of the spectra violating and non-violating the synchrotron limit for short GRBs, the initial 2 s of the long GRBs and long GRBs, we find K–S test probabilities of , and , respectively.
The initial part of a prompt emission spectrum of long GRBs shows a peculiar characteristic in general. A spectral evolution of a prompt emission follows a hard-to-soft trend e.g., [26]. There is a well-known correlation between intensity and hardness during a burst [27]. However, according to Lu et al. [28], the flux and during a burst do not follow a positive correlation at the initial phase, mainly a rising part of the burst episode. Since a time-averaged spectrum of a long GRB is dominated by the emission from a peak to a tail part of a burst for a single pulse GRB, the distinct spectral characteristic which we see between long GRBs and the initial 2 s of long GRBs is related to the finding of Lu et al. [28]. A detailed study of the initial part of a GRB spectrum, especially the rising part of a GRB emission, will be important to understand the radiation processes of a prompt GRB emission.
Thanks to the gravitational wave detection accompany with a short GRB, the progenitor of a short GRB has been solved. Therefore, it becomes clear that the progenitors of long and short GRBs are different. Although long and short GRBs are originated to a different progenitor, our results suggest that the similar radiation process is involved between those two different classes of GRBs. We suggest that a similar kind of a relativistic jet needs to be launched in both long and short GRBs to explain the similarity in the spectral properties.
Author Contributions
Formal analysis, Y.Y.; Writing—original draft, T.S.; Writing — review and editing, M.S.
Funding
This research received no external funding.
Acknowledgments
We would like to thank the anonymous referees for comments and suggestions that materially improved the paper. This work is supported by MEXT KAKENHI Grant Numbers 17H06357 and 17H06362.
Conflicts of Interest
The authors declare no conflict of interest.
References
- Abbott, B.P.; Abbott, R.; Abbott, T.D.; Acernese, F.; Ackley, K.; Adams, C.; Adams, T.; Addesso, P.; Adhikari, R.X.; Adya, V.B.; et al. GW170817: Observation of Gravitational Waves from a Binary Neutron Star Inspiral. Phys. Rev. Lett. 2017, 119, 161101. [Google Scholar] [CrossRef] [PubMed] [Green Version]
- Abbott, B.P.; Abbott, R.; Adhikari, R.X.; Ananyeva, A.; Anderson, S.B.; Appert, S.; Arai, K.; Araya, M.C.; Barayoga, J.C.; Barish, B.C.; et al. Multi-messenger Observations of a Binary Neutron Star Merger. Astrophys. J. Lett. 2017, 848, 59. [Google Scholar] [CrossRef]
- Goldstein, A.; Veres, P.; Burns, E.; Briggs, M.S.; Hamburg, R.; Kocevski, D.; Wilson-Hodge, C.A.; Preece, R.D.; Poolakkil, S.; Roberts, O.J.; et al. An Ordinary Short Gamma-ray Burst with Extraordinary Implications: Fermi GBM Detection of GRB 170817A. Astrophys. J. Lett. 2017, 848, 14. [Google Scholar] [CrossRef]
- Troja, E.; Piro, L.; Van Eerten, H.; Wollaeger, R.T.; Im, M.; Fox, O.D.; Butler, N.R.; Cenko, S.B.; Sakamoto, T.; Fryer, C.L.; et al. The X-ray Counterpart to the Gravitational-wave Event GW170817. Nature 2017, 551, 71–74. [Google Scholar] [CrossRef]
- Troja, E.; Piro, L.; Ryan, G.; van Eerten, H.; Ricci, R.; Wieringa, M.H.; Lotti, S.; Sakamoto, T.; Cenko, S.B. The Outflow Structure of GW170817 from Late-time Broad-band Observations. Mon. Not. R. Astron. Soc. Lett. 2018, 478, L18–L23. [Google Scholar] [CrossRef]
- Mooley, K.P.; Nakar, E.; Hotokezaka, K.; Hallinan, G.; Corsi, A.; Frail, D.A.; Horesh, A.; Murphy, T.; Lenc, E.; Kaplan, D.L.; et al. A Mildly Relativistic Wide-angle Outflow in the Neutron-star Merger Event GW170817. Nature 2018, 554, 207–210. [Google Scholar] [CrossRef] [PubMed]
- Yamazaki, R.; Ioka, K.; Nakamura, T. X-ray Flashes from Off-Axis Gamma-ray Bursts. Astrophys. J. Lett. 2002, 571, L31–L35. [Google Scholar] [CrossRef]
- Zhang, B.; Dai, X.; Lloyd-Ronning, N.M.; Mészáros, P. Quasi-universal Gaussian Jets: A Unified Picture for Gamma-ray Bursts and X-ray Flashes. Astrophys. J. Lett. 2004, 601, L119–L122. [Google Scholar] [CrossRef]
- Kouveliotou, C.; Meegan, C.A.; Fishman, G.J.; Bhat, N.P.; Briggs, M.S.; Koshut, T.M.; Paciesas, W.S.; Pendleton, G.N. Identification of two classes of gamma-ray bursts. Astrophys. J. 1993, 413, L101–L104. [Google Scholar] [CrossRef]
- Ghirlanda, G.; Ghisellini, G.; Celotti, A. The spectra of short Gamma-ray Bursts. Astron. Astrophys. 2004, 422, L55–L58. [Google Scholar] [CrossRef]
- Ghirlanda, G.; Nava, L.; Ghisellini, G.; Celotti, A.; Firmani, C. Short versus Long gamma-ray bursts: Spectra, energetics, and luminosities. Astron. Astrophys. 2009, 496, 585–595. [Google Scholar] [CrossRef]
- Hakkila, J.; Preece, R.D. Unification of Pulses in Long and Short Gamma-ray Bursts: Evidence from Pulse Properties and their Correlations. Astrophys. J. 2011, 740, 104. [Google Scholar] [CrossRef]
- Ghirlanda, G.; Ghisellini, G.; Nava, L. Short and Long Gamma-ray Bursts: Same Emission Mechanism? Mon. Not. R. Astron. Soc. Lett. 2011, 418, L109–L113. [Google Scholar] [CrossRef]
- Gehrels, N.; Chincarini, G.; Giommi, P.; Mason, K.O.; Nousek, J.A.; Wells, A.A.; White, N.E.; Barthelmy, S.D.; Burrows, D.N.; Cominsky, L.R.; et al. The Swift Gamma-ray Burst Mission. Astrophys. J. 2004, 611, 1005–1020. [Google Scholar] [CrossRef]
- Barthelmy, S.D.; Barbier, L.M.; Cummings, J.R.; Fenimore, E.E.; Gehrels, N.; Hullinger, D.; Krimm, H.A.; Markwardt, C.B.; Palmer, D.M.; Parsons, A.; et al. The Burst Alert Telescope (BAT) on the SWIFT MIDEX Mission. Space Sci. Rev. 2005, 120, 143–164. [Google Scholar] [CrossRef]
- Meegan, C.; Lichti, G.; Bhat, P.N.; Bissaldi, E.; Briggs, M.S.; Connaughton, V.; Diehl, R.; Fishman, G.; Greiner, J.; Hoover, A.S.; et al. The Fermi Gamma-ray Burst Monitor. Astrophys. J. 2009, 702, 791–804. [Google Scholar] [CrossRef]
- Lien, A.; Sakamoto, T.; Barthelmy, S.D.; Baumgartner, W.H.; Cannizzo, J.K.; Chen, K.; Collins, N.R.; Cummings, J.R.; Gehrels, N.; Krimm, H.A.; et al. The Third Swift Burst Alert Telescope Gamma-ray Burst Catalog. Astrophys. J. 2016, 829, 47. [Google Scholar] [CrossRef]
- Sakamoto, T.; Barthelmy, S.D.; Barbier, L.; Cummings, J.R.; Fenimore, E.E.; Gehrels, N.; Hullinger, D.; Krimm, H.A.; Markwardt, C.B.; Palmer, D.M.; et al. The First Swift BAT Gamma-ray Burst Catalog. Astrophys. J. Suppl. Ser. 2008, 175, 179–190. [Google Scholar] [CrossRef]
- Sakamoto, T.; Barthelmy, S.D.; Baumgartner, W.H.; Cummings, J.R.; Fenimore, E.E.; Gehrels, N.; Krimm, H.A.; Markwardt, C.B.; Palmer, D.M.; Parsons, A.M.; et al. The Second Swift Burst Alert Telescope Gamma-ray Burst Catalog. Astrophys. J. Suppl. Ser. 2011, 195, 27. [Google Scholar] [CrossRef]
- Sakamoto, T.; Pal’Shin, V.; Yamaoka, K.; Ohno, M.; Sato, G.; Aptekar, R.; Barthelmy, S.D.; Baumgartner, W.H.; Cummings, J.R.; Fenimore, E.E.; et al. Spectral Cross-Calibration of the Konus–Wind, the Suzaku/WAM, and the Swift/BAT Data Using Gamma-ray Bursts. Publ. Astron. Soc. Jpn. 2011, 63, 215–277. [Google Scholar] [CrossRef]
- Gruber, D.; Goldstein, A.; von Ahlefeld, V.W.; Bhat, P.N.; Bissaldi, E.; Briggs, M.S.; Byrne, D.; Cleveland, W.H.; Connaughton, V.; Diehl, R.; et al. The Fermi GBM Gamma-ray Burst Spectral Catalog: Four Years of Data. Astrophys. J. Suppl. Ser. 2014, 211, 27. [Google Scholar] [CrossRef]
- Von Kienlin, A.; Meegan, C.A.; Paciesas, W.S.; Bhat, P.N.; Bissaldi, E.; Briggs, M.S.; Burgess, J.M.; Byrne, D.; Chaplin, V.; Cleveland, W.; et al. The Second Fermi GBM Gamma-ray Burst Catalog: The First Four Years. Astrophys. J. Suppl. Ser. 2014, 211, 13. [Google Scholar] [CrossRef]
- Bhat, P.N.; Meegan, C.A.; von Kienlin, A.; Paciesas, W.S.; Briggs, M.S.; Burgess, J.M.; Burns, E.; Chaplin, V.; Cleveland, W.H.; Collazzi, A.C.; et al. The Third Fermi GBM Gamma-ray Burst Catalog: The First Six Years. Astrophys. J. Suppl. Ser. 2016, 223, 18. [Google Scholar] [CrossRef]
- Sari, R.; Piran, T.; Narayan, R. Spectra and Light curves of Gamma-ray Bursts Afterglows. Astrophys. J. Lett. 1998, 497, L17–L20. [Google Scholar] [CrossRef]
- Preece, R.D.; Briggs, M.S.; Mallozzi, R.S.; Pendleton, G.N.; Paciesas, W.S.; Band, D.L. The Synchrotron Shock Model Confronts a “Line of Death” in the BATSE Gamma-ray Burst Data. Astrophys. J. Lett. 1998, 506, L23–L26. [Google Scholar] [CrossRef]
- Norris, J.P.; Share, G.H.; Messina, D.C.; Dennis, B.R.; Desai, U.D.; Cline, T.L.; Matz, S.M.; Chupp, E.L. Spectral Evolution of Pulse Structures in Gamma-ray Burst. Astrophys. J. 1986, 301, 213–219. [Google Scholar] [CrossRef]
- Golenetskii, S.V.; Mazets, E.P.; Aptekar, R.L.; Ilinskii, V.N. Correlation between Luminosity and Temperature in Gamma-ray Burst Sources. Nature 1983, 306, 451–453. [Google Scholar] [CrossRef]
- Lu, R.J.; Hou, S.J.; Liang, E.W. The Epeak-Flux Correlation in the Rising and Decaying Phases of Gamma-ray Burst Pulses: Evidence for Viewing Angle Effect? Astrophys. J. 2010, 720, 1146–1154. [Google Scholar] [CrossRef]
| 1. | |
| 2. | |
| 3. |
Figure 1.
Joint spectral analysis of the Swift BAT (black) and the Fermi GBM NaI (green and blue) and BGO (red) for GRB 170705A (left: using the Fermi GBM NaI data from 7 keV to 1 MeV; right: using the Fermi GBM NaI data from 30 keV to 1 MeV).
Figure 1.
Joint spectral analysis of the Swift BAT (black) and the Fermi GBM NaI (green and blue) and BGO (red) for GRB 170705A (left: using the Fermi GBM NaI data from 7 keV to 1 MeV; right: using the Fermi GBM NaI data from 30 keV to 1 MeV).

Figure 2.
Distribution of versus between long GRBs and short GRBs (left), and the initial 2 s of long GRBs and short GRBs (right).
Figure 2.
Distribution of versus between long GRBs and short GRBs (left), and the initial 2 s of long GRBs and short GRBs (right).

Figure 3.
Histograms of between short GRBs and long GRBs (left), and short GRBs and the initial 2 s of long GRBs (right).
Figure 3.
Histograms of between short GRBs and long GRBs (left), and short GRBs and the initial 2 s of long GRBs (right).

Figure 4.
Histograms of between short GRBs and long GRBs (left), and short GRBs and the initial 2 s of long GRBs (right).
Figure 4.
Histograms of between short GRBs and long GRBs (left), and short GRBs and the initial 2 s of long GRBs (right).


Table 1.
Spectral parameters of short GRBs.
| GRB | [keV] | |
|---|---|---|
| GRB081209981 | ||
| GRB081216531 | ||
| GRB081223419 | ||
| GRB081226509 | ||
| GRB090228204 | ||
| GRB090305052 | ||
| GRB090308734 | ||
| GRB090617208 | ||
| GRB090907808 | ||
| GRB091126333 | ||
| GRB100206563 | ||
| GRB100525744 | ||
| GRB100625773 | ||
| GRB100629801 | ||
| GRB100811108 | ||
| GRB101031625 | ||
| GRB101216721 | ||
| GRB110526715 | ||
| GRB110705151 | ||
| GRB111103948 | ||
| GRB111222619 | ||
| GRB120323507 | ||
| GRB120603439 | ||
| GRB120811014 | ||
| GRB120817168 | ||
| GRB120830297 | ||
| GRB121012724 | ||
| GRB130204484 | ||
| GRB130307126 | ||
| GRB130628860 | ||
| GRB130701761 | ||
| GRB130912358 | ||
| GRB131126163 | ||
| GRB131217108 | ||
| GRB140105065 | ||
| GRB140209313 | ||
| GRB140511095 | ||
| GRB140605377 | ||
| GRB140626843 | ||
| GRB140807500 | ||
| GRB140901821 | ||
| GRB141011282 | ||
| GRB141105406 | ||
| GRB150118927 | ||
| GRB150506630 | ||
| GRB150604434 | ||
| GRB150811849 | ||
| GRB150819440 | ||
| GRB151231568 | ||
| GRB160406503 | ||
| GRB160804180 | ||
| GRB160806584 | ||
| GRB160820496 | ||
| GRB160821937 | ||
| GRB160822672 | ||
| GRB170121133 | ||
| GRB170127634 | ||
| GRB170206453 | ||
| GRB170305256 | ||
| GRB170325331 |
Table 2.
Spectral parameters of long GRBs.
| GRB | [keV] | |
|---|---|---|
| GRB081009140 | ||
| GRB081215784 | ||
| GRB090424592 | ||
| GRB090719063 | ||
| GRB090804940 | ||
| GRB091127976 | ||
| GRB100131730 | ||
| GRB100324172 | ||
| GRB100722096 | ||
| GRB100829876 | ||
| GRB100910818 | ||
| GRB101208498 | ||
| GRB110817191 | ||
| GRB110921912 | ||
| GRB111220486 | ||
| GRB120129580 | ||
| GRB120204054 | ||
| GRB120217904 | ||
| GRB120328268 | ||
| GRB120426090 | ||
| GRB120728434 | ||
| GRB120801920 | ||
| GRB130121835 | ||
| GRB130228212 | ||
| GRB130306991 | ||
| GRB130425327 | ||
| GRB130502327 | ||
| GRB130815660 | ||
| GRB130821674 | ||
| GRB131108862 | ||
| GRB131214705 | ||
| GRB131229277 | ||
| GRB140213807 | ||
| GRB140523129 | ||
| GRB140621827 | ||
| GRB140801792 | ||
| GRB141222298 | ||
| GRB150330828 | ||
| GRB150403913 | ||
| GRB150426594 | ||
| GRB151227072 | ||
| GRB151227218 | ||
| GRB151231443 | ||
| GRB160113398 | ||
| GRB160516237 | ||
| GRB160521385 | ||
| GRB160724444 | ||
| GRB16080225 | ||
| GRB160816730 | ||
| GRB160910722 | ||
| GRB161218356 | ||
| GRB170207906 | ||
| GRB170511249 | ||
| GRB170522657 | ||
| GRB170626401 | ||
| GRB170802638 | ||
| GRB170826819 | ||
| GRB171120556 | ||
| GRB180120207 |
Table 3.
Spectral parameters of the initial 2 s of long GRBs.
| GRB | [keV] | |
|---|---|---|
| GRB081009140 | ||
| GRB081215784 | ||
| GRB090424592 | ||
| GRB090719063 | ||
| GRB090804940 | ||
| GRB091127976 | ||
| GRB100131730 | ||
| GRB100324172 | ||
| GRB100722096 | ||
| GRB100829876 | ||
| GRB100910818 | ||
| GRB101208498 | ||
| GRB110817191 | ||
| GRB110921912 | ||
| GRB111220486 | ||
| GRB120129580 | ||
| GRB120204054 | ||
| GRB120217904 | ||
| GRB120328268 | ||
| GRB120426090 | ||
| GRB120728434 | ||
| GRB120801920 | ||
| GRB130121835 | ||
| GRB130228212 | ||
| GRB130306991 | ||
| GRB130425327 | ||
| GRB130502327 | ||
| GRB130815660 | ||
| GRB130821674 | ||
| GRB131108862 | ||
| GRB131214705 | ||
| GRB131229277 | ||
| GRB140213807 | ||
| GRB140523129 | ||
| GRB140621827 | ||
| GRB140801792 | ||
| GRB141222298 | ||
| GRB150330828 | ||
| GRB150403913 | ||
| GRB150426594 | ||
| GRB151227072 | ||
| GRB151227218 | ||
| GRB151231443 | ||
| GRB160113398 | ||
| GRB160516237 | ||
| GRB160521385 | ||
| GRB160724444 | ||
| GRB16080225 | ||
| GRB160816730 | ||
| GRB160910722 | ||
| GRB161218356 | ||
| GRB170207906 | ||
| GRB170511249 | ||
| GRB170522657 | ||
| GRB170626401 | ||
| GRB170802638 | ||
| GRB170826819 | ||
| GRB171120556 | ||
| GRB180120207 |
© 2018 by the authors. Licensee MDPI, Basel, Switzerland. This article is an open access article distributed under the terms and conditions of the Creative Commons Attribution (CC BY) license (http://creativecommons.org/licenses/by/4.0/).
Share and Cite
MDPI and ACS Style
Sakamoto, T.; Yoshida, Y.; Serino, M. Investigation of Similarity in the Spectra between Short- and Long-Duration Gamma-ray Bursts. Galaxies 2018, 6, 106. https://doi.org/10.3390/galaxies6040106
AMA Style
Sakamoto T, Yoshida Y, Serino M. Investigation of Similarity in the Spectra between Short- and Long-Duration Gamma-ray Bursts. Galaxies. 2018; 6(4):106. https://doi.org/10.3390/galaxies6040106
Chicago/Turabian StyleSakamoto, Takanori, Yuuki Yoshida, and Motoko Serino. 2018. "Investigation of Similarity in the Spectra between Short- and Long-Duration Gamma-ray Bursts" Galaxies 6, no. 4: 106. https://doi.org/10.3390/galaxies6040106
Note that from the first issue of 2016, this journal uses article numbers instead of page numbers. See further details here.