Centaurus A: Hard X-ray and High-Energy Gamma-Ray Light Curve Correlation


1
Department of Physics, University of Namibia, Private Bag 13301, Windhoek 12010, Namibia
2
Centre for Space Research, North-West University, Private Bag X6001, Potchefstroom 2520, South Africa
*
Author to whom correspondence should be addressed.
Galaxies 2019, 7(2), 44; https://doi.org/10.3390/galaxies7020044
Submission received: 26 February 2019
/
Revised: 25 March 2019
/
Accepted: 27 March 2019
/
Published: 4 April 2019
(This article belongs to the Special Issue Radio Galaxies at TeV Energies)
Abstract
:Centaurus A, powered by a 55 million solar mass supermassive black hole, has been intensively monitored in all accessible wavelength ranges of the electromagnetic spectrum. However, its very-high energy gamma () ray flux (TeV photons), obtained from H.E.S.S. is relatively faint, hampering detailed light curve analyses in the most energetic energy band. Yet, the extensive long-term light curve data from Fermi-LAT and Swift-BAT (hard X-rays) allows for cross-correlation studies. We find a hint that X-ray emission from Centaurus A precedes the rays by days. If this lag is real and related to a absorption effect in the broad-line region (BLR) around the central source, we can constrain the size of the BLR using light-travel time arguments. These are first results of extended light curve correlation studies between high-energy rays and X-rays from Centaurus A.
1. Introduction
Active galactic nuclei (AGN) are a type of galaxies hosting extremely luminous central regions that can outshine the entire galaxy. It is customarily accepted that these active central regions are powered by a super-massive black hole (SMBH). The SMBH accretes matter from its surroundings through an accretion disk around it. AGN are known to feature a relativistic outflow, in the form of jets, of charged particles traveling in a highly collimated flow that slams into the intergalactic matter forming large radio lobes at the ends.
AGN can be classified based on the observer’s viewing angle [1] with respect to the AGN jet orientation. Radio galaxies (RGs) belong to the type of AGN for which the jet viewing angle with respect to our line of sight is relatively large in contrast to blazars for which this angle is small. A well known radio galaxy is Centaurus A (Cen A), which is the source of interest in this study.
In general, radio-loud AGN feature a broadband (from radio to rays) emission spectrum which is primarily attributed to non-thermal radiation. Two distinct peaks can be seen in such a spectral energy distribution (SED) where the lower energy peak (extending from radio to X-rays) is traditionally accepted as being due to synchrotron emission from relativistic electrons in the jets. In leptonic models, the second hump (from X-rays to rays) in the SED is attributed to inverse-Compton upscattering of a soft target photon field by the same relativistic jet electron population.
Amongst the basic components of the structure of a typical AGN, are the fast-moving high-density clouds surrounding the central engine (but external to the jet) and located closer to the central SMBH than the optically obscuring dust torus. Due to the broad emission lines from this region, observed primarily in the optical and ultraviolet, these components are referred to as the broad line regions (BLRs) of the AGN (see [2] for a discussion on the possible origins of the BLR). The location of the BLR can be measured by the reverberation method employing the light travel time, the width of the emission line which in turn indicates the speed of the BLR clouds, and the observable temporal lag between the ionizing continuum radiation from the accretion disk and the line emission. The intense BLR radiation field is likely to be an efficient target photon field for -absorption of high-energy (HE; ) and / or very-high energy (VHE; ) -rays producing electron-positron () pairs [3,4].
In this work, we report results of the time-series study using the discrete cross-correlation of light curves as applied to Swift-BAT X-ray and Fermi-LAT -ray long-term observations of the nearest radio galaxy, Cen A.
2. Centaurus A
The massive elliptical galaxy NGC 5128 (discovered in 1826, and also known as Cen A), is the closest radio galaxy, at a distance of [5]. This source is centrally powered by a SMBH of mass (see e.g., [6,7]). The giant radio lobes of Cen A subtend on the sky due to its proximity to Earth. This Fanaroff-Riley Type I [8] radio galaxy has been observed from radio to VHE rays, and is an ideal target for studying radio lobes and relativistic outflows.
Long-term multi-wavelength observations of Cen A from various astronomical facilities lead to high-quality long-term light curves in several wavebands across the electromagnetic spectrum.
The Spectral Energy Distribution of Cen A
Numerous extensive studies have so far been carried out on Cen A, aiming at characterizing the SED of the source (see e.g., [5,9,10,11,12]). As is seen with other active galaxies, the SED of Cen A is dominated by non-thermal radiative output originating mainly from synchrotron and inverse-Compton emission mechanisms.
In [9], the broadband SED of Cen A is reported, ranging from radio to VHE -rays modeled with various theoretical emission processes. A break in the -ray spectrum of the source indicating a spectral upturn above has been established [10]. This break is not well modeled using a single leptonic synchrotron self-Compton model. Recent results, from joint observations by H.E.S.S. and Fermi-LAT [11], show that the VHE data points are consistently above the HE power-law extrapolation of the -ray spectrum measured below the break. There is clear evidence for a second spectral component in VHE rays in the SED.
In the so-called one-zone model, one considers a single emission region (say a relativistic blob traveling along the jet) producing rays by electron-induced upscattering of low energy photons through the inverse-Compton process. The target low energy photon populations can be internal or external to the jet system. The single-zone models generally fail to reproduce the VHE ray data of Cen A.
Also shown in [9,12], one can invoke a second emission zone with differing input parameters to account for the VHE data points. Such a two-zone leptonic scenario has been recently employed by the Fermi-LAT and H.E.S.S. collaborations to fully explain the entire -ray spectrum of Cen A [11].
Alternatively, the hadronic explanation of the HE peak uses energetic protons (interacting with low-energy photons) that produce -rays after photo-pion production that leads to pion and muon decay processes (or from proton-synchrotron radiation). These hadronic models will typically require an input of rather large power in the proton population (see e.g., [13]), reaching . The corresponding luminosity estimates are much lower, by even two or more orders of magnitude for leptonic models—this is essentially attributed to electrons radiating more efficiently.
A combination of leptonic and hadronic (leptohadronic) models has also been used in a successful reproduction of the HE tail of the SED of Cen A where the TeV component is considered as the emission from a relativistic proton population that interacts with the photons (photohadronic interaction) produced by the primary leptonic component [12].
Absorption
The photons that result from inverse-Compton scattering can again undergo interactions with soft photons from various photon fields producing electron-positron pairs. The target photon field can be external to the jet—in particular an intense photon population is provided by the BLR of an AGN. Other external regions with soft photons include the accretion disk, the dusty torus, the cosmic microwave background, and the extragalactic background light.
Due to the potentially large density of the BLR radiation field, it is possible that absorption by the BLR radiation field produces a discernible spectral signature. Indeed, absorption in the BLR of blazars has been considered by several authors, see e.g., [3,4,14], requiring that the -ray emission region must be located outside or at the outer edge of the BLR, as significant absorption by the BLR can be avoided by having the -ray emission region outside the BLR.
3. Multi-wavelength Observations
To study the long-term activity of Cen A, we obtained contemporaneous data spanning about years of hard X-rays and high-energy rays.
3.1. X-ray Data
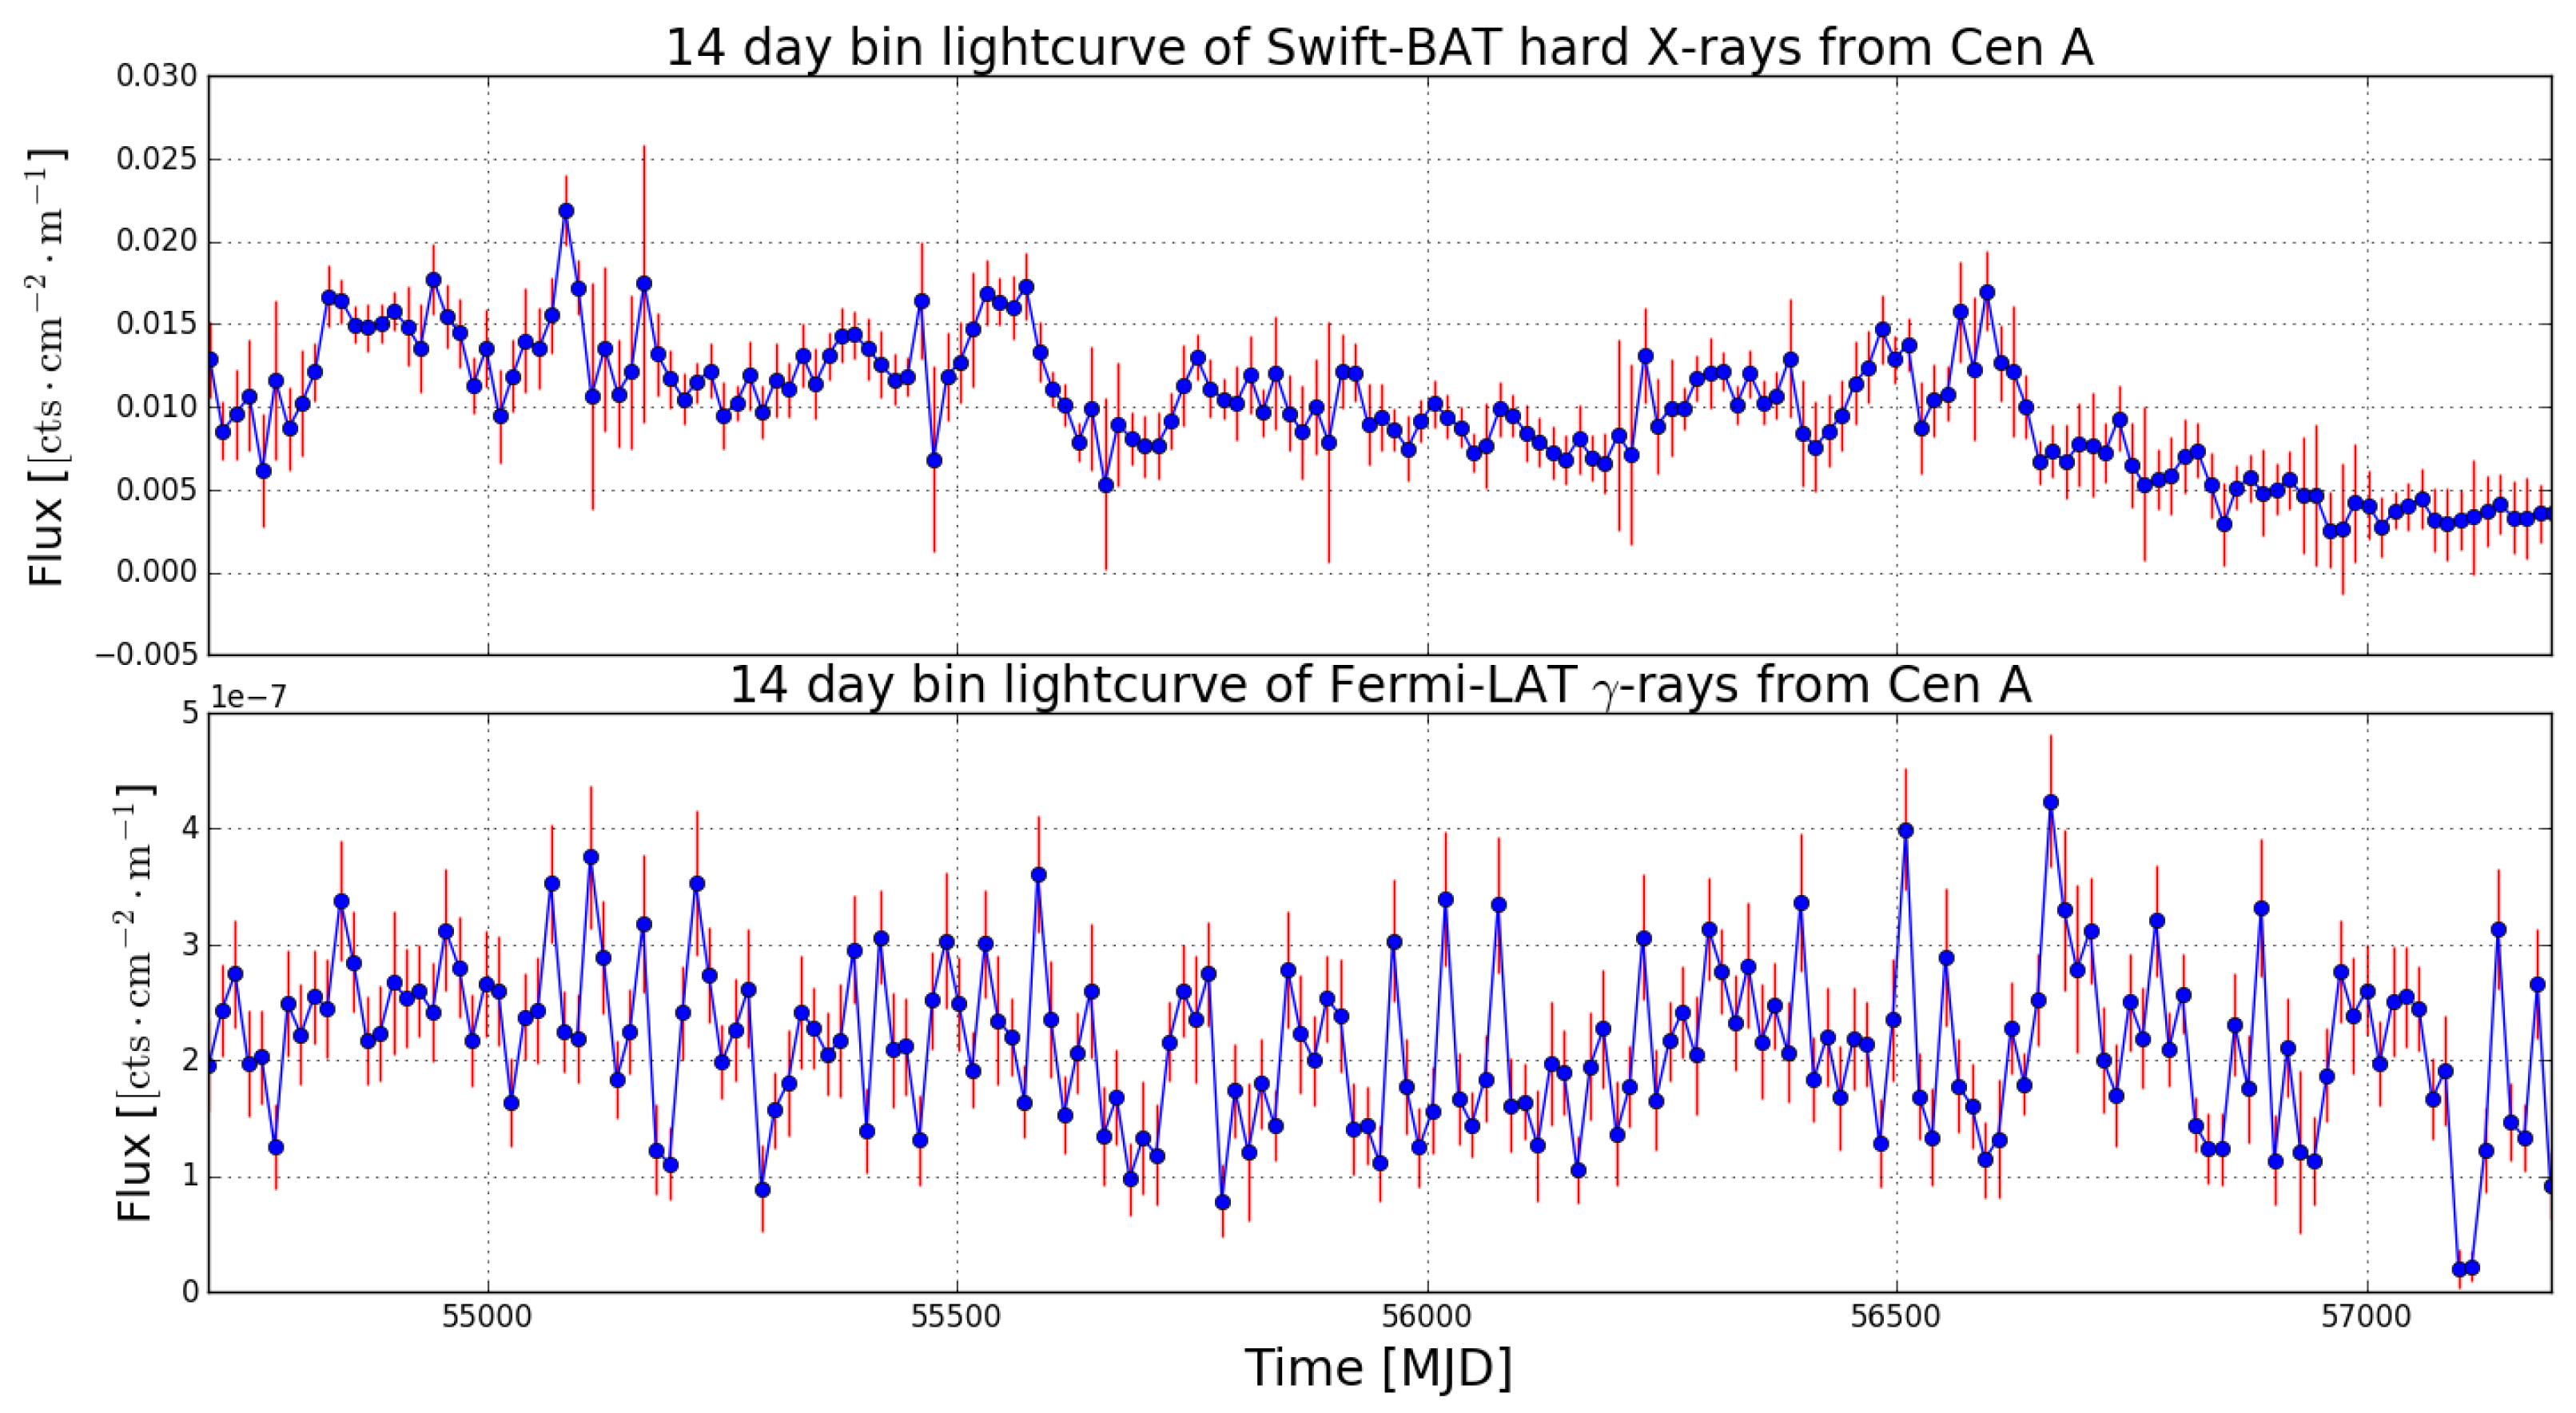
Hard X-ray data (15–150 keV) from the Burst Alert Telescope (BAT) [15] on board the Neil Gehrels Swift Observatory was used to obtain a -year span light curve. While primarily designed for gamma-ray burst (GRB) detection and rapid triggering, BAT is an efficient hard X-ray monitor instrument [16,17]. These data are readily available from the BAT transient source online repository1, and have been used herein to produce the light curve binned in 14 day bins in the period from MJD to MJD (i.e., between 8 August 2008 and 22 June 2015). The starting date of this time window is set by the mission operation date of the Fermi-LAT, and the ending date by the time of analyses in the year 2015.
3.2. HE Gamma-ray Data
High-energy -ray () observations of Cen A that were contemporaneous to the Swift-BAT data, from the Large Area Telescope (LAT), the primary instrument on board the Fermi gamma-ray Space Telescope (Fermi) [18], were used to extract the -ray light curve. We employed the publicly available event reconstruction tool (Fermi-LAT Pass 8 event-level analysis) [19], which has been optimized for point-like sources after a comprehensive review of -ray event analysis. Released in 2015, Pass 8 is considered to be the event reconstruction and analysis realizing the full scientific potential of the instrument by increasing the effective area, improving the point spread function, and widening the energy range to which LAT is sensitive. We performed unbinned likelihood analysis (a maximum likelihood optimization technique) as described in the LAT Cicerone (see [20]) to obtain the light curve in the energy range to 500 GeV within a region of interest centered at the position of Cen A. The LAT science tools include all Pass 8 background models, such as the galactic diffuse emission and the extragalactic isotropic diffuse emission models.
Figure 1 shows the X-ray and -ray light curves produced as described above. The light curves span years of observations, sampled in 14 day bins.
4. Time-lag Analysis
4.1. The Discrete Correlation Function
We now test for the presence of a correlation (or absence thereof) between the two observed time varying signals from Cen A. For this purpose, we employ the discrete correlation function (DCF) analysis developed by [21]. One of the advantages of the DCF is that it does not interpolate data and can also handle sparse and / or unevenly sampled light curves.
Suppose we have recorded two time series of time-dependent data and (these can be in the form of astronomical fluxes), then the mathematical description of the set of unbinned discrete correlations is
where and are observed flux pairs, such that the corresponding pairwise lag is . The averages of the series are denoted with and , while and represent their variances. The errors in these measurements are denoted by and . DCF values were computed for pairwise time-lags (M pairs in total) where each time-lag is given by . The DCF that we make use of here was then obtained through binning in time and averaging over all M pairs of for which to get
As can be seen in [21], the uncertainty in the DCF is obtained by
where the summation is over all series of unbinned discrete correlations obtained in Equation (1).
The algorithm employed progressively iterates through time-lags and computes a discrete correlation coefficient for each lag. This enables an evaluation of the correlation between the two time series as a function of difference in arrival time of the signals. The result can be interpreted as trailing or leading of the first input signal if the lag is positive or negative, respectively. The concept of auto-correlation is achieved if .
4.2. Monte Carlo Simulation of Light Curves
In order to quantify the statistical significance of the DCF computed, we used the observed light curve in each band to simulate, via a Monte Carlo approach, a set of 20,000 artificial light curves. To accomplish this, an algorithm proposed by [22] and later improved by [23], was used. A Python implementation of this approach is published by [24].
For each observed light curve (the HE -ray and X-ray curves), we used the algorithm by [24] to extract the underlying power spectral densities (PSDs) and probability density functions (PDFs). These PSDs and PDFs are then used to simulate light curves that resemble the observations. At first, to get a PSD, the algorithm derives the associated periodogram (the power as function of frequency) which is in-turn fitted with a normalized (by A) smoothly bending power-law (around and ) to which a constant c is added. Secondly, the PDF is obtained again from a best-fit (to its histogram) of a superposition of two distributions (a gamma-distribution and log-normal distribution ) whose contributions are weighted by . The latter weighing takes care of the partitioning of the mixing distributions towards the PDF. Table 1 shows the description and the numerical values of the above-mentioned parameters as used in this work.
In this way, we simulated two pairs of 20,000 light curves resembling the -ray and the X-rays, respectively. We then obtained correlation coefficients (using the [21] framework) by correlating each of the 20,000 simulated light curves against the observed light curve in the other band. The simulated light curves feature the same variability and statistical properties as the observed light curves. Using the Monte Carlo simulated light curves, we sorted the lag-wise correlation coefficients and determined the upper of these, which is used then to define the upper boundary of the 95% confidence level (CL). These limits derived from the contour boundaries of the CLs of the DCF process are used as a statistical significance check of the peak of the DCF distribution obtained.
4.3. DCF Computation Result
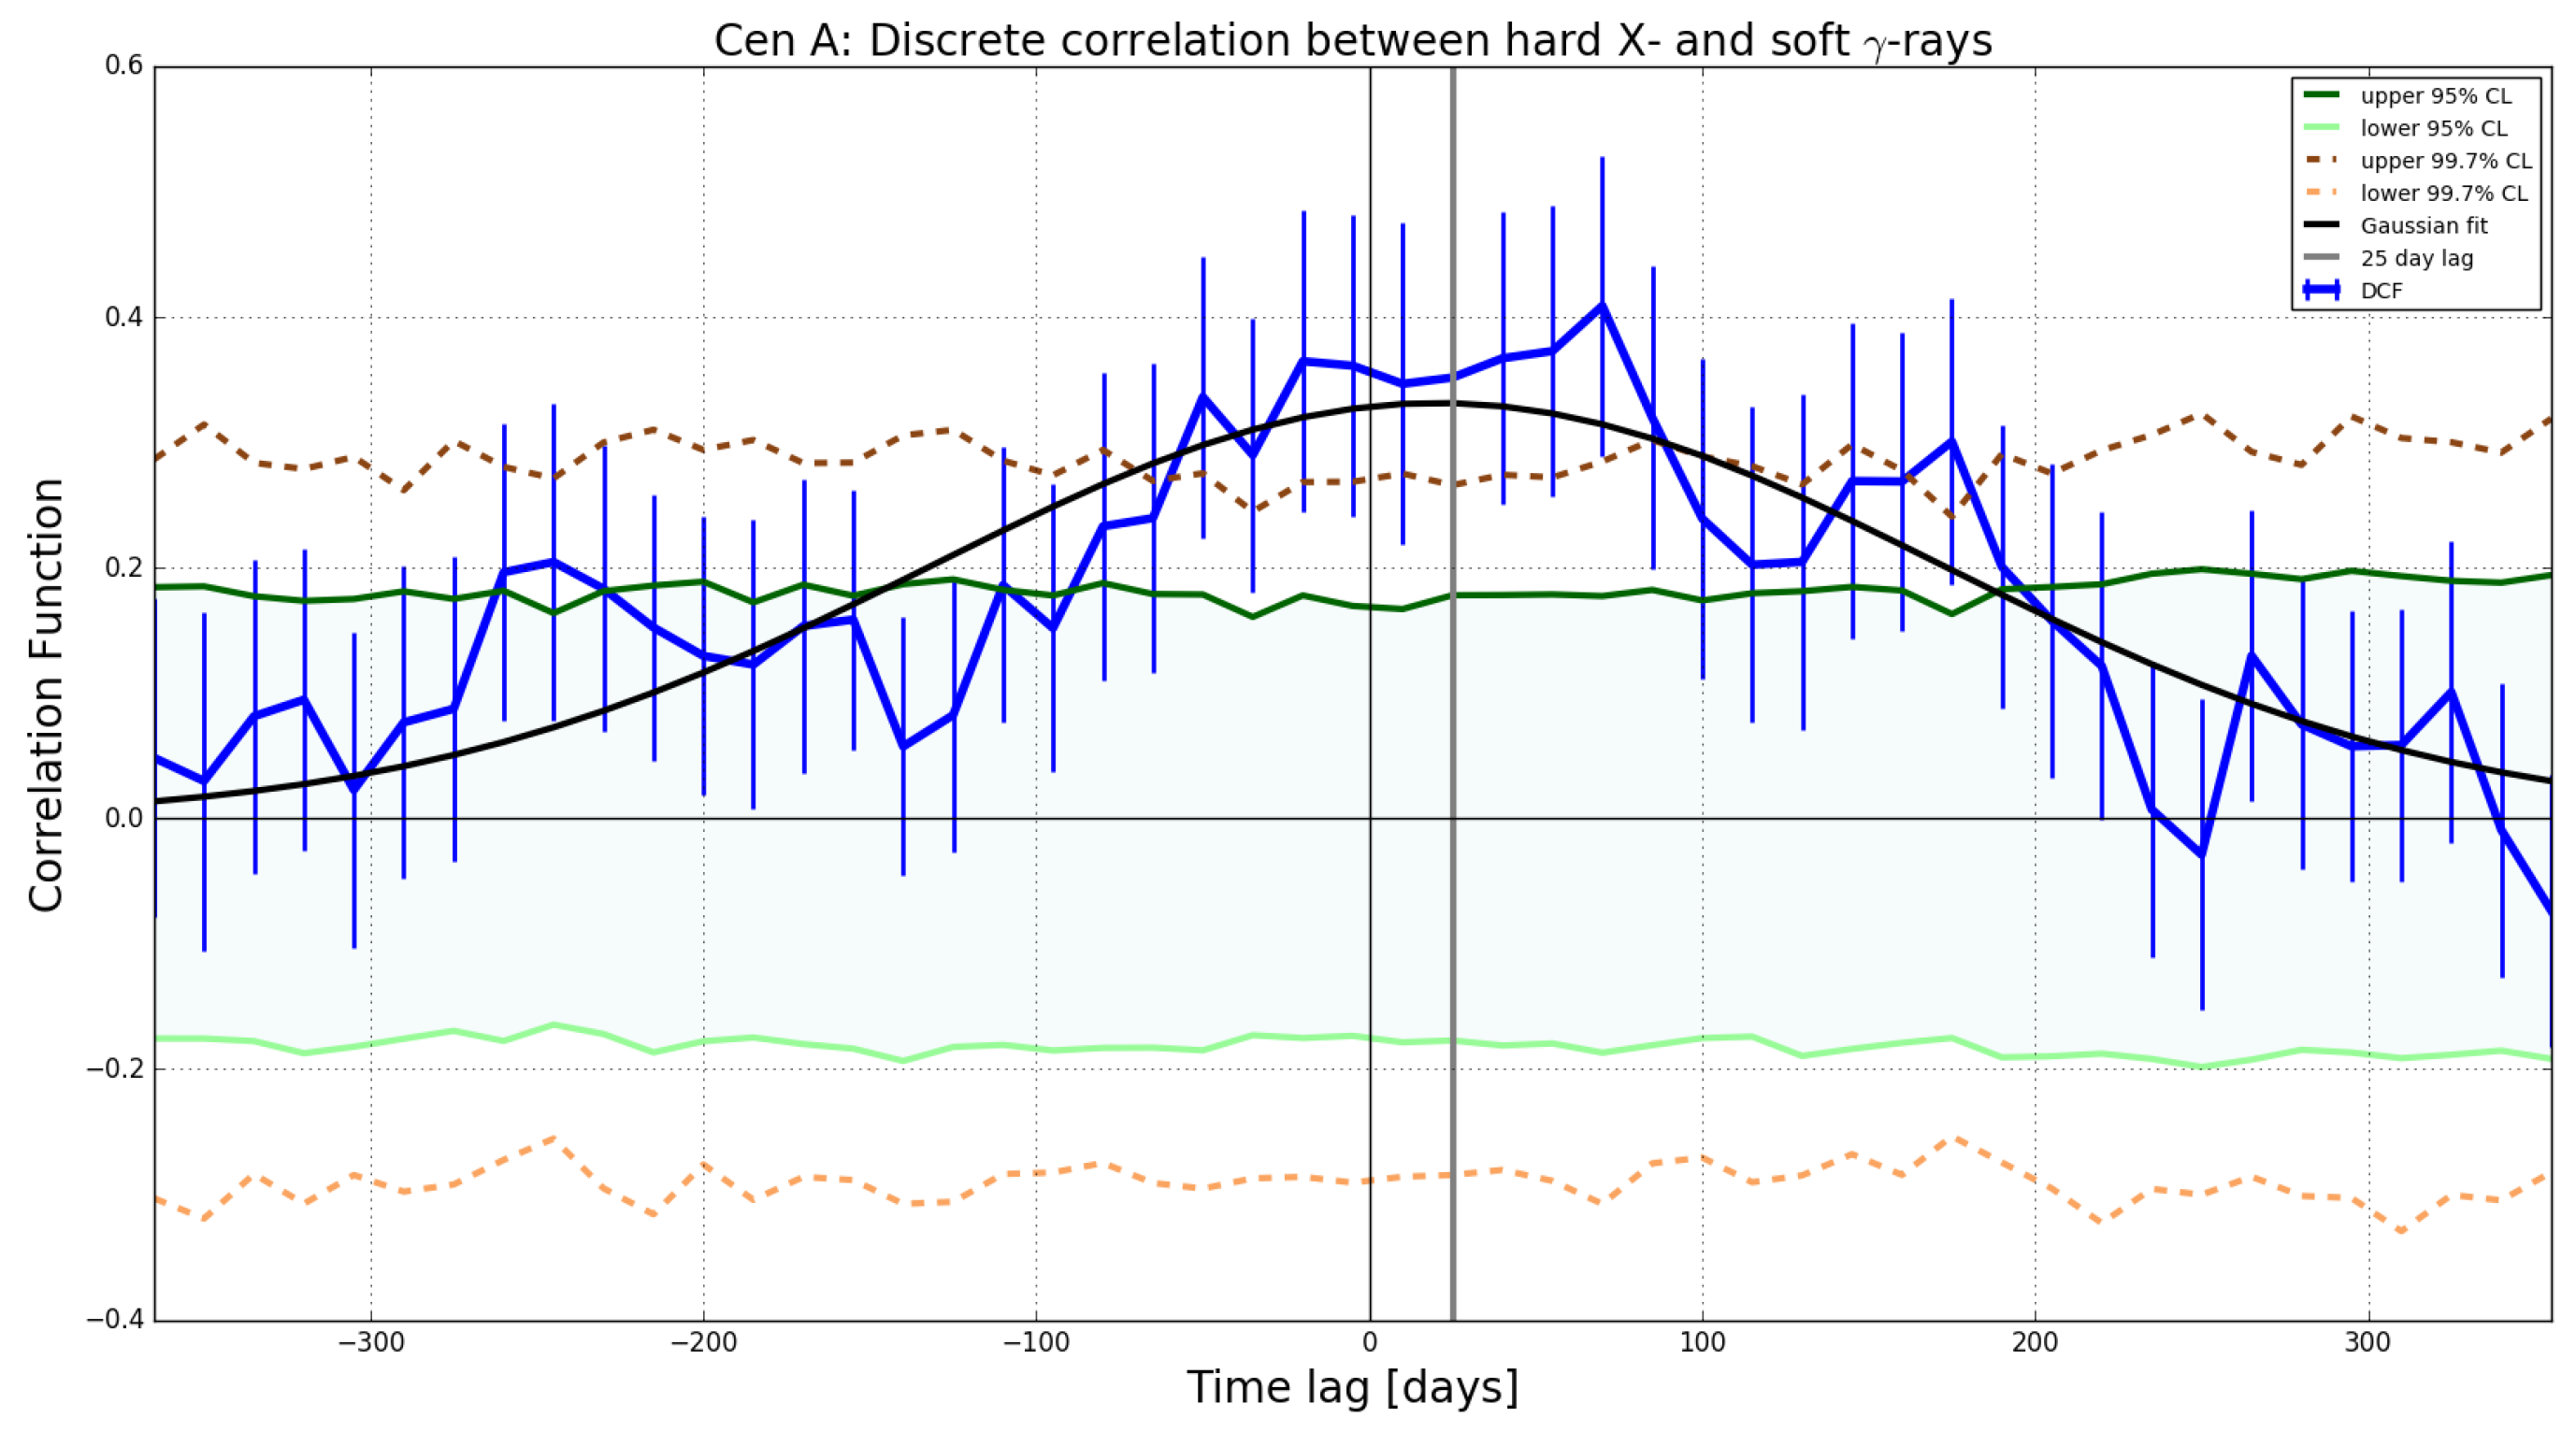
Figure 2 shows the discrete correlation function between hard X-rays and HE rays from Cen A. This is the correlation coefficient as a function of time-lag where the correlation was performed as described in Section 4.1. The shape of the peak in Figure 2 is approximately Gaussian for which the width is a measure of the uncertainty in the time lag. Overlaid on the correlation, is a band delimiting the confidence level (see Section 4.2) which is significantly surpassed by the peak of the correlation function. It can be noticed that the result hints to a scenario where the X-rays observed from the Swift-BAT instrument lead the Fermi-LAT -rays by days (see the peak of the Gaussian fit which has a standard deviation of 125 days). The correlation coefficient at the peak is . The result is established to have been significant above the 95% CL, but a correlation at a CL significance cannot be claimed due to the magnitude of the error bars.
5. Summary and Discussion
Cen A, the closest radio galaxy to Earth, has been observed in various wavelength bands across the electromagnetic spectrum over the years.
The light curve correlation between the years of HE gamma-ray and the X-ray data of Cen A considered here, resulted in a hint of a possible time-lag of about days of the gamma-ray emission behind the X-rays. The discrete correlation function (DCF) associated with this lag peaked at the value of . Although the time-lag is a mere hint (due to the very broad Gaussian width of the peak), the correlation is above the CL as obtained from the correlation studies done on the Monte Carlo simulated light curves.
In the event that further studies confirm a time-lag of this magnitude, then we can couple that to arguments of light-travel time, to set a constraint on the size of the BLR of the system. This is based on the argument that, while the emission region is within the BLR, X-rays produced by the relativistic particles escape immediately while rays are absorbed. The resulting lag () is then associated to the size of the BLR () through
This (25 light-day distance) would then indicate that the size of the BLR near the central engine is about parsec. In this estimate, we neglect relativistic beaming for a typical radio galaxy for which the jet is largely misaligned to our line of sight.
Estimates of of AGN have been set through a relationship with the observed luminosity of the accretion disk (see e.g., [25]) here written in the form of
where is the disk luminosity in units of . This relationship implies that AGN with luminosities in the range feature BLR of sizes in the range of 12 to 116 light-days. This is consistent with the hint from the current work of the BLR in Cen A to be about 25 light-days.
Author Contributions
The formal analysis and the orgininal draft preparation was carried out by I.D.D., while M.B. (Michael Backes) and M.B. (Markus Böttcher) contributed with validation, conceptualization, reviewing, editing and supervision. Furthermore, M.B. (Markus Böttcher) was pivotal in funding acquisition for the project.
Funding
This project is sponsored by the German Academic Exchange Service (DAAD) (German: Deutscher Akademischer Austauschdienst), the National Research Foundation2(NRF) and the Department of Science and Technology of the Republic of South Africa through the South African Research Chair Initiative under SARChI grant 64798, as well as the Department of Physics of the University of Namibia.
Conflicts of Interest
The authors declare no conflict of interest.
Abbreviations
The following abbreviations are used in this manuscript:
| BAT | Burst Alert Telescope (on-board Neil Gehrels Swift Observatory) |
| BLR | Broad line region |
| CL | Confidence level |
| DCF | Discrete correlation function |
| HE | High-energy (gamma-rays of energy ∼ 0.1–100 GeV) |
| H.E.S.S. | High-Energy Stereoscopic System |
| IACT | Imaging Atmospheric Cherenkov Telescope |
| LAT | Large Area Telescope (on-board Fermi satellite) |
| RG | Radio galaxy |
| SED | Spectral energy distribution |
| VHE | Very high-energy (gamma-rays of energy ) |
References
- Urry, C.M.; Padovani, P. Unified Schemes for Radio-Loud Active Galactic Nuclei. Publ. Astron. Soc. Pac. 1995, 107, 803. [Google Scholar] [CrossRef]
- Czerny, B.; Hryniewicz, K. The origin of the broad line region in active galactic nuclei. Astron. Astrophys. 2011, 525, L8. [Google Scholar] [CrossRef]
- Roustazadeh, P.; Boettcher, M. Compton and Synchrotron Emission from Pair Cascades in Radio Galaxies. AAS/High Energy Astrophys. Div. 2011, 12, 4.08. [Google Scholar]
- Böttcher, M.; Els, P. Gamma-Gamma Absorption in the Broad Line Region Radiation Fields of Gamma-ray Blazars. Astrophys. J. 2016, 821, 102–106. [Google Scholar] [CrossRef]
- Israel, F.P. Centaurus A - NGC 5128. Astron. Astrophys. Rev. 1998, 8, 237–278. [Google Scholar] [CrossRef]
- Marconi, A.; Pastorini, G.; Pacini, F.; Axon, D.J.; Capetti, A.; Macchetto, D.; Koekemoer, A.M.; Schreier, E.J. The supermassive black hole in Centaurus A: A benchmark for gas kinematical measurements. Astron. Astrophys. 2006, 448, 921–953. [Google Scholar] [CrossRef]
- Häring-Neumayer, N.; Cappellari, M.; Rix, H.-W.; Hartung, M.; Prieto, M.A.; Meisenheimer, K.; Lenzen, R. VLT Diffraction-limited Imaging and Spectroscopy in the NIR: Weighing the Black Hole in Centaurus A with NACO. Astrophys. J. 2006, 643, 226–237. [Google Scholar] [CrossRef]
- Fanaroff, B.L.; Riley, J.M. The morphology of extragalactic radio sources of high and low luminosity. Mon. Not. R. Astron. Soc. 1974, 167, 31P–36P. [Google Scholar] [CrossRef]
- Abdo, A.A.; Ackermann, M.; Ajello, M.; Atwood, W.B.; Baldini, L.; Ballet, J.; Barbiellini, G.; Bastieri, D.; Baughman, B.M.; Bechto, K.; et al. Fermi Large Area Telescope View of the Core of the Radio Galaxy Centaurus A. Astrophys. J. 2010, 719, 1433–1444. [Google Scholar] [CrossRef]
- Graham, J.A.; Brown, A.M.; Boehm, C.; Lacroix, T.; Chadwick, P.M.; Joseph, S. The Fermi-LAT spectrum of Centaurus A—Analysis and interpretations. AIP Conf. Proc. 2017, 1792, 050004. [Google Scholar]
- Abdalla, H.; Abramowski, A.; Aharonian, F.; Benkhali, F.A.; Angüner, E.O.; Arakawa, M.; Armand, C.; Arrieta, M.; Backes, M.; Balzer, A.; et al. The γ-ray spectrum of the core of Centaurus A as observed with H.E.S.S. and Fermi-LAT. Astron. Astrophys. 2018, 619, A71. [Google Scholar]
- Petropoulou, M.; Lefa, E.; Dimitrakoudis, S.; Mastichiadis, A. One-zone synchrotron self-Compton model for the core emission of Centaurus A revisited. Astron. Astrophys. 2014, 562, A12. [Google Scholar] [CrossRef]
- Böttcher, M.; Reimer, A.; Sweeney, K.; Prakash, A. Leptonic and Hadronic Modeling of Fermi-detected Blazars. Astrophys. J. 2013, 768, 54. [Google Scholar] [CrossRef]
- Protheroe, R.J.; Biermann, P.L. Photon-photon absorption above a molecular cloud torus in blazars. Astropart. Phys. 1997, 6, 293–300. [Google Scholar] [CrossRef]
- Gehrels, N.; Chincarini, G.; Giommi, P.; Mason, K.O.; Nousek, J.A.; Wells, A.A.; White, N.E.; Barthelmy, S.D.; Burrows, D.N.; Cominsky, L.R.; et al. The Swift Gamma-Ray Burst Mission. Astrophys. J. 2004, 611, 1005–1020. [Google Scholar] [CrossRef]
- Krimm, H.A.; Barthelmy, S.D.; Markwardt, C.B.; Sanwal, D.; Tueller, J.; Gehrels, N.; Swift/BAT Team. The Swift-BAT Hard X-ray Transient Monitor. Bull. Am. Astron. Soc. 2006, 38, 374. [Google Scholar]
- Krimm, H.A.; Holland, S.T.; Corbet, R.H.D.; Pearlman, A.B.; Romano, P.; Kennea, J.A.; Bloom, J.S.; Barthelmy, S.D.; Baumgartner, W.H.; Cummings, J.R.; et al. The Swift/BAT Hard X-Ray Transient Monitor. Astrophys. J. Suppl. Ser. 2013, 209, 14. [Google Scholar] [CrossRef]
- Abdo, A.A.; Ackermann, M.; Althouse, W.; Anderson, B.; Axelsson, M.; Baldini, L.; Ballet, J.; Band, D.L.; Barbiellini, G.; et al. The Large Area Telescope on the Fermi Gamma-Ray Space Telescope Mission. Astrophys. J. 2009, 697, 1071–1102. [Google Scholar]
- Atwood, W.; Albert, A.; Baldini, L.; Tinivella, M.; Bregeon, J.; Pesce-Rollins, M.; Sgrò, C.; Bruel, P.; Charles, E.; Drlica-Wagner, A.; et al. Pass 8: Toward the Full Realization of the Fermi-LAT Scientific Potential. arXiv 2013, arXiv:1303.3514. [Google Scholar]
- Abdo, A.A.; Ackermann, M.; Ajello, M.; Atwood, W.B.; Axelsson, M.; Baldini, L.; Ballet, J.; Band, D.L.; Barbiellini, G.; Bastieri, D.; et al. Fermi/Large Area Telescope Bright Gamma-Ray Source List. Astrophys. J. Suppl. Ser. 2009, 183, 46–66. [Google Scholar] [CrossRef]
- Edelson, R.A.; Krolik, J.H. The discrete correlation function: A new method for analyzing unevenly sampled variability data. ESA Spec. Public. 1988, 281, 646–659. [Google Scholar] [CrossRef]
- Timmer, J.; Koenig, M. On generating power law noise. Astron. Astrophys. 1995, 300, 707. [Google Scholar]
- Emmanoulopoulos, D.; McHardy, I.M.; Papadakis, I.E. Generating artificial light curves: Revisited and updated. Mon. Not. R. Astron. Soc. 2013, 433, 907–927. [Google Scholar] [CrossRef]
- Connolly, S. A Python Code for the Emmanoulopoulos et al. [arXiv:1305.0304] Light Curve Simulation Algorithm. arXiv 2015, arXiv:1503.06676. [Google Scholar]
- Bentz, M.C.; Peterson, B.M.; Netzer, H.; Pogge, R.W.; Vestergaard, M. The Radius-Luminosity Relationship for Active Galactic Nuclei: The Effect of Host-Galaxy Starlight on Luminosity Measurements. II. The Full Sample of Reverberation-Mapped AGNs. Astrophys. J. 2009, 697, 160. [Google Scholar] [CrossRef]
| 1 | The publicly available monitor web page, http://swift.gsfc.nasa.gov/docs/swift/results/transients/, provides light curves for astrophysical sources observed with Swift-BAT. |
| 2 | Disclaimer: Any opinion, finding and conclusion or recommendation expressed in this material is that of the authors and the NRF does not accept any liability in this regard. |
Figure 1.
The Swift-burst alert telescope (BAT) and Fermi-large area telescope (LAT) light curves spanning years between 2008 and 2015 (at a 14 day sample rate) is shown here.
Figure 1.
The Swift-burst alert telescope (BAT) and Fermi-large area telescope (LAT) light curves spanning years between 2008 and 2015 (at a 14 day sample rate) is shown here.

Figure 2.
Discrete correlation function (DCF) result: the solid blue curve denotes the DCF as a function of time-lag (fitted with a Gaussian function in black), while the error bars on the correlation coefficients are propagated from the errors on the flux measurements. The peak at day time lag (indicated by the solid gray vertical line), is the deduced time-lag by which HE -rays trail behind the X-rays. The solid dark green line traces out the upper 95% confidence level (CL), while light green solid line marks the lower boundary of the 95% CL. Also shown are the upper and lower % CLs in dark brown and light brown, respectively. The lag bin width of the shown DCF is 15 days, constrained by the observation sampling rate and the duration of the observations. The latter also serves as a boundary to the lag range tested. This presented choice of the lag bin width and its range were arrived at by iterative visual inspection through these intervals. The correlation is insignificant on time scales larger than the time scale in this window.


Table 1.
An illustration of the parameter set for simulating the -ray light curves in the Python implementation [24] of the algorithm by [23]. In this case, amongst others one, notes the over 80 % contribution of the -distribution to the probability density function (PDF) at the expense of the log-normal component.
| Parameter | Symbol | Numerical Value |
|---|---|---|
| PSD normalizer | A | |
| Bending frequency of PSD | ||
| Low frequency slope in PSD | ||
| High frequency slope in PSD | ||
| Constant added for PSD | c | |
| Shape parameter of -distribution for PDF | ||
| Scale parameter of -distribution for PDF | ||
| Mean of the log-normal distribution for PDF | ||
| Variance of the log-normal distribution for PDF | ||
| Weight between the and log-normal distributions for PDF |
© 2019 by the authors. Licensee MDPI, Basel, Switzerland. This article is an open access article distributed under the terms and conditions of the Creative Commons Attribution (CC BY) license (http://creativecommons.org/licenses/by/4.0/).
Share and Cite
MDPI and ACS Style
Davids, I.D.; Böttcher, M.; Backes, M. Centaurus A: Hard X-ray and High-Energy Gamma-Ray Light Curve Correlation. Galaxies 2019, 7, 44. https://doi.org/10.3390/galaxies7020044
AMA Style
Davids ID, Böttcher M, Backes M. Centaurus A: Hard X-ray and High-Energy Gamma-Ray Light Curve Correlation. Galaxies. 2019; 7(2):44. https://doi.org/10.3390/galaxies7020044
Chicago/Turabian StyleDavids, Isak Delberth, Markus Böttcher, and Michael Backes. 2019. "Centaurus A: Hard X-ray and High-Energy Gamma-Ray Light Curve Correlation" Galaxies 7, no. 2: 44. https://doi.org/10.3390/galaxies7020044
Note that from the first issue of 2016, this journal uses article numbers instead of page numbers. See further details here.