Article

Change in Time of the Value of Dry and Lubricated Friction Coefficients for Surfaces Generated by Different Processing Methods

Department of Machine Manufacturing Technology, Gheorghe Asachi Technical University of Iasi, 700050 Iasi, Romania
*
Author to whom correspondence should be addressed.
Lubricants 2023, 11(10), 436; https://doi.org/10.3390/lubricants11100436
Submission received: 31 August 2023 / Revised: 17 September 2023 / Accepted: 2 October 2023 / Published: 9 October 2023

Abstract

:
The surfaces of the mechanical parts involved in friction processes are made using different processing methods. Each of these processing methods leads to a certain profile of the asperities of the generated surfaces. When such surfaces are subjected to friction processes, it is possible to produce a change in time in the magnitude of the friction coefficient. For experimental research, the outer cylindrical surfaces of some steel test samples were generated using various machining methods such as turning, grinding, ball and diamond burnishing, and vibroburnishing. Later, using a device adapted to a lathe, experimental tests were carried out following the time variation of the value of the friction coefficient under conditions of dry friction and lubricated friction, respectively. The results of the experimental tests were processed mathematically, being determined by empirical mathematical models that highlight the influence of the final processing methods of the surface, the presence of the lubricant, and the test duration on the variation of the friction coefficient. It was found that first, there is an increase over time in the values of the friction coefficient, and then the values of this coefficient stabilize at certain values. The increase in the coefficient of friction until reaching the stabilization value takes place in a proportion of approximately 148–305%.

1. Introduction

The friction coefficient is the main parameter that characterizes friction, a ratio between the friction force Ff and the normal force Fn on the contact surface [1,2,3].
The importance of friction processes for the proper functioning of mechanical equipment and the possibilities to act to ensure friction characterized by certain values of the coefficient of friction constituted a concern for researchers in manufacturing engineering and mechanical engineering.
When examining the review articles published in recent years, it was found that Marian and Tremmel highlighted the ever-deeper involvement of machine learning and artificial intelligence, including in the tribological characterization of materials and processes [1]. They thought there was an expansion of the use of numerical algorithms, such as those in the case of artificial neural networks, decision trees, and rule-based learners. The main fields in which machine learning was successfully applied in studying tribological aspects were composite materials, drive technology, manufacturing, and surface engineering.
Costa and Schille investigated the solutions by which it is possible to use textured surfaces to change the intensity of friction processes, namely, to increase friction [2]. They appreciated that the main applications of interest from the point of view of the intensification of friction processes refer to the transmission and control of movement, some biomimetic applications, and road-tire contacts.
Li et al. have elaborated a review in which they analyzed how it is possible to intervene in the tribological characteristics of lubricated friction of some bodies made of soft materials using surface texturing [3]. They appreciated that in this way, it is possible to better control the behavior of some bodies under conditions of lubricated friction and notice more appropriate results for certain equipment operating conditions.
The examination of specialized literature related to the modification of the friction conditions and the influence of these modifications on the values of some indicators of the intensity of the friction processes revealed that the main research themes taken into account in the last decade are the following:
-
The influence of the shape, size, and mutual distribution of texture elements on friction behavior [4,5,6,7,8,9,10,11,12,13,14];
-
The influence of different types of texture on wear performance [1,7,8,9,11,15,16,17,18,19,20,21,22,23];
-
The influence of the nature and chemical composition of the materials of the parts involved in the friction process on some tribological properties of different categories of materials [3,12,14,24,25,26,27];
-
Sizes used to characterize friction processes between textured surfaces, with or without lubricant [3,11,28];
-
The influence of the shape of the surface involved in the study of the friction process on the values of some friction characteristics [3,11,28,29];
-
Identifying the theoretical non-linear correlation of the data concerning specific aspects of the friction of textured surfaces [11,17,25,29];
-
Laser surface texturing and the possibilities of affecting the tribological characteristics of surfaces through such a process [2,6,8,13,15,16,24,29,30,31,32];
-
The influence of the texturing on the adhesion between surfaces [2,14];
-
Surface texturing inspired by nature [5,14,25];
-
Numerical simulation of aspects corresponding to friction processes involving textured surfaces [3,4,25,27];
-
The influence of some properties of the lubricant layer on some characteristics of the friction process in which textured surfaces are involved [17,33];
-
The procedures used to create surface texturing [1,5,9,10,18,23,25,34];
-
The study of the friction process specific to the operation of some mechanical parts [1,4,14,22,35];
-
Experimental research on the influence of different factors on some tribological characteristics [4,6,10,29,36,37,38];
-
Highlighting equipment solutions for the study of friction processes [6,7,9,10,11,12,15,17,20,24,28,30,31,32,34,38];
-
Carrying out extensive analyses of the results obtained in the field of specific friction of textured surfaces [2,11];
-
The study of the wettability properties influences the values of some characteristics of the friction processes [12,24,29,32].
The previously mentioned research directions highlight a lower approach to the influence exerted by the final processes applied to a surface on the frictional behavior of this surface. On the other hand, in industrial practice, the problem of applying some processing techniques that ensure certain values of the friction coefficients when the analyzed surfaces are involved in the operation of mobile joints often arises.
This paper presents the results of some research that sought to highlight the influence exerted by the processing techniques of the outer cylindrical surfaces on the evolution of the magnitude of the friction coefficient. A theoretical approach to the friction processes that develop in a spindle-bearing cylindrical joint was considered, in which different processing methods obtained the final generation of the outer cylindrical surface. Later, experimental research conditions and results were highlighted by tracking the change over time, due to the friction processes, of the value of the friction coefficient.

2. Materials and Methods

2.1. Lubricated and Dry Friction Considerations for Joints through Cylindrical Surfaces

In machine manufacturing, joining parts using cylindrical surfaces can be frequently encountered. Joints of this type may constitute clearance fits and tight fits, sometimes still using the concept of intermediate fits, for a category of joints where the relative positions of the tolerance fields for shaft and bore partially or completely overlap. A similar classification of joints with the participation of cylindrical surfaces takes into account the existence of mobile joints when conditions are provided for a relative movement between the components of the joint and those of fixed joints, which do not allow relative movement between the components of the joint.
In the case of a mobile joint of cylindrical surfaces, the friction torque Mf can be determined using the equation:
M f = r F f ,
where µ is the friction coefficient and Ff—the friction force between the surfaces in contact:
On the other hand, the friction force Ff can be calculated according to a well-known equation by considering the coefficient of friction µ and the normal force Fn:
F f = μ F n
Substituting the expression of the friction force Ff in Equation (1) for the calculation of the friction torque Mf, it arrives at:
μ = M f r F n .
This means that if the magnitude of the friction torque Mf and the magnitude Fn of the normal force are determined experimentally and the value of the radius r of the cylindrical surface involved in the friction process is known, the magnitude of the friction coefficient µ can be determined.
In such situations, the friction coefficient values are influenced by several groups of factors:
  • The nature, chemical composition, and some physical-mechanical properties of the two materials of the solid bodies (the spindle of a shaft and the bearing) that constitute the joint;
  • The dimensions that characterize the two cylindrical surfaces;
  • The heights and shapes of the asperities on the two surfaces;
  • The presence, nature, and lubrication properties of any solid and liquid lubricants found between the two surfaces;
  • The temperature at which the joint operates, both by changing some properties of the lubricants and by the expansion or contraction of the materials of the two parts in contact, thus including the possible change of the type of fit;
  • The nature of the contact exerted between the surfaces (continuous and pulsating contacts), etc.
One of the factors with a decisive influence on the friction coefficient values is the roughness of the surfaces in contact. Conventionally, roughness is defined as a set of geometric deviations from the surface for which the ratio between the step and the height is less than 50. In a cross-section through the cylindrical surface, the asperities can present a periodic profile due to the feed movement and, respectively, a non-periodic profile, resulting in tool marks, voids, material tearing, etc.
The roughness profile evaluation parameters can be amplitude parameters, which take into account aspects related to peak and valley (e.g., the maximum profile peak height Rp, the maximum profile valley height Rv, the maximum height Rz, etc.), amplitude average parameters (e.g., the arithmetic mean deviation Ra, the mean square deviation Rq, the skewness Rsk, the kurtosis Rku, etc.), spacing parameters (e.g., mean width RSm), hybrid parameters (e.g., root mean square slope Rdq), and, respectively, material rate curves and related parameters (e.g., core roughness depth Rk, reduced peak height Rpk, reduced valley height Rvk, etc.). Although there are several parameters for assessing the roughness of a surface and specialized companies have produced devices for determining the values of such parameters, currently, almost exclusively, the values of the roughness parameter Ra are indicated on the mechanical drawings.
The involvement of asperities in the generation of frictional forces primarily considers the possible penetration of the tips of some asperities on one of the surfaces between the gaps between the asperities existing on the other surface involved in contact. Such a situation occurs, especially with high values of the roughness parameter Ra. When the asperity heights are relatively small, due to the application of different surface finishing processes, there is less interpenetration of the asperities and more discontinuous contact between the profiles of the two surfaces.
The existence of a layer of liquid lubricant between the surfaces in contact (Figure 1), as well as the dynamic behavior of the lubricant, contributes even more to avoiding the interpenetration of asperities, thus determining, in this way, a decrease in the values of the frictional forces. This last aspect is specific to lubricated friction, as opposed to dry friction, when there is no lubricant layer between the surfaces in contact.
The problems are complicated when dealing with a textured surface, which presents microreliefs generated specifically by applying certain processing techniques for generating the respective surfaces.
In principle, texture is a physical structure found on the surface of an object and characterized by the repetition of certain components defined by certain sizes, shapes, and arrangements. As a result, texturing (or 3D texturing) means generating or applying a texture to the surfaces of solid bodies. In the engineering of mechanical part manufacture, texturing will lead to the appearance of specific microreliefs, usually aiming to improve the behavior of the part during its operation. Texturing will, therefore, sometimes also aim to improve friction conditions or reduce the wear of some parts at the level of the surfaces in contact.
Surfaces with different types of textures can be achieved using a varied range of processes, with the removal of material from the workpiece, with the addition of material, or without significant modifications to the mass of the workpiece. For example, as previously shown, many researchers have preferred to generate different categories of textures using the laser beam.
Another method of texturing a surface in the case of metal workpieces was processing by cold surface plastic deformation, or more concretely, by burnishing or vibro-burnishing, using tools like diamond tips or balls made of hard materials. A process that can be materialized using adaptable devices on lathes allows the texturing of the outer cylindrical surfaces, for example, by driving the workpiece in a rotational movement. At the same time, the diamond tip or the ball performs a feed movement and possibly a vibratory movement along a direction parallel to the direction of the feed movement (Figure 2a,b). The pressing of the diamond tip or the ball, combined with the previously mentioned movements, leads to the appearance, by plastic deformation on the outer cylindrical surface of the workpiece, of shallow channels, which may or may not overlap each other. It is believed that obtaining certain microreliefs characterized by certain shapes and sizes is possible.
According to an older classification [36,37,38,39], such microreliefs can be (Figure 3):
-
Microreliefs of the first category (I), when the generated channels do not intersect;
-
Microreliefs of the second category (II), when the generated channels are tangent;
-
Microreliefs of the third category (III), when the channels partially overlap/intersect, but with the maintenance of some areas that were not affected by the texture generation process;
-
Microreliefs of the fourth category (IV), when the overlapping of the channels takes place without maintaining areas of the initial cylindrical surface on which it acts through superficial plastic deformation. It is appreciated that, in this way, it is possible to reach reticular-type surfaces with a geometric appearance of hexagonal, tetragonal, and sinusoidal shapes, etc.
There is, of course, a wide range of processing methods by which outer cylindrical surfaces can be obtained (turning, milling, broaching, mortising, grinding, lapping, honing, vibrofinishing, etc.). Some of these processes are also used as final processes for obtaining outer cylindrical surfaces. In the framework of the research whose results were used in this paper, as the final process for obtaining the outer cylindrical surface of the samples, turning, grinding, burnishing, and vibroburnishing were taken into account (steel balls being used as hard tools), smoothing, or texturing with diamond tips. Through the variation of some input factors in the processes of generating the surfaces of the test samples, it is possible to obtain surface asperities with different dimensional characteristics and, therefore, different roughness parameter values. As such, it was decided to conduct experimental research on the surfaces of the test samples that presented distinct values of the roughness parameter Ra, obtained, as mentioned before, by changing the input factors’ values in obtaining the outer investigated surfaces.
Surface profiles generated exclusively by cutting processes can be different as a result of the use of different values of the cutting parameters, different geometries of the active areas of the cutting tools, the possible presence and characteristics of the working fluids, the rigidity of the technological system, some particularities of the processing process, etc. For example, the profile resulting from applying a longitudinal turning of an outer cylindrical surface (Figure 4a) is different from the one resulting from applying an outer cylindrical grinding with a longitudinal feed (Figure 4b). In principle, the profile of a turned surface presents asperities with higher heights, which have a more pronounced periodic character than the surface profile obtained by grinding.
It is expected that the different profiles of the surfaces generated by different processes lead to different initial values of the roughness parameter Ra and, as such, to change over time with different intensities of the value of the friction coefficient.
There are processing methods where the heights of the asperities on the surfaces of the parts have high values, and such methods are mainly used for roughing processing. One such process is turning. It should be noted, however, that by finishing turning, surfaces characterized by values of the roughness parameter Ra in the range of 1.6–3.2 µm can be produced. On the other hand, the use of surface finishing processes, such as grinding, can ensure conditions for obtaining values of the roughness parameter Ra in the range of 0.4–1.6 µm. Processing methods by superficial plastic deformation, such as diamond smoothing, burnishing, and vibroburnishing, provide conditions for obtaining surfaces with even lower values of the roughness parameter Ra, for example, in the 0.1–0.4 µm range. Since all those mentioned above outer cylindrical surface processing methods feed movements are used, it is accepted that when the feed rate is increased, there will be an increase in the heights of the asperities and, therefore, in the values of the Ra parameter. Increasing the rotation speed of the workpiece determines an increase in the temperature in the contact zone between the tool tip and the workpiece, leading to a better plasticization of the workpiece material and, as such, a decrease in the values of the roughness parameter Ra. It is considered that a variation between the normal limits of the depth of cut does not significantly influence the value of the roughness parameter Ra. Of course, too small values of the depth of cut can lead to discontinuous machining, which means an increase in roughness, as large values of the depth of cut can lead to the generation of intense vibrations and, therefore, increase the value of the roughness parameter Ra. The geometry of the active zone of the cutting tool or plastic deformation tool exerts a strong influence on the heights of asperities generated by processing. Other factors specific to different methods for processing outer cylindrical surfaces that influence the roughness of the processed surface are the presence and nature of work fluids, the stiffness of the components of the technological system, etc.

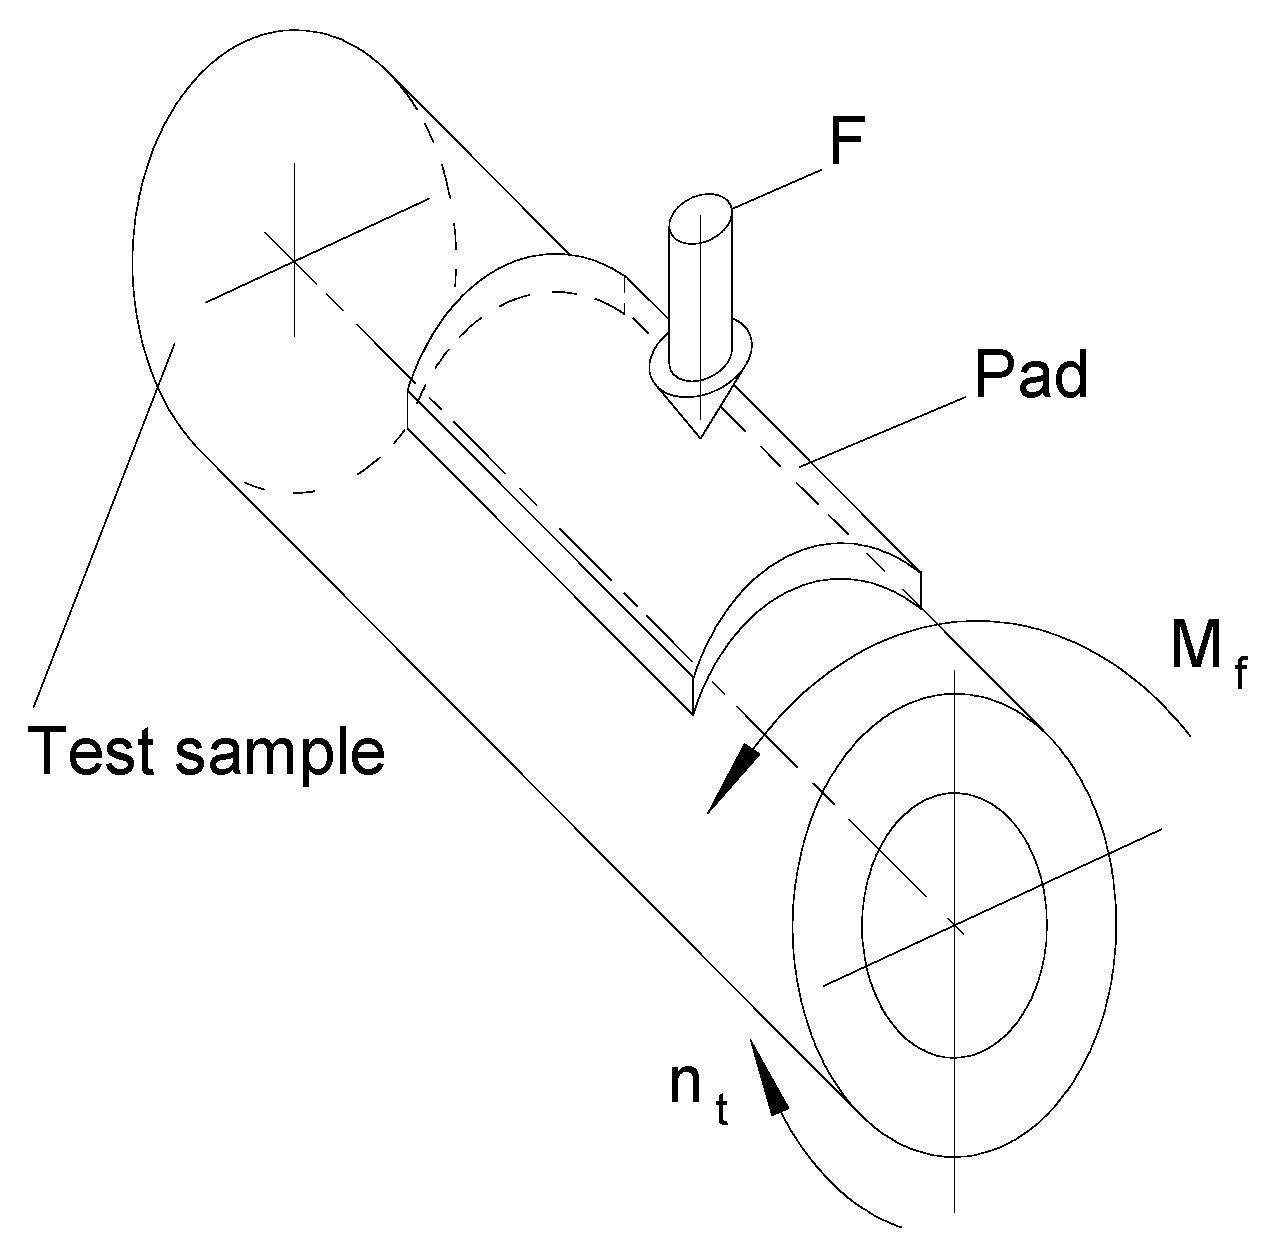
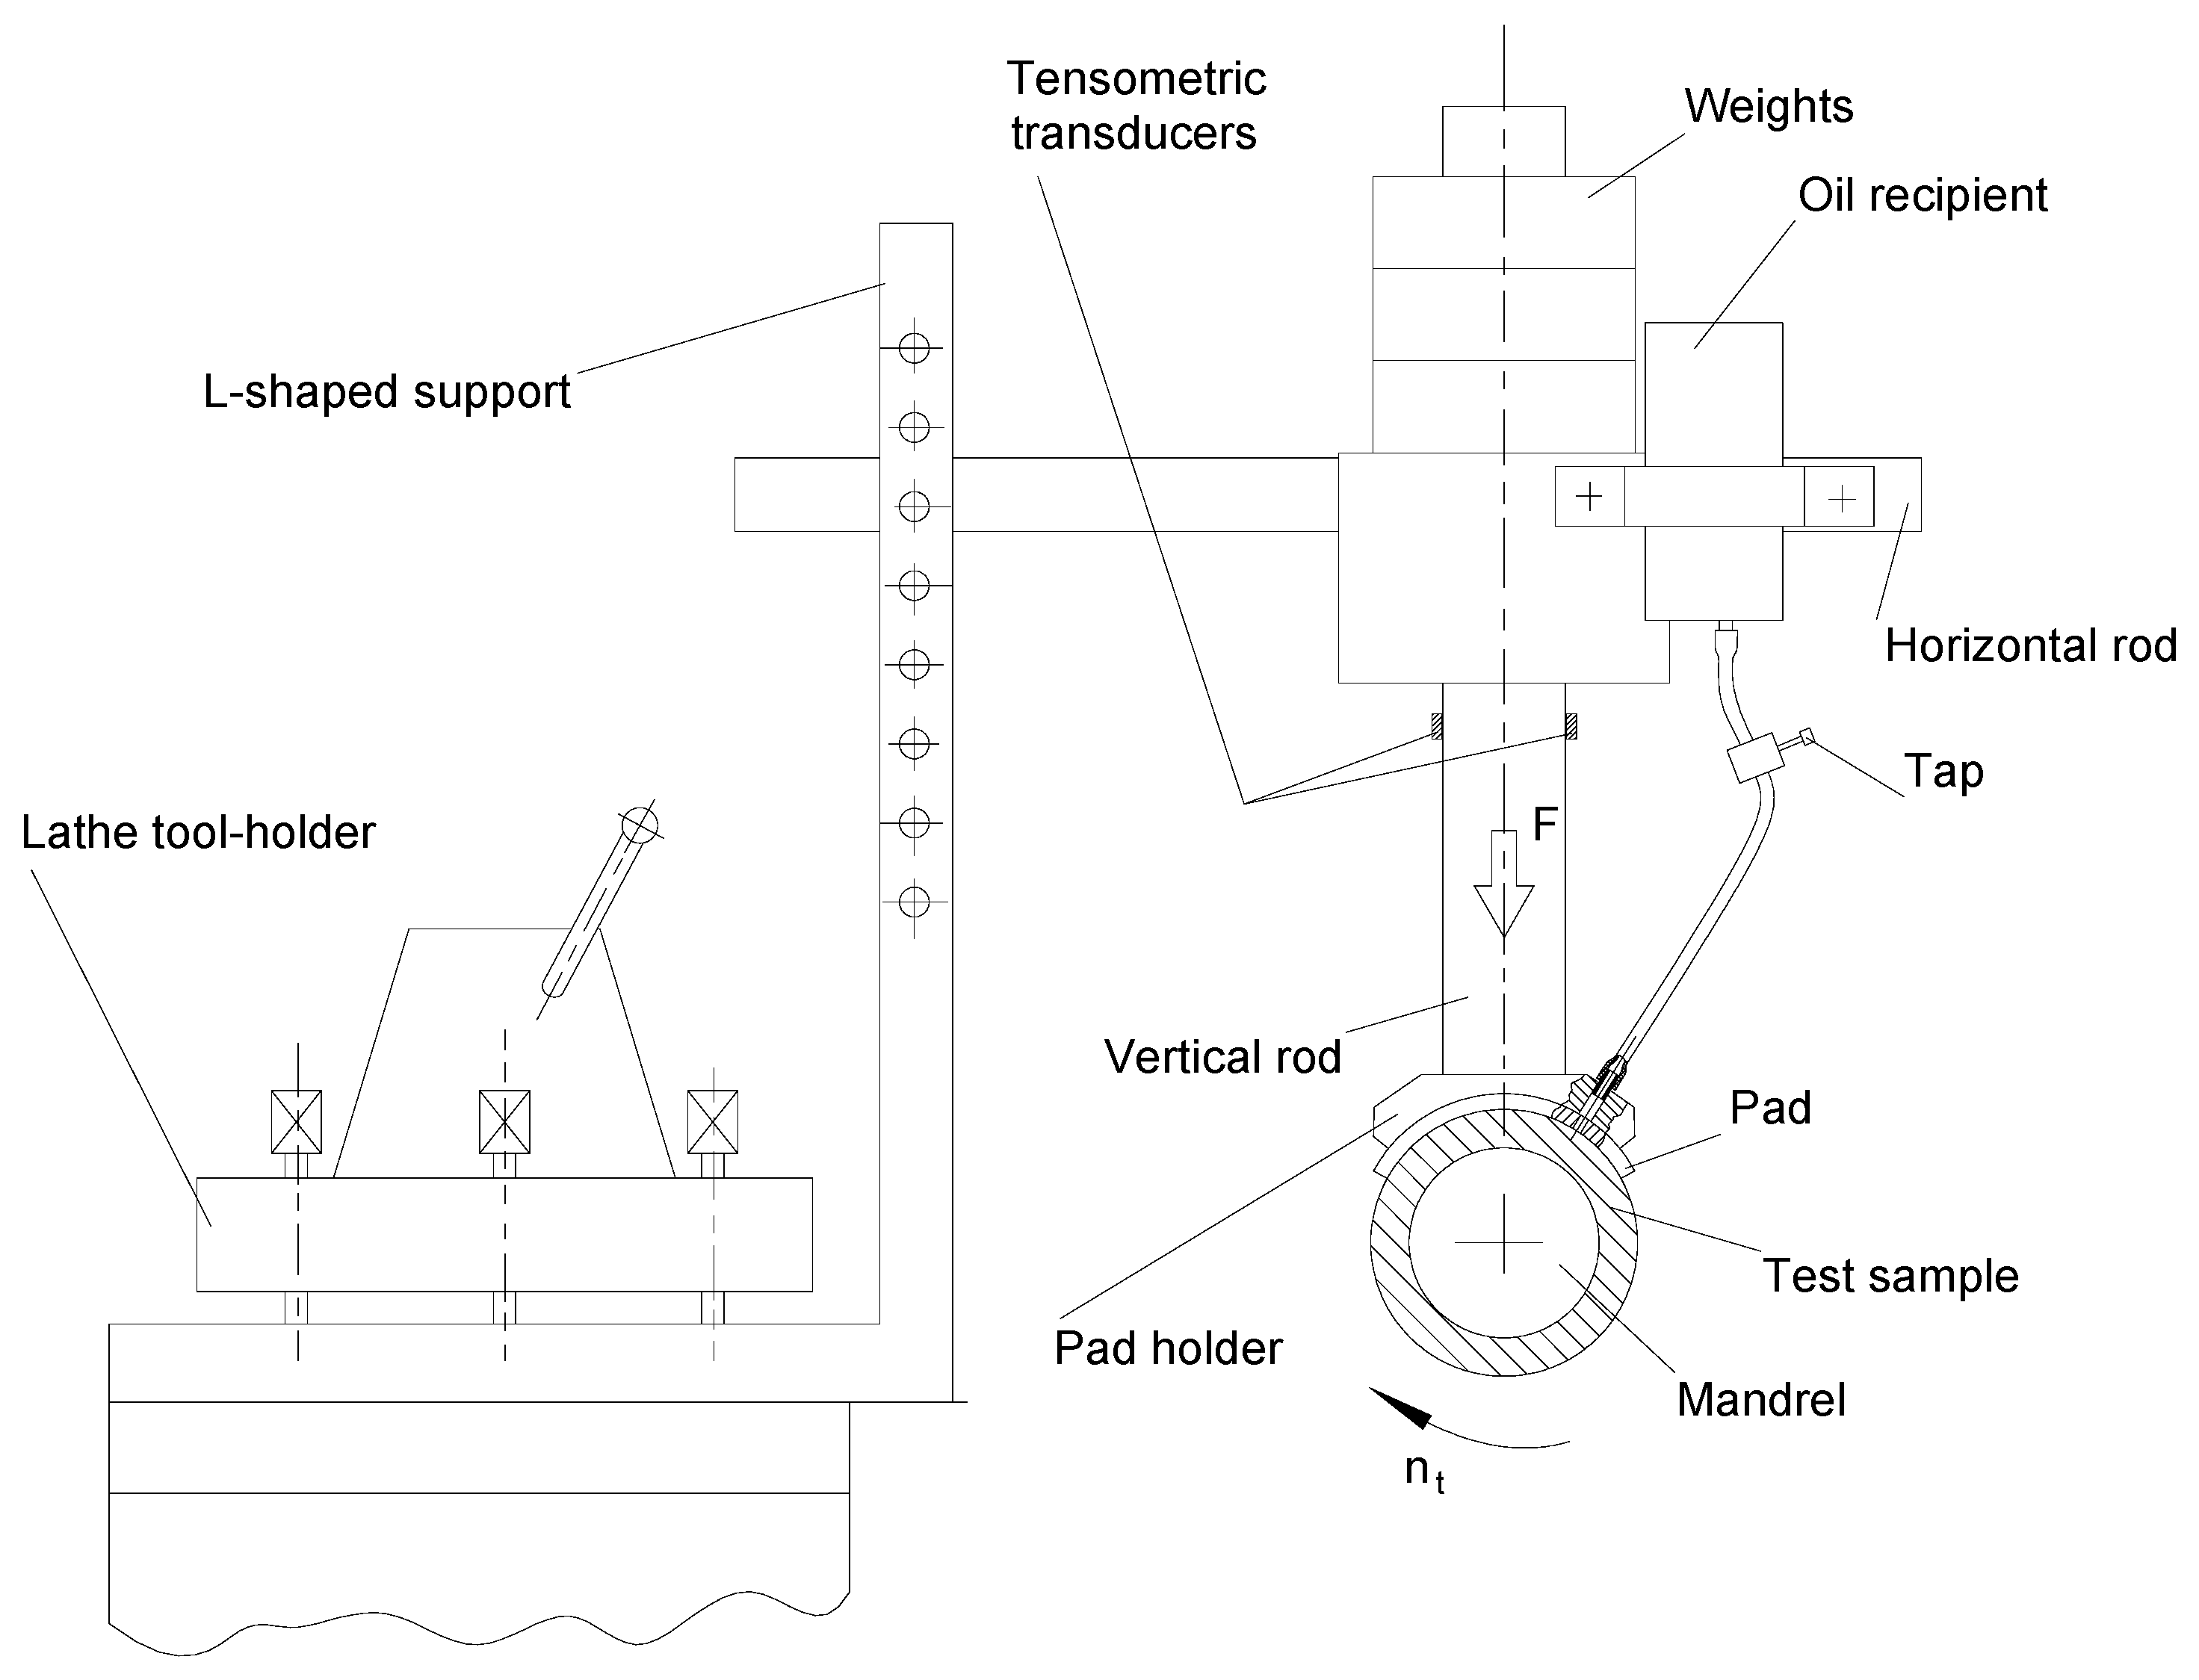
2.2. The Scheme Used for the Experimental Tests

Within the framework of this paper, the research examines the change over time in the value of the friction coefficient between the cylindrical surface of a tubular test sample, the surface made by different processes, and, respectively, the surface of a pad made of a hard and wear-resistant material (cast iron), as can be seen from the simplified graphic representation in Figure 5. It was considered to conduct experimental tests based on pressing a pad with established dimensions on the outer cylindrical surfaces of some tubular test samples. A force (Fn) of known magnitude was applied to the pad while the test sample was driven in a rotational movement. The working scheme used is similar, to a certain extent, to the one provided by the ASTM G77 standard [40].
A principal representation of the area corresponding to the experimental research [41] can be seen in Figure 6. The test sample in the form of a cylindrical bushing was mounted on a mandrel located and clamped, in its turn, in the lathe universal chuck and, respectively, in the live center of the universal lathe.
In one of the 4 slots of the usual lathe tool holder, the base part of a support frame for the subsystem generating an Fn normal force with different values was fixed. For this purpose, weights of different sizes could be placed on a rod that could move vertically, allowing different values of the normal force Fn to be obtained. On the horizontal support rod of the vertical rod bearing, an oil reservoir was also placed in the experimental variant that used lubricated friction, through which the oil reached the space between the working surface of the pad and the outer cylindrical surface of the tubular test sample. The oil flow was adjusted using a valve.
Two tensometric transducers are placed on the vertical rod of the device, with the help of which it became possible to determine the magnitude of the friction torque Mf using the results of a previous calibration action carried out using a special part [41].
Knowing the value of the friction torque Mf, the value of the friction coefficient µ can be calculated using Equation (4), which was reached by replacing the magnitude of the normal force Fn by the product mg, where m is the mass of the weights placed on the vertical rod, g is the gravitational acceleration (mm/s2), and the diameter d of the cylindrical surface corresponds to twice the radius r of the same surface (d = 2r):
μ = 2 M f m g d ,
A cast iron pad is pressed against the outer cylindrical surface of the tubular test sample by the weights placed on the vertical rod, thus causing the normal force Fn to appear. Cast iron was used as the material for the pad due to the higher wear resistance of this material. The size of the width of the pad and the radius corresponding to the outer cylindrical surface of the tubular test sample are factors capable of changing the values of the pressure distribution exerted by the pad on the tubular test sample, but, in the case of the experimental research proposed to be carried out, it is intended, for the time being, to maintain the values constants of these input factors in each distinct experimental run. An increase in the pad width could result in a reduction of the local pressure exerted on the outer cylindrical surface of the tubular test sample, as the increase in the radius corresponding to the outer cylindrical surface of the tubular test sample will lead to a change in the pressure distribution on the contact surface between the pad and the tubular test sample. Increasing the value of the normal force Fn will cause an increase in the pressure exerted by the pad on the tubular test sample, contributing to an intensification of the wear process of the outer cylindrical surface of the tubular test sample involved in the process. A more thorough examination of the process could reveal a variation in the pressure exerted by the pad along its width, but in the present work, such an aspect will not be addressed for the time being. It was also intended to keep the speed of rotation of the tubular test sample constant for all the experimental tests that will aim to measure the time variation of the magnitude of the friction coefficient.
A change in the value of the friction coefficient is expected over time due to the interaction of the two surfaces in contact, the impact of the asperities, and the variation of the lubrication conditions when it comes to lubricated friction [40]. For example, in the case of vehicle braking systems, the value of the friction coefficient may decrease over time [42]. On the other hand, it is accepted that the variation of the value of the friction coefficient during the first operating period of a cylindrical joint can provide information on the size of the running-in period. It is thus considered that there is a more intense change in the magnitude of the friction coefficient in the first period of equipment operation, after which the value of the friction coefficient remains approximately constant or has a very slow variation. It was agreed that the first operating period of the cylindrical joint, i.e., the one in which the value of the friction coefficient changes with greater intensity, should be considered the running-in period.
The experimental tests using the previously mentioned working scheme will, therefore, be able to provide information related to the size of the running-in period by tracking the variation over time of the size of the friction coefficient.

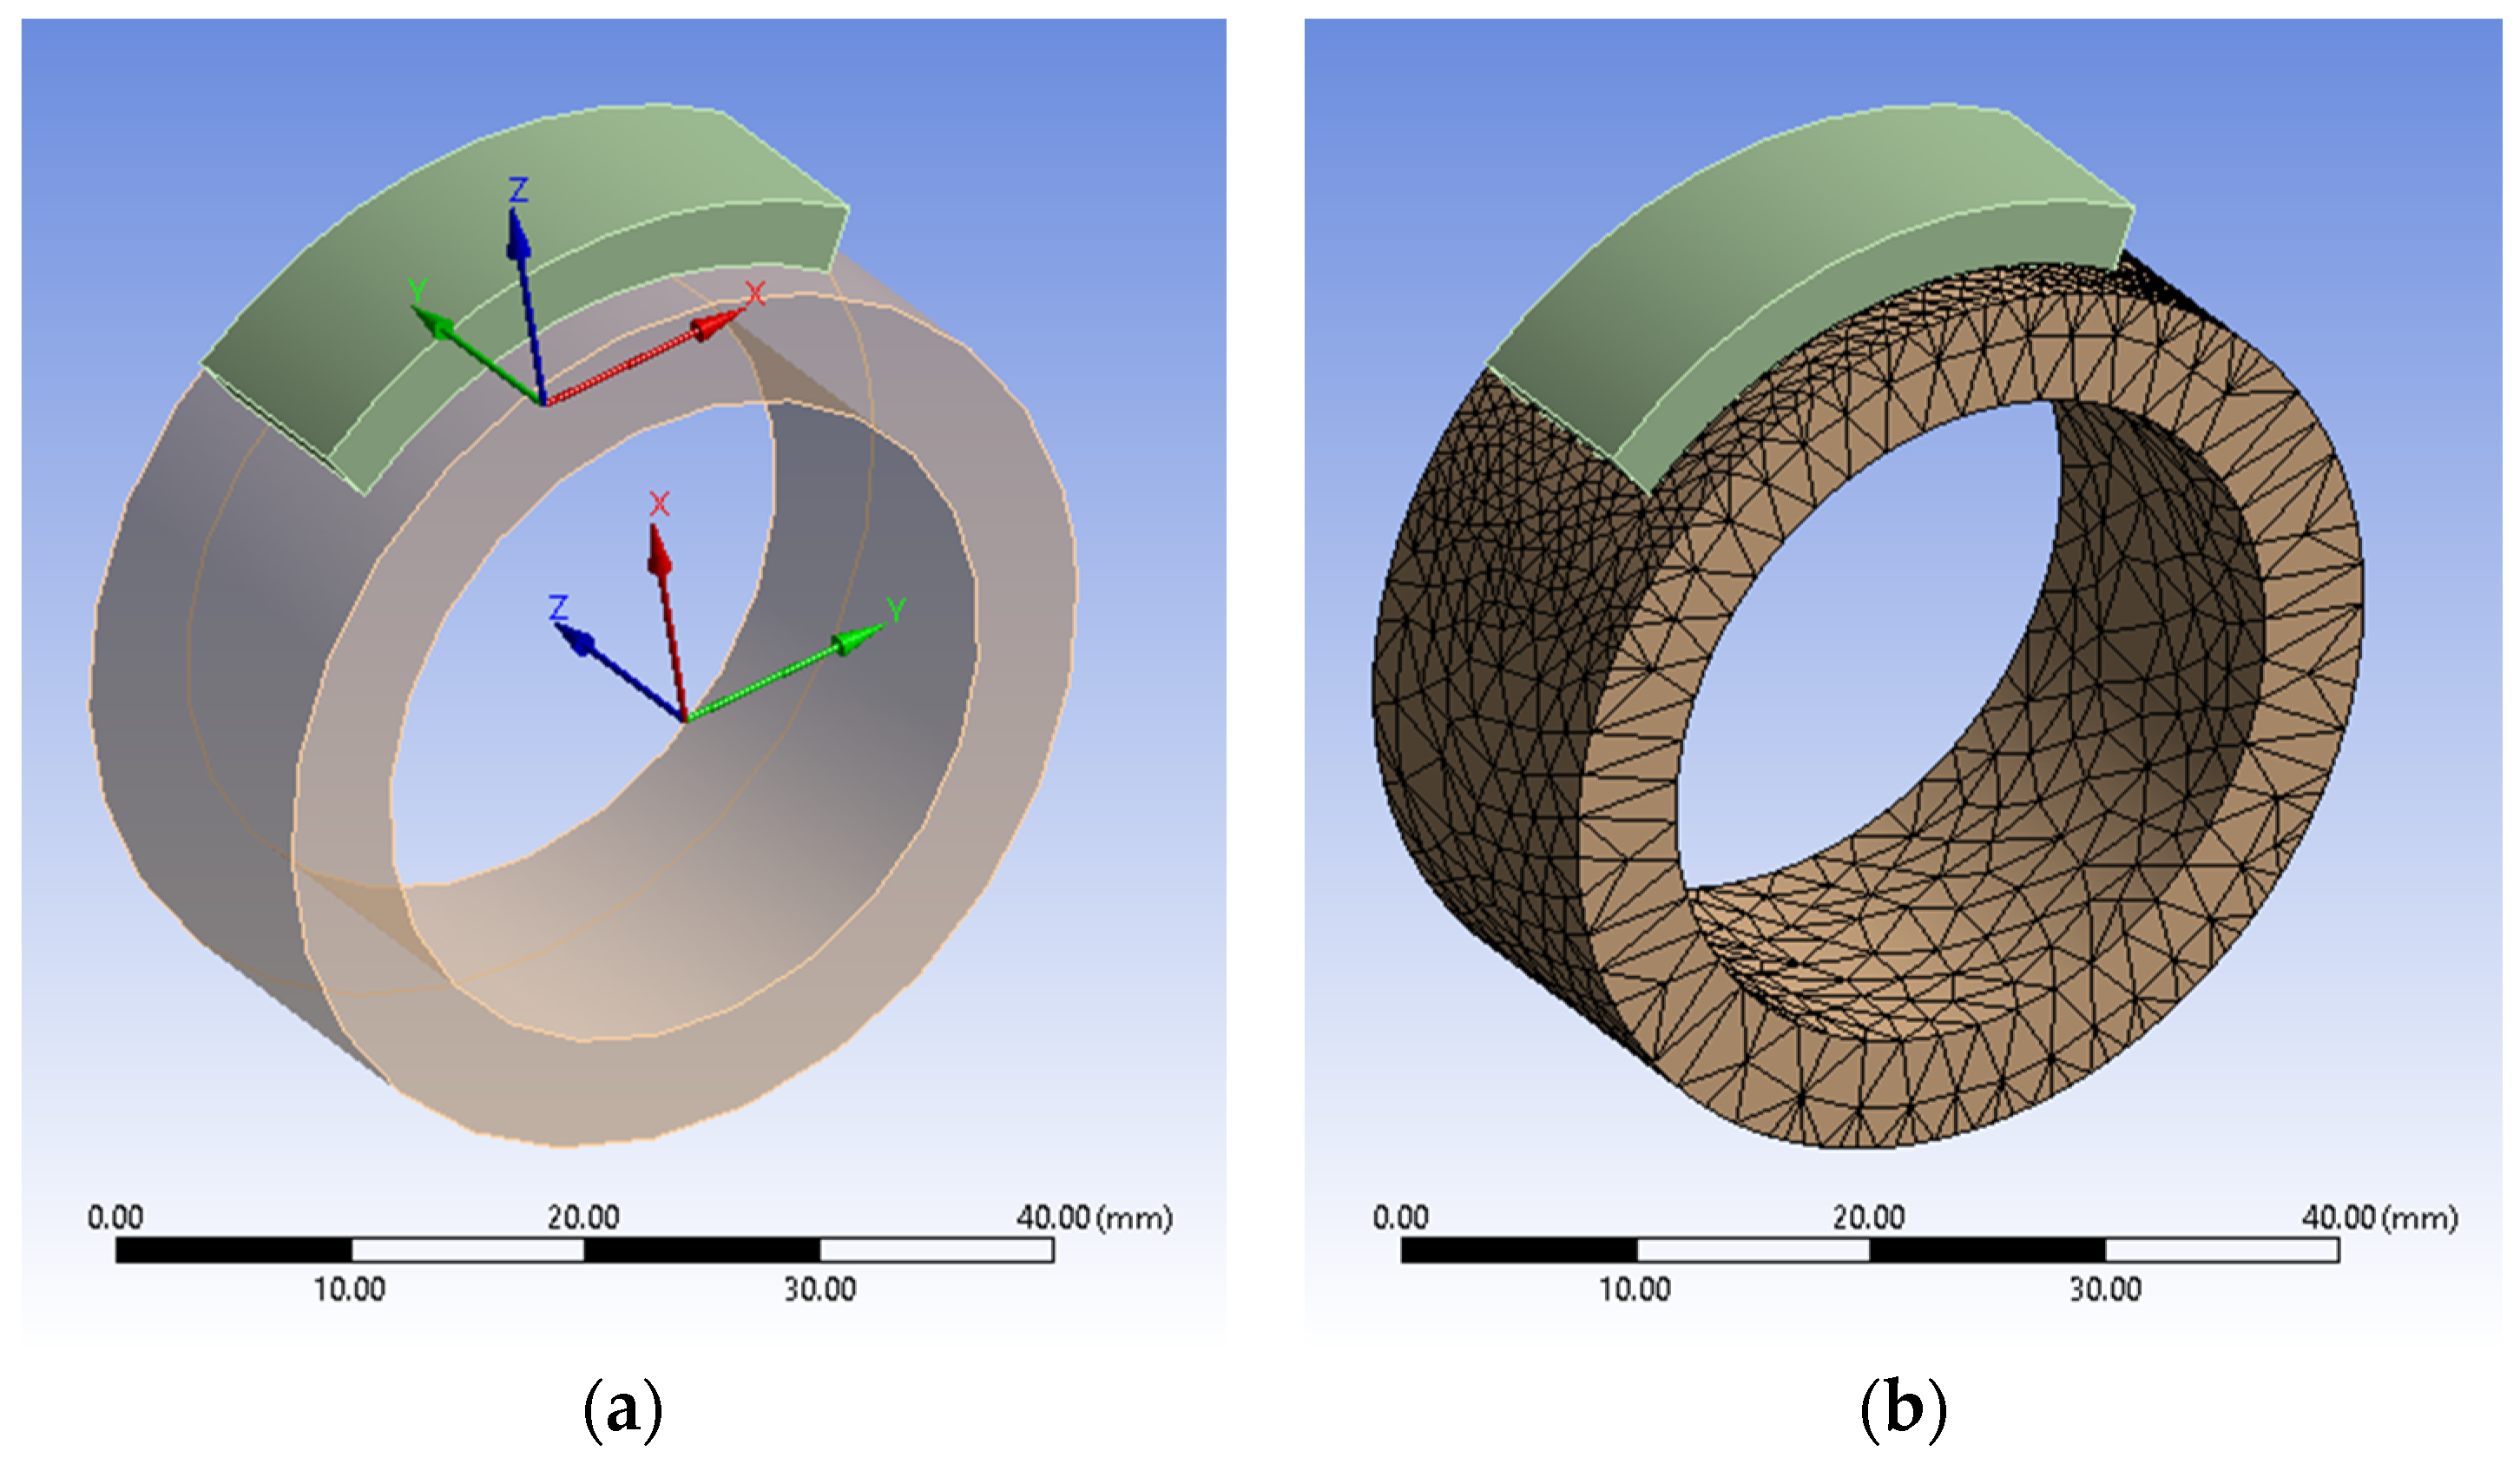
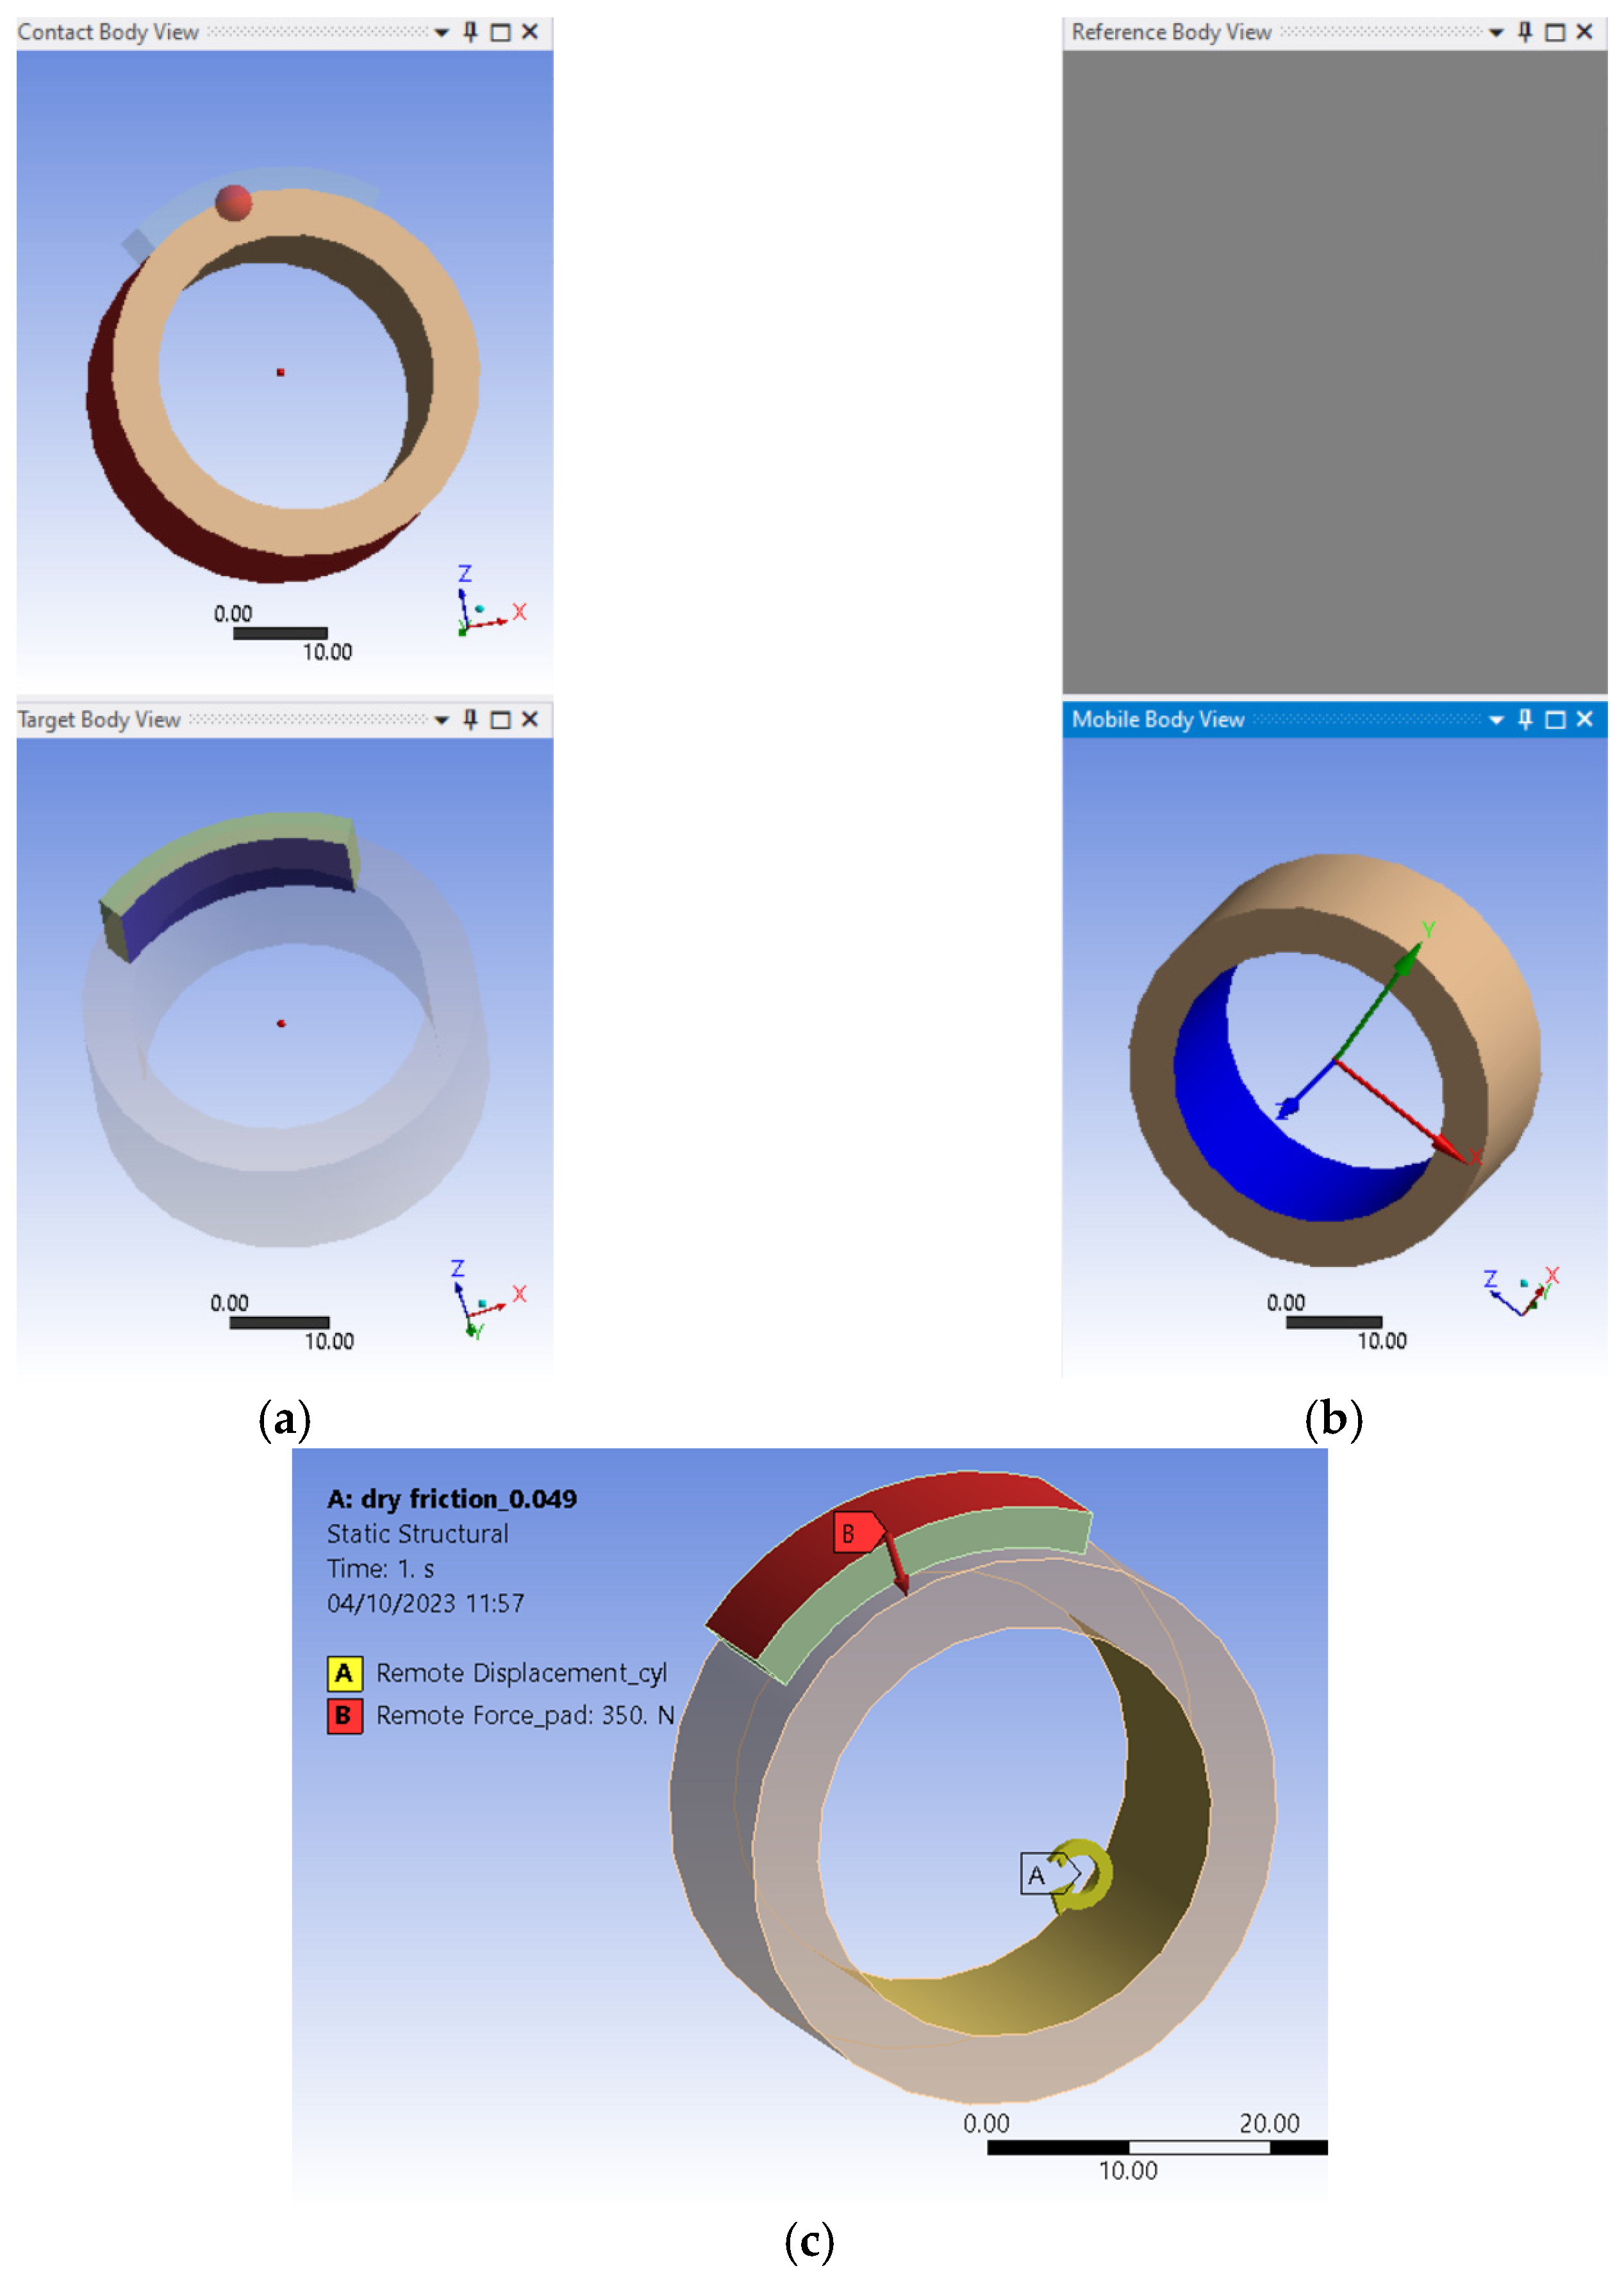
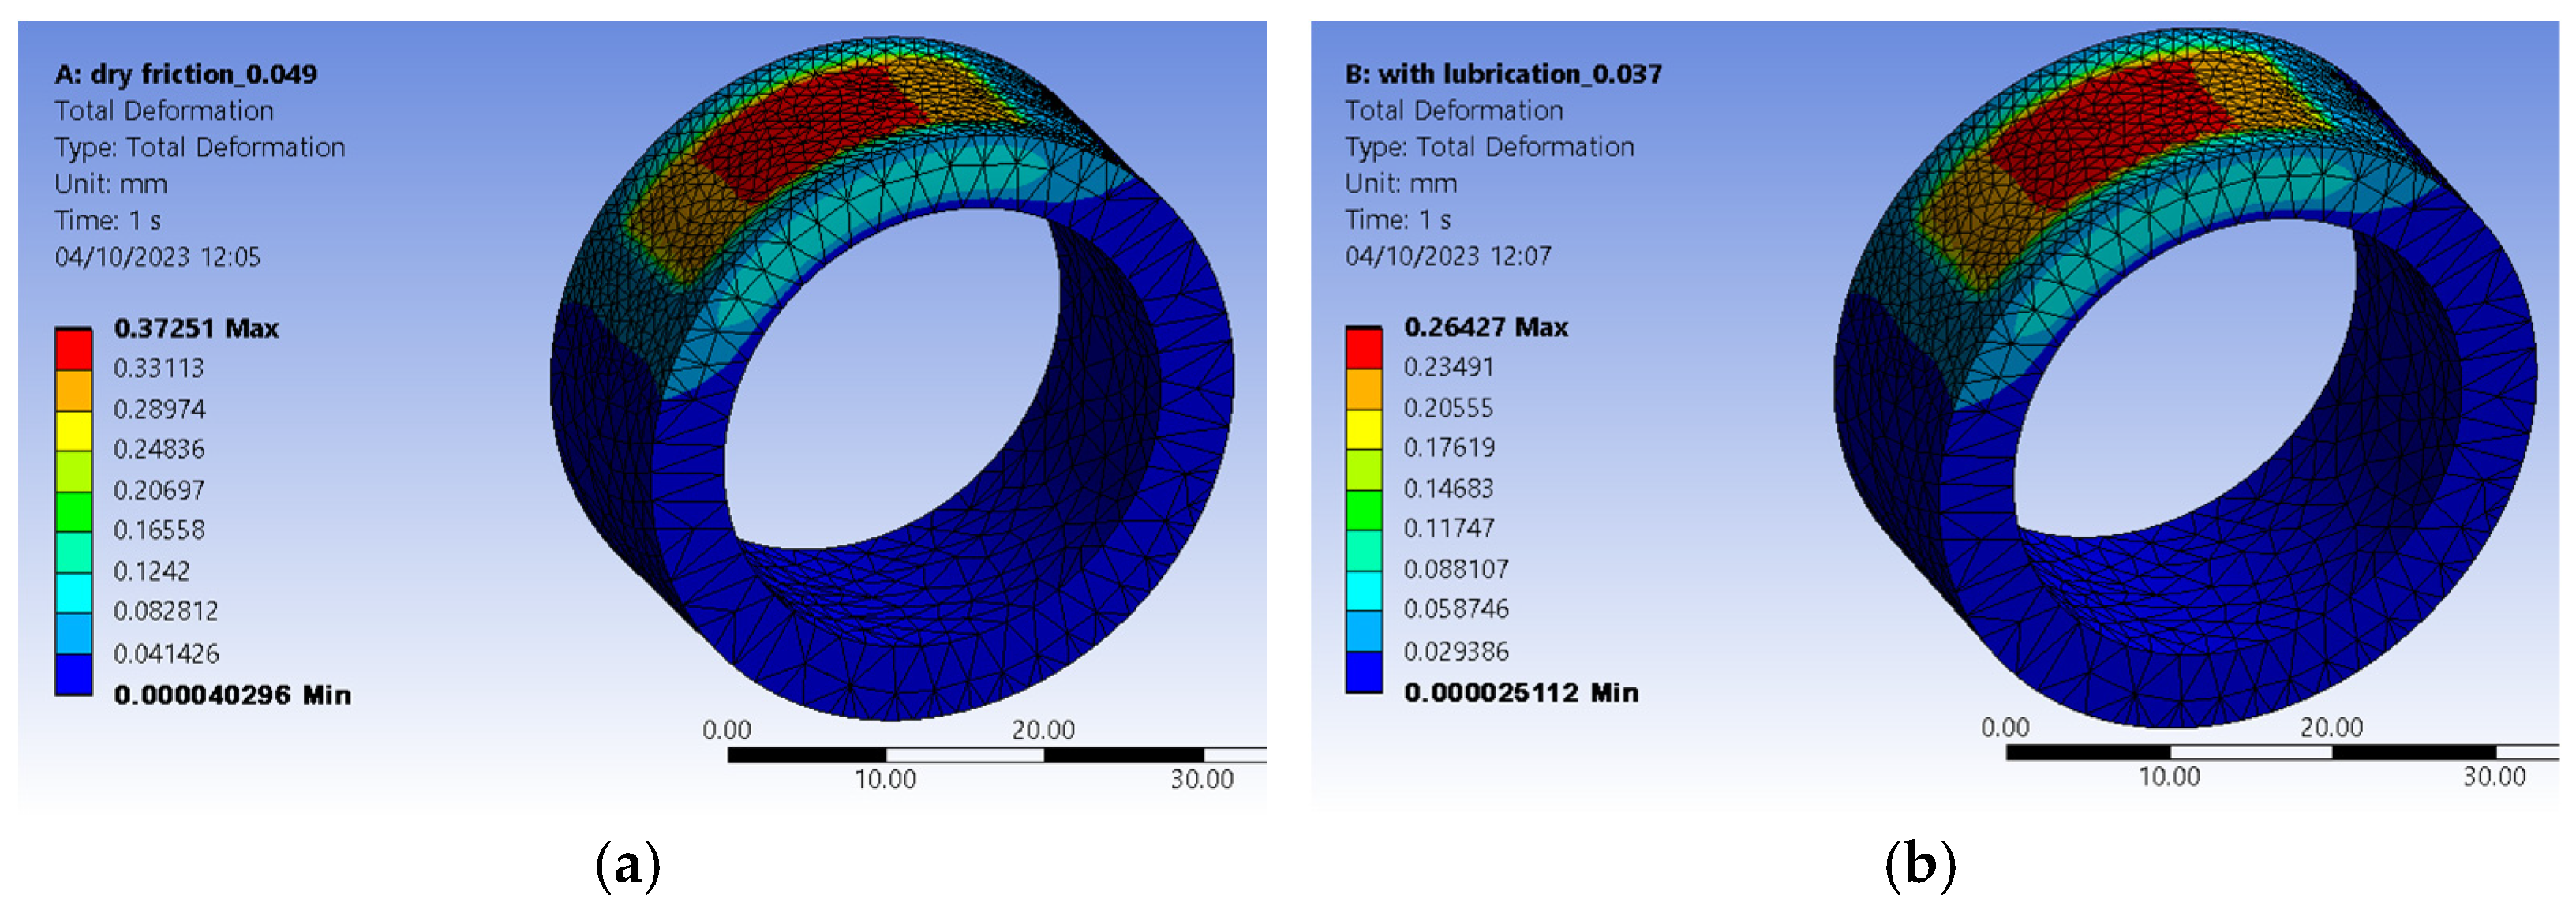
2.3. Analysis by the Finite Element Method of Some Aspects Regarding the Influence Exerted by the Character of Friction and the Final Processing of the Surface on the Magnitude of the Coefficient of Friction

It was intended to highlight that a lower friction coefficient given by the presence of lubrication, in the case of a grinded surface, produces different effects than those of the absence of lubrication. For this purpose, a 3D model was designed using the academic version of Siemens Solid Edge. The model was later saved in a Parasolid file format. Ansys was chosen as the finite element method (FEM) analyzing software. The software will simulate the interaction between the pad and the tubular test sample in the presence and absence of the lubricant. The values of the friction coefficients resulting from the previously performed experimental tests were taken into account.
In the static structural module of Ansys, the Parasolid file of the 3D model was imported. A structural steel-type material was considered for the tubular test sample, which has similar properties to those of the samples used in the experimental tests. For the pad, the same material was used. Since the effects are only noticeable on the test sample, it was decided to choose a rigid behavior for the pad. The tubular test sample of cylindrical shape was considered flexible with the activation of the highlighting option for non-linear effects. The coordinate system attached to the cylindrical sample allows rotation around the Z-axis (Figure 7a). From the mesh point of view, a contact sizing method with a 1 mm element size assigned to the test sample was preferred. In addition, a same-body patch conformation method based on tetrahedra with quadratic element order was imposed. This resulted in 15,695 nodes and 8569 elements (Figure 7b).
The connections branch contains both contacts and joints. A frictional contact was chosen between the contacting surfaces of both the pad and the tubular test sample (Figure 8a). The analyses were performed both for dry friction and for lubricated friction. Based on the experimental results, a friction coefficient value of 0.049 and 0.037 was chosen for dry and lubricated friction, respectively, when lubrication is taken into account. The interface treatment was set to adapt to the contact situation. Other options were left as expected by the program. Based on the considered coordinate system, a body-to-ground rotary joint type was chosen for the test sample (Figure 8b).
The analysis settings include only one step with a time limit of 1 s, which allows the identification of the effects exerted on the test sample. The step was defined by substeps that received a minimum of 10 and a maximum of 2000. The large deviation option was turned on. The non-symmetrical output was selected when evaluating it according to the Newton-Raphson criteria for non-linear controls. A remote force was imposed on the upper surface of the pad of 350 N in the -Z direction, and a remote displacement was imposed on the inner surface of the cylindrical sample for rotation purposes (Figure 8c).
Results show similar distributions in terms of deformation recorded in all three directions. The pad’s footprint is visible on the test sample’s outer surfaces, but its action is also on its inner surface. In the case of dry friction, it peaks at 0.37251 mm (Figure 9a), and with lubrication, it peaks at only 0.26427 mm (Figure 9b).
The authors acknowledge that further refinement may be necessary and recommend carefully using the results presented in the paper.

2.4. Planning and Conducting Experimental Tests

The equipment used to perform the experimental tests corresponds to the simplified representation in Figure 6: a burnishing/vibroburnishing device adapted to a medium-sized universal lathe [41,43,44,45].
It was considered to follow the evolution of the friction coefficient µ size until the period in which the friction coefficient values begin to remain approximately constant. In this way, a total test duration of 132 min was reached, with the measurements being carried out at intervals of 12 min.
Two tests were performed for each processing method used as the final processing of the surfaces of the test samples. In Table 1 and Table 2, the average values of the two measurements are entered.
The test samples were bushings with an outer diameter of 60 mm, an inner diameter of 22 mm, and a length of 22 mm. They were made of carbon steel type 1.0060, with a tensile strength of 765 MPa. As a material for the pad, a nodular graphite cast iron of type EN-GJS-600–3 (DIN 1693 GGG60) was used, having a hardness of 761 MPa, a tensile strength of 600 MPa, a yield strength of 370 MPa, and an elongation of 3%.
A sample rotation speed of 800 rev/min was used, corresponding to a peripheral speed at the outer cylindrical surface of the tubular test sample of 150 m/min.
The pressing force Fn of the pad on the tubular test sample was 550 N, which allowed it to reach a pressure p according to the relationship:
p = F n A = 550 22 · 60 = 0.41 N m m 2 = 0.41   M P a ,
where A is the projection of the pad work surface area in a horizontal plane.
Considering the dimensions of the projection of the working surface area in a horizontal plane of 22∙60 mm2, a pressure value of p = 0.41 MPa is reached.
In the case of lubricated friction tests, an H20-type hydraulic oil was used, ensuring the presence of the lubricant in the space between the pad and the tubular test sample at a flow rate of 12–14 drops/min.
Surfaces obtained by applying distinct final processing methods and having asperities or textures with different profiles and sizes were taken into account. It resorted to the study of the evolution over time of the size of the friction coefficient µ for surfaces resulting from turning, grinding, smoothing with a diamond tip, ball burnishing, ball vibroburnishing, and diamond-tip vibroburnishing. In the case of the last two processing methods, test samples obtained under different processing conditions were used to obtain complete information regarding the effects investigated for different shapes and sizes of the initial asperities. The final surface processing procedures were as follows:
-
Processing method no. 1: outer cylindrical turning, which led to a value of the roughness parameter Ra = 1.69 µm;
-
Processing method no. 2: outer cylindrical grinding, through which a value of the roughness parameter Ra = 0.82 µm was obtained;
-
Processing method no. 3: ball burnishing, using a pressing force F = 350 N and a longitudinal feed rate f = 0.059 mm/rev, which led to a value of the roughness parameter Ra = 0.65 µm;
-
Processing method no. 4: diamond type smoothing, using a pressing force F = 100 N and a longitudinal feed rate f = 0.059 mm/rev, obtaining a value of the parameter Ra = 0.58 µm;
-
Processing method no. 5: ball vibroburnishing, using a longitudinal feed rate f = 0.059 mm/rev, obtaining a type IV microrelief and a value of the roughness parameter Ra = 0.1 µm;
-
Processing method no. 6: vibroburnishing type diamond, using a longitudinal feed rate f = 0.059 mm/rev, obtaining a type IV microrelief and a value of the roughness parameter Ra = 0.08 µm;
-
Processing method no. 7: ball vibroburnishing, using a longitudinal feed rate f = 0.46 mm/rev and obtaining a type III microrelief;
-
Processing method no. 8: diamond-type vibroburnishing, using a longitudinal feed rate f = 0.46 mm/rev and obtaining a type III microrelief;
-
Processing method no. 9: ball vibroburnishing, using a longitudinal feed rate f = 0.916 mm/rev and obtaining a type II microrelief;
-
Processing method no. 10: diamond tip vibroburnishing, using a longitudinal feed rate f = 0.916 mm/rev and obtaining a type II microrelief;
-
Processing method no. 11: ball vibroburnishing, using a longitudinal feed rate f = 1.5 mm/rev and obtaining a type I microrelief;
-
Processing method no. 12: ball vibroburnishing, using a longitudinal feed rate f = 1.5 mm/rev and obtaining a type I microrelief;
-
Processing method no. 13: ball vibroburnishing, using a longitudinal feed rate f = 0.264 mm/rev and obtaining a type III microrelief;
-
Processing method no. 14: ball vibroburnishing, using a longitudinal feed rate f = 0.416 mm/rev and obtaining a type III microrelief.
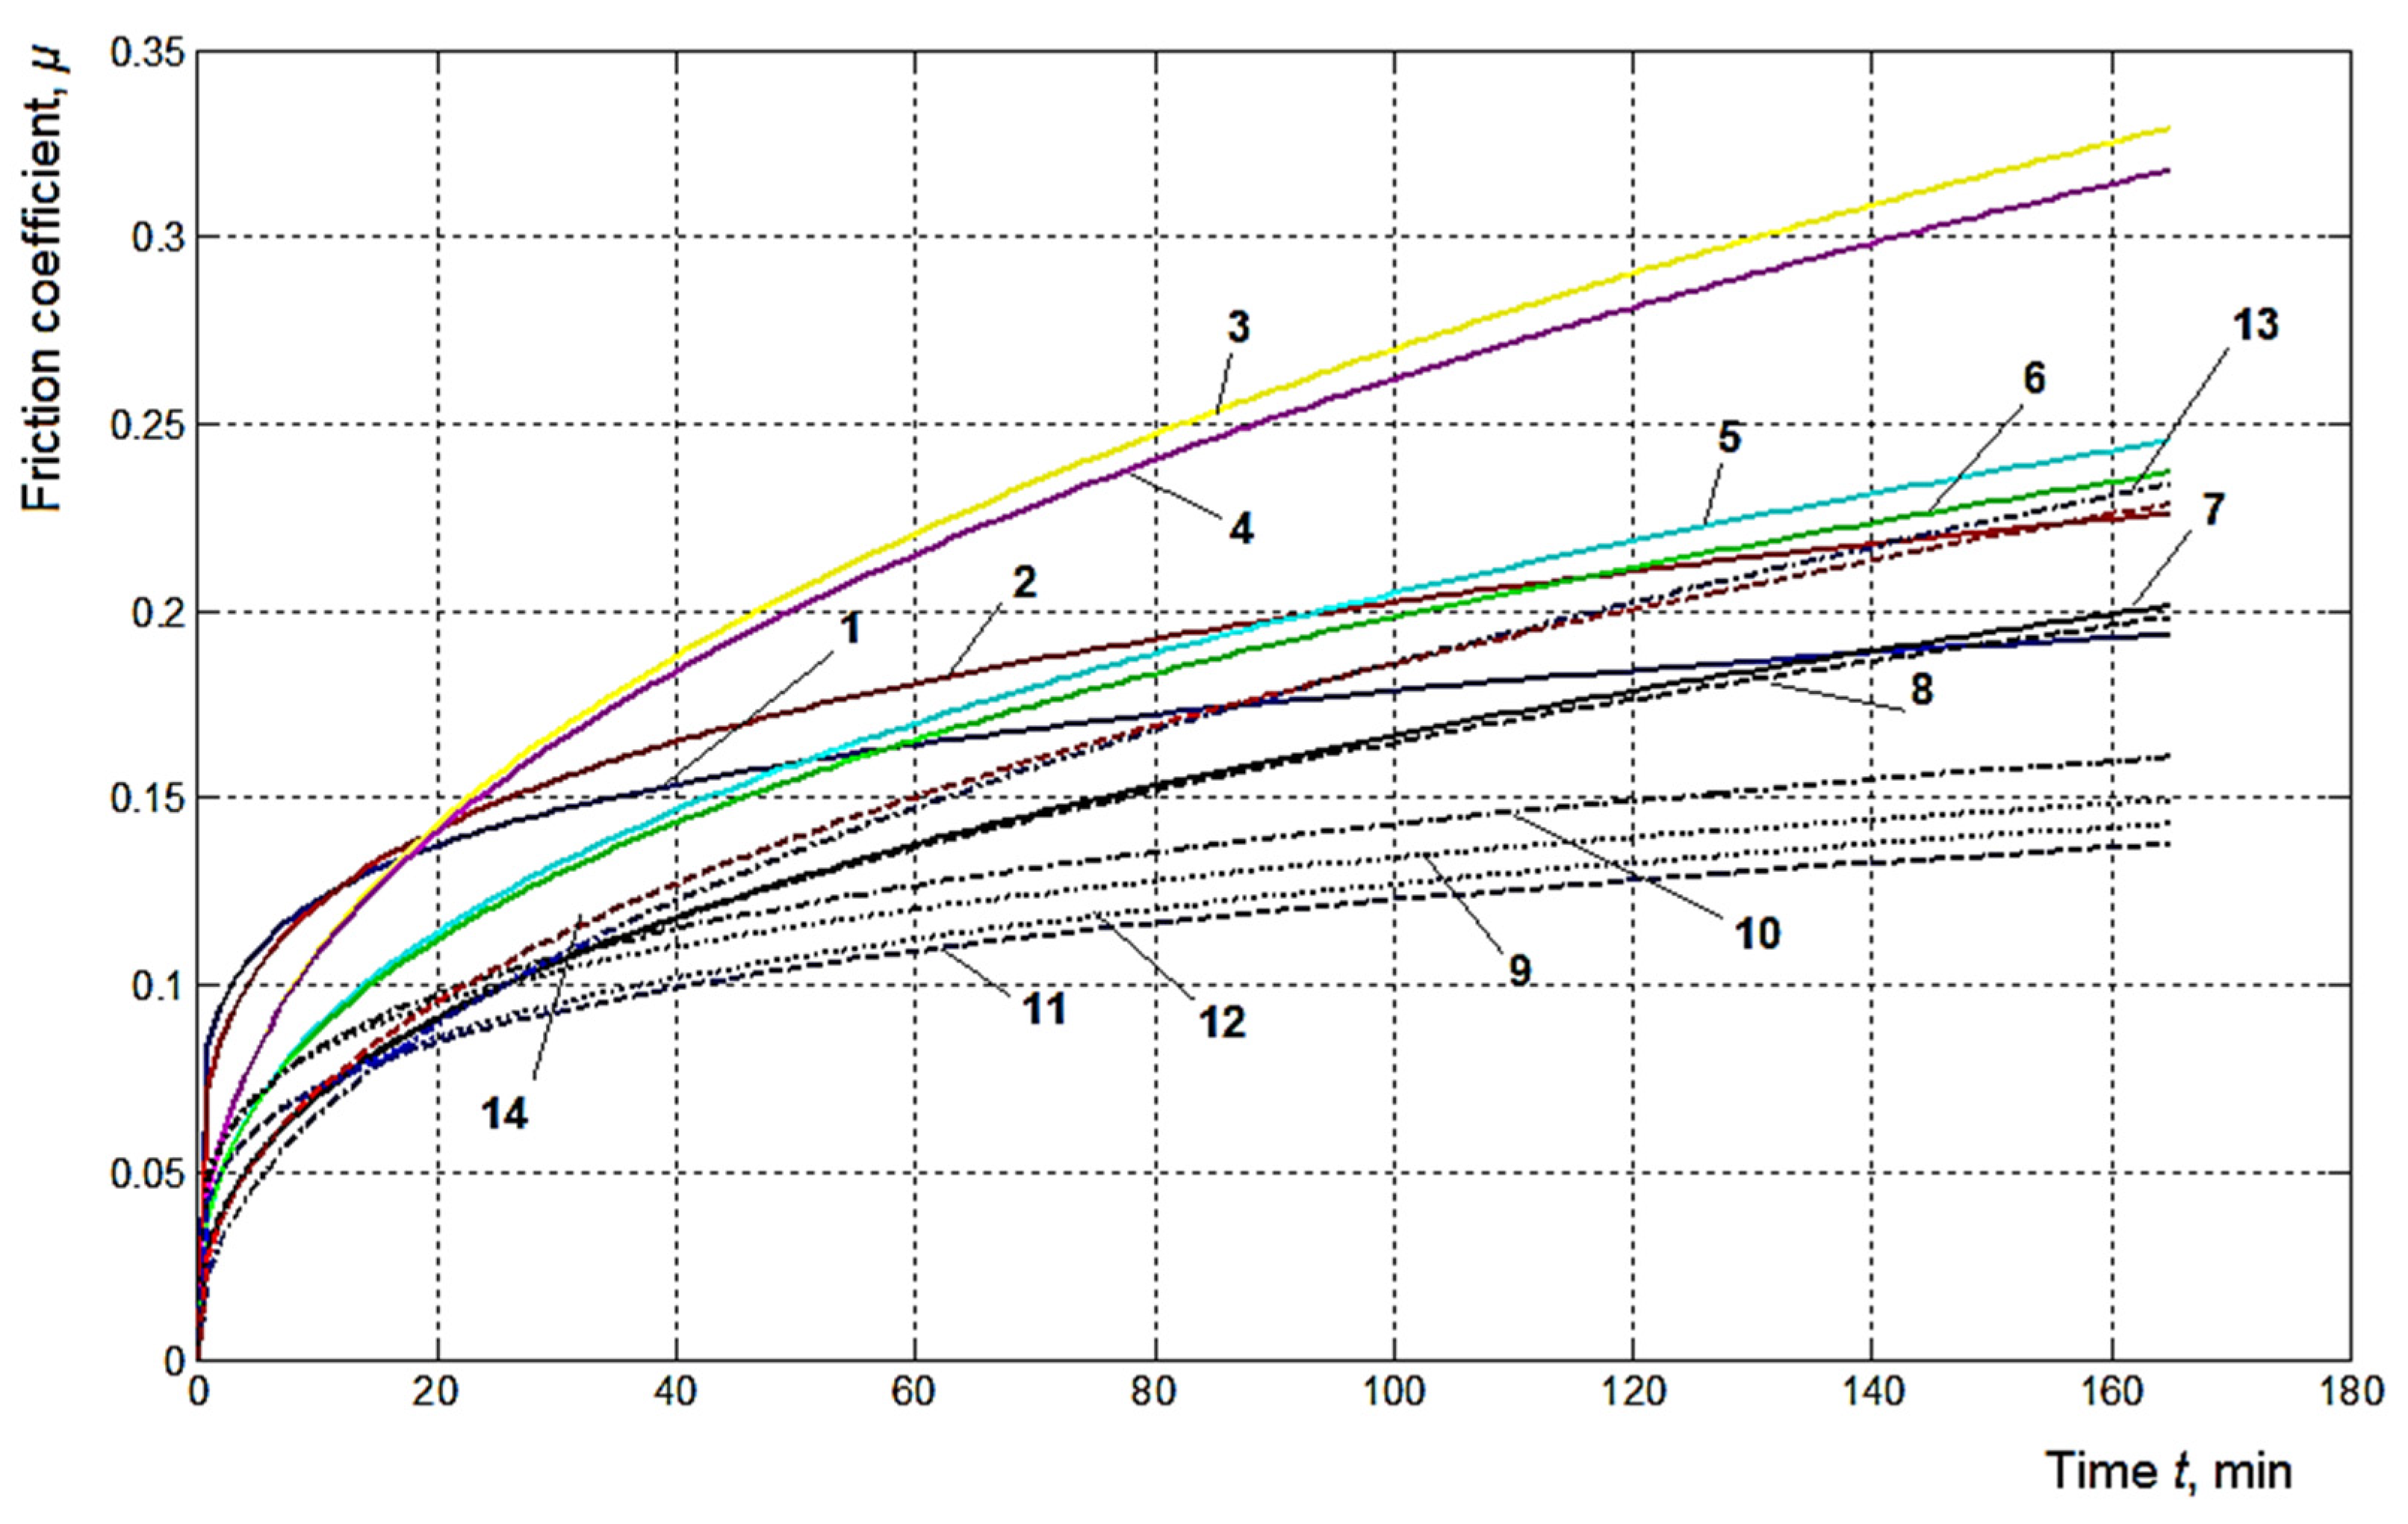
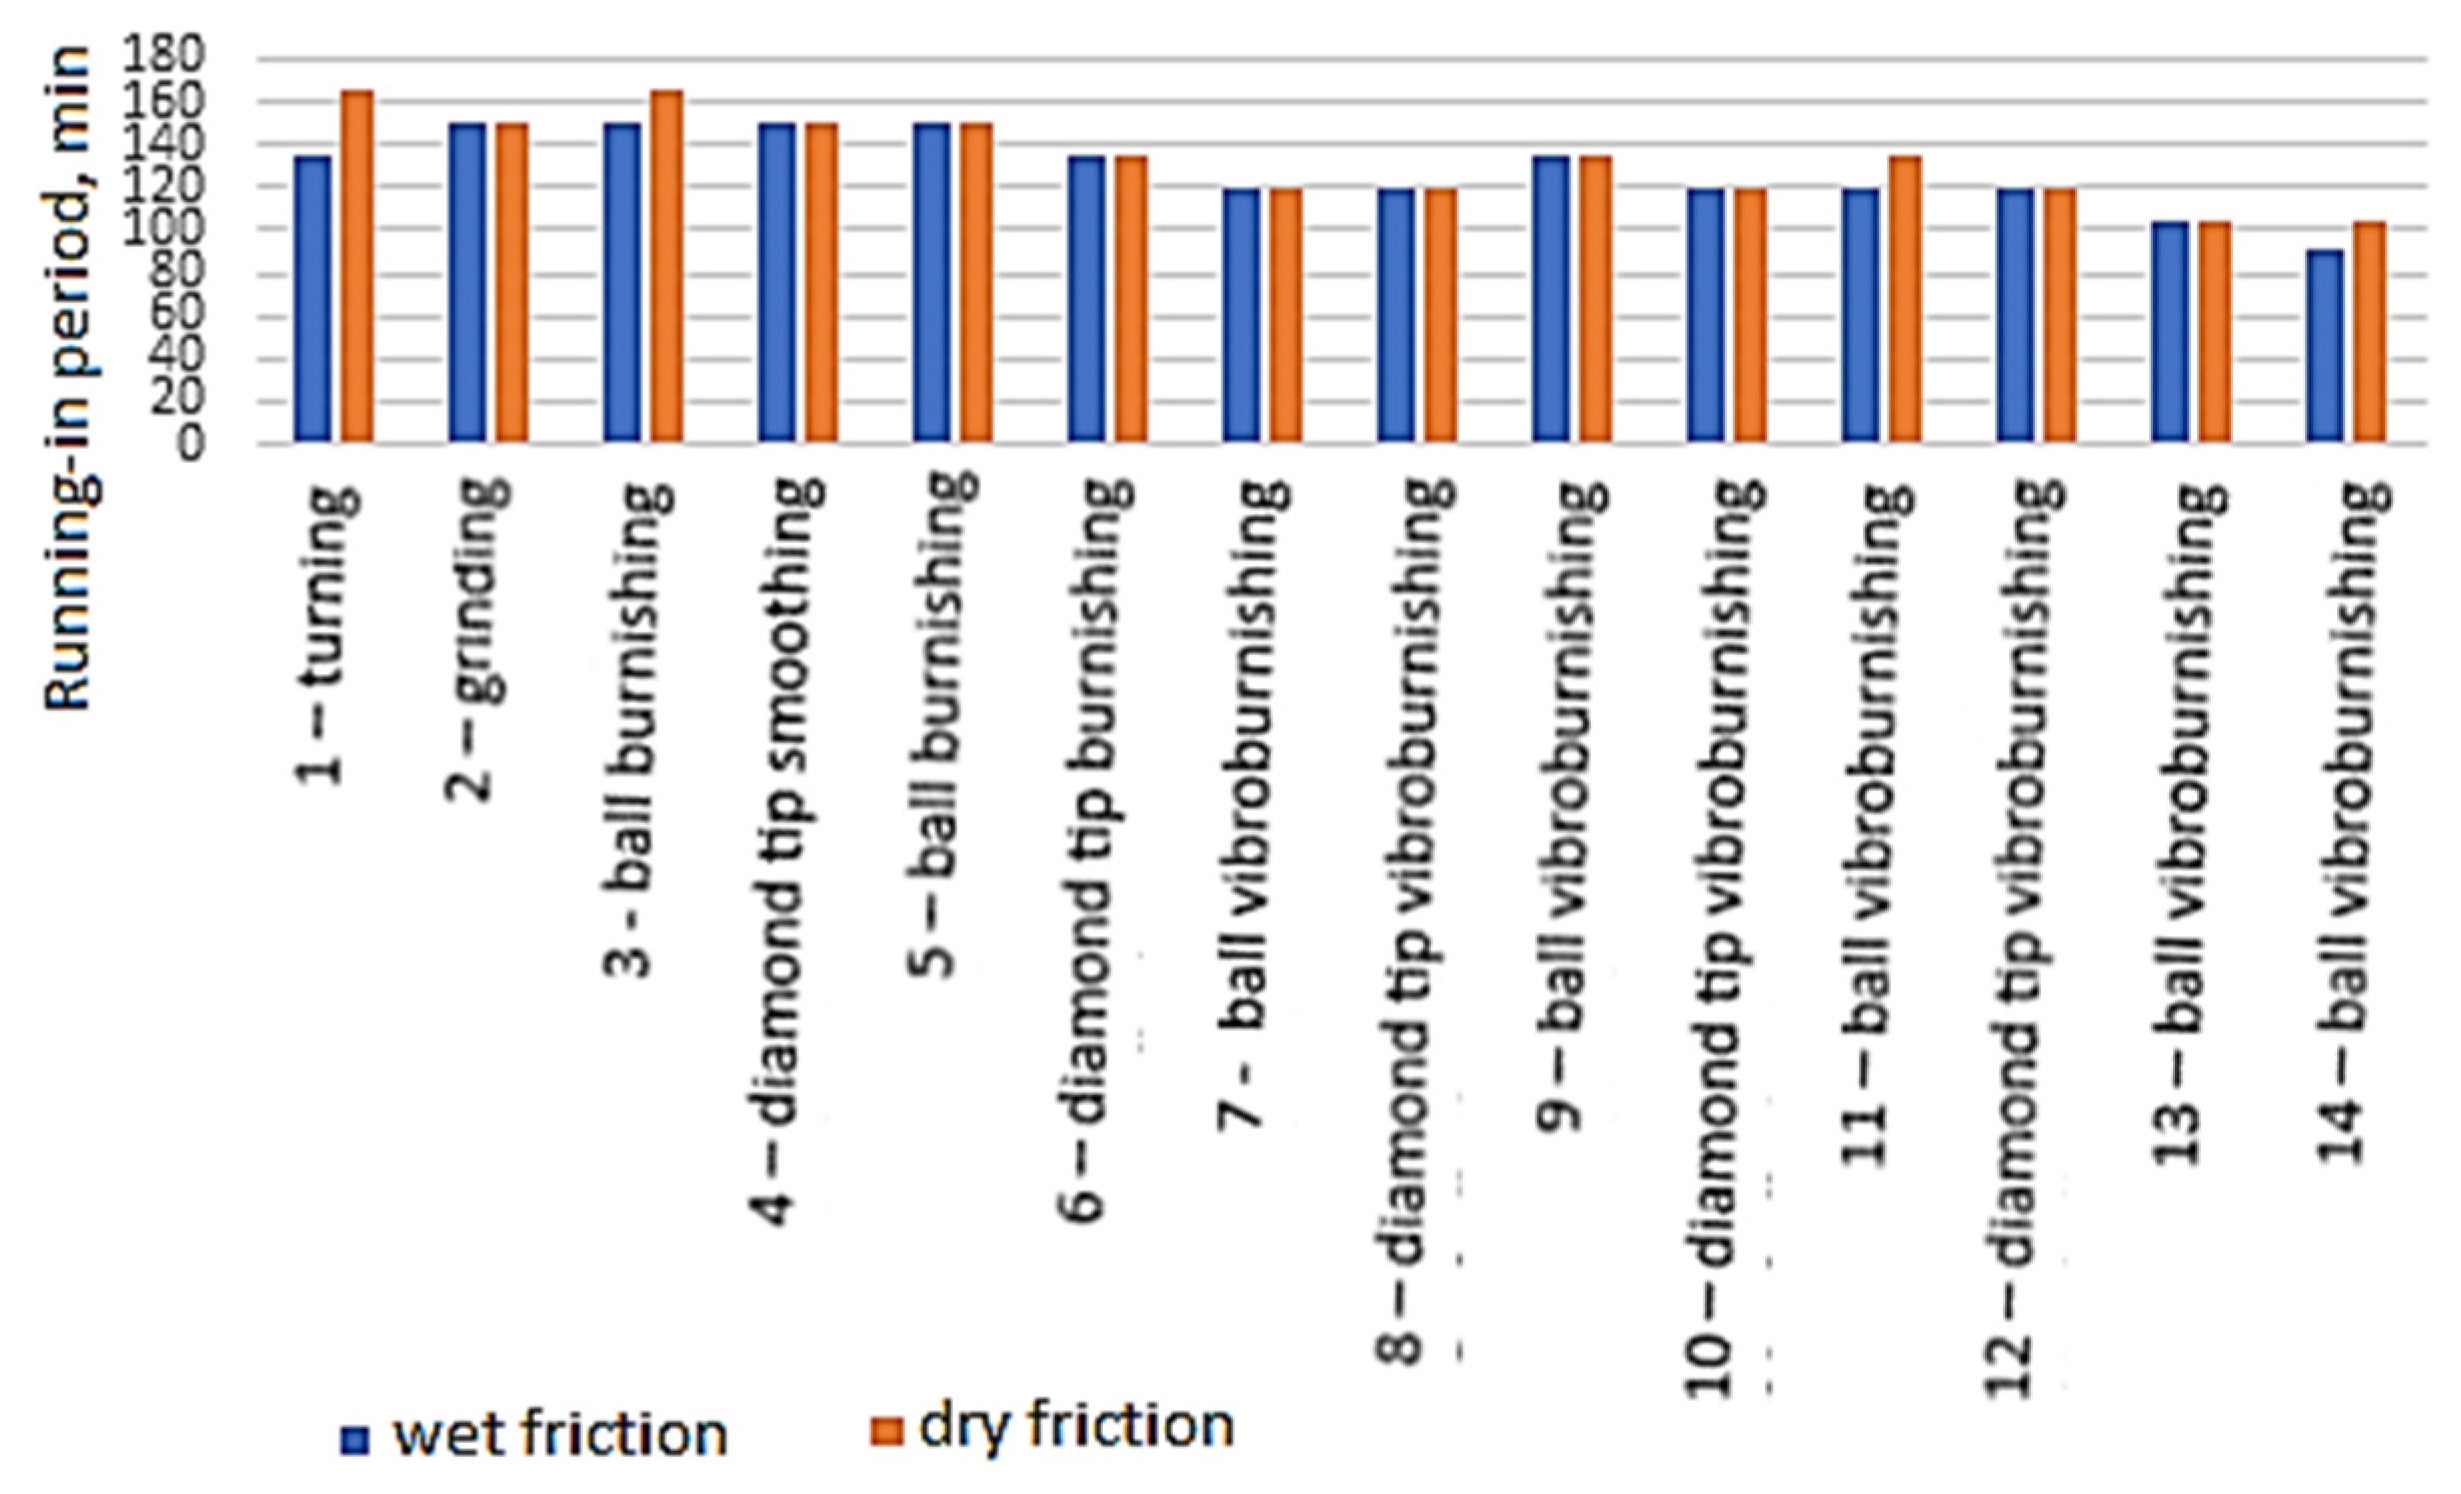
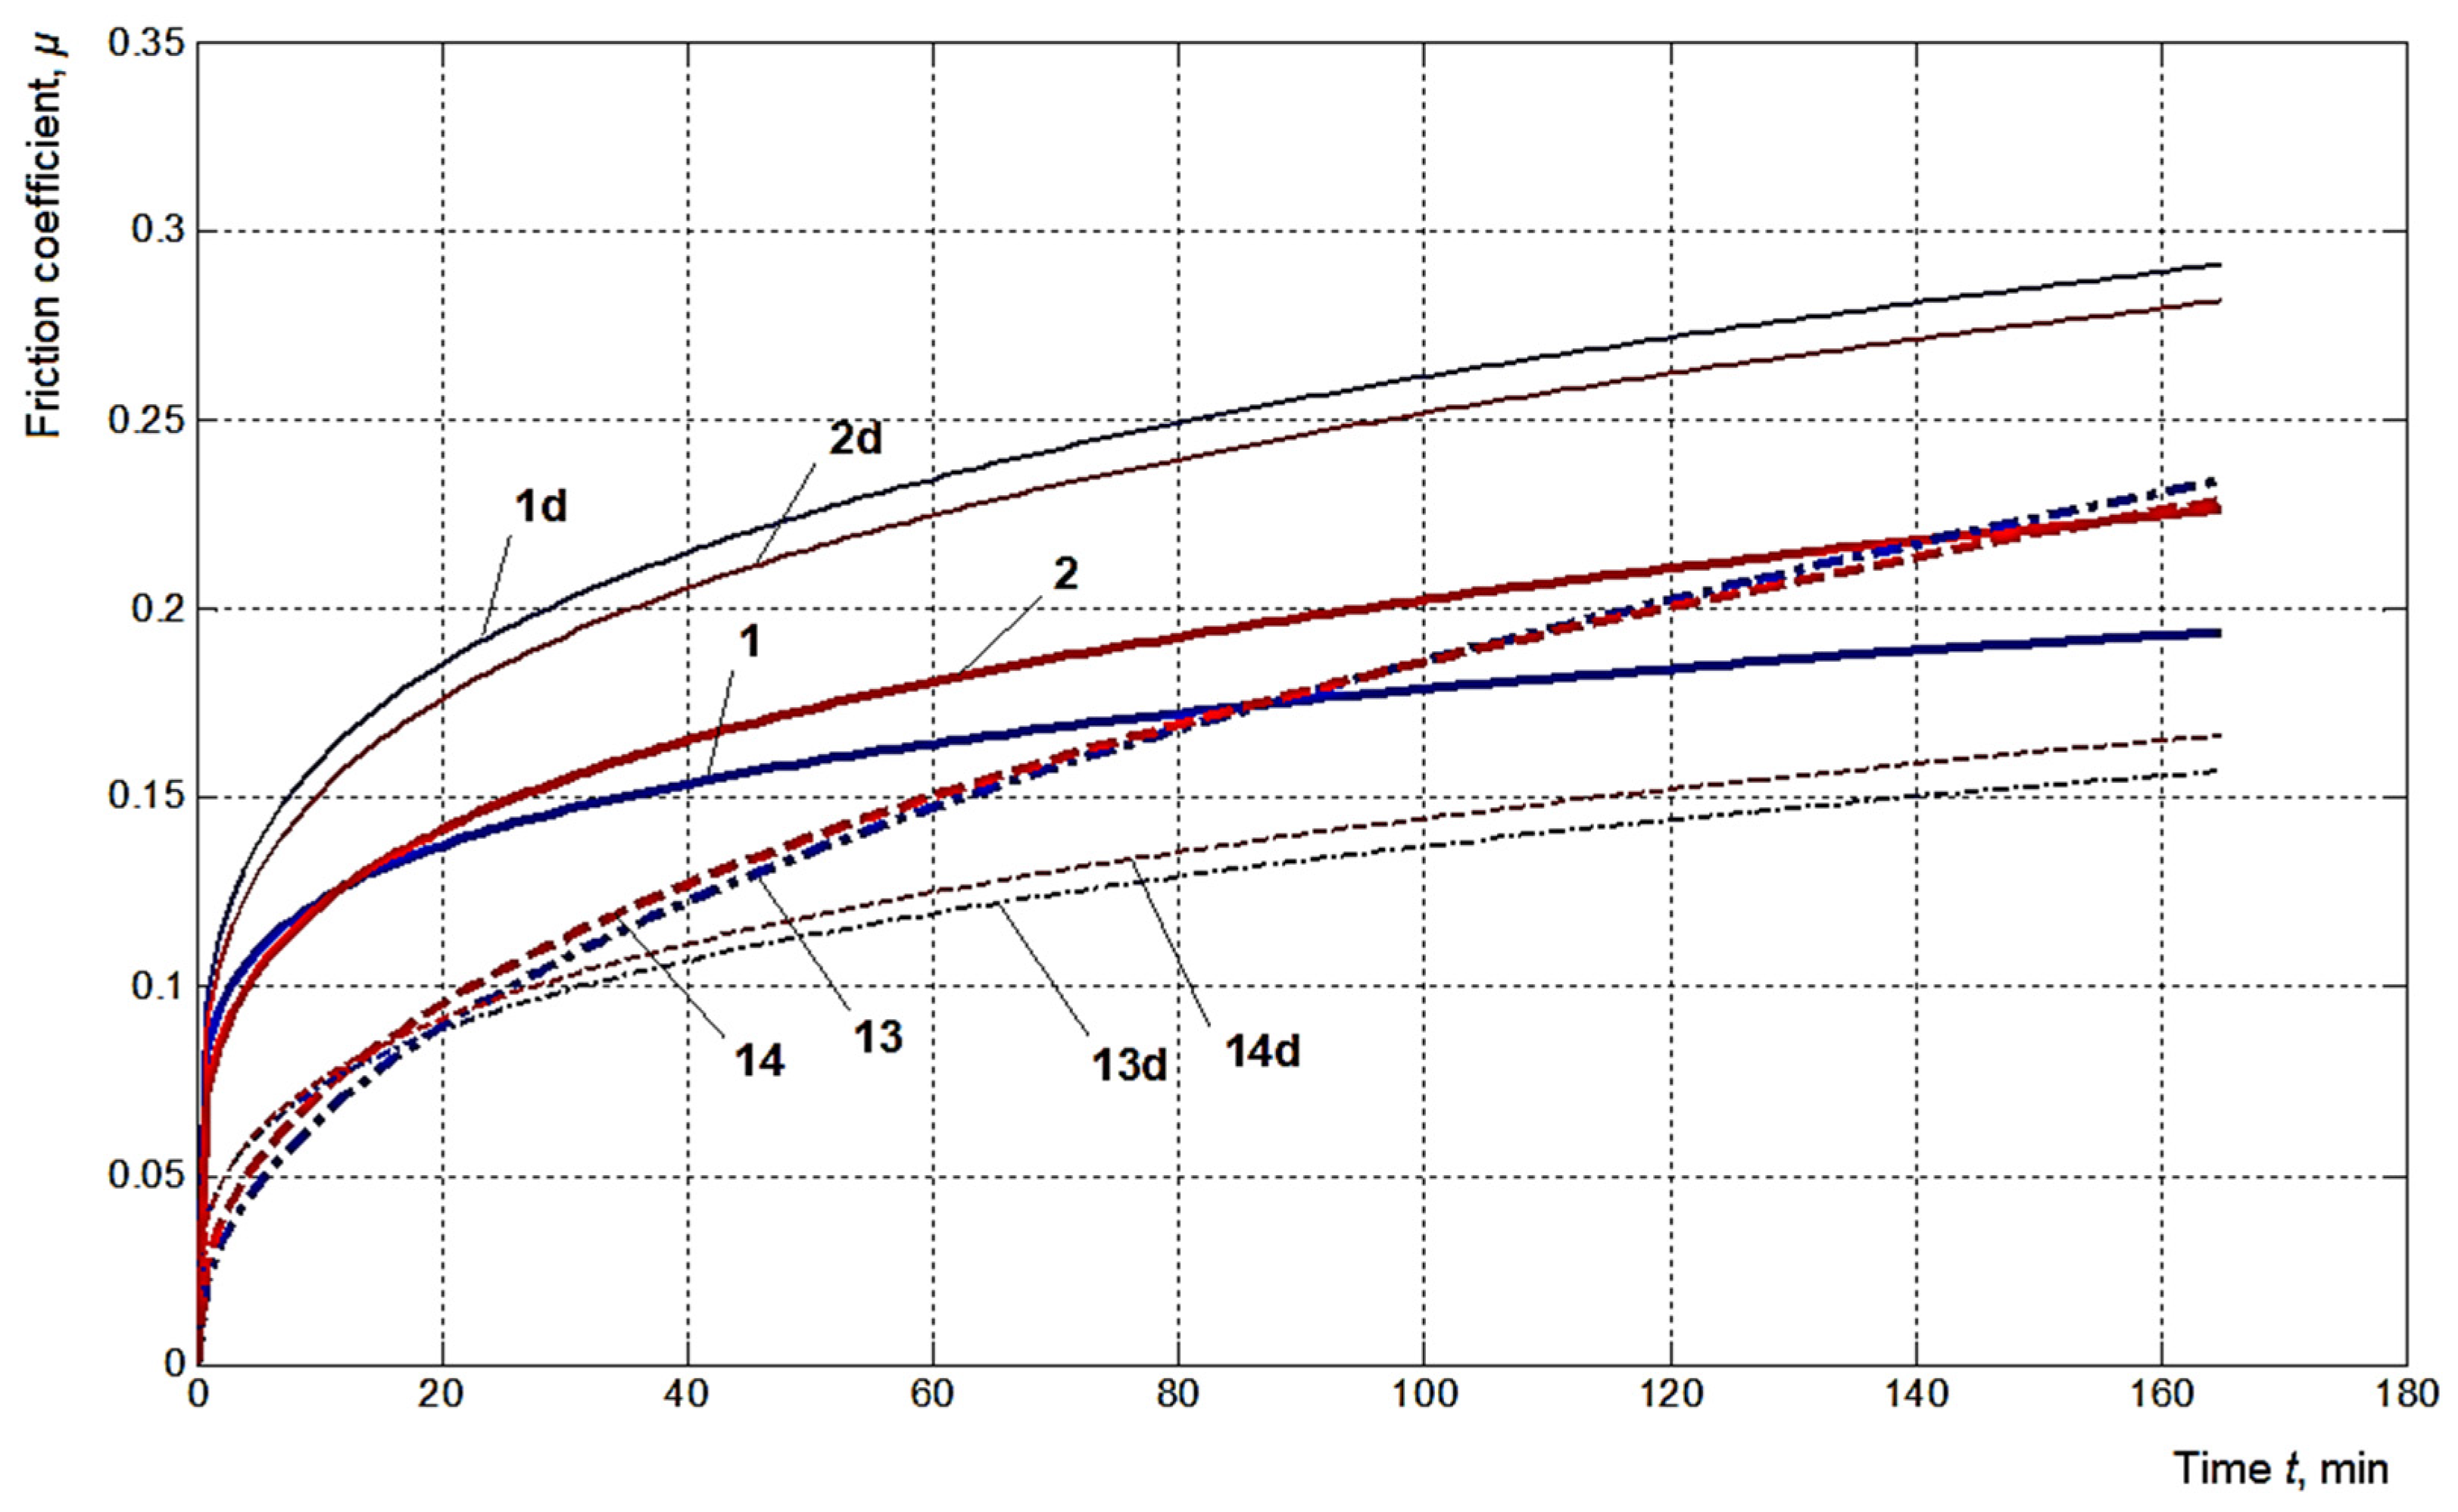
3. Results

The results obtained for the size of the friction coefficient determined by using Equation (2) were entered in Table 1 (in the case of dry friction) and, respectively, in Table 2 (in the case of lubricated friction).
Following another assessment of the extent to which the final value of the friction coefficient has changed from the initial value, in the last column of Table 1 and, respectively, in the penultimate column of Table 2, values of the ratio between the final value and the initial friction coefficient were included.
In the last column of Table 2, the values of the test durations at which the size of the friction coefficient starts to remain constant or approximately constant were mentioned, assuming that these values provide information on the running-in durations.
The experimental results were processed to evaluate the intensity of the process of increasing the value of the friction coefficient over time when aiming at the determination of empirical mathematical models of the power-type function to highlight the intensity of the influence exerted by the duration t of the test on the size of the friction coefficient factor µ. The mathematical models obtained in this way are included in Table 3. It was preferred to identify some mathematical models of the power function type, considering that for the interval of time variation (0–165 min), the change in the size of the friction coefficient µ will have a monotonous character without therefore presenting maxima or minima.

4. Discussion

The graphical representations in Figure 10, Figure 11 and Figure 12 were developed using the determined empirical mathematical models.
Analyzing the experimental results, the empirical mathematical models, and the graphic representations in Figure 10, Figure 11 and Figure 12 allowed the formulation of the observations mentioned below.
Thus, at the beginning of the experimental test, when the roughness parameter Ra is high, a high value of the friction coefficient µ is obtained, as expected. Thus, it is found that if, in the case of the surface generated by turning, at the time of initiation of the experimental test, the roughness parameter Ra had a value of 1.69 µm, this value corresponds to a value of the friction coefficient µ = 0.086 µm in the lubrication case and respectively µ = 0.10 µm when no lubrication is used. These values of the friction coefficient µ are higher than those corresponding to some surfaces for which the final processing methods have led to lower values of the roughness parameter Ra, as are the other processing methods, except for turning. Results of this type, i.e., higher values of the friction coefficient µ when the heights of the surface asperities considered were high, are also consistent with the results obtained by other researchers in similar situations [46].
Examining the diagrams in Figure 10, Figure 11, and Figure 13 shows that, in the first 5–7 min of the test, the increase in the value of the friction coefficient is quite intense, with the slope of each curve being quite high. Afterward, the increase in the value of the friction coefficient continues, but with a lower intensity of increase than the increase in the value of the friction coefficient from the first period. It can be stated that the more intense increase in the value of the friction coefficient in the first period is due to more serious damage to the asperity tips as a result of the friction between the pad and the outer surface of the tubular test sample. Other researchers also highlighted such an initial increase in the value of the friction coefficient µ, followed by the subsequent maintenance of a somewhat constant coefficient value over time [46,47,48].
The evolution over time of the friction coefficient size can be put in a certain correlation with the evolution during the running-in period of the magnitude of a roughness parameter that takes into account the asperity heights of the investigated surface, such as the roughness parameter Ra. It is thus known that, during the running-in period, regardless of the initial value of the roughness parameter, the heights of the asperities decrease or increase until they reach a value judged to be appropriate for the operating conditions of the joint, after which the heights of the asperities remain somewhat constant for a long time, that is, until the occurrence of catastrophic wear is signaled [49,50].
As part of the research on lubricated friction, experimental tests were carried out until three consecutive tests at 12-minute intervals showed that the friction coefficient µ remained approximately at the same value. As previously mentioned, the time variation of the size of the friction coefficient can be correlated with the time variation of the value of the roughness parameter Ra. Suppose the running-in period is considered to end when the values of the friction coefficient µ do not change over time or are characterized by insignificant changes. In that case, it can be considered that the duration of the test until the entry into the regime of keeping the friction coefficient µ constant provides some information on the duration of the running-in. For this reason, in the last column of Table 1, the durations of the tests at which no changes in the size of the friction coefficient µ were observed were entered.
The analysis of the values of the exponents attached to the independent variable time t in the mathematical models included in Table 3 shows that in the case of lubricated friction, the lowest value (0.164) corresponds to processing method no. 1 (turning). In contrast, the highest value (0.457) was obtained for processing method no. 13 (ball vibroburnishing). It is therefore found that the intensity of changing the value of the friction coefficient µ is lower when the initial value of the roughness is high, and, respectively, this intensity is higher for surfaces characterized by lower values of the roughness parameter Ra. This is also reflected in the values of the ratio between the final value of the friction coefficient µ and the value of the same friction coefficient µ after a test duration of 165 min. Indeed, as seen from the last column of Table 1, the increase in the value of the friction coefficient µ is 64% in the case of processing method no. 1 (turning) and 132% in the case of processing method no. 13 (ball vibroburnishing).
The diagram in Figure 13 allows a comparison of the durations of the running-in periods corresponding to the type of joint investigated, in the case of lubricated friction and dry friction, respectively. It is thus found that, in general, the durations of the running-in periods are shorter in the case of lubricated friction. This means that such a joint reaches the working conditions corresponding to the normal use of the joint more quickly.
The diagram in Figure 13 provides conditions for comparing how the increase in the value of the friction coefficient µ takes place in the case of lubricated and dry friction, respectively. From examining this graphical representation, it can be seen that, as expected, the values of the friction coefficient µ are lower in the case of lubricated friction compared to the values of the friction coefficient determined in the case of dry friction.
From the examination of the information included in Table 3 and Figure 13, it can be seen that the use of H20 hydraulic oil as a lubricant between the pad and the tubular test sample contributes to a significant reduction in the magnitude of the friction coefficient, and this is essentially due to the good lubricating qualities of the oil. Although this oil is mainly used for materializing the movements of mobile components in hydraulic systems, the lubricating qualities of the oil have also determined its use to reduce friction between moving parts. As with other liquid lubricants, the hydraulic oil film is believed to significantly reduce the surface areas of the two surfaces in direct contact and the areas where interweaving of asperity tips occurs.
The ratios entered in the last column of Table 2 consider the final and initial values of the friction coefficient for each experimental test. It is thus established that the minimum value of the ratio was 1.488 (for process no. 1—turning) and the maximum was 3.05 (for process no. 13—ball vibroburnishing), which reflects an increase of 48.8% and 205% of the friction coefficient for the 165-minute duration of the test and for the conditions of performing the experimental tests.

5. Conclusions

A brief theoretical analysis of the friction conditions specific to the operation of a mobile joint on cylindrical surfaces showed that it is possible that the value of the friction coefficient can change over time. Such a mobile joint can be the spindle-bearing type. An analysis using the finite element method of certain processes in the contact area highlighted some aspects of interest from a tribological point of view. A research device adaptable to a universal lathe was used for experimental research. The device facilitated the investigation of the change over time of the dry and lubricated friction coefficient values for outer cylindrical surfaces finished by different processing methods. The results of experimental research were modeled mathematically. An increase in time of the friction coefficient up to a certain value, specific to certain friction conditions, was observed. The results also provide an image of the change in the value of the friction coefficient during the running-in period of a part of the equipment that incorporates mobile shaft-bearing joints. The experimental results revealed an increase in the value of the friction coefficient under conditions of lubricated friction of 48.8–205%. Empirical mathematical models of power-type functions highlighted the change in time of the value of the dry and lubricated friction coefficient in the case of outer cylindrical surfaces previously generated by different processing methods. In the future, it is intended to expand the experimental research by considering the possible influence exerted by several other factors on the evolution over time of the size of the friction coefficient.

Author Contributions

Conceptualization, G.N. and L.S.; methodology, O.D.; software, G.N. and A.M.M.; validation, L.S.; formal analysis, A.H.; investigation, G.N. and V.M.; writing—original draft preparation, L.S., A.M.M. and A.H.; writing—review and editing, O.D. and A.H.; visualization, A.H.; supervision, G.N. and A.H.; project administration, G.N. All authors have read and agreed to the published version of the manuscript.

Funding

This research received no external funding.

Data Availability Statement

The authors will respond to requests for additional information regarding the research undertaken and the results obtained.

Conflicts of Interest

The authors declare no conflict of interest.

References

  1. Marian, M.; Tremmel, S. Current Trends and Applications of Machine Learning in Tribology—A Review. Lubricants 2021, 9, 86. [Google Scholar] [CrossRef]
  2. Costa, H.L.; Schille, J.; Rosenkranz, A. Tailored Surface Textures to Increase Friction—A review. Friction 2022, 10, 1285–1304. [Google Scholar] [CrossRef]
  3. Li, M.; Shi, W.; Shi, J.; Wang, T.; Shi, L.; Wang, X. Regulation and Control of Wet Friction of Soft Materials Using Surface Texturing: A Review. Friction 2023, 11, 333–353. [Google Scholar] [CrossRef]
  4. Rosenkranz, A.; Grützmacher, P.G.; Gachot, C.; Costa, H.L. Surface Texturing in Machine Elements—A Critical Discussion for Rolling and Sliding Contacts. Adv. Eng. Mater. 2019, 21, 1900194. [Google Scholar] [CrossRef]
  5. Hou, Q.; Yang, X.; Cheng, J.; Wang, S.; Duan, D.; Xiao, J.; Li, W. Optimization of Performance Parameters and Mechanism of Bionic Texture on Friction Surface. Coatings 2020, 10, 171. [Google Scholar] [CrossRef]
  6. Murzin, S.P.; Balyakin, V.; Liedl, G.; Melnikov, A.A.; Fürbacher, R. Improving Tribological Properties of Stainless Steel Surfaces by Femtosecond Laser Irradiation. Coatings 2020, 10, 606. [Google Scholar] [CrossRef]
  7. Bai, L.; Sun, J.; Zhang, P.; Khan, Z.A. Friction Behavior of a Textured Surface against Several Materials Under Dry and Lubricated Conditions. Materials 2021, 14, 5228. [Google Scholar] [CrossRef] [PubMed]
  8. Cuao Moreu, C.A.; Maldonado Cortés, D.; Lara Banda, M.d.R.; García Sánchez, E.O.; Zambrano Robledo, P.; Hernández Rodríguez, M.A.L. Surface, Chemical, and Tribological Characterization of an ASTM F-1537 Cobalt Alloy Modified through an Ns-Pulse Laser. Metals 2021, 11, 1719. [Google Scholar] [CrossRef]
  9. Wos, S.; Koszela, W.; Pawlus, P. Selected Methods and Applications of Anti-Friction and Anti-Wear Surface Texturing. Materials 2021, 14, 3227. [Google Scholar] [CrossRef]
  10. Bhaumik, S.; Paleu, V.; Chowdhury, D.; Batham, A.; Sehgal, U.; Bhattacharya, B.; Ghosh, C.; Datta, S. Tribological Investigation of Textured Surfaces in Starved Lubrication Conditions. Materials 2022, 15, 8445. [Google Scholar] [CrossRef]
  11. Marian, M.; Almqvist, A.; Rosenkranz, A.; Fillon, M. Numerical micro-texture optimization for lubricated contacts—A critical discussion. Friction 2022, 10, 1772–1809. [Google Scholar] [CrossRef]
  12. Wei, Y.; Resendiz, J.; Tomkowski, R.; Liu, X. An Experimental Study of Micro-Dimpled Texture in Friction Control under Dry and Lubricated Conditions. Micromachines 2022, 13, 70. [Google Scholar] [CrossRef]
  13. Cheng, H.; Zhou, F.; Fei, Z. Dry Friction Properties of Friction Subsets and Angle Related to Surface Texture of Cemented Carbide by Femtosecond Laser Surface Texturing. Coatings 2023, 13, 741. [Google Scholar] [CrossRef]
  14. Evangelista, I.; Wencel, D.; Beguin, S.; Zhang, N.; Gilchrist, M.D. Influence of Surface Texturing on the Dry Tribological Properties of Polymers in Medical Devices. Polymers 2023, 15, 2858. [Google Scholar] [CrossRef]
  15. Hao, L.; Meng, Y.; Chen, C. Experimental Investigation on Effects of Surface Texturing on Lubrication of Initial Line Contacts. Lubr. Sci. 2014, 26, 363–373. Available online: https://onlinelibrary.wiley.com/doi/epdf/10.1002/ls.1265 (accessed on 19 September 2023). [CrossRef]
  16. Sanguedolce, M.; Zekonyte, J.; Alfano, M. Wear of 17-4 PH Stainless Steel Patterned Surfaces Fabricated Using Selective Laser Melting. Appl. Sci. 2021, 11, 9317. [Google Scholar] [CrossRef]
  17. Wang, W.; Zhao, W.; Liu, Y.; Zhang, H.; Hua, M.; Dong, G.; Tam, H.Y.; Chin, K.S. A Pocket-Textured Surface for Improving the Tribological Properties of Point Contact under Starved Lubrication. Materials 2021, 14, 1789. [Google Scholar] [CrossRef] [PubMed]
  18. Slavov, S.; Dimitrov, D.; Konsulova-Bakalova, M.; Vasileva, D. Impact of Ball Burnished Regular Reliefs on Fatigue Life of AISI 304 and 316L Austenitic Stainless Steels. Materials 2021, 14, 2529. [Google Scholar] [CrossRef]
  19. Li, C.; Yang, X.; Wang, S.; Wang, Y.; Lu, C.; Cao, J. Study on Friction and Lubrication Characteristics of Surface with Unidirectional Convergence Texture. Coatings 2019, 9, 780. [Google Scholar] [CrossRef]
  20. Du, F.; Li, D.; Sa, X.; Li, C.; Yu, Y.; Li, C.; Wang, J.; Wang, W. Overview of Friction and Wear Performance of Sliding Bearings. Coatings 2022, 12, 1303. [Google Scholar] [CrossRef]
  21. Dzyura, V.; Maruschak, P.; Slavov, S.; Dimitrov, D.; Semehen, V.; Markov, O. Evaluating Some Functional Properties of Surfaces with Partially Regular Microreliefs Formed by Ball-Burnishing. Machines 2023, 11, 633. [Google Scholar] [CrossRef]
  22. Ren, Y.; Huang, Z.; Wang, Y.; Zhou, Q.; Yang, T.; Li, Q.; Jia, Q.; Wang, H. Friction-Induced Rapid Amorphization in A Wear-Resistant (CoCrNi)88Mo12 Dual-Phase Medium-Entropy Alloy at Cryogenic Temperature. Compos. Part B Eng. 2023, 263, 110833. [Google Scholar] [CrossRef]
  23. Ye, W.; Xie, M.; Huang, Z.; Wang, H.; Zhou, Q.; Wang, L.; Chen, B.; Wang, H.; Liu, W. Microstructure and Tribological Properties of In-Situ Carbide/CoCrFeNiMn High Entropy Alloy Composites Synthesized by Flake Powder Metallurgy. Tribol. Int. 2023, 181, 108295. [Google Scholar] [CrossRef]
  24. Mizushima, K.; Suzuki, Y.; Tsuji, T.; Watanabe, T. Deformable fingertip with a friction reduction system based on lubricating effect for smooth operation under both dry and wet conditions. Adv. Robot. 2013, 33, 1–12. [Google Scholar] [CrossRef]
  25. Leszczyńska-Madej, B.; Madej, M.; Hrabia-Wiśnios, J. Effect of Chemical Composition on the Microstructure and Tribological Properties of Sn-Based Alloys. J. Mater. Eng. Perform. 2019, 28, 4065–4073. [Google Scholar] [CrossRef]
  26. Zabala, A.; Galdos, L.; Childs, C.; Llavori, I.; Aginagalde, A.; Mendiguren, J.; Saenz de Argandoña, E. The Interaction between the Sheet/Tool Surface Texture and the Friction/Galling Behaviour on Aluminium Deep Drawing Operations. Metals 2021, 11, 979. [Google Scholar] [CrossRef]
  27. Söderfjäll, M.; Gachot, C. Friction Reduction by Dimple Type Textured Cylinder Liners—An Experimental Investigation. Materials 2023, 16, 665. [Google Scholar] [CrossRef]
  28. Sun, J.; Bai, L.; Guo, F.; Khan, Z.A. Experimental Study on the Effect of Micro-Texture on EHL Point-Contact Film Thickness Subject to Sliding Conditions. Materials 2022, 15, 7926. [Google Scholar] [CrossRef] [PubMed]
  29. Wang, H.; Bie, W.; Zhang, S.; Liu, T. Theoretical and Experimental Study of Friction Characteristics of Textured Journal Bearing. Micromachines 2023, 14, 577. [Google Scholar] [CrossRef] [PubMed]
  30. Conradi, M.; Drnovšek, A.; Gregorčič, P. Wettability and Friction Control of a Stainless Steel Surface by Combining Nanosecond Laser Texturing and Adsorption of Superhydrophobic Nanosilica Particles. Sci. Rep. 2018, 8, 7457. [Google Scholar] [CrossRef]
  31. Murzin, S.P.; Balyakin, V.B.; Gachot, C.; Fomchenkov, S.A.; Blokhin, M.V.; Kazanskiy, N.L. Ultraviolet Nanosecond Laser Treatment to Reduce the Friction Coefficient of Silicon Carbide Ceramics. Appl. Sci. 2021, 11, 11906. [Google Scholar] [CrossRef]
  32. Moldovan, E.R.; Concheso Doria, C.; Ocaña, J.L.; Baltes, L.S.; Stanciu, E.M.; Croitoru, C.; Pascu, A.; Roata, I.C.; Tierean, M.H. Wettability and Surface Roughness Analysis of Laser Surface Texturing of AISI 430 Stainless Steel. Materials 2022, 15, 2955. [Google Scholar] [CrossRef] [PubMed]
  33. Capilla-González, G.; Martínez-Ramírez, I.; Díaz-Infante, D.; Hernandez-Rodríguez, E.; Alcántar-Camarena, V. Effect of the Ball Burnishing on the Surface Quality and Mechanical Properties of a TRIP Steel Sheet. Int. J. Adv. Manuf. Technol. 2021, 116, 3953–3964. [Google Scholar] [CrossRef]
  34. Skoczylas, A.; Zaleski, K.; Matuszak, J.; Ciecieląg, K.; Zaleski, R.; Gorgol, M. Influence of Slide Burnishing Parameters on the Surface Layer Properties of Stainless Steel and Mean Positron Lifetime. Materials 2022, 15, 8131. [Google Scholar] [CrossRef]
  35. Grützmacher, P. Controlling Friction by Multi-Scale Surface Patterning inside and outside the Contact Zone. Ph.D. Thesis, Universitat des Saarlandes, Saarbrucken, Germany, 2019. Available online: https://publikationen.sulb.uni-saarland.de/handle/20.500.11880/28283 (accessed on 19 September 2023).
  36. Gorohov, V.A. Part Processing by Plastic Deformation; Publishing House Tehnika: Kiev, Ukraine, 1978. [Google Scholar]
  37. Odintsov, L.G. Better Wear-Resistance of Hydraulic Unit Parts by Vibratory Burnishing. Russ. Eng. J. 1979, 59, 22–24. [Google Scholar]
  38. Shneider, G. Performance Properties of Parts with Regular Microrelief; Publishing house Mashinostroenie: Leningrad, Russia, 1982. (In Russian) [Google Scholar]
  39. Berce, P.; Roș, O. Experimental Researches Concerning the Vibroburnishing of the External Cylindrical Surfaces. Mach. Manuf. 1994, 1–2, 86–89. (In Romanian) [Google Scholar]
  40. Lee, A. In Our Element: What Value for Coefficient of Friction Should I Use in My Calculations. Available online: https://materion.com/about/new-at-materion/in-our-element-what-value-for-coefficient-of-friction-should-i-use-in-my-calculations (accessed on 18 August 2023).
  41. Nagîț, G.; Slatineanu, L.; Dodun, O.; Mihalache, A.M.; Rîpanu, M.I. Influence of Some Microchanges Generated by Different Processing Methods on Selected Tribological Characteristics. Micromachines 2022, 13, 29. [Google Scholar] [CrossRef] [PubMed]
  42. Borawski, A. Impact of Operating Time on Selected Tribological Properties of the Friction Material in the Brake Pads of Passenger Cars. Materials 2021, 14, 884. [Google Scholar] [CrossRef] [PubMed]
  43. Nagîţ, G.; Slătineanu, L.; Dodun, O.; Rîpanu, M.I.; Mihalache, A.M. Surface Layer Microhardness and Roughness after Applying a Vibroburnishing Process. J. Mater. Res. Technol. 2019, 8, 4333–4346. [Google Scholar] [CrossRef]
  44. Nagîţ, G.; Slătineanu, L.; Merticaru, V.; Rîpanu, M.I.; Mihalache, A.M.; Tăbăcaru, L.; Boca, M. Analysis of a Device for Texturing by Burnishing Using Principles from Axiomatic Design. In Proceedings of the 11th International Conference on Axiomatic Design (ICAD 2017), Iasi, Romania, 13–15 September 2017; Volume 127, p. 01021. [Google Scholar] [CrossRef]
  45. Nagîț, G.; Braha, V.; Slatineanu, L. Vibration Rolling Device. Romanian Patent 116954, 10 January 1996. Available online: https://worldwide.espacenet.com/patent/search/family/064360902/publication/RO116954B1?q=Nag%C3%AE%C5%A3 (accessed on 20 October 2021).
  46. Wen, Q.; Liu, M.; Zhang, Z.; Sun, Y. Experimental Investigation into the Friction Coefficient of Ball-on-Disc in Dry Sliding Contact Considering the Effects of Surface Roughness, Low Rotation Speed, and Light Normal Load. Lubricants 2022, 10, 256. [Google Scholar] [CrossRef]
  47. Hansen, J. Elasto-Hydrodynamic Film Formation in Heavily Loaded Rolling-Sliding Contacts Influence of Surface Topography on the Transition between Lubrication Regimes. Ph.D. Thesis, Luleå University of Technology, Luleå, Sweden, 2021. Available online: https://www.diva-portal.org/smash/get/diva2:1527353/FULLTEXT01.pdf (accessed on 19 September 2023).
  48. Hansen, J.; Björling, M.; Larsson, R. Topography Transformations Due to Running-In of Rolling-Sliding Non-Conformal Contacts. Tribol. Int. 2020, 144, 106126. [Google Scholar] [CrossRef]
  49. Chou, C.C.; Lin, J.F. Tribological Effects of Roughness and Running-In on Oil-Lubricated Line Contacts. Proc. Inst. Mech. Eng. J J. Eng. Tribol. 1997, 211, 209–222. [Google Scholar] [CrossRef]
  50. Sakhamuri, M.S.D.; Harvey, T.J.; Vierneusel, B.; Wood, R.J.K. Wear Induced Changes in Surface Topography During Running-In of Rolling-Sliding Contacts. Wear 2023, 522, 204685. [Google Scholar] [CrossRef]
Figure 1. Changing the friction conditions between the pad and the test sample in the presence of the liquid lubricant.
Lubricants 11 00436 g001
Figure 2. Texturing of an external cylindrical surface by vibroburnishing using a diamond tip (a) and a ball (b) (nw—rotation of the workpiece, f—longitudinal feed rate, fv—vibration movement).
Lubricants 11 00436 g002
Figure 3. Categories of microreliefs that can be achieved through different vibroburnishing processes: (a)—microrelief of the first category (I, channels do not intersect); (b)—microrelief of the second category (II, channels are tangent); (c)—microrelief of the third category (III, channels partially overlap); (d)—tetragonal microrelief of the fourth category (IV); (e)—hexagonal microrelief of the fourth category (IV).
Lubricants 11 00436 g003
Figure 4. Generation of cylindrical surfaces by turning (a) and grinding (b) (nw—rotation of the workpiece, nT—rotation of the tool, f—longitudinal feed movement).
Lubricants 11 00436 g004
Figure 5. Pressing the pad on the rotating test sample.
Lubricants 11 00436 g005
Figure 6. The working scheme used to determine the magnitude of the friction torque Mf.
Lubricants 11 00436 g006
Figure 7. Graphical representations of setup conditions; (a)—view of available coordinate systems; (b)—mesh distribution.
Lubricants 11 00436 g007
Figure 8. Graphical representations of connections: (a)—view of available contacts; (b)—view of available joints; (c)—graphical representations of remote supports.
Lubricants 11 00436 g008
Figure 9. Graphical representations of deformation distribution along three axes: (a)—dry friction; (b)—friction with lubrication.
Lubricants 11 00436 g009
Figure 10. Time evolution of the value of the coefficient of friction for surfaces obtained by applying different final processing methods or with different values of the processing parameters under lubricated friction conditions, according to the established empirical mathematical models.
Lubricants 11 00436 g010
Figure 11. Time evolution of the value of the friction coefficient µ for surfaces obtained by applying different final processing methods or with different values of the processing parameters under dry friction conditions, according to the established empirical mathematical models.
Lubricants 11 00436 g011
Figure 12. Comparison of the running-in duration of the evolution over time of the friction coefficient value in lubricated friction and dry friction, respectively, for outer cylindrical surfaces obtained by using different final processing methods or with different values of the processing parameters.
Lubricants 11 00436 g012
Figure 13. The evolution over time of the magnitude of the friction coefficient µ for some of the final processing methods applied to the surfaces, in the case of lubricated friction and dry friction, respectively (the curves corresponding to processing methods nos. 1—turning, 2—grinding, 13 and 14—ball vibroburnishing, were drawn).
Lubricants 11 00436 g013
Table 1. Values of the friction coefficients µ in the case of dry friction and the use of different processing methods for obtaining the outer cylindrical surface.
Test Duration, t, min0153045607590105120135150165Final Value/Initial Value Ratio
The Number of Revolutions Corresponding to a Certain Duration of the Test, in Thousands01224364860728496108120132
Final processing method no. 1 (turning)0.100.110.1220.130.1380.1440.150.1550.1580.160.1630.1641.64
2 (grinding)0.0920.1040.1130.1230.1310.1360.1410.1460.1490.1520.1530.1551.684
3 (burnishing with ball)0.0550.0530.0640.0730.0810.0870.0920.0960.1010.1040.1090.1001.818
4 (diamond smoothing)0.0520.0640.0730.0810.0890.0930.0980.1010.1040.1050.1070.1072.057
5 (ball burnishing) 0.0460.0550.0640.0710.0750.0800.0840.0860.0830.0890.0910.0911.978
6 (diamond tip burnishing)0.0490.0580.0660.0730.0750.0780.0830.0860.0890.0910.0910.0911.857
7 (ball vibroburnishing)0.0380.0460.0520.060.0630.0670.0690.0700.0720.0720.0720.0721.894
8 (diamond tip vibroburnishing)0.040.0470.0550.0610.0660.0690.0710.0720.0730.0730.0730.0731.825
9 (ball vibroburnishing)0.0580.0670.0750.080.0840.0860.0890.0900.0910.0920.0920.0921.586
10 (diamond tip vibroburnshing)0.0560.0690.0740.0780.0810.0830.0850.0860.0870.0870.0870.0871.553
11 (ball vibroburnishing)0.0510.0580.0660.0710.0730.0760.0770.080.0810.0810.0810.0811.588
12 (diamond tip vibroburnishing)0.0490.0570.0630.0660.0690.0710.0720.0740.0750.0750.0750.0751.530
13 (ball vibroburnishing)0.0310.0410.0510.0580.0640.0690.0710.0720.0720.0720.0720.0722.322
14 (ball vibroburnishing)0.0350.0470.0560.0630.0660.0690.0710.0720.0720.0720.0720.0722.057
Table 2. Values of the friction coefficients in the case of lubrication (lubricated friction) and different processing methods for obtaining the outer cylindrical surface.
Test Duration, t, min0153045607590105120135150165Final Value/Initial Value RatioEstimated Duration of the Running-In Period, Min
The Number of Revolutions Corresponding to a Certain Duration of the Test, in Thousands01224364860728496108120132
Final processing method no.1 (turning)0.0860.0930.10.1060.1090.1110.1120.1170.1220.1260.1260.1281.488135
2 (grinding)0.0780.0830.0880.0960.1010.1080.1110.1150.120.1250.1280.1281.641150
3 (burnishing with ball)0.0430.0560.0670.0760.0840.0920.0980.1030.1060.1080.1090.1092.534150
4 (diamond smoothing)0.0420.0550.0760.0770.0840.0910.0960.1020.1040.1060.1080.1082.571150
5 (ball burnishing) 0.0370.0480.0580.0650.0720.0760.0820.0840.0860.0870.0880.0882.378150
6 (diamond tip burnishing)0.0370.0480.0590.0670.070.0750.0790.0830.0860.0870.0870.0872.351135
7 (ball vibroburnishing)0.0280.0370.0440.0520.0580.0620.0660.0670.0680.0680.0680.0682.428120
8 (diamond tip vibroburnishing)0.0280.0380.0460.0540.0590.0640.0660.0670.0680.0680.0680.0682.428120
9 (ball vibroburnishing)0.0460.0580.0660.0720.0750.0770.0780.0780.0790.0800.0800.0801.739135
10 (diamond tip vibroburnshing)0.0440.0550.0650.0720.0750.0780.0790.0790.0800.0800.0800.0801.818120
11 (ball vibroburnishing)0.0390.0490.0570.0630.0660.0670.0690.0690.0700.0700.0700.0701.794120
12 (diamond tip vibroburnishing)0.0390.0480.0570.0620.0650.0680.0690.0700.0710.0710.0710.0711.820120
13 (ball vibroburnishing)0.020.030.0390.0470.0530.0580.0610.0610.0610.0610.0610.0613.05105
14 (ball vibroburnishing)0.0240.0350.0460.0550.0610.0660.0670.0670.0670.0670.0670.0672.79190
Table 3. Empirical mathematical models corresponding to the friction coefficient µ for using certain final processing methods.
The Final Processing Method Applied to the Surface No.:Empirical Mathematical Models for the Time Evolution of the Magnitude of the Friction Coefficient µ
Lubricated FrictionDry Friction
1 (turning)µ = 0.084t0.164µ = 0.0976t0.214
2 (grinding)µ = 0.0728t0.222µ = 0.0906t0.222
3 (burnishing with ball)µ = 0.0436t0.396µ = 0.0484t0.318
4 (diamond tip smoothing)µ = 0.0443t0.386µ = 0.0527t0.304
5 (ball burnishing)µ = 0.0383t0.364µ = 0.0466t0.283
6 (diamond tip burnishing)µ = 0.0387t0.355µ = 0.0493t0.261
7 (ball vibroburnishing)µ = 0.0294t0.377µ = 0.0336t0.350
8 (diamond tip vibroburnishing)µ = 0.0303t0.368µ = 0.0412t0.258
9 (ball vibroburnishing)µ = 0.0501t0.214µ = 0.0598t0.191
10 (diamond tip vibroburnishing)µ = 0.0478t0.238µ = 0.0598t0.17
11 (ball vibroburnishing)µ = 0.0424t0.231µ = 0.0522t0.195
12 (diamond tip vibroburnishing)µ = 0.0417t0.242µ = 0.0508t0.173
13 (ball vibroburnishing)µ = 0.0227t0.457µ = 0.0392t0.272
14 (ball vibroburnishing)µ = 0.0275t0.415µ = 0.0389t0.285
Disclaimer/Publisher’s Note: The statements, opinions and data contained in all publications are solely those of the individual author(s) and contributor(s) and not of MDPI and/or the editor(s). MDPI and/or the editor(s) disclaim responsibility for any injury to people or property resulting from any ideas, methods, instructions or products referred to in the content.

