Investigation of Mechanical Properties of Grey Cast Irons Reinforced with Carbon Titanium Nitride (TiNC)


Department of Energy Systems Engineering, Faculty of Technology, Batman University, Batman 72000, Türkiye
Lubricants 2023, 11(10), 454; https://doi.org/10.3390/lubricants11100454
Submission received: 13 September 2023
/
Revised: 11 October 2023
/
Accepted: 20 October 2023
/
Published: 22 October 2023
(This article belongs to the Special Issue Frictional Behavior and Wear Performance of Cast Irons)
Abstract
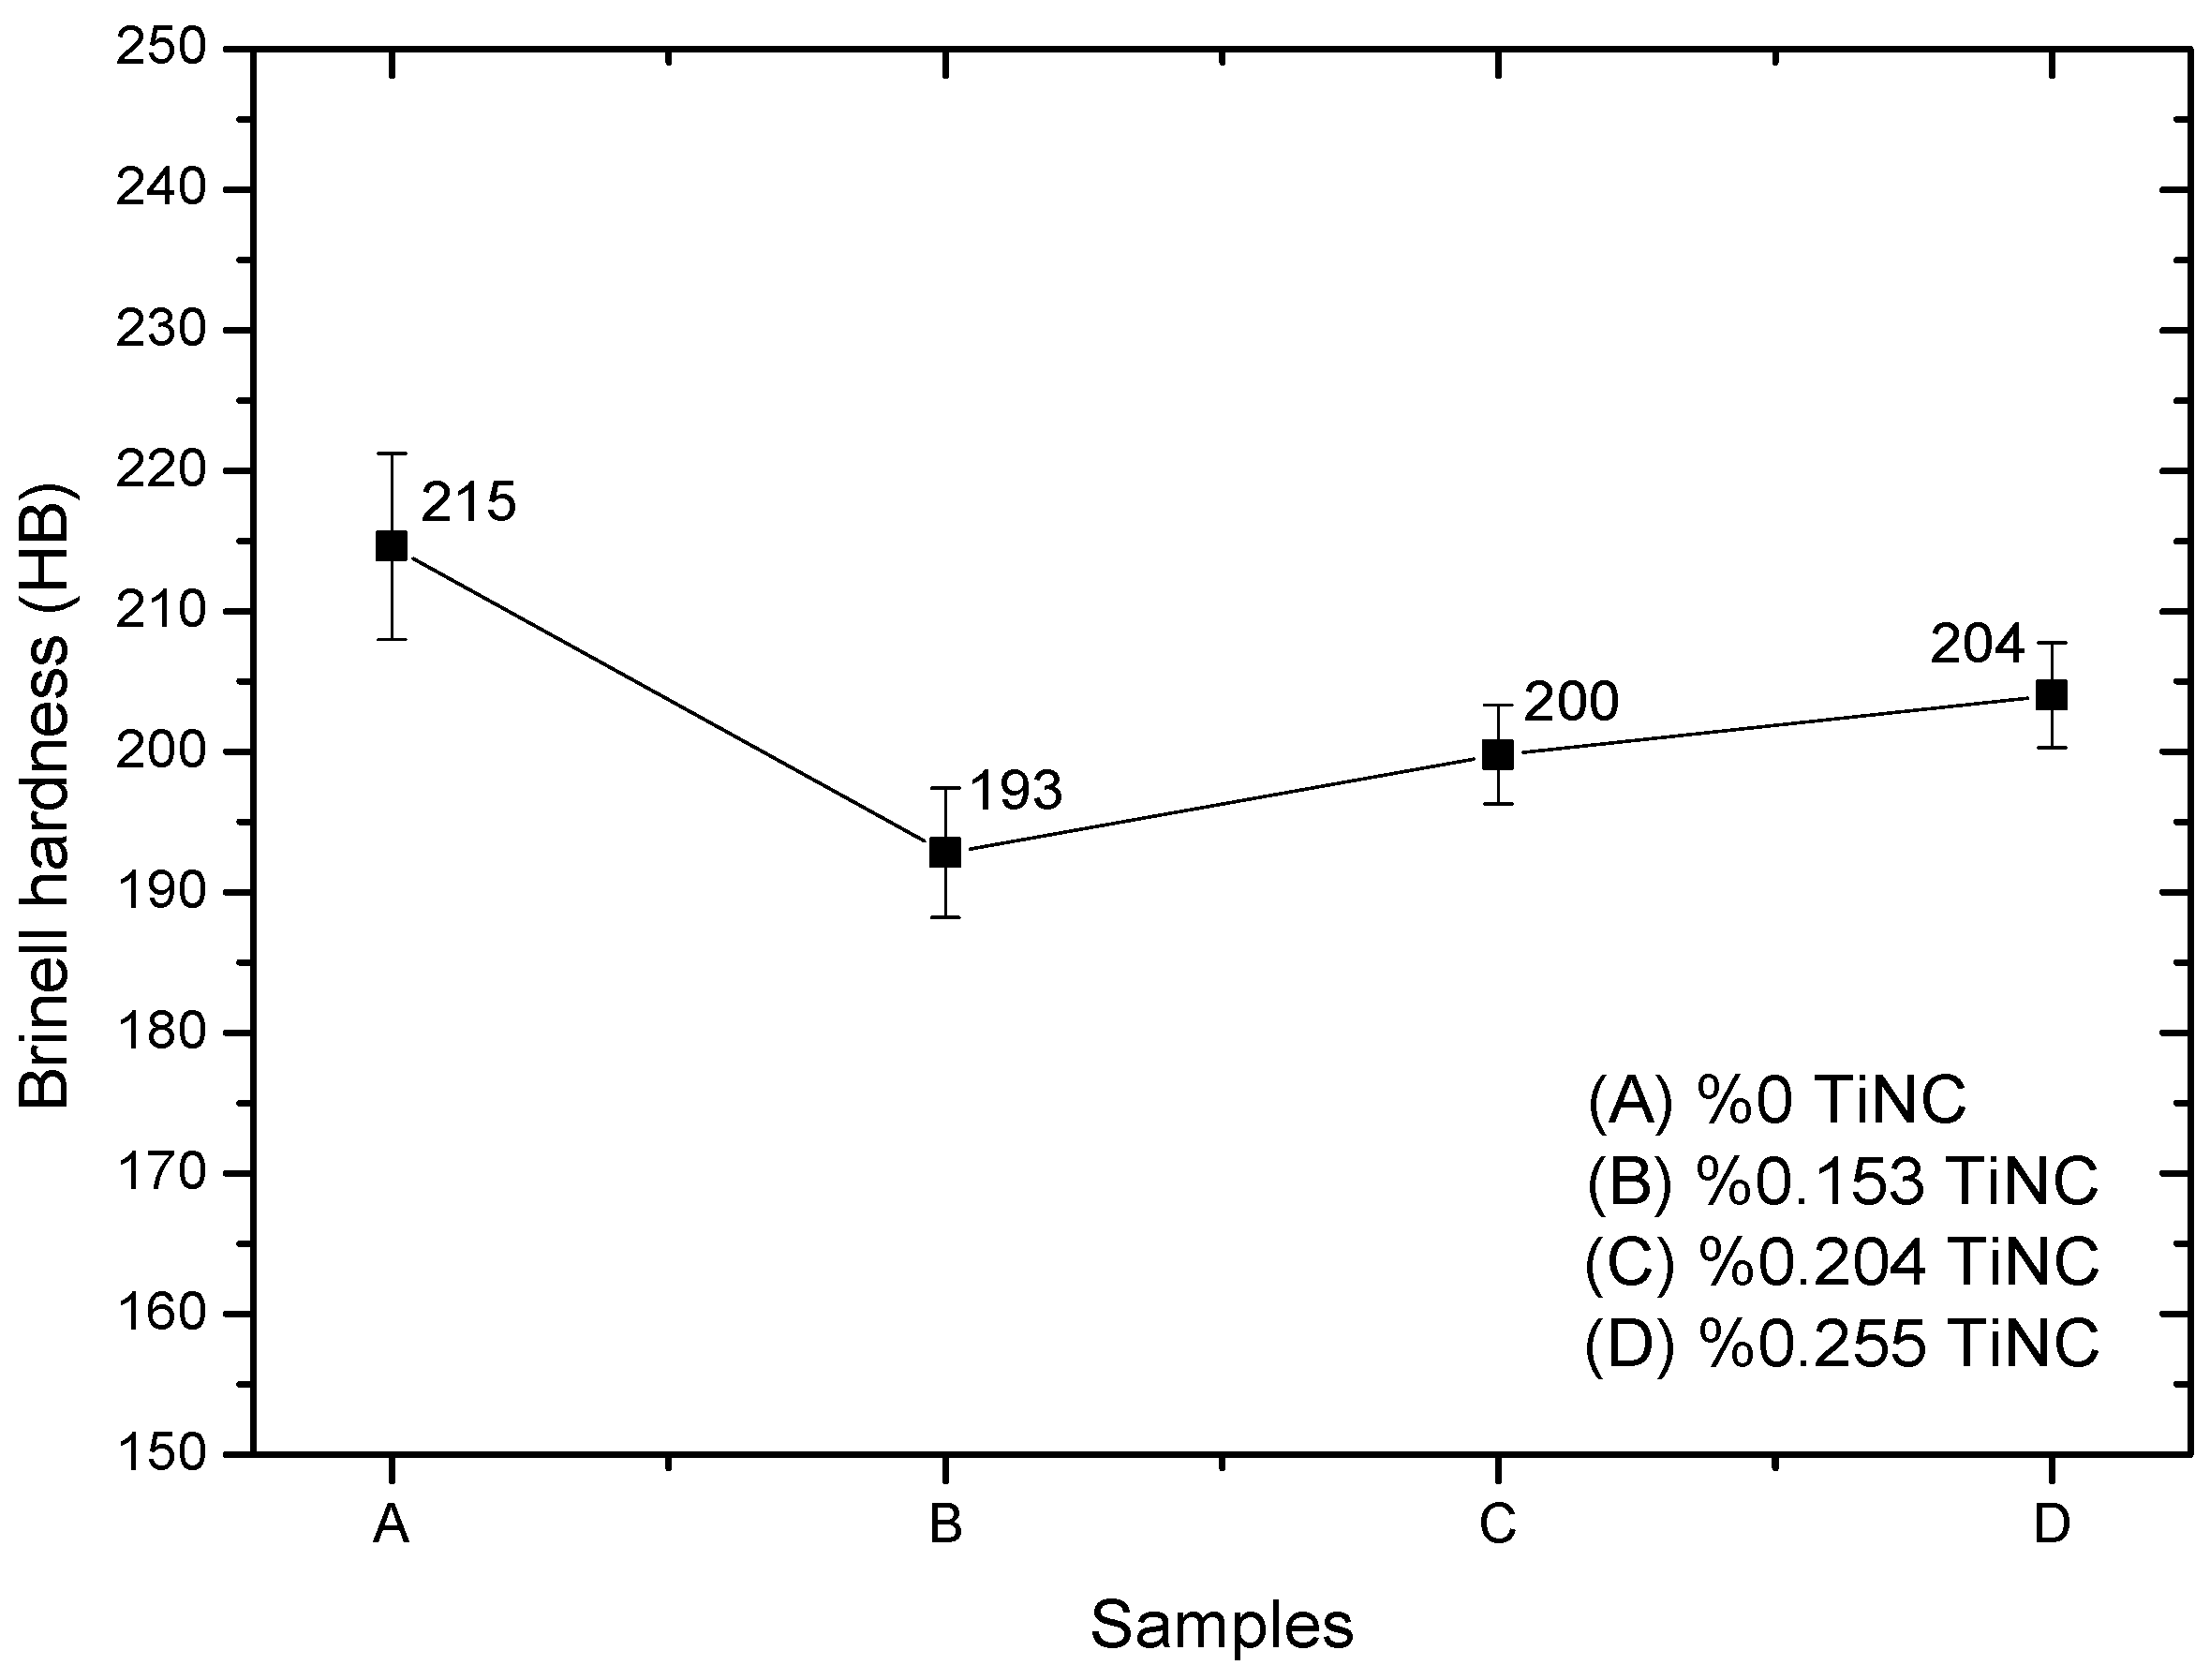
:In this study, grey cast iron (GG25) was produced via reinforcement with carbon titanium nitride (TiNC) in different amounts (0%, 0.153%, 0.204% and 0.255%). Samples were made from this material according to the standards for hardness, compression and wear, and then experiments were conducted. The test conditions applied for the TiNC-reinforced samples were similarly applied to unreinforced samples. The TiNC-reinforced and unreinforced samples were compared regarding their compression, hardness, and wear properties. The results of the hardness tests showed the highest average hardness value of 215 HB for sample A (0% TiNC). For TiNC-reinforced specimens, the hardness values of the reinforced specimens increased with increasing reinforcement. Sample B (0.153% TiNC) had an average hardness value of 193 HB. For sample C (0.204% TiNC), an average hardness value of 200 HB was measured. For sample D (0.255% TiNC), an average hardness value of 204 HB was determined. Sample A’s highest compression strength value was 780 MPA (0% TiNC). Similar to the hardness test values, the compression strength of the reinforced samples increased with the increasing reinforcement rate. The compression test value was found to be 747 MPa for sample B (0.153% TiNC), 765 MPa for sample C (0.204% TiNC) and 778 MPa for sample D (0.255% TiNC). Wear tests were performed on all samples to examine changes in the wear volume loss, wear rate and friction coefficients. Scanning electron microscopy (SEM) was used to determine the wear mechanisms on the worn surfaces of the samples. When examining the wear condition of the samples with the same hardness value as a function of increasing load values, increases in the wear volume loss values were observed as the load value increased.
1. Introduction
Cast irons are widely used materials in many fields of industry. These materials have basic properties such as fusibility, strength and ductility. In many applications, they can replace steel castings where high loads are applied [1]. Cast irons are highly preferred due to their castability, ease of procurement and high compressive strength compared to steel [2,3]. Cast irons are Fe–C alloys containing at least 2.1% C and 1–3% Si [4,5]. As the carbon content in the casting increases, the metal becomes more brittle [2,6]. The melting temperature of cast irons is approximately 1600 °C. This makes cast iron a useful alloy for industrial applications [7]. Cast irons have various applications in various industries, such as machinery, automobile parts, pipes, and kitchen equipment. Since cast irons are highly fluid in the molten state, they have high castability [2].
Grey (lamellar graphite) cast irons (GCI) are the most commonly used cast materials for engineering purposes. They are widely used because they have many advantages, such as a high heat capacity, high thermal conductivity [8,9], a low melting point [10], high vibration damping, hardness, superior wear resistance [11] and good machinability [12]. These materials have a compressive strength, dimensional stability and tensile strength comparable to steel [11]. The presence of graphite as flakes in the iron matrix gives it a grey color. Grey cast iron is an iron–carbon–silicon alloy with small amounts of other alloying elements [13]. These grey cast irons find wide application in the automobile industry, including in casting the cylinder head for heavy fuel diesel engines [14,15,16], and especially in the engine block of internal combustion engines [2,17]. The structure of these cast irons is determined by their chemical composition, inoculants and the cooling conditions before casting [2,18]. These grey cast irons have attracted much attention due to their superior properties, such as good strength, low production cost [19,20,21], good fluidity, good castability and high wear resistance [22]. Their microstructure comprises a metal matrix in which graphite lamellae are dispersed [21]. The mechanical properties of grey cast irons depend mainly on its microstructure, which consists of a matrix of flake graphite, ferrite, and pearlite [15]. The mechanical properties of these cast irons are determined by the size, amount, and distribution of graphite lamellae in its microstructure [21,23,24,25,26]. The best way to increase the tensile strength of grey cast irons is to add alloying elements to change their microstructure [27,28,29]. Common alloying elements in these grey cast irons are molybdenum (Mo), niobium (Nb), vanadium (V), copper (Cu), tin (Sn), chromium (Cr) and so on [27,30,31,32].
Abrasive wear is a phenomenon that occurs between two contact surfaces with different degrees of hardness, whereby the material surface is attacked by the particle with higher hardness. Abrasive wear causes mass wastage, damage and component failure in industry. Industrialized countries spend an estimated 1–4% of their gross national product on losses due to abrasive wear [33]. Grey cast iron is often used for sliding wear applications. Examples of materials subject to sliding wear are automotive cylinder blocks, brake drums and bearings [34]. When we look at the tribological properties of cast irons with a high damping capacity, we can see that they show good tribological properties [35]. Friction and wear phenomena cause a decrease in the operating efficiency of both mechanical components and electrical components. They can also lead to the early replacement of components [36]. Depending on the composition/microstructure of materials, the applied load, and the operating environment, wear can be classified into several types, including adhesive, abrasive, fretting, and fatigue [37]. The coefficient of friction and wear rate typically characterize the wear properties of materials [38,39]. The coefficient of friction is a crucial parameter in measuring the friction and wear properties of materials and studying their friction and wear mechanisms [38,40,41]. The wear rate is commonly expressed as the amount of wear per unit volume of samples [38,42].
Cast iron materials are easy to melt and are usually produced in final sizes. Even intricately shaped materials can be produced via casting. The grey cast iron parts of machine elements used in industry fail over time due to sliding wear. When this happens, there is a need to replace the defective part before using its entire service life. Replacing the defective machine element long before it has reached its full service life causes an increase in costs. This leads the users of the equipment to experience an economically difficult situation. To prevent this situation, material wear can be reduced by increasing the strength of the matrix material by adding a TiNC reinforcement material in certain ratios to the cast iron machine element. In this study, we attempted to increase the strength values of the grey cast iron material by adding carbon titanium nitride (TiNC). Therefore, the compressive strength, hardness and wear behavior of the samples were investigated at different reinforcement ratios (specimen A: 0%; specimen B: 0.153%; specimen C: 0.204% and specimen D: 0.255%). The abrasion tests were conducted on a reciprocating abrasion tester (CSM Instrument Tribometer, Peseux, Switzerland) at a temperature of 25 ± 1 °C, a humidity of 60 ± 2% and in dry sliding conditions in air, in accordance with the standards. Alumina balls with a diameter of 6 mm were used as the abrasive material. The tests were carried out under loads of 5 N, 10 N and 15 N, with a constant sliding speed of 20 cm/s, a sliding length of 8.5 mm and a total sliding distance of 500 m. During the test, the values of the coefficient of friction were measured and the data were immediately recorded. In this way, the effects of load variations on the wear behavior of TiNC-reinforced grey cast iron at different rates were investigated.
2. Materials and Methods
2.1. Material Production
The sample materials used in the experiments were produced in Hema Automotive Systems Inc. (Turkey), an Iron Casting Factory. The grey cast iron specimens were formed in a metal-melting furnace using varying amounts of carbon titanium nitride (TiNC) reinforcement material. Four different specimens were produced: Specimen A with 0%, specimen B with 0.153%, specimen C with 0.204%, and specimen D with 0.255%. The chemical compositions of these samples can be found in Table 1. The specimens were cast in separate sand molds at the temperature of 1410 °C in the casting ladle. The compression, hardness, microstructure and wear of these grey cast iron samples were investigated. Grey cast irons are classified according to the ASTM A 48 standard [43]. The carbon titanium nitride (TiNC) reinforcement material used in the study was provided by Nanography Nano Technology (Ankara, Turkey). TiNC powder with a chemical composition of 76–79 Ti, 10.0–12.0 N, 9.0–11.0 C, 0.3 free C, 0.5–1.0 O, and 0.08 Fe (wt.%) was used. The purity and size of the TiNC powder were 99.95% and 1.05–3.05 μm, respectively.
2.2. Preparation of Sample Materials
The cast samples were taken out of the sand mold at room temperature after casting. 12 mm × 32 mm × 42 mm samples with four different TiNC reinforcement ratios (A, B, C, and D) were prepared for hardness tests from these samples.
For compressive strength test samples, it is recommended that the dimensional ratio (initial height (ho)/initial diameter (do)) is 1.5 < (ho/do) < 10. The most commonly used ratio for pressure tests is (ho/do) > 2. This ratio is usually taken as (ho/do) = 2 in compressive strength tests of metallic materials. When the ho/do ratio of samples is too large, bending and inhomogeneous stress distributions may occur in the samples during the test. If the ho/do ratio is too low, the friction between the sample and the compression plates significantly affects the test results [43]. This study was prepared in 12 Ø11 mm × 22 mm cylindrical samples, using 3 samples of each reinforcement ratio for compressive strength tests. In the study, the compression ratio was determined as (ho/do) = 2. The compressive strength of the grey cast irons was approximately 3–5 times higher than their tensile strength [43]. These high compressive strengths are one of the most important properties of grey cast irons. In terms of procedure, compressive strength tests are considered to be the inverse of tensile strength tests. Compressive strength tests are usually applied to brittle materials subjected to compressive loads. Since the compressive strength of metal materials such as bearing alloys produced from grey cast irons is higher than their tensile strength, they are used in places where they are subjected to compressive stresses [43].
For wear tests, 12 mm × 32 mm × 42 mm samples of each reinforcement ratio (A, B, C and D) were prepared using machining methods. The surfaces of these samples were polished before the wear tests.
3. Results and Discussion
Microhardness Test Results
The hardness tests were performed according to standards using the Ernst AT250DR Brinell hardness tester. The measurement results were compared with previous GCI studies. In their study, Kuzmanov et al. [44] determined the hardness value of GG25 grey cast iron produced without reinforcement to be 219 HB. In our study, the average hardness value of the GG25 grey cast iron produced without reinforcement was found to be 215 HB for sample A (0% TiNC). This average hardness value agrees with the hardness value found in the earlier study by Kuzmanov et al. [44]. In the hardness measurements, the lowest value, with an average of 193 HB, was measured in sample B with 0.153% TiNC reinforcement. For sample C, with 0.204% TiNC reinforcement, the hardness value increased with the increasing reinforcement ratio and was measured as 200 HB on average. For sample D, with 0.255% TiNC reinforcement, the average hardness value with an increasing reinforcement ratio was 204 HB. Collini et al. [18] thought that this varied depending on the chemical composition, inoculants or cooling conditions. The Brinell hardness values of the samples at different reinforcement ratios are shown in Figure 1.
Compressive strength tests are generally applied to brittle materials that are expected to have higher values than tensile strength. The compressive strength values of grey cast irons vary depending on their matrix structure and graphite flake size, type and distribution. Their tensile strength is taken into account when determining the compressive strength of grey cast irons. The tensile strength values of grey cast irons typically range between 100 and 350 MPa. Since the compressive strength values of grey cast irons are approximately 3–5 times those of the tensile strength, the expected compressive strength values are 300–1050 MPa [43]. When the compression test results were compared with previous studies, the results were found to be appropriate. Compression tests were carried out with a Zwick Roell Z600 universal testing machine produced by ASTM E9 standards. The average compressive stress values of the 0% TiNC A (unreinforced) sample and 0.153% TiNC-reinforced B sample were 780 MPa and 747 MPa, respectively. The average compressive stress of the 0.204% TiNC-reinforced C sample was found to be 765 MPa, according to expectations, as the reinforcement ratio increased. In the 0.255% TiNC-reinforced D sample, the compressive stress values increased with the increase in the reinforcement ratio, and the average compressive stress was 778 MPa. The compressive stress values were expected to increase as the reinforcement ratio increased. However, although the compressive stress values increased with the increase in the reinforcement ratio, it was found that the unreinforced A sample had higher values than the reinforced B, C and D samples. This can be explained by the possibility that the lamellae in grey cast irons create an unpredictable notch effect, decreasing the strength values [43]. The compression test values of the samples, depending on the reinforcement ratio, are shown in Figure 2.
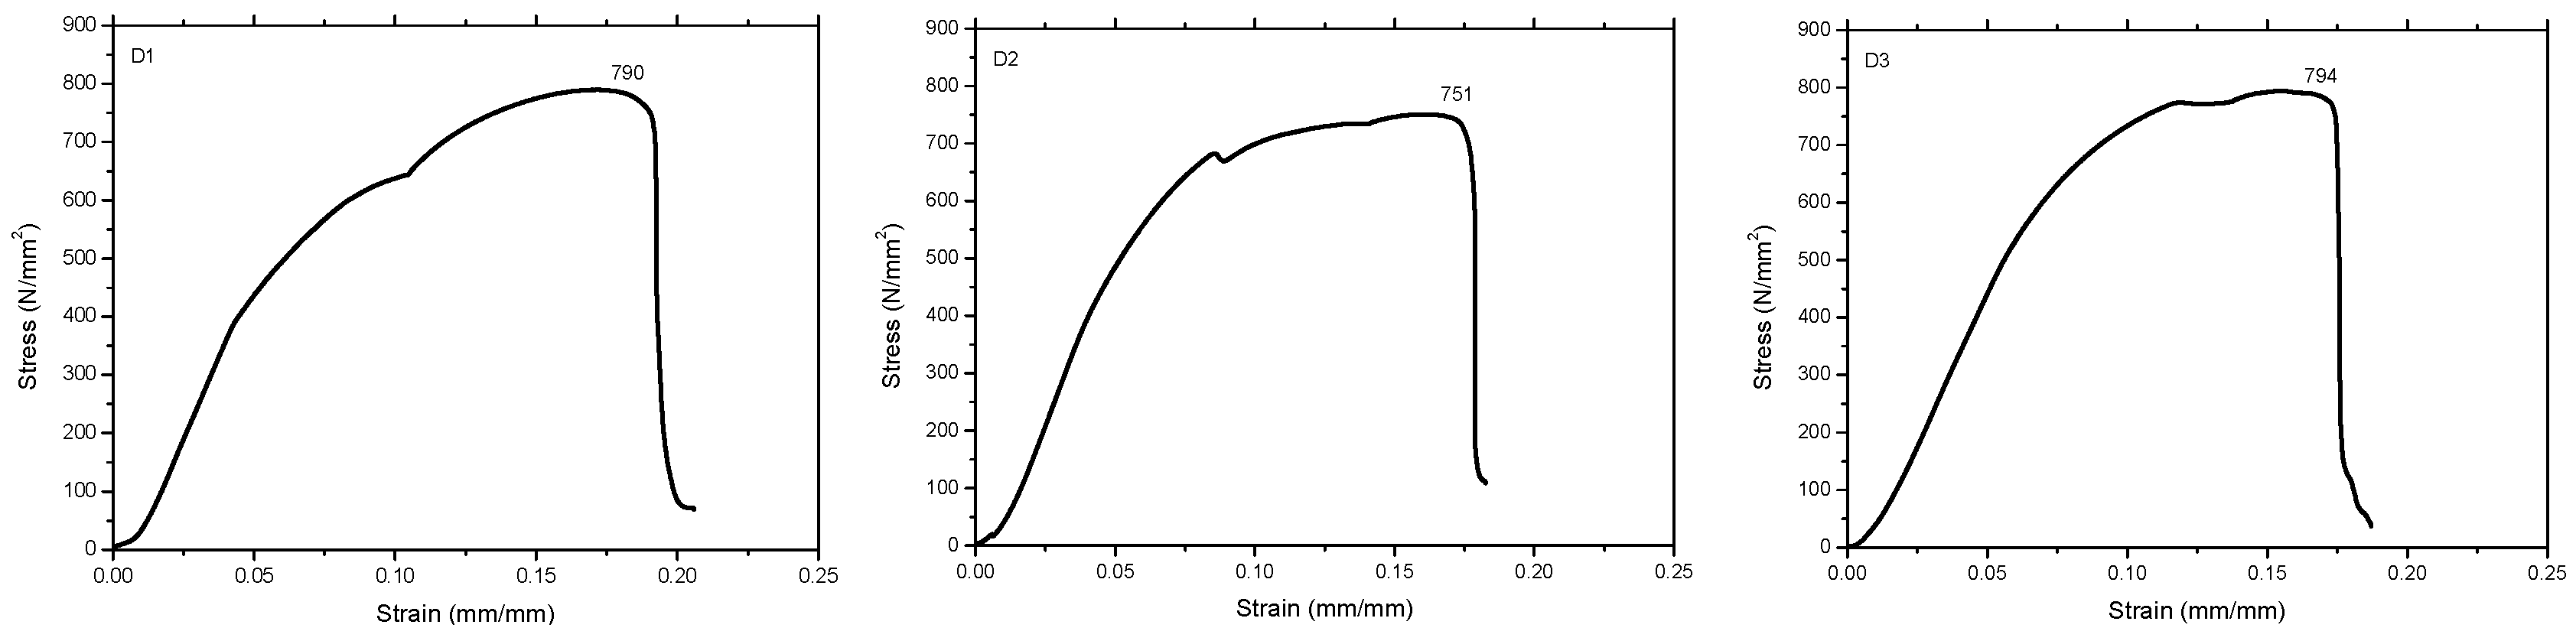
When examining the stress–strain diagrams of the compression tests, it was found that, although the curves were comparable, deviations occurred at the points with the highest stress. Fracture damage occurred in the materials due to the stresses generated during the compression loads (Figure 3). When we examine the damage from the compression tests, we can see that the fractures occurred at an angle of approximately 45 degrees. Figure 4 shows the stress–strain diagrams for the compression tests.
The wear tests were conducted under similar conditions in order to compare the samples. The wear rates, wear volume losses and friction coefficients obtained during the wear tests were compared for different TiNC reinforcement ratios. In the study carried out on the CSM Instrument Tribometer brand pin-on-disk wear device, when the applied load and additional rates were examined, the highest wear volume loss for the 5 N load was determined to be 1.24 × 10⁻¹ mm3 in the D (0.255% TiNC) sample. For the 5 N load, the highest wear rate of 4.95 × 10⁻⁵ mm3/Nm was found in the D (0.255% TiNC) sample. For the 10 N load value, the highest amount of wear volume loss was measured as 1.98 × 10⁻¹ mm3 in sample A (0% TiNC). For a load value of 10 N, the highest wear rate of 3.95 × 10⁻⁵ mm3/Nm was observed in sample A (0% TiNC). When a load value of 15 N was used for the wear test, the highest wear volume loss was found to be 2.93 × 10⁻¹ mm3 for sample B (0.153% TiNC). For a load value of 15 N, the highest wear rate of 3.90 × 10⁻⁵ mm3/Nm was found in the B (0.153% TiNC) sample. In the wear test, the amount of wear volume loss in the B (0.153% TiNC) sample with the lowest hardness value was 0.55 × 10⁻¹ mm3 for a 5 N load, 1.22 × 10⁻¹ mm3 for a 10 N load and 2.93 × 10⁻¹ mm3 for a 15 N load. According to this, it can be said that the amount of wear increases as the load value increases in sample B (0.153% TiNC), where the hardness value is the lowest. At a load of 5 N, the highest average coefficient of friction was 0.493 for sample A (0% TiNC). The lowest average coefficient of friction was 0.429 for sample C (0.204% TiNC). At a load of 10 N, the highest average coefficient of friction was 0.434 for sample C (0.204% TiNC). The lowest average coefficient of friction was 0.377 for sample D (0.255% TiNC). At a load of 15 N, the highest average coefficient of friction was 0.429 for sample D (0.255% TiNC). The lowest average coefficient of friction was 0.284 for sample A (0% TiNC). When evaluating the coefficients of friction, it was found that a general downward trend with increasing load value was observed for grey cast iron with the same reinforcement ratio. In Miyake’s study [45], he found that the coefficient of friction tended to decrease as the load increased [45]. Metallic materials’ sliding wear resistance is often estimated using their hardness [46]. Liu et al. [47] stated that the hardness values of materials are the most important factor in determining the wear resistance of that material, and according to Archard’s law, wear resistance is inversely proportional to hardness. The hardness of a material is a crucial factor in determining its wear resistance [48]. Additionally, the microstructure of the matrix, types and properties of carbides (such as size, distribution, orientation and morphology [48]), as well as the fracture toughness, volume fraction and hardness of the alloys, also influence the wear resistance. Moreover, the wear resistance is affected by loading conditions, tribological media properties, the relative movement of the contact area, and the type and size of abrasives [49]. Zambrano et al. [50], who tested steels with similar hardness but varying microstructures, demonstrated this. Wear losses [46] were calculated from the profilometer traces of the wear track. The wear volume losses, wear rates and average friction coefficients of the study are given in Table 2.
When examining the friction coefficient changes for the samples in Table 2 and Figure 5, we can observe that sample A (0% TiNC) has the highest friction coefficient value of 0.493 at a load value of 5 N. For a 5 N load value, the lowest coefficient of friction value was 0.429 in sample C (0.204% TiNC). For a 10 N load value, the highest coefficient of friction value was 0.434 in the C (0.204% TiNC) sample. For a 10 N load value, the lowest coefficient of friction value was 0.377 in sample D (0.255% TiNC). Sample D (0.255% TiNC) had the highest friction coefficient value of 0.429 at a 15 N load. For a 15 N load value, the lowest coefficient of friction was 0.284 in sample A (0% TiNC). The grain size, microhardness, film/substrate adhesion strength, surface roughness, etc., determine the wear performance of ductile iron (DI) and austempered grey cast iron (AGCI). Wear behavior is categorized according to microhardness and the coefficient of friction [51].
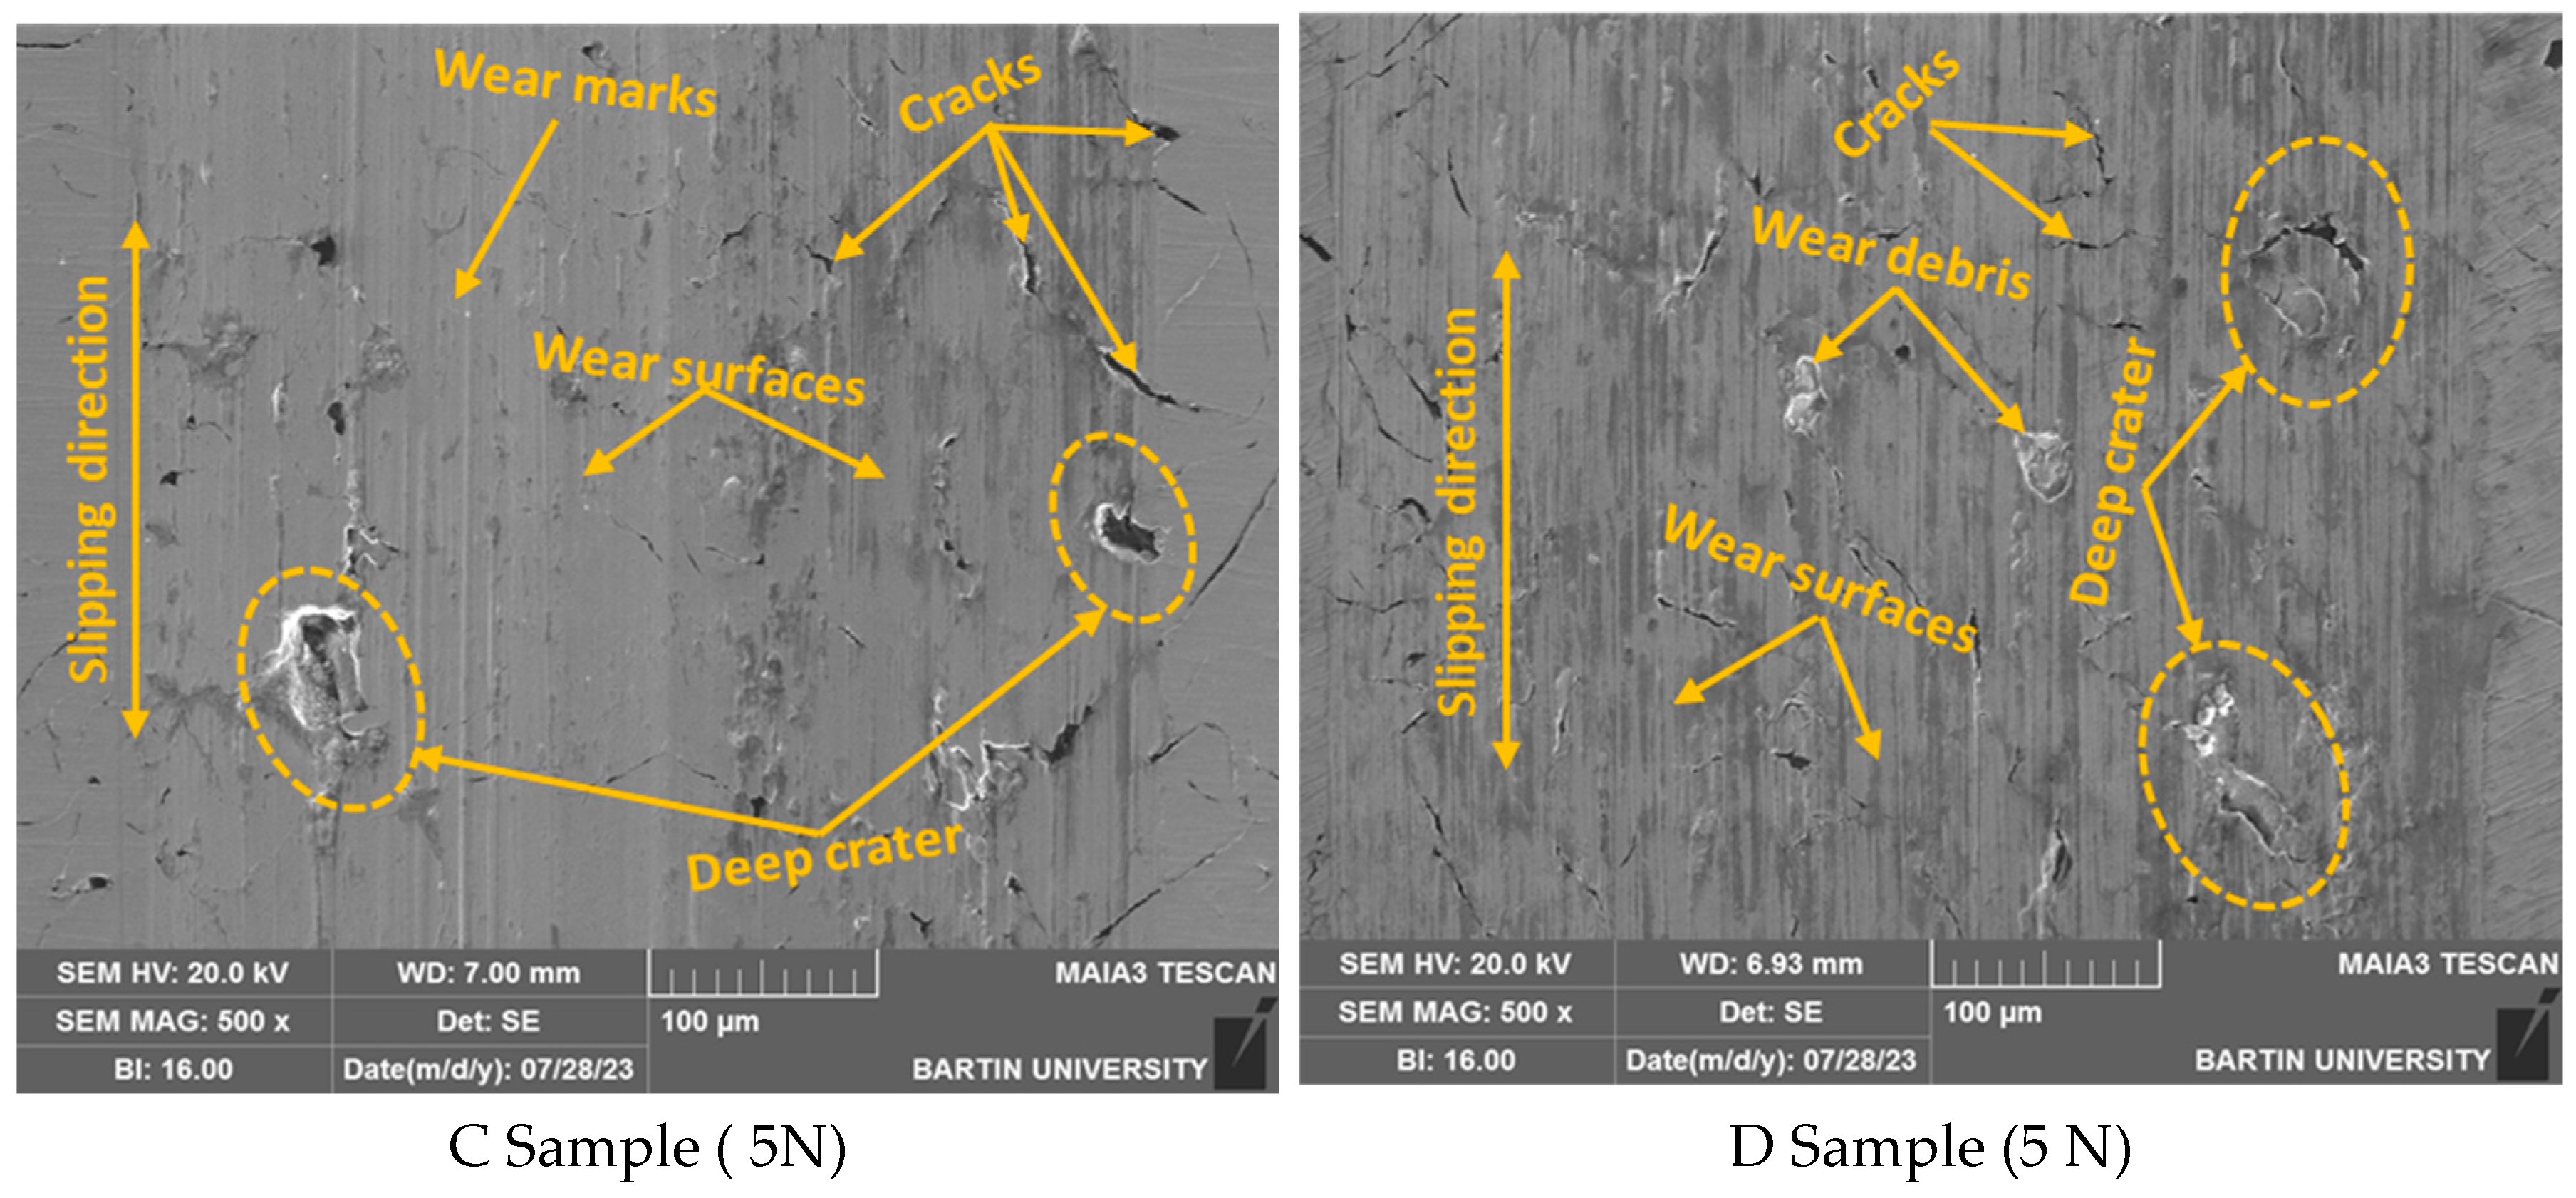
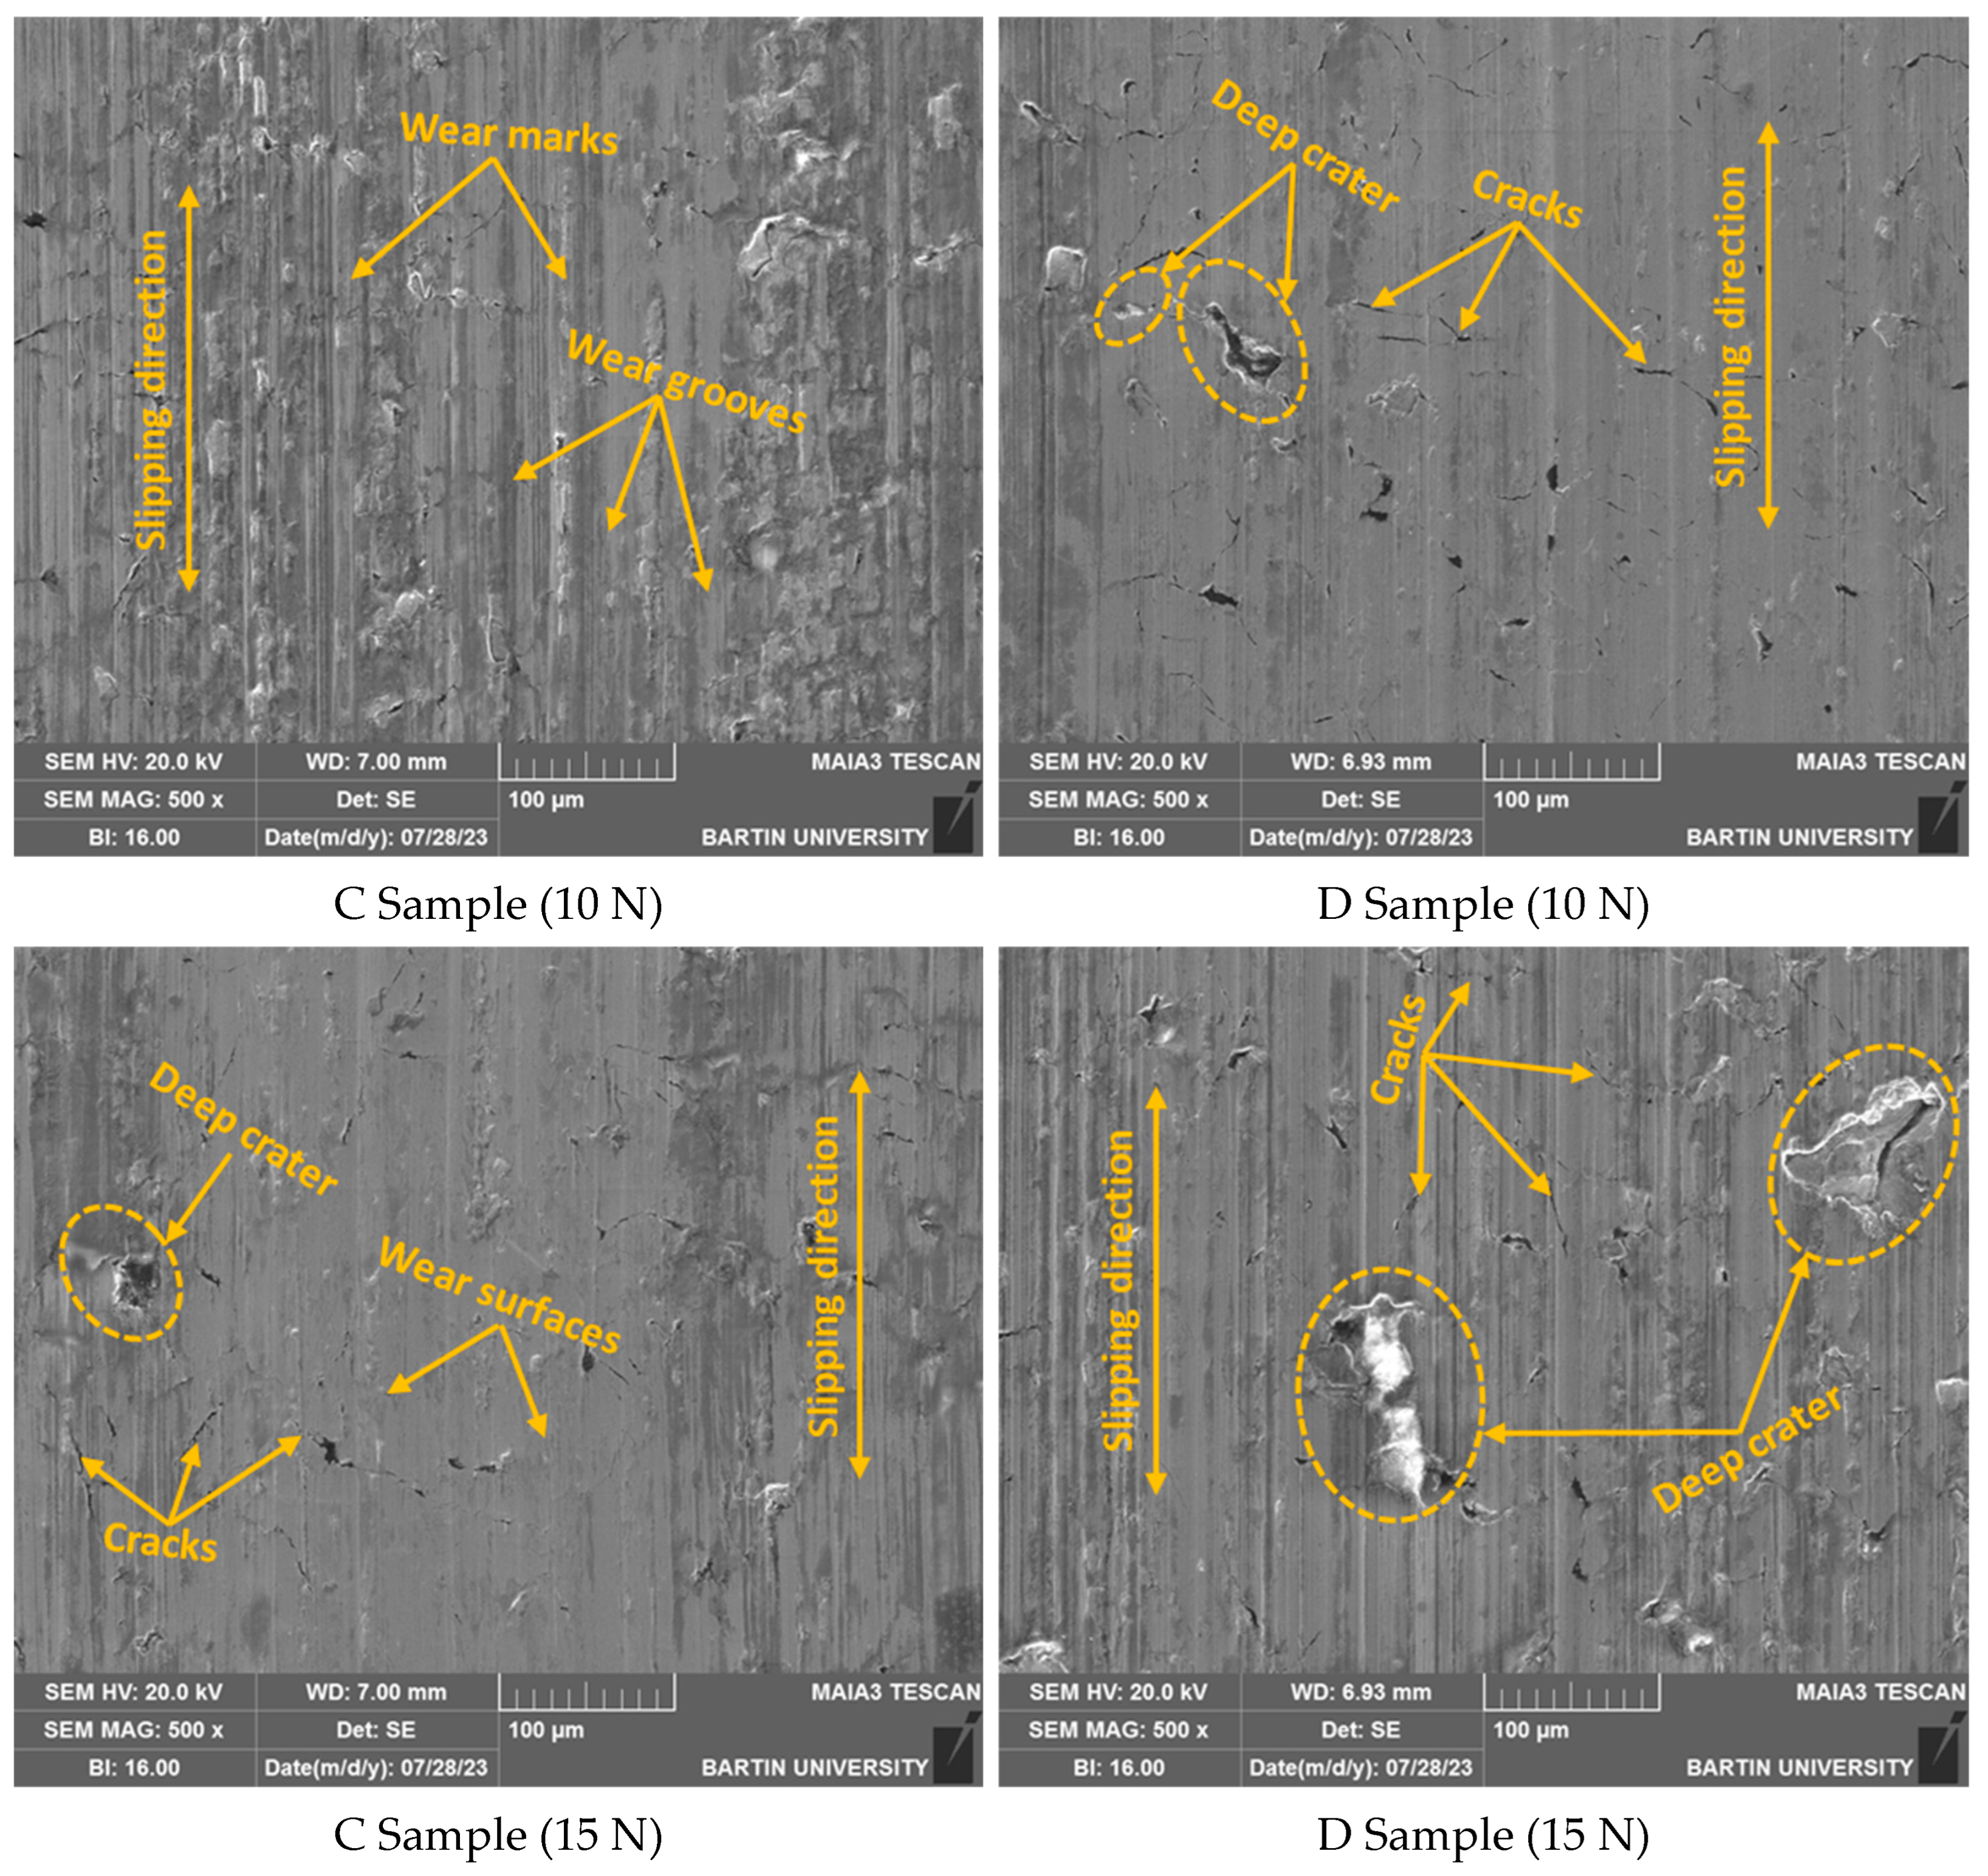
The worn surfaces under dry sliding conditions were examined using a TESCAN MAIA3 XMU Scanning Electron Microscope (SEM) to determine the wear mechanisms. An (0% TiNC) unreinforced sample showed increased wear volume loss with increasing load. At a 5 N load, the C (0.204% TiNC) and D (0.255% TiNC) samples showed deep pits and cracks. At a 10 N load, sample C (0.204% TiNC) showed wear without particle breakage on the wear surfaces. Also, at a 10 N load, deep pits and cracks were observed in sample D (0.255% TiNC). At a 15 N load, deep pits and cracks were observed in samples C (0.204% TiNC) and D (0.255% TiNC). The wear surfaces parallel to the sliding direction were observed to have significant scratches. The post-wear scanning electron microscopy (SEM) microstructure images are presented in Figure 6.
4. Conclusions
Grey cast iron, used in many machine elements, fails due to sliding wear. Therefore, there is a need to replace the failed parts without using the entire service life. This study evaluates the compression, hardness and wear behavior of grey cast iron reinforced with TiNC at different ratios. The results obtained in this study are given below:
- The hardness measurements obtained the highest average reading for sample A (0% TiNC) at 215 HB. The average hardness values were 193 HB, 200 HB and 204 HB for samples B (0.153% TiNC), C (0.204% TiNC), and D (0.255% TiNC), respectively. Although the hardness values of the reinforced samples were lower than those of the unreinforced sample A, the average hardness values increased as the degrees of reinforcement increased.
- In compression tests, sample A’s highest value was 780 MPa (0% TiNC). The compression test value was determined to be 747 MPa in sample B (0.153% TiNC), 765 MPa in sample C (0.204% TiNC) and 778 MPa in sample D (0.255% TiNC). When the compression test results are evaluated graphically in general terms, they show similarities with the hardness tests.
- When the wear condition of the samples with the same hardness value is examined depending on the increasing load values, it can be said that the wear volume loss values increase with the increase in the load value. The wear volume losses of sample A (0% TiNC) were 0.97 × 10⁻¹ mm3 at a 5 N load, 1.98 × 10⁻¹ mm3 at a 10 N load and 2.38 × 10⁻¹ mm3 at a 15 N load. The wear volume losses of sample B (0.153% TiNC) were 0.55 × 10⁻¹ mm3 at a 5 N load, 1.22 × 10⁻¹ mm3 at a 10 N load and 2.93 × 10⁻¹ mm3 at a 15 N load. The wear volume losses of sample C (0.204% TiNC) were 1.07 × 10⁻¹ mm3 at a 5 N load, 1.32 × 10⁻¹ mm3 at a 10 N load and 1.45 × 10⁻¹ mm3 at a 15 N load. The wear volume losses of sample D (0.255% TiNC) were 1.24 × 10⁻¹ mm3 at a 5 N load, 1.48 × 10⁻¹ mm3 at a 10 N load and 2.23 × 10⁻¹ mm3 at a 15 N load.
- When evaluating the coefficients of friction, it was observed that grey cast iron with the same reinforcement ratio exhibited a general downward trend as the load value increased. The highest coefficient of friction was determined, with an average of 0.493 for sample A (0% TiNC) at a load of 5 N. The lowest coefficient of friction was found to be 0.284 for sample A (0% TiNC) at a load of 15 N.
5. Future Research
Cast irons are easily melted and are generally manufactured in final dimensions. Complex-shaped materials can also be produced via casting. Grey cast iron is widely used in many machine elements used in industry. These grey cast irons suffer much damage due to sliding wear. For this reason, there is a need to replace defective parts before they have completed their entire service life. Replacing damaged parts leads to both high economic costs and the loss of time. In order to prevent this, it is necessary to increase the strength values of grey cast iron. In this study, we aimed to increase the strength values of grey cast iron via reinforcement with carbon titanium nitride (TiNC) at different rates (sample A: 0%; sample B: 0.153%; sample C: 0.204%; and sample D: 0.255%). Accordingly, the prepared specimens’ compressive strength, hardness and wear resistance properties were investigated. A similar study can be carried out for spheroidal graphite cast irons in the future. The compressive properties, hardness, and wear properties of spheroidal graphite cast iron and grey cast iron can be compared with TiNC reinforcement at different ratios.
Funding
This research received no external funding.
Data Availability Statement
All data generated and used in this study are included in the submitted manuscript.
Conflicts of Interest
The authors declare no conflict of interest.
References
- Tokova, O.; Savchenko, Y. Modelling of dependence of mechanical properties of cast iron on chemical composition of raw 272 materials. In Proceedings of the 2019 IEEE 14th International Conference on Computer Sciences and Information Technologies (CSIT), Lviv, Ukraine, 17–20 September 2019; Volume 273, pp. 179–182. [Google Scholar] [CrossRef]
- Salawu, E.Y.; Elvis, A.O.; Ajayi, O.O.; Ongbali, S.O.; Afolalu, S.A. Particle size distribution analysis of carburized HT250 Gray cast iron using Image. J. Mater. Today: Proc. 2023. [Google Scholar] [CrossRef]
- Sadeghi, A.; Moloodi, A.; Golestanipour, M.; Mahdavi Shahri, M. An investigation of abrasive wear and corrosion behavior of surface repair of gray cast iron by Smaw. J. Mater. Res. Technol. 2017, 6, 90–95. [Google Scholar] [CrossRef]
- Günen, A.; Soylu, B.; Karakas, Ö. Titanium carbide coating to improve surface characteristic, wear and corrosion resistance of spheroidal graphite cast irons. Surf. Coat. Technol. 2022, 437, 128280. [Google Scholar] [CrossRef]
- Yakut, R.; Ortakaya, R. Investigation of the effect of additional zirconium diboride (ZrB2) in spherical graphite cast iron on mechanical properties. Coatings 2023, 13, 1385. [Google Scholar] [CrossRef]
- Alias, S.K.; Abdullah, B.; Jaffar, A.; Latip, S.A.; Kasolang, S.; Izham, M.F.; Ghani, M.A. Mechanical properties of paste carburized ASTM A516 Steel. Procedia Eng. 2013, 68, 525–530. [Google Scholar] [CrossRef]
- Beniwal, G.; Saxena, K.K. Effect of niobium addition in grey cast iron: A short review. Mater. Today Proc. 2020, 26, 2337–2343. [Google Scholar] [CrossRef]
- Masafi, M.; Palkowski, H.; Mozaffari-Jovein, H. Microstructural properties of particle-reinforced multilayer systems of 316L and 430L alloys on Gray Cast Iron. Coatings 2023, 13, 1450. [Google Scholar] [CrossRef]
- Motta, M.; Zanocco, M.; Rondinella, A.; Iodice, V.; Sin, A.; Fedrizzi, L.; Andreatta, F. Inhibitive effect of 8-hydroxyquinoline on Corrosion of Gray cast iron in automotive braking systems. Electrochim. Acta 2023, 449, 142221. [Google Scholar] [CrossRef]
- Aranke, O.; Algenaid, W.; Awe, S.; Joshi, S. Coatings for Automotive Gray Cast Iron Brake Discs: A Review. Coatings 2019, 9, 552. [Google Scholar] [CrossRef]
- Mu, D.; Shen, B. The kinetics and dry-sliding wear properties of boronized Gray Cast Iron. Adv. Mater. Sci. Eng. 2013, 2013, 751971. [Google Scholar] [CrossRef]
- Diószegi, A.; Svidró, P.; Elmquist, L.; Dugic, I. Defect formation mechanisms in lamellar graphite ıron related to the casting geometry. Int. J. Cast Met. Res. 2016, 29, 279–285. [Google Scholar] [CrossRef]
- Upadhyay, S.; Saxena, K.K. Effect of Cu and Mo addition on mechanical properties and microstructure of Grey Cast Iron: An overview. Mater. Today Proc. 2020, 26, 2462–2470. [Google Scholar] [CrossRef]
- Teng, X.Y.; Pang, J.C.; Liu, F.; Zou, C.L.; Gao, C.; Li, S.X.; Zhang, Z.F. Fatigue strength optimization of gray cast iron processed by different austempering temperatures. Int. J. Fatigue 2023, 175, 107831. [Google Scholar] [CrossRef]
- Sarkar, T.; Sutradhar, G. Influence of austenitizing temperature on microstructure and mechanical properties of austempered gray iron (AGI). Mater. Today Proc. 2017, 4, 10138–10143. [Google Scholar] [CrossRef]
- Ghasemi, R.; Hassan, I.; Ghorbani, A.; Dioszegi, A. Austempered compacted graphite iron—Influence of austempering temperature and time on microstructural and mechanical properties. Mater. Sci. Eng. A 2019, 767, 138434. [Google Scholar] [CrossRef]
- Riemschneider, E.; Bordeasu, I.; Mitelea, I.; Dragos Utu, I.; Marius Crăciunescu, C. Morphology and mechanism of cavitation degradation of gray cast iron surfaces with lamellar graphite. Mater. Today Proc. 2021, 45, 4157–4160. [Google Scholar] [CrossRef]
- Collini, L.; Nicoletto, G.; Konečná, R. Microstructure and mechanical properties of pearlitic Gray Cast Iron. Mater. Sci. Eng. A 2008, 488, 529–539. [Google Scholar] [CrossRef]
- Lin, Y.; Ma, J.; Lai, D.; Zhang, J.; Li, W.; Li, S.; He, S. Multi-response optimization of process parameters in nitrogen-containing gray cast iron milling process based on application of non-dominated ranking genetic algorithm. Heliyon 2022, 8, e11629. [Google Scholar] [CrossRef] [PubMed]
- Gweon, J.; Shin, S.; Jang, H.; Lee, W.; Kim, D.; Lee, K. The factors governing corrosion stiction of brake friction materials to a gray cast iron disc. SAE Tech. Pap. Ser. 2018, 1, 1–8. [Google Scholar] [CrossRef]
- Mitelea, I.; Bordeaşu, I.; Riemschneider, E.; Uţu, I.D.; Crăciunescu, C.M. Cavitation erosion improvement following TIG surface-remelting of Gray Cast Iron. Wear 2022, 496–497, 204282. [Google Scholar] [CrossRef]
- Chen, Z.; Zhou, T.; Zhao, R.; Zhang, H.; Lu, S.; Yang, W.; Zhou, H. Improved fatigue wear resistance of gray cast iron by localized laser carburizing. Mater. Sci. Eng. A 2015, 644, 1–9. [Google Scholar] [CrossRef]
- Sreedhar, B.K.; Albert, S.K.; Pandit, A.B. Cavitation damage: Theory and measurements—A Review. Wear 2017, 372–373, 177–196. [Google Scholar] [CrossRef]
- Dular, M.; Delgosha, O.C.; Petkovšek, M. Observations of cavitation erosion pit formation. Ultrason. Sonochemistry 2013, 20, 1113–1120. [Google Scholar] [CrossRef] [PubMed]
- Van Wijngaarden, L. Mechanics of collapsing cavitation bubbles. Ultrason. Sonochemistry 2016, 29, 524–527. [Google Scholar] [CrossRef] [PubMed]
- Park, I.-C.; Lee, H.-K.; Kim, S.-J. Microstructure and cavitation damage characteristics of surface treated gray cast iron by plasma ion nitriding. Appl. Surf. Sci. 2019, 477, 147–153. [Google Scholar] [CrossRef]
- Chen, Y.; Xue, Z.; Song, S.; Cromarty, R.; Zhou, X. Evolution of microstructure and high temperature tensile strength of gray cast iron HT250: The role of molybdenum. Mater. Sci. Eng. A 2023, 863, 144511. [Google Scholar] [CrossRef]
- Lyu, Y.; Sun, Y.; Liu, S.; Zhao, J. Effect of tin on microstructure and mechanical properties of compacted graphite iron. Int. J. Cast Met. Res. 2015, 28, 263–268. [Google Scholar] [CrossRef]
- Jabbari Behnam, M.M.; Davami, P.; Varahram, N. Effect of cooling rate on microstructure and mechanical properties of Gray Cast Iron. Mater. Sci. Eng. A 2010, 528, 583–588. [Google Scholar] [CrossRef]
- Li, Y.; Chen, R.; Wang, Q.; Cao, W.; Wang, X.; Xia, Y.; Zhou, G.; Qu, Y.; Li, G. Effect of V and SN on microstructure and mechanical properties of Gray Cast Iron. China Foundry 2022, 19, 427–434. [Google Scholar] [CrossRef]
- Zhou, Z.-H.; Song, S.-Q.; Cromarty, R.; Chen, Y.-L.; Xue, Z.-L. The precipitation of niobium carbide and its influence on the structure of HT250 for automobile wheel hubs. Materials 2021, 14, 6109. [Google Scholar] [CrossRef]
- Habireche, M.; Bacha, N.; Haireche, S.; Djeghdjough, M.; Abdellah El-hadj, A.; Bouterfaya, S.; Saidi, D. Effect of copper and chromium addition on the mechanical and wear resistance of tempered hypoeutectic grey cast iron used in Crusher Applications. Int. J. Met. 2022, 16, 1869–1884. [Google Scholar] [CrossRef]
- Huq, M.J.; Shimizu, K.; Kusumoto, K.; Purba, R.H. Three-body abrasive wear performance of high chromium white cast iron with different TI and C content. Lubricants 2022, 10, 348. [Google Scholar] [CrossRef]
- Prasad, B.K. Sliding wear response of a zinc-based alloy and its composite and comparison with a gray cast iron: Influence of external lubrication and microstructural features. Mater. Sci. Eng. A 2005, 392, 427–439. [Google Scholar] [CrossRef]
- Inoue, T.; Shimura, H.; Nakano, M.; Sasaki, S. Damping and tribological properties of Fe–Si–C cast iron prepared using various heat treatments. Mater. Sci. Eng. A-Struct. Mater. Prop. Microstruct. Process. 2006, 432, 113–119. [Google Scholar] [CrossRef]
- Goti, E.; Mura, A.; Wang, H.; Ji, X.; Kong, J. Comparison of the tribological behaviour of various graphene nano-coatings as a solid lubricant for copper. Appl. Sci. 2023, 13, 8540. [Google Scholar] [CrossRef]
- Wang, R.; Ohgata, Y.; Li, Y.; Xiao, T.; Honda, M. Tribocorrosion behaviour of SUS430 stainless steel in aqueous solutions with different ph. Coatings 2023, 13, 1539. [Google Scholar] [CrossRef]
- Wang, Y.; Zhang, J. A review of the friction and wear behavior of particle-reinforced aluminum matrix composites. Lubricants 2023, 11, 317. [Google Scholar] [CrossRef]
- Kumar, T.S.; Shivashankar, G.S.; Dhotey, K.; Singh, J. Experimental study wear rate of glass fibre reinforced epoxy polymer composites filled with aluminium powder. Mater. Today Proc. 2017, 4, 10764–10768. [Google Scholar] [CrossRef]
- Singh, H.; Bhowmick, H. Lubrication characteristics and wear mechanism mapping for hybrid aluminium metal matrix composite sliding under surfactant functionalized MWCNT-oil. Tribol. Int. 2020, 145, 106152. [Google Scholar] [CrossRef]
- Ramkumar, K.R.; Sivasankaran, S.; Al-Mufadi, F.A.; Siddharth, S.; Raghu, R. Investigations on microstructure, mechanical, and tribological behaviour of AA 7075–XWT.% TIC composites for aerospace applications. Arch. Civ. Mech. Eng. 2019, 19, 428–438. [Google Scholar] [CrossRef]
- Bai, M.; Xue, Q. Investigation of wear mechanism of sic particulate-reinforced al-20si-3cu-1mg aluminium matrix composites under dry sliding and water lubrication. Tribol. Int. 1997, 30, 261–269. [Google Scholar] [CrossRef]
- Yakut, R.; Çiftçi, Ö. Investigation of the microstructure, hardness, and compressive properties of TaC-reinforced lamellar graphite cast irons. Eur. Mech. Sci. 2023, 7, 56–62. [Google Scholar] [CrossRef]
- Kuzmanov, P.; Dimitrova, R.; Lazarova, R.; Cherepanov, A.; Popov, S.; Petrov, R.; Manolov, V. Investigation of the structure and mechanical properties of castings of Alloy AlSi7Mg, cast irons GG15 and GG25 and steel GX120MN12, modified by nanosized powders. Proc. Inst. Mech. Eng. Part N J. Nanoeng. Nanosyst. 2013, 228, 11–18. [Google Scholar] [CrossRef]
- Miyake, S. Boundary lubrication properties of diamond and surface-modified diamond films with various water solutions. Thinning Film. Tribol. Interfaces Proc. 26th Leeds-Lyon Symp. Tribol. 2000, 38, 559–568. [Google Scholar] [CrossRef]
- Lathabai, S. An SEM study of mild-to-severe wear transition in grey cast iron during dry sliding. Scr. Mater. 1998, 38, 1557–1562. [Google Scholar] [CrossRef]
- Liu, C.; Du, Y.; Wang, X.; Zheng, Q.; Zhu, X.; Zhang, D.; Liu, D.; Yang, C.; Jiang, B. Comparison of the tribological behavior of quench-tempered ductile iron and austempered ductile iron with similar hardness. Wear 2023, 520–521, 204668. [Google Scholar] [CrossRef]
- Woodward, R.G.; Toumpis, A.; Galloway, A. The influence of tempering and annealing on the microstructure and sliding wear response of G350 grey cast iron. Wear 2022, 496–497, 204283. [Google Scholar] [CrossRef]
- Scandian, C.; Boher, C.; de Mello, J.D.B.; Rézaï-Aria, F. Effect of molybdenum and chromium contents in sliding wear of high-chromium white cast iron: The relationship between microstructure and Wear. Wear 2009, 267, 401–408. [Google Scholar] [CrossRef]
- Zambrano, O.A.; Gómez, J.A.; Coronado, J.J.; Rodríguez, S.A. The sliding wear behaviour of steels with the same hardness. Wear 2019, 418–419, 201–207. [Google Scholar] [CrossRef]
- Akinribide, O.J.; Akinwamide, S.O.; Obadele, B.A.; Ogundare, O.D.; Ayeleru, O.O.; Olubambi, P.A. Tribological behaviour of ductile and austempered grey cast iron under dry environment. Mater. Today Proc. 2021, 38, 1174–1182. [Google Scholar] [CrossRef]
Figure 1.
Brinell hardness measurement values.

Figure 2.
Compression test values.
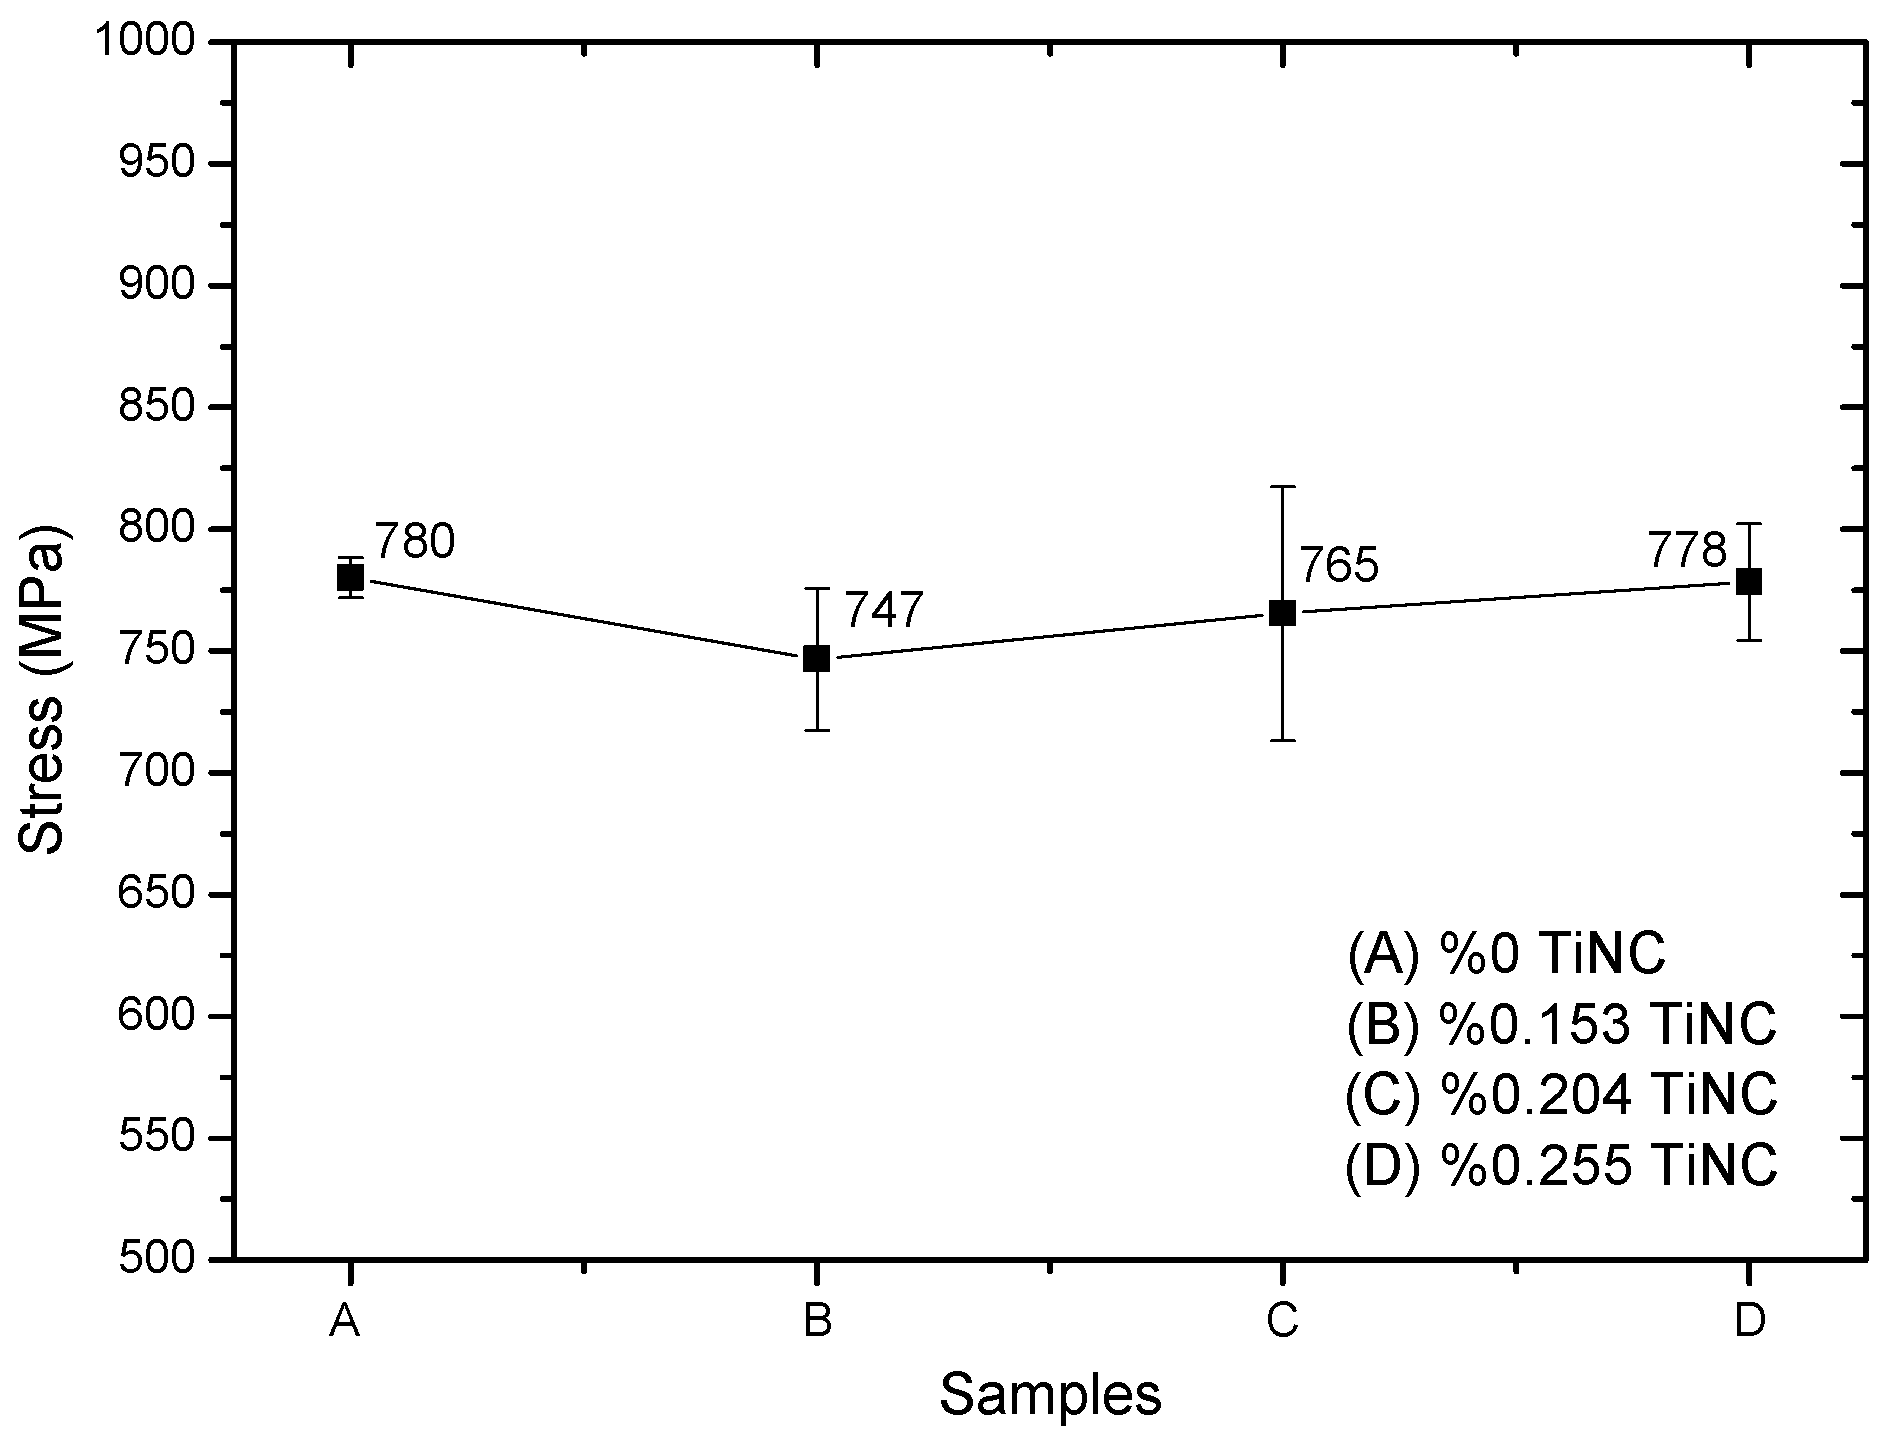
Figure 3.
Compression load fracture damage appearance. (A): %0 TiNC; (B): 0.153 TiNC; (C): %0.204 TiNC; (D): %0.255 TiNC. 1–3 each represent three samples with the same addition ratio of TiNC.
Figure 3.
Compression load fracture damage appearance. (A): %0 TiNC; (B): 0.153 TiNC; (C): %0.204 TiNC; (D): %0.255 TiNC. 1–3 each represent three samples with the same addition ratio of TiNC.

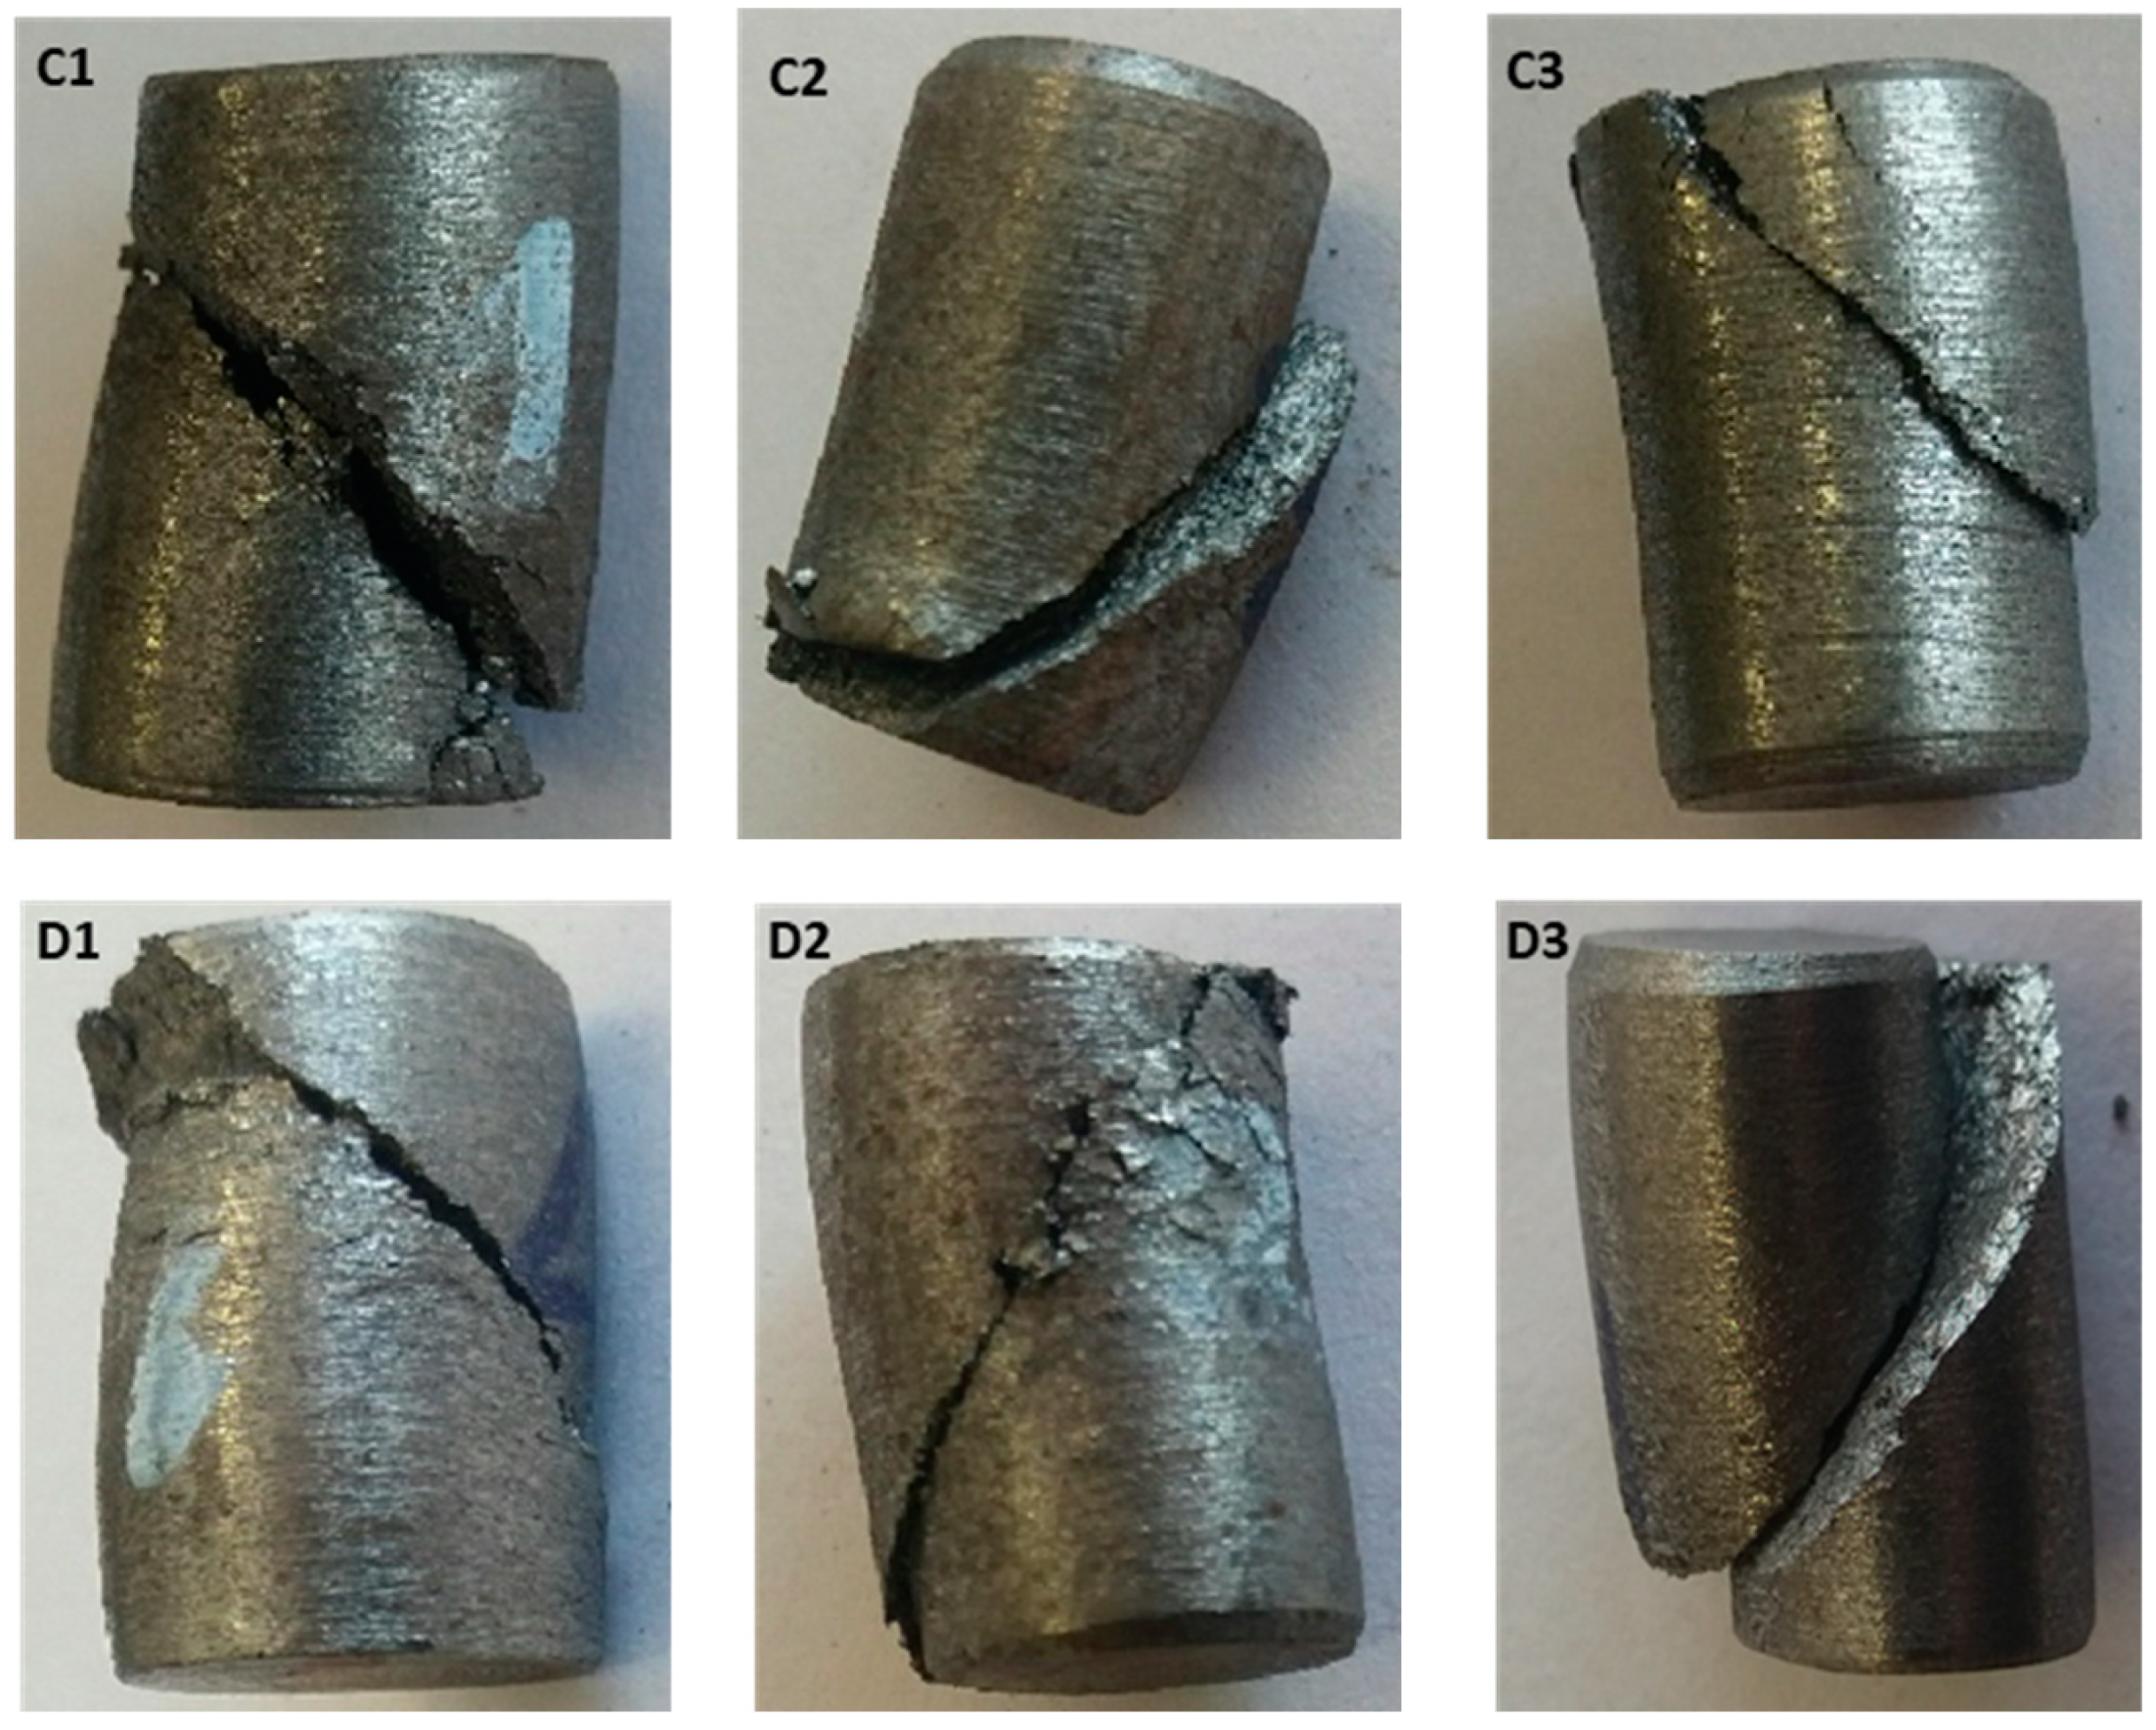
Figure 4.
Compression test stress–strain plots. (A): %0 TiNC; (B): 0.153 TiNC; (C): %0.204 TiNC; (D): %0.255 TiNC. 1–3 each represent three samples with the same addition ratio of TiNC.
Figure 4.
Compression test stress–strain plots. (A): %0 TiNC; (B): 0.153 TiNC; (C): %0.204 TiNC; (D): %0.255 TiNC. 1–3 each represent three samples with the same addition ratio of TiNC.
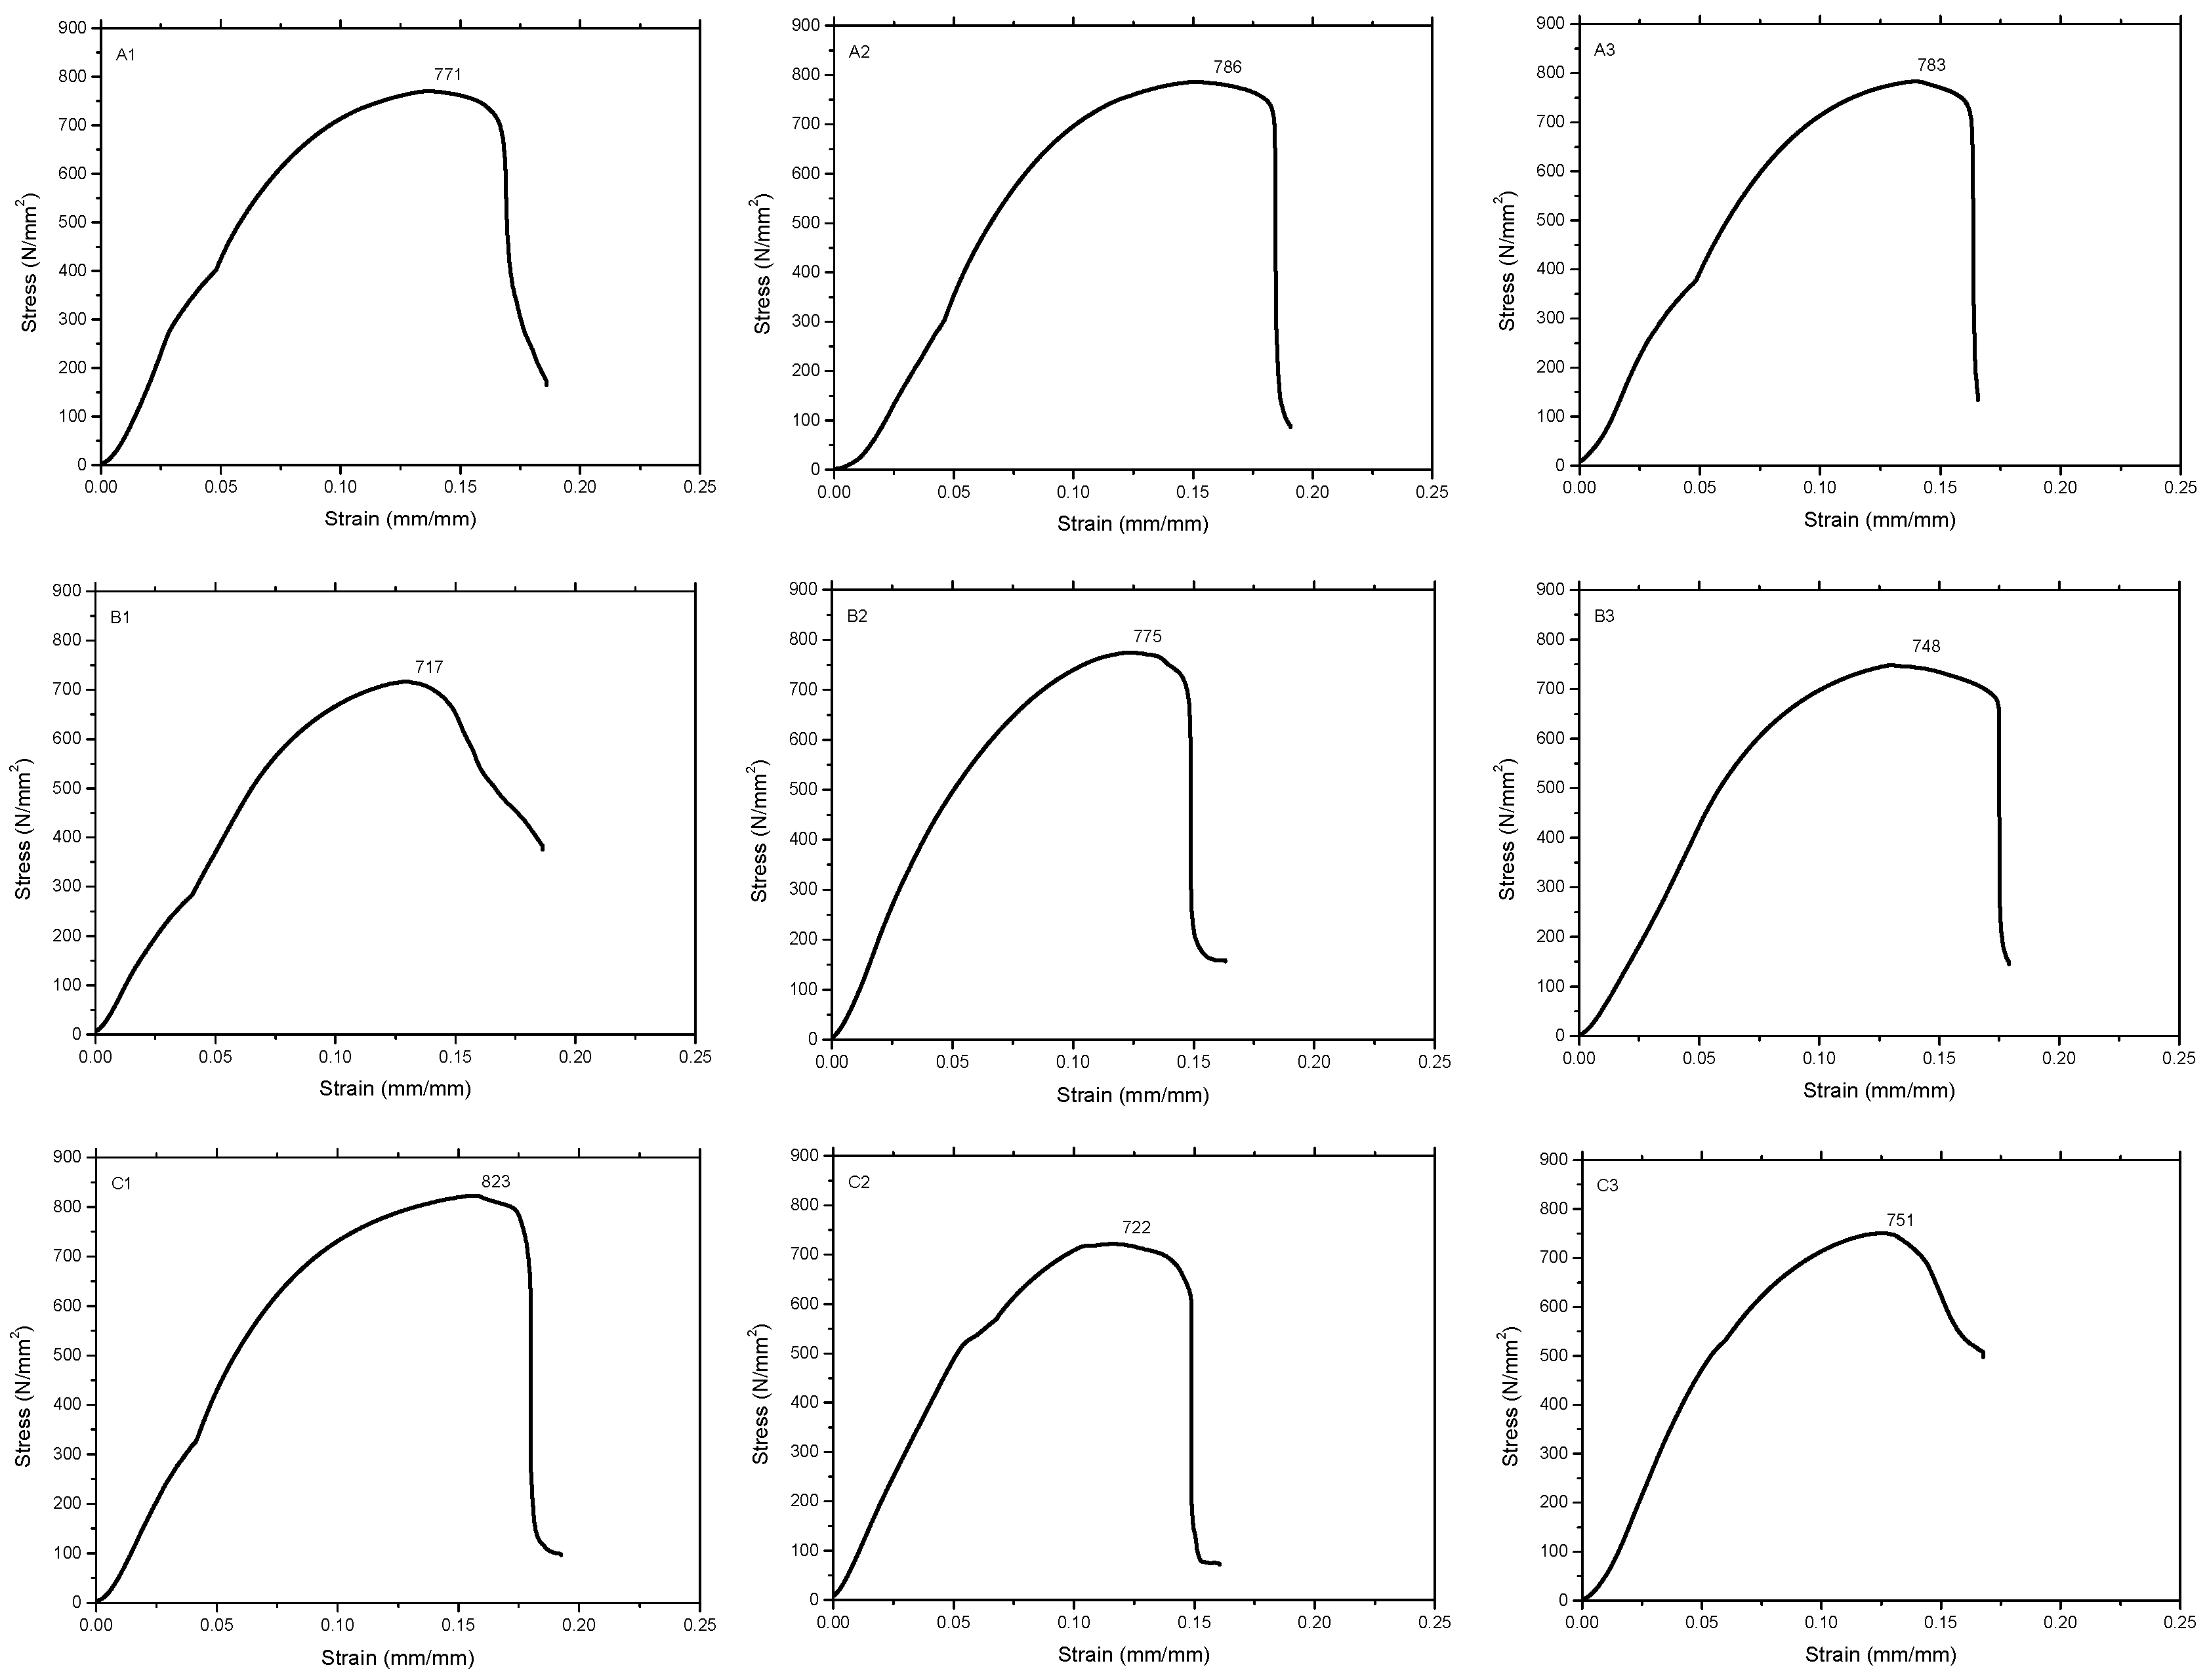

Figure 5.
Friction coefficient changes: 5 N, 10 N and 15 N.
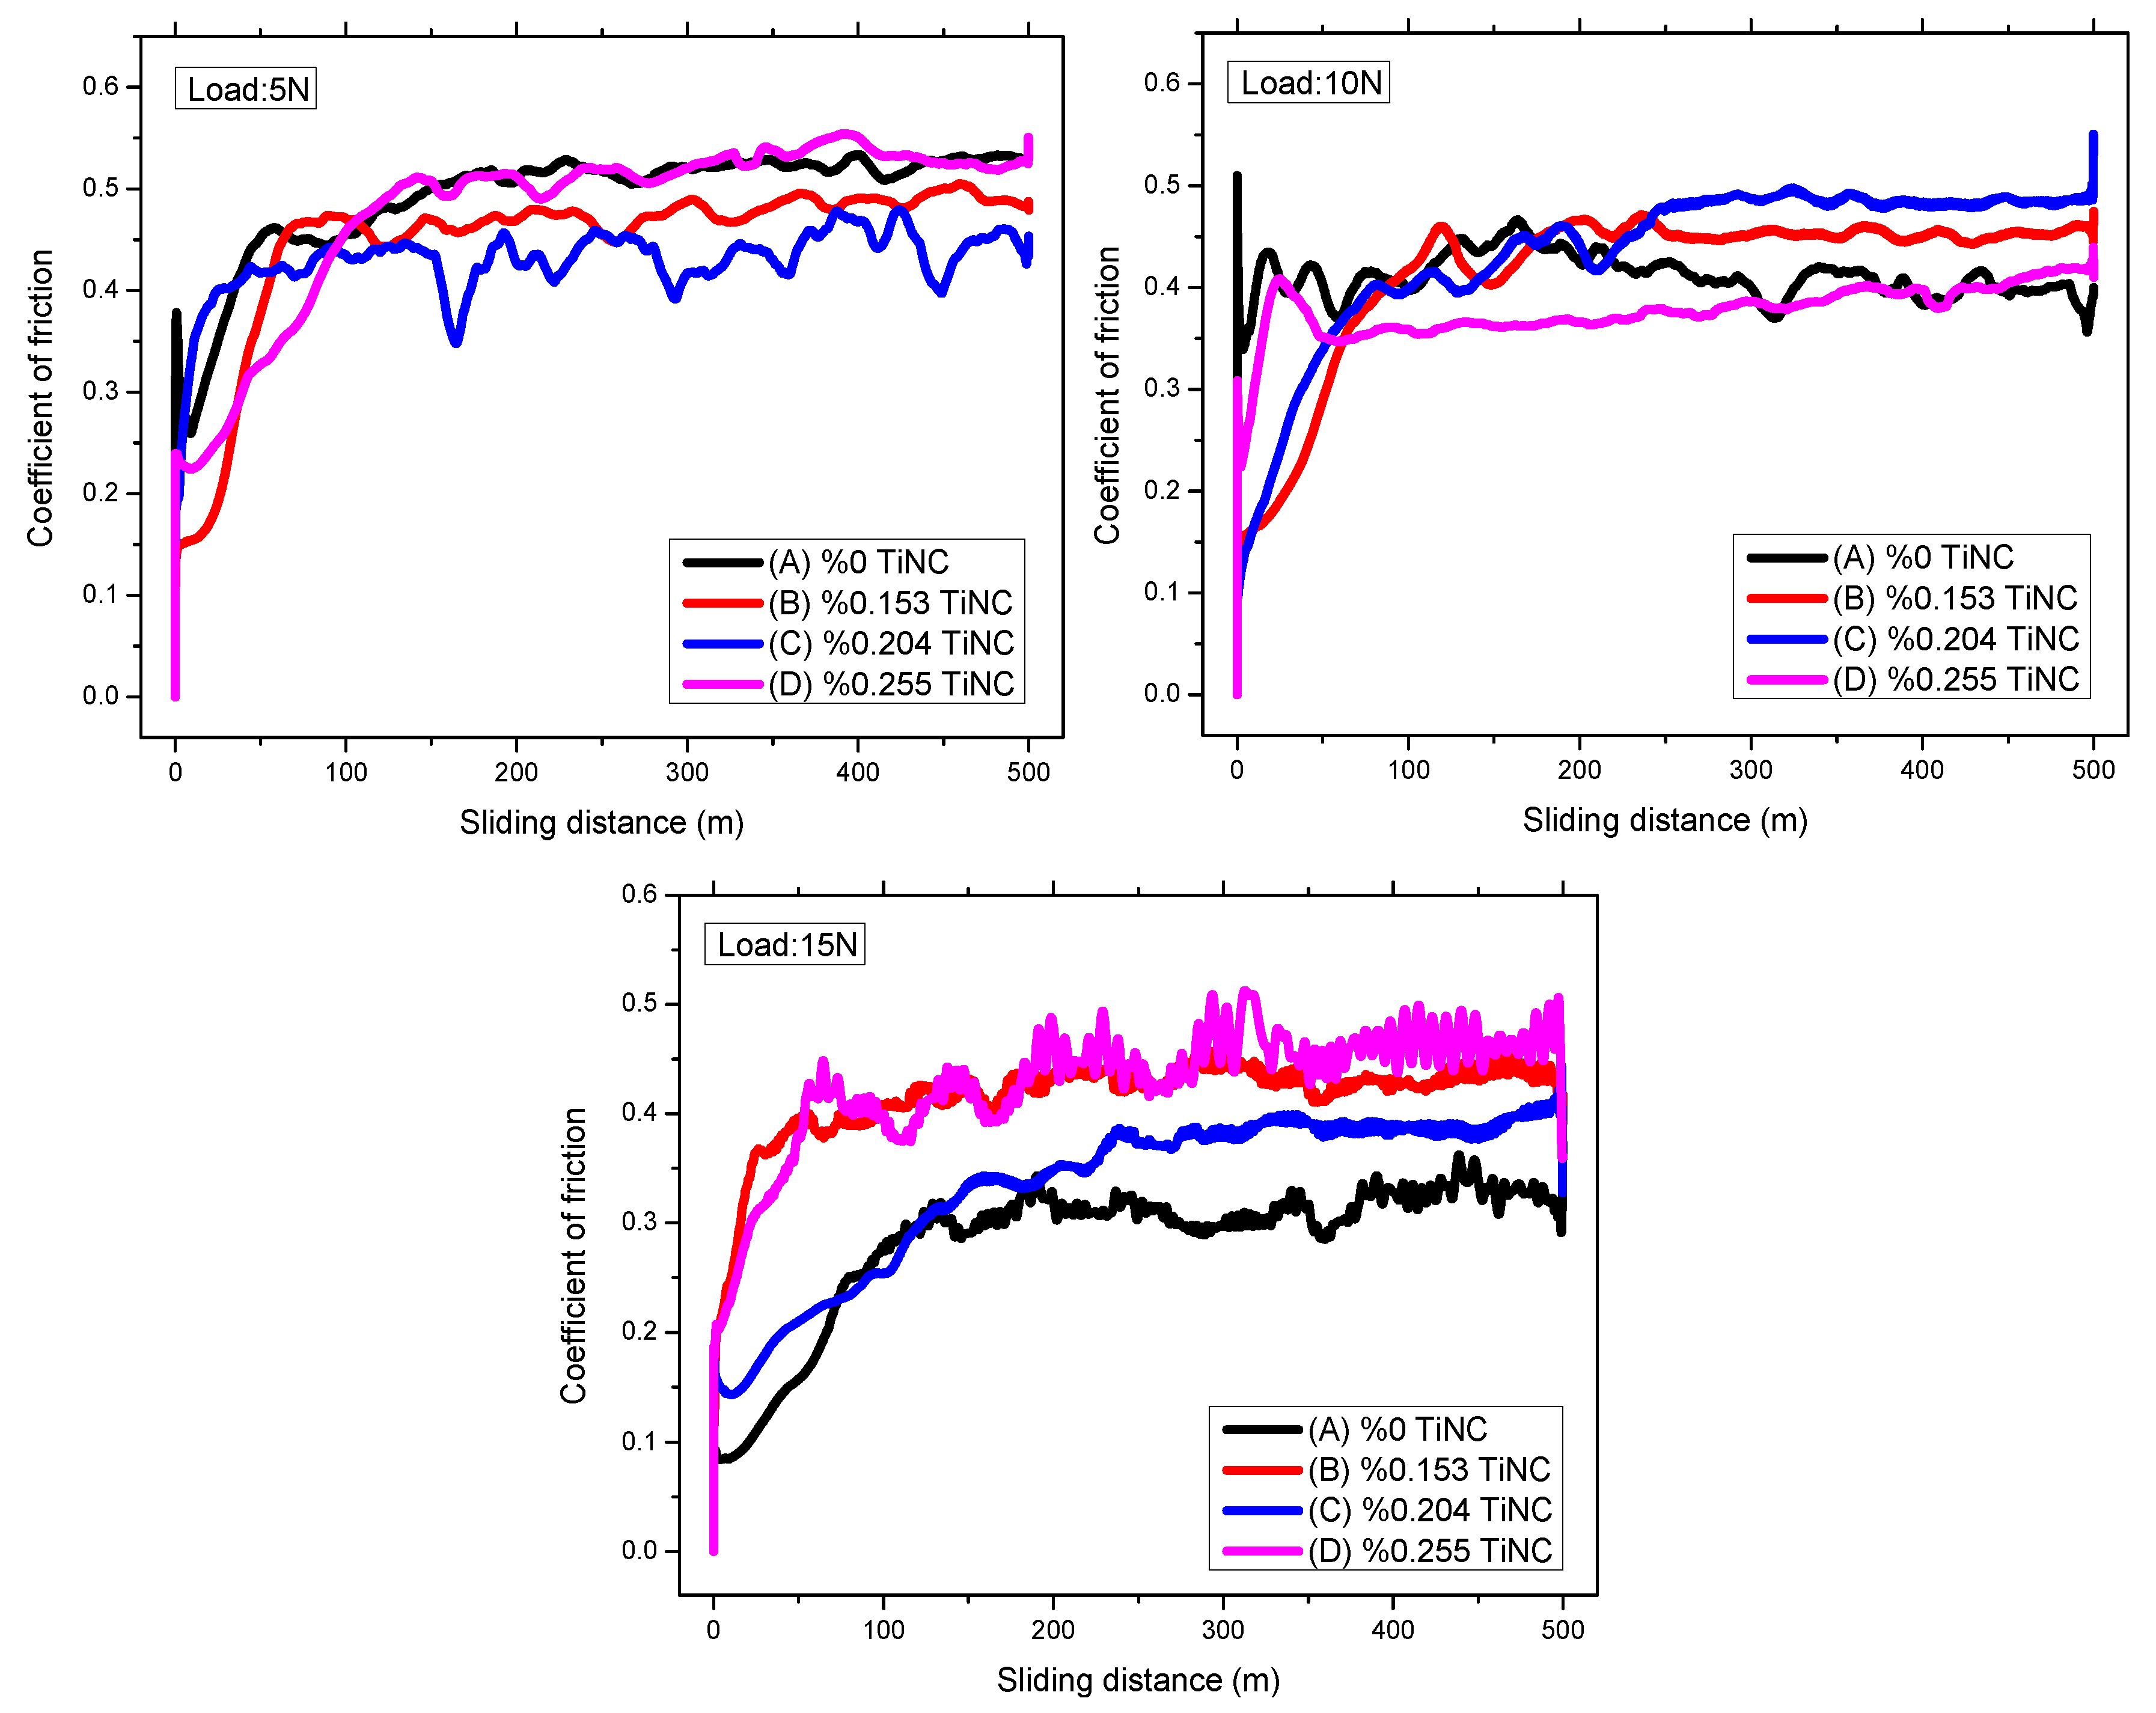
Figure 6.
SEM images after wear tests. (C): %0.204 TiNC; (D): %0.255 TiNC.


Table 1.
Chemical compositions of samples (wt.%).
| No. | C | Si | Mn | P | S | Cr | Ni | Cu | Mg | Nb | Ti | V | Sn | B | Zr | TiNC |
|---|---|---|---|---|---|---|---|---|---|---|---|---|---|---|---|---|
| A | 3.13 | 2.09 | 0.73 | 0.0337 | 0.0941 | 0.313 | 0.0382 | 0.518 | 0.0032 | 0.0060 | 0.0198 | 0.0115 | 0.135 | 0.0025 | 0.0086 | - |
| B | 3.22 | 1.97 | 0.78 | 0.0490 | 0.0771 | 0.336 | 0.0303 | 0.0494 | 0.0031 | 0.0076 | 0.0236 | 0.0115 | 0.146 | 0.0021 | 0.0086 | 0.153 |
| C | 3.15 | 2.01 | 0.74 | 0.0374 | 0.0817 | 0.316 | 0.0368 | 0.0508 | 0.0031 | 0.0056 | 0.0213 | 0.0095 | 0.133 | 0.0024 | 0.0094 | 0.204 |
| D | 3.23 | 2.05 | 0.72 | 0.0318 | 0.0807 | 0.285 | 0.0364 | 0.0515 | 0.0032 | 0.0058 | 0.0200 | 0.0084 | 0.128 | 0.0023 | 0.0077 | 0.255 |
Table 2.
Wear volume, wear rates and average friction coefficients.
| Sample | Load (N) | Volume Loss (×10−1 mm3) | Wear Rate (×10−5 mm3/Nm) | Coefficient of Friction (COF) |
|---|---|---|---|---|
| A (%0 TiNC) | 5 | 0.97 | 3.89 | 0.493 |
| B (%0.153 TiNC) | 5 | 0.55 | 2.18 | 0.449 |
| C (%0.204 TiNC) | 5 | 1.07 | 4.29 | 0.429 |
| D (%0.255 TiNC) | 5 | 1.24 | 4.95 | 0.479 |
| A (%0 TiNC) | 10 | 1.98 | 3.95 | 0.411 |
| B (%0.153 TiNC) | 10 | 1.22 | 2.43 | 0.416 |
| C (%0.204 TiNC) | 10 | 1.32 | 2.64 | 0.434 |
| D (%0.255 TiNC) | 10 | 1.48 | 2.96 | 0.377 |
| A (%0 TiNC) | 15 | 2.38 | 3.18 | 0.284 |
| B (%0.153 TiNC) | 15 | 2.93 | 3.90 | 0.416 |
| C (%0.204 TiNC) | 15 | 1.45 | 1.94 | 0.334 |
| D (%0.255 TiNC) | 15 | 2.23 | 2.98 | 0.429 |
Disclaimer/Publisher’s Note: The statements, opinions and data contained in all publications are solely those of the individual author(s) and contributor(s) and not of MDPI and/or the editor(s). MDPI and/or the editor(s) disclaim responsibility for any injury to people or property resulting from any ideas, methods, instructions or products referred to in the content. |
© 2023 by the author. Licensee MDPI, Basel, Switzerland. This article is an open access article distributed under the terms and conditions of the Creative Commons Attribution (CC BY) license (https://creativecommons.org/licenses/by/4.0/).
Share and Cite
MDPI and ACS Style
Yakut, R. Investigation of Mechanical Properties of Grey Cast Irons Reinforced with Carbon Titanium Nitride (TiNC). Lubricants 2023, 11, 454. https://doi.org/10.3390/lubricants11100454
AMA Style
Yakut R. Investigation of Mechanical Properties of Grey Cast Irons Reinforced with Carbon Titanium Nitride (TiNC). Lubricants. 2023; 11(10):454. https://doi.org/10.3390/lubricants11100454
Chicago/Turabian StyleYakut, Rifat. 2023. "Investigation of Mechanical Properties of Grey Cast Irons Reinforced with Carbon Titanium Nitride (TiNC)" Lubricants 11, no. 10: 454. https://doi.org/10.3390/lubricants11100454
Note that from the first issue of 2016, this journal uses article numbers instead of page numbers. See further details here.