Enhancing the Performance of Rapeseed Oil Lubricant for Machinery Component Applications through Hybrid Blends of Nanoadditives


1
Institute of Machine Design and Tribology, Leibniz University of Hanover, 30823 Hannover, Germany
2
Production Engineering Department, Faculty of Engineering, Alexandria University, Alexandria 21544, Egypt
*
Author to whom correspondence should be addressed.
Lubricants 2023, 11(11), 479; https://doi.org/10.3390/lubricants11110479
Submission received: 29 September 2023
/
Revised: 1 November 2023
/
Accepted: 3 November 2023
/
Published: 6 November 2023
(This article belongs to the Special Issue Additives for Lubricating Oil and Grease: Mechanism, Properties and Applications)
Abstract
:Bio-lubricants have demonstrated promising tribological and physical properties, suggesting their potential advantages in the lubrication of critical machinery components. This study investigates the impact of using blended individual and hybrid nanoadditives, such as graphene nanoplatelets, ZnO, and an ionic liquid (IL) of Trihexyltetradecylphosphonium bis(2,4,4-trimethylpentyl)phosphinate, on the rheological, tribological, and physical characteristics of rapeseed oil. A commercial cutting fluid (BLASER Vasco 6000) (VB 6000) is used for comparison. The results revealed a substantial improvement in viscosity index (VI) values for mixtures containing graphene nanoplatelets, reaching up to 150%, as compared to VB 6000. Regarding the tribological behavior, the friction coefficient achieved a reduction of up to 20% at room temperature (RT) and 26% at 60 °C for the hybrid containing all three nanoadditives (H3), outperforming the commercial fluid. Moreover, H3 demonstrated the most substantial reductions in wear volume (84%) and surface roughness (60%). The wettability of H3 benefited from the combined mechanisms of the applied nanoadditives; its application the contact angle decreased by 63%, revealing its outstanding spreadability. The results reveal the high potential of the H3 hybrid as a competitive and green metal working fluid that can replace hostile and toxic ones in industrial applications.
Keywords:
graphene; ionic liquid; ZnO; rheology; rapeseed oil; wettability; metal cutting fluid; tribology1. Introduction
The environmental impact of petroleum-based lubricants poses a significant challenge due to their limited biodegradability, leading to soil and water contamination upon disposal. A notable solution available in the United States involves the recycling of approximately 1.3 billion gallons of used oils annually to fuel critical industrial operations such as boilers, thus offering a sustainable approach [1,2]. An alternative perspective explores natural bio-lubricants as sustainable and eco-friendly replacements for mineral and synthetic counterparts. These bio-lubricants are free from harmful substances and toxic compounds harmful to humans, such as sulfur. They also exhibit versatility in various applications, including automotive, aerospace, and machinery systems, and prove particularly beneficial in total-loss lubrication systems, safeguarding against potential harm to soil and drinking water [3].
Recently, great attention has been redirected towards vegetable oil, as a natural oil, due to its superior biodegradability over animal fats and esters [4]. It absorbs far greater amounts of carbon dioxide through the photosynthesis process compared to that released due to burning [5]. Among vegetable oils, rapeseed (Canola) oil stands out. This represents 15% of total world consumption of edible oil, ranking third after palm oil (32%) and soybean oil (26%). Several research articles have considered rapeseed oil as a bio-lubricant in different industrial applications [6,7,8] due to its unique fatty acids profile. Its structure contains high oleic acid content (50–65%), a moderate content of linolenic acid (10–20%) and a low content of saturated fatty acids, such as palmitic (4–5%) and stearic acid (1.5–2%) [9].
According to a previous study, compared to mineral oil, rapeseed lubricant showed a lower average coefficient of friction (COF) (by 20%) and a better pitting resistance (by approximately 50%). However, rapeseed oil exhibited poor wear resistance due to th low strength of the lubricating film, which resulted in metal-to-metal contact and adhesive wear [10]. Kandeva et al. [11] focused on studying the behavior of rapeseed oil with novel metal additives in terms of friction and wear using a pin-on-disc tribosystem. They found that the COF and wear rate were reduced by 55% and 61%, respectively, by increasing concentration of copper-based additive up to 3 wt.%.
Despite its noteworthy molecular structure, rapeseed oil is susceptible to oxidation, especially at high temperatures, due to its remarkable percentage of unsaturated fatty chains, containing C=C bonds [12,13]. The oxidation process is responsible for degrading the properties of the bio-oil, significantly affecting the cold flow of the oil [14,15]. Moreover, its tribological and physicochemical properties require a significant improvement to withstand harsh operation conditions.
Several recent investigations have considered ionic liquids (ILs) as promising nanoadditves to mineral and bio-based lubricants due to their distinctive physicochemical and tribological characteristics, offering outstanding thermal stability, high fire resistance, inherent polarity, and low volatility [16,17,18]. Presilla et al. [19] studied the impact using non-halogenated ILs of bis(oxalato)borate [BOB] and bis(mandelato)borate [BMB] in combination with LiX grease. The findings suggested that grease compositions with the applied ILs can offer effective boundary lubrication. This leads to minimal wear and lower friction values, even under moderate contact pressure and when the contact area remains partially covered. According to the authors’ conclusions, this behavior outperforms that of the conventional additives of Zinc dithiophosphate (ZDDP) and MoS2. Another previous study proposed the use of ILs to lubricate 100Cr6 steel substrates instead of ZDDP. ILs are preferred for their capacity to form efficient boundary tribofilms, especially at elevated temperatures of up to 500 °C [20].
Despite the varied types of IL that exist, many investigations focus on phosphonium-based ILs for their good miscibility in oils and their chemical inertness with most organic species [21,22]. In the research conducted by Rohlmann et al. [23], the impact of blending non-halogenated phosphonium orthoborate IL by up to 15 wt.% with bio-oils was studied. The used bio-oils were oil-soluble polyalkylene glycol and Estisol 240 monoester. The findings revealed that the monoester oil, in its pristine state, outperformed the polyalkylene glycol in terms of wear resistance, exhibiting wear values approximately five times lower. However, a noteworthy outcome emerged when IL was introduced into both bio-oils. This addition led to a significant reduction in wear values for polyalkylene glycol, with approximately 92% less wear compared to the result obtained using monoester oil.
Bambam et al. [24] compared the tribological behavior of three types of ILs added to canola oil each with 1 wt.% to be used in machining operations. They used two halogen-based ILs of BMIM PF4 and BMIM PF6 and one halogen-free IL of P6,6,6,14 [(C8)2 PO2]. The halogen-free phosphinate variety showed competent behavior compared to other types as it reduced the COF and wear rate of canola oil by 48% and 73%, respectively. Also, it increased the dynamic viscosity by 36% at RT. This IL type was recommended for machining operations as it improved the cutting parameters by reaching reduction percentages of 68% and 44% in surface roughness and temperature, respectively, as compared to dry machining.
Other investigations introduced the hybridization idea between ionic liquid and other additives, such as ZDDP [25], graphene [26] or, hexagonal boron nitride (h-BN) [27]. The main purpose of these synergies is to combine outstanding tribological and physicochemical properties into one lubricant [28,29,30,31]. Nasser et al. [32] investigated the effects of adding 1 wt.% phosphonium ionic liquid and 0.1 wt.% graphene to PAO32 mineral oil. They observed significant reductions in the coefficient of friction (COF) and wear rate, with drops by up to 36% and 15%, respectively. In another study, the addition of 0.04 wt.% graphene/ionic liquid composite to PAO6 resulted in a considerable decrease of 45% in COF and a substantial 90% reduction in wear rate [33]. Despite the numerous investigations in this field, a considerable research gap still remains concerning the hybridization of ionic liquids with other nanoadditives in rapeseed oil. Additional research is needed to investigate the potential advantages and combined effects of these hybrid lubricants in applications involving rapeseed oil.
This study investigates the impact of incorporating various weight percentages of a phosphonium-based ionic liquid, graphene nanoplatelets, and ZnO nanoparticles as individual nanoadditives, as well as three hybrid combinations of these nanoadditives, on the properties of commercial rapeseed oil. Ionic liquid and ZnO are selected for their physicochemical and tribological properties, while graphene is chosen as a two-dimensional layered antifriction nanoadditive [34,35]. The main objective is to reach optimum rheological, tribological and physical behavior when employing hybrid nanoadditives with the rapeseed oil. The dynamic viscosity is measured in this work at two different temperatures for all tested mixtures to give an indication of rheological behavior, while tribological parameters, such as COF and wear volume values are recorded at a 1 GPa loading condition to define the tribological properties for all mixtures. A wettability test is conducted for selected mixtures, which exhibit outstanding wear behavior, to assess their physical behavior. All findings are compared with those of a commercial cutting fluid BLASER Vasco 6000.
2. Materials and Methods
2.1. Materials and Characterization
In this work, a commercially available edible refined rapeseed oil was purchased from the local market to act as the base bio-oil. 6000. To enhance the properties of bio-oil, three distinct types of nanomaterials were simultaneously utilized as nanoadditives, along with their combined incorporation. These nanomaterials were graphene nanoplatelets (size of 6–8 nm; purity of 99.5%) (Gr), zinc (II) oxide (ZnO) powder (size of 90–210 nm; purity of 99.9%) and Trihexyltetradecylposphonium bis (2,4,4-trimethylpentyl)phosphinate (purity of >90%) ionic liquid (IL) [P66614] [TMPP]. All these nanomaterials were supplied by Ionic liquids technology (Iolitec) GmbH, Heilbronn, Germany. These nanomaterials were selected for their specific properties and potential benefits in enhancing the bio-oil’s performance. To assess the performance of the obtained mixtures, a commercially available cutting fluid of BLASER Vasco 6000 (VB 6000) was used for comparison. Table 1 displays information about rapeseed and VB 6000 oils.
To analyze the particle morphology, size, shape, and the degree of particle aggregation for both graphene and ZnO nanoparticles, scanning electron microscopy (SEM) (JEOL JSM-IT200,) and transmission electron microscopy (TEM) (JEOL JEM-2100, JEOL Ltd., Tokyo, Japan) were employed. For SEM sample preparation, coated powder samples with platinum–palladium (coating was performed using a JEOL JEC-3000 FC Auto Fine Coater) were affixed to a double-face carbon tape. For TEM sample preparation, the nanoparticles were dispersed in an ethanol solution and then underwent sonication for a duration of 15 min. A small droplet of the resulting solution was then placed onto a copper–carbon grid using the drop-casting technique. The analysis was carried out at 200 kV.
Microstructural phases and crystallinity percentages were determined using X-ray diffraction (XRD) spectroscopy (Empyrean Malvern Panalytical, Almelo city, The Netherlands), showing the characteristic peaks for both ZnO and graphene. Regarding the attached functional groups, Fourier-transform infrared (FTIR) spectroscopy (Bruker Company, Billerica, MA, USA) was used to detect the quality of each nanostructure, providing a wide range of detection of up to 4000 cm−1.
In order to confirm the structural quality of graphene along with its layered nature, Raman spectroscopy (WITec alpha 300 R, Braunschweig, Germany) was used to analyze the vibrational modes. A graphene sample was tested in a special chamber, within which the sample was exposed to a laser beam of 532 nm wavelength under 3 mW. The results were detected in 20 s with 5 accumulations.
2.2. Sample Preparation
In this subsection, the focus is on describing the sample preparation techniques for the mixtures, including details on sample size and the weight percentages of the nanoadditives. Initially, each sample was prepared with a volume of 10 mL. Afterwards, various weight percentages of graphene (0.5 wt.%, 1 wt.%, 2 wt.%, and 4 wt.%), ZnO (0.05 wt.%, 0.1 wt.%, 0.25 wt.%, and 0.5 wt.%), and IL (1 wt.%, 2 wt.%, and 5 wt.%) nanoadditives were accurately weighed using a suitable commercial scale (Mettler-Toledo GmbH, Germany) in order to be mixed individually with the bio-oil samples. Also, three hybrid mixtures of 1% IL–4% Gr, 0.1% ZnO–4% Gr and 1% IL–0.1 ZnO–4% Gr were considered in this study, as shown in Table 2.
The mixing process was conducted in accordance with articles from the literature, especially the ones introducing the hybridization idea. It involved two main steps. In the first step, the specified nanomaterials were individually mixed with the oil samples using a Sonorex high-performance ultrasonic bath (BANDELIN GmbH, Berlin, Germany), operating at a frequency of 35 kHz for a duration of 1 h for each sample. This ultrasonic bath facilitated the dispersion and incorporation of the nanoadditives into the bio-oil.
In the second step, the obtained mixtures underwent 10 min of agitation using a Sonopuls ultrasonic homogenizer (BANDELIN GmbH, Berlin, Germany), equipped with an MS72 probe. The homogenization parameters were set to 50% amplitude, a frequency of 20 kHz, and a depth of immersion of about 1.5 cm. This agitation process ensured proper homogenization and uniform distribution of the nanoadditives within the mixtures, as shown in Figure 1.
The combination of the ultrasonic bath and the ultrasonic homogenizer in the sample preparation process aimed to achieve the effective dispersion and homogeneity of the nanoadditives in the bio-oil mixtures, thereby ensuring reliable and consistent results throughout the study.
2.3. Rheological Behavior
To comprehensively assess the rheological properties of the mixture samples, dynamic viscosities were measured using a rotational rheometer (Kinexus Prime lab +, Netzsch GmbH, Selb, Germany) according to ASTM D2196-20, as shown in Figure 2. For each sample, a volume of 0.3 mL was utilized to determine the viscosity measurements. The rheometer subjected the samples to a wide range of shear rates, spanning from 0.1 to 100/s. This broad range of shear rates allowed us to investigate the non-Newtonian behavior of samples.
In addition to shear rate analysis, the measurements were carried out at two distinct temperatures of 40 °C and 100 °C, with 3 repetitions. This temperature-dependent analysis allowed for the examination of how the samples’ rheological behavior was influenced by changes in operating temperature. To evaluate the Newtonian behavior of the mixtures, a power law model was employed to fit the viscosity data [36,37]. The power law model helped us to understand the relationship between shear rate and viscosity, enabling the classification of the samples as either exhibiting Newtonian or non-Newtonian behavior according to the following formula:
where η represents viscosity, γ represents shear rate, K represents the consistency index, and n represents the flow behavior index.
η = K γ n,
2.4. Tribological Properties
The tribological behavior of each mixture was investigated in terms the of coefficient of friction using the same rheometer (Kinexus Prime lab +, Netzsch GmbH, Selb, Germany). A volume of 0.11 mL of each mixture was used in the testing process. The testing attachment consisted of a rotating ball made of 316 stainless steel with a diameter of 12.7 mm. The ball was designed to make contact with three pads of the same material at three distinct points [38], following the guidelines outlined in ASTM D-4172, as shown in Figure 3. A similar technique was proposed in a previous investigation [39].
To capture the tribological response, a wide range of angular velocities was applied to each mixture, ranging from 0.1 to 300 rad/s. The resulting frictional torque values generated during the test were recorded. The measurements were conducted at two different temperatures: 25 °C and 60 °C under a pressure of 1 GPa, with 3 repetitions. The obtained torque values in the boundary regime were translated into the coefficient of friction using the formula:
where µ represents friction coefficient, T represents frictional torque, F represents the normal load, and r represents the radius of contact surface.
µ = T √6/3Fr,
Regarding wear analysis, a Milli Tribotester (Tribotechnic company, Clichy, France) was employed (as depicted in Figure 4) to assess wear characteristics. The test protocol followed ASTM G133-05, which involved scratching a lubricated 316 stainless steel substrate using a 100Cr6 round pin with a diameter of 3 mm. All experiments were conducted at room temperature, maintaining consistent testing conditions including a normal radial load of 1 N (Hertzian contact pressure of 1 GPa), a sliding speed of 4 mm/s, and a stroke length of 2 mm. The outcomes of this analysis, involving wear volume, and surface texture, have been presented and discussed in detail using 3D laser scanning microscope (VK-X250, Keyence GmbH, Neu-Isenburg, Germany).
2.5. Wettability Analysis
Selected representative samples were chosen in order to be assessed for their wettability. The wettability test was conducted on the chosen samples using the Krüss EasyDrop (FM40, KRÜSS GmbH, Hamburg, Germany) goniometer device, according to ASTM D7334-08. The test procedure started with the placement of an oily droplet of 0.3 µL on a flat and polished 316 stainless steel surface using a suitable syringe. After reaching an equilibrium state (within 30 s), a Monochrome interline CCD camera with the assistance of SW21 (DSA 1) software captured suitable images of the droplet, allowing us to specify its contact angle. The test was repeated 4 times and the average value was taken.
3. Results and Discussion
3.1. Materials and Characterization
3.1.1. ZnO Characterization
Figure 5 offers an in-depth microstructural analysis of ZnO nanoparticles, utilizing both scanning electron microscopy (SEM) and transmission electron microscopy (TEM) micrographs. The SEM examination (as illustrated in Figure 5a) was conducted at magnifications of ×20,000 and a resolution of 1 µm. It revealed an irregular structure characterized by crystal formations resembling rosettes. This structure was consistent with the wurtzite hexagonal phase, which was confirmed in previous research articles [40,41]. In terms of the TEM micrograph, images were captured at magnifications of ×50,000 and a resolution of 500 nm. The findings from the SEM micrograph were supported by the TEM micrograph (depicted in Figure 5b), which showed hexagonal nanoparticles with an estimated size of 95 nm.
The graphical representation in Figure 6 clarifies the X-ray diffraction (XRD) pattern of ZnO nanoparticles. An array of angular positions (2θ) were observed at 31.6, 34.28, 36.08, 47.4, 56.42, 62.74, 66.18, 67.78, 68.96, and 76.98 degrees. These angles were associated with the corresponding hkl indices (100), (002), (101), (102), (110), (103), (200), (112), (201), and (202) [42]. The conspicuous manifestation of these distinct peaks offered solid structural integrity of ZnO, with a notable absence of impurities [43]. It is important to note the very sharp (101) peak in the data, which indicates a highly organized ZnO structure. This finding matches the detailed data in the JCPDS card no. 36-1451. [41]. Using the Debye–Scherrer formula, the calculated crystallite size was found to be approximately 30.10 nm with the full width half maximum (FWHM) value of 0.29.
Figure 7 illustrates results of the Fourier-transform infrared (FTIR) spectral analysis, showing the functional groups contained in ZnO nanostructure. It becomes evident that the sample manifested an intermediary adsorption peak placed at 557.98 cm−1, indicating to metal oxide (Zn-O) functional group. This peak served to corroborate the structural robustness and stability. This finding conformed to the XRD findings, which was previously demonstrated through previous studies [44,45]. Regarding vibrational peaks within the range of 800 to 1000 cm−1, they were linked to the Zn-OH group [46]. Of note, the resonance of hydroxyl (O-H) stretching vibrations appeared at dual frequencies of 3441.30 and 2923.90 cm−1, revealing the presence of water molecules within the ZnO structure [47]. The moderate existence of the C-O functional group at 1633.42 cm−1 suggested the possible involvement of carbonaceous materials during ZnO fabrication process [48]. Moreover, the vibrational peaks at 1260.84 and 1383.22 cm−1, ascribed to the C-H2 and C-H bands correspondingly, could be a result of the monoacetate group [49].
3.1.2. Graphene Characterization
Graphene nanostructure was examined to establish its morphology using SEM and TEM. As shown in the SEM images (Figure 8a), less entangled layered nanosheets were recorded, with few folds and wrinkles. The size of each nanosheet was estimated as a ratio between length and thickness (aspect ratio) reaching up to 600. As for TEM micrograph, it confirmed the layered nature of the characterized nanosheets, providing an approximate number of layers to be 4 (Figure 8b).
By studying XRD pattern, shown in Figure 9, it is possible to clearly observe the graphitic basal plane of (002) at 2θ = 24.63°, denoted by a distinctive near-sharp peak. The significance of this peak offered clear affirmation of the graphene structure. Furthermore, the proximate sharpness of the peak served as a strong indication of a graphene structure with few layers, defined by a crystallinity ratio of 54%. Using Scherrer’s and Bragg’s formulas, the average grain size, along with d-spacing, were estimated to be 1.44 nm and 0.37 nm, respectively.
The FTIR spectrum of graphene is depicted in Figure 10a, covering a wide wavelength range from 500 to 3500 cm−1. Notable vibrational peaks emerged prominently at 3421.43, 1629.73, 1386.57, 1191.48, and 754.28 cm−1. The robust presence of the O-H functional group became evident at 3421.43 cm−1, denoting the water content embedded within the graphene structure. The vibrational band at 1629.73 cm−1, indicating C=C stretching, suggested a significant degree of structural integrity. Meanwhile, the modest signal at 1191.48 cm−1 (C-O) implied a restricted abundance of oxygen species capable of infiltrating the covalent basal plane bonds. Additionally, the 1386.57 and 754.28 cm−1 wavenumbers correspond to C-H bending, revealing a marginal presence due to the limited functionalization of hydrogen species with carbon atoms.
In Raman analysis (depicted in Figure 10b), the outcomes revealed three distinct peaks at 1350, 1595, and 2925 cm−1, characterizing the D-, G-, and 2D-bands correspondingly. The D-band predominantly signified structural imperfections. In contrast, the G-band provided insight into the arrangement and symmetry of graphene layers. The 2D-band signified the stacking of layers across the entire graphene structure. The spectrum showed a clear D-band, which suggested that there were significant edge defects in the structure. This matched with the calculated ID/IG ratio of 0.98. Also, the I2D/IG ratio of 0.91 confirmed the same number of graphene layers, which was defined in TEM observations.
3.2. Rheological Behavior
3.2.1. Effect of Shear Rate
In the present and upcoming subsections, the main rheological mechanisms of each nanoadditives are illustrated in comparison to rapeseed oil. In the viscosity index subsection, the commercial cutting fluid BLASER Vasco 6000 (VB 6000) is used for comparison. Figure 11 shows the shear viscosity patterns for each nanoadditive at both 40 °C and 100 °C under a wide range of shear rates. Generally, the addition of nanoparticles to rapeseed oil increases its viscosity at both operating temperatures. Also, increasing the operating temperature has a significant impact on reducing viscosity levels in all samples. This reduction occurs because the forces between the fluid and the nanoparticles, as well as within the fluid itself, decrease. At elevated temperatures, increased thermal energy results in higher molecular movement and weaker interactions between molecules, which promotes improved fluidity and easier flow, making the system less resistant to deformation or shear [50,51]. The effect of each nanomaterial in improving the rheological properties of rapeseed oil at both temperatures will be discussed in detail in the next subsection.
Turning to the shear rate effect, it can be seen in the figure that rapeseed oil in its plain form experiences Newtonian behavior at nearly all shear rates. When graphene nanoadditives are incorporated into the rapeseed oil at concentrations up to 2 wt.% (from S2 to S4), a minor exponential decrease in shear viscosity is observed, according to the power law model, at extremely low shear rates with an n value of about 0.98, as shown in Figure 11a,b. This minor decrease indicates a slight shear thinning behavior, where the fluid’s viscosity decreases with increasing shear rate, resulting in improved flowability at higher velocities.
The shear thinning behavior observed in the mixtures can be attributed to the alignment of graphene nanopoarticles, which is in the direction of flow during shearing, moving to align with separate layers to avoid collisions [52,53]. As the fluid experiences shear forces, the graphene nanosheets align and reduce their flow resistance, particularly at low concentrations. This alignment phenomenon contributes to the observed decrease in viscosity at low shear rates [36]. It is essential to note that the steady-state (Newtonian) behavior of the mixtures starts from a shear rate of 10 s−1. This means that, at shear rates below 10 s−1, the samples exhibit shear thinning behavior, while at shear rates above this threshold they demonstrate a constant viscosity like that of Newtonian fluids. This latter outcome is due to the weakened effect of the intermolecular bonding between the nanofluid molecules [54].
Examining the highest percentage of graphene nanoaddition (S5), with the aim of reaching a Newtonian state around 80 s−1, reveals a significant exponential decrease in dynamic viscosity (n = 0.63) across a wide range of shear rates, particularly at 100 °C. The primary cause of this behavior is the tendency of graphene at higher percentages to agglomerate and form clusters. However, during the test, these agglomerations break up, facilitating the alignment of graphene sheets within the oil matrix. As a result, the nanofluid exhibits reduced viscous dissipation, allowing for smoother flow. This behavior is consistent with findings reported in previous literature [55].
Next we examine IL samples (from S6 to S8), which exhibit a minimal shear thickening behavior (n of up to 1.105) at both operating temperatures, specifically at very low shear rates below 5 s−1, as shown in Figure 11c,d. However, as the shear rate increases beyond this threshold, the samples demonstrate an extended Newtonian behavior throughout the test. Shear thickening behavior is commonly observed in colloidal systems and suspension solutions [56,57], and it is influenced by two key factors: particle size and the concentration of the nanoadditive (volume fraction). In this case, the concentration of the IL in these samples is considered high, resulting in a significant decrease in the critical shear rate value. As a result, the onset of shear thickening occurs at lower shear rate values, as reported previously [58].
The presence of the ionic liquid in the rapeseed oil matrix leads to an increase in the molecular chain length, primarily due to the excellent dispersion of this type of ionic liquid within the oil. This dispersion results in the formation of a complex network structure, which weakens the Brownian motion and decreases the critical shear strain [59]. Therefore, the viscosity of the mixture increases under low shear rates in shear thickening behavior. The interaction and arrangement of the ionic liquid molecules creates temporary particle-like structures that impede the flow of the oil, leading to a jammed state [60]. It is noteworthy that this finding is particularly interesting, as shear thickening behavior at lower shear rates is not commonly observed in studies involving ionic liquids, as stated in previously published articles [61,62,63].
Figure 11d,e shows the rheological behavior of samples containing ZnO nanoparticles (from S9 to S12). When testing all samples at 40 °C and 100 °C with n of up to 1.162, it can be seen that the shear thickening behavior normally appears at lower shear rates (up to 5 s−1). However, testing sample S11 at 100 °C shows instable behavior of shear thickening to be followed by thinning until a Newtonian state beyond 20 s−1 is reached
In order to illustrate the mechanism of shear thickening behavior of ZnO, the nanoparticle size should be taken into concern. Regarding this case, ZnO, as illustrated in the characterization section, has significantly higher particle size than graphene, which enhances the likelihood of hydro-cluster formation [64]. As clusters form, the inter-particle contacts and interactions between the nanoparticles become more significant. The presence of these particle clusters leads to an increase in resistance to flow, resulting in shear thickening behavior [65,66]. The rearrangement and realignment of these clusters under shear pressure causes further disruption and the reformation of particle contacts, contributing to increased viscosity and resistance to flow.
Regarding the hybrid interaction between different nanomaterials in the rapeseed oil, Figure 11g,h reveal that all hybrid samples displayed shear thinning behavior until nearly 20 s−1 at both temperatures, followed by the emergence of a Newtonian attitude. The shear viscosity in the shear thinning zone experiences a lower reduction rate as compared to 4 wt.%, especially i H1 and H3 samples. This may be due to the role of IL in enhancing the dispersion of graphene and ZnO in the base bio-oil. According to previous studies, combining ionic liquid (IL) with various nanoadditives is a promising approach because of ILs’ ability to disperse these nanomaterials effectively in lubricating oils [26,67,68,69]. However, sample H2 recorded the highest dynamic viscosity, with remarkable shear thinning due to the poor dispersion of the ZnO and graphene combination in rapeseed oil. This poor dispersion is attributed to the complete difference in nanostructure between ZnO and graphene.
The reasons behind the effectiveness of ILs in enhancing the dispersion of nanomaterials in base oils are illustrated in four main points. The first one is the surface interaction of polar regions of IL molecules with the surface of the nanomaterial, which decreases susceptibility to agglomeration [21]. Meanwhile, the second one is due to the adsorption of IL molecules to the functional groups attached to the nanoparticle structure, leading to quite compatible mixtures [70]. Turning to the third one, ILs possess high thermal stability [71], which enhances the nanoparticles stability in the mixture at higher temperatures. The final reason lies in the liquid nature of the IL at room temperature (RT), allowing effective penetration through the nanomaterial structure [72].
3.2.2. Effect of Nanoadditive Concentration
Figure 12 displays the distribution of average dynamic viscosities for different sample mixtures. It is clear that all nanoadditives increased the dynamic viscosity of rapeseed oil (S1) at 40 °C and 100 °C by 2% to 180% for the former and 2% to 406% for the latter. The most prominent impact here was attributed to graphene, which contributed most significantly to the enhancement percentage of dynamic viscosity. However, IL and ZnO nanoadditives showed a slightly comparable enhancement percentage at both operating temperatures.
In general, when nanoparticles are dispersed within an oil layer, it can indeed lead to an increase in viscosity. This effect is primarily attributed to the changes in the microstructure and interactions within the fluid system. As the nanoparticles interact with each other and with the oil molecules, they create additional friction and resistance to flow, resulting in an overall increase in viscosity. Regarding graphene nanoadditive, the viscosity continues increasing with raising the amount of graphene in bio-oil, reaching the highest viscosity value at both operating temperatures [73,74]. This may be attributed to the agglomeration effect when introducing higher amounts of graphene inside the oil matrix, leading to a prominent increase in the collision between the nanoparticles and the bio-oil molecules [75]. While this effect is somewhat observable for different ZnO weight percentages, there is only an enhancement from 2 to 8% due to their lower concentrations in the bio-oil [50,76].
IL possesses a slightly higher enhancement compared to ZnO, falling in the range of 5 to 10%. The reason behind this finding is that the longer alkyl chain length of the cations in the IL can contribute to an increase in viscosity because the van der Waals forces between these longer alkyl chains and the oil molecules can be stronger. In addition, longer alkyl chains have a greater ability to entangle with each other and with the oil molecules, forming a more intricate network that hinders fluid flow and results in higher viscosity. This matches with the shear thickening behavior found in the previous subsection. These findings confirm those in the previous literature [24,77]. Upon analyzing the hybrid samples (Figure 11g,h), it becomes evident that all three hybrid mixtures exhibit elevated viscosity values at both temperatures, with H2 displaying the highest values. This observation reaffirms the inadequate dispersion of ZnO with graphene in the bio-oil matrix, particularly in the case of H2. A slight contrast can be observed between H1 and S5 samples, indicating the superior dispersion capability of the ionic liquid (IL) at a high percentage of graphene in the bio-oil matrix. Surprisingly, H3 maintains a lower viscosity value similar to that of other hybrid mixtures at 100 °C, despite containing both graphene and ZnO nanoparticles in the bio-oil matrix. This favorable outcome is likely due to the high thermal properties of graphene along with the distinguished thermal behavior of IL and ZnO, contributing to the enhanced stability under high-temperature conditions, especially for H3.
3.2.3. Viscosity Index
To demonstrate the stability of oil films at elevated temperatures, Figure 13 presents the viscosity index (VI) values for each oil mixture. Notably, the VB 6000 commercial fluid exhibits the lowest VI among the tested lubricants. The VI values show an upward trend with the addition of graphene, reaching a significant increase of 150% compared to VB 6000. This represents the highest VI value achievable for individual mixtures, highlighting the ability of graphene nanosheets to maintain their viscosity values even at higher temperatures, especially at higher weight percentages [73]. Regarding both IL and ZnO, the VI values are remarkably improved compared to VB 6000, with improvement percentages ranging from 10% to 38%. Based on the previous findings, an outstanding performance can be expected for the hybrid samples, which demonstrate a strong increase in VI due to containing higher graphene weight percentage. This underlines the positive impact of graphene on thermal stability of the oil film.
3.3. Tribological Properties
3.3.1. Frictional Behavior
Figure 14 represents the average coefficient of friction values for all lubricant samples at both RT and 60 °C under a contact pressure of 1 GPa within the boundary condition regime. Compared to S1, it is clear that the COF for all mixtures is reduced by a range starting from 11% to 41% at RT and from 1% to 35% at 60 °C. The reduction percentages show a significant decrease when increasing the temperature, except for S2, S3, S5 and S8. This finding matches the results of Zhao et al. [78]. These authors tested hydraulic oil with multilayer graphene at a range of temperatures starting from RT until 100 °C and found a slight decrease in COF values when increasing temperature compared to the RT condition. Another study reported the same behavior when testing Castrol-ATF mineral oil mixed with a hybrid of graphene and ionic liquid nanoadditives [35]. The main reason behind that is the strong relationship between the boundary tribofilm strength and the operating temperature. After an increase in temperature, the viscosity value decreases and a weaker tribofilm of lower thickness forms between the contact bodies. By observing the VB 6000 commercial fluid, we find lower COF values than S1 at both temperatures, revealing its improved frictional behavior. When compared with VB 6000, only H1 is higher in COF at 60 °C. In addition, VB 6000 can function better at RT than S2, S7 and S8. However, H3 is considered the optimum sample for achieving the maximum reduction of up to 30% at both temperatures compared to VB6000.
Looking at the Stribeck curve of individual graphene additions (S2–S5) shown in Figure 15a,b, COF values continue decreasing while graphene percentages increase until reaching a maximum reduction of about 35% at S5 compared to the base bio-oil (S1). Additionally, the difference between COF values for the same weight percentage at the two operating temperatures is found to be negligible, especially for additions more than 0.5 wt.%. The optimum addition for this case is found to be 4 wt.% (S5) at both temperatures. The observed phenomenon can be explained by considering the influence of high loading conditions and the optimum concentration of graphene on the presence of nanoparticles within the rubbing contact. At the optimum concentration, a stable and continuous tribofilm is formed due to the strong interaction of nanoparticles. However, prior to the optimum percentage of graphene, the tribofilm formed is expected to be weaker according to previous investigations, which confirms that the optimal concentration of graphene plays a crucial role in improving the strength of the tribofilm [79,80]. The strong tribofilm formed at the optimum concentration is explained by the effective presence and interaction of nanoparticles within the rubbing contact [81]. Also, graphene nanoadditives activate the sliding mechanism due to its layered 2D structure, which dissipates the frictional energy easily between the contact surfaces, at least according to the discussion in a previous study [82].
IL nanoadditives (S6–S8) (Figure 16a,b) show an increasing trend, where the addition of 1 wt.% (S6) represents the lowest COF at both temperature with a reduction percentage of 40% at RT and 17% at 60 °C. It is obvious from the results that the difference between COF values for S6 at both temperatures is a slightly higher compared to the rest of the IL additions. This may be due to the ability of temperature increases to weaken the formed protective layer at lower IL concentration. In addition, increasing the concentration of IL will increase the thickness and robustness of the protective layers formed between the contact bodies, which are supposed to be more stable at higher temperatures.
However, the increase in the IL concentration beyond 1 wt.% may lead to a slight rise in COF values due to the formation of a complex network structure, causing a jammed state at higher additions. This confirms the viscosity results. The tribo-mechanism is mainly based on the IL alkyl chain, which is long and consists of anions and cations. The anions are adsorbed to the metal surface because of the electrostatic attraction phenomenon [83]. Then, a layer of cations is uniformly arranged between the anions due to the van der Waals bonding between alkyl chains, forming a compact tribolayer. This leads to the formation of a robust thin tribofilm, as shown in Figure 17 [84]. This tribofilm layers can be easily sheared, leading to a significant decrease in the COF [77].
Figure 18a,b illustrate the frictional behavior for different ZnO mixtures (S9–S12). It is shown that the COF value reduces for all ZnO additions compared to rapeseed oil. The COF recorded its lowest value at 0.1 wt.% (S10), after which value increased again, reaching its highest peak at 0.5 wt.% (S12) at both operating temperatures. The maximum reduction percentage was found to be up to 40% at RT and 28% at 60 °C for S10. Compared to S6, S10 can keep smaller difference between its COF values at both operating temperatures. This may be because of the more efficient thermal stability of tribofilm formed at this weight percentage as compared to the optimum percentage of IL. The reduction percentage in COF in this case is higher than that stated in other previous studies. A previous investigation recorded a reduction percentage in COF of about 22% after adding an optimum ZnO addition of 0.6 wt.% to engine oil (10–40 W) [85]. Also, another study reached an ultimate reduction of 15% after employing 0.1 wt.% ZnO to castor oil [86]. However, these studies confirmed the same tribo-mechanisms, which involve filling between the surface asperities in order to heal the contact bodies and reduce roughness. Another mechanism involves the activation of rolling action between the contact bodies, which illustrates why ZnO in S10 at RT is better than graphene in enhancing the COF [76].
The previous findings demonstrated that samples S5, S6, and S10 exhibit the best performance within their respective groups. That is why the hybrid samples were created by combining S5 and S6, S5 and S10, and S5, S6, and S10. The purpose was to investigate the synergistic effect of graphene, IL and ZnO on the tribological characteristics of rapeseed oil. Through an analysis of the hybrid effect on the base bio-oil (Figure 19a,b), it became evident that all hybrid samples enhanced the tribological performance of rapeseed oil. The coefficient of friction (COF) values were reduced by approximately 35–41% at RT and 1–35% at 60 °C.
Among the hybrid samples, H3 demonstrates the most significant effect, exhibiting the least frictional behavior, followed by H2 and then H1. Also, a key observation is the ability of hybrids containing ZnO (H2 and H3) to maintain a consistently low COF value at both temperatures. This behavior can be attributed to the distinctive thermal properties of both graphene and ZnO, especially when combined with IL (H3), enabling the hybrids to withstand temperature variations without experiencing significant changes in their coefficient of friction.
Notably, H3 is the optimum choice compared to all samples. This finding highlights the positive impact of the hybridization process, especially between the three nanoadditives, in terms of enhancing the frictional performance of rapeseed oil. Similar investigations reached a slightly lower reduction percentage in the COF value after employing both graphene and IL to PAO 32 mineral oil. However, this investigation only tested this hybrid mixture at RT [32]. Another study recorded a decrease in the COF by 20% after adding 4 wt.% of a hybrid mixture of graphene oxide (GO)-SiO2-IL to a water-based lubricant [87]. However, the obtained results in this investigation contradict what Murthy et al. [88] found. They confirmed the neutral effect of the 0.02 wt.% graphene-1 wt.% IL hybrid when added to rotorcraft transmission oil. Also, there was no obvious enhancement in tribological behavior compared to the base oil.
3.3.2. Wear Results
In the analysis of wear results, as shown in Figure 20, a difference in wear volume values becomes evident between VB 6000 and S1 lubrication mixtures. The key differentiator lies in the strength of the tribofilm formed during their application under specified conditions. A weaker tribofilm is built in the case of S1, which cannot withstand the abrasion and adhesion wear effect under the specified conditions. This susceptibility arises from the inherent high polarity of rapeseed oil, which lacks the presence of efficacious antiwear additives. Therefore, the formed tribolayer will be effective only in mild wear conditions [10]. Conversely, VB 6000, under the same conditions, showcases improved wear resistance, firmly establishing its superiority. However, the addition of nanoadditives is considered an effective way to strengthen the rapeseed oil tribofilm to overcome the different combined wear mechanisms and compete with VB 6000.
By studying graphene nanoadditive, a consistent decrease in average wear volumes occurs until S5, which exhibits the most significant reduction of 25% compared to rapeseed oil (S1). This reduction pattern aligns with the one of friction coefficients within the graphene group (S2–S5), with S5 demonstrating optimal performance. Again, the mechanism behind this improvement is based on the weak van der Waal bonding between graphitic layers. This bonding can be easily disrupted, allowing for sliding between the contacting surfaces [89]. However, it is important to note that, despite the reduction in wear volume across the graphene mixtures, only the highest graphene concentration (S5) outperforms the commercial fluid, achieving a 5% reduction in wear volume. This behavior can be illustrated by the inability of graphene nanoparticles of percentages less than 4 wt.% to achieve the appropriate surface coverage when compared to VB 6000 [73]. Hence, the wear volume keeps declining when increasing graphene concentration until reaching a superior surface protection than that of VB 6000. Due to its consistent decline in both COF and wear results across various operating temperatures and tribological tests, graphene emerges as the most stable nanomaterial in this investigation with predictable behavior. This can be confirmed through the research of Nassef et al. [80], in which graphene was added to lithium-based grease used to lubricate rolling bearings and showed consistently stable behavior for not only wear results, but also in vibrational behavior.
Next we examine the IL nanoaddition, which shows a continuous exponential decrease, reaching an extreme reduction percentage of 60% at S8 compared to rapeseed oil. The significant superiority of the IL mixtures over the commercial fluid starts to appear in S7. Then, it increases until reaching a noteworthy reduction in wear volume by 46%. According to the frictional behavior discussion, the IL adsorbed layer is enriched with electrons owing to the ionic nature of the IL, resulting in a significant enhancement of electronic conductivity. This, in turn, contributes to notable improvements in heat transfer properties, especially when increasing the IL concentration, which reduces the temperature in the wear track and improves the wear behavior [90,91].
Concerning the incorporation of ZnO additives, it is observed that S9 exhibits the lowest percentage reduction, accounting for a 72% reduction in wear volume compared to VB 6000. Subsequently, this percentage gradually increases until it falls below VB 6000 by a margin of 3% at S12. This notable reduction in wear volume primarily arises from the activation of a rolling action mechanism rather than a mending process within the rubbing contact zone, as discussed in the frictional analysis. Furthermore, the increase in wear volume can be attributed to the agglomeration of ZnO nanoparticles, resulting in the blockage of nanoparticle supply to the contact zone, as corroborated by previous research [50]. An additional perspective on this phenomenon is offered by Singh et al. They conducted trials to enhance the tribological behavior of Euphorbia Lathyris oil through ZnO addition. Their findings suggest that exceeding the optimal ZnO percentage in the oil leads to a significant increase in wear volume due to adhesive mechanisms. In their study, they reported a 50% reduction in mass loss by incorporating 0.5 wt.% ZnO into the lubricant [76]. However, these findings do not align with the results presented in the current study, in which a higher percentage of reduction can be offered at very small percentage of addition of 0.05 wt.% (S9).
By comparing the hybrid samples with the commercial VB 6000, the wear volume diminishes by a range starting from 6% to 84%. This finding reveals the promising milestone that can be achieved, especially after replacing VB 6000 with H3. H3 is considered the best combination, followed by H1. Also, H3 can combine the whole tribo-mechanisms of the individual nanoadditives into one mixture, which explains its superiority and excellence.
One crucial method for evaluating the effectiveness of the formed tribofilm is monitoring the roughness values on the surfaces of the wear tracks [68]. In Figure 21, the average roughness values (Ra) of the worn tracks for selected optimal samples are compared to those of the base oils. It is evident that the surface lubricated with the VB 6000 commercial fluid exhibits slightly smoother characteristics compared to S1. This observation aligns with the wear volume results, indicating that the boundary film created by VB 6000 is more stable than that of S1. When nanoadditives are introduced, there is a noteworthy reduction in roughness values by 6%, 34%, and 42% for S5, S8, and S9, respectively. This reduction signifies an enhancement in the bond strength between the lubricated surface and the lubricant mixture, resulting in more robust and reliable tribofilms. Considering the hybrid sample H3, it is evident that it exhibits a substantial 60% reduction in roughness values compared to rapeseed oil (S1). This reduction in the roughness value can be ascribed to the synergistic effect of the three applied nanoadditives. These nanoadditives collaborate to enhance and protect the tribo-surface by forming a remarkably robust and thin layer that firmly adheres to the surface.
In Figure 22, the 3D wear scar profiles for S9 and H3 are presented alongside those of S1 and VB 6000 oils for comparison. Notably, the wear scars on S1 and VB 6000 exhibit greater depth, indicating the superior performance of S9 and H3 in terms of wear resistance. Notably, H3 shows nearly invisible wear scars within the 3D profile, revealing its distinguished tribological properties.
In order to analyze track morphology of the selected samples, Figure 23 reveals the morphology of S1, VB 6000, S9 and H3. Regarding S1 (Figure 23a), it can be seen that the surface morphology is full of deep beside shallow scratches accompanied with significant delamination and adhesion wear. This is attributed to the significant weakness of the built tribofilm in achieving full coverage and protection, confirming the wear volume and roughness results. Looking at VB 6000 (Figure 23b), the severity of wear is reduced compared to S1 due to the effect of antiwear additives in this commercial fluid. However, there are still some severe, deep grooves, with significant adhesive wear in different spots, a fact confirmed by the 3D image.
Considering the S9 sample (Figure 23c), the overall surface morphology is improved by experiencing limited deep grooves along with slight adhesive wear. This behavior confirms the outstanding wear properties of ZnO nanoparticles, which activate the rolling action and allow for less wear action. Turning to the hybrid sample H3 (Figure 23d), a discontinuous wear area is displayed with repetitive smooth surfaces separated by abrasive wear grooves. However, these grooves are considered shallow according to the 3D image, which denies the possibility of the existence of severe wear. This finding confirms the positive synergistic effect of the applied three nanoadditives, which employ 3 different tribo-mechanisms to protect the surface. Based on which, the built tribofilm is considered to be the strongest, conforming to the roughness results.
3.4. Wettability Analysis
Figure 24 shows the spreadability of selected samples of S9 (Figure 24c) and H3 (Figure 24d) in terms of the droplet contact angle with the steel substrate. The angle values are compared to those of the base oils. It is observed that VB 6000 (Figure 24a) records the highest contact angle of 27°, while the rapeseed base oil (S1) (Figure 24b) shows spreading characteristic enhancements of 11%. This finding has been confirmed by Carvalho et al. [92] after testing a vegetable-based emulsion as a cutting fluid on an AISI 1050 steel surface. They suggested that the vegetable oil structure consists of polar molecules that exhibit improved alignment and compatibility with the steel surface.
The introduction of ZnO nanoparticles into rapeseed oil, as shown in the case of S9, leads to a significant improvement in wettability, characterized by a notable reduction in the contact angle to 20° (representing a 26% decrease compared to VB 6000). Regarding H3, the contact angle is reduced by 63% and 58%, as compared to VB 6000 and S1, respectively. To understand the mechanisms behind the enhanced wettability in the case of S9 and H3, two primary factors are taken into consideration. The first is the structural arrangement of nanoadditives [93] and the second is the adsorption of nanomaterials onto the substrate surface [94].
The former mechanism involves the dispersion and alignment of nanoparticles at the interface between the liquid and the substrate, effectively diminishing the contact angle by minimizing the curvature of the liquid–steel interface. The latter mechanism encompasses the adhesion of nanoparticles to the substrate surface via various intermolecular forces, resulting in surface modifications conducive to improved wetting. In the cases of ZnO in S9 and H3, as well as graphene in H3, both mechanisms likely contribute to enhancing interactions between the liquid and the substrate surface. As for IL, the elongated alkyl chain inherent in IL structures serves to enhance ILs’ adsorption affinity for the steel surface. Additionally, it is worth noting that prior investigations have documented the notably elevated polarity exhibited by phosphonium-based ILs, further augmenting their adsorption characteristics [77,95].
4. Conclusions
This study extensively examined the impact of incorporating various highly effective nanoadditives, including graphene nanoplatelets, ZnO, and IL, both individually and in hybrid combinations with rapeseed oil. The primary goal was to assess how these nanoadditives affect the rheological, physical, and lubrication properties of bio-oil. For comparative purposes, a commercial cutting fluid (VB 6000) was introduced. The key findings of this investigation can be summarized as follows:
- The addition of graphene to rapeseed oil resulted in shear thinning behavior, while ZnO and IL exhibited a shear thickening trend. When these nanoadditives were combined in hybrids, such as H1, H2, and H3, the shear thickening behavior of ZnO and IL transformed into a milder shear thinning behavior, approaching a near-Newtonian behavior, particularly in H1 and H3.
- VI values showed a drastic increase of up to 150% after adding graphene to rapeseed oil, emphasizing its superior thermal stability when compared to ZnO and IL, which exhibited enhancements in the range of 10% to 38% compared to VB 6000.
- The frictional behavior of the prepared mixtures demonstrated reductions of up to 41% and 35% at room temperature (RT) and 60 °C, respectively, when compared to the bio-oil sample (S1). Notably, H3 emerged as the optimal sample, exhibiting the most substantial decrease in coefficient of friction (COF) by up to 30%, as compared to VB 6000.
- Concerning wear behavior, H3 exhibited negligible wear scar, achieving a superior reduction in wear volume by 84% when compared to VB 6000. This highlights its enhanced wear resistance, further supported by its minimal average roughness value on the worn surface and the smoothest worn area.
- The physical behavior of the chosen optimal samples, S9 and H3, was evaluated by examining their wettability characteristics. H3 exhibited significantly superior wettability on a stainless-steel surface, surpassing VB 6000 by 63%.
Based on the preceding findings, a strong recommendation is made to consider the H3 mixture as a promising lubricant candidate for metalworking processes. This recommendation is mainly based on its distinguished tribological behavior within rubbing contacts, its improved VI value, and its remarkable wettability characteristics.
Author Contributions
Conceptualization, B.G.N., F.P. and G.P.; methodology, B.G.N. and F.P.; samples preparation, B.G.N.; validation, B.G.N., F.P. and G.P.; formal analysis, B.G.N. and F.P.; investigation, B.G.N.; resources, F.P. and B.G.N.; data curation, B.G.N., F.P. and G.P.; writing—original draft preparation, B.G.N. and F.P.; writing—review & editing, G.P. and F.P.; visualization, G.P. and F.P.; project administration, G.P. and F.P. All authors have read and agreed to the published version of the manuscript.
Funding
The authors appreciate the funding of this work within the Priority Program 2231 “Effi-cient cooling, lubrication and transportation—coupled mechanical and fluid-dynamical simulation methods for efficient production processes (FLUSIMPRO)” by the German Research Foundation (DFG)—project number 439904924. The publication of this article was funded by the Open Access Fund of Leibniz Universität Hannover.
Data Availability Statement
Not applicable.
Acknowledgments
We would like to express our sincere appreciation to Netszch GmbH in Germany for their invaluable assistance with the rotational rheometer. Additionally, we extend our gratitude to the Institute for Multiphase Processes (IMP) at Leibniz University Hannover, Germany, for their valuable support in conducting wettability tests. We also acknowledge the Faculty of Science at Alexandria University, Egypt, and the City of Scientific Research and Technological Applications (SRTA) in Alexandria, Egypt, for their collaborative efforts in characterizing graphene and ZnO nanostructures.
Conflicts of Interest
The authors declare no conflict of interest.
References
- Can Oil Be Recycled? 2009. Available online: https://www.scientificamerican.com/article/can-oil-be-recycled/#:~:text=Condela%3A%20There’s%20about%201.3%20billion,power%20plants%20or%20industrial%20boilers (accessed on 19 October 2023).
- Machine Oil: Reclaim, Recycle or Regenerate? Available online: https://www.skf.com/id/services/recondoil/knowledge-hub/recondoil-articles/machine-oil-reclaim-recycle-or-regenerate (accessed on 19 October 2023).
- Abere, J.O. Improved Performance of Bio-Lubricant by Nanoparticles Additives. Ph.D. Thesis, University of Sheffield, Sheffield, UK, 2017. [Google Scholar]
- Lee, C.T.; Lee, M.B.; Mong, G.R.; Chong, W.W.F. A bibliometric analysis on the tribological and physicochemical properties of vegetable oil–based bio-lubricants (2010–2021). Environ. Sci. Pollut. Res. 2022, 29, 56215–56248. [Google Scholar] [CrossRef] [PubMed]
- Muhammad, C.; Usman, Z.; Agada, F. Biodiesel production from Ceiba pentandra seed oil using CaO derived from snail shell as catalyst. Pet. Sci. Eng. 2018, 2, 7–16. [Google Scholar] [CrossRef]
- Kumar, G.; Garg, H.C. Influence of a halogen free ionic liquid on the rheological and tribological characteristics of canola oil. Ind. Lubr. Tribol. 2022, 74, 914–921. [Google Scholar] [CrossRef]
- Wu, X.; Zhang, X.; Yang, S.; Chen, H.; Wang, D. The study of epoxidized rapeseed oil used as a potential biodegradable lubricant. J. Am. Oil Chem. Soc. 2000, 77, 561–563. [Google Scholar] [CrossRef]
- Durak, E.r. A study on friction behavior of rapeseed oil as an environmentally friendly additive in lubricating oil. Ind. Lubr. Tribol. 2004, 56, 23–37. [Google Scholar] [CrossRef]
- Matthaus, B.; Özcan, M.M.; Al Juhaimi, F. Some rape/canola seed oils: Fatty acid composition and tocopherols. Z. Naturforschung C 2016, 71, 73–77. [Google Scholar] [CrossRef]
- Arnšek, A.; Vižintin, J. Lubricating properties of rapeseed-based oils. J. Synth. Lubr. 2000, 16, 281–296. [Google Scholar] [CrossRef]
- Kandeva, M.; Kalitchin, Z.; Zadorozhnaya, E.; Vencl, A. Performance characteristics of lubricant based on rapeseed oil containing different amounts of metal-containing additive. Ind. Lubr. Tribol. 2022, 74, 309–315. [Google Scholar] [CrossRef]
- Maszewska, M.; Florowska, A.; Dłużewska, E.; Wroniak, M.; Marciniak-Lukasiak, K.; Żbikowska, A. Oxidative Stability of Selected Edible Oils. Molecules 2018, 23, 1746. [Google Scholar] [CrossRef] [PubMed]
- Choe, E.; Min, D.B. Mechanisms and Factors for Edible Oil Oxidation. Compr. Rev. Food Sci. Food Saf. 2006, 5, 169–186. [Google Scholar] [CrossRef]
- Parker, T.D.; Adams, D.; Zhou, K.; Harris, M.; Yu, L. Fatty acid composition and oxidative stability of cold-pressed edible seed oils. J. Food Sci. 2003, 68, 1240–1243. [Google Scholar] [CrossRef]
- Gertz, C.; Klostermann, S.; Kochhar, S.P. Testing and comparing oxidative stability of vegetable oils and fats at frying temperature. Eur. J. Lipid Sci. 2000, 102, 543–551. [Google Scholar] [CrossRef]
- Zhou, Y.; Qu, J. Ionic Liquids as Lubricant Additives: A Review. ACS Appl. Mater. Interfaces 2017, 9, 3209–3222. [Google Scholar] [CrossRef] [PubMed]
- Liu, X.; Zhou, F.; Liang, Y.; Liu, W. Tribological performance of phosphonium based ionic liquids for an aluminum-on-steel system and opinions on lubrication mechanism. Wear 2006, 261, 1174–1179. [Google Scholar] [CrossRef]
- Gutierrez, M.A.; Haselkorn, M.; Iglesias, P. The Lubrication Ability of Ionic Liquids as Additives for Wind Turbine Gearboxes Oils. Lubricants 2016, 4, 14. [Google Scholar] [CrossRef]
- Presilla, R.; Leckner, J.; Glavatskih, S. Grease lubricity in the fretting contact: Are ionic liquids the solution? Tribol. Int. 2023, 185, 108509. [Google Scholar] [CrossRef]
- Mallach, D.; Pape, F.; Lipinsky, D.; Arlinghaus, H.F. ToF-SIMS analysis of boundary layers formed under zinc-free antiwear. Ind. Lubr. Tribol. 2020, 72, 1013–1017. [Google Scholar] [CrossRef]
- Kronberger, M.; Pagano, F.; Pejaković, V.; Igartua, A.; Urbistondo, E.; Kalin, M. Miscibility and tribological investigations of ionic liquids in biodegradable esters. Lubr. Sci. 2014, 26, 463–487. [Google Scholar] [CrossRef]
- González, R.; Viesca, J.L.; Battez, A.H.; Hadfield, M.; Fernández-González, A.; Bartolomé, M. Two phosphonium cation-based ionic liquids as lubricant additive to a polyalphaolefin base oil. J. Mol. Liq. 2019, 293, 111536. [Google Scholar] [CrossRef]
- Rohlmann, P.; Munavirov, B.; Furó, I.; Antzutkin, O.; Rutland, M.W.; Glavatskih, S. Non-halogenated Ionic Liquid Dramatically Enhances Tribological Performance of Biodegradable Oils. Front Chem. 2019, 7, 98. [Google Scholar] [CrossRef]
- Bambam, A.K.; Alok, A.; Rajak, A.; Gajrani, K.K. Tribological performance of phosphonium-based halogen-free ionic liquids as lubricant additives. Proc. Inst. Mech. Eng. Part J J. Eng. Tribol. 2023, 237, 881–893. [Google Scholar] [CrossRef]
- Yang, S.; Zhang, D.; Wong, J.S.; Cai, M. Interactions between ZDDP and an oil-soluble ionic liquid additive. Tribol. Int. 2021, 158, 106938. [Google Scholar] [CrossRef]
- Sanes, J.; Avilés, M.-D.; Saurín, N.; Espinosa, T.; Carrión, F.-J.; Bermúdez, M.-D. Synergy between graphene and ionic liquid lubricant additives. Tribol. Int. 2017, 116, 371–382. [Google Scholar] [CrossRef]
- Nasser, K.I.; del Río, J.M.L.; Lopez, E.R.; Fernandez, J. Synergistic effects of hexagonal boron nitride nanoparticles and phosphonium ionic liquids as hybrid lubricant additives. J. Mol. Liq. 2020, 311, 113343. [Google Scholar] [CrossRef]
- José, M.; del Río, L.; López, E.R.; Fernández, J. Synergy between boron nitride or graphene nanoplatelets and tri(butyl)ethylphosphonium diethylphosphate ionic liquid as lubricant additives of triisotridecyltrimellitate oil. J. Mol. Liq. 2020, 301, 112442. [Google Scholar] [CrossRef]
- Maurya, U.; Vasu, V.; Kashinath, D. Ionic Liquid-Nanoparticle-Based Hybrid-Nanolubricant Additives for Potential Enhancement of Tribological Properties of Lubricants and Their Comparative Study with ZDDP. Tribol. Lett. 2022, 70, 11. [Google Scholar] [CrossRef]
- Sikdar, S.; Rahman, M.H.; Menezes, P.L. Synergistic Study of Solid Lubricant Nano-Additives Incorporated in canola oil for Enhancing Energy Efficiency and Sustainability. Sustainability 2022, 14, 290. [Google Scholar] [CrossRef]
- Seymour, B.T.; Fu, W.; Wright, R.A.; Luo, H.; Qu, J.; Dai, S.; Zhao, B. Improved lubricating performance by combining oil-soluble hairy silica nanoparticles and an ionic liquid as an additive for a synthetic base oil. ACS Appl. Mater. Interfaces 2018, 10, 15129–15139. [Google Scholar] [CrossRef]
- Nasser, K.I.; Liñeira del Río, J.M.; López, E.R.; Fernández, J. Hybrid combinations of graphene nanoplatelets and phosphonium ionic liquids as lubricant additives for a polyalphaolefin. J. Mol. Liq. 2021, 336, 116266. [Google Scholar] [CrossRef]
- Liu, L.; Zhou, M.; Mo, Y.; Bai, P.; Wei, Q.; Jin, L.; You, S.; Wang, M.; Li, L.; Chen, X.; et al. Synergistic lubricating effect of graphene/ionic liquid composite material used as an additive. Friction 2021, 9, 1568–1579. [Google Scholar] [CrossRef]
- Pape, F.; Poll, G. Investigations on Graphene Platelets as Dry Lubricant and as Grease Additive for Sliding Contacts and Rolling Bearing Application. Lubricants 2020, 8, 3. [Google Scholar] [CrossRef]
- Nassef, B.G.; El-Labban, H.; Al-Oufy, A.; Daha, M. Effect of Graphene Addition to Lithium-Based Grease on the Performance of Rolling Element Bearings. Key Eng. Mater. 2022, 913, 279–284. [Google Scholar] [CrossRef]
- Ho, C.Y.; Yusup, S.; Soon, C.V.; Arpin, M.T. Rheological Behaviour of Graphene Nano-sheets in Hydrogenated Oil-based Drilling Fluid. Procedia Eng. 2016, 148, 49–56. [Google Scholar] [CrossRef]
- Hasan, W.; Khan, M.N. Rheological characterization of vegetable oil blends: Effect of shear rate, temperature, and short-term heating. J. Food Process Eng. 2020, 43, e13396. [Google Scholar] [CrossRef]
- Läuger, J.; Pondicherry, K. New Insights into the Use of a Rotational Rheometer as Tribometer. Annu. Trans. Nord. Rheol. Soc. 2017, 25, 1–10. [Google Scholar]
- Amann, T.; Gatti, F.; Li, K.; Demirel, Y.; Kailer, A.; Feng, H.; Yuan, C. Investigation of ionic liquids with and without graphene as lubricant additive for metal/metal and metal/PEEK contacts over a wide temperature range. Lubr. Sci. 2021, 33, 100–111. [Google Scholar] [CrossRef]
- Cao, D.; Gong, S.; Shu, X.; Zhu, D.; Liang, S. Preparation of ZnO Nanoparticles with High Dispersibility Based on Oriented Attachment (OA) Process. Nanoscale Res. Lett. 2019, 14, 210. [Google Scholar] [CrossRef]
- Gavhane, R.S.; Kate, A.M.; Pawar, A.; Safaei, M.R.; Soudagar, M.E.M.; Abbas, M.M.; Ali, H.M.; Banapurmath, N.R.; Goodarzi, M.; Badruddin, I.A.; et al. Effect of Zinc Oxide Nano-Additives and Soybean Biodiesel at Varying Loads and Compression Ratios on VCR Diesel Engine Characteristics. Symmetry 2020, 12, 1042. [Google Scholar] [CrossRef]
- Maher, S.; Nisar, S.; Aslam, S.M.; Saleem, F.; Behlil, F.; Imran, M.; Assiri, M.A.; Nouroz, A.; Naheed, N.; Khan, Z.A.; et al. Synthesis and Characterization of ZnO Nanoparticles Derived from Biomass (Sisymbrium Irio) and Assessment of Potential Anticancer Activity. ACS Omega 2023, 8, 15920–15931. [Google Scholar] [CrossRef]
- Talam, S.; Karumuri, S.R.; Gunnam, N. Synthesis, characterization, and spectroscopic properties of ZnO nanoparticles. Int. Sch. Res. Notices 2012, 2012, 372505. [Google Scholar] [CrossRef]
- Handore, K.; Bhavsar, S.; Horne, A.; Chhattise, P.; Mohite, K.; Ambekar, J.; Pande, N.; Chabukswar, V. Novel Green Route of Synthesis of ZnO Nanoparticles by Using Natural Biodegradable Polymer and Its Application as a Catalyst for Oxidation of Aldehydes. J. Macromol. Sci. A 2014, 51, 941–947. [Google Scholar] [CrossRef]
- Taufiq, A.; Ulya, H.N.; Utomo, J.; Sunaryono; Hidayat, N.; Susanto, H.; Mufti, N.; Munasir; Soontaranon, S. Structural, Optical, and Antifungal Characters of Zinc Oxide Nanoparticles Prepared by Sol-gel Method. J. Phys. Conf. Ser. 2018, 1093, 012001. [Google Scholar] [CrossRef]
- Kołodziejczak-Radzimska, A.; Markiewicz, E.; Jesionowski, T. Structural Characterisation of ZnO Particles Obtained by the Emulsion Precipitation Method. J. Nanomater. 2012, 2012, 656353. [Google Scholar] [CrossRef]
- Zandi, S.; Kameli, P.; Salamati, H.; Ahmadvand, H.; Hakimi, M. Microstructure and optical properties of ZnO nanoparticles prepared by a simple method. Phys. B Condens. 2011, 406, 3215–3218. [Google Scholar] [CrossRef]
- Xiong, G.; Pal, U.; Serrano, J.; Ucer, K.; Williams, R. Photoluminesence and FTIR study of ZnO nanoparticles: The impurity and defect perspective. Phys. Status Solidi C 2006, 3, 3577–3581. [Google Scholar] [CrossRef]
- Vafaee, M.; Ghamsari, M.S. Preparation and characterization of ZnO nanoparticles by a novel sol–gel route. Mater. Lett. 2007, 61, 3265–3268. [Google Scholar] [CrossRef]
- Mousavi, S.B.; Heris, S.Z.; Estellé, P. Experimental comparison between ZnO and MoS2 nanoparticles as additives on performance of diesel oil-based nano lubricant. Sci. Rep. 2020, 10, 5813. [Google Scholar] [CrossRef]
- Jamaluddin, N.A.; Talib, N.; Sani, A.S.A. Tribological Assessment of Modified Jatropha Oil with hBN and Graphene Nanoparticles as a New Preference for the Metalworking fluid. Int. J. Adv. Eng. Technol. 2020, 9, 3144–3149. [Google Scholar] [CrossRef]
- Yan, Y.D.; Dhont, J.K.G.; Smits, C.; Lekkerkerker, H.N.W. Oscillatory-shear-induced order in nonaqueous dispersions of charged colloidal spheres. Phys. A Stat. Mech. Appl. 1994, 202, 68–80. [Google Scholar] [CrossRef]
- López-Barrón, C.R.; Wagner, N.J.; Porcar, L. Layering, melting, and recrystallization of a close-packed micellar crystal under steady and large-amplitude oscillatory shear flows. J. Rheol. 2015, 59, 793–820. [Google Scholar] [CrossRef]
- Moghaddam, M.B.; Goharshadi, E.K.; Entezari, M.H.; Nancarrow, P. Preparation, characterization, and rheological properties of graphene–glycerol nanofluids. Chem. Eng. J. 2013, 231, 365–372. [Google Scholar] [CrossRef]
- Bao, J.; Heyd, R.; Régnier, G.; Ammar, A.; Peixinho, J. Viscosity of graphene in lubricating oil, ethylene glycol and glycerol. J. Therm. Anal. Calorim. 2023. [Google Scholar] [CrossRef]
- Crawford, N.C.; Popp, L.B.; Johns, K.E.; Caire, L.M.; Peterson, B.N.; Liberatore, M.W. Shear thickening of corn starch suspensions: Does concentration matter? J. Colloid Interface Sci. 2013, 396, 83–89. [Google Scholar] [CrossRef] [PubMed]
- Brown, E.; Jaeger, H.M. Shear thickening in concentrated suspensions: Phenomenology, mechanisms and relations to jamming. Rep. Prog. Phys. 2014, 77, 046602. [Google Scholar] [CrossRef] [PubMed]
- Chow, M.K.; Zukoski, C.F. Nonequilibrium behavior of dense suspensions of uniform particles: Volume fraction and size dependence of rheology and microstructure. J. Rheol. 1995, 39, 33–59. [Google Scholar] [CrossRef]
- Wei, M.; Lin, K.; Sun, L. Shear thickening fluids and their applications. Mater. Des. 2022, 216, 110570. [Google Scholar] [CrossRef]
- Küçüksönmez, E.; Servantie, J. Shear thinning and thickening in dispersions of spherical nanoparticles. Phys. Rev. E 2020, 102, 012604. [Google Scholar] [CrossRef]
- Sakthivel, S.; Velusamy, S. Effect of ammonium based ionic liquids on the rheological behavior of the heavy crude oil for high pressure and high temperature conditions. Petroleum 2022, 8, 552–566. [Google Scholar] [CrossRef]
- Mozes, R.; Cooper, P.K.; Atkin, R.; Li, H. Ionic Liquids as Grease Base Liquids. Lubricants 2017, 5, 31. [Google Scholar] [CrossRef]
- Burrell, G.L.; Dunlop, N.F.; Separovic, F. Non-Newtonian viscous shear thinning in ionic liquids. Soft Matter 2010, 6, 2080–2086. [Google Scholar] [CrossRef]
- Bossis, G.; Brady, J. The rheology of Brownian suspensions. J. Chem. Phys. 1989, 91, 1866–1874. [Google Scholar] [CrossRef]
- Egres, R.G.; Nettesheim, F.; Wagner, N.J. Rheo-SANS investigation of acicular-precipitated calcium carbonate colloidal suspensions through the shear thickening transition. J. Rheol. 2006, 50, 685–709. [Google Scholar] [CrossRef]
- Hoffman, R.L. Explanations for the cause of shear thickening in concentrated colloidal suspensions. J. Rheol. 1998, 42, 111–123. [Google Scholar] [CrossRef]
- Wittmar, A.; Gautam, D.; Schilling, C.; Dörfler, U.; Mayer-Zaika, W.; Winterer, M.; Ulbricht, M. Stable zinc oxide nanoparticle dispersions in ionic liquids. J. Nanopart. Res. 2014, 16, 2341. [Google Scholar] [CrossRef]
- Xie, M.; Cheng, J.; Huo, C.; Zhao, G. Improving the lubricity of a bio-lubricating grease with the multilayer graphene additive. Tribol. Int. 2020, 150, 106386. [Google Scholar] [CrossRef]
- Beheshti, A.; Huang, Y.; Ohno, K.; Blakey, I.; Stokes, J.R. Improving tribological properties of oil-based lubricants using hybrid colloidal additives. Tribol. Int. 2020, 144, 106130. [Google Scholar] [CrossRef]
- Wittmar, A.; Ruiz-Abad, D.; Ulbricht, M. Dispersions of silica nanoparticles in ionic liquids investigated with advanced rheology. J. Nanopart. Res. 2012, 14, 651. [Google Scholar] [CrossRef]
- Sawada, H.; Kodama, S.; Tsunashima, K.; Sugiya, M. Preparation and properties of novel phosphonium-type ionic liquids/silica gel nanocomposites. J. Mater. Sci. 2007, 42, 2532–2535. [Google Scholar] [CrossRef]
- He, Z.; Alexandridis, P. Nanoparticles in ionic liquids: Interactions and organization. Phys. Chem. Chem. Phys. 2015, 17, 18238–18261. [Google Scholar] [CrossRef]
- Azman, S.S.N.; Zulkifli, N.W.M.; Masjuki, H.; Gulzar, M.; Zahid, R. Study of tribological properties of lubricating oil blend added with graphene nanoplatelets. J. Mater. Res. 2016, 31, 1932–1938. [Google Scholar] [CrossRef]
- Bader, A.; Hoziefa, W.; Hussein Mohammed Abdel, M.; Hamoud, M.; Salunkhe, S.; Abou Bakr, E.; Abdel-Mottaleb, M.; Davim, J.P. Tribological Performance and Rheological Properties of Engine Oil with Graphene Nano-Additives. Lubricants 2022, 10, 137. [Google Scholar] [CrossRef]
- Cai, Z.; Tian, M.; Zhang, G. Experimental Study on the Flow and Heat Transfer of Graphene-Based Lubricants in a Horizontal Tube. Processes 2020, 8, 1675. [Google Scholar] [CrossRef]
- Singh, Y.; Singh, N.K.; Sharma, A.; Singla, A.; Singh, D.; Abd Rahim, E. Effect of ZnO nanoparticles concentration as additives to the epoxidized Euphorbia Lathyris oil and their tribological characterization. Fuel 2021, 285, 119148. [Google Scholar] [CrossRef]
- Bambam, A.K.; Dhanola, A.; Gajrani, K.K. Machining of titanium alloys using phosphonium-based halogen-free ionic liquid as lubricant additives. Ind. Lubr. Tribol. 2022, 74, 722–728. [Google Scholar] [CrossRef]
- Zhao, J.; He, Y.; Wang, Y.; Wang, W.; Yan, L.; Luo, J. An investigation on the tribological properties of multilayer graphene and MoS2 nanosheets as additives used in hydraulic applications. Tribol. Int. 2016, 97, 14–20. [Google Scholar] [CrossRef]
- Del Río, J.M.L.; Guimarey, M.J.; Prado, J.I.; Lugo, L.; López, E.R.; Comuñas, M.J. Improving the tribological performance of a biodegradable lubricant adding graphene nanoplatelets as additives. J. Mol. Liq. 2022, 345, 117797. [Google Scholar] [CrossRef]
- Nassef, M.G.A.; Soliman, M.; Nassef, B.G.; Daha, M.A.; Nassef, G.A. Impact of Graphene Nano-Additives to Lithium Grease on the Dynamic and Tribological Behavior of Rolling Bearings. Lubricant 2022, 10, 29. [Google Scholar] [CrossRef]
- Sarno, M.; Scarpa, D.; Senatore, A.; Ahmed Abdalglil Mustafa, W. rGO/GO Nanosheets in Tribology: From the State of the Art to the Future Prospective. Lubricants 2020, 8, 31. [Google Scholar] [CrossRef]
- Kumar, P.; Wani, M.F. Effect of temperature on the friction and wear properties of graphene nano-platelets as lubricant additive on Al-25Si alloy. Mater. Res. Express 2019, 6, 046513. [Google Scholar] [CrossRef]
- Zhu, Y.; Lin, S.; Wang, H.; Liu, D. Study on the tribological properties of porous sweating PEEK composites under ionic liquid lubricated condition. J. Appl. Polym. Sci. 2014, 131, 40989. [Google Scholar] [CrossRef]
- Wang, Z.; Chang, J.; Cai, C. Tribological Performance of Phosphonium Ionic Liquids as Additives in Lithium Lubricating Grease. Lubricants 2018, 6, 23. [Google Scholar] [CrossRef]
- Elagouz, A.; Ali, M.K.A.; Xianjun, H.; Abdelkareem, M.A.A.; Hassan, M.A. Frictional performance evaluation of sliding surfaces lubricated by zinc-oxide nano-additives. Surf. Eng. 2020, 36, 144–157. [Google Scholar] [CrossRef]
- Bhaumik, S.; Maggirwar, R.; Datta, S.; Pathak, S.D. Analyses of anti-wear and extreme pressure properties of castor oil with zinc oxide nano friction modifiers. Appl. Surf. Sci. 2018, 449, 277–286. [Google Scholar] [CrossRef]
- Hao, L.; Hao, W.; Li, P.; Liu, G.; Li, H.; Aljabri, A.; Xie, Z. Friction and Wear Properties of a Nanoscale Ionic Liquid-like GO@SiO2 Hybrid as a Water-Based Lubricant Additive. Lubricants 2022, 10, 125. [Google Scholar] [CrossRef]
- Murthy, N.; Rai, A.K.; Berkebile, S. Improved Loss-of-Lubrication Performance with Lubricants Containing Nano-Graphene Platelets and Ionic Liquids. Appl. Sci. 2020, 10, 7958. [Google Scholar] [CrossRef]
- Zhang, G.; Xu, Y.; Xiang, X.; Zheng, G.; Zeng, X.; Li, Z.; Ren, T.; Zhang, Y. Tribological performances of highly dispersed graphene oxide derivatives in vegetable oil. Tribol. Int. 2018, 126, 39–48. [Google Scholar] [CrossRef]
- Somers, A.E.; Howlett, P.C.; MacFarlane, D.R.; Forsyth, M. A Review of Ionic Liquid Lubricants. Lubricants 2013, 1, 3–21. [Google Scholar] [CrossRef]
- Palacio, M.; Bhushan, B. A review of ionic liquids for green molecular lubrication in nanotechnology. Tribol. Lett. 2010, 40, 247–268. [Google Scholar] [CrossRef]
- Carvalho, D.O.A.; da Silva, L.R.R.; Sopchenski, L.; Jackson, M.J.; Machado, Á.R. Performance evaluation of vegetable-based cutting fluids in turning of AISI 1050 steel. Int. J. Adv. Manuf. Technol. 2019, 103, 1603–1619. [Google Scholar] [CrossRef]
- Wasan, D.T.; Nikolov, A.D. Spreading of nanofluids on solids. Nature 2003, 423, 156–159. [Google Scholar] [CrossRef]
- Sefiane, K.; Skilling, J.; MacGillivray, J. Contact line motion and dynamic wetting of nanofluid solutions. Adv. Colloid Interface Sci. 2008, 138, 101–120. [Google Scholar] [CrossRef] [PubMed]
- Verma, C.; Quraishi, M.A. Ionic liquids-metal surface interactions: Effect of alkyl chain length on coordination capabilities and orientations. Adv. Electr. Electron. Eng. 2022, 2, 100070. [Google Scholar] [CrossRef]
Figure 1.
A representation of the prepared samples.
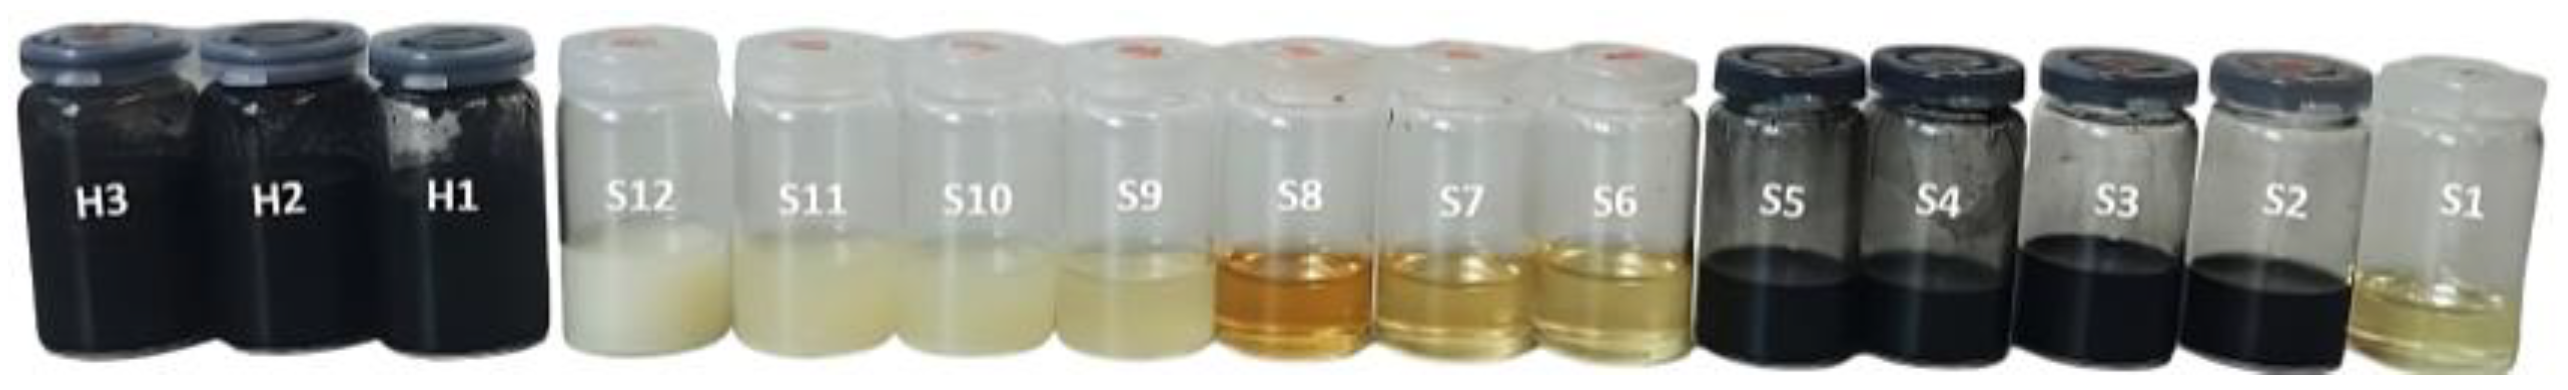
Figure 2.
Shear viscosity test setup.
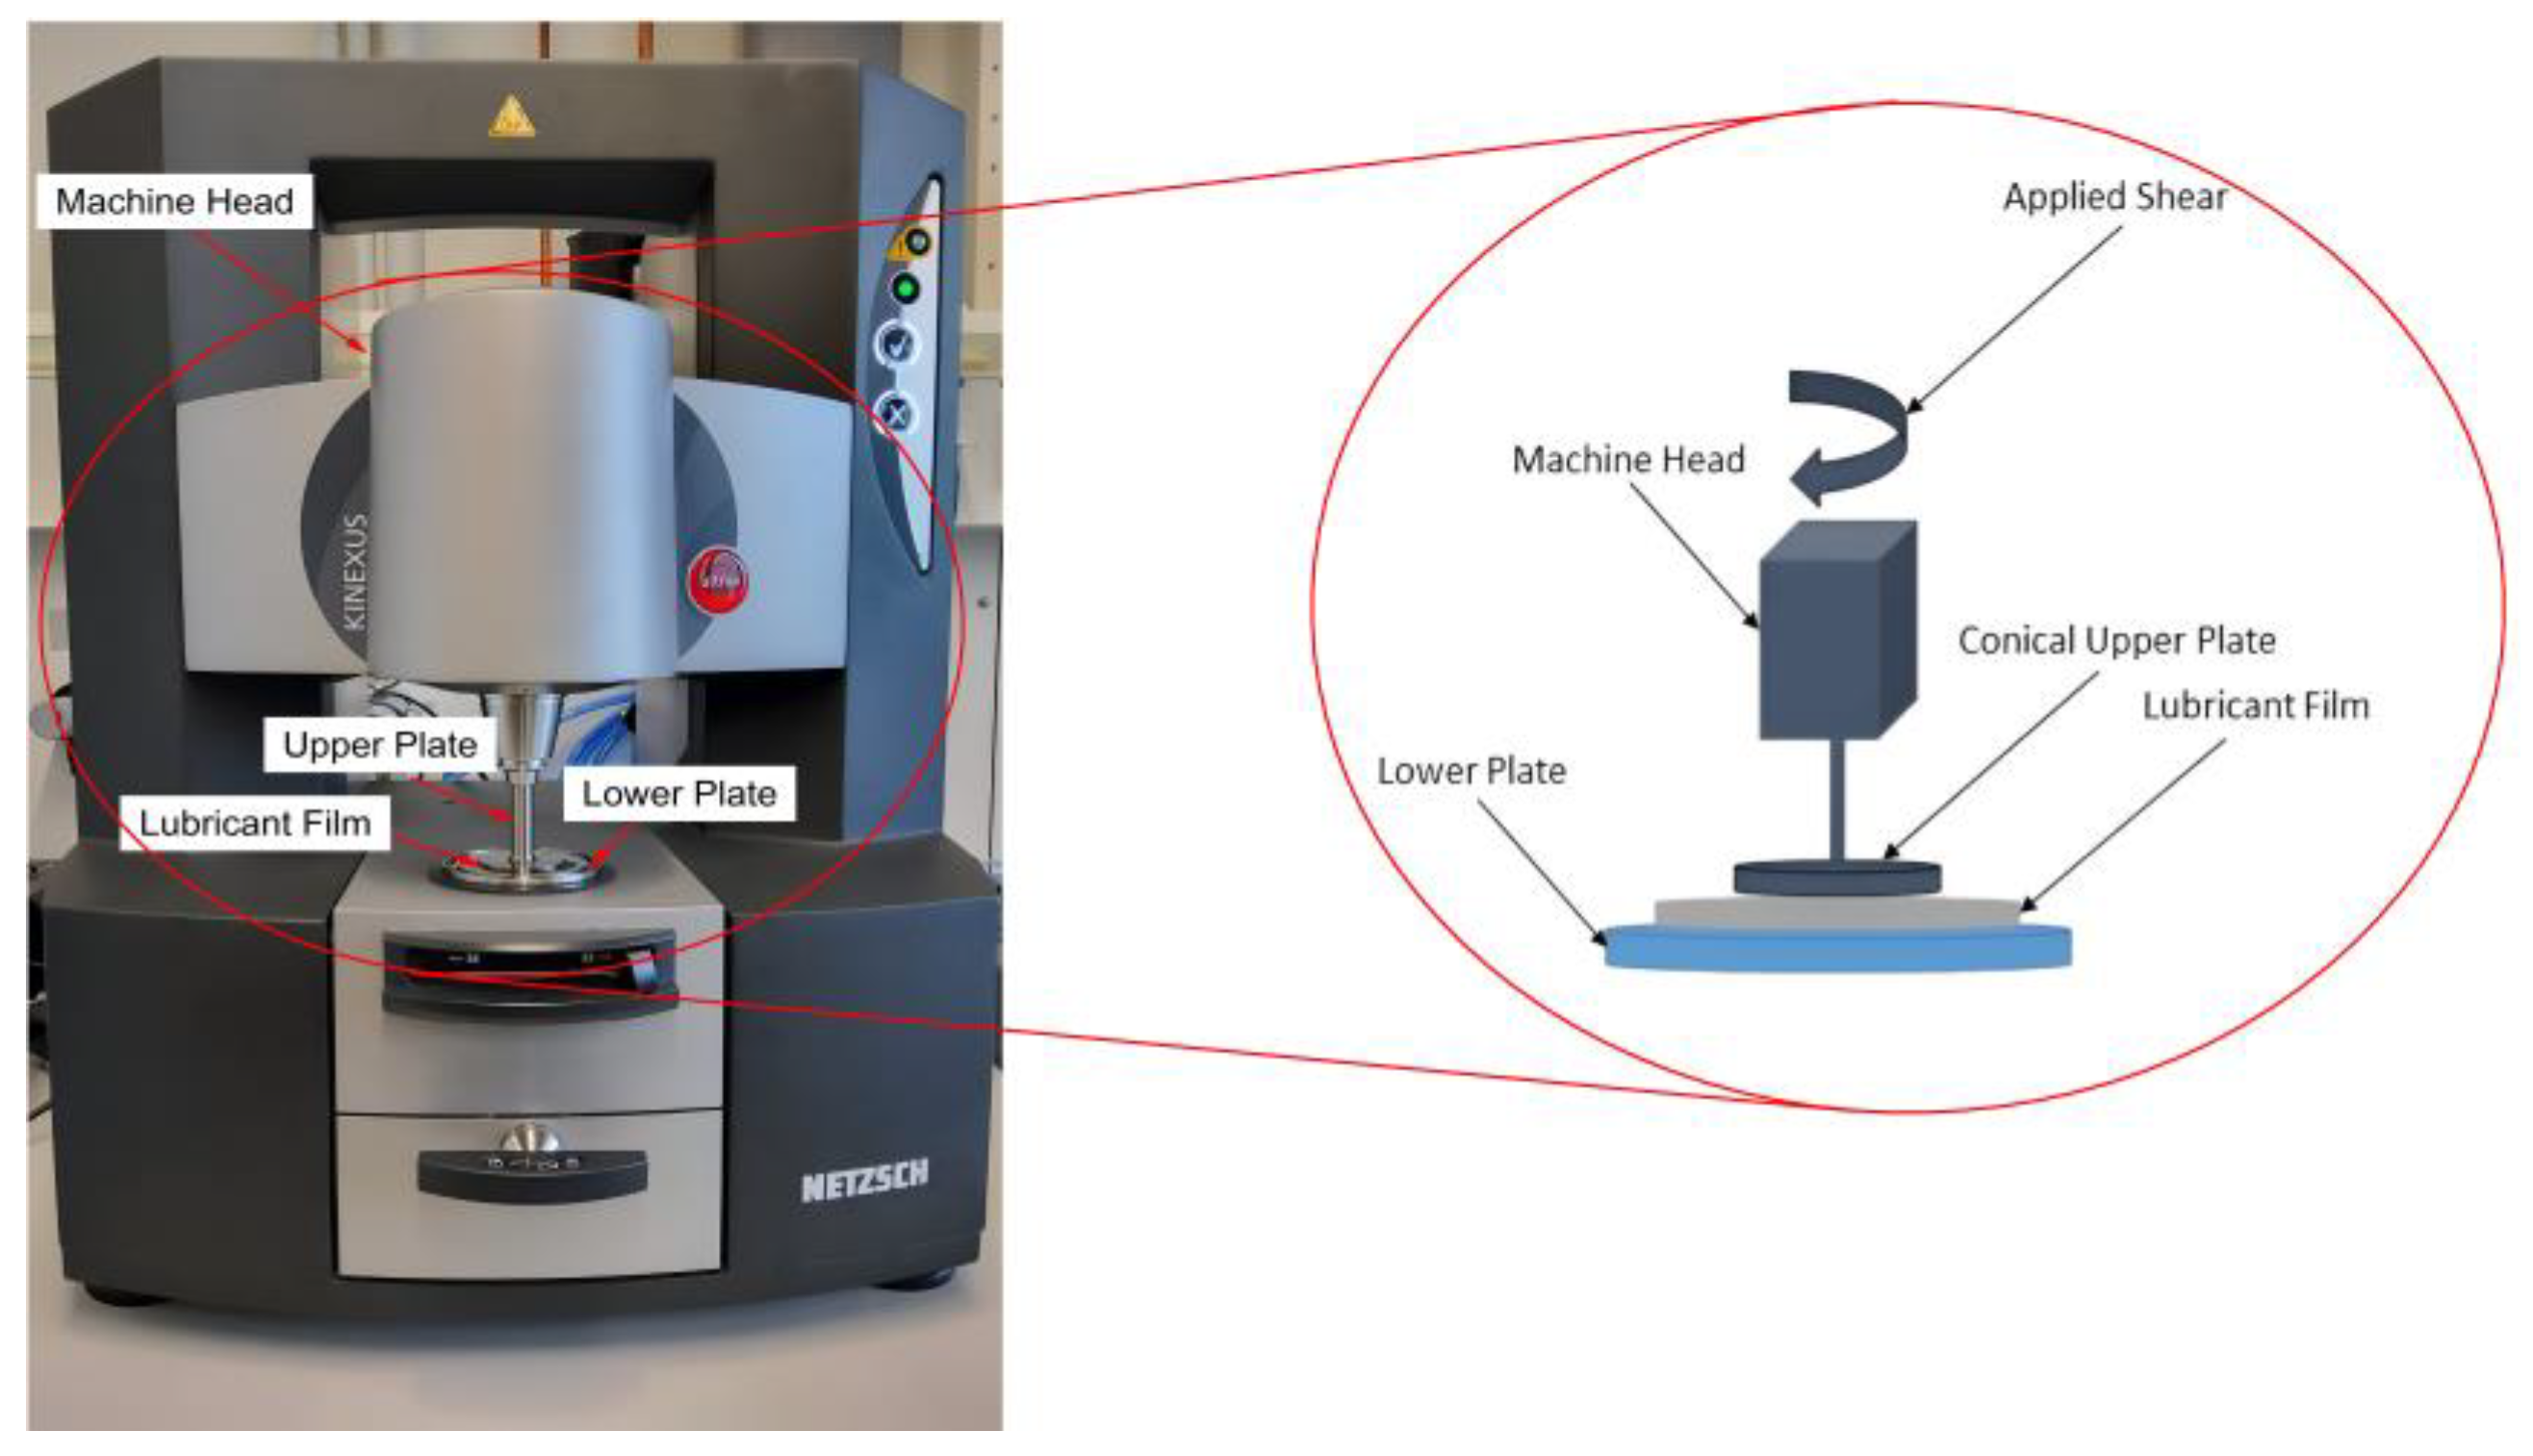
Figure 3.
Ball on three-plate setup.

Figure 4.
Milli tribotester setup.
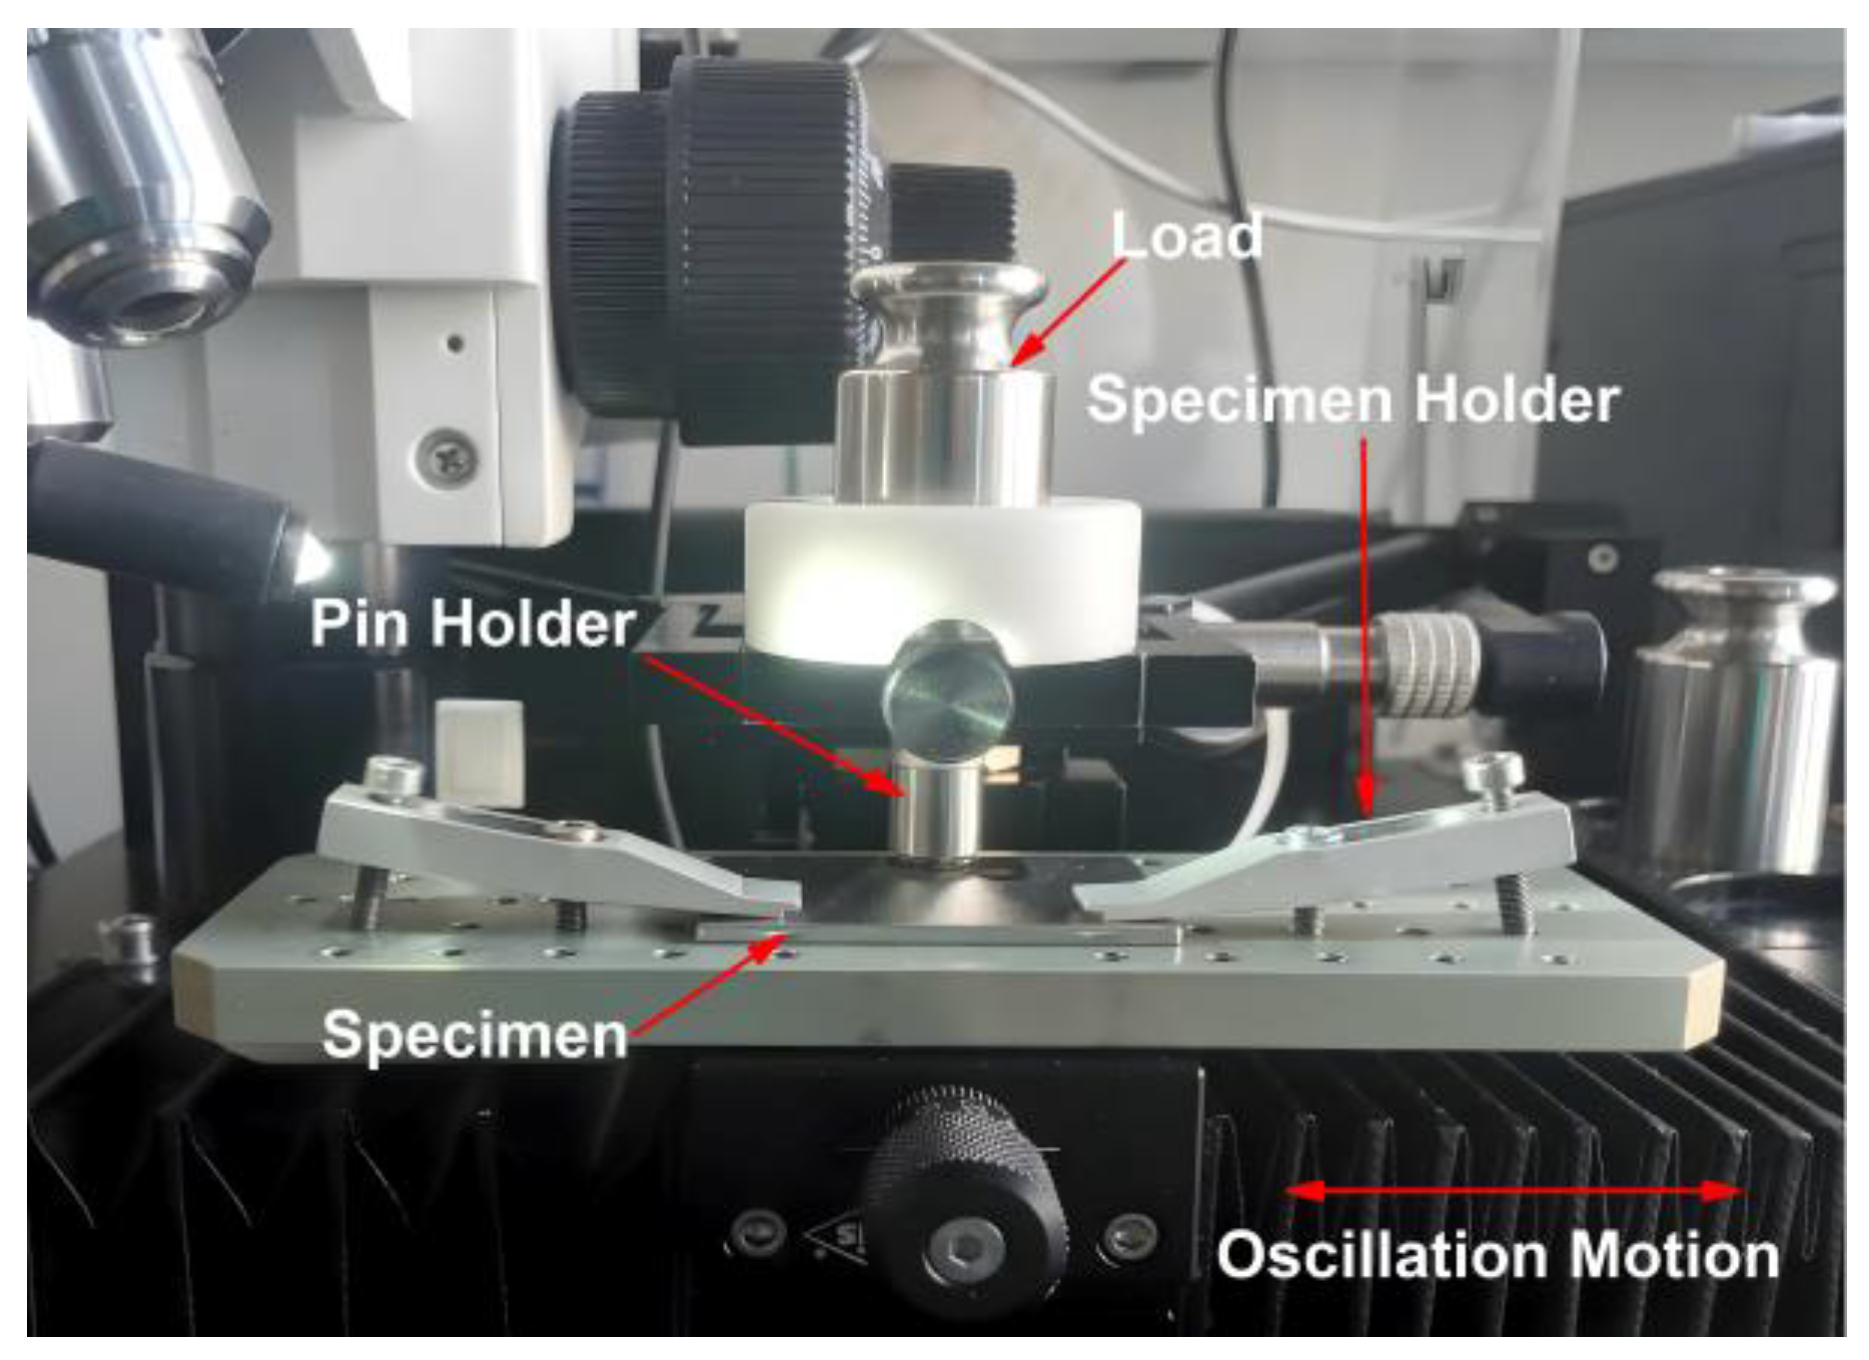
Figure 5.
(a) SEM; (b) TEM micrographs for ZnO powder.
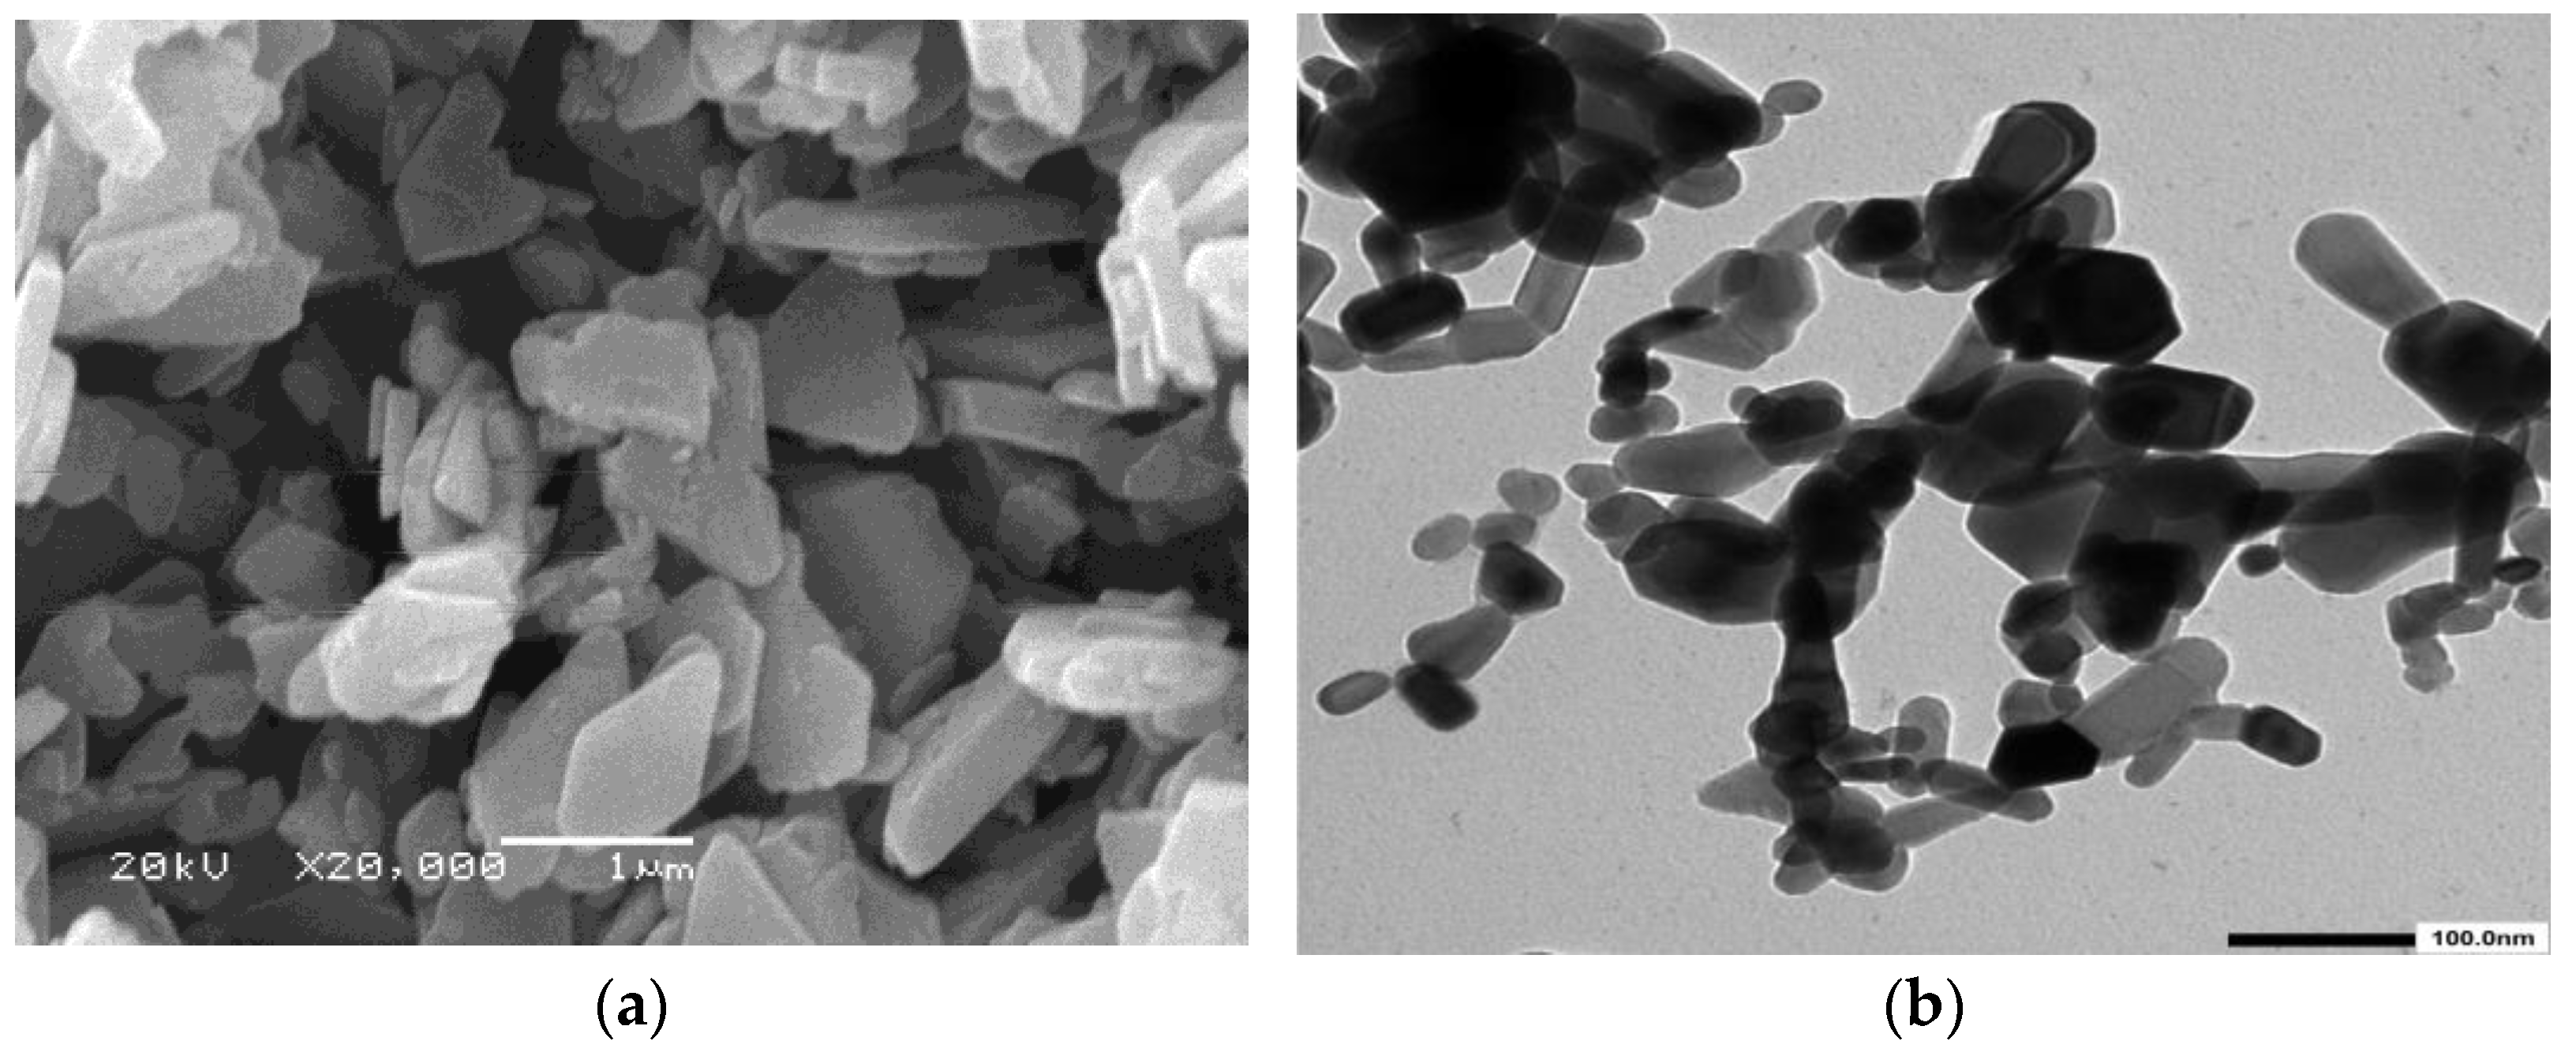
Figure 6.
XRD pattern for ZnO powder.
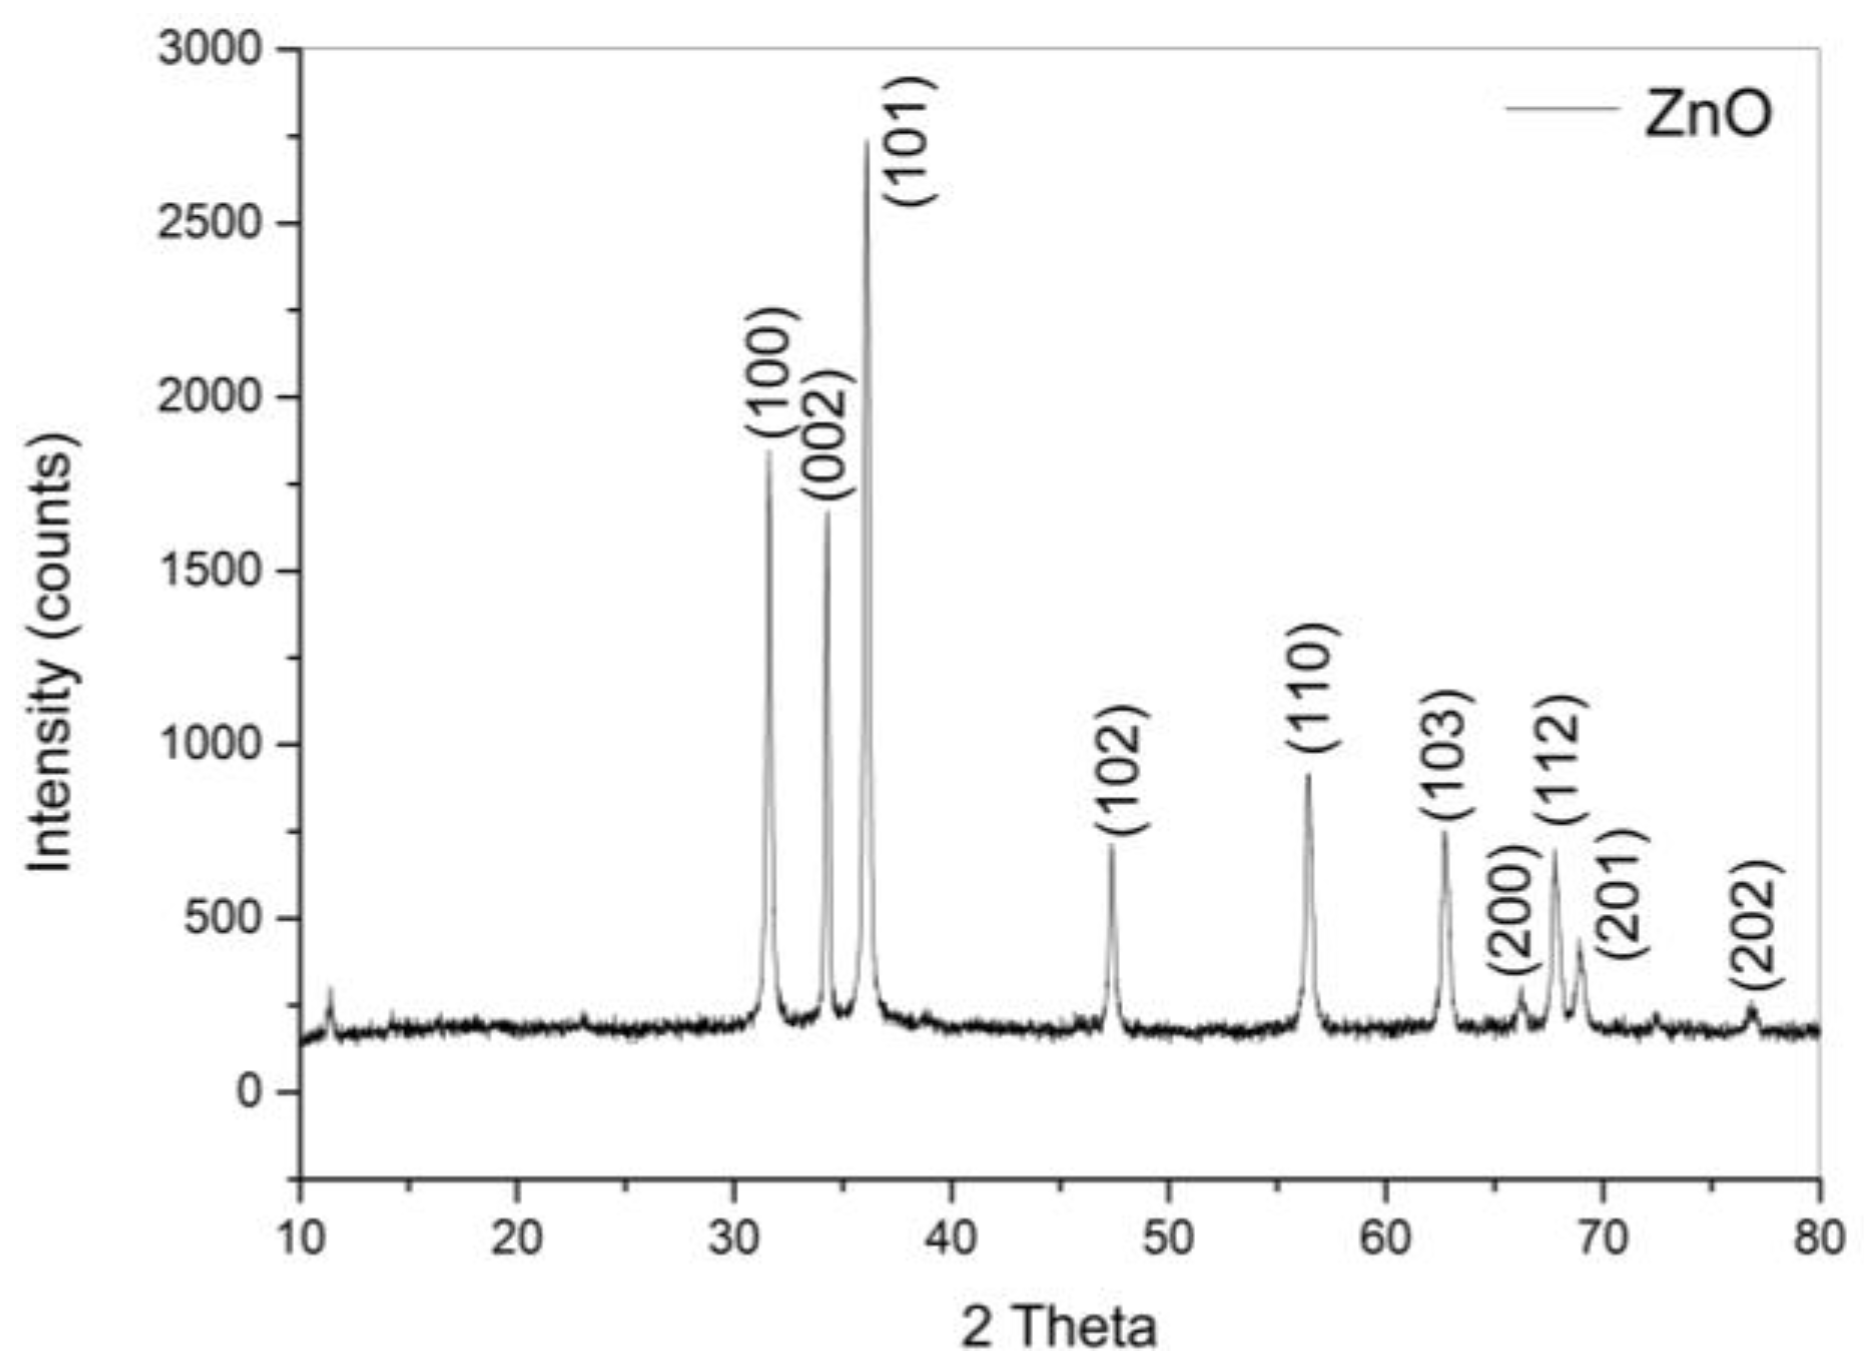
Figure 7.
FTIR spectrum for ZnO powder.

Figure 8.
(a) SEM; (b) TEM micrographs for graphene nanosheets.
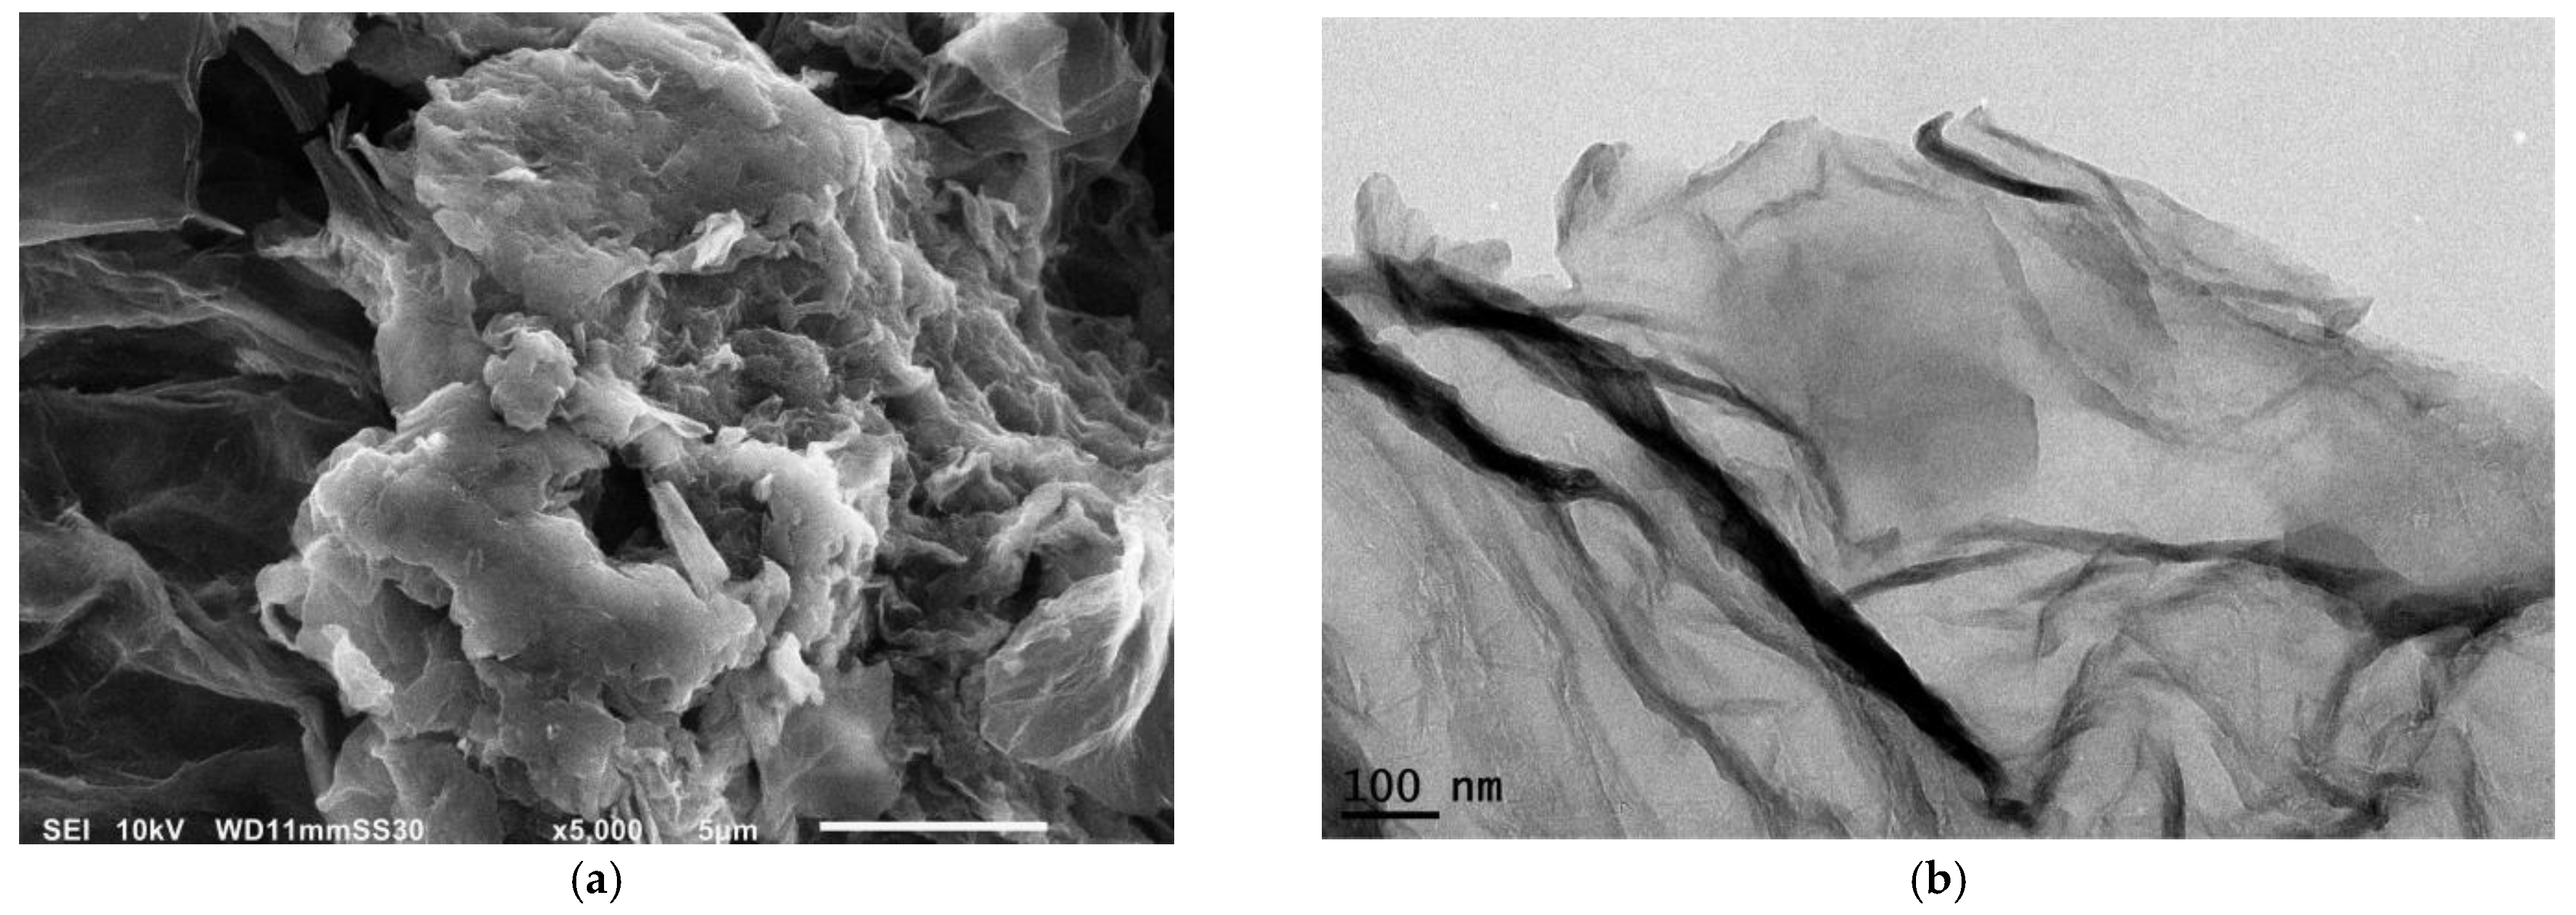
Figure 9.
XRD pattern for graphene nanosheets.
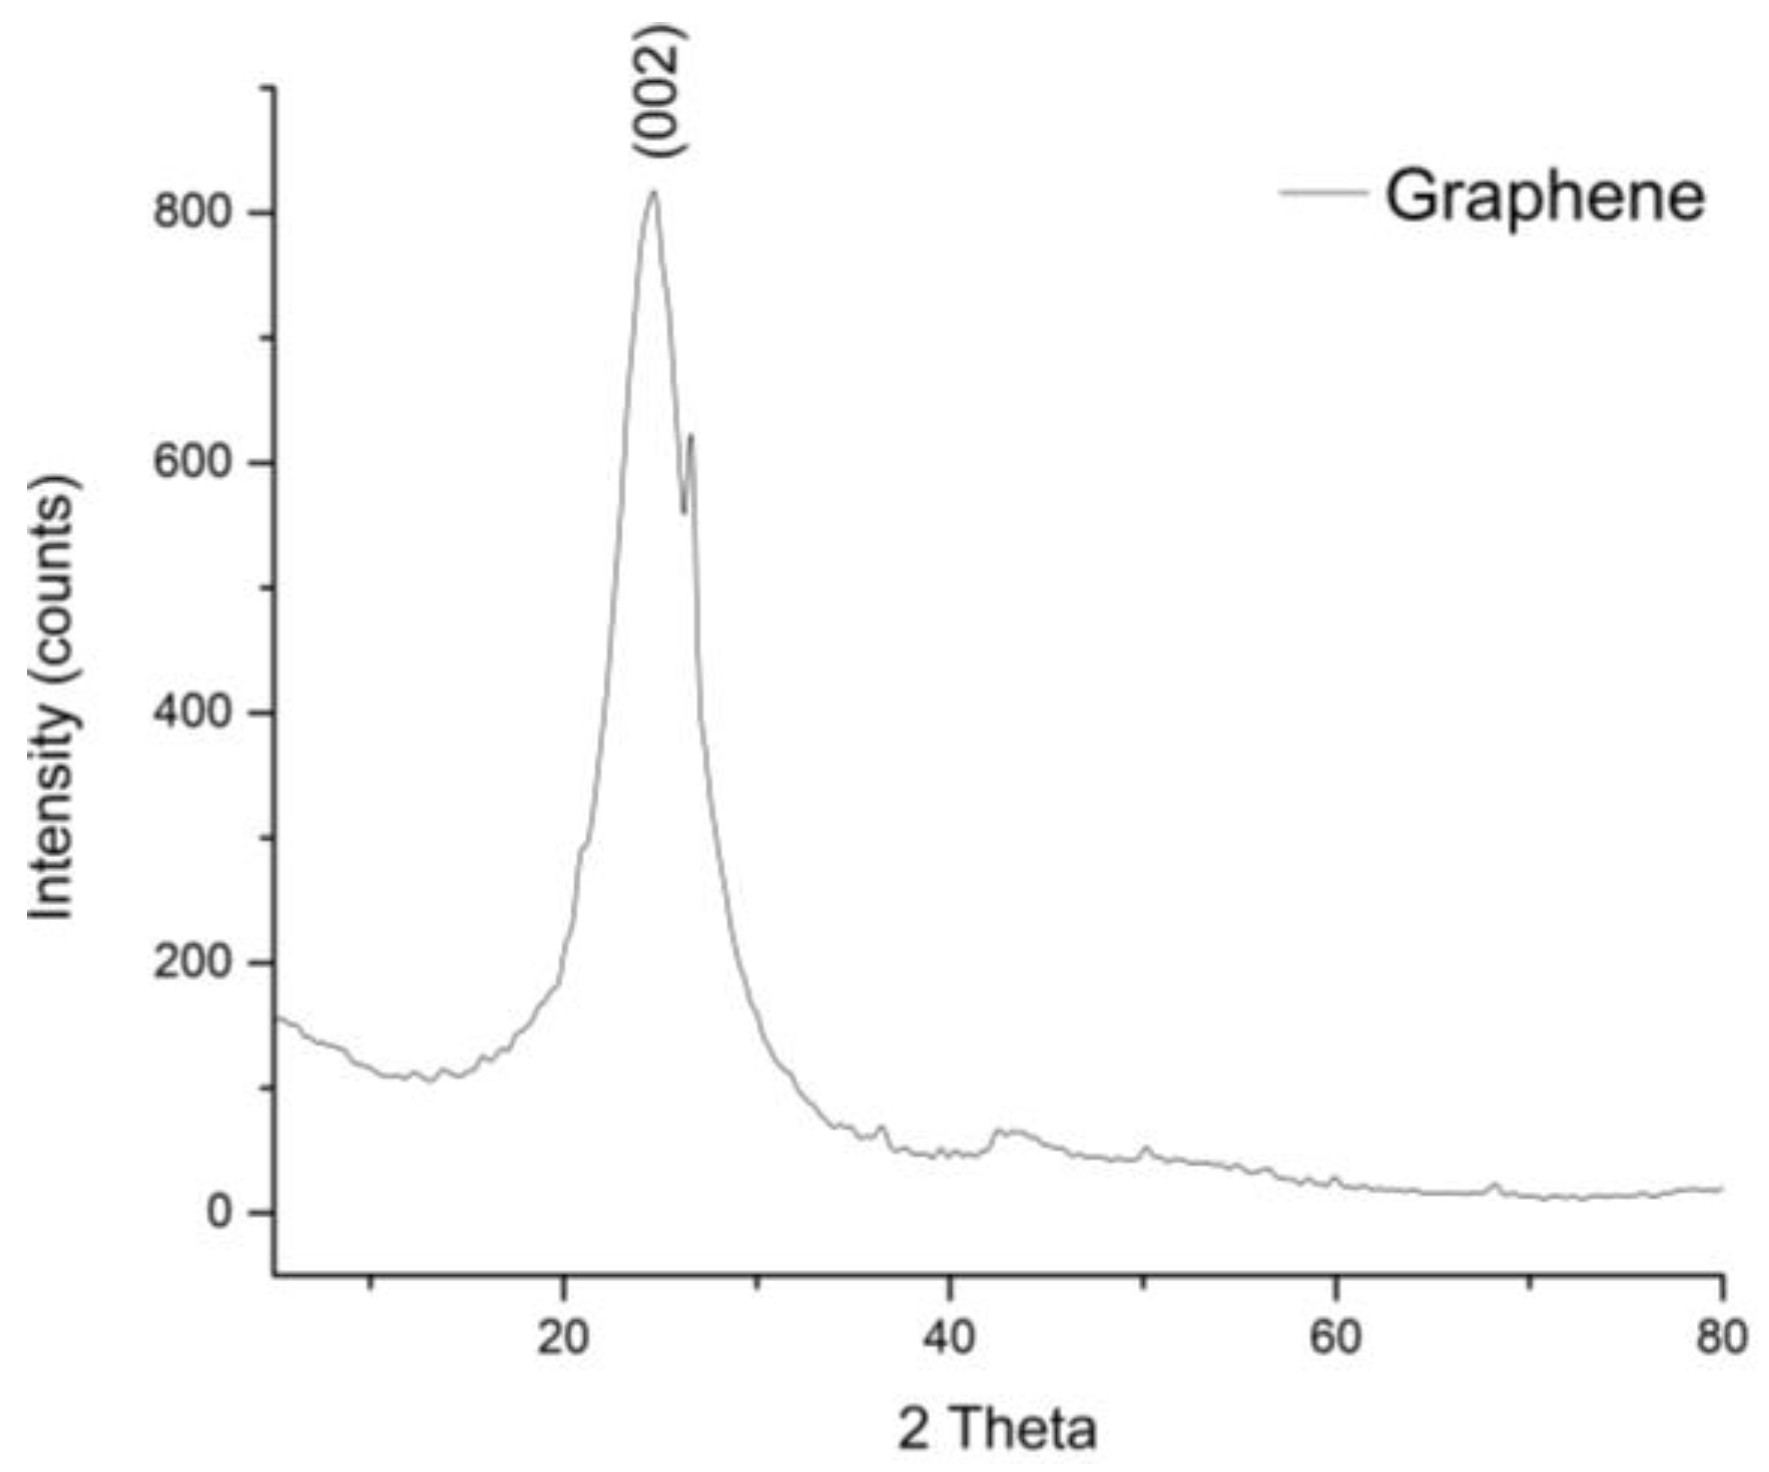
Figure 10.
(a) FTIR; (b) Raman spectra for graphene nanosheets.
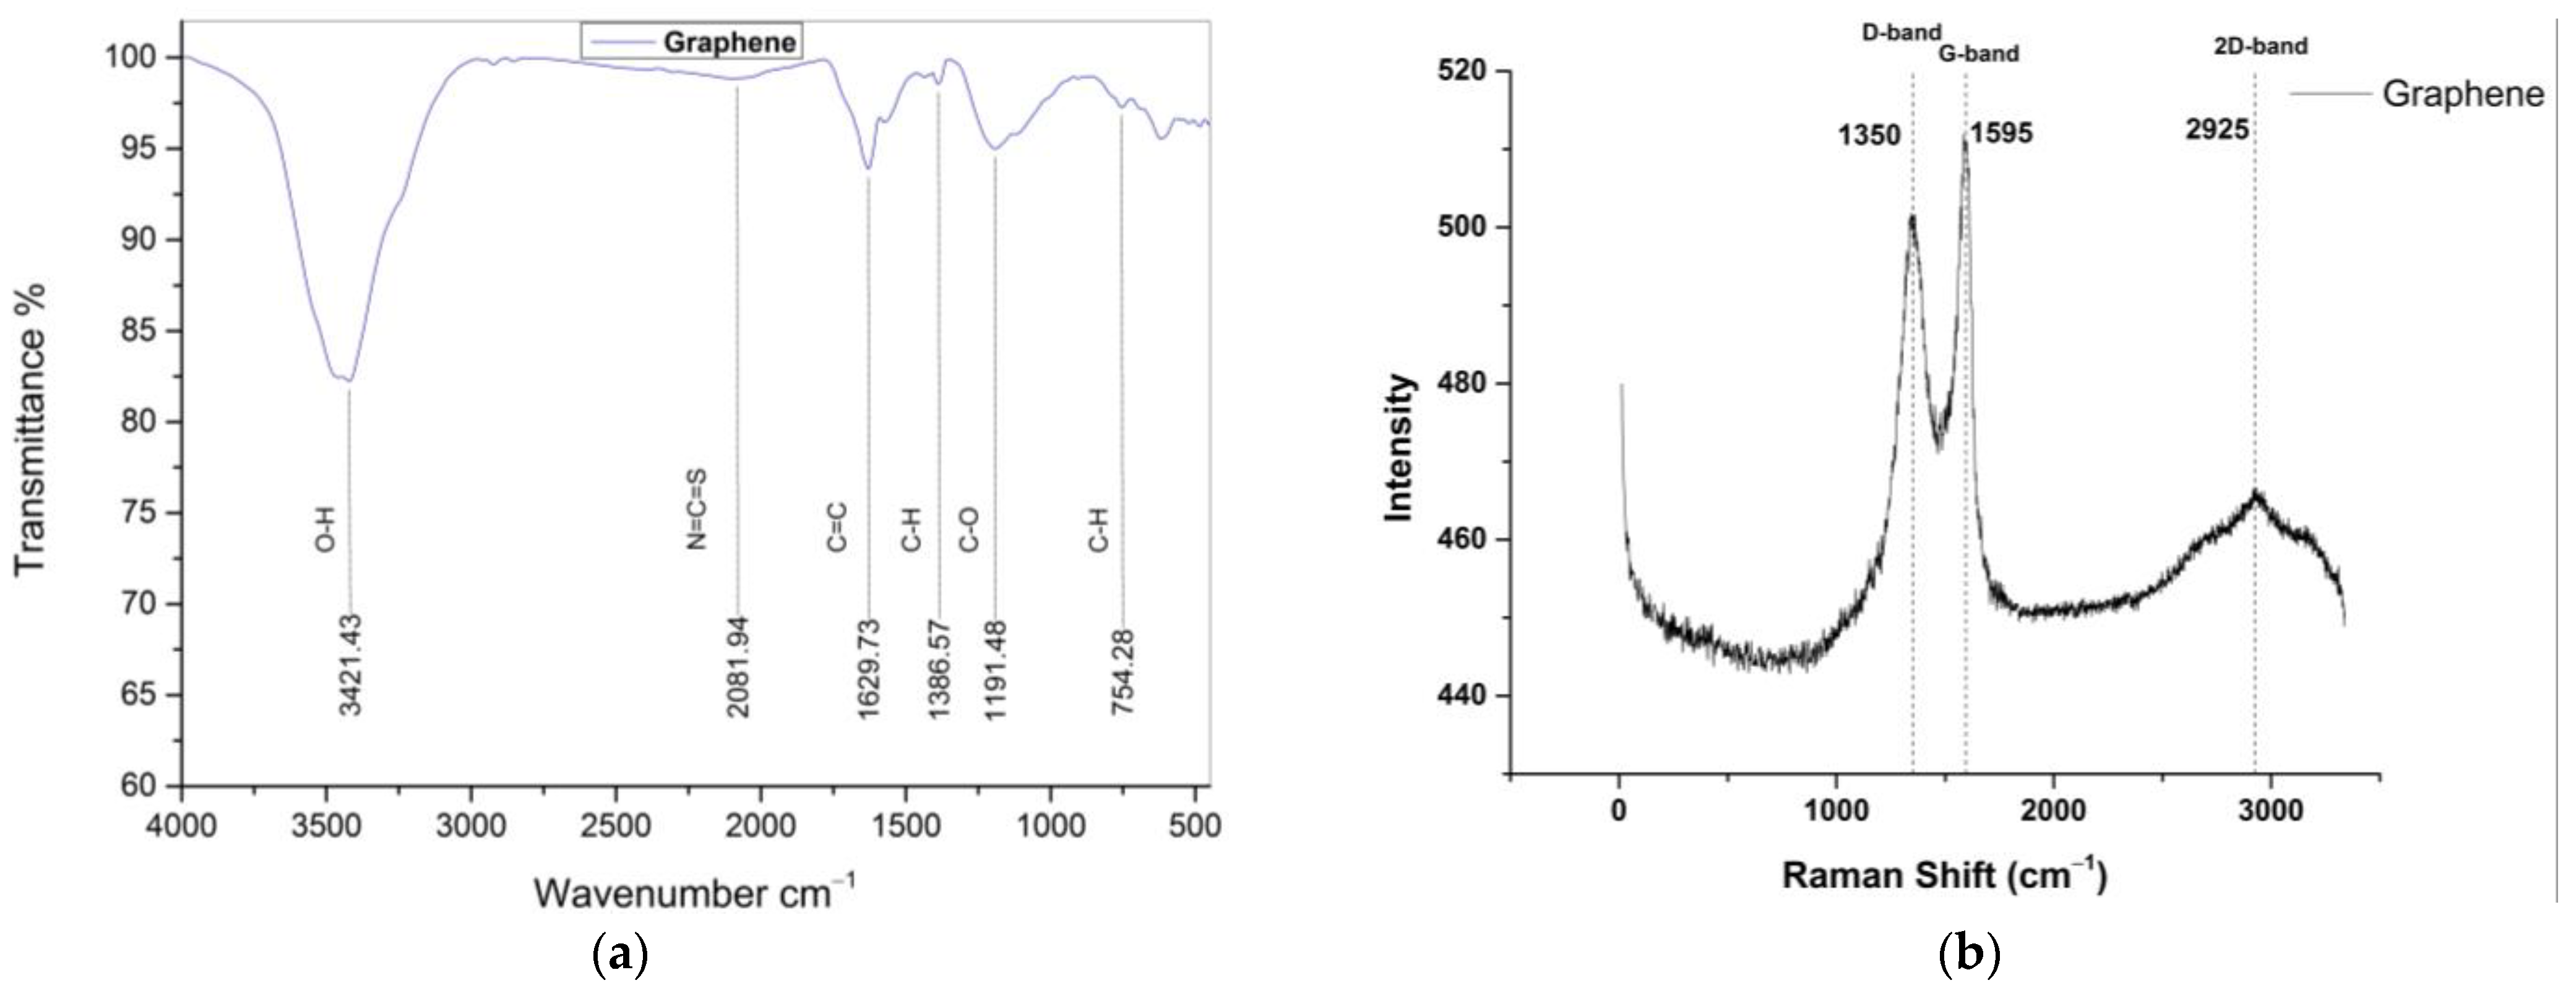
Figure 11.
Shear viscosity curves for graphene (a,b), IL (c,d), ZnO (e,f) and hybrid samples (g,h) at both 40 °C and 100 °C, as compared to rapeseed oil sample (S1).
Figure 11.
Shear viscosity curves for graphene (a,b), IL (c,d), ZnO (e,f) and hybrid samples (g,h) at both 40 °C and 100 °C, as compared to rapeseed oil sample (S1).
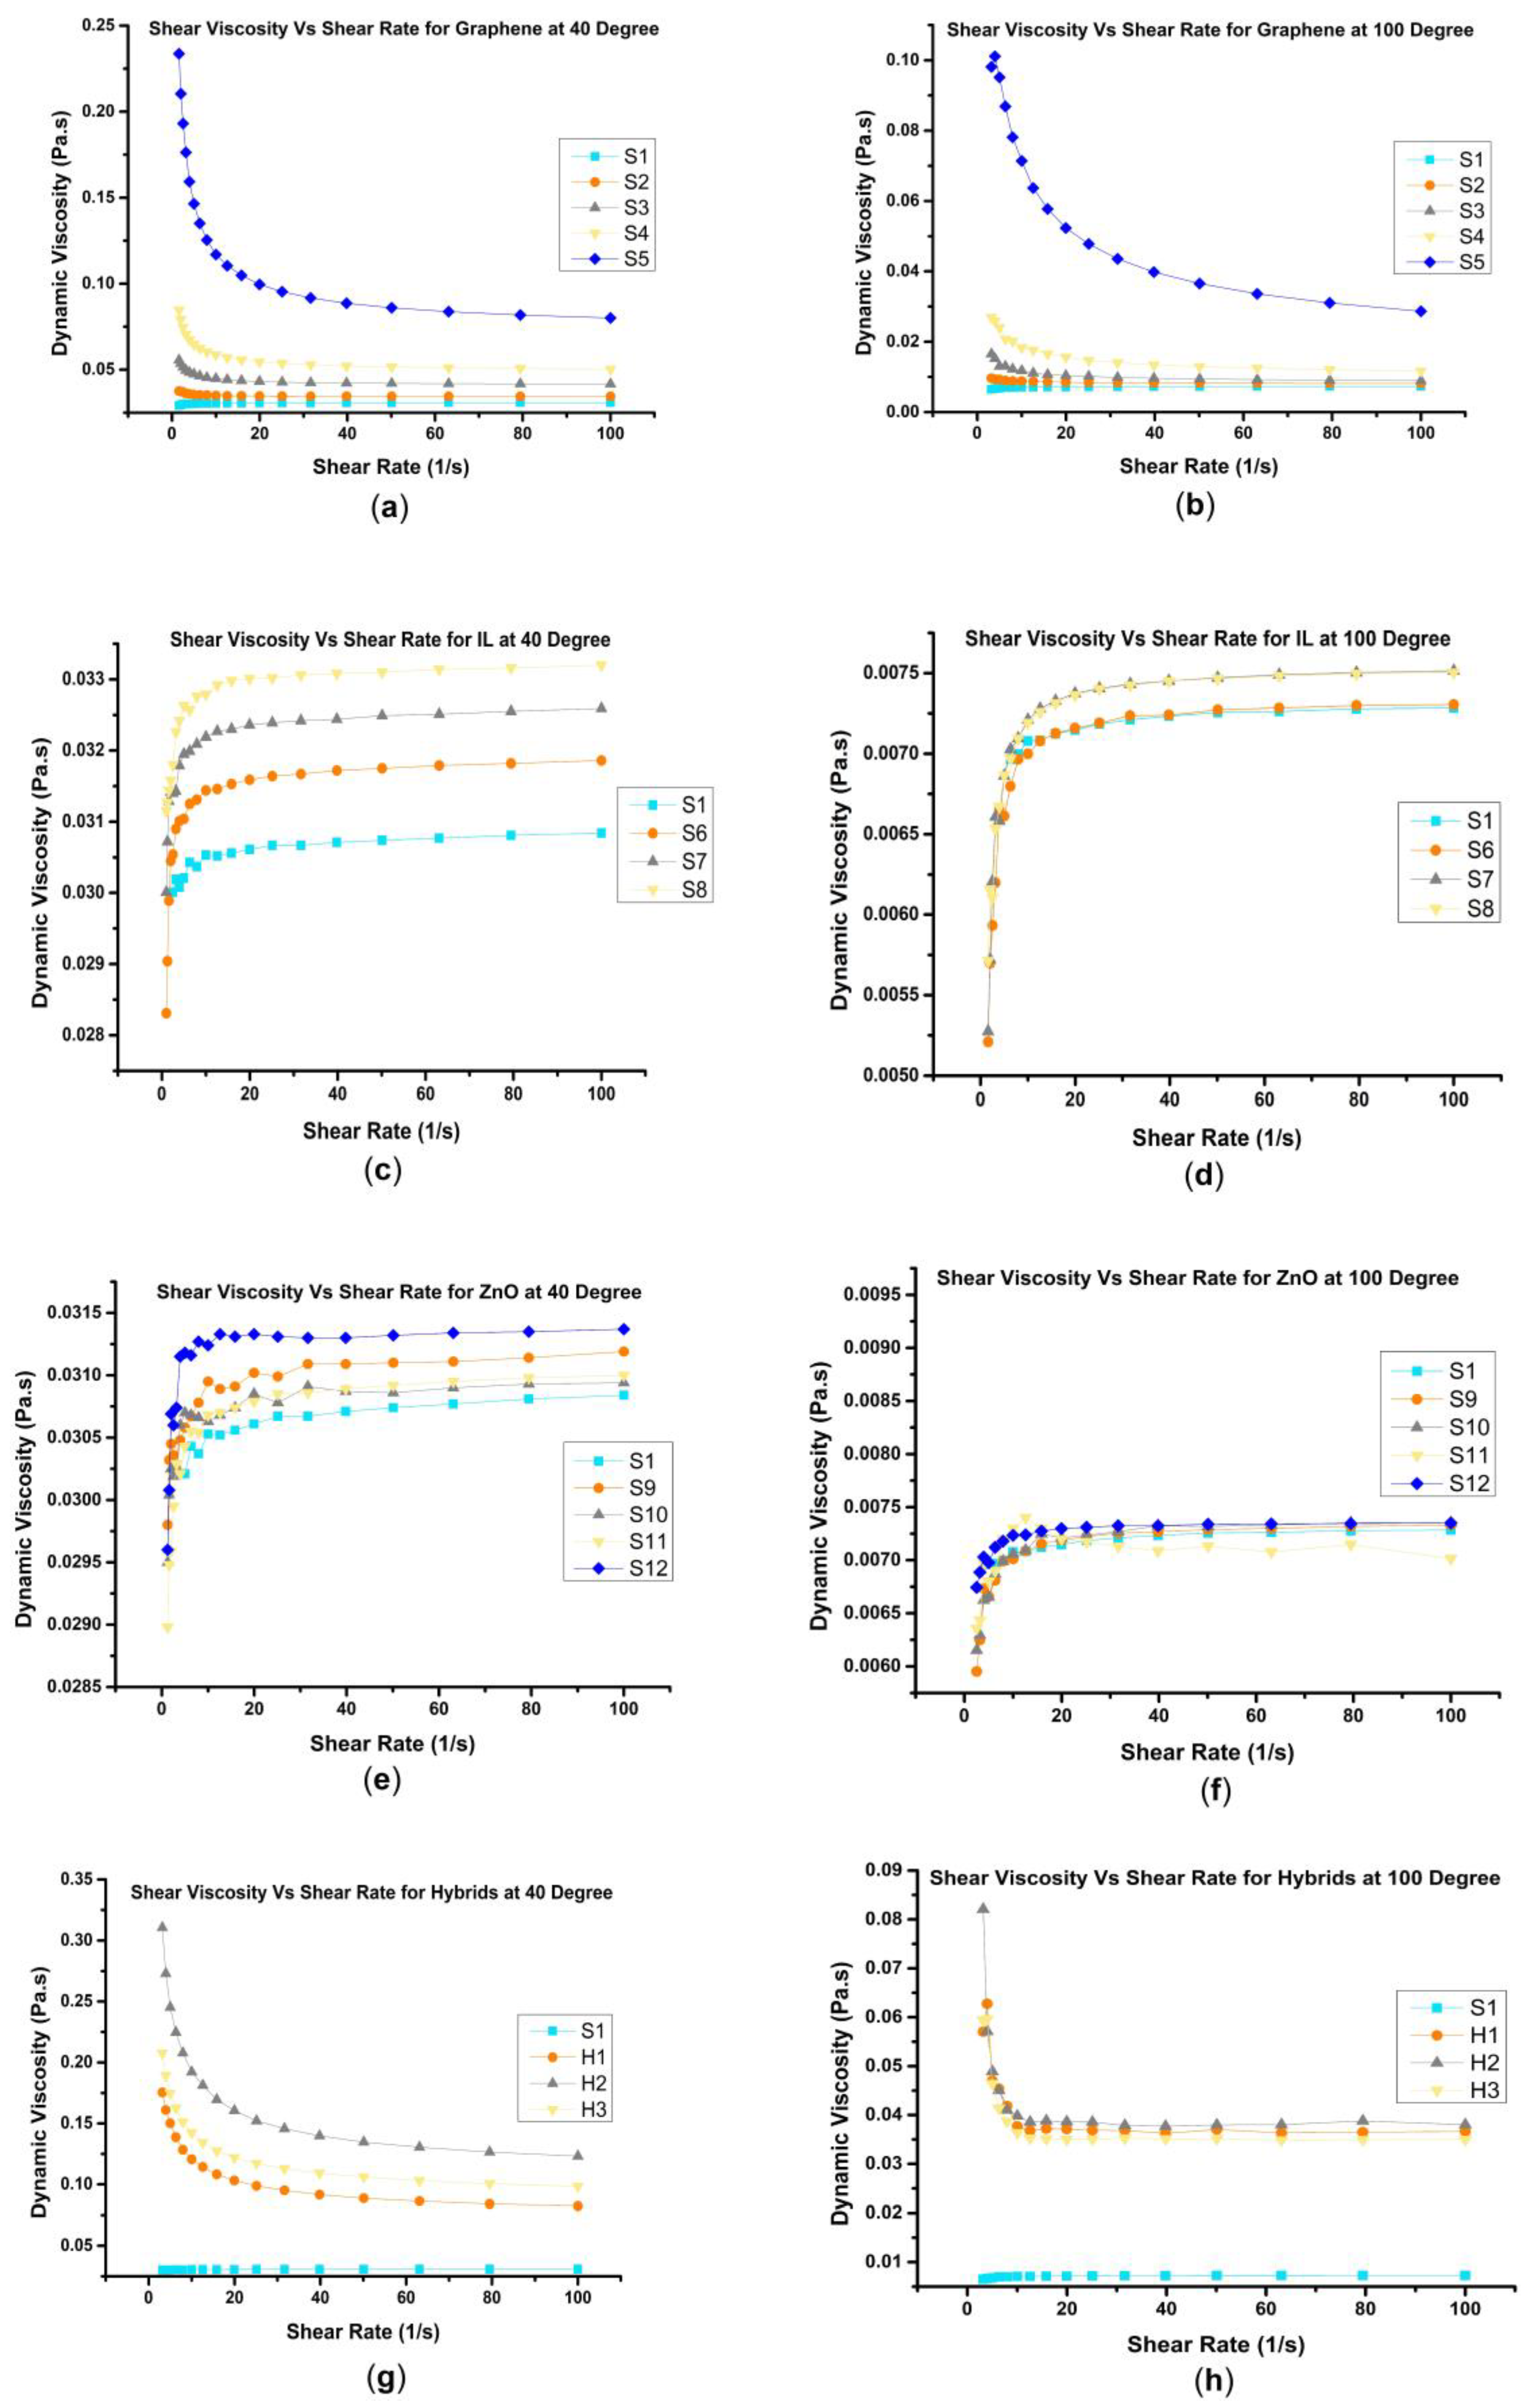
Figure 12.
Dynamic viscosity values for the prepared mixtures at 40 °C (blue) and 100 °C (orange).
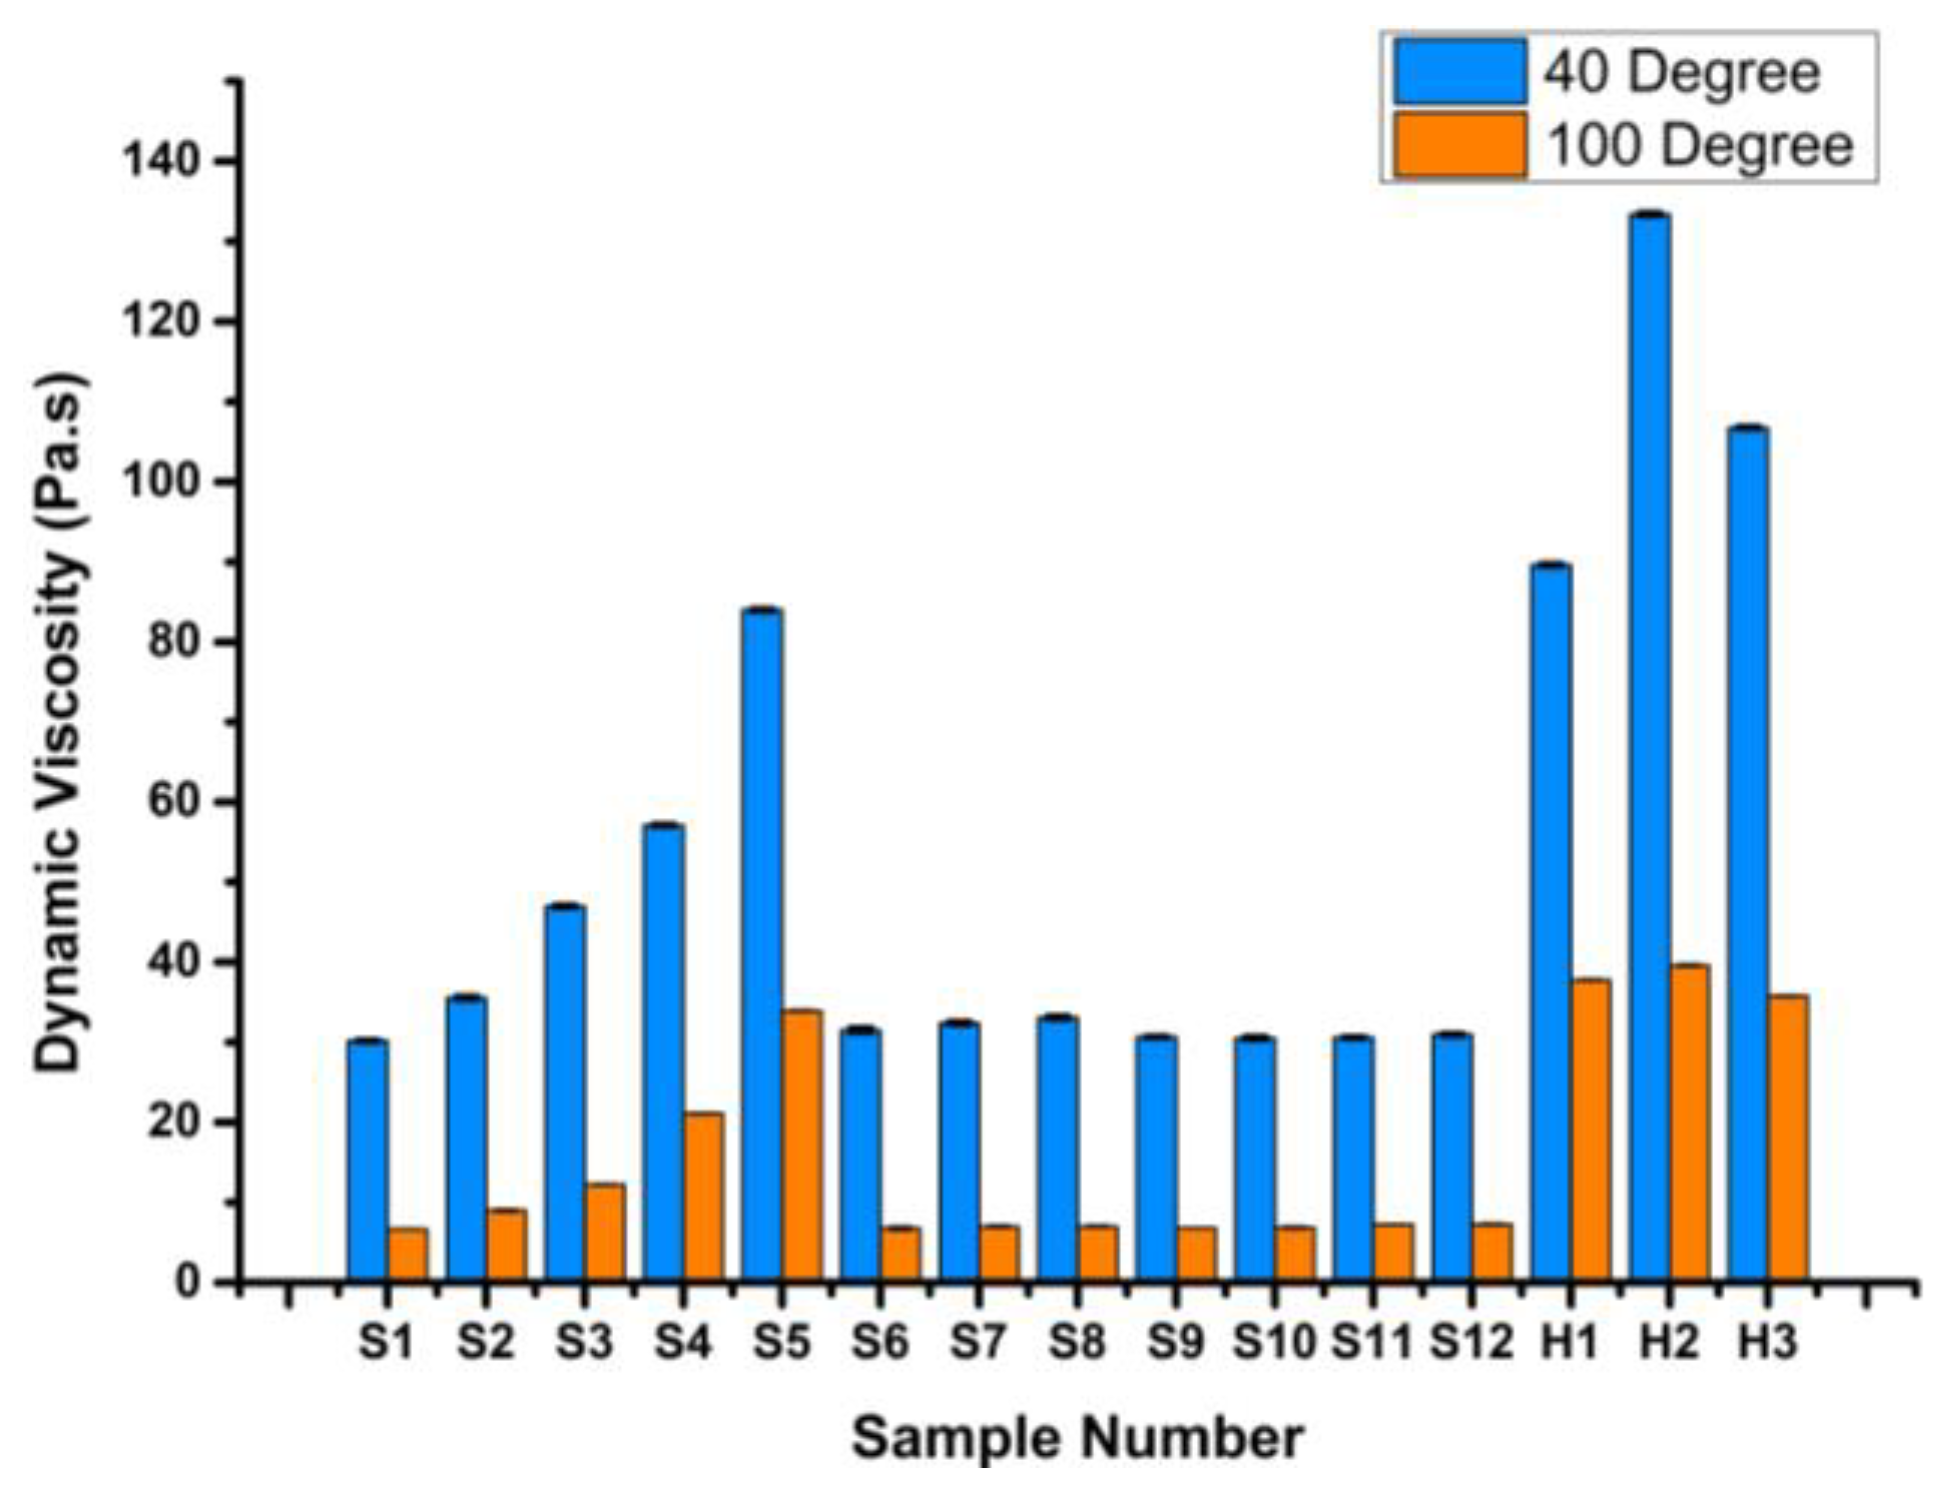
Figure 13.
Viscosity index values for all samples.

Figure 14.
Average friction coefficient values at boundary condition for all samples at room temperature (RT) (light blue) and 60 °C (orange).
Figure 14.
Average friction coefficient values at boundary condition for all samples at room temperature (RT) (light blue) and 60 °C (orange).

Figure 15.
Stribeck Curve for Graphene samples at (a) RT; (b) 60 °C at 1 GPa.
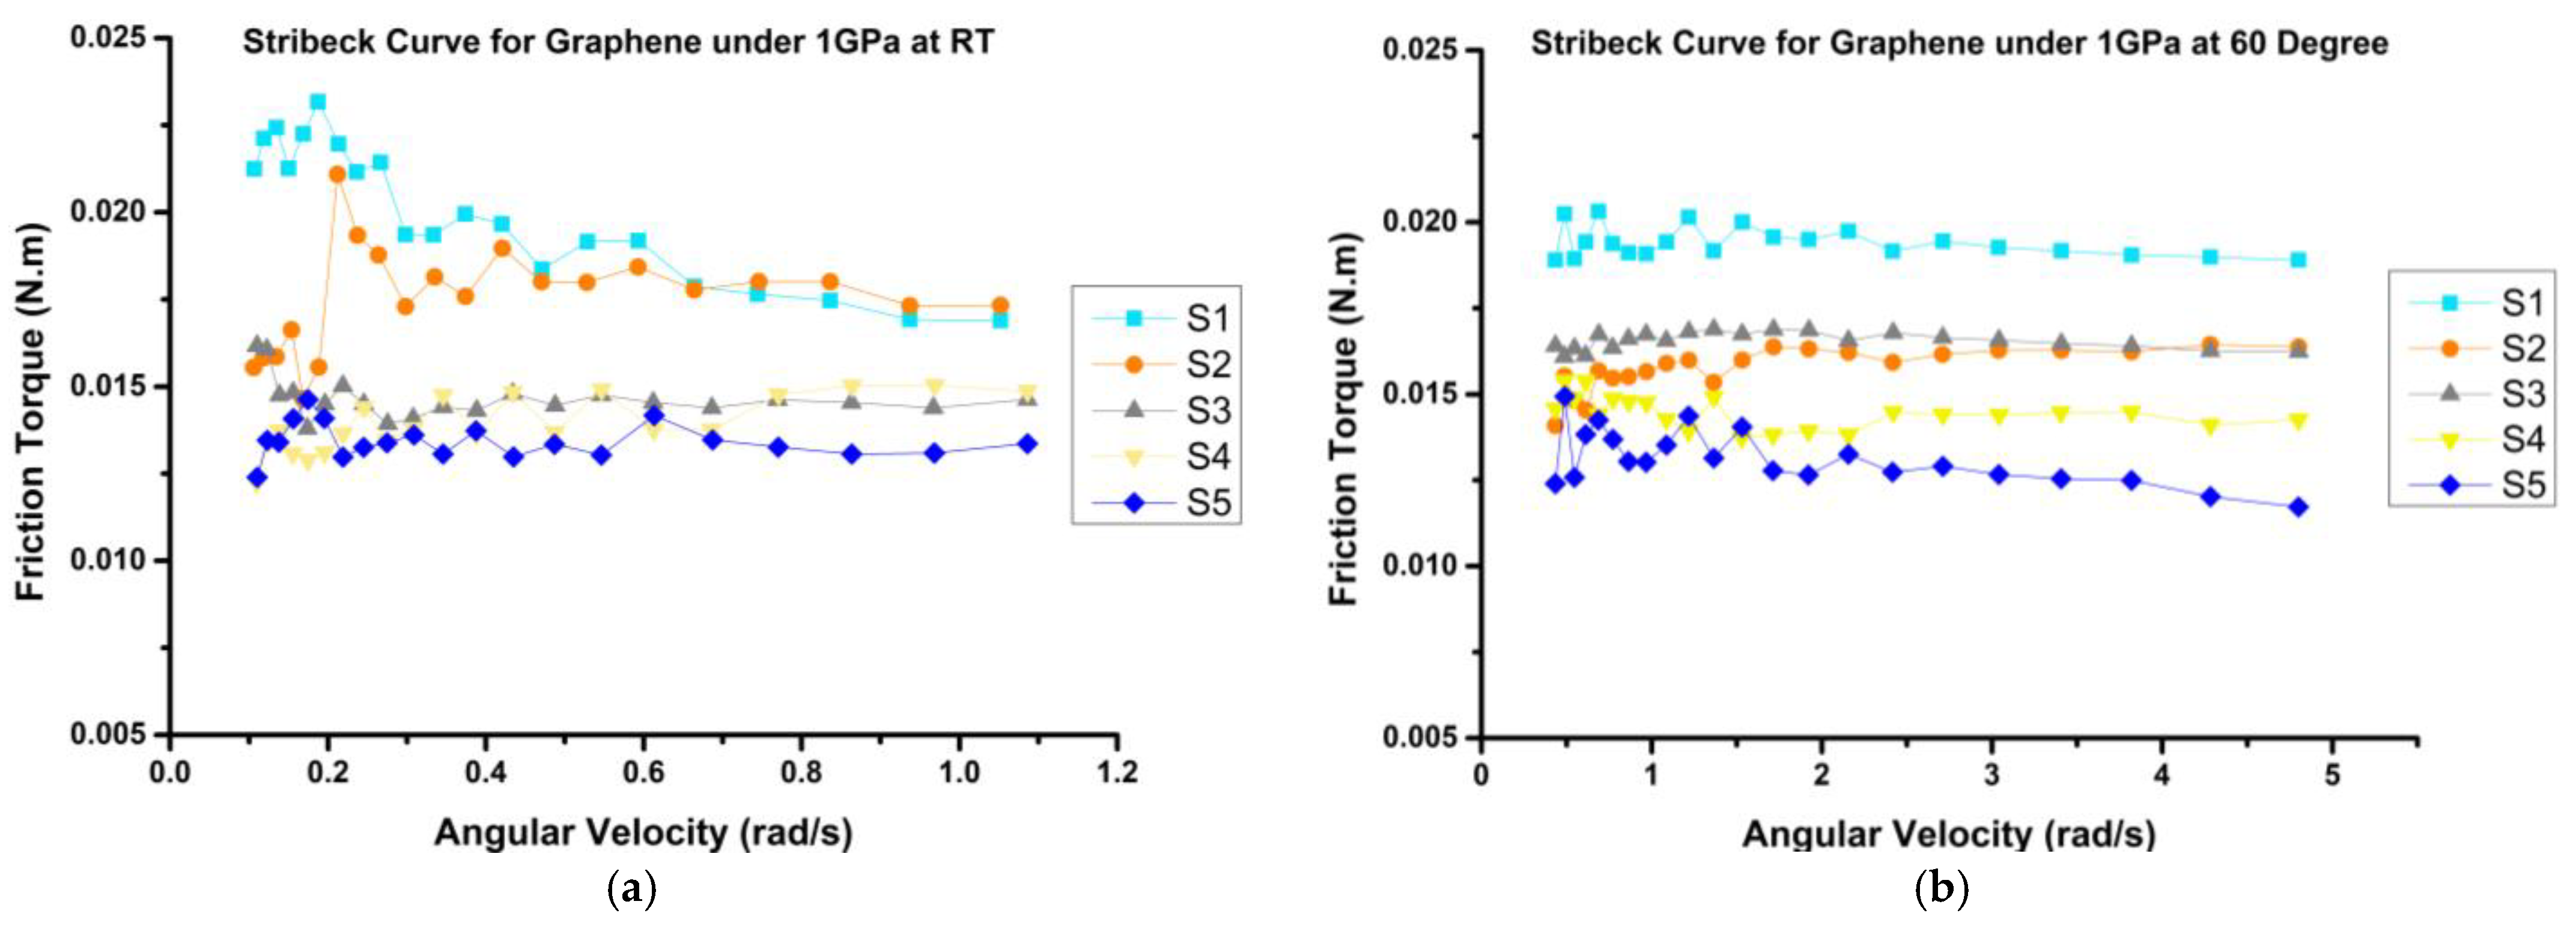
Figure 16.
Stribeck Curve for IL samples at (a) RT; (b) 60 °C at 1 GPa.
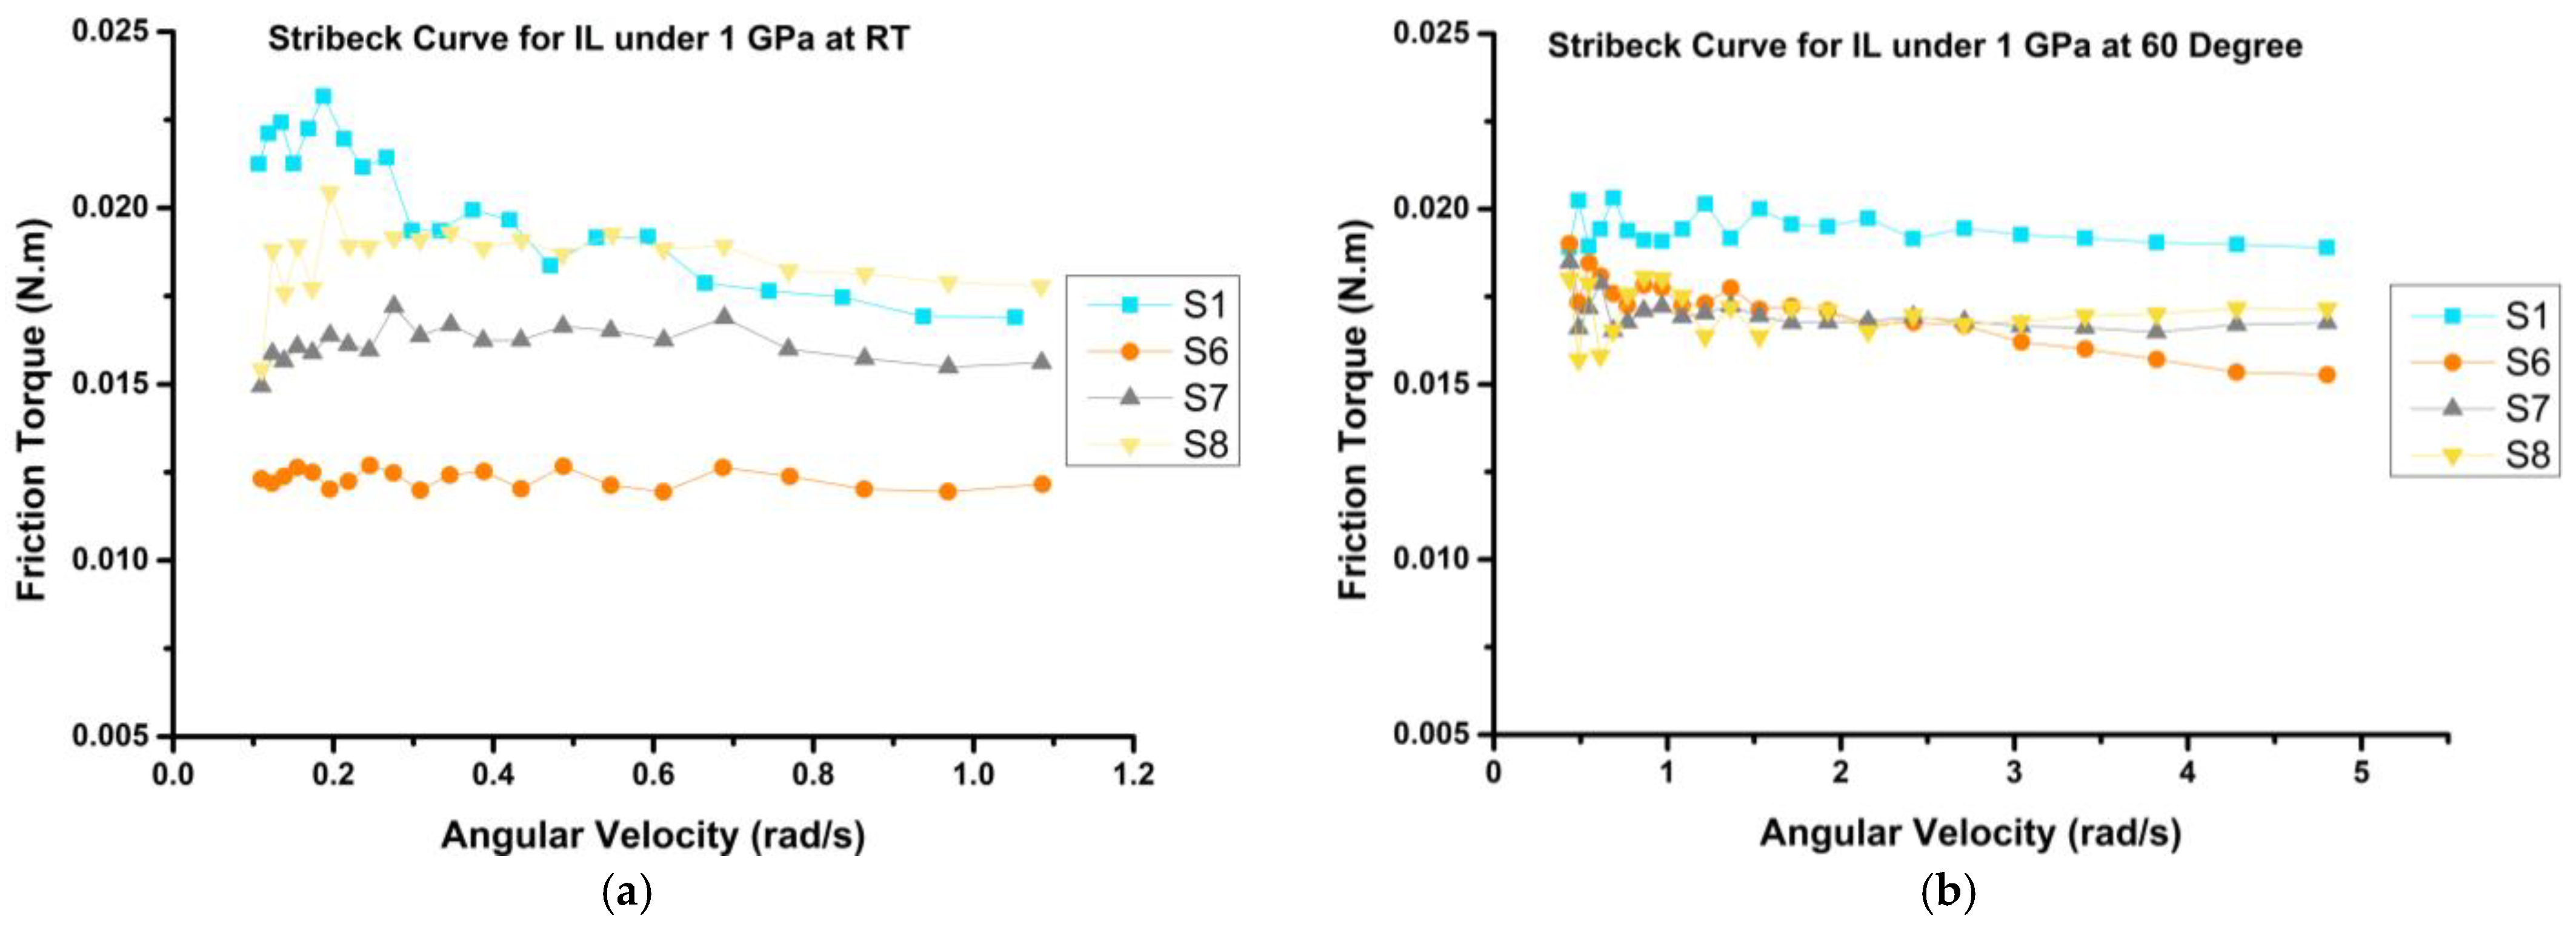
Figure 17.
The tribo-mechanism of the applied ionic liquid.
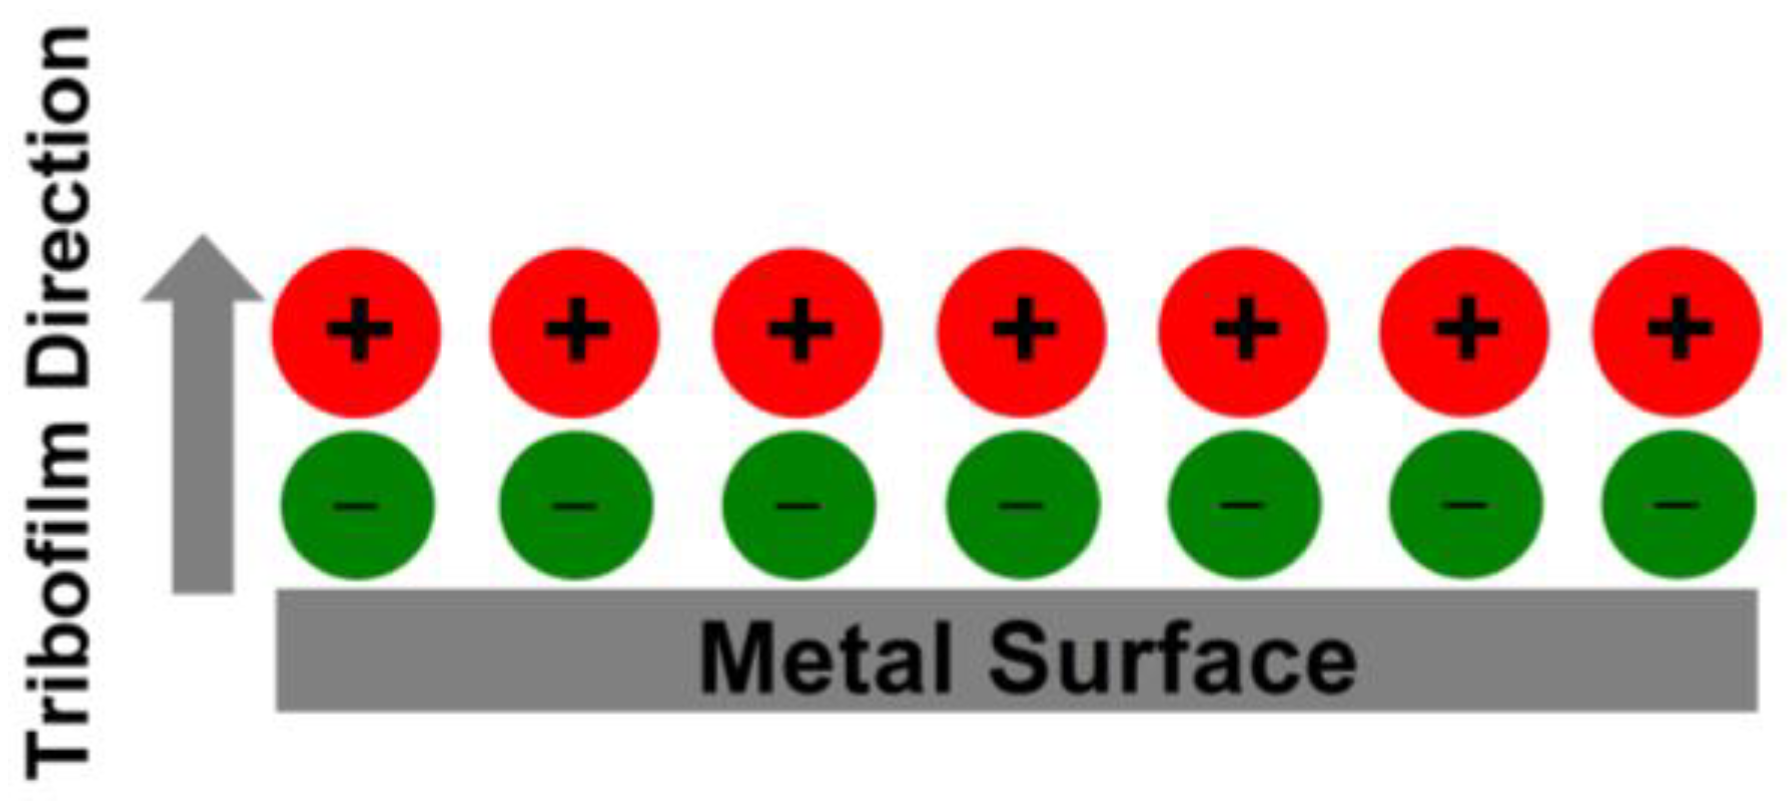
Figure 18.
Stribeck Curve for ZnO samples at (a) RT; (b) 60 °C at 1 GPa.
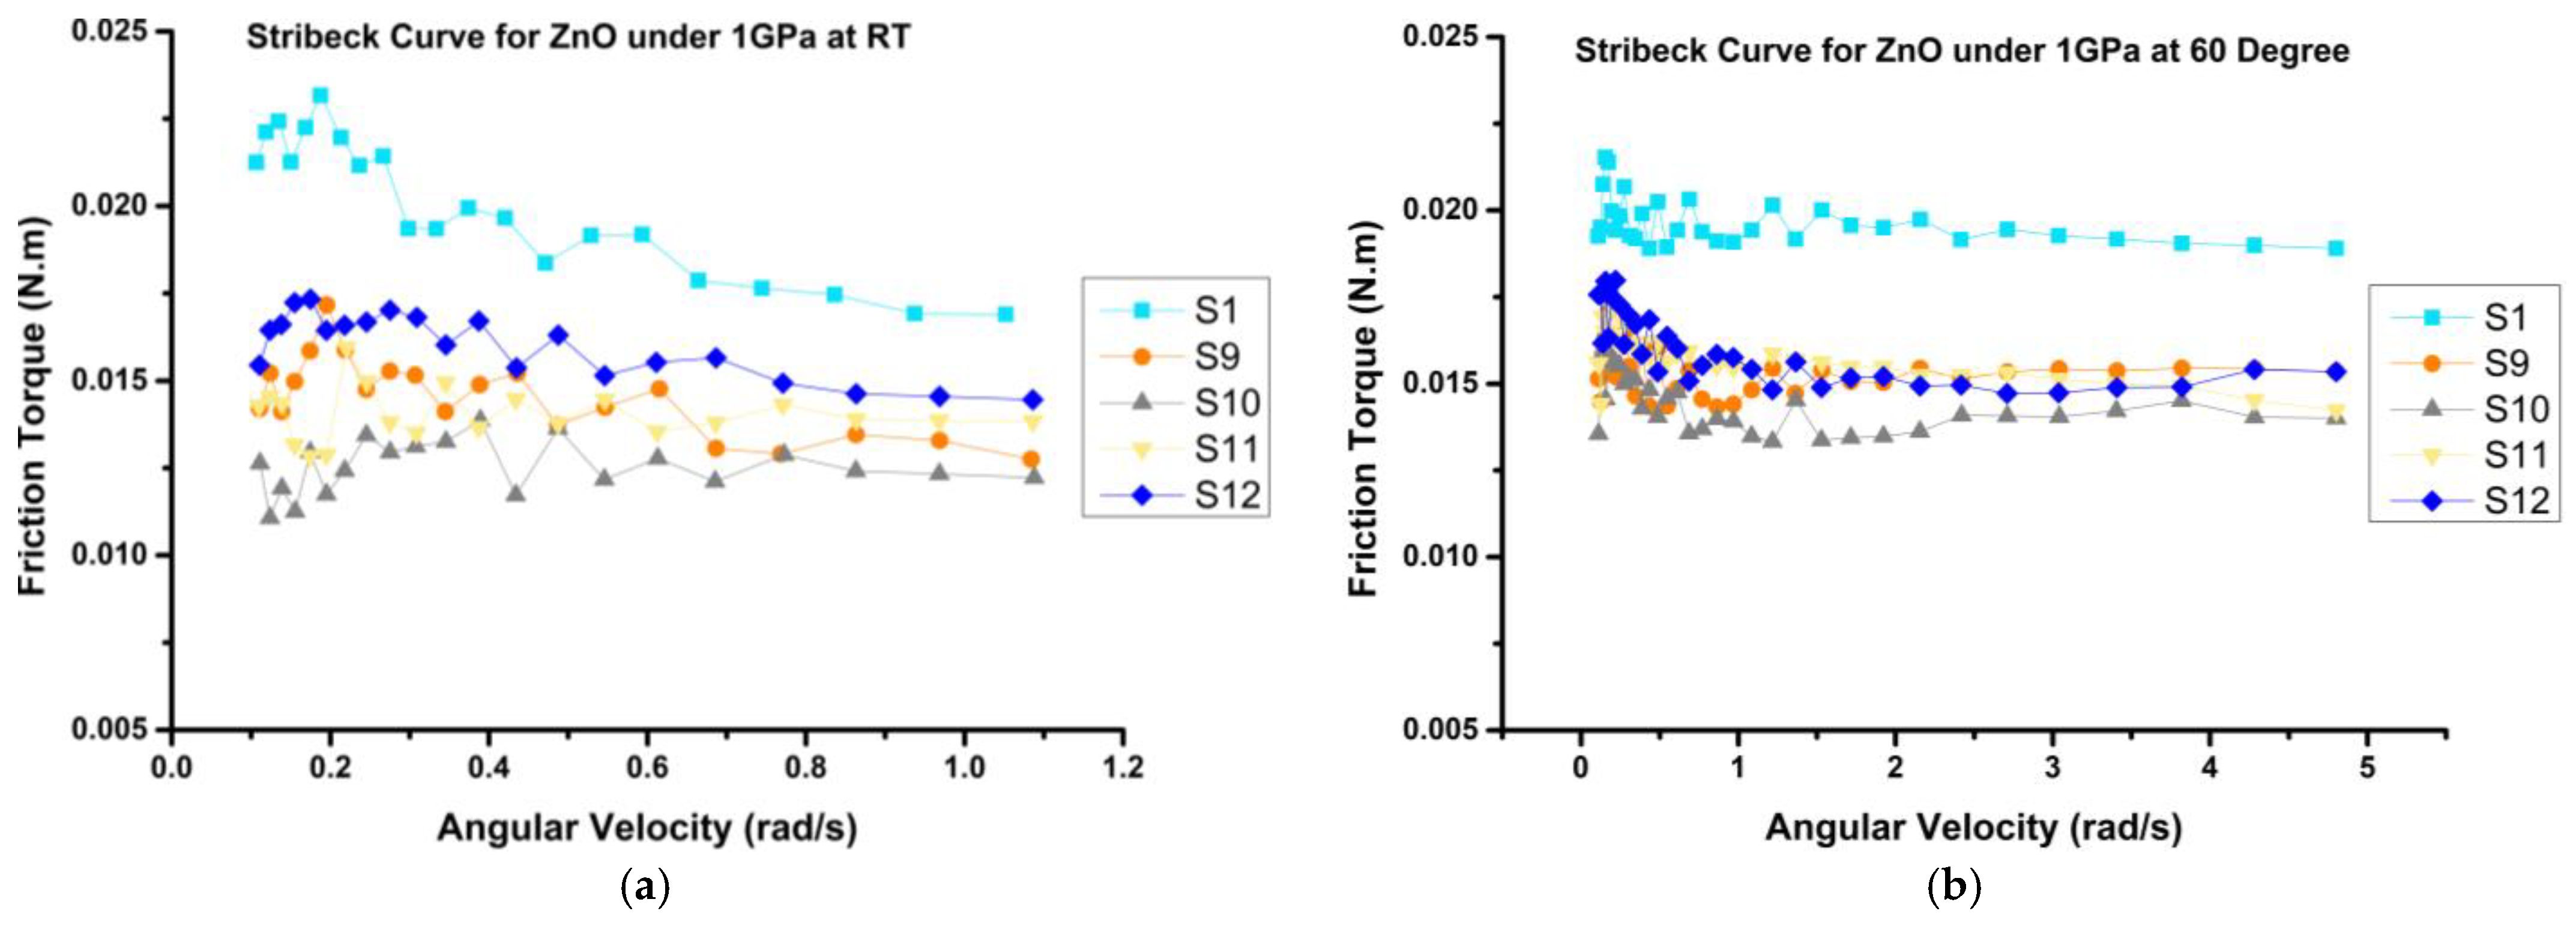
Figure 19.
Stribeck Curve for hybrid samples at (a) RT; (b) 60 °C at 1 GPa.
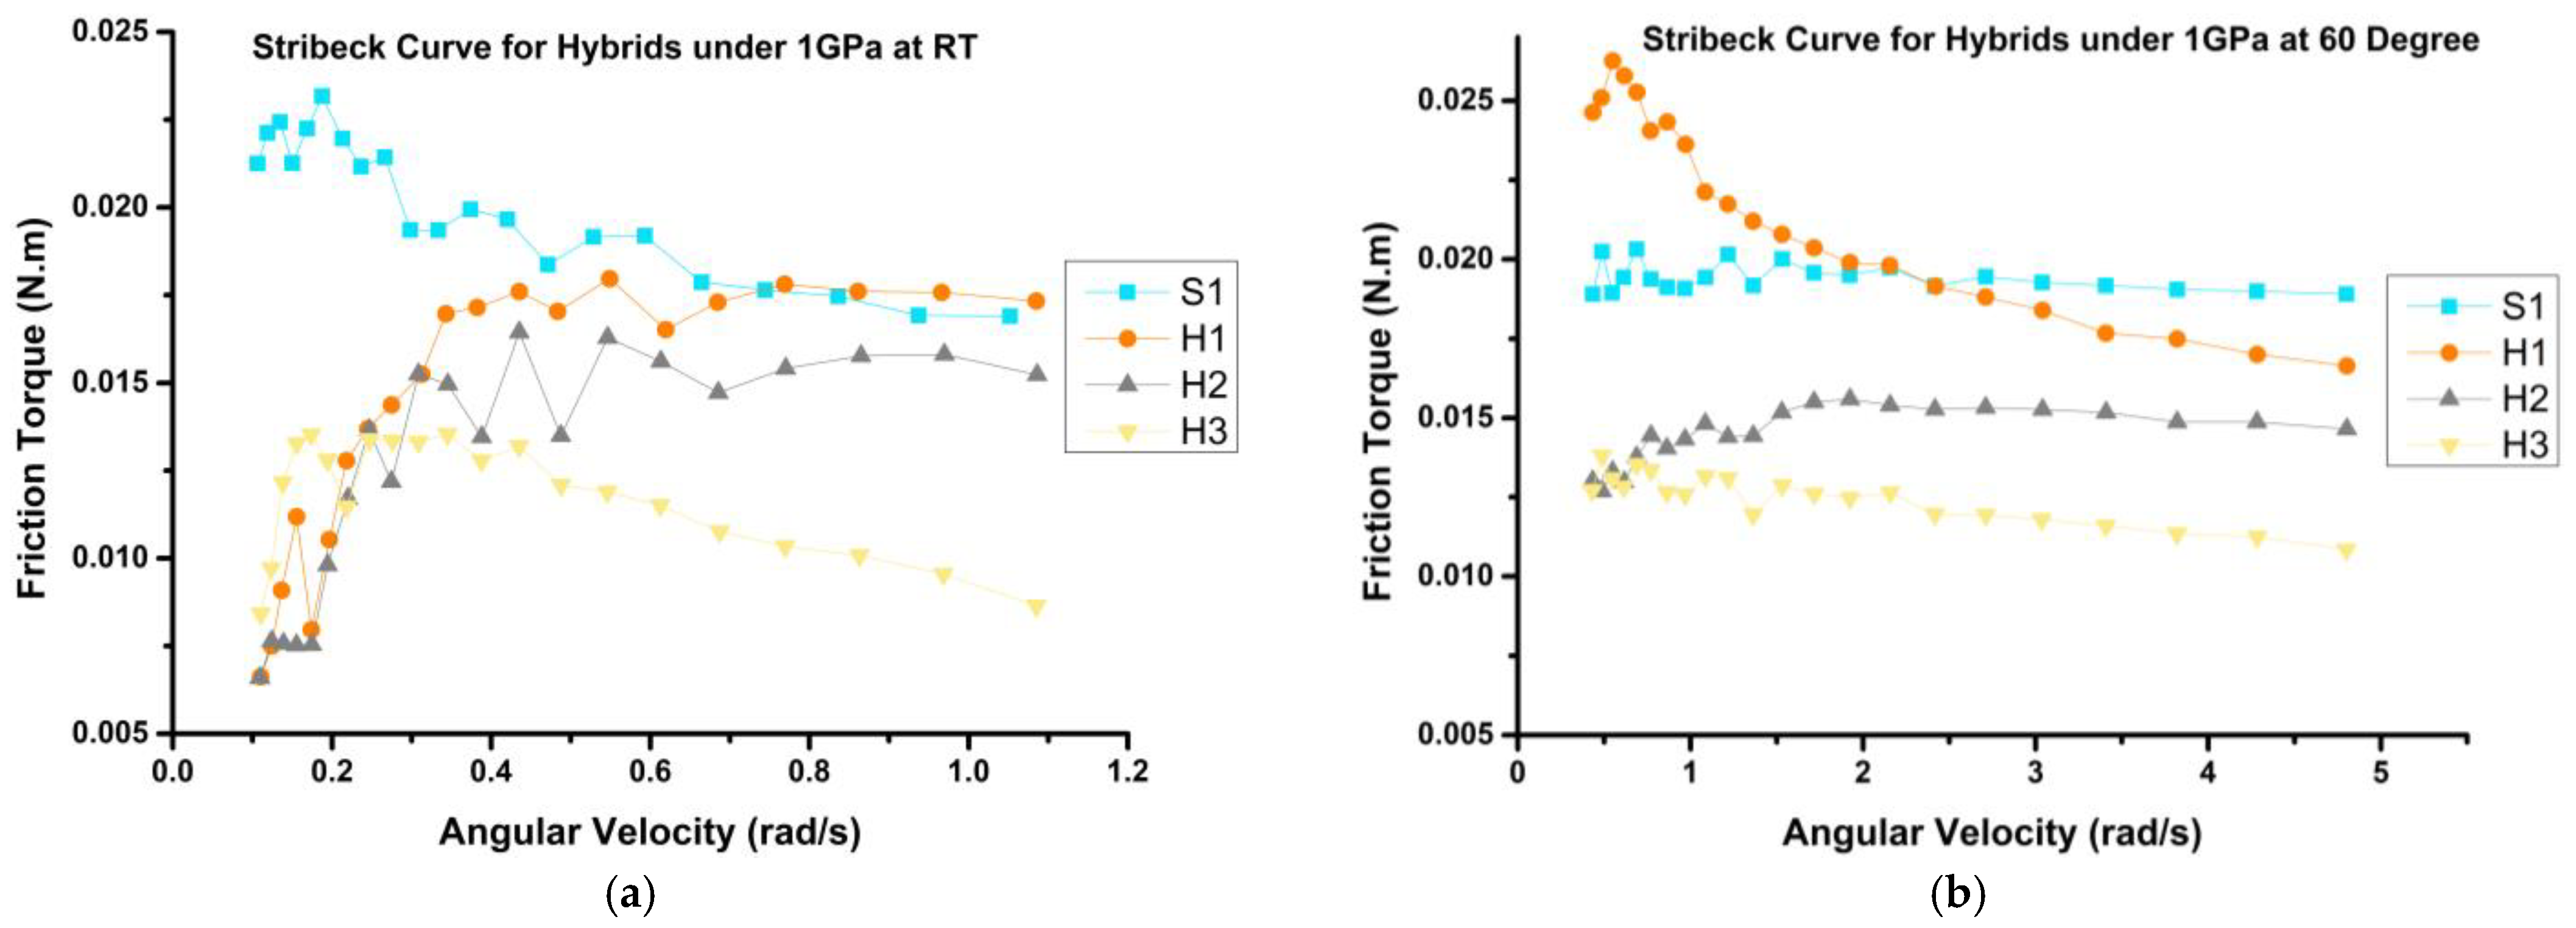
Figure 20.
A representation of wear volume values for all samples.

Figure 21.
Average roughness values for the worn surfaces of selected representative samples.
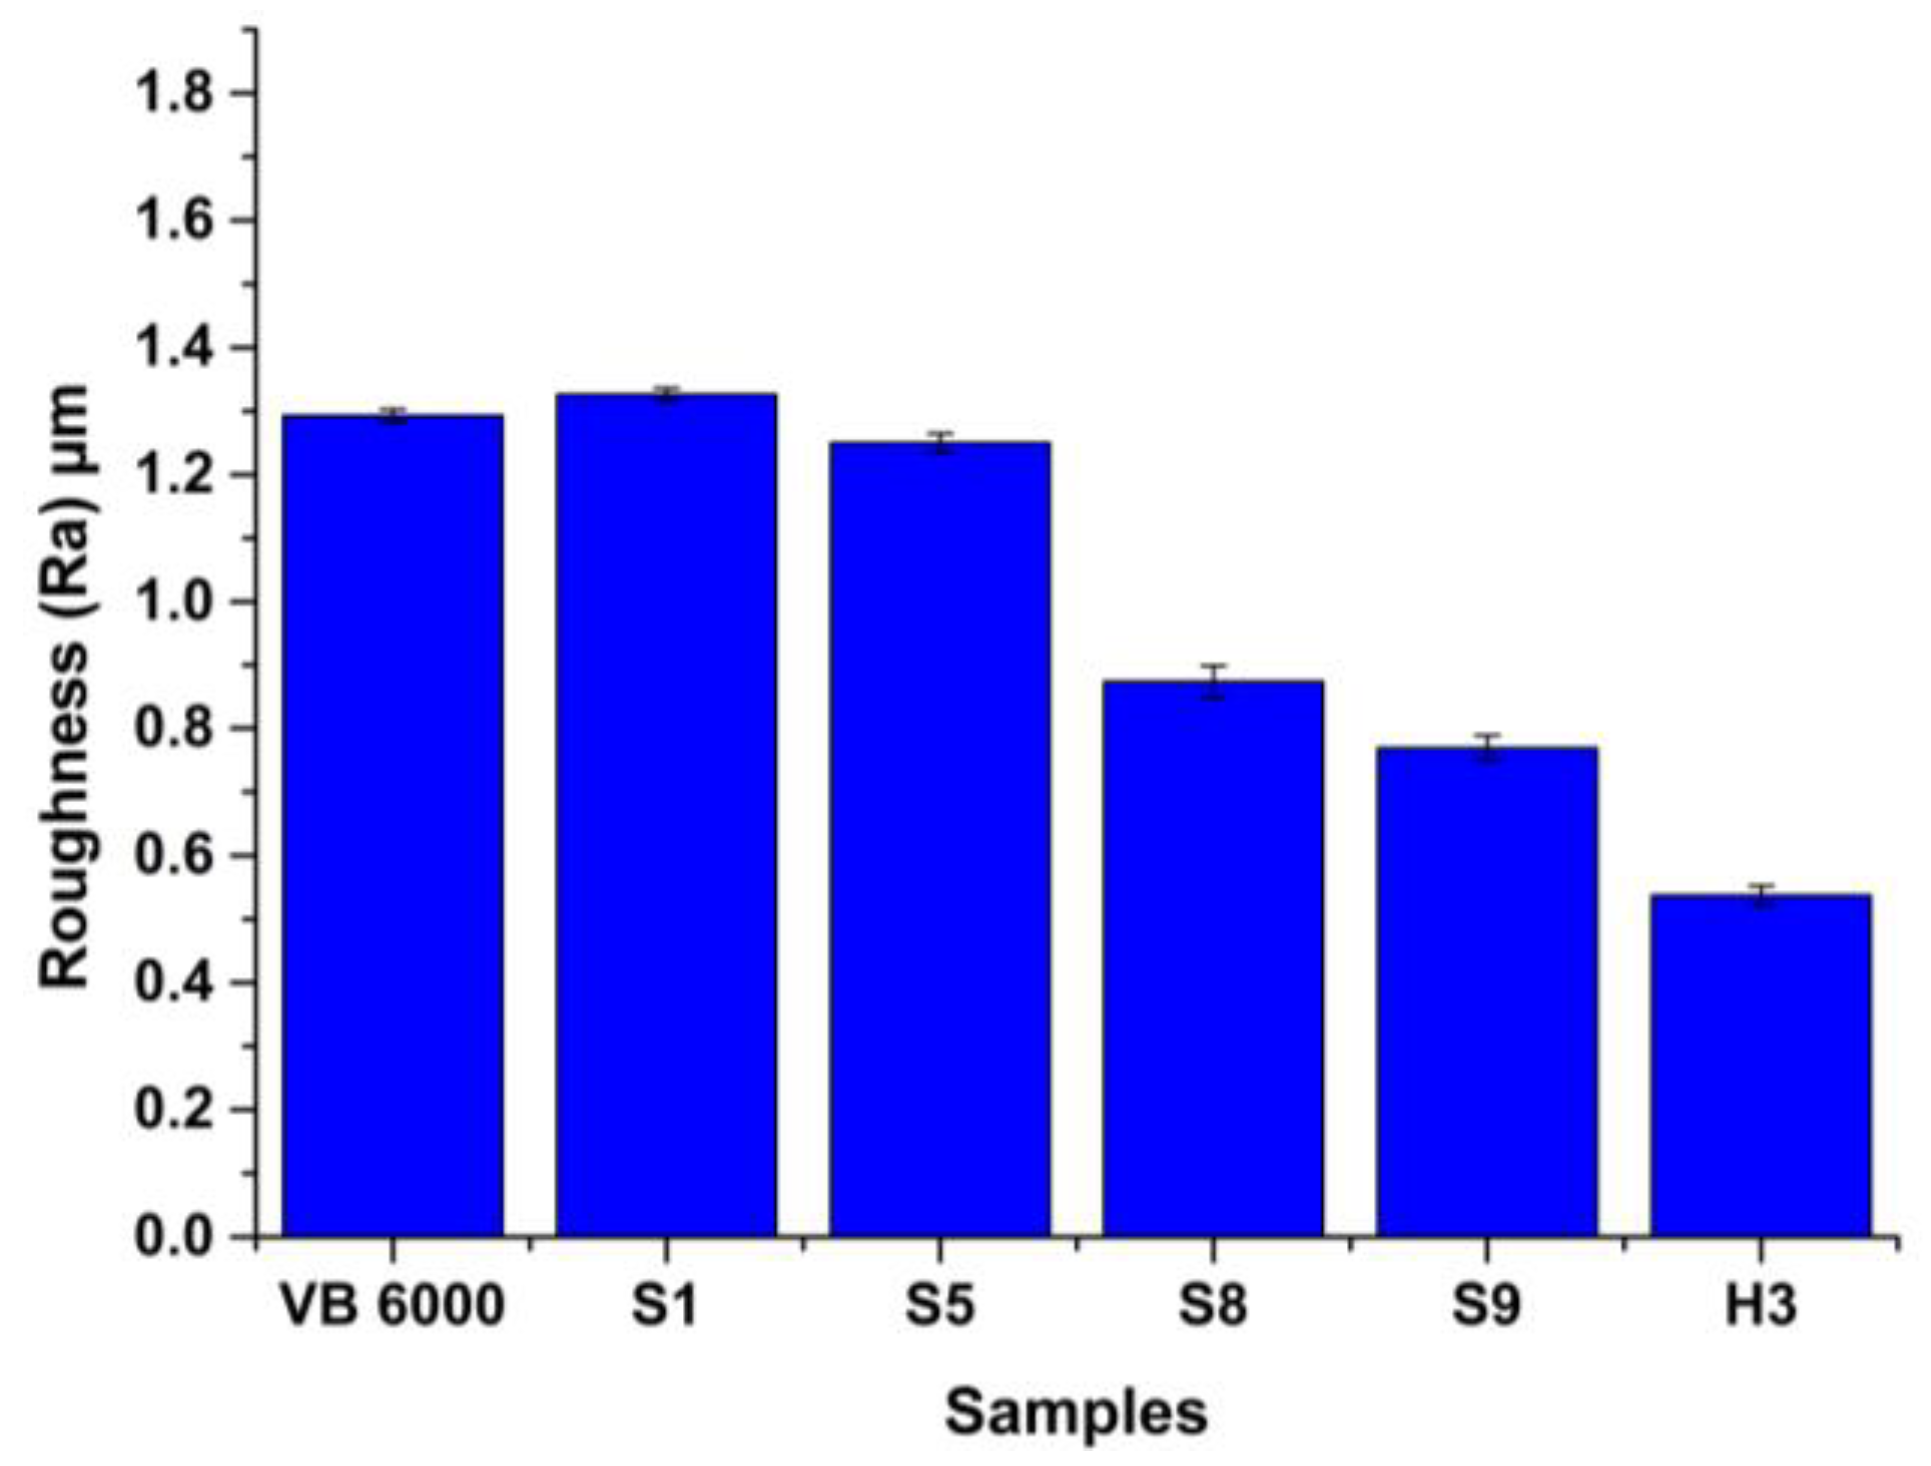
Figure 22.
3D images of wear scars for (a) S1; (b) VB 6000; (c) S9 and (d); H3.
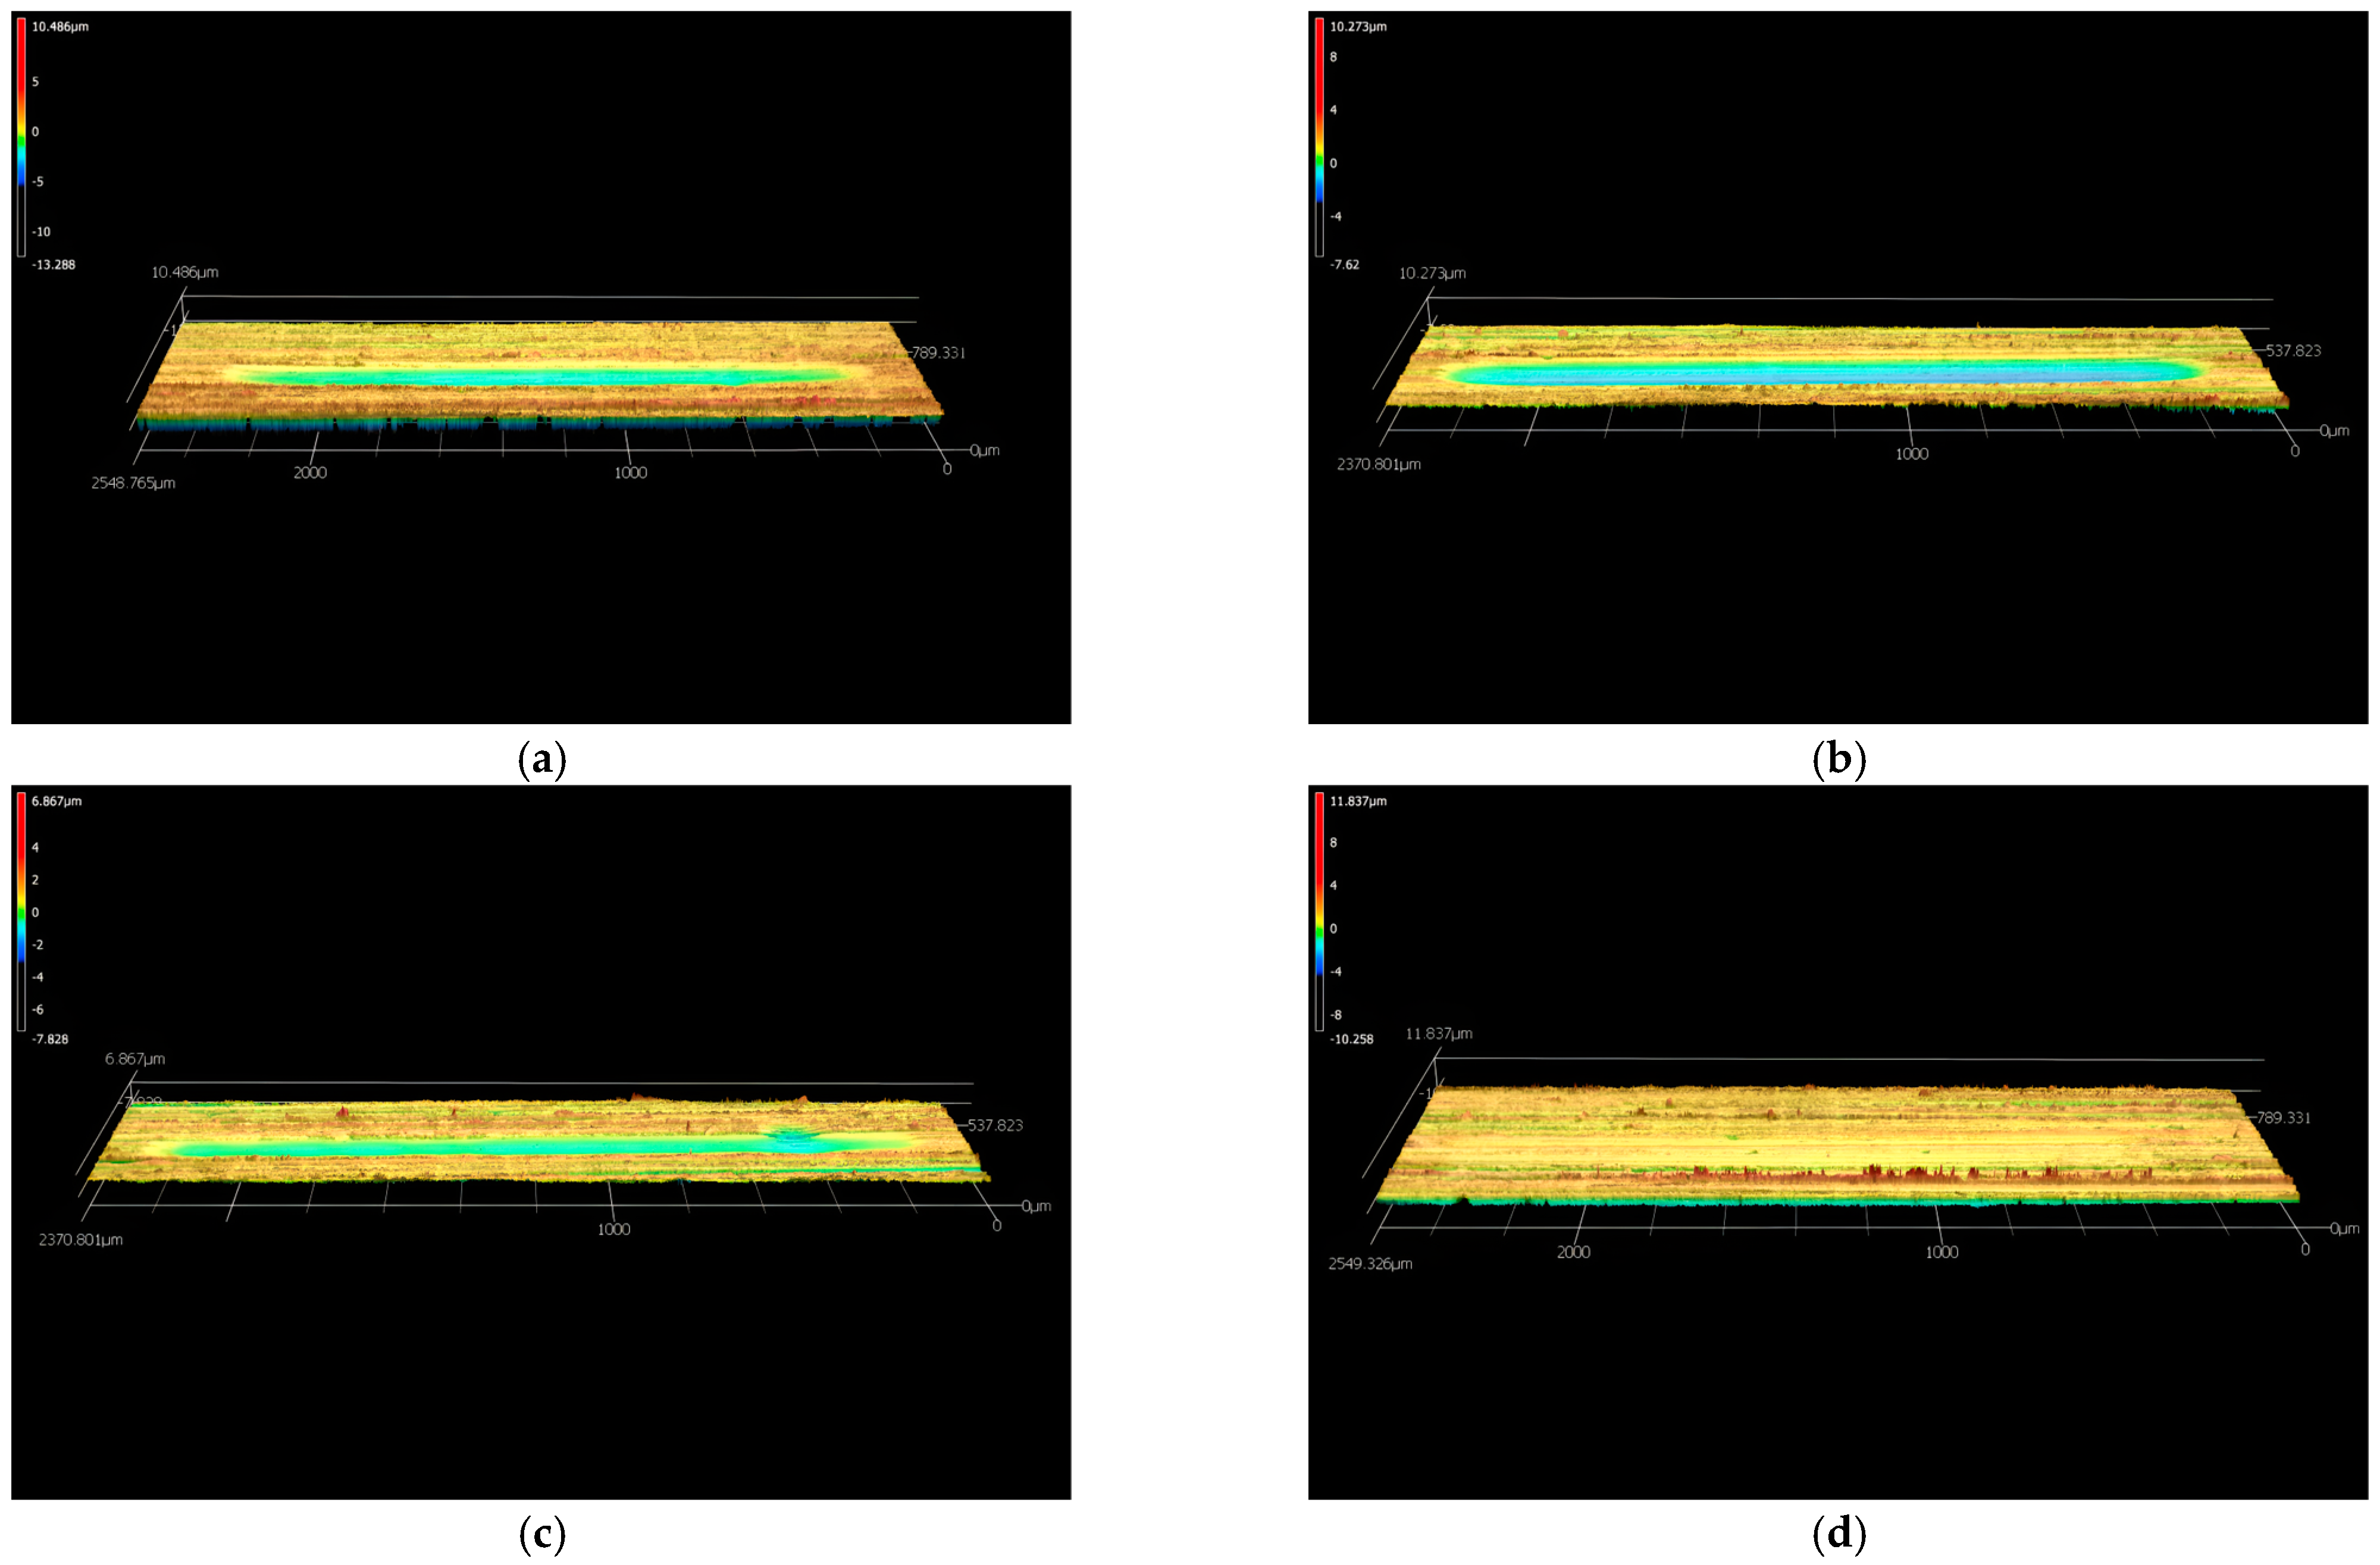
Figure 23.
Surface morphology of wear scars for (a) S1; (b) VB 6000; (c) S9; (d) H3.
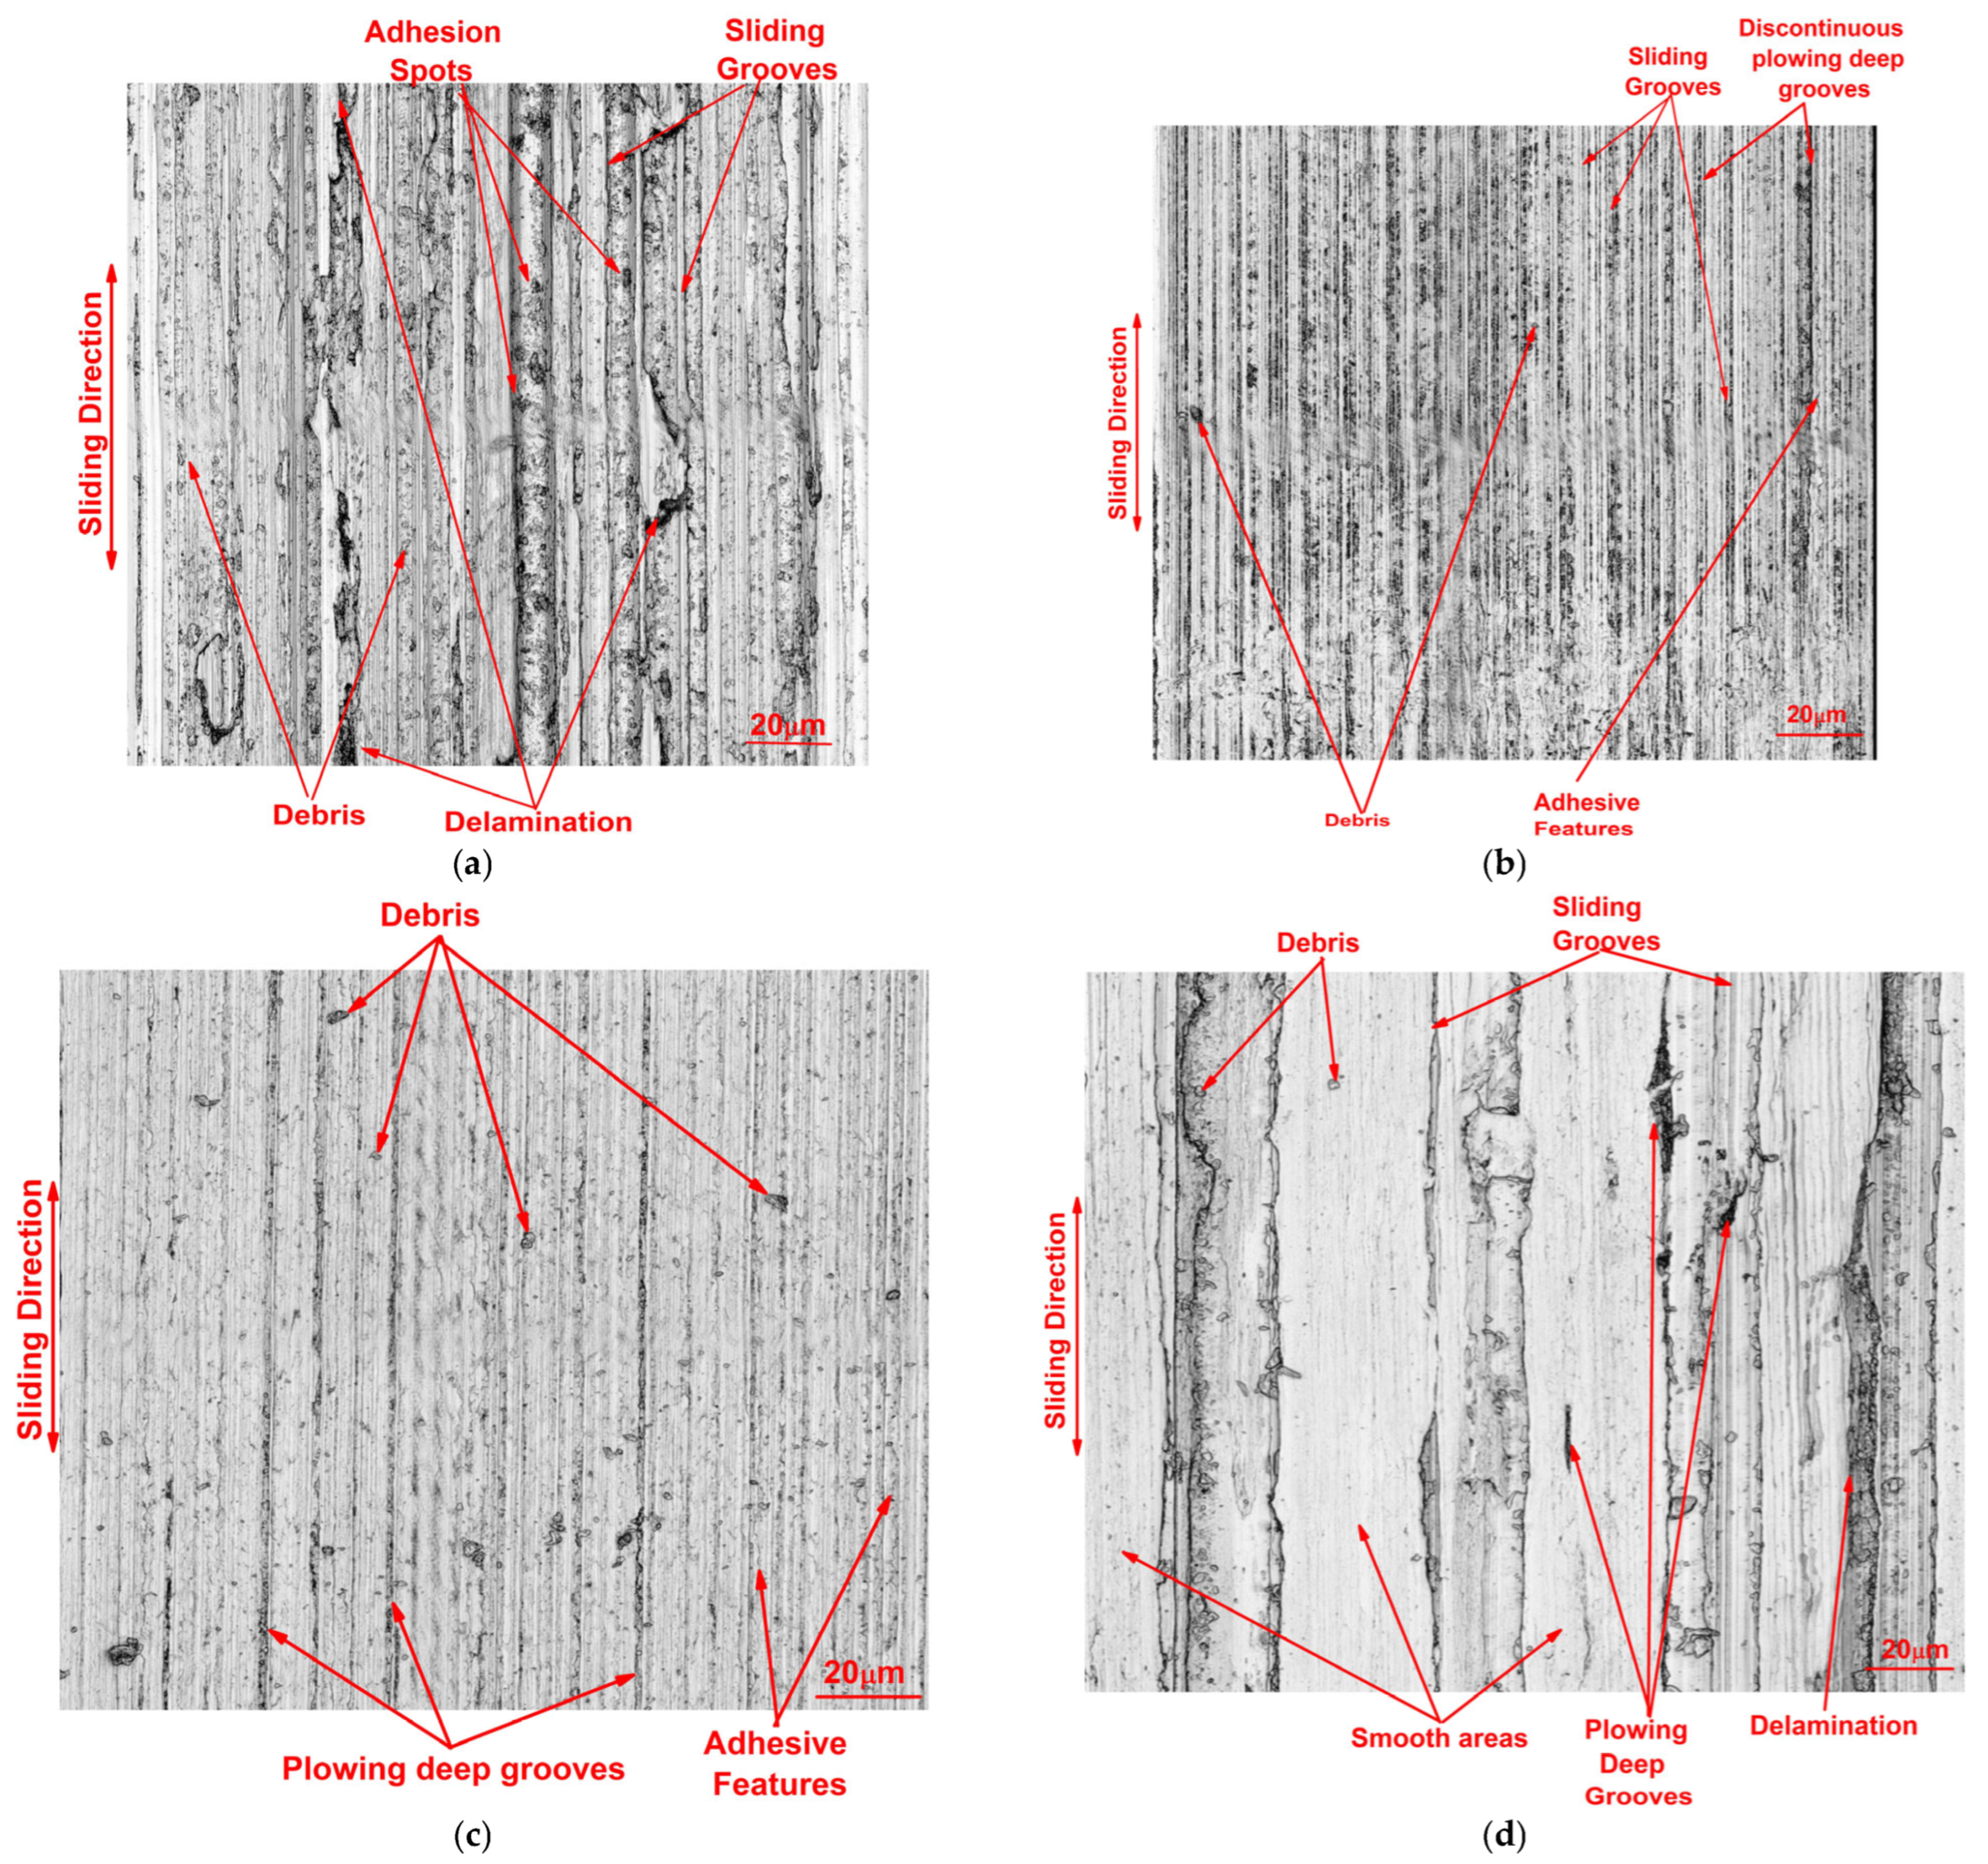
Figure 24.
Contact angles for (a) VB 6000; (b) S1; (c) S9; (d) H3 droplets.

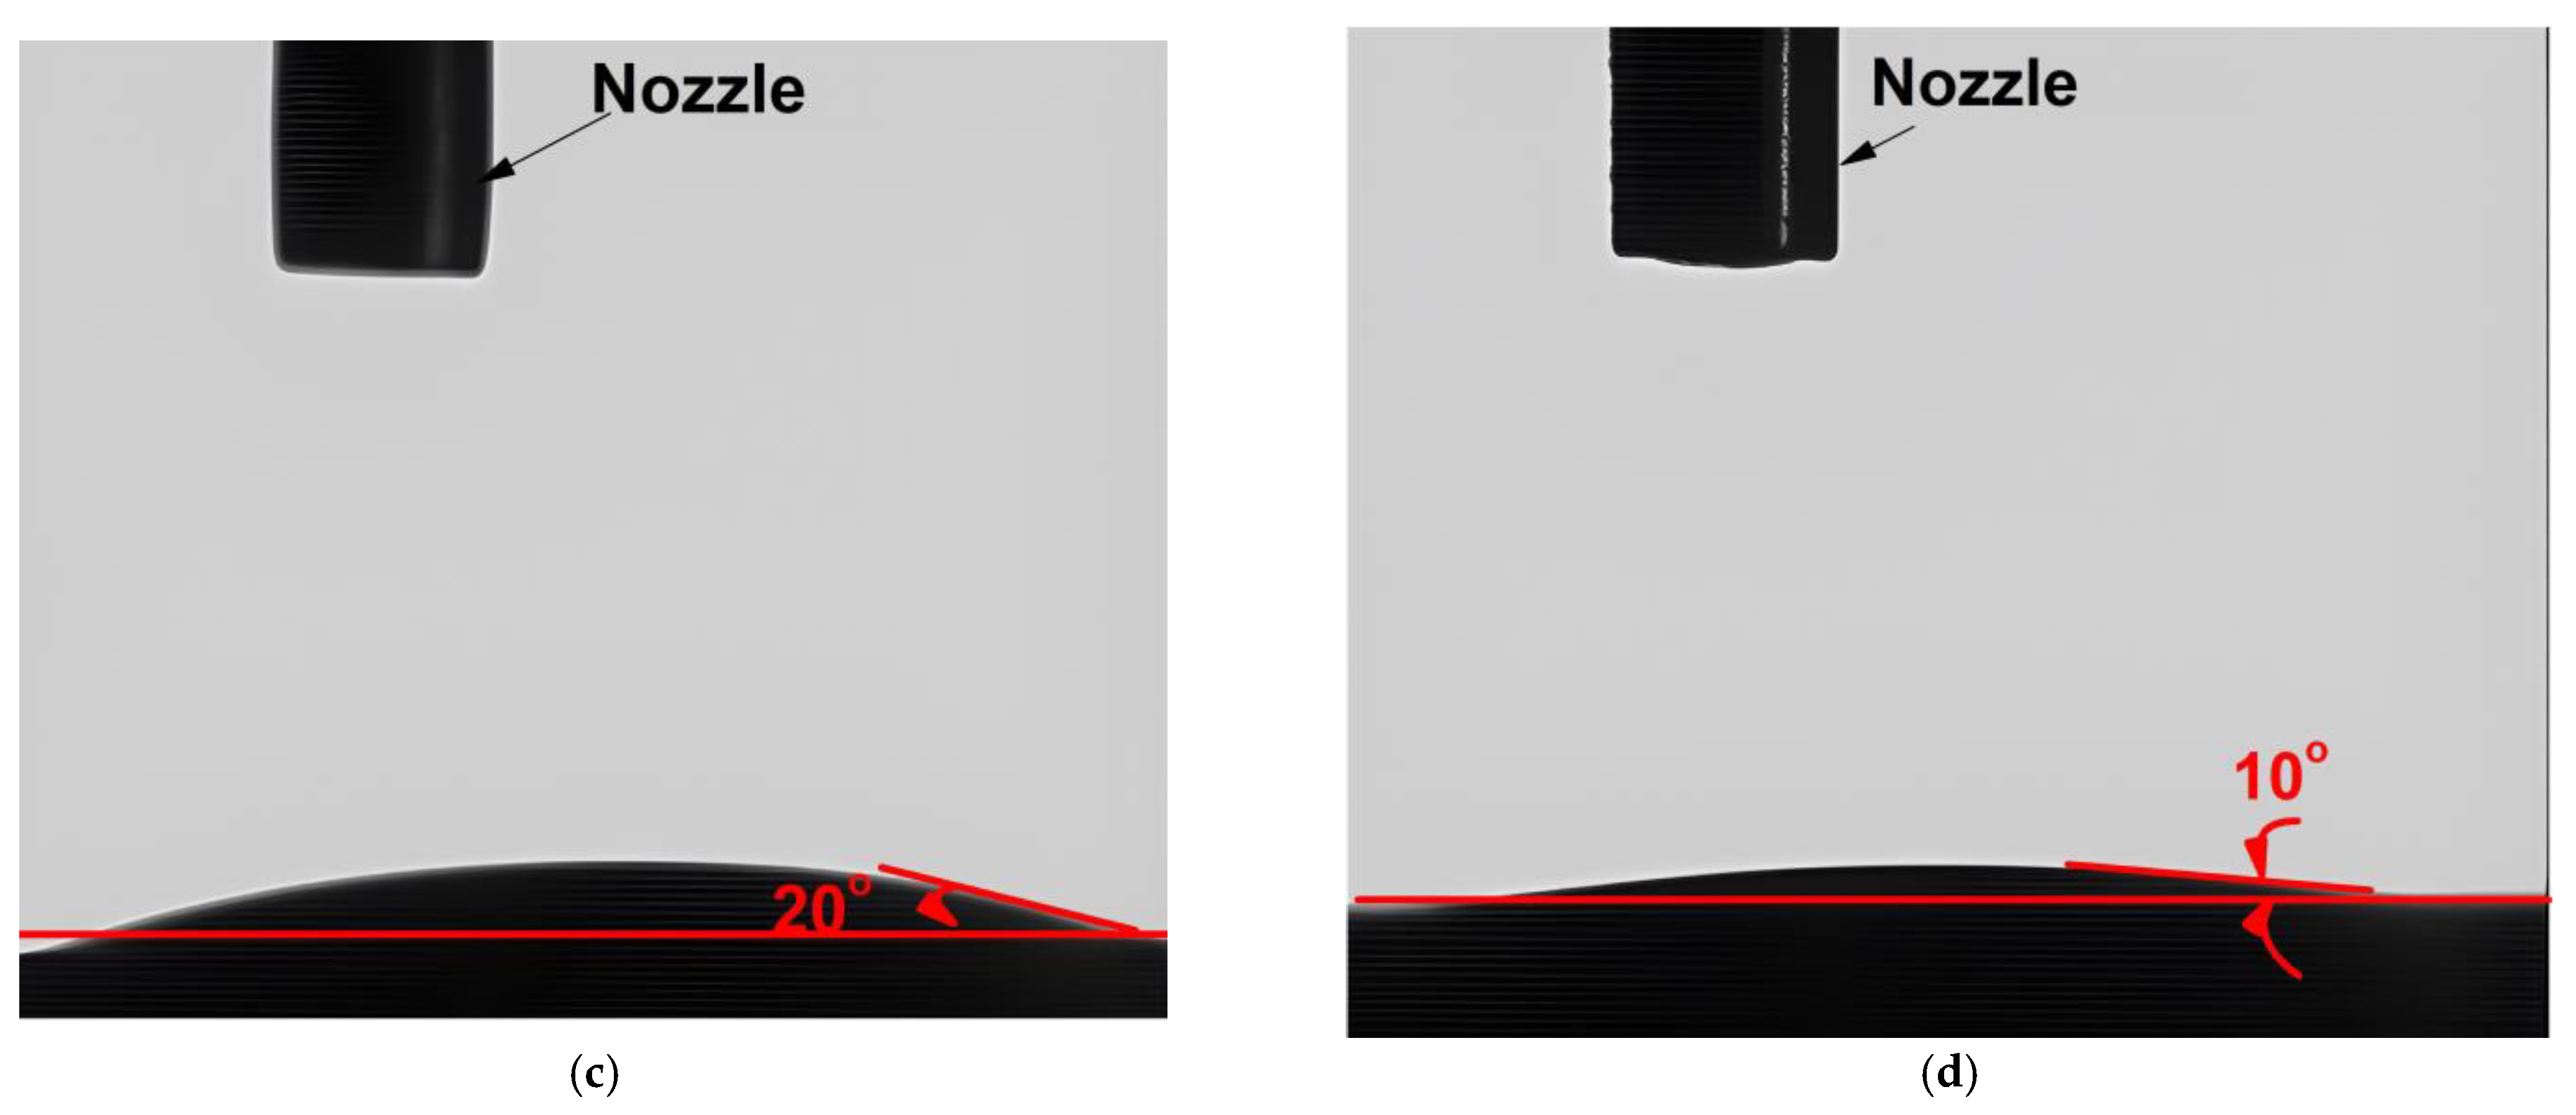

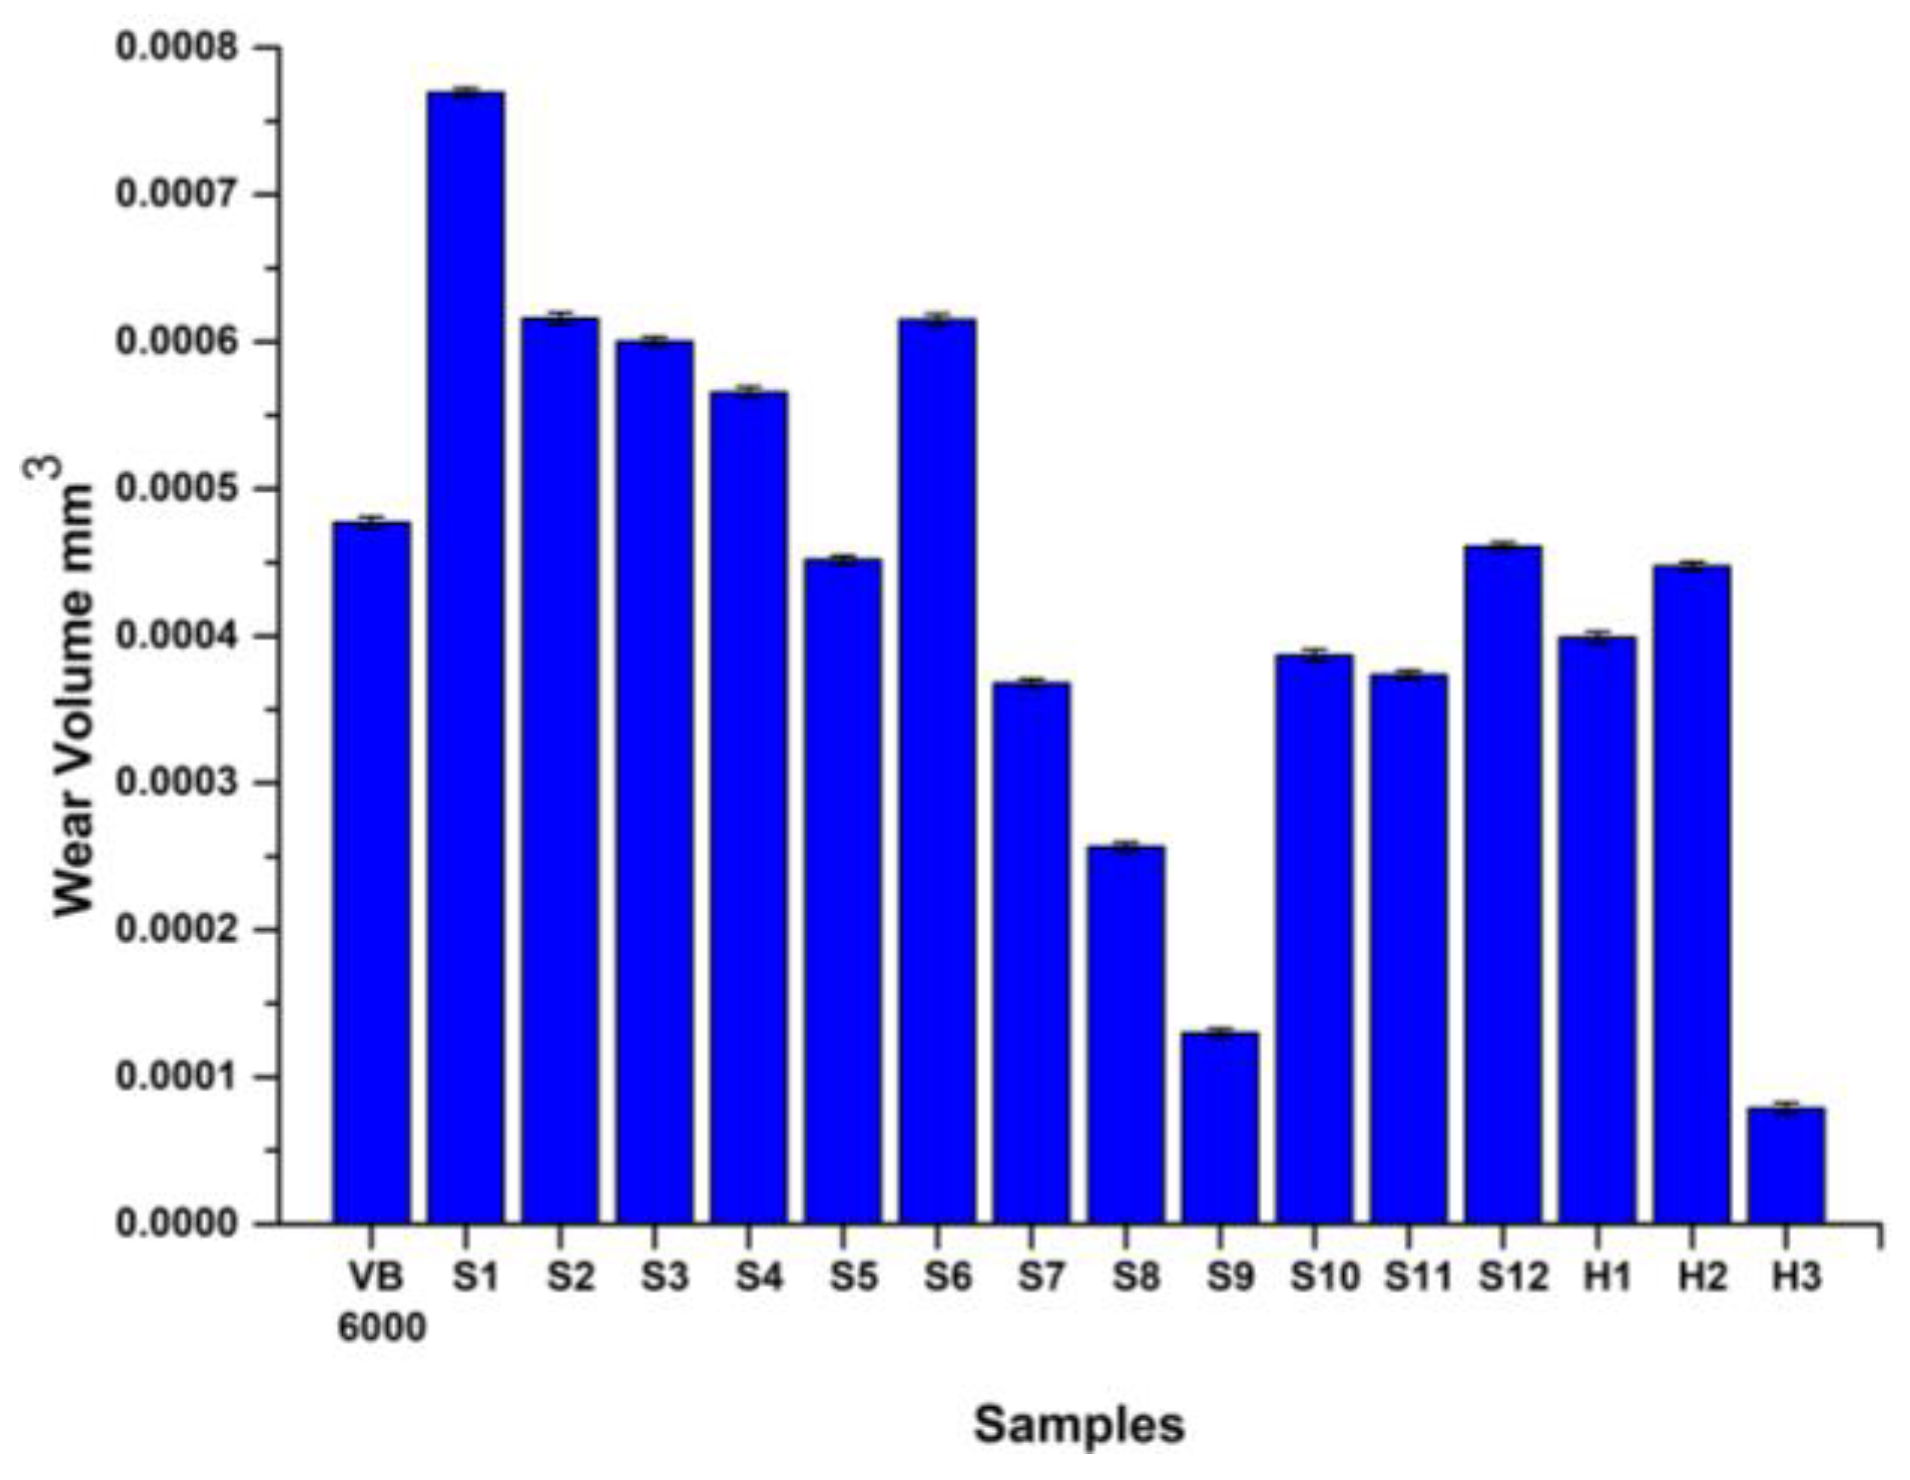
Table 1.
Properties of the proposed base oils.
| Item | Rapeseed Oil | Blaser Vasco 6000 |
|---|---|---|
| Viscosity at 40 °C | 32 mm2/s | 42 mm2/s |
| Viscosity at 100 °C | 7 mm2/s | 8 mm2/s |
| Structure | Fatty acid structure | Water-miscible, Ester oil base, boron, formaldehyde and chlorine-free |
| Flash Point °C | 218 | 129 |
Table 2.
Designation of each lubricant mixture.
| Sample Designation | Content |
|---|---|
| S1 | Pure rapeseed oil |
| S2 | Rapeseed oil + 0.5 wt.% Gr |
| S3 | Rapeseed oil + 1 wt.% Gr |
| S4 | Rapeseed oil + 2 wt.% Gr |
| S5 | Rapeseed oil + 4 wt.% Gr |
| S6 | Rapeseed oil + 1 wt.% Ionic liquid |
| S7 | Rapeseed oil + 2 wt.% Ionic liquid |
| S8 | Rapeseed oil + 5 wt.% Ionic liquid |
| S9 | Rapeseed oil + 0.05 wt.% ZnO |
| S10 | Rapeseed oil + 0.1 wt.% ZnO |
| S11 | Rapeseed oil + 0.25 wt.% ZnO |
| S12 | Rapeseed oil + 0.5 wt.% ZnO |
| H1 | Rapeseed oil + 1% IL + 4% Gr |
| H2 | Rapeseed oil + 0.1% ZnO + 4% Gr |
| H3 | Rapeseed oil + 1% IL + 0.1% ZnO + 4% Gr |
Disclaimer/Publisher’s Note: The statements, opinions and data contained in all publications are solely those of the individual author(s) and contributor(s) and not of MDPI and/or the editor(s). MDPI and/or the editor(s) disclaim responsibility for any injury to people or property resulting from any ideas, methods, instructions or products referred to in the content. |
© 2023 by the authors. Licensee MDPI, Basel, Switzerland. This article is an open access article distributed under the terms and conditions of the Creative Commons Attribution (CC BY) license (https://creativecommons.org/licenses/by/4.0/).
Share and Cite
MDPI and ACS Style
Nassef, B.G.; Pape, F.; Poll, G. Enhancing the Performance of Rapeseed Oil Lubricant for Machinery Component Applications through Hybrid Blends of Nanoadditives. Lubricants 2023, 11, 479. https://doi.org/10.3390/lubricants11110479
AMA Style
Nassef BG, Pape F, Poll G. Enhancing the Performance of Rapeseed Oil Lubricant for Machinery Component Applications through Hybrid Blends of Nanoadditives. Lubricants. 2023; 11(11):479. https://doi.org/10.3390/lubricants11110479
Chicago/Turabian StyleNassef, Belal G., Florian Pape, and Gerhard Poll. 2023. "Enhancing the Performance of Rapeseed Oil Lubricant for Machinery Component Applications through Hybrid Blends of Nanoadditives" Lubricants 11, no. 11: 479. https://doi.org/10.3390/lubricants11110479
Note that from the first issue of 2016, this journal uses article numbers instead of page numbers. See further details here.