Effect of Third-Particle Material and Contact Mode on Tribology Contact Characteristics at Interface


Department of Power Mechanical Engineering, National Formosa University, No. 64, Wenhua Rd., Huwei Township, Yunlin City 632, Taiwan
*
Author to whom correspondence should be addressed.
Lubricants 2023, 11(4), 184; https://doi.org/10.3390/lubricants11040184
Submission received: 24 March 2023
/
Revised: 13 April 2023
/
Accepted: 18 April 2023
/
Published: 20 April 2023
Abstract
:A moving pair with two-body contact is the ideal situation assumed in previous analyses. However, all moving pairs are in a three-body contact state at the start of operation or immediately after the start of operation, such as bearings, ball-screws, gears and engines. This work studies the influence of wear particles (SUJ2), environmental particles (SiO2 and Al2O3) and nano-additives (CuO) on the tribological contact characteristics under different particle concentrations, particle sizes, surface roughnesses and contact modes. The three-body microcontact analysis revealed that the differences in the real contact area, particle contact area and separation of the four-particle materials in the three-body s–s and p–s contact modes are rather small. Under the three-body hybrid contact mode, the difference is relatively large and the sequence of the real contact area value obtained due to the elastic modulus for the four-particle material at this interface is Al2O3 > SUJ2 > CuO > SiO2. The order of the other two contact characteristics is reversed. The difference increases as the particle size or particle concentration increases. The order of the critical load required to transform three kinds of contact modes is SiO2 > CuO > SUJ2 > Al2O3. On the nearly initial three-body hybrid contact mode, the plastic contact area ratio at the interface first increases to a critical value and then decreases as the load increases because the original plastic contact spot area and contact spot number increases with the increase in load. At the same time, the elasto-plastic contact area ratio decreases to a low value and then increases. The elastic contact area ratio at the interface decreases as the load increases. Among the four third-particle materials, the experimental results and theoretical predictions show that the environmental particles, Al2O3, cause the maximum friction and wear observed at the interface.
1. Introduction
The presence of third particles on the lubricating interface of mechanical parts is a normal phenomenon that will inevitably occur. The possible sources of third particles include environmental particles and wear debris from component operation or micro-nano particles in the lubricant. The two-body contact motion pair without the third particle occurs only at the start of operation. The concentration of the third particle will gradually increase with the increase in the part’s operation time. This will eventually result in a reduction in performance until the end of service life. Therefore, the third particle at the interface is an important indicator of the performance of the part. However, the difference in the influence of the material and concentration of the third particle on the interface tribology performance has not been discussed in detail to date.
The systematic research on the effect of the third particle comes from a series of papers published by Godet since 1984 [1,2,3]. Due to the complexity of the contact mechanics between the third particle and the two surfaces, the progress of the research on the mechanism of the three-body contact interface is not obvious. Major developments have focused on the predictive analysis of three-body wear [4,5]. In recent years, in the development of lubricants, it has been found that nanoparticles greatly affect the performance of lubricants. The importance of third particle research has attracted widespread attention [6,7]. Greenwood suggested that third particle research is one of the tribology topics that must be tackled in the future [7]. The experimental results of Peña-Parás et al. in 2018 [8] found that the interface has an excellent tribology performance when the particle-size-to-surface-roughness ratio (xa/σ) is below 0.75. The results of three-body contact analysis [9] obtained in 2022 showed better contact characteristics near the turning point of contact area (TCPA) at the interface. These two articles show that replacing the sliding motion of two surfaces by the rolling motion of particles is not the sole reason for nanoparticles’ effectiveness in lubricants [10,11,12]. In the same year, the three-body mixed lubrication analysis framework was established [13]. Theoretical analysis shows that the specific film thickness criterion for two-body mixed lubrication is not suitable for three-body mixed lubrication.
The real contact area at the interface of the moving component is the main factor influencing contact temperature and contact pressure at the interface. Increasing the real contact area at the interface can reduce the contact temperature and contact pressure. It can even enhance the interface’s ability to resist scuffing [14] and enhance the running-in performance [15]. A microcontact analysis of the two-body contact interface [16,17,18] shows that the main influencing factors are plasticity index and applied load [18]. The greater the applied load, the greater the contact area. The plasticity index includes two parameters: material properties and surface roughness topography. This is the main factor affecting the real contact area of the two surfaces. When there are three particles at the interface, the contact characteristics between the third particle and the surface roughness will be different due to the difference in the material properties of the particles. This also shows that the type of particle material is an important factor in the real contact area of the three-body contact interface.
The total area of contact between two rough surfaces is the sum of the discrete small areas of contact. These small contact areas may be elastically deformed, elastoplastically deformed, or plastically deformed. Wear mainly occurs at the contact spots of plastic deformation. The results of the two-body contact analysis showed that the area of plastic deformation is still small, even at extremely high loads [19,20,21,22]. This does not coincide with the general situation in which large loads produce large wear. This indicates that the transformation process of the area of different deformation types in two-body contact needs to be further clarified. In the case of three-body contact, the transformation process of the deformation type area must be different from that of two-body contact. The third particle will affect the interface wear and friction characteristics. This study will discuss the characteristics and evolution of different deformation types of different particle materials under three-body contact conditions.
In recent decades, the application of nanoparticles as lubricant additives has been a topic of active research. Nanoparticles have been shown to significantly improve the tribological properties of lubricating oils due to their antifriction and antiwear properties, and their ability to function under extreme pressure [23,24,25]. According to the literature, nanoparticles can serve as lubricant additives and have the potential to enhance the tribological properties of the base oil while being environmentally friendly [26,27,28]. The use of nano-particle lubricants can effectively reduce friction and wear. Singh et al. [29] conducted a study to investigate the effects that the addition of SiO2 nanoparticles to desert date oil had on tribological characteristics. Their findings revealed that the introduction of SiO2 nanoparticles led to an improvement in the interaction between the surfaces, resulting in reduced friction and surface wear upon contact. In 2023, Wang et al. [29] focused on the development and testing of environmentally friendly lubricants and additives to enhance manufacturing processes and tribological performance. They investigated the effects of nano-lubricants, cellulose nanocrystal, and MoDTC on friction and wear reductions, and suggest their potential for sustainable machining and manufacturing. A tribology experiment [30,31,32,33,34,35] found that the use of certain sizes and concentrations of CuO in lubricant leads to the best tribology properties. In relation to these specific environmental controls, the air in factories is full of dust. The main components of dust are silicon dioxide (SiO2) and aluminum oxide (Al2O3). Nabhan et al., in 2021, [36] conducted a study that found that Al2O3 nanoparticles can effectively improve the wear resistance and load-carrying capacity of lithium grease. H. Chen et al. [37] reported that Al2O3 nanoparticles can effectively improve the wear resistance and load-carrying capacity of lithium grease. Furthermore, WC and Al2O3 were found to enhance the wear resistance and friction performance of ZrB2-20% vol SiC composite material at high temperatures. If the transmission element is made of bearing steel (SUJ2), the interface during operation will produce wear debris formed by the bearing steel material. The transmission components generally operate under medium- and high-load conditions. In order to study the influence of different material particles on the interface contact properties, this work will analyze the microcontact characteristics of bearing steel components when there are four kinds of material particles (SiO2, SUJ2, Al2O3 and CuO) at the interface.
2. Theoretical Analysis
Four contact modes at the contact interfaces with the addition of a third particle are shown in Figure 1. When two surfaces are rough, their contact can be simplified as an equivalent contact between a rough surface and a smooth surface, known as two-body s–s mode [38,39], as shown in Figure 1a. The presence of third particles on the contact interface results in three distinct contact modes, depending on the relative size of the third particle diameter and the separation distance between the two surfaces. The first mode is called three-body surface-to-particle contact (p–s mode), where the third particle completely separates the two surfaces when its diameter is much larger than the separation distance. The contact load is supported by the contact spots between the third particle and the surface, as illustrated in Figure 1b. The second mode is known as three-body surface-to-surface contact (s–s mode), where all particles sink into the groove when their diameter is much smaller than the separation distance. In this instance, the contact load is sustained by the contact spots between the two surfaces, as depicted in Figure 1c. The third mode is a three-body hybrid contact (hy. mode), where the difference between the third particle diameter and the surface separation distance is small. In this case, the contact load is jointly borne by the contact points between the third particle and the two surfaces, as shown in Figure 1d.
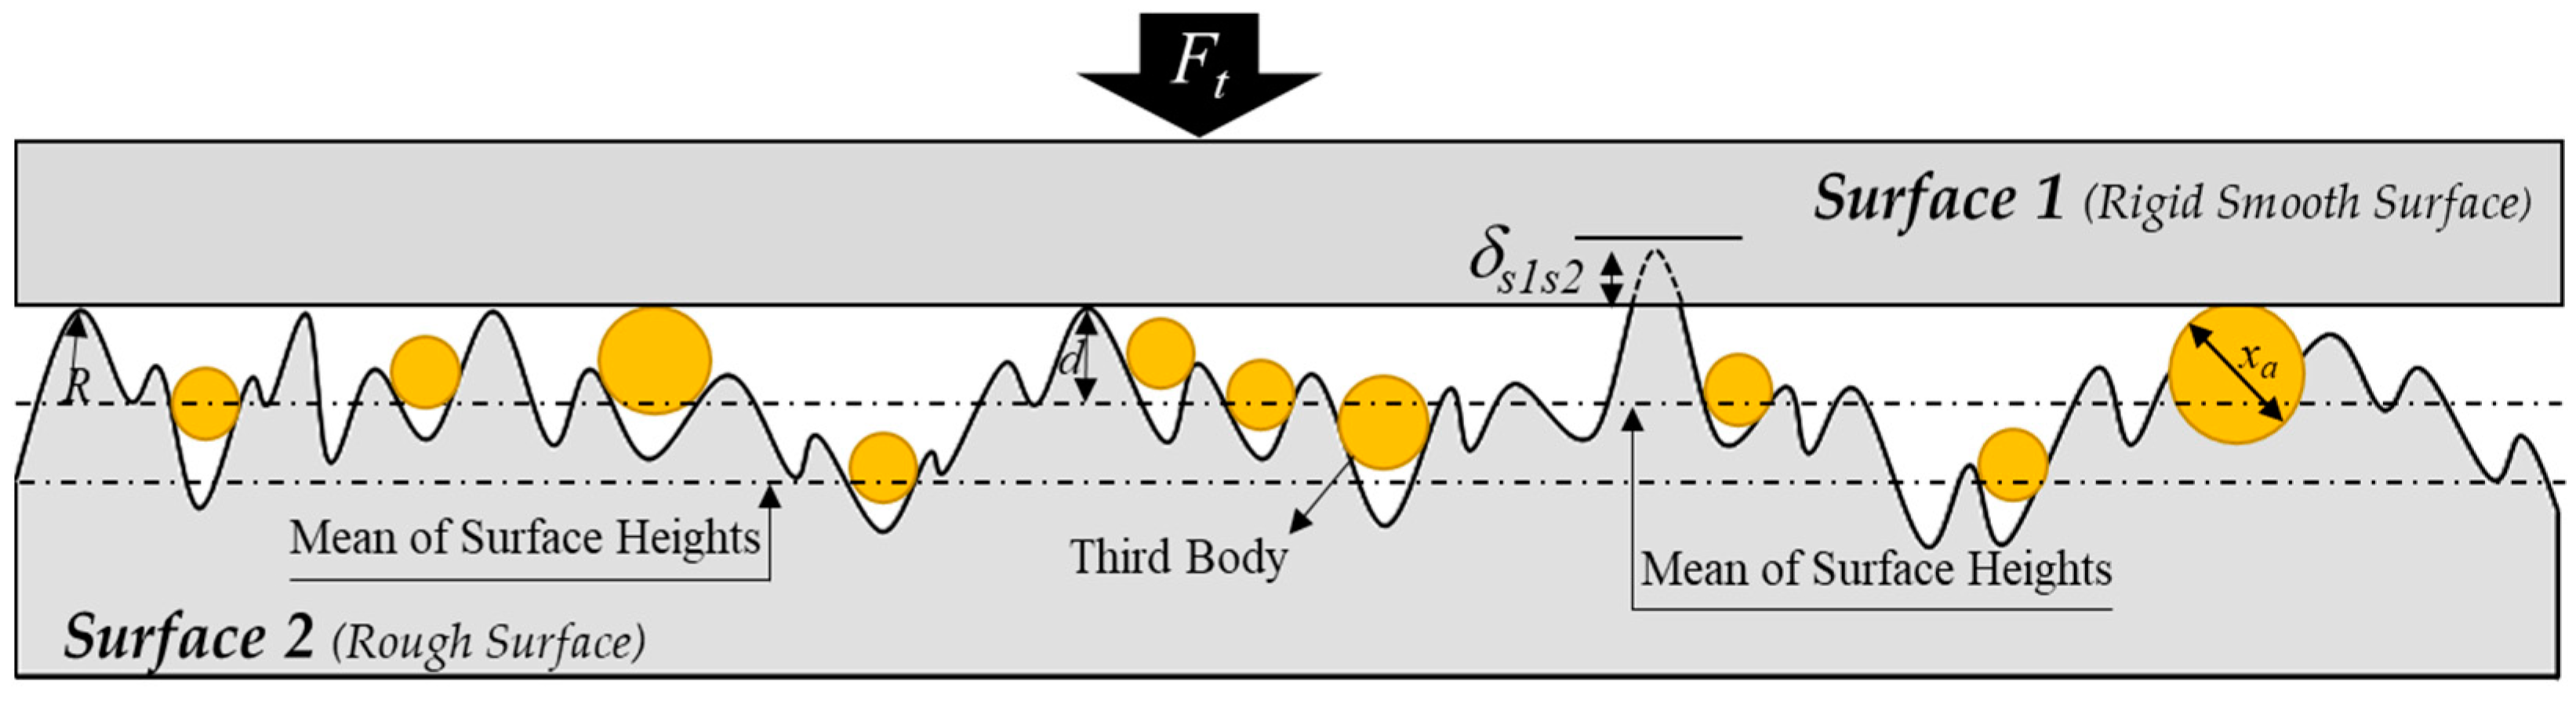
Figure 2 shows a schematic of a three-body contact situation. The assumptions made in this study are as follows [40]:
- All surface asperities and third particles are far apart and there is no interaction between them.
- The surface asperities and third particles deform during contact with no bulk deformation of the two surfaces.
- The slopes of the surface asperities are considered to be negligible in the contact model.
When the contact between the peaks in surface 1 and surface 2 occurs in practical situations, the deformation of the contact will be influenced by the characteristics of surface 2, such as the height and hardness of its peak, leading to elastic deformation, elastoplastic deformation, or plastic deformation. Therefore, the actual number of contact peaks between two surfaces can be expressed as follows:
where, N = ηAn represents the total number of peaks in the contact area between two surfaces, Zmax represents the maximum distance from the reference plane of the lower surface to the summit of asperity and d represents the separation between surface 1 and mean height of asperities. The height variation in surface 2 peak is represented by a distribution function ϕ(z), where η represents the peak density per unit area (asperity density) and An represents the nominal contact area. The actual contact area between two surfaces is the sum of elastic deformation, elastoplastic deformation, and plastic deformation. According to the Zhao, Maietta and Chang proposed two-body contact formula (ZMC model) [20], where Ass is the real contact area of two surfaces, this can be written as follows:
where, Ass,e represents the area of elastic deformation in the real contact area between two surfaces, Ass,ep represents the area of elastoplastic deformation in the contact area between surface 2 peak and surface 1, Ass,p represents the area of plastic contact between surface 2 peak and surface 1, R represents the radius curvature of surface peak, δss represents the interference amount between two surfaces, δss,1 represents the initial yield interference amount of elastic deformation between two surfaces, and δss,2 represents the critical yield interference amount required for the complete plastic deformation between two surfaces. Where Ess represents the composite Young’s modulus between two surfaces, this can be expressed as follows:
where, Es1 is the Young’s modulus of surface 1, νs1 is the Poisson’s ratio of surface 1, Es2 is the Young’s modulus of surface 2, and νs2 is the Poisson’s ratio of surface 2. Where Fss contact load of two surfaces, the contact load can be expressed as follows:
The two surfaces and a particle that results in plastic contact, and the total contact area Asa, and contact load Fsa can be written as follows [33]:
In this study, both ϕa (x) and ϕ (z) are assumed to follow the Gaussian distributions, where, xmax, Esa, Hs1, Hs2, ηa and xa represent the maximum particle diameter, the equivalent elastic modulus of the third particle and surface, surface 1 hardness, surface 2 hardness, the number of third particles per unit area, and the mean size of the third particle, respectively. To obtain the real contact area between the two surfaces, the contact area of particles deposited on the surface peaks must be subtracted, as shown in Figure 2. The contact area of two surface, Ass-sa, can be expressed as follows:
The total actual contact area of the two-body microcontact model is denoted by Ass. The total contact area At and the total contact load Ft can be obtained from Equations (6) and (7) for the three-body system. Therefore, the three-body microcontact model is formulated.
If there are no particles present between the two surfaces (xa = 0), then Equations (9) and (10) reduce to the results of another surface-to-surface contact model for two bodies.
The dimensionless contact load and dimensionless real contact area can be obtained by dividing Equations (9) and (10) by AnEss and An, respectively. To obtain the dimensionless contact area ratios (Ap,t*, Aep,t*, Ae,t*, Ass,t*, and Asa,t*), the individual components of At, which include Ap, Aep, Ae, Ass, and Asa, were divided by At.
3. Experiment
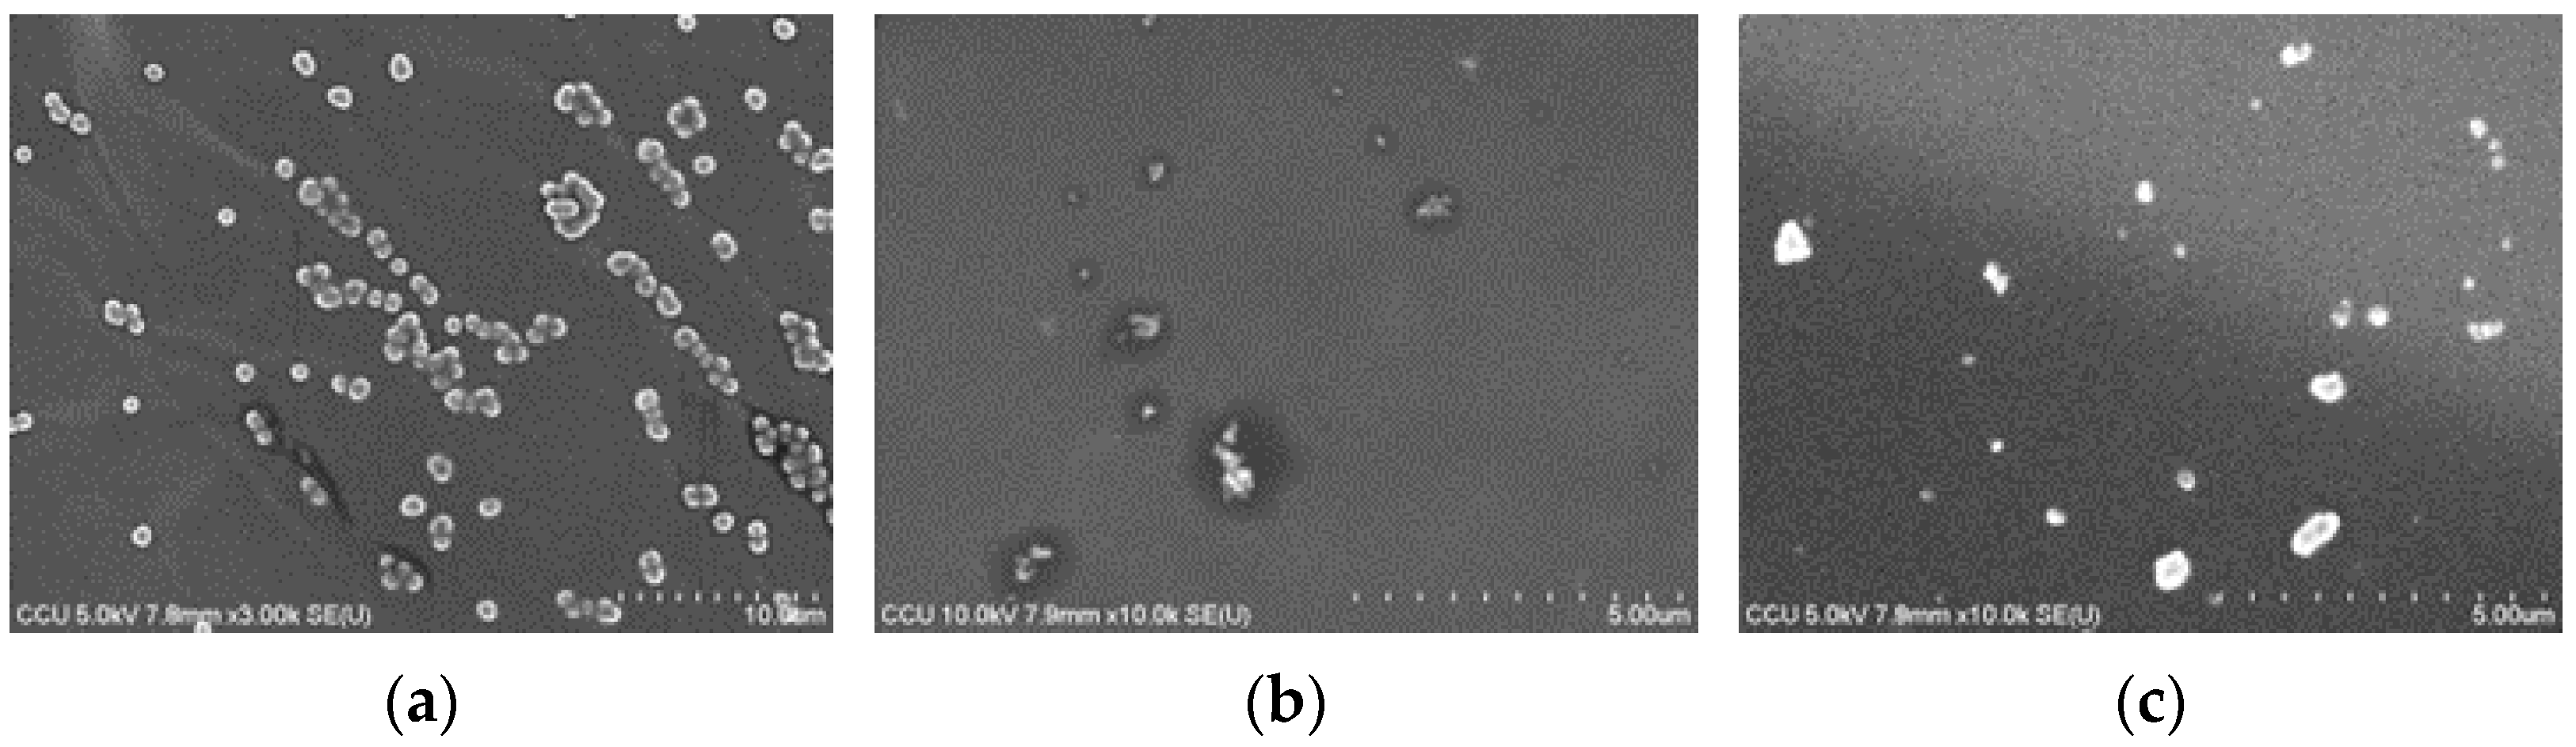
A four-ball tribology test was used to verify the results of the theoretical analysis in this study, as shown in Figure 3. The material of the test ball is SUJ2, the radius is 12.7 mm, and the root mean square (RMS) value of surface roughness is 0.04 μm. Its chemical composition is shown in Table 1. According to the ASTM-D 4172, the test was conducted with a load of 396 N (3.44 GPa), speed of 1200 rpm, oil temperature of 75 °C and test time of 60 min. This research is a physics-based study of contact characteristics. In order to reduce the chemical interaction between the lubricant and the test ball, the oil used in this experiment was a commercial lubricating oil with mineral base oil and the addition of a small amount of antioxidant and defoamer [43]. The properties of the test lubricant are shown in Table 2. Four kinds of particle materials with a weight concentration of 1.0 wt% were added to the test lubricant, as shown in Figure 4. According to three-body lubrication analysis [13], the particle materials at the interface were all found in the boundary lubrication regime. The experimental data shown in the figures are the average values of these three times.
4. Results and Discussion
In this study, the component of the two relatively moving surfaces was SUJ2 (bearing steel). In order to compare the difference between additive particles, foreign particles and wear debris, the third particles in this paper contained CuO (nano-additive), SiO2, Al2O3 (foreign particles) and SUJ2 (wear debris). SiO2 and Al2O3 particles were used as third particles because dust in the environment contains about 80.78% of SiO2 and 10.52% of Al2O3 [44]. The reason for selecting a particle material with the same material properties as the surface material (SUJ2) in this study is to consider the wear debris generated during operation as another scenario for the influence of third particles. The effects of work hardening are not taken into account in the selection of the particle material [45,46]. Table 3 provides the material characteristics of surface 1, surface 2, and the third particle, while Table 4 outlines the input parameters in the three-body contact model, where σ represents the equivalent surface RMS roughness.
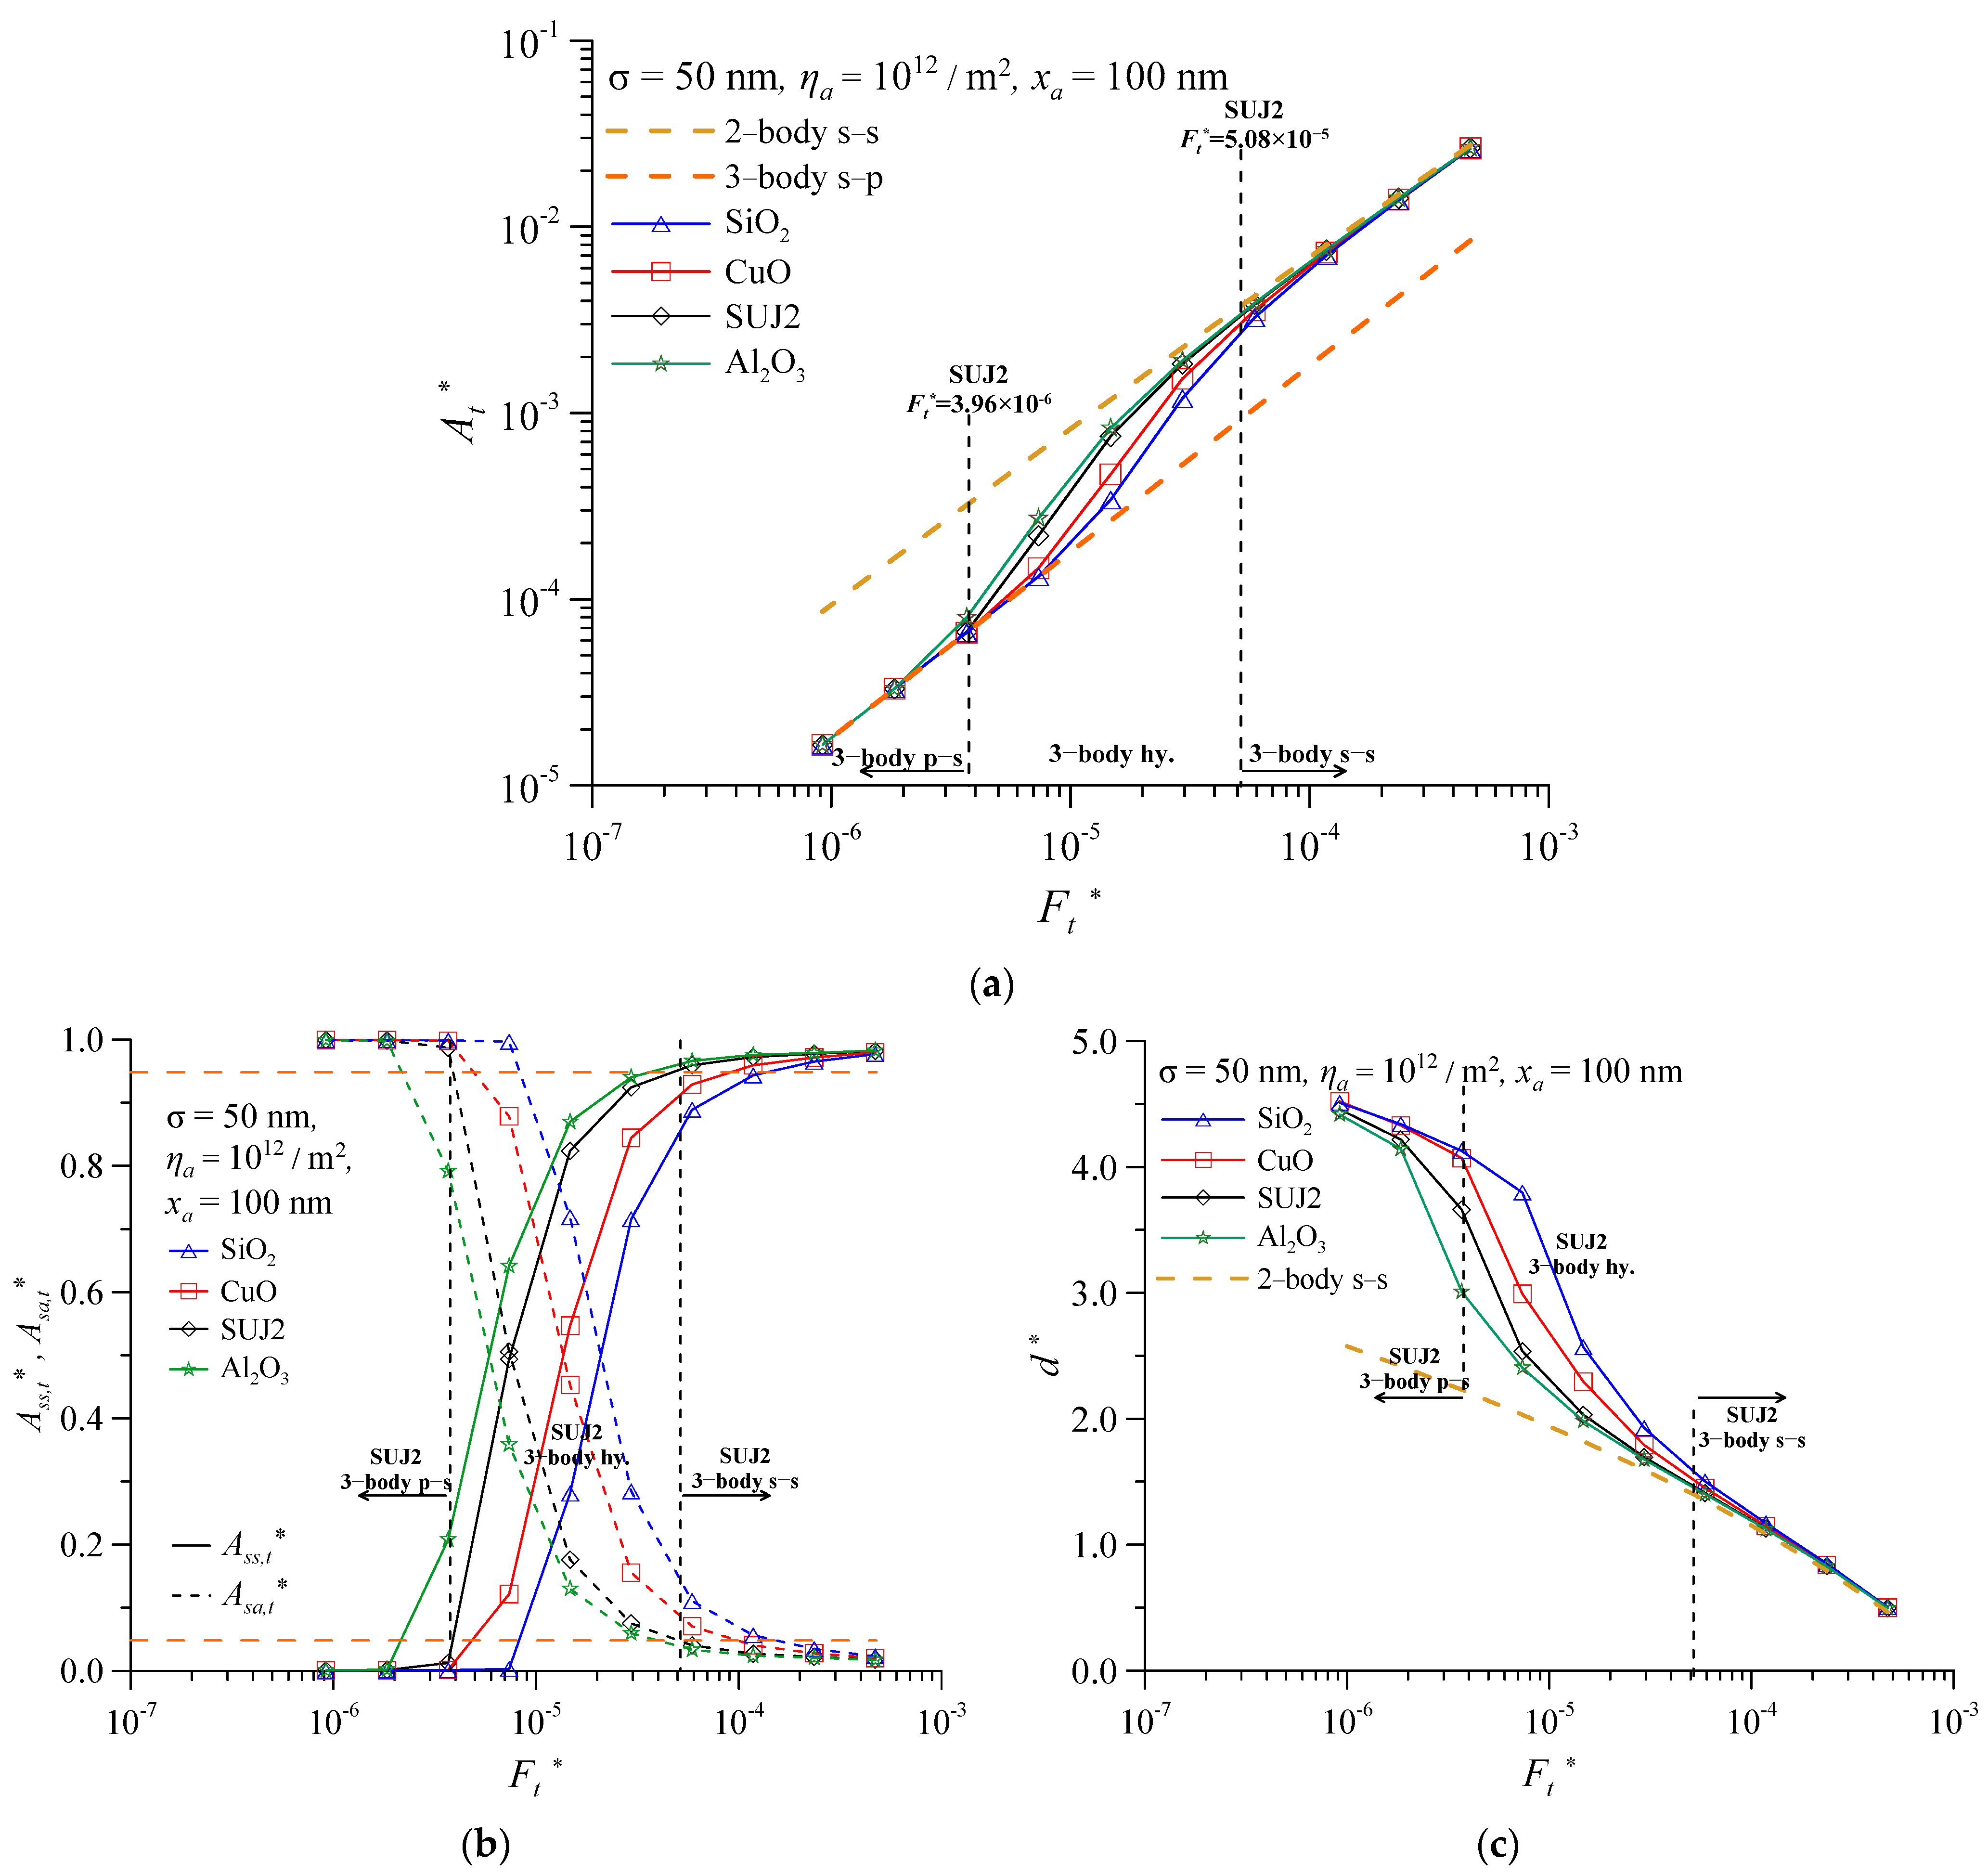
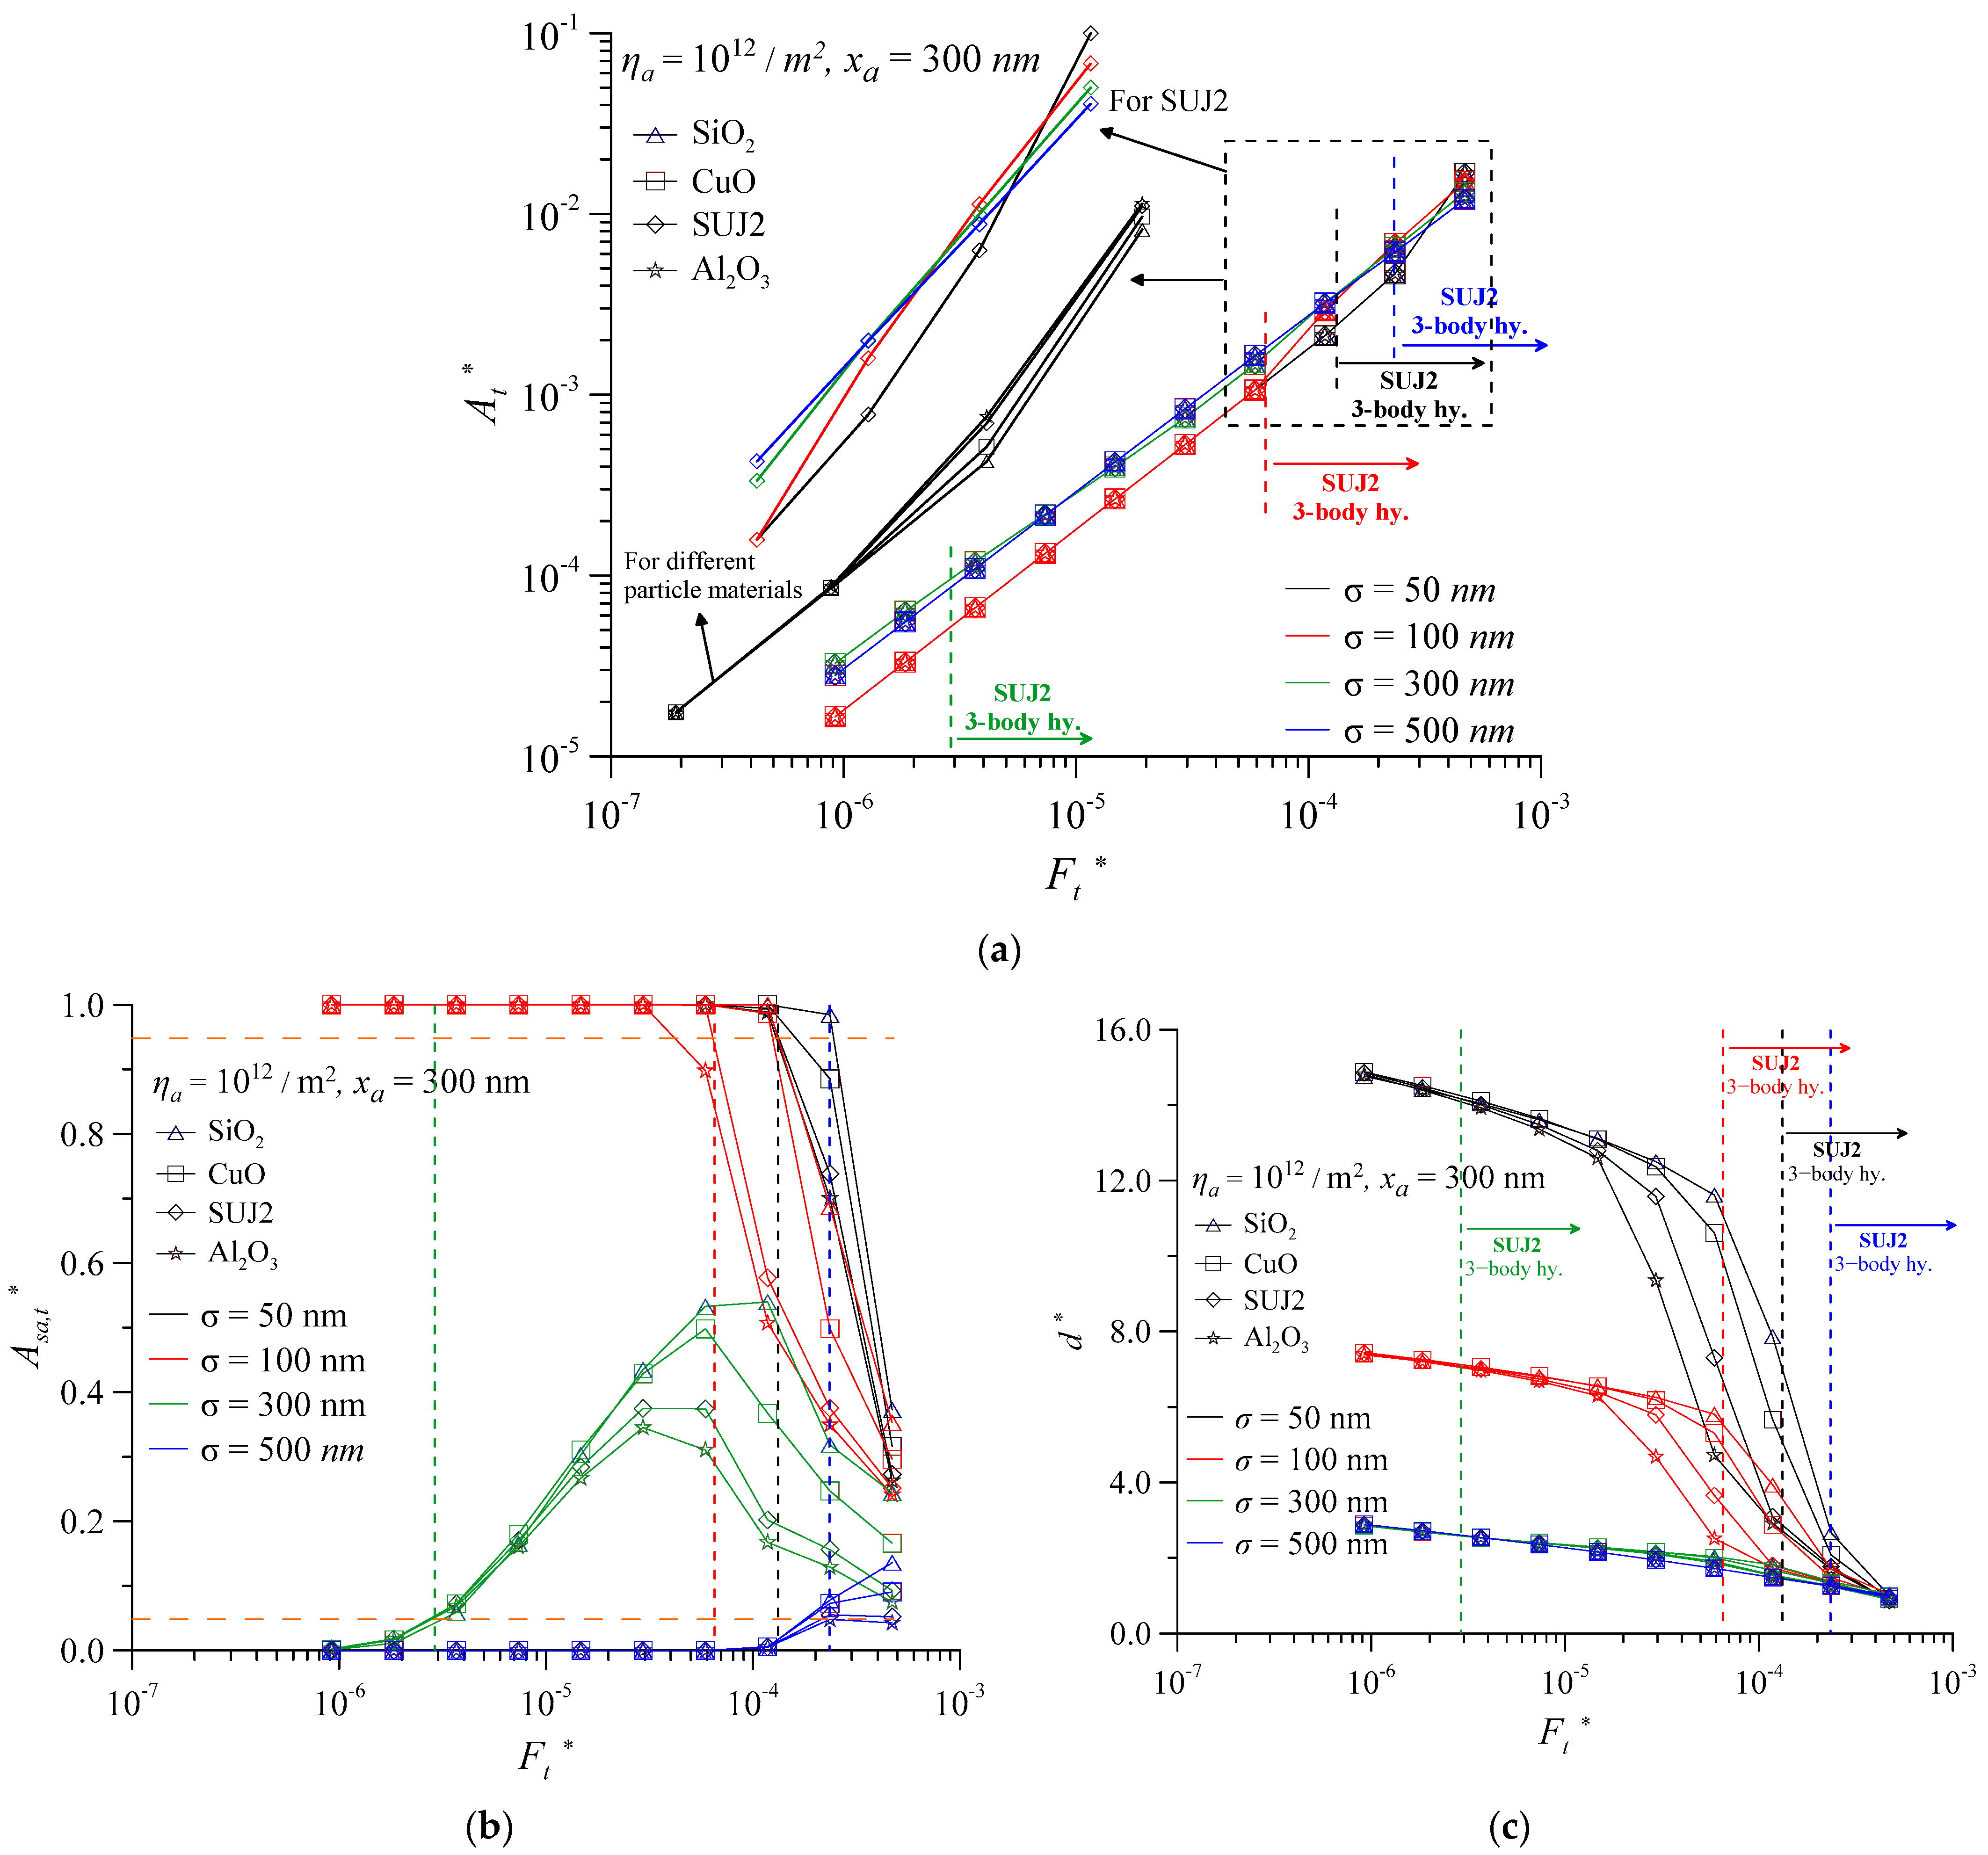
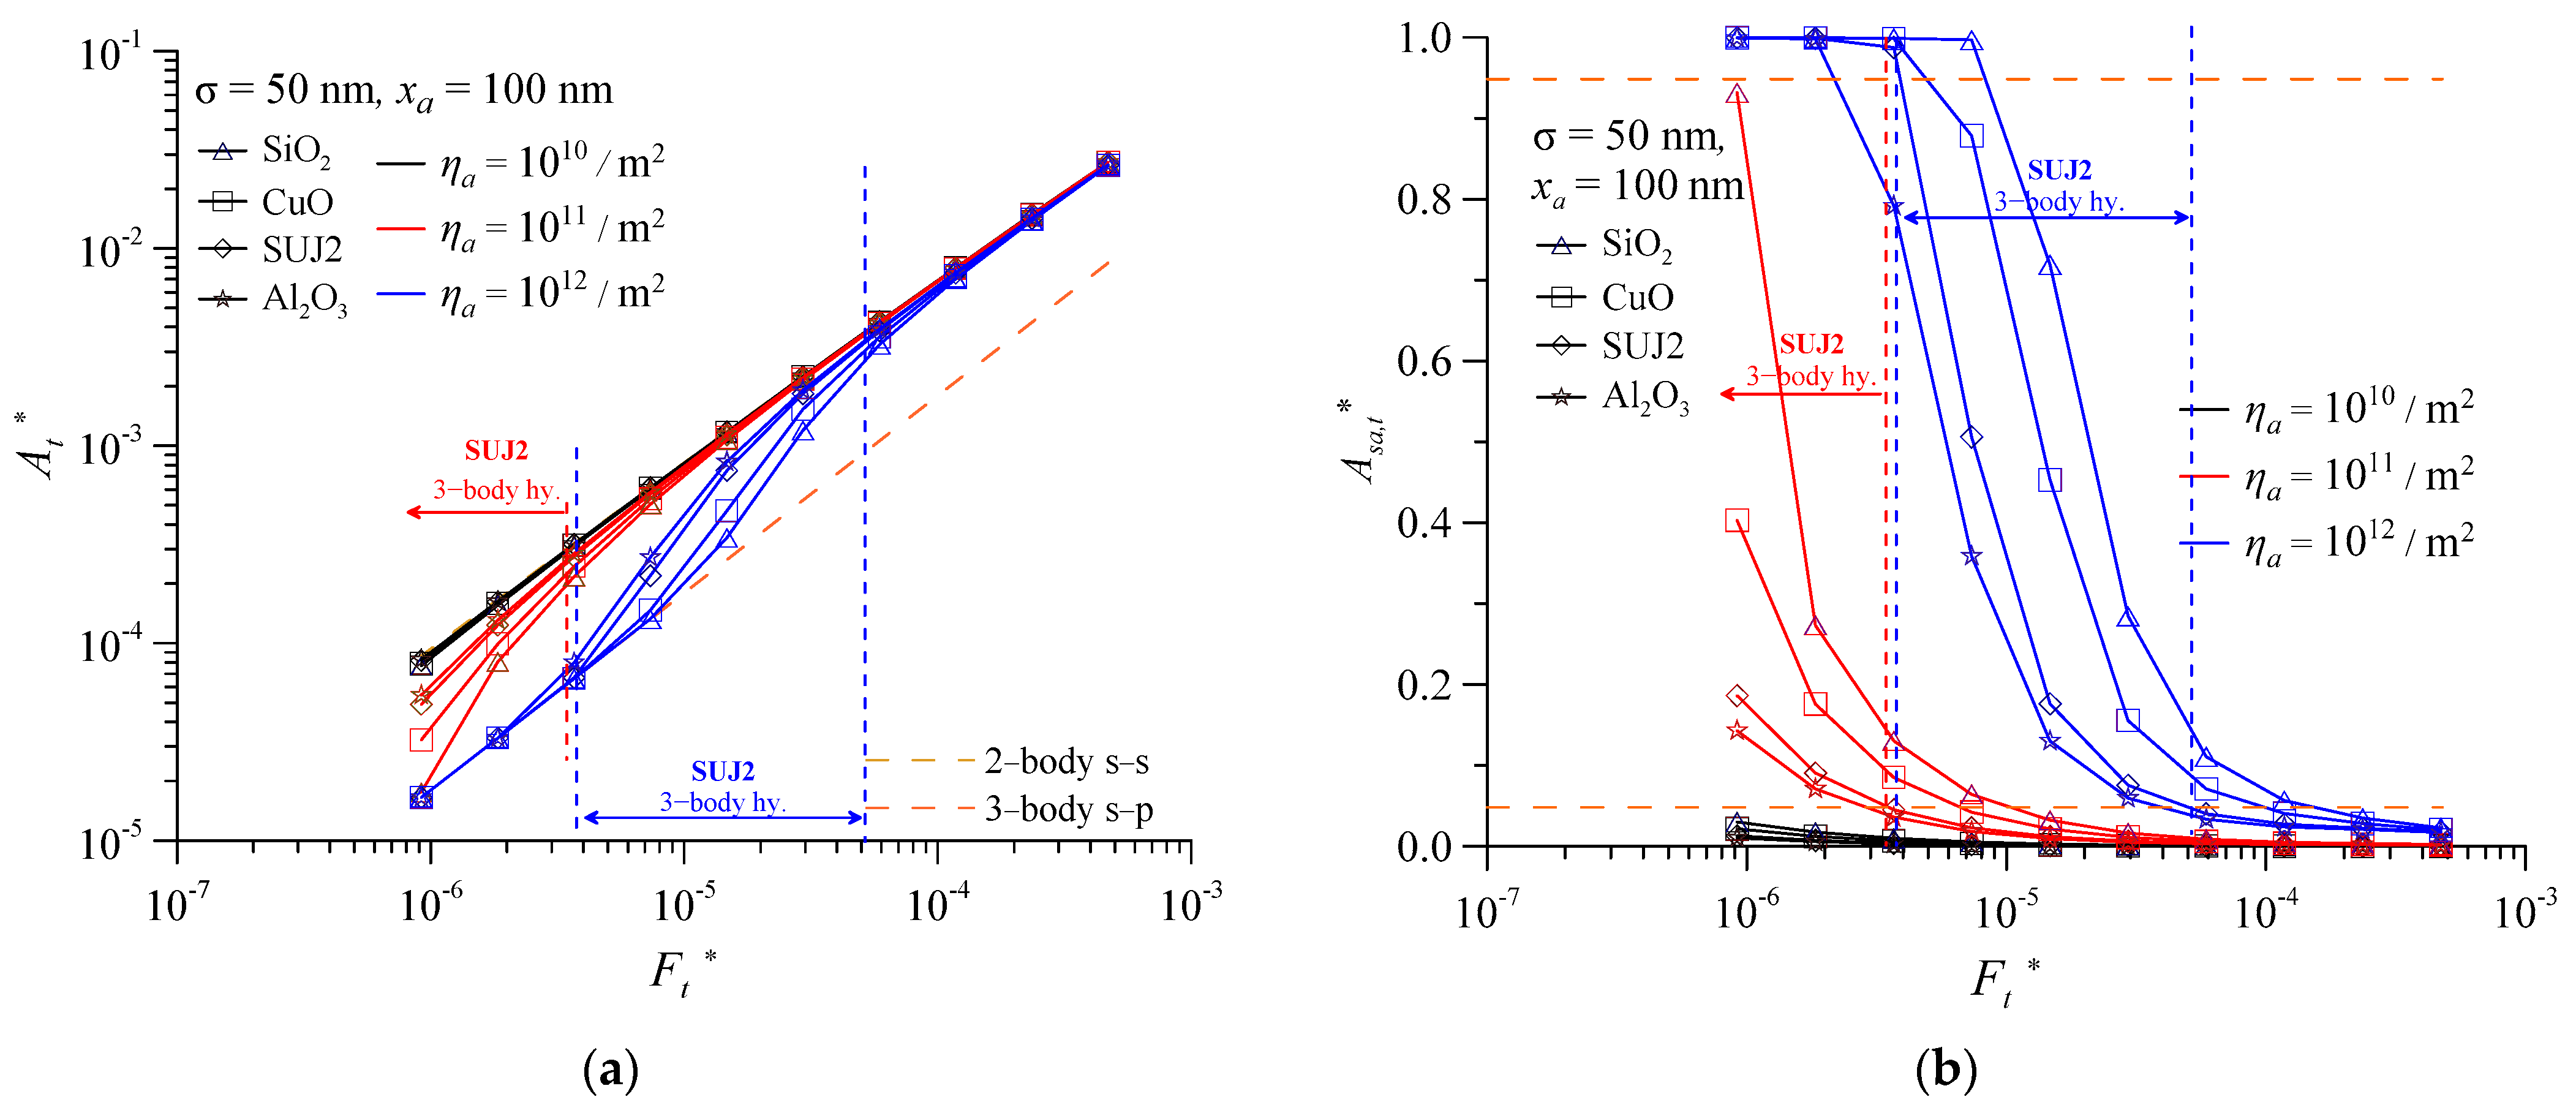
Figure 5 illustrates the difference in real contact area between two-body contact and three-body contact, as well as the difference caused by different third-particle materials. The dimensionless real contact area was plotted against dimensionless contact load (Ft*) for various third particles, with σ = 50 nm, ηa = 1012/m2 and xa = 100 nm, as shown in Figure 5a. The yellow dashed line represents the At* at the different Ft* for traditional two-body contact (xa = 0 nm). This curve is calculated using the ZMC two-body contact model. The orange dashed line represents the At* when the particle size is relatively large and the surface is completely supported by particles (p–s mode). This shows that the real contact areal calculated by the traditional two-body s–s contact assumption is overestimated. Both curves linearly increase with the increasing Ft* and form an upper and lower limit for all three-body contact situations. In this paper, we defined that when Asa,t* > 95%, the contact interface is in p–s mode; when Asa,t* < 5%, the contact interface is in s–s mode; and when 5% < Asa,t* < 95%, the contact interface is in hy. mode, as shown in Figure 5b. Under the same σ, the At* varies with the load and the four third-particle materials, as shown in Figure 5a. For example, with third-particle material SUJ2, as the Ft* becomes lower than 3.96 × 10⁻⁶, the curve overlaps with the curve of p–s mode in the first stage. This indicates that the contact pressure between the support surfaces is mainly borne by the third particles at this load. In the second stage, 5.08 × 10⁻⁵ > Ft* > 3.96 × 10⁻⁶, the At* increases rapidly and the 5% < Asa,t* < 95%. This indicates that the contact interface has entered the hy. mode. In this contact mode, the size order of Asa,t* under fixed load is SiO2 > CuO > SUJ2 > Al2O3. In the third stage, Ft* > 5.07×10⁻⁵, the At* almost overlaps with the s–s mode situation. The particle area ratio Asa,t* is less than the 5% presented, as shown in Figure 5b.
Comparing Figure 5a with Figure 5b for four-material particles showed that the interface with SiO2 particles needs a larger contact load to enter hy. mode compared to other third-particle materials. The sequence of critical contact load is SiO2 > CuO > SUJ2 > Al2O3. Figure 5c shows the variation in dimensionless separation (d* = d/σ) and Ft* for all kinds of particles. The yellow dashed line represents the linear relationship between d* and Ft* for the traditional two-body contact mode. For four materials, the relationship between d* and Ft* is almost the same under s–s mode. The deviation of the effect of particle material on d* is obvious from near p–s to hy. mode. At the same Ft*, the sequence of d* is SiO2 > CuO > SUJ2 > Al2O3. The separation was obtained from Equation (6). The separation value, d, is influenced by the hardness, Young’s modulus, and Poisson ratio of three body. Among the four-particle materials, SiO2 show the largest (Hs12/Esa2 + Hs12/Ess2) and the smallest values of he. Therefore, d is the largest compared to other particles.
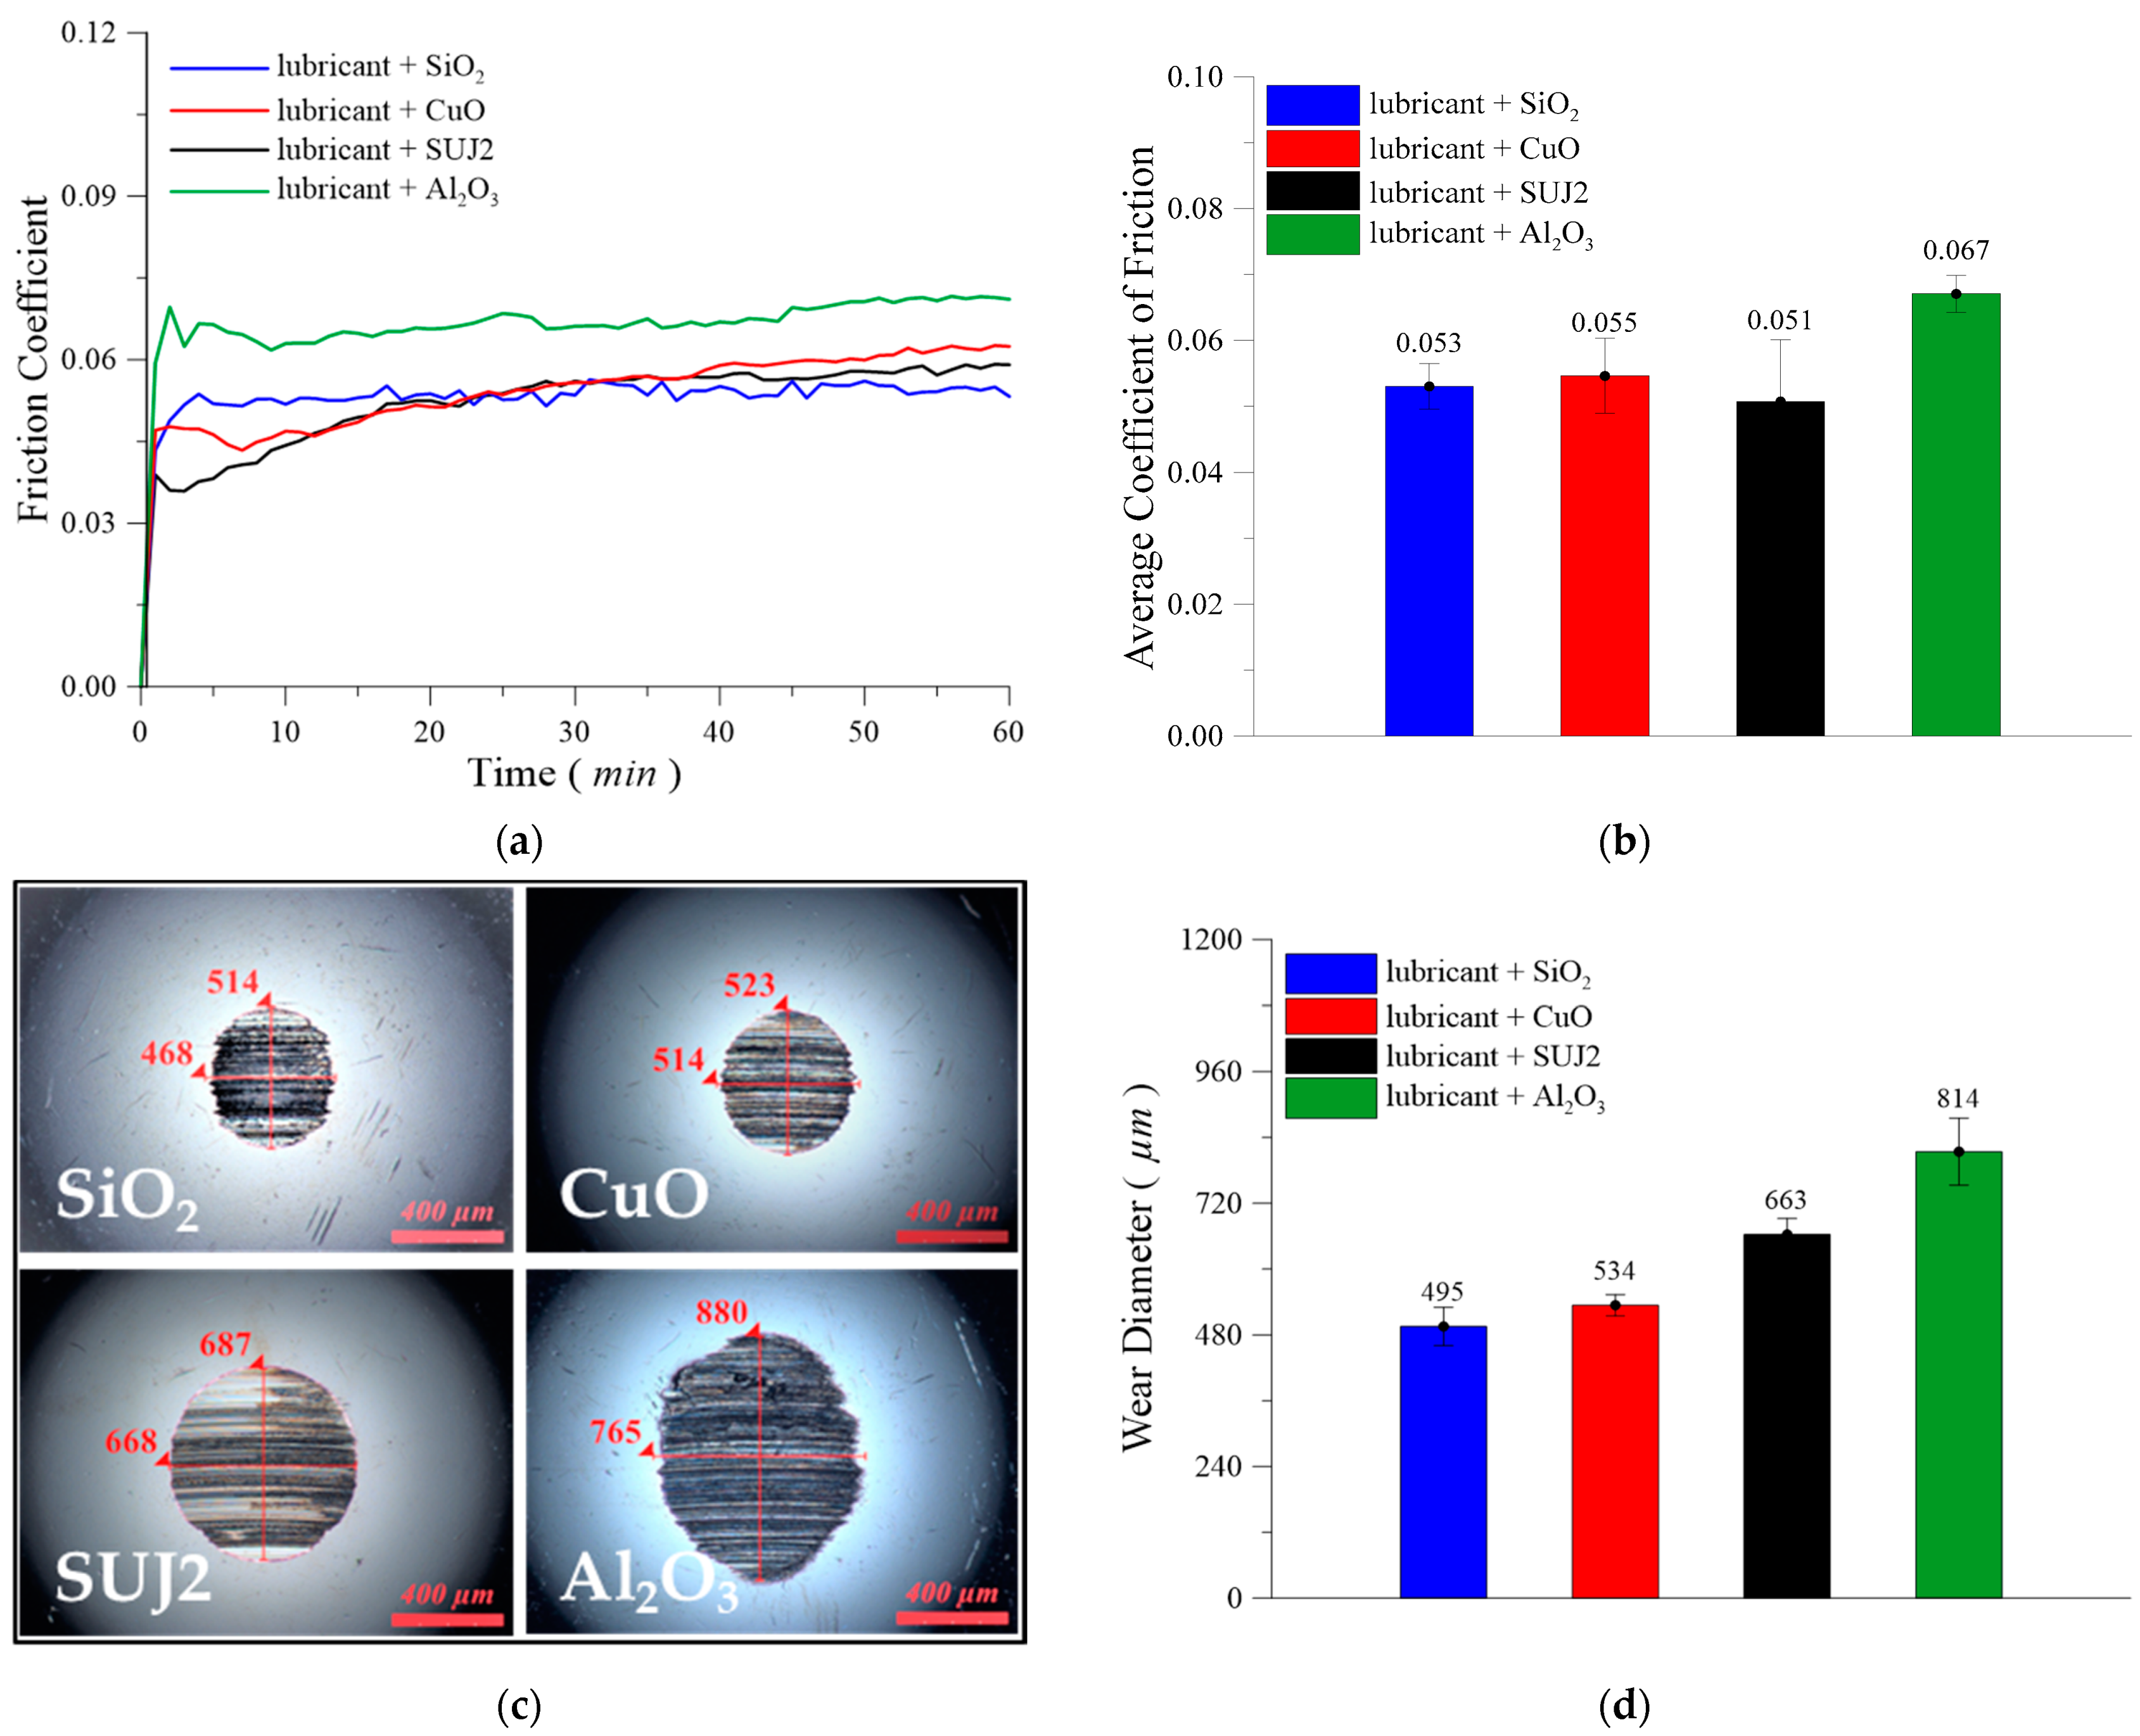
To verify the results of Figure 5, four-ball tests were conducted for the different particle materials, as shown in Figure 6a,b. In the past, there have been many studies on the relationship between real contact area and friction force. A theoretical analysis in 2010 [18], focusing on microcontact mechanics, showed that real contact area is positively correlated with friction force. Experimental results in 2021 [51] indicated linearity between real contact area and friction force. To verify the results of Figure 5, four-ball tests were conducted for the different particle materials. Figure 6a,b show the variation in friction coefficient and average coefficient during the test process with four kinds of particle materials. Comparing Figure 5a and Figure 6b show that the friction coefficient and real contact area have a positive relationship for the three particle materials of Al2O3, CuO and SiO2. However, the interface with SUJ2 particles has a lower friction coefficient than that of the interface with CuO particles. A possible reason for this is that the other three material particles are different from the workpiece material, so their friction order is consistent with the real contact area ratio. The SUJ2 particle is the same as the workpiece material, so that different bonding patterns are produced at the interface. The interface with Al2O3 particles has a much larger average friction coefficient than the other third-particle interfaces. The reason for this is the relatively high hardness, which means that the plowing friction is relatively large. Figure 6c shows that the main wear pattern of the four wear scars is a three-body abrasive wear. From Figure 6b, the size order of Asa,t* under fixed load is SiO2 > CuO > SUJ2 > Al2O3. Therefore, the size order of real contact pressure between surface and particles under fixed load is Al2O3 > SUJ2 > CuO > SiO2. According to the wear theory, the greater the contact pressure, the greater the wear volume. We find that the wear diameter in Figure 6d and real contact pressure between surface and particles in Figure 6b have a positive relationship for four-particle materials. These experimental results are in good agreement with the theoretical analysis.
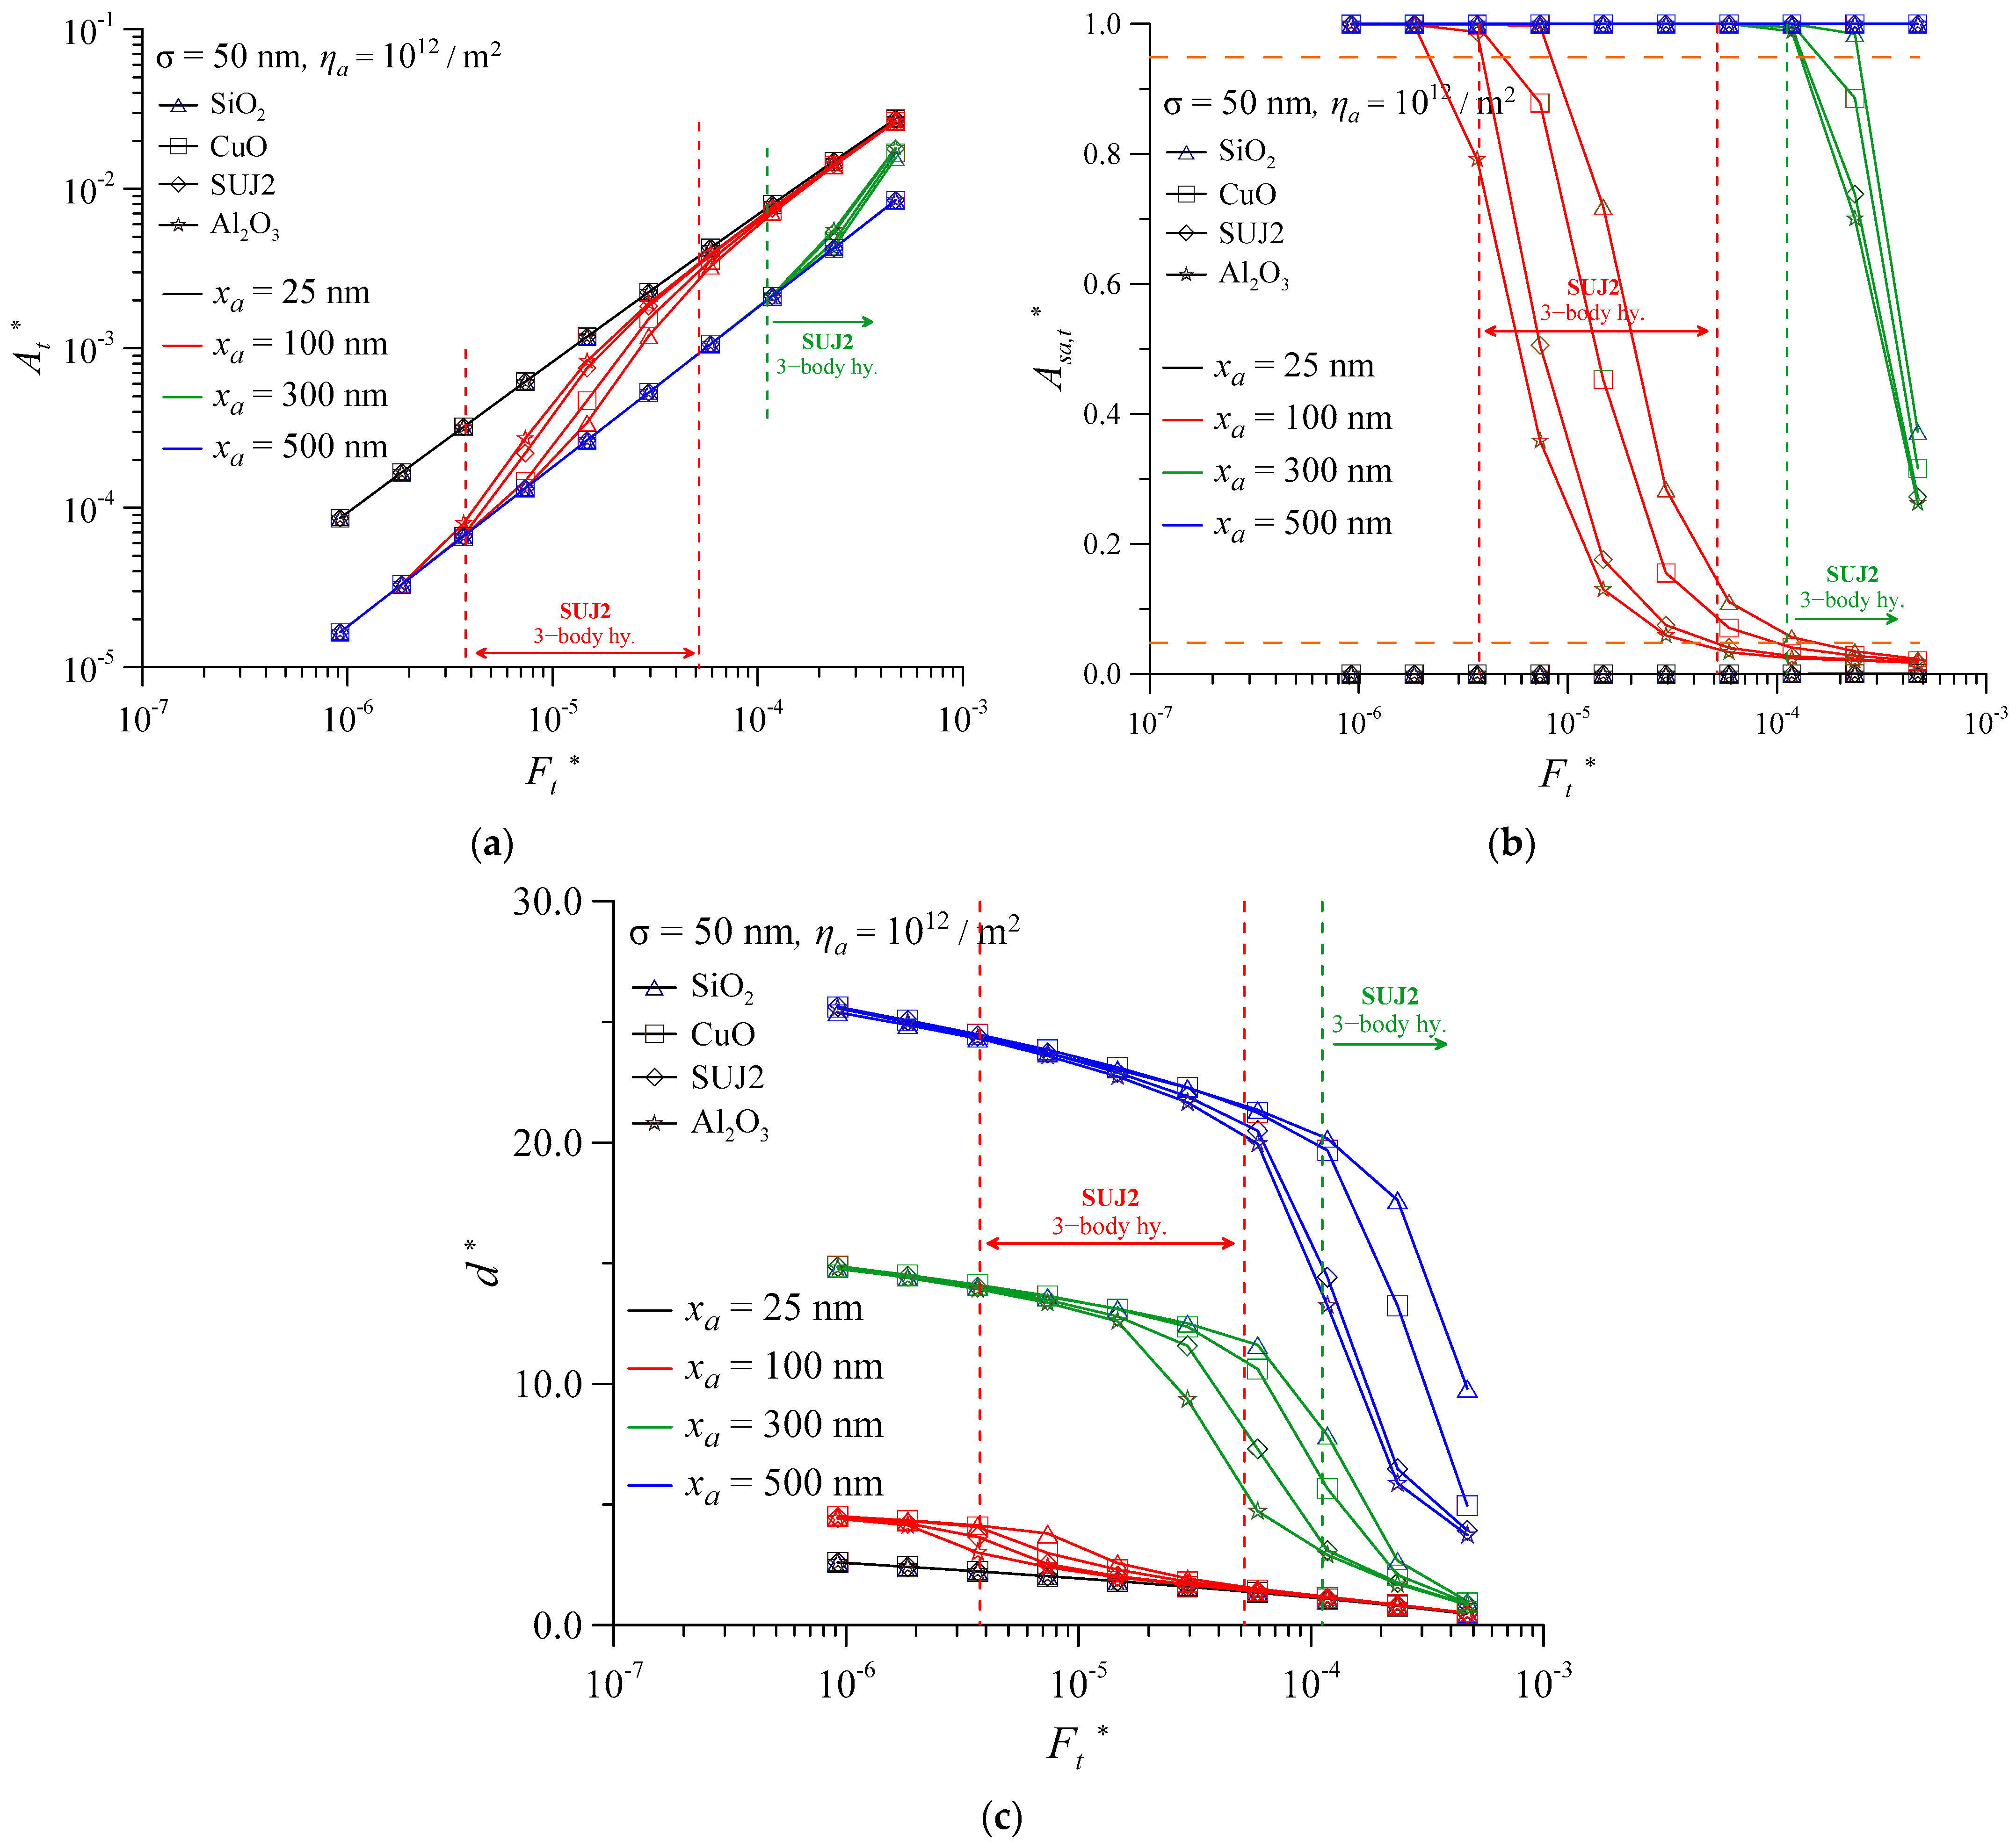
Figure 7 shows the influence of different surface roughnesses and third-particle materials on tribological behavior of contact interfaces. In Figure 7a, using SUJ2 as an example, for σ = 300 nm (green line) and σ = 500 nm (blue line), the dimensionless real contact areas for all four different third-particle materials completely overlap, and linearly increase with increases in Ft*. Comparing Figure 7a and Figure 7b show that these situations are in the s–s mode. This means that third particles sink into valleys in the surface roughness. The third particles have almost no effect on the change in real contact area. The At* for σ = 300 nm was 11.35% higher than for σ = 500 nm under all load conditions. When σ = 100 nm (red line), the Ft* range for entering the hy. mode is much larger than that of when σ = 50 nm (black line) and is true for all third-particle materials. The At* is close to overlapping the four-particle materials, which are in s–s mode for which Asa,t* < 5%, as seen in Figure 7b. In addition, the At* for three different surface roughnesses (σ = 100 nm, σ = 300 nm and σ = 500 nm) decreases with the increase in σ. When the interface with σ = 50 nm is under a high load, the interface enters the s–s mode. This kind of s–s mode situation for all materials shows that the larger the surface roughness, the smaller the real contact area. This conclusion is the same for an ideal two-body contact situation. However, the interface with σ = 50 nm under a low load is in the p–s contact mode for which Asa,t* > 95%, as seen in Figure 7b. The At* is lower than that of the other roughness surfaces. The real contact area of an interface with σ = 50 nm in the hy. mode does not show a uniform trend with surfaces with different roughness values. The findings emphasize that decreasing the value of equivalent surface roughness σ or increasing the xa can have a significant impact on the At*, which may lead to unstable operation of the components and surface damage.
Figure 8 is presented to further investigate the variations in contact modes with increasing surface roughness and third-particle diameter. Figure 7 and Figure 8 have the same parameters and conditions, except for the increase in the σ value of surface roughness from 100 nm to 300 nm. Due to the increase in particle size, Figure 8a,b show that the value of composed surface roughness at the interface between 50 nm (black line) and 100 nm (red line) is mostly in p–s mode. They enter the hy. mode under extremely high loads. The size order of the real contact area caused by the different materials used in this area is the same as that in Figure 7a: Al2O3 > SUJ2 > CuO > SiO2. Interfaces with σ value of 500 nm are mostly found in the s–s mode, as seen in Figure 7a. This indicates that the third particles sink into the valley of surface roughness. When the load is high, it enters the hy. mode. However, the interface between the surface roughnesses of 50 nm and 100 nm enters from the p–s mode to the hy. mode. As a result, the real contact area of the two contact modes differs greatly at low loads. However, the gap narrows at a high load and the order of the real contact area caused by different materials is different, as shown in the enlarged picture of SUJ2 material.
Figure 8c shows that the d* value decreases as the σ and Ft* increase under the same Ft*. The interface between 50 nm and 100 nm at the initial p–s mode of the low load overlaps for four materials, and then the difference becomes larger as the load increases. The larger the xa/σ value of the interface, the larger the initial separation. However, at the s–s mode interface with a σ of 500 nm, the separations of the four materials are almost the same. When the surface roughness and particle size are almost equal, xa ≅ σ, Asa,t* and d* first increase and then decrease with the increase in load, as shown in Figure 7 and Figure 8. This phenomenon will be further explained in Figure 9 and Figure 10.
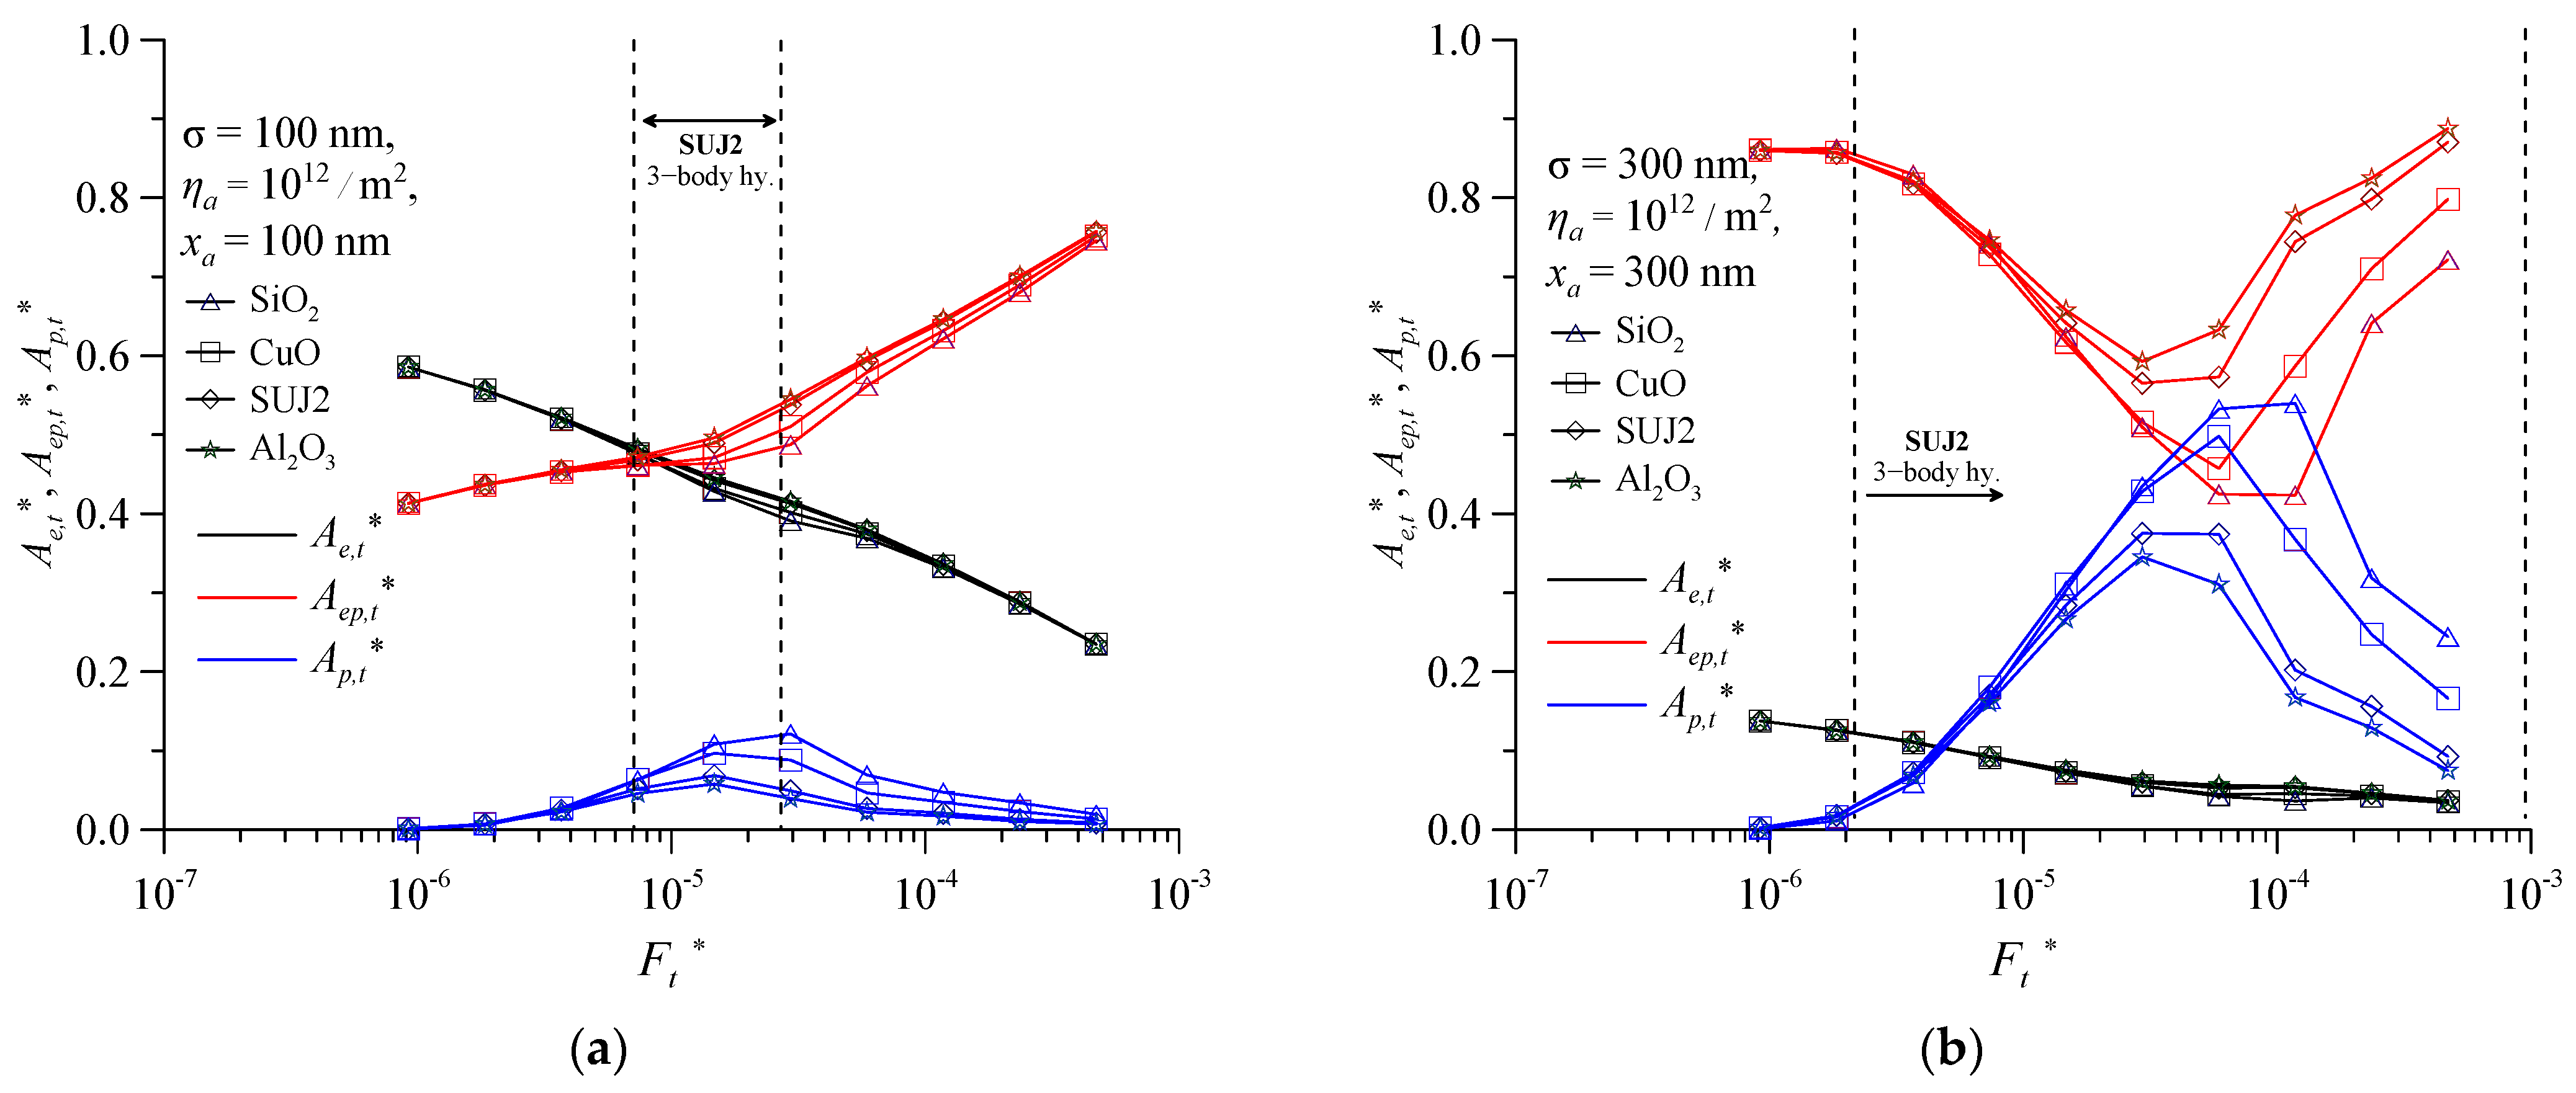
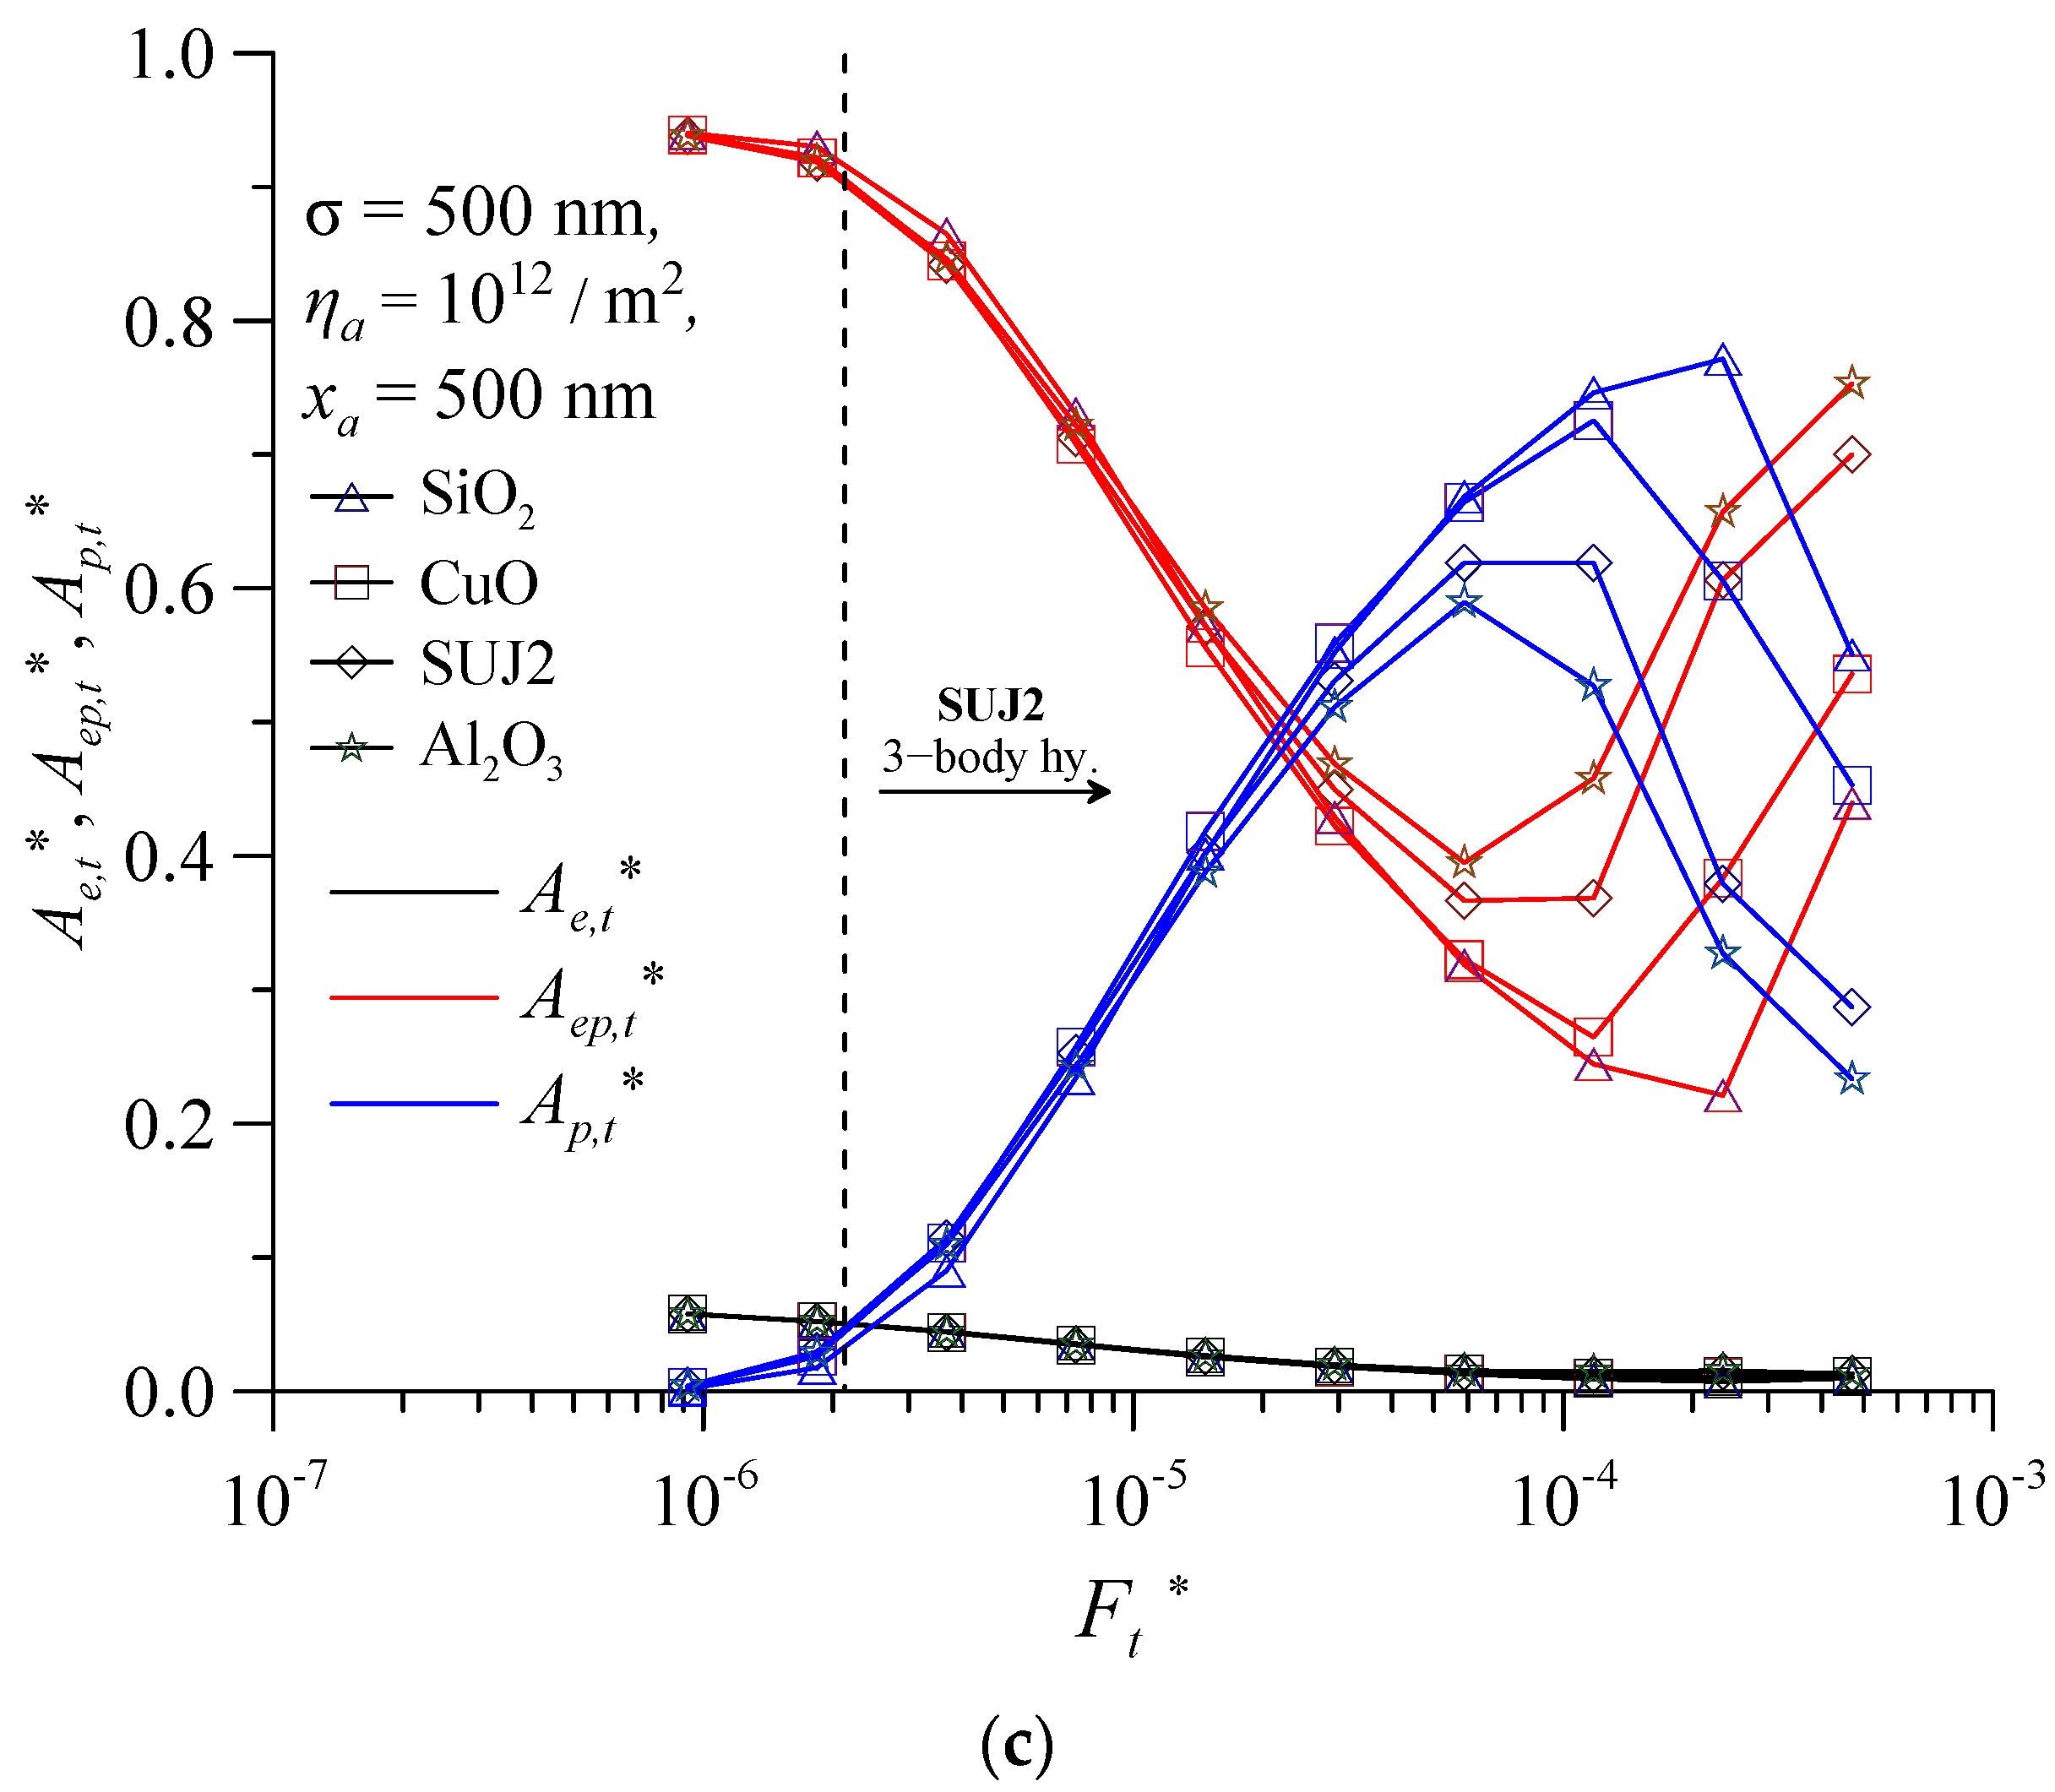
The deformation behavior of the contact interface includes three different modes: elastic deformation (Ae,t*), elastoplastic deformation(Aep,t*), and plastic deformation(Ap,t*). The plastic deformation spots in the real contact area are the main areas of surface damage, such as plowing groove, pitting and delamination wear. Figure 9 shows the deformation components’ variation in the total real contact area ratio versus the Ft* for Ae,t*, Aep,t*, and Ap,t*, with ηa = 1012/m2. Three different values of σ and, xa are considered: (a) σ = 100 nm, xa = 100 nm; (b) σ = 300 nm, xa = 300 nm; and (c) σ = 500 nm, xa = 500 nm. As shown in Figure 9a, the Ae,t* decreases with increasing Ft*. In contrast, the Aep,t* increases with increasing Ft*, and the Aep,t* increases at the initial stage and then decreases. This behavior is different from that of the Ap,t* and Aep,t*. The reason for this is that original plastic contact area increases, and new contact spots occur, as the load increases. The real contact pressure at parts of the original plastic contact spots decreases and results in the plastic area transferring to the elastoplastic area. At the same time, part of the real elastic area changes to the elastoplastic area due to the decreasing separation of the two surfaces. It is interesting to note that the ratio of plastic contact area for the four-particle materials starts to make a difference near the hy. contact. Their order of magnitude is SiO2 > CuO > SUJ2 > Al2O3. The order of their magnitude is opposite to the value of Young’s modulus. The results of a previous two-body contact analysis show that, even at extremely low loads, the elastoplastic area accounts for more than 80% and only a small part is the plastic and elastic deformation area [18]. The results of the three-body contact analysis are obviously more reasonable.
Figure 9b,c also show that the Ap,t* first increases and then decreases with increasing Ft*, as described in Figure 11a. The order of magnitude for four-particle materials is the same for different surface roughness and contact loads. However, in Figure 9b, showing the results for σ = 300 nm and xa = 300 nm, the Ap,t* and deviation of four-particle materials are greater than that of the surface, with σ = 100. The Ap,t* of SiO2 reached 50%, and the Ae,t* was smaller than 0.15 for all materials. Because the increase rate of the plastic area with the increase in load is larger than that of the surface with small roughness, the elastoplastic deformation area will drop to the lowest value and then rise. The interface with a higher roughness and larger particle size is shown in Figure 9c. The Ap,t* of SiO2 reached 80% at a high load. The larger the surface roughness, the smaller the elastic deformation area for all materials. This concludes that higher roughness and a larger particle size have a greater chance of causing wear and damage.
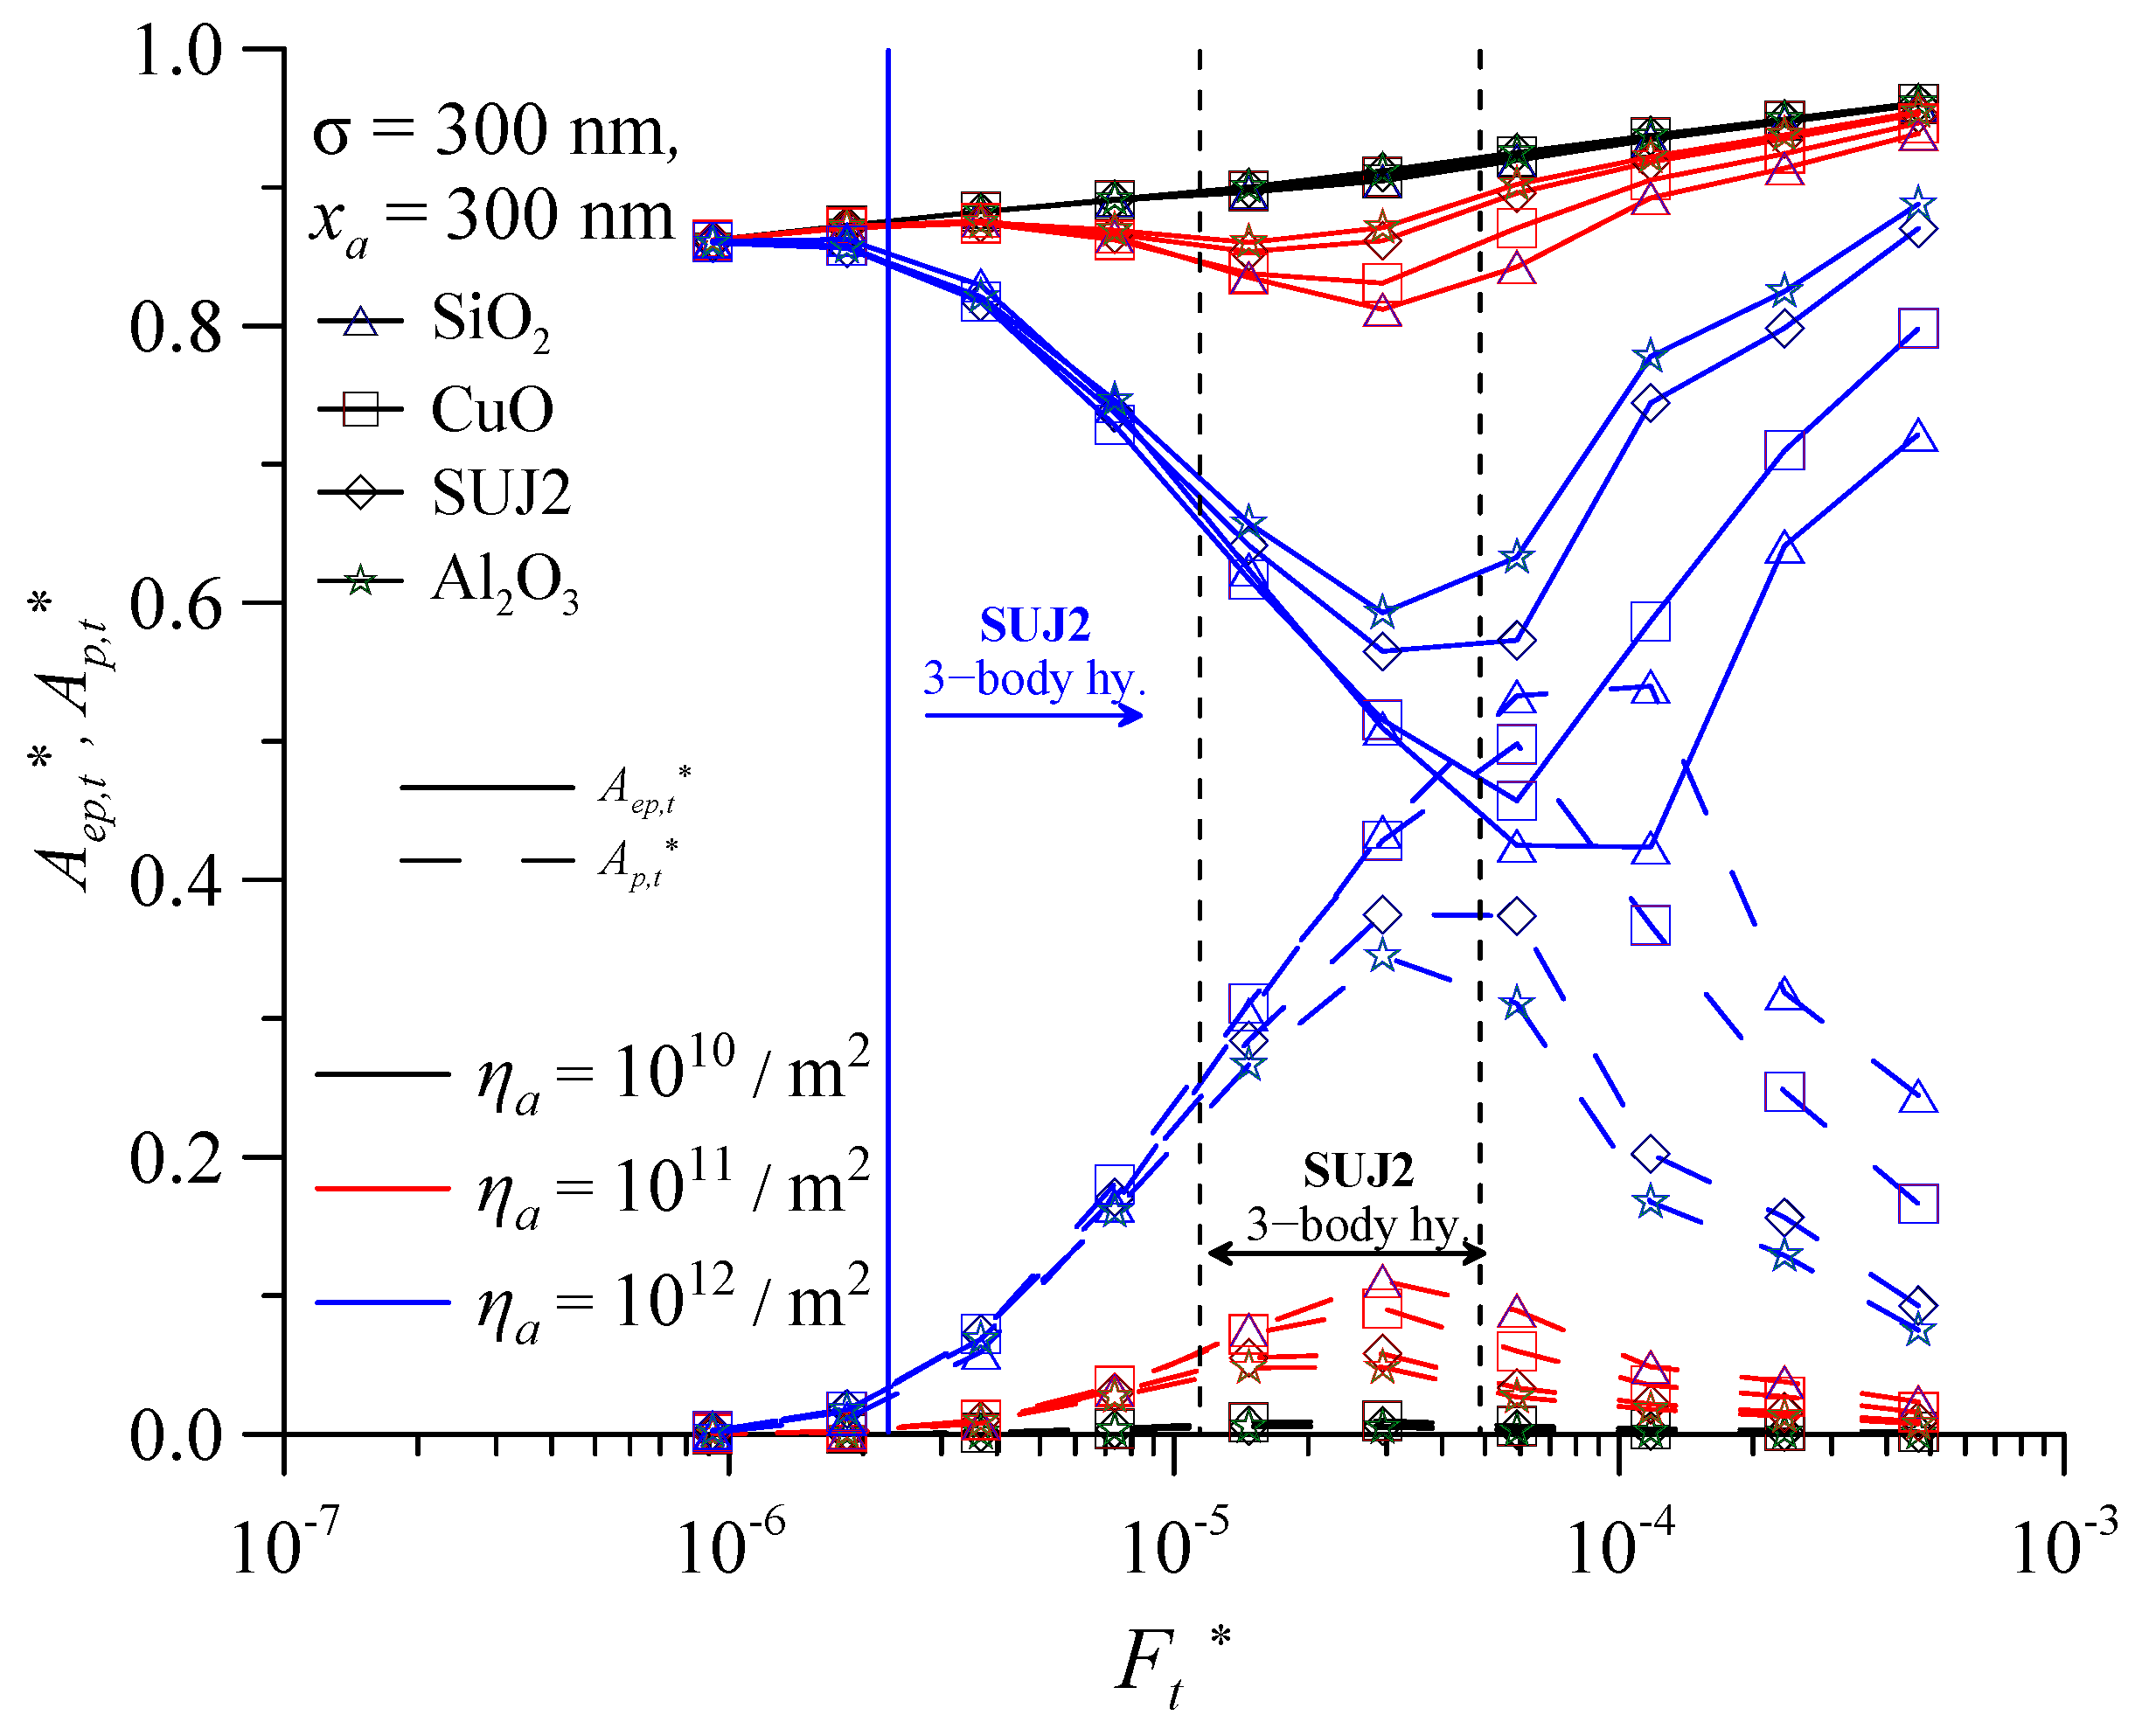
The following is a further discussion of the variations in the effects of particle concentration on elastoplastic deformation and plastic deformation. Figure 10 shows the Aep,t* and Ap,t* versus the Ft* for various third-particle materials and the ηa. Regardless of the material, the greater the particle concentration, the smaller the Aep,t*. However, the order of the Aep,t* produced by different material types does not change. As analyzed in Figure 10, the Ae,t* linearly decreases with the increase in load. Therefore, the Ap,t* shows an opposite trend to the Aep,t*. The real plastic deformation area is the main area in which wear occurs. This also shows that the concentration of wear particles will gradually increase with the prolongation of the mechanical parts’ operation part, and the parts will be damaged by failure due to excessive wear or fatigue.
Figure 11 illustrates the effect of particle concentration and particle material on real contact area at interface, contact area of third particle and surface 1, and separation. Figure 11 also shows the effects of ηa (particle concentration) on the contact characteristics at the interface. The three-body contact situation interface with a low concentration of 1010/m2, xa = 100 nm and σ = 50 nm, has almost the same linear relationship between At* and Ft* as in the two-body contact situation. Comparing Figure 11a with Figure 11b, the interfaces for all particle materials are shown to be in the s–s mode. However, when the concentration of third particle rises to 1012/m2, the interface enters the p–s, hy. and s–s modes as the load increases. The three-body contact situation interface with a concentration of 1011/m2 occurs between the above two conditions. Therefore, under the same load, the greater the concentration, the smaller the value of the real contact area ratio.
It can be observed from Figure 11b that the Ft* range of SiO2 in the hy. mode is the largest (Ft *= 8.60 × 10⁻⁶~1.53 × 10⁻⁴) when ηa = 1012/m2, followed by CuO, and Al2O3 is the smallest. However, the interface with Al2O3 can easily enter the hy. mode compared to interfaces with other third-particle materials under smaller loads. In summary, the smaller the equivalent elastic modulus of the third particle, the larger the load range it can withstand. On the other hand, the larger the equivalent elastic modulus, the earlier it can enter the hy. contact under smaller loads. This also indicates that the four different third-particle materials are suitable for different mechanical surface motion conditions.
Figure 11c shows that d* increases with the increase in particle concentration. When the particle concentration is ηa = 1010/m2, the d* values of the four different third-particle materials are almost the same. However, as the particle concentration increases to ηa = 1012/m2, the differences in d* values among the four different third-particle materials become larger. After Ft* > 3.96 × 10⁻⁶, the d* value of Al2O3 is smaller than that of other third-particle materials. This result is consistent with the results shown in Figure 11b. This indicates that the interface with Al2O3 enters the hy. mode earlier than interfaces with the other third-particle materials. The findings of this study suggest that the concentration of third-particle materials significantly affects the real contact area and interface separation. This is also the reason why, as the operating time of the machine increases, the concentration of the third particle also increases, resulting in the end of life.
Figure 12 shows the relationship between the At* and the Ft* at various third-particle sizes and materials, with σ = 50 nm, and ηa = 1012/m2. Figure 12a shows that At* increases as the At* increases. As explained above, within the load and particle concentration range of general components, when xa/σ is less than 1, the interface is almost the s–s mode. When xa/σ is far greater than 1, the interface is almost the p–s mode. When there is a third particle present between the two surfaces under the same Ft*, the At* decreases. This phenomenon is consistent with the inference made by Ghaednia et al. [52]. Figure 12c shows that as the average third-particle diameter (xa) increases, the d* also increases at all load ranges. Figure 8c illustrates the relationship between xa/σ and d*. The larger the xa/σ value of the interface, the larger the initial separation. At the s–s mode interface, the separations of the four materials are almost the same. The interface at the initial p–s contact mode overlaps for four materials, and then the difference becomes larger as the load increases. Figure 12c shows that the analysis results have the same trend as the results from Figure 8c.
5. Conclusions
The presence of third particles at the interface of moving parts is unavoidable. They come from different sources and have different materials. In this paper, based on the three-body microcontact model, the effects of four third-particle materials on the tribological contact characteristics are analyzed. Assuming two-body contact at the machine-part interface, this is an ideal analysis. The conclusion regarding the two-body contact characteristics of the roughness surface may be misleading. The following are the conclusions drawn from this study:
- The difference in the dimensionless separation and real contact area ratio of the four-particle materials in the three-body s–s and p–s contact modes is rather small. The biggest difference occurs near the transition area from the p–s contact mode to three-body hy. contact mode. Regardless of the contact mode, the order of the dimensionless separation of the four-particle materials is SiO2 > CuO > SUJ2 > Al2O3. The separation value, d, is influenced by the hardness, Young’s modulus, and Poisson ratio of three body. The order of the real contact area ratio is reversed. The experimental results regarding friction and wear for the four third-particle materials show that the theoretical predictions are reasonable.
- Under the same particle size, particle concentration and surface roughness, the critical load level sequence from three-body p–s contact mode to three-body hy. contact mode is SiO2 > CuO > SUJ2 > Al2O3. The critical load sequence from three-body hy. contact mode to three-body s–s contact mode is the same. The smaller the particle size, the lower the concentration, and the three-body interface only needs a relatively low load to enter the three-body s–s contact mode.
- The difference in the contact deformation type of the four-particle materials in the three-body s–s and p–s contact modes is rather small. In the three-body hy. contact mode, the plastic contact areas of the four materials first increase to a critical value and then decrease as the load increases. This is because the area of the original plastic contact spot gradually increases with the increase in load. At the same time, the number of contact spot also increases. The contact pressure at the plastic contact spot is reduced. As a result, some plastic contact spots enter the elastic–plastic region.
- The order of plastic contact area value in the hy. mode is SiO2 > CuO > SUJ2 > Al2O3. The load required to achieve the maximum plastic contact area ratio is also in the same order. The larger the particle size, the greater the plastic contact area for all particle materials. The lower the particle concentration, the greater the elasto-plastic contact area for all particle materials.
Author Contributions
Conceptualization, J.-H.H., C.-C.Y. and Y.-Y.C.; methodology, J.-H.H., C.-C.Y. and Y.-Y.C.; software, C.-C.Y. and Y.-Y.C.; validation, J.-H.H., C.-C.Y. and Y.-Y.C.; formal analysis, C.-C.Y. and Y.-Y.C.; investigation, J.-H.H.; resources, J.-H.H.; data curation, C.-C.Y. and Y.-Y.C.; writing—original draft preparation, C.-C.Y.; writing—review and editing, J.-H.H. and Y.-Y.C.; visualization, C.-C.Y.; supervision, J.-H.H. and Y.-Y.C.; project administration, C.-C.Y. All authors have read and agreed to the published version of the manuscript.
Funding
This research was supported by the National Ministry of Science and Technology, Taiwan (R.O.C.), under grants MOST 110-2221-E-150 -015 -MY3 and 110-2923-E-150 -001 -MY3, as well as National Formosa University, Taiwan (R.O.C.).
Data Availability Statement
Not applicable.
Conflicts of Interest
The authors declare no conflict of interest.
References
- Godet, M. The third particle approach: A mechanical view of wear. Wear 1984, 100, 437–452. [Google Scholar] [CrossRef]
- Godet, M. Third particles in tribology. Wear 1990, 136, 29–45. [Google Scholar] [CrossRef]
- Heshmat, H.; Godet, M.; Berthier, Y. On the Role and Mechanism of Dry Triboparticulate Lubrication. In Proceedings of the 49th STLE Annual Meeting, Pittsburgh, PN, USA, 1–5 May 1994. [Google Scholar]
- Stachowiak, G.B.; Stachowiak, G.W. The effects of particle characteristics on three-body abrasive wear. Wear 2001, 249, 201–207. [Google Scholar] [CrossRef]
- Ruling, C.; Shaoxian, L. Novel three-body nano-abrasive wear mechanism. Friction 2022, 10, 677–687. [Google Scholar] [CrossRef]
- Popov, V.L. Is tribology approaching its golden age? grand challenges in engineering education and tribological research. Front. Mech. Eng. 2018, 4, 16. [Google Scholar] [CrossRef]
- Greenwood, J.A. Metal transfer and wear. Front. Mech. Eng. 2020, 6, 62. [Google Scholar] [CrossRef]
- Peña-Parás, L.; Gao, H.; Maldonado-Cortés, D.; Vellore, A.; García-Pineda, P.; Montemayor, O.E.; Nava, K.L.; Martini, M. Effects of substrate surface roughness and nano/micro particle additive size on friction and wear in lubricated sliding. Tribol. Int. 2018, 119, 88–98. [Google Scholar] [CrossRef]
- Chern, S.Y.; Chen, Y.Y.; Liu, W.L.; Horng, J.H. Contact Characteristics at Interface in Three-Body Contact Conditions with Rough Surfaces and Foreign Particles. Lubricants 2022, 10, 164. [Google Scholar] [CrossRef]
- Singh, Y.; Rahim, E.A.; Singh, N.K.; Sharma, A.; Singla, A.; Palamanit, A. Friction and wear characteristics of chemically modified mahua (madhuca indica) oil based lubricant with SiO2 nanoparticles as additives. Wear 2022, 508–509, 204463. [Google Scholar] [CrossRef]
- Miftakhova, A.; Chen, Y.Y.; Horng, J.H. Effect of rolling on the friction coefficient in three-body contact. Adv. Mech. Eng. 2019, 11, 1687814019872303. [Google Scholar] [CrossRef]
- Boungomba, H.; Moreau, P.; Sadat, T.; Dubois, R.; Dubar, M.; Dubar, L. Influence of oxide polluted lubricants on friction: Trapping mechanisms. Tribol. Int. 2023, 179, 108164. [Google Scholar] [CrossRef]
- Horng, J.H.; Yu, C.C.; Chen, Y.Y. Tribological Characteristics and Load-Sharing of Point-Contact Interface in Three-Body Mixed Lubrication. ASME J. Tribol. 2021, 144, 052201. [Google Scholar] [CrossRef]
- Horng, J.H.; Lin, J.F.; Li, K.Y. Scuffing as Evaluated from the Viewpoint of Surface Roughness and Friction Energy. ASME J. Tribol. 1996, 118, 669–675. [Google Scholar] [CrossRef]
- Horng, J.H. Contact Analysis of Rough Surfaces at Transition Conditions in Sliding Line Lubrication. Wear 1999, 219, 205–212. [Google Scholar] [CrossRef]
- Pawlus, P.; Zelasko, W. The importance of sampling interval for rough contact mechanics. Wear 2012, 276–277, 121–129. [Google Scholar] [CrossRef]
- Beheshti, A.; Khonsari, M.M. Asperity micro-contact models as applied to the deformation of rough line contact. Tribol. Int. 2012, 52, 61–74. [Google Scholar] [CrossRef]
- Li, L.; Etsion, I.; Talke, F.E. Contact Area and Static Friction of Rough Surfaces with High Plasticity Index. ASME J. Tribol. 2010, 132, 669–675. [Google Scholar] [CrossRef]
- Kogut, L.; Etsion, I. Elastic-Plastic Contact Analysis of a Sphere and a Rigid Flat. ASME J. Appl. Mech. 2002, 69, 657–662. [Google Scholar] [CrossRef]
- Zhao, Y.; Maietta, D.M.; Chang, L. An Asperity Microcontact Model Incorporating the Transition from Elastic Deformation to Fully Plastic Flow. ASME J. Tribol. 2000, 122, 86–93. [Google Scholar] [CrossRef]
- Jamari, J.; Schipper, D.J. Plastic deformation and contact area of an elastic–plastic contact of ellipsoid bodies after unloading. Tribol. Int. 2007, 40, 1311–1318. [Google Scholar] [CrossRef]
- Lin, L.P.; Lin, J.F. A New Method for Elastic-Plastic Contact Analysis of a Deformable Sphere and a Rigid Flat. ASME J. Tribol. 2006, 128, 221–229. [Google Scholar] [CrossRef]
- Qiu, S.; Dong, J.; Cheng, G. A review of ultrafine particles as antiwear additives and friction modifiers in lubricating oils. Lubr. Sci. 1999, 11, 217–226. [Google Scholar] [CrossRef]
- Rapoport, L.; Leshchinsky, V.; Lvovsky, M.; Lapsker, I.; Volovik, Y.; Feldman, Y.; Popovitz-Biro, R.; Tenne, R. Superior tribological properties of powder materials with solid lubricant nanoparticles. Wear 2003, 255, 794–800. [Google Scholar] [CrossRef]
- Wornyoh, E.Y.A.; Jasti, V.K.; Higgs, C.F. A review of dry particulate lubrication: Powder and granular materials. J. Tribol. 2007, 129, 438–449. [Google Scholar] [CrossRef]
- Asnida, M.; Hisham, S.; Awang, N.W.; Amirruddin, A.K.; Noor, M.M.; Kadirgama, K.; Ramasamy, D.; Najafi, G.; Tarlochan, F. Copper (II) oxide nanoparticles as additve in engine oil to increase the durability of piston-liner contact. Fuel 2018, 212, 656–667. [Google Scholar] [CrossRef]
- Bhaumik, S.; Maggirwar, R.; Datta, S.; Pathak, S.D. Analyses of anti-wear and extreme pressure properties of castor oil with zinc oxide nano friction modifiers. Appl. Surf. Sci. 2018, 449, 277–286. [Google Scholar] [CrossRef]
- Aghbashlo, M.; Tabatabaei, M.; Khalife, E.; Najafi, B.; Mirsalim, S.M.; Gharehghani, A.; Mohammadi, P.; Dadak, A.; Shojaei, T.R.; Khounani, Z. A novel emulsion fuel containing aqueous nano cerium oxide additive in diesel–biodiesel blends to improve diesel engines performance and reduce exhaust emissions: Part II—exergetic analysis. Fuel 2017, 205, 262–271. [Google Scholar] [CrossRef]
- Singh, Y.; Singh, N.K.; Sharma, A. Effect of SiO2 Nanoparticles on the Tribological Behavior of Balanites Aegytiaca (Desert date) Oil-Based Biolubricant. J. Bio Tribo Corros. 2021, 7, 1–6. [Google Scholar] [CrossRef]
- Wang, W.; Yu, M.; Ma, J.; Jia, Y. Tribological Properties of Nanoparticles in the Presence of MoDTC. Lubricants 2023, 11, 132. [Google Scholar] [CrossRef]
- Kumar, S.; Kumar, R. Tribological characteristics of synthesized hybrid nanofluid composed of CuO and TiO2 nanoparticle additives. Wear 2023, 518–519, 204623. [Google Scholar] [CrossRef]
- Wu, C.; Xiong, R.; Ni, J.; Yao, L.; Li, X. Effects of CuO nanoparticles on friction and vibration behaviors of grease on rolling bearing. Tribol. Int. 2020, 152, 106552. [Google Scholar] [CrossRef]
- Alves, S.M.; Barros, B.S.; Trajano, M.F.; Ribeiro, K.S.B.; Moura, E. Tribological behavior of vegetable oil-based lubricants with nanoparticles of oxides in boundary lubrication conditions. Tribol. Int. 2013, 65, 28–36. [Google Scholar] [CrossRef]
- Choi, Y.; Lee, C.; Hwang, Y.; Park, M.; Lee, J.; Choi, C.; Jung, M. Tribological behavior of copper nanoparticles as additives in oil. Curr. Appl. Phys. 2009, 9, e124–e127. [Google Scholar] [CrossRef]
- Wei, C.C.; Horng, J.H.; Lee, A.C.; Lin, J.F. Analyses and experimental confirmation of removal performance of silicon oxide film in the chemical–mechanical polishing (CMP) process with pattern geometry of concentric groove pads. Wear 2011, 270, 172–180. [Google Scholar] [CrossRef]
- Nabhan, A.; Rashed, A.; Ghazay, N.M.; Abdo, J.; Haneef, M.D. Tribological Properties of Al2O3 Nanoparticles as Lithium Grease Additives. Lubricants 2021, 9, 9. [Google Scholar] [CrossRef]
- Chen, H.; Wu, Z.; Hai, W.; Liu, L.; Sun, W. Tribo-oxidation and tribological behaviour of ZrB2-20%volSiC composites coupled with WC and Al2O3 at high temperatures. Wear 2021, 464–465, 203534. [Google Scholar] [CrossRef]
- Greenwood, J.A.; Tripp, J.H. The contact of two nominally flat rough surfaces. Proc. Inst. Mech. Eng. 1970, 185, 625–633. [Google Scholar] [CrossRef]
- Shi, W.; Zhang, Z. Contact characteristic parameters modeling for the assembled structure with bolted joints. Tribol. Int. 2022, 165, 107272. [Google Scholar] [CrossRef]
- Wu, H.W.; Chen, Y.Y.; Horng, J.H. The analysis of three-body contact temperature under the different third particle size, density, and value of friction. Micromachines 2017, 8, 302. [Google Scholar] [CrossRef]
- Xie, H.; Jiang, B.; He, J.; Xia, X.; Pan, F. Lubrication performance of MoS2 and SiO2 nanoparticles as lubricant additives in magnesium alloy-steel contacts. Tribol. Int. 2016, 93, 63–70. [Google Scholar] [CrossRef]
- Rigney, D.A. The role of characterization in understanding debris generation. In Wear Particles, 1st ed.; Dowson, D., Taylor, C.M., Childs, T.H.C., Godet, M., Dalmaz, G., Eds.; Elsevier Science: Amsterdam, The Netherlands, 1992; pp. 405–412. [Google Scholar]
- CPC Corporation, Taiwan. Available online: https://cpclube.cpc.com.tw/en/C_ProductDetail.aspx?n=7547&s=840 (accessed on 23 March 2023).
- Mir, A.H. Improved Concrete Properties Using Quarry Dust as Replacement for Natural Sand. Int. J. Eng. Res. Dev. 2015, 11, 46–52. Available online: http://www.ijerd.com/paper/vol11-issue3/Version_1/E1134652.pdf (accessed on 23 March 2023).
- Shi, X.; Zou, Y. A Comparative Study on Equivalent Modeling of Rough Surfaces Contact. J. Tribol. 2018, 140, 041402. [Google Scholar] [CrossRef]
- Croné, P.; Gudmundson, P.; Faleskog, J. Analytical prediction of yield stress and strain hardening in a strain gradient plasticity material reinforced by small elastic particles. Int. J. Plast. 2022, 151, 103200. [Google Scholar] [CrossRef]
- Umbrello, D.; Hua, J.; Shivpuri, R. Hardness-based flow stress and fracture models for numerical simulation of hard machining AISI 52100 bearing steel. Mater. Sci. Eng. A 2004, 374, 90–100. [Google Scholar] [CrossRef]
- Jang, J.S.; Bouveret, B.; Suhr, J.; Gibson, R.F. Combined numerical/experimental investigation of particle diameter and interphase effects on coefficient of thermal expansion and young’s modulus of SiO2/epoxy nanocomposites. Polym. Compos. 2012, 33, 1415–1423. [Google Scholar] [CrossRef]
- Yao, B.; Zhou, X.; Liu, M.; Yu, J.; Cao, J.; Wang, L. First-principles calculations on phase transformation and elastic properties of CuO under pressure. J. Comput. Electron. 2018, 17, 1450–1456. [Google Scholar] [CrossRef]
- Abyzov, A.M. Aluminum Oxide and Alumina Ceramics (review). Part 1. Properties of Al2O3 and Commercial Production of Dispersed Al2O3. Refract. Ind. Ceram. 2019, 60, 24–32. [Google Scholar] [CrossRef]
- Liang, X.M.; Xing, Y.Z.; Li, L.T.; Yuan, W.K.; Wang, G.F. An experimental study on the relation between friction force and real contact area. Sci. Rep. 2021, 11, 20366. [Google Scholar] [CrossRef]
- Ghaednia, H.; Jackson, R.L.; Khodadadi, J.M. Experimental analysis of stable CuO nanoparticle enhanced lubricants. J. Exp. Nanosci. 2015, 10, 1–18. [Google Scholar] [CrossRef]
Figure 1.
The contact mode at the contact interfaces: (a) two-body s–s mode, (b) surface-to-particle mode, (c) surface-to-surface mode, and (d) three-body s–s mode. (The light purple circles is contact spots between the two surfaces and the light blue circles is contact spots between the third particle and the surface.)

Figure 2.
Schematic of a three-body contact system.

Figure 3.
Four-ball tribology tester. (a) the actual machine and (b) 3D model schematic.

Figure 4.
Foreign particle materials (a) SiO2 (b) CuO (c) Al2O3.

Figure 5.
Contact characteristics as a function of dimensionless contact load for various third-particles, with σ = 50 nm, ηa = 1012/m2 and xa = 100 nm, (a) dimensionless real contact area (b) real contact area ratio of two surfaces, and real contact area ratio of third particle and surface (c) dimensionless separation.

Figure 6.
Experimental results of lubricating oil with different third-particle materials: (a) variation in friction coefficient, (b) average coefficient of friction, (c) wear scar, (d) wear diameter.
Figure 6.
Experimental results of lubricating oil with different third-particle materials: (a) variation in friction coefficient, (b) average coefficient of friction, (c) wear scar, (d) wear diameter.

Figure 7.
Contact characteristics as a function of dimensionless contact load for various third-particles and equivalent surface RMS roughnesses, with ηa = 1012/m2, and xa = 100 nm, (a) dimensionless real contact area (b) real contact area ratio of third particle and surface (c) dimensionless separation.

Figure 8.
Contact characteristics as a function of dimensionless contact load for various third-particle materials and equivalent surface RMS roughnesses, with ηa = 1012/m2, and xa = 300 nm, (a) dimensionless real contact area (b) real contact area ratio of third particle and surface (c) dimensionless separation.

Figure 9.
Deformation components of total real contact area ratio as a function of dimensionless contact load for Ae,t*, Aep,t*, and Ap,t*, with ηa = 1012/m2 (a) σ = 100 nm, xa = 100 nm (b) σ = 300 nm, xa = 300 nm (c) σ = 500 nm, xa = 500 nm.
Figure 9.
Deformation components of total real contact area ratio as a function of dimensionless contact load for Ae,t*, Aep,t*, and Ap,t*, with ηa = 1012/m2 (a) σ = 100 nm, xa = 100 nm (b) σ = 300 nm, xa = 300 nm (c) σ = 500 nm, xa = 500 nm.


Figure 10.
Real contact area ratio of elastoplastic and plastic deformations as a function of dimensionless contact load for various third-particle materials and concentrations.
Figure 10.
Real contact area ratio of elastoplastic and plastic deformations as a function of dimensionless contact load for various third-particle materials and concentrations.

Figure 11.
Contact characteristics as a function of dimensionless contact load for various particle concentrations, with σ = 50 nm, and xa = 100 nm, (a) dimensionless real contact area (b) real contact area ratio of third particle and surface (c) dimensionless separation.
Figure 11.
Contact characteristics as a function of dimensionless contact load for various particle concentrations, with σ = 50 nm, and xa = 100 nm, (a) dimensionless real contact area (b) real contact area ratio of third particle and surface (c) dimensionless separation.


Figure 12.
Contact characteristics as a function of dimensionless contact load for various third-particle and average third-particle diameters, with σ = 50 nm, and ηa = 1012/m2 (a) dimensionless real contact area (b) real contact area ratio of third particle and surface (c) dimensionless separation.


Table 1.
Chemical composition of SUJ2.
| Component Properties | C | Cr | Cu | Fe | Mn | Ni | P | Si | S |
|---|---|---|---|---|---|---|---|---|---|
| Value (%) | 0.42~0.48 | ≤0.20 | ≤0.30 | 97.6~98.8 | 0.60~0.90 | ≤0.20 | ≤0.030 | 0.15~0.35 | ≤0.035 |
Table 2.
Properties of test lubricant.
| Sp. Gr. | Viscosity, Kin. (cSt) | Viscosity Index | Pour Point (°C) | Flash Point (°C) | ||
|---|---|---|---|---|---|---|
| 40 °C | 100 °C | |||||
| Lubricant | 0.878 | 67.18 | 8.70 | 101 | −12 | 264 |
| Surface 1 | Surface 2 | Third Particle | ||||
|---|---|---|---|---|---|---|
| Materials | SUJ2 | SUJ2 | SUJ2 | CuO | SiO2 | Al2O3 |
| H (GPa) | 6.3 | 6.3 | 6.3 | 1.143 | 7 | 14.12 |
| E (GPa) | 210 | 210 | 210 | 87.9 | 70.55 | 375 |
| ν | 0.27 | 0.27 | 0.27 | 0.39 | 0.17 | 0.22 |
Table 4.
Input parameters in three-body contact model.
| Property | Value |
|---|---|
| Ft (N) | 0.31–160 |
| σ (nm) | 50, 100, 300, 500 |
| ηa (m−2) | 1010, 1011, 1012 |
| xa (nm) | 25, 100, 300, 500 |
Disclaimer/Publisher’s Note: The statements, opinions and data contained in all publications are solely those of the individual author(s) and contributor(s) and not of MDPI and/or the editor(s). MDPI and/or the editor(s) disclaim responsibility for any injury to people or property resulting from any ideas, methods, instructions or products referred to in the content. |
© 2023 by the authors. Licensee MDPI, Basel, Switzerland. This article is an open access article distributed under the terms and conditions of the Creative Commons Attribution (CC BY) license (https://creativecommons.org/licenses/by/4.0/).
Share and Cite
MDPI and ACS Style
Horng, J.-H.; Yu, C.-C.; Chen, Y.-Y. Effect of Third-Particle Material and Contact Mode on Tribology Contact Characteristics at Interface. Lubricants 2023, 11, 184. https://doi.org/10.3390/lubricants11040184
AMA Style
Horng J-H, Yu C-C, Chen Y-Y. Effect of Third-Particle Material and Contact Mode on Tribology Contact Characteristics at Interface. Lubricants. 2023; 11(4):184. https://doi.org/10.3390/lubricants11040184
Chicago/Turabian StyleHorng, Jeng-Haur, Chia-Chun Yu, and Yang-Yuan Chen. 2023. "Effect of Third-Particle Material and Contact Mode on Tribology Contact Characteristics at Interface" Lubricants 11, no. 4: 184. https://doi.org/10.3390/lubricants11040184
Note that from the first issue of 2016, this journal uses article numbers instead of page numbers. See further details here.