Experimental Analysis of Chemically Degraded Lubricant’s Impact on Spur Gear Wear


Department of Mechanical Engineering, Indian Institute of Technology, Delhi 110016, India
*
Author to whom correspondence should be addressed.
Lubricants 2023, 11(5), 201; https://doi.org/10.3390/lubricants11050201
Submission received: 14 March 2023
/
Revised: 27 April 2023
/
Accepted: 28 April 2023
/
Published: 29 April 2023
Abstract
:The impact of lubricating oil degradation, which can happen during both storage and use, on spur gear wear is thoroughly examined in this paper at all scales, from macro to nano. A thorough structure was created by combining the results of testing performed at the macroscale on a test rig and at the nanoscale using tools such as FESEM analysis. Using a single-stage spur transmission under two different working conditions (‘40 Nm, 1200 rpm, 198 h’ and ‘50 Nm, 500 rpm, 90 min’), macroscale experiments were carried out using both conventional and artificially degraded lubricant oils. Aqueous hydrochloric acid (36.46% v/v concentration) was added to the lubricating lubricant to induce artificial degradation. Wear development and oil degradation were monitored in real time using tools such as metallic wear detritus sensors and oil sensor suites. Offline methods, such as total acid number (TAN) and pH value readings, were used with periodic lubricant oil samples. It was discovered through both online and offline monitoring methods that the spur gear experienced substantial wear in lubricant-degraded conditions. By demonstrating elevated levels of oxidative degradation products and the formation of new oxidative compounds, such as sulphates and aromatic groups, the attenuated total reflection-Fourier transform infrared spectroscopy (ATR-FTIR) analysis of the oil degradation at the nanoscale verified this. In addition, water creation was noted. It is interesting to note that the pH meter has become a viable option for detecting oil degradation and offers a useful way to keep track of lubricant quality. Overall, this study shows that there is a strong connection between macroscale and nanoscale phenomena in the complete method created for assessing the tribological performance of gear lubricants.
1. Introduction
Lubricants play a crucial role in reducing wear in mechanical systems, but their selection requires a thorough design methodology [1] to ensure optimal results. However, exposure of stored lubricating oil to high temperatures and solar radiation can instigate oxidative degradation of the lubricant, potentially causing the mechanical system more harm than good. The AGMA 9005-F16 [2] standard classifies gear lubricants as “rust and oxidation inhibiting”, “anti-scuffing”, and “compound oils”. In practice, however, these classifications are closely related to the adjuvant packages [3,4,5,6] added to base oils to impart anti-wear, anti-scuff, and anti-rust properties. In addition to these characteristics, the age of lubricant oil is an important consideration. The rate of chemical and mechanical degradation determines the rate of lubricant degradation [7,8,9]. High temperatures, contamination, and extended use can all contribute to this deterioration process. The oxidation of lubricant depletes -ROOH- and -RH- and produces carboxylic acid and water [10,11]. The deterioration of lubricant and machine components is caused by an increase in moisture levels, and the typically acceptable moisture content limit is 100 ppm or 0.2% [12]. Usually, an alkaline base is applied to oil to neutralize its acid content. As assessed by the total base number (TBN) value, gear oil formulations must be alkaline to neutralize the acid produced during operation. It is important to note that the total acid number (TAN) measures acidity in lubricant oils and indicates acid concentration. With time and continuous use of additives in forming a sacrificial layer, additives become depleted due to their limited addition. Several online and offline monitoring methods [13,14,15,16,17,18,19,20,21,22,23] for monitoring gearboxes have been developed.
However, to study oil degradation and its impact on gear conditions, this paper focuses on accelerated tests that attempt to concurrently monitor wear debris and lubricant characteristics. A framework that integrates the study of various tribology scales, from macro to nano, has also been created concurrently. These scales have been examined and divided into groups by Stoyanov and Cromik [24] and Broitman [25] based on the system’s normal force, the type of friction force, and the Hertz circles of contact. Whereas groups of asperities are regarded as a collective at the microscale, interactions between single asperities are considered at the nanoscale. The contacting asperities that span a sizable real contact area, which can be measured in the range of 0.1 mm to several mm, are represented at the macroscale.
In their research, Gosvami et al. [3] showed how lubricant reacts with the base metal matrix to create a tribofilm. Various techniques, such as TAN analysis, rheological analysis, spectrometric analysis, pH measurement (which can even yield negative values for natural resources [25,26]), physicochemical properties, chromatography [27], etc., can be used to study lubricant degradation. Wolak [28] investigated the effect of time on oil deterioration. Several studies [7,8,9,10,11,29,30,31,32] have employed ATR-FTIR techniques in conjunction with TAN and viscosity measurements to monitor lubricant depletion due to oxidative and mechanical degradation. The FTIR data were combined with optical imaging [7] and linear regression [29] to monitor the shelf life and service life of lubricating oils. De et al. [32] used FTIR to determine the depletion of different compounds in engine oil and machine learning algorithms to predict the lubricant’s TAN value. Modern machine learning methods [32,33,34,35,36,37] and multi-objective optimization techniques are available; however, their successful implementation necessitates the use of trustworthy datasets. Several researchers [38,39,40] have utilized artificial aging techniques, such as mechanical shearing, thermal stressing, and chemical oxidation, to simulate the degradation of lubricants. In a study conducted by Nagy et al. [40], chemical (TAN value) and physical (viscosity, etc.) properties of thermally degraded oil and “used contaminated lubricant oil” were compared. A strong correlation was observed between the two oils’ performances. Physical, chemical, and biological characteristics of lubricants, such as pH, are affected by chemical oxidation, which was investigated by Seidel et al. [41]. They discovered that chemical oxidation had radically altered the lubricant’s performance properties. Gupta et al. [42] investigated the results of chemically ageing lubricants with HCl and ethanol on wear and friction. It has been found [43,44] that lubricants’ acid numbers increase in reaction to increased moisture, oil particulates, and operating temperatures. To sum up, it is now crucial to comprehend the significance of oil degradation in terms of tribological performance.
Muniyappa et al. [45] used wear debris and associated morphology as a predictive data source for gear failure. Kattelus et al. [46] proposed particle progression as a promising method for detecting gear-pitting defects. As a measure of gear degradation, Feng et al. [47] proposed the index of particle coverage area (IPCA). Sheng [48] emphasized the connection between lubricant cleanliness and gear life. He reported that temperature and humidity changed slowly with equipment condition, whereas oil deterioration was more severe due to the addition of wear debris, which caused contamination and altered the lubricant’s properties, thereby accelerating wear. Lopez et al. [23] devised a novel in-line sensor based on photonics principles, specifically diffusion and transmittance, to evaluate various lubricant properties such as degradation index, oil oxidation, acid number, etc. This sensor is a potent instrument that provides a precise and real-time measurement of oil deterioration, providing unprecedented insight into lubricant performance.
Although many studies have focused on predicting oil quality [8,48], Rezasoltani and Khonsari [8] studied lubricant degradation from the energy point of view without reporting the related tribological evaluation. Only one study [49] related to the effect of oil deterioration and nano-additive use on gear wear is available in the open literature. Findings from this study highlight the importance of checking the pH of lubricating oil to predict its eventual deterioration. The results additionally illustrate the distinction between gear wear in conventional and deteriorated lubricant settings. A set of online oil and metallic wear debris sensors have been integrated into the gear test system to conduct the tests. This setup allowed for continuous monitoring of gear wear caused by oil breakdown. The effects of acidic lubrication on gear failure were studied in two different scenarios: one in which oil additives were depleted naturally (pH ≅ 6), and another in which lubricant depletion was accelerated by adding aqueous HCl to the oil. In the current study, we consider the entire system as a continuum and show the connection between different levels of analysis. Overall, this study clarifies the importance of measuring pH for predicting lubricant deterioration and increases our understanding of lubricant degradation’s role in gear wear.
2. Experimental Test Setup and Methodology
2.1. Experimental Setup
This study’s experimental setup consisted of a single-stage spur gearbox operated by a DC shunt motor and loaded by a water-cooled eddy current dynamometer (as shown in Figure 1a–d). The gearbox had a reduction ratio of 1.96 and was powered by a 30 kW DC shunt motor managed by a three-phase 440 V/75 A motor controller. Using pulse width modulation (PWM), the motor controller rectified the AC input voltage and controlled the DC voltage applied to the motor. The controller monitors the speed and torque and adjusts the pulse width to maintain the intended speed and torque.
The experimental gearbox consisted of 20° involute spur gears, with a module of 2 mm and a face width of 33 mm, manufactured from EN24 steel with a hardness of 30 ± 2 HRC. The low hardness was deliberately maintained to simulate accelerated wear conditions. Table 1 provides the detailed specification. The water-cooled eddy current dynamometer (E-50 ‘LC’ series) used in this investigation had a torque capacity of 0–75 Nm and a controller that provides a current output of 0 to 3 A.
2.2. Experimental Procedure
The two examinations, “Test 1: 40 Nm, 1200 rpm, 198 h” and “Test 2: 50 Nm, 500 rpm, 90 min”, were carried out separately. Before collecting data, the load was raised by 10 Nm increments every 10 min to meet the test load. An online metallic wear debris sensor and an oil quality sensor suite were connected to collect real-time data on the wear mass loss, quantity of ferrous particles, oil quality, oil temperature, and relative humidity. In addition, a valve mechanism for extracting oil samples for offline measurements was developed.
Test 2 is further divided into two subtests performed as “Test 21: using fresh lubricant” and “Test 22: using artificially degraded lubricant (mixed with aqueous HCl)”. In Test 2, samples of 30 mL were withdrawn every 10 min for offline measurements. For replenishment, a 30 mL new sample with the same properties was brought externally to the sump temperature and then refilled to the sump. The capacity of the sump was 1500 mL, and the 30 mL oil sample extracted for offline analysis represents only 2% of the total sump oil. It was therefore anticipated that this negligible quantity of oil replacement would not result in a significant change. The offline sample was analysed for pH and viscosity within 24 h of collection.
The tests on the lubricity tester and four-ball tester were conducted to evaluate the physiochemical properties of the lubricants as specified in Table 1.
Various sensors for monitoring lubricant degradation and wear debris generation (detailed in Section 2.2) were utilized to acquire real-time data.
2.3. Description of Sensors, Instruments, and Data Processing
- Metallic wear debris sensor: There may be ferrous and non-ferrous debris from the gearbox. A metallic wear debris sensor (AS-19144-KW, shown in Figure 1c) was utilized to measure the ferrous (ranges from 40 µm to 400 µm) and non-ferrous (ranges from 135 µm to 450 µm) particles. The sensor is based on Biot-Savarts’ law and relates the change in magnetic field strength to the size of wear debris. Every minute, the sensor collected 12 samples.
- Oil sensor suite (ANALEXrs): An oil sensor suite (Figure 1d) was utilized to measure total ferrous wear debris, oil degradation, and lubricant temperature. The oil degradation was evaluated according to the oil quality index (OQI) (1–100) indicated by the sensor, which operates on the principle of variation in dielectric constant. The sensor consists of a polymer coating that absorbs moisture and the change in dielectric constant and provides a percentage of the oil’s moisture content and the lubricant’s TAN value. Therefore, the oil quality index is a function of oil TAN, and oil degradation, represented by moisture. Every minute, the sensor collected one sample.
- pH-measuring instrument: The 916 Ti-touch variant of Metrohm, with a measuring range of −13 to +20 pH, 0.001 pH resolution, and 0.003 pH accuracy, was utilized.
- Rheometer: The oil viscosity was measured at a shear rate of 100 s−1 using an MCR 102 rheometer (torque up to 200 nNm, temperature range from −5 to 200 °C).
- Centrifuge: To isolate particles, a REMI CPR-24 plus centrifuge (maximum 7000 rpm) was utilized. After draining the oil and rinsing it with ethanol to remove the oil layer, particles were collected.
- Four ball wear tester: Using Ducom FBT-2, the anti-wear and EP (extreme pressure) effectiveness of lubricating lubricants were evaluated. The anti-wear performance was evaluated by conducting four-ball wear experiments at a temperature of 75 °C and a load of 392 N for sixty minutes. The extreme pressure performance was evaluated by performing four-ball EP experiments at 1760 rpm for 10 s at temperatures ranging from 18 to 35 °C in accordance with the ASTM D2783 standard. In addition, the IP-239 standard was used to affirm extreme pressure performance at 1450 rpm for 60 s at a room temperature of 27 ± 2 °C.
- Lubricity tester: This instrument is developed by Ducom Instruments, an Indian company. By simulating line contact between two surfaces, the anti-wear and friction qualities were assessed; the experimental setup utilized a block-on-disk configuration. The system was composed of a stationary disc and a block that moved back and forth over the disc’s surface, causing friction between the two surfaces. A counter surface in the form of a disc with a diameter of 40 mm and a breadth of 15 mm was utilized, and the test surface was a block with dimensions of 12 mm by 12 mm by 12 mm. The test was performed using the test block at a temperature of 40 ± 2 °C, a rotating speed of 100 rpm, and a dead weight of 12.86 kg. Every test was performed twice. Every five minutes, manual friction readings were obtained, and at the end of the experiment, wear loss was calculated using a weight balance with a minimum count of 10 µg.
- ATR-FTIR: Thermo-scientific instruments FTIR Nicolet iS50 were used for lubricant oil ATR investigations. The instrument has a resolution of 0.09 cm−1 and a scanning range of 400–4000 cm−1 for measuring absorbance and transmittance. The scan rate was maintained at 64 for improved resolution.
- Data smoothening: In this study, the data collected from various online sensors, such as the metallic wear debris sensor, oil sensor suite, and offline ATR-FTIR, were smoothed using the ‘Savitzky Golay’ method of a second-degree polynomial because it provides a good balance between capturing the overall trend and removing high-frequency noise. This method resulted in smoother data trends, allowing for more accurate analysis and interpretation of the results.
2.4. Comprehensive Framework of the Study
Lubricants are tested on a wide range of scales using a wide range of test rigs and instruments. In the present study, macro-level wear evaluation of materials and lubricants was performed using a gear test rig to mimic actual working circumstances and attaching multiple instruments to the test apparatus to monitor wear and lubricant degradation in real time.
The lubricant’s microscale lubricating qualities were evaluated with a lubricity tester. The tester measured the frictional force between a block and a rotating disk. The lubricant’s performance was measured by evaluating friction and measuring wear loss.
Microscopically, the lubricant’s extreme pressure and anti-wear characteristics were tested using a four-ball tester. This instrument tests the lubricant’s load-carrying capacity using ultra-high finish balls. The test measures the lubricant’s resistance to deterioration under extreme conditions. Furthermore, anti-wear experiments were executed to assess the lubricant’s wear performance.
The properties of the lubricant and the generated wear debris can be investigated using a number of different characterization methods at the nanoscale. The present study analyzed the generated wear debris and lubricant degradation using a scanning electron microscope (SEM) and attenuated total reflection-Fourier transform infrared spectroscopy (ATR-FTIR).
Figure 2 depicts the complete architecture of the lubricant tribological investigation. The framework incorporates macro, micro, and nanoscale investigations to provide a comprehensive understanding of the behavior of lubricants under different operating conditions. The framework enables a more accurate and realistic assessment of lubricants’ tribological properties, which is essential for optimizing their performance in engineering applications.
3. Results and Discussions
3.1. Test 1
Test 1 was conducted with the commercially available gear lubricant grade API GL-4 SAE 90 (Oil 1: O1) at a constant speed of 1200 rpm and torque of 40 Nm for 198 h. The lubricant contained additives for extreme pressure, antirust agents, and corrosion inhibitors. During the investigation, online data were collected for both wear debris and oil degradation. The wear debris was analyzed to determine the extent of gear wear, whereas the oil degradation was evaluated to determine the lubricant’s performance under test conditions.
3.1.1. Test 1: Online Lubricant Analysis
The variation of three critical parameters, namely oil quality index, oil temperature, and relative humidity, was investigated during experimental analysis. Figure 3a–c depicts the variation and illustrates the trends and patterns of change.
Figure 3a depicts the variation of the oil quality index, which indicates a general upward trend with increasing operating duration. However, the increase was not uniform, and a more rapid increase was observed toward the end of the experiment. This trend affirms the decline in oil quality (e.g., oil quality declined as the quantity rose from zero to fifty), which can be attributed to several factors, including contamination, oxidation, and thermal degradation.
The variation in oil temperature over time is depicted in Figure 3b, which demonstrates an upward trend. This observation can be analyzed in the context of increased oil deterioration, as shown in Figure 3a, which resulted in a decrease in the formation of lubricating film at the interfaces that led to increased metal-to-metal contact, which can contribute to an increase in heat production at the contacting surfaces. Such contact conditions accelerated the wear of contacting surfaces. The phenomenon further catalyzed the oil deterioration and increased temperature and vice versa.
Figure 3c illustrates the variation of relative humidity, which decreased slightly as the temperature rose. This trend can be attributed to the water-holding capacity of the lubricant, which increases as the temperature increases.
3.1.2. Test 1: Online Wear Debris Analysis
The concentration of ferrous particles illustrated a rising tendency, as shown in Figure 4. There appeared to be a lot of metal-on-metal contact. The failure of the lubricant oil to create a thick enough film on the contacting surfaces was likely to blame for this phenomenon. The presence of wear particles can further enhance wear, deteriorate contacting surfaces, and decrease the lubricant quality.
3.2. Lubricant Artificial Degradation, Physicochemical and Tribological Performance Evaluation
According to the data collected from Test 1, wear increased constantly, and there was no sign of running-in wear. To further understand the wear behavior, two separate tests were performed. In the first set of tests, the physicochemical (extreme pressure performance) and tribological properties (anti-wear) were evaluated for two commercially available gear lubricants of grade API GL-4 SAE 90 (Oil 1: O1) and API GL-4 EP 90 Oil 2 (O21: “Pack 1, March 2022” and O22: “Pack 2, January 2017”). To accelerate the chemical aging process [49,50], 0.0025 v/v% aqueous HCl was added to each of the three oils (O1, O21, and O22). Since intentionally aging lubricants with 100% hydrochloric acid (HCl) can be challenging, a concentration of HCl of 36.46% was used instead. Given the low concentration of HCl, the water content of the solution is highly unlikely to go above the maximum allowable value for moisture content in lubricating oil (0.2% or 100 ppm [12]). The rise in moisture would be minimal at just 0.0015885%. Each of the six lubricating oils was tested for its TAN, TBN, and pH. Furthermore, the tribological characteristics of all the lubricants were assessed using the Ducom FBT-2 four-ball wear tester. In the second set of experiments, both fresh and chemically degraded API GL-4 EP 90 gear lubricants were subjected to accelerated testing on a gear test apparatus at 500 rpm, 50 Nm, and 90 min.
3.2.1. Artificial Lubricant Aging
The lubricant was artificially degraded by adding the aqueous HCl in the lubricant, as proposed in reference [49]. Different concentrations of aqueous HCl were added to the lubricant, ranging from 0.0005% v/v% to 0.0025% v/v%. To determine the effect of aqueous HCl, the pH value and ATR-FTIR spectrum were obtained. Mixing aqueous HCl led to the formation of carboxylic oxide (1720–1732 cm−1), an increase in moisture content (3410 cm−1), and the degradation of anti-wear compounds (723 cm−1). The pH value represents acidic compound formation in the lubricant; acidic compound formation resulted in an increase in TAN and a decrease in pH value. Table 2 displays the pH values and peak absorbance intensities between 723 and 1720 cm−1. Figure 5 depicts the ATR-FTIR for the various aqueous HCl concentrations in the lubricant. Figure 6 shows the logarithmic fit between the absorbance intensity and the pH value for the corresponding absorbance peak at about 723 and 1720 cm−1. The logarithmic fit was chosen according to the LibreTexts organization (University of California) [51], which states that the pH scale follows the logarithmic fit. The logarithmic fit equation corresponding to the 723 cm−1 is as follows:
The logarithmic fit equation corresponding to 1720 cm−1:
3.2.2. Physicochemical and Tribological Evaluation
Physicochemical Properties of Oil
The chemical analysis of oil samples is essential for comprehending the quality and composition of the oil. The Total Acid Number (TAN: measurement of acidity) and Total Base Number (TBN: measurement of alkalinity) are commonly measured parameters, but pH values were also considered in the present study. Based on the TAN, TBN, and pH values reported in Table 3 for the oils, the following conclusions can be drawn:
- The TAN value was low in fresh oil, indicating a low concentration of acidic components, whereas the TBN value was high, indicating a high concentration of basic components. As oil deteriorated over time, the TAN value increased as the acidic components of the oil increased, whereas the TBN value decreased as the basic components of the oil decreased.
- The addition of a minute amount of acid to oil samples accelerated degradation. As predicted, the TAN value rose, and the TBN value fell. Acid caused the oil to degrade more rapidly, resulting in the formation of more acidic components and the consumption of basic components.
- Comparing the O22 and O21 samples, it was observed that the TAN values were higher in O22, indicating that the oil had degraded more than in O21.
- The pH values of all oil samples followed a similar pattern, which was to be expected given that pH is a measure of the acidity or basicity of the oil. The pH decreased as the oil degraded and became more acidic.
Using ATR-FTIR analysis, the chemical decomposition of the lubricant oil was determined. The peaks at 2920 cm−1 and 723 cm−1 in the ATR-FTIR analysis data reveal the hydrocarbon chains present in the base oil. The peaks at 1050 and 1090 cm−1 indicate the presence of C=C double bonds. The peak at 879 cm−1 indicates the presence of aromatic groups. As illustrated in Figure 7, the presence of absorption peaks at 1720 cm−1 in the acquired ATR-FTIR spectra indicates the formation of oxidative products such as carboxylic acids, esters, and ketones. Upon the formation of the acidic component and water, the pH decreased. The decrease in pH was supported by the rise in peak height around 1720 cm−1. As indicated by the base shift at 2000 cm−1, the addition of acid led to sedimentation. The absorption peak at 3410 cm−1 indicates that the lubricant contained water. In addition, the inclusion of aqueous HCl increased the lubricant’s water content marginally, as indicated by the enhancement of the absorption peak at 3410 cm−1.
The absorbance peaks at 723 and 1720 cm−1 were determined (see Table 3), and Equations (1) and (2) were used to verify and measure the pH value, respectively. The calculated pH values were in close proximity, with an average deviation of ~8% for Equation (1) and ~6% for Equation (2). Therefore, the ATR-FTIR spectrum is a valuable tool for calculating the pH value of lubricating oil.
Tribological Evaluation (Anti-Wear and Extreme Pressure Performance):
Figure 8a [52] illustrates the anti-wear performance variation of two lubricants, oil 1: O1 and oil 2: O21 (March 2022), under normal and aqueous hydrochloric acid (HCl) contaminated conditions. In the presence of an acid, the anti-wear properties of both lubricants diminished. The anti-wear effectiveness of O1 and O21 decreased by 33% and 22%, respectively, when mixed with aqueous HCl. However, a distinct decrease in anti-wear performance was observed in the oils as a result of acid manipulation. Figure 7 confirms that acid reacted with additives to form carboxylic acids, esters, ketones, and aromatic products, thereby modifying their chemical structure or concentration and reducing their ability to prevent wear of tribo-surfaces.
The load-carrying capacity of lubricants decreased by up to 20% due to the aqueous HCl doping-induced artificial aging of the lubricants, as shown in Figure 8b [52]. Both lubricants showed distinct variations in anti-wear performance but a similar (equal magnitude) decrease in load-carrying capacity. The reduced load capacity of the degraded surfaces is one explanation for such a decline. However, the direct interaction of extreme pressure additives with surfaces, according to Spikes [53], results in the formation of a masking layer, which increases the load-bearing capacity [54,55,56]. Because aqueous HCl forms a corrosive layer, it can be used as an extreme pressure additive masking shield, especially under extreme loads. In other words, HCl forms a corrosive layer that increases wear while decreasing friction and possibly improving surface load-bearing capacity. Additional experiments were planned in light of these considerations.
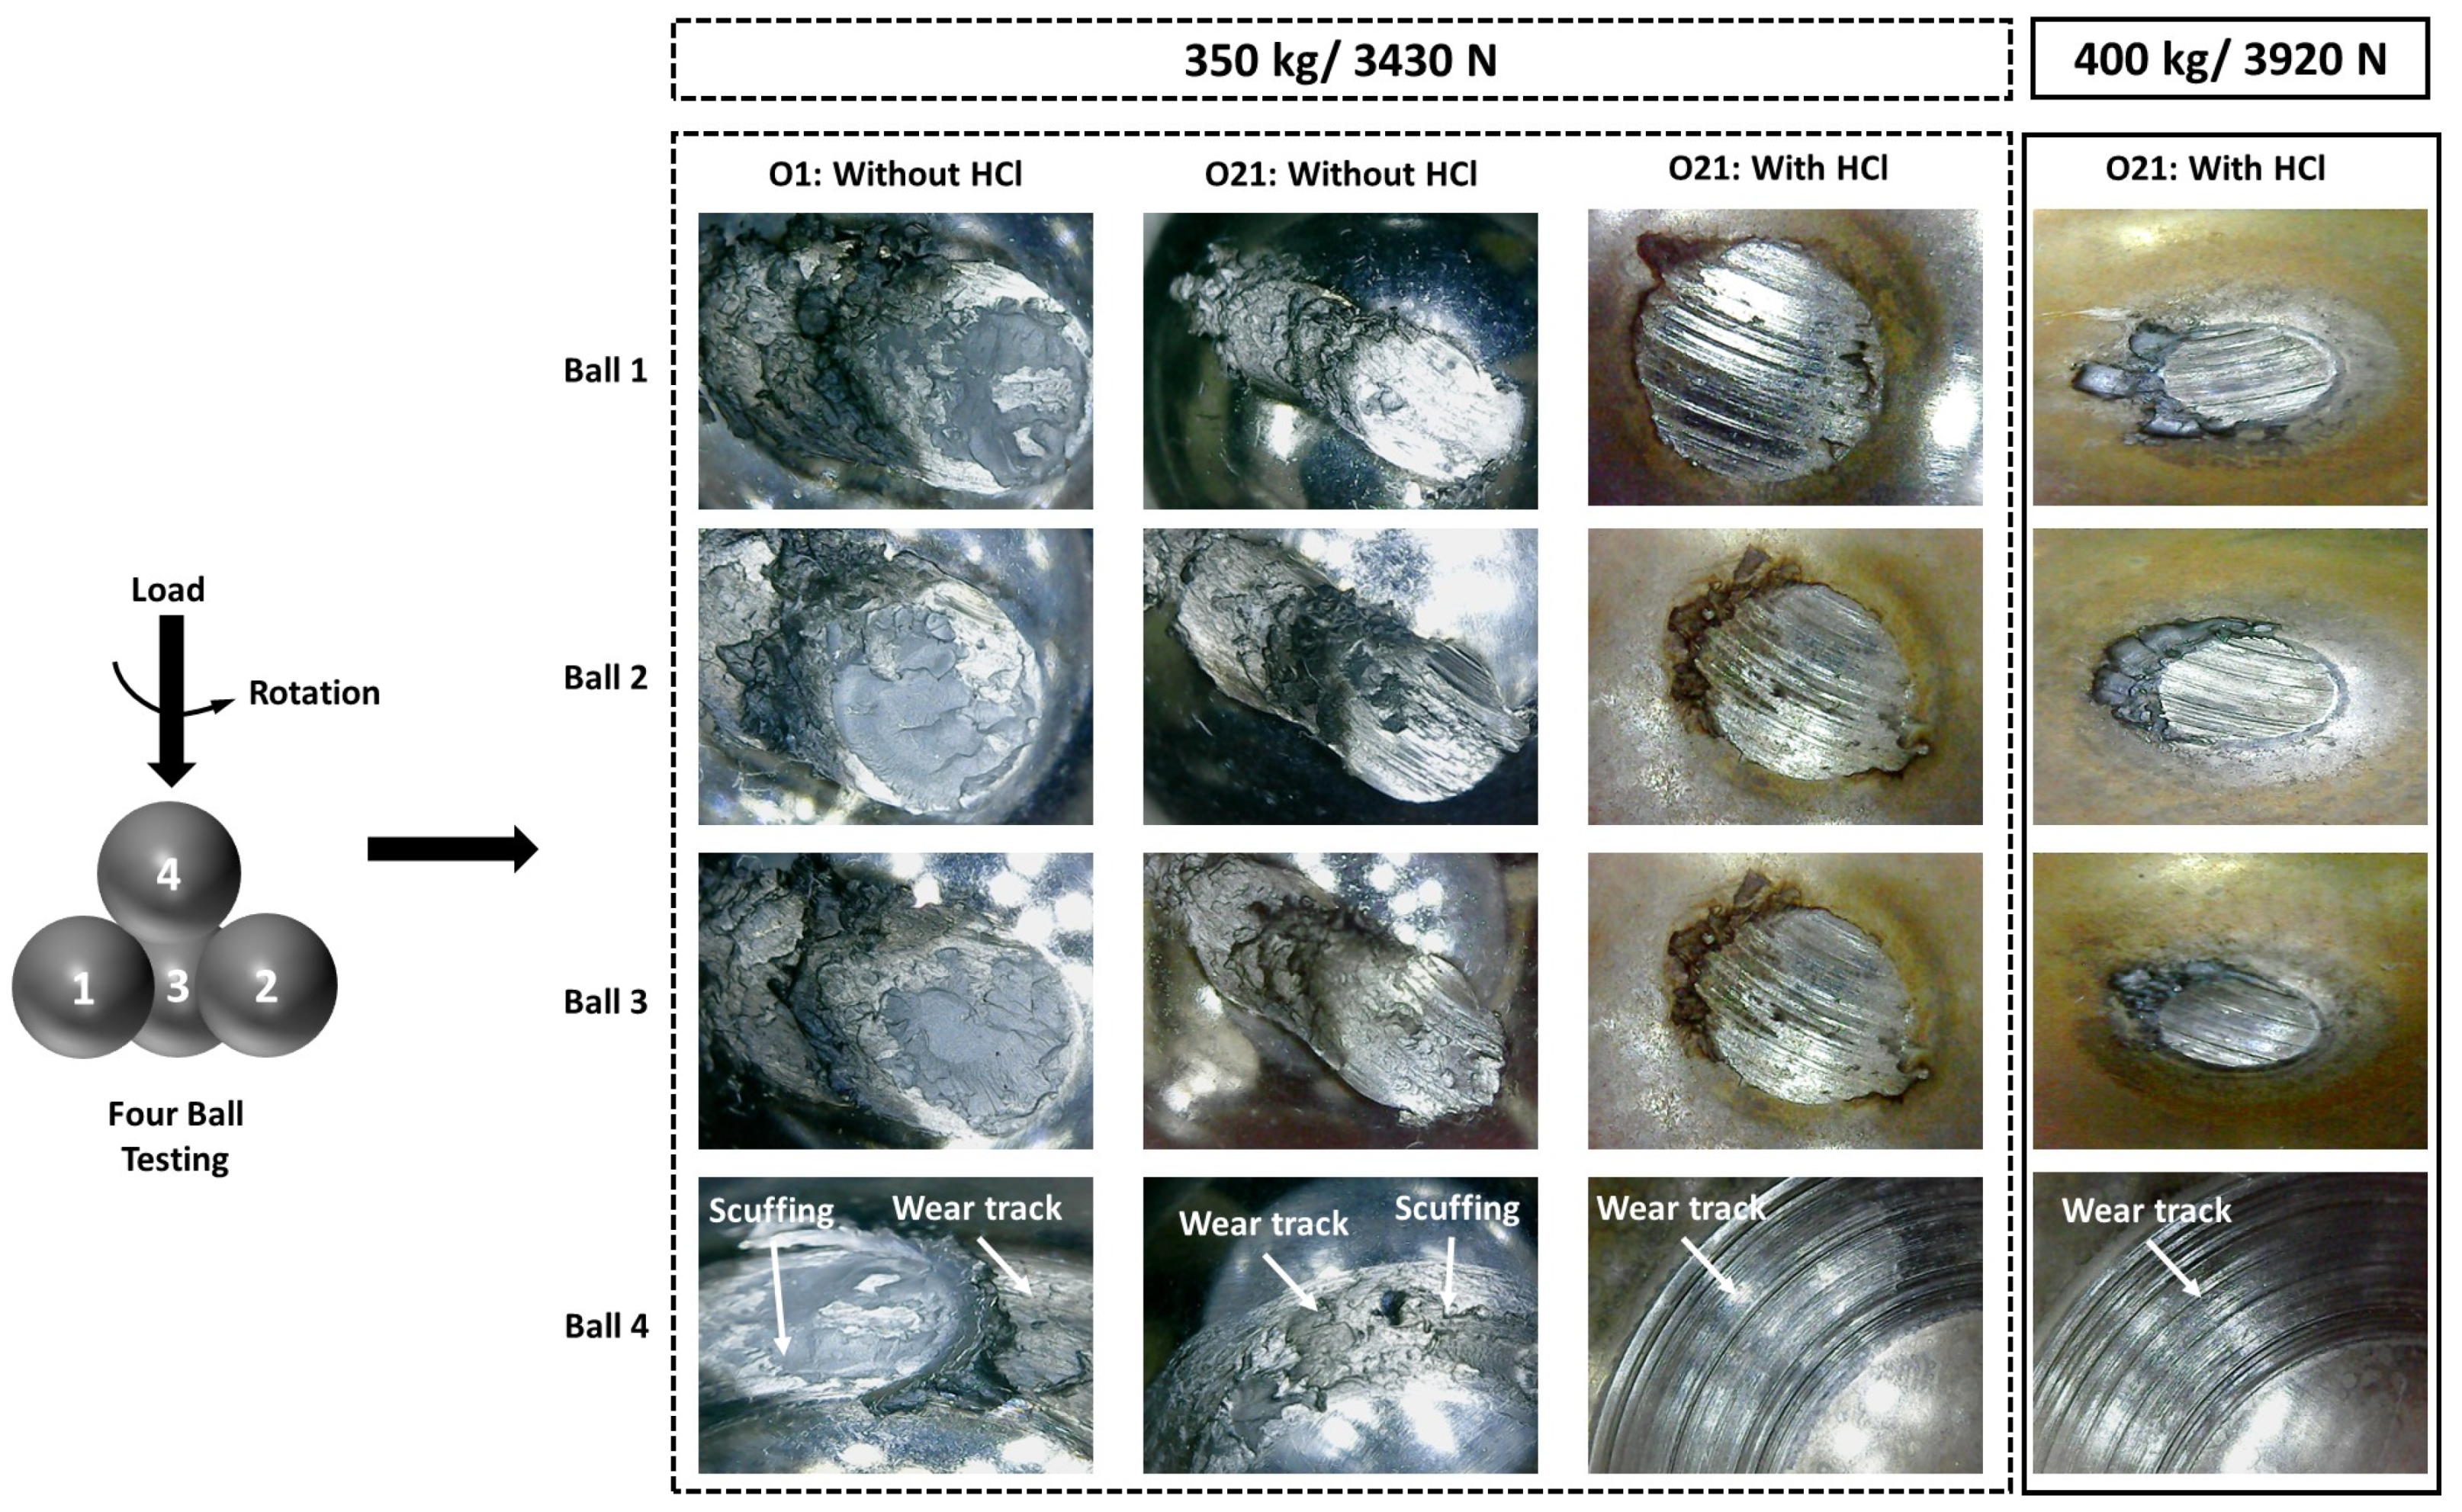
Additional tests were carried out in accordance with the IP-239 standard rather than ASTM D2783. The ASTM D2783 test time of 10 s may not be long enough to develop a fully matured oxide layer. Increased rotational speed and relatively low temperature may not be enough to produce extreme pressure conditions. As a result, the IP-239 standard was followed during the validation tests. Each load condition was put through two tests. The first three balls, as shown in Figure 9, remained stationary, while the fourth rotated.
The extreme pressure test results shown in Figure 9 indicate that oil 1 (O1) and oil 2 (O21) had a load-carrying capacity of 3430 N. According to Figure 9, at 3430 N, material surface seizure occurred under both oil O1 and oil O21. When O21 was mixed with aqueous HCl, the load-carrying capacity increased, and no major damage was observed, even at 3920 N. Furthermore, as the load (3920 N) for the aqueous HCl mixed lubricant increased, so did the wear scar diameter. The scar diameter limit is 4mm according to the IP-239 standard, so the test was terminated based on the limits and accuracy of ±5%. Based on these results, the weld loads with and without HCl doping were 3920 N and 3430 N, respectively. The observed anomaly in Figure 8b result was caused by aqueous HCl reacting with both the oil and the interacting surfaces, possibly forming an oxide layer on the interacting surfaces. This oxide layer served as a masking layer, allowing for greater load-carrying capacity. So, it can be concluded that the with mixing the aqueous HCl increased the load-carrying capacity.
The anti-wear properties of a lubricant were evaluated using a lubricity tester (see Figure 10) (Ducom Instruments, India) that employed a block-on-disk configuration. This experimental setup allowed for the simulation of line contact between two surfaces, as discussed in detail in Section 2.2 (g).
The results of the experiment indicate that the lubricant mixed with aqueous HCl lost ~50% more mass than the lubricant without the aqueous HCl mix. Specifically, the lost mass measured for the lubricant without aqueous HCl was 40 ± 10 µg, and for the lubricant with aqueous HCl, the value was 60 ± 10 µg. The experiments were repeated thrice. These results indicate that the presence of aqueous HCl in the lubricant oil has a detrimental effect on its anti-wear properties, resulting in an increase in the mass loss of the lubricated surfaces. The observed increase in mass loss may be attributable to the corrosive properties of HCl, which can lead to surface degradation and wear.
In addition, the measured coefficient of friction variation for both experiments is depicted in Figure 11, from which it can be concluded that the coefficient of friction decreased by ~75%. This evident decrease in the mean value was majorly caused by the formation of oxides and possibly thinning of the lubricant due to the addition of aqueous HCl. The oxide creates a layer on the surface, improving anti-friction characteristics, as described in the references [53,54].
3.3. Test 2
3.3.1. Online and Offline Lubricant Analysis
In Figure 12a, the initial value of the oil quality index is high, followed by a decreasing trend in both experiments. The oil quality index is determined by a number of variables, including water ingress, total acid number (TAN), and viscosity variations. Nonetheless, the sensor suite’s measured oil quality index values do not provide a distinct indication of oil degradation. The ATR-FTIR analysis of the used oil confirmed the depletion of the lubricant.
Figure 12b shows an increasing trend in temperature. This could be due to the absorption of the contact temperature by the gear lubricant oil. The temperature rise can also contribute to the degradation of the oil quality, causing changes in viscosity, acidity, and other properties.
Furthermore, Figure 12c shows that the relative humidity increased in the absence of an aqueous HCl mix, whereas it saturated to a value of 100% for the aqueous HCL mix test. This saturated value indicates that any further addition of water would be free and form an emulsion in the lubricant. However, the sensor readings still indicate an improvement in the oil quality index.
The addition of 0.0025% v/v aqueous HCl to the lubricant resulted in a 0.0015885% increase in the water level. Nonetheless, this increase is within the acceptable range. Analysis of ATR-FTIR spectra revealed that the absorbance peak intensity for 0.0015885 percent of the water level was 0.00521. In addition, the mechanical degradation of the oil combined with aqueous HCl caused the ATR-FTIR peak intensity to increase to 0.00747. Using a linear relationship, the percentage of water was calculated to be 0.0022775%, which is nearly 100-times lower than the acceptable limit of 0.2%.
The combined analysis of Figure 12a–c indicates that the sensor suite alone is not sufficient to accurately assess the quality of lubricant oil. To obtain a more precise evaluation of oil degradation, additional offline studies such as viscosity and pH measurements are required.
In this experiment, lubricating oil samples were periodically taken every 10 min to track alterations in the oil’s pH and viscosity. As shown in Table 4, the pH values for both Test 21 (fresh lubricant) and Test 22 (artificially aged lubricant) decreased over time. In particular, after operating for 90 min, Test 21’s pH value dropped from 5.86 to 4.98, while Test 22’s pH value dropped from 1.55 to −2.28 at that same time. Both normal and chemically degraded oil underwent an overall shift of 15.01% and 247.1%.
In addition, Table 4 demonstrates that Test 21 and Test 22’s kinematic viscosity dropped over time. After 90 min of activity, the kinematic viscosity value for Test 21 dropped from 134.78 cSt to 91.80 cSt, while the value for Test 22 dropped from 127.60 cSt to 90.64 cSt in the same timeframe. Both normal and chemically degraded oil underwent an overall shift of 31.88% and 28.96%, respectively. These results indicate that lubricants, whether natural or artificially aged, experience a decrease in pH and viscosity over time, which may have an influence on how well they lubricate machinery. Both pH and viscosity are crucial for lubricating oil health monitoring. A decrease in pH or viscosity may suggest acidic contaminants or lubricant breakdown due to mechanical shearing or wear debris mixing.
ATR-FTIR analysis was conducted to corroborate the deterioration of the lubricant oil. As shown in Figure 13a, when aqueous HCl was added to the lubricating oil, observable changes occurred, including a color change and the formation of an emulsion. In addition, mechanical deterioration caused the mingling of wear particles. The ATR-FTIR absorbance spectra of fresh oil, fresh oil mixed with 0.0025% v/v HCl, oil sample from experiment 1 (‘Test 21’: the lubricant used without HCl), and oil sample from experiment 2 (‘Test 22’: the lubricant used with aqueous HCl) are shown in Figure 13b. High-intensity peaks were observed at 723 cm−1 and 2920 cm−1 for all samples. The value of the peaks at 2920 cm−1 decreased due to chemical and mechanical degradation. In contrast, the peak at 1720 cm−1 indicates the formation of oxidation products including carboxylic acids, esters, and ketones. The observation of a prominent peak at 3410 cm−1 confirms the formation of water during both chemical and mechanical degradation, as it indicates the formation of water. This peak was absent from the sample of fresh oil. In addition, under mechanical degradation of the lubricant, new compounds such as aromatics (879 cm−1) and sulphates (1050 and 1090 cm−1) were produced that were not present in the fresh oil. These depict the degradation of the lubricant oil’s base additives. The change in baseline at 2000 cm−1 indicates the formation of sludge as a result of both categories of degradation.
3.3.2. Online and Offline Wear Debris Analysis
Figure 14a,b displays the variation in ferrous particle concentration (Fe PPM) for lubricating oil samples obtained from both tests, one without the inclusion of aqueous hydrochloric acid (Test 21) and the other with the addition of aqueous hydrochloric acid mixed (Test 22) in the oil. In both experiments, the Fe PPM values exhibited an increasing trend. In Test 22, the Fe PPM was approximately fourfold that of Test 21.
In addition, Figure 14c depicts an increase in wear mass per hour, which increased from ~66,769 µg to ~73,969 µg when measured with the online sensor. The analysis of wear particles extracted from the oil samples using a mechanical centrifuge at 7000 rpm further supported this conclusion. The measured values for Test 21 were ~138,400 µg, and Test 22 measured ~322,400 µg. Curiously, the wear particle mass measured by the wear debris sensor was significantly less than the actual wear debris mass. This could be due to a number of factors, including the sensor’s inability to detect finer particles, particles adhering to the surface of the sensor flow channel or other components in the lubrication system, or the presence of other contaminants in the oil that impeded the sensor’s accuracy. These results illustrate the constraints of wear debris sensors.
For the SEM analysis, the wear particles extracted from both samples were processed. Figure 15a,b displays SEM images of wear particles. It is evident from the particle images that the size of the wear particles extracted from Test 22 was significantly larger than the size of the wear particles extracted from Test 21. In Test 21, particle size ranged from ~5 to 20 µm, whereas in Test 22, particle size ranged from ~100 to 450 µm. Therefore, the oil degradation accelerated the wear of the gears. The results of the SEM analysis of the wear particles extracted from both experiments indicate that their size distribution differed significantly. In the first test, wear particles had a size range of approximately 5 to 20 µm, whereas in the second test, the size range was significantly larger, ranging from approximately 100 to 450 µm. The observed increase in the size of wear particles extracted from Test 22 can be attributed to the deterioration of the lubricant, which caused the gears to wear more quickly. Overall, the results of the SEM analysis of wear particles indicate that oil degradation can substantially accelerate gear wear, resulting in the production of larger wear particles.
Discrepancies were observed when comparing the results of online sensors and offline analysis for Fe PPM, oil quality, and humidity. The ATR-FTIR analysis indicates that the lubricant was degrading, whereas the online sensor suite evidence demonstrates that the lubricant was improving in quality. In addition, a slight increase in moisture value following the addition of aqueous HCl and mechanical degradation was observed in the results of ATR-FTIR, but the online sensor indicated 100% relative humidity. In addition, the online sensor array measured three to four times less wear mass than the offline measurement. Given the preceding observations, there are possible explanations for this anomaly. The sedimentation rate of wear particles in the sump or channel could have been faster than the online sensor’s sampling rate. The humidity sensor’s polymeric coating may have become damaged or water-saturated, necessitating recalibration or replacement.
The aforementioned study confirms that wear and lubricant degradation are closely related. By forming an oxide layer, the degradation of the lubricant at the molecular level increases the load-carrying capacity but adversely influences the wear performance. The degradation behavior at both the macro and micro scales exhibited the same trend. The nanoscale study, which represented the deterioration of the oil and the effective change in particulate size, also revealed that nanoscale variations are responsible for the increased wear. The tribological study of lubricants at the molecular scale also confirmed that wear and lubricant degradation are closely related.
The same trend has been observed for wear at both the macro and microscales, indicating that the efficacy of the lubricant is consistent across multiple length scales. This consistency suggests that the lubricant’s performance can be precisely predicted on the basis of its behavior at various scales.
Studies at the nanoscale have demonstrated that oil deterioration observed at the nanoscale is accountable for effective particle size changes and the increased wear observed at the macroscale.
To enhance the present framework, a thorough, exhaustive study on the coupling of digital and physical systems is required to create a digital twin model. Future research will necessitate the construction of a digital twin of the gear test bench [57] and the simulation of friction and wear behavior on pin-on-disk [58] for establishing, calibrating, diagnosing, predicting, and taking into consideration various length scales, etc.
4. Conclusions
The present study investigated the influence of oil degradation on gear failure, and the following conclusions were drawn:
- In both tests studied in the present paper, ferrous particle content increased with no run-in stage of wear.
- The gear oil used had an adequate TAN value but low pH (acidic).
- Lubricant oil chemical aging lowered the pH from 5.742 to 4.786 and the TAN from 0.08 to 0.12. ATR-FTIR research has shown additive depletion, lubricant oxidation products, and water formation.
- A logarithmic relation between the pH value and ATR-FTIR absorbance intensity corresponding to the 723 and 1720 cm−1 was derived, which depicts the oxide formation and anti-wear additive depletion. The derived equations predict the pH value with an approximate deviation of ~8%.
- The formation of oxide layers, under aqueous HCl doped lubricant, on the interacting surfaces was responsible for the rise in weld load. This layer also acted as a friction modifier.
- The online oil quality sensor did not accurately reflect oil degradation because oil degrades in response to a decrease in pH value and oil viscosity, but the sensor did indicate an improvement in oil quality over time.
- The wear debris monitoring sensor did not show a significant rise in wear debris mass, but the extracted wear debris mass was ~2.32 times higher for Test 22 (with aqueous HCl mix) than Test 21 (without mix) in Test 2.
- ATR-FTIR analysis showed that adding aqueous HCl to lubricating oil and running it in the gear test rig increased water (3410 cm−1) and oxidation components (1050, 1090, and 1720 cm−1), and decreased base additive (2920 cm−1).
- The wear particle size for Test 22 was significantly larger than Test 21.
Conclusively, ATR-FTIR is a well-established method for predicting oil deterioration, but it is offline and costly. On the other hand, pH monitoring can be performed online and in a cost-effective way. The predicted correlation between ATR-FTIR analysis confirms the effectiveness of measuring the pH value. So, pH monitoring may be a more accurate indicator of oil degradation. To corroborate offline observations, online sensors must be developed further. The study of lubricants’ tribology provides valuable insights into the relationship between wear and lubricant degradation in general. By comprehending the behavior of lubricants at multiple length scales, it is possible to design lubricants with optimal performance and durability for real-world applications. Understanding the behavior of lubricants on the smallest scales and optimizing their performance accordingly necessitates the application of sophisticated nanoscale characterization techniques.
Author Contributions
Conceptualization, H.H.; methodology, H.H.; resources, H.H.; supervision, H.H.; writing—editing of the manuscript H.H., D.J. and K.N.S.; data curation, D.J. and K.N.S.; formal analysis, D.J. and K.N.S.; writing—original draft preparation, D.J. and K.N.S. All authors have read and agreed to the published version of the manuscript.
Funding
This research is not funded by any agency.
Data Availability Statement
Data can be shared on request.
Acknowledgments
Tarunendra Singh and Nikhil Kumar of R&D Centre, Bharat Petroleum Co., Ltd., Mumbai, Mumbai-400001, India, for conducting the tribological anti-wear and weld load tests provided in Figure 8 of the manuscript. We also acknowledge the support provided by V. B. Satpathy during the experimentation.
Conflicts of Interest
The authors declare no conflict of interest.
References
- Hirani, H.; Athre, K.; Biswas, S. Comprehensive design methodology for an engine journal bearing. Proc. Inst. Mech. Eng. Part J J. Eng. Tribol. 2000, 214, 401–412. [Google Scholar] [CrossRef]
- ANSI/AGMA 9005-F16. Industrial Gear Lubrication. 2016. Available online: https://www.scribd.com/document/527146091/Ansi-Agma-9005-f16-Gear-Oils (accessed on 10 December 2022).
- Gosvami, N.N.; Bares, J.A.; Mangolini, F.; Konicek, A.R.; Yablon, D.G.; Carpick, R.W. Mechanisms of antiwear tribofilm growth revealed in situ by single-asperity sliding contacts. Science 2015, 348, 102–106. [Google Scholar] [CrossRef] [PubMed]
- Minami, I. Molecular Science of Lubricant Additives. Appl. Sci. 2017, 7, 445. [Google Scholar] [CrossRef]
- Naveed, T.; Zahid, R.; Mufti, R.A.; Waqas, M.; Hanif, M.T. A review on tribological performance of ionic liquids as additives to bio lubricants. Proc. Inst. Mech. Eng. Part J J. Eng. Tribol. 2021, 235, 1782–1806. [Google Scholar] [CrossRef]
- Bhaumik, S.; Kamaraj, M.; Paleu, V. Tribological analyses of a new optimized gearbox biodegradable lubricant blended with reduced graphene oxide nanoparticles. Proc. Inst. Mech. Eng. Part J J. Eng. Tribol. 2020, 235, 901–915. [Google Scholar] [CrossRef]
- Ribeiro, F.C.; Oliveira, A.S.; Araújo, A.S.; Marinho, W.; Schneider, M.P.; Pinto, L.; Gomes, A.D.A. Detection oxidative degradation in lubricating oil under storage conditions using digital images and chemometrics. Microchem. J. 2019, 147, 622–627. [Google Scholar] [CrossRef]
- Rezasoltani, A.; Khonsari, M. Experimental investigation of the chemical degradation of lubricating grease from an energy point of view. Tribol. Int. 2019, 137, 289–302. [Google Scholar] [CrossRef]
- Hirani, H.; Athre, K.; Biswas, S. Lubricant Shear Thinning Analysis of Engine Journal Bearings. Tribol. Trans. 2001, 44, 125–131. [Google Scholar] [CrossRef]
- Singh, A.; Gandra, R.T.; Schneider, E.W.; Biswas, S.K. Lubricant Degradation and Related Wear of a Steel Pin in Lubricated Sliding Against a Steel Disc. ACS Appl. Mater. Interfaces 2011, 3, 2512–2521. [Google Scholar] [CrossRef]
- Zzeyani, S.; Mikou, M.; Naja, J.; Elachhab, A. Spectroscopic analysis of synthetic lubricating oil. Tribol. Int. 2017, 114, 27–32. [Google Scholar] [CrossRef]
- Cantley, R.E. The Effect of Water in Lubricating Oil on Bearing Fatigue Life. ASLE Trans. 1977, 20, 244–248. [Google Scholar] [CrossRef]
- Ebersbach, S.; Peng, Z.; Kessissoglou, N. The investigation of the condition and faults of a spur gearbox using vibration and wear debris analysis techniques. Wear 2006, 260, 16–24. [Google Scholar] [CrossRef]
- Tan, C.K.; Irving, P.; Mba, D. A comparative experimental study on the diagnostic and prognostic capabilities of acoustics emission, vibration and spectrometric oil analysis for spur gears. Mech. Syst. Signal Process. 2007, 21, 208–233. [Google Scholar] [CrossRef]
- Loutas, T.; Roulias, D.; Pauly, E.; Kostopoulos, V. The combined use of vibration, acoustic emission and oil debris on-line monitoring towards a more effective condition monitoring of rotating machinery. Mech. Syst. Signal Process. 2011, 25, 1339–1352. [Google Scholar] [CrossRef]
- Dempsey, P.J. Integrating Oil Debris and Vibration Measurements for Intelligent Machine Health Monitoring. Ph.D. Thesis, The University of Toledo, Toledo, OH, USA, 2002. [Google Scholar]
- El-Naggar, A.; El-Adly, R.A.; Altalhi, T.A.; Alhadhrami, A.; Modather, F.; Ebiad, M.A.; Salem, A. Oxidation stability of lubricating base oils. Pet. Sci. Technol. 2017, 36, 179–185. [Google Scholar] [CrossRef]
- Jain, M.R.; Sawant, R.; Paulmer, R.; Ganguli, D.; Vasudev, G. Evaluation of thermo-oxidative characteristics of gear oils by different techniques: Effect of antioxidant chemistry. Thermochim. Acta 2005, 435, 172–175. [Google Scholar] [CrossRef]
- Jihua, C.; Shaojun, L.; Xiaozhou, H. A temperature measurement method for testing lubrication system or revealing scuffing failure mechanism of spur gear. Proc. Inst. Mech. Eng. Part J J. Eng. Tribol. 2018, 233, 831–840. [Google Scholar] [CrossRef]
- Evans, H.; Snidle, R. Duncan Dowson: Pioneer of elastohydrodynamic lubrication of gears. Proc. Inst. Mech. Eng. Part J J. Eng. Tribol. 2021, 235, 2592–2603. [Google Scholar] [CrossRef]
- Peng, Q.; Zhou, C.; Gui, L.; Fan, Z. Investigation of the lubrication system in a vehicle axle: Numerical model and experimental validation. Proc. Inst. Mech. Eng. Part D J. Automob. Eng. 2018, 233, 1232–1244. [Google Scholar] [CrossRef]
- Inturi, V.; Sabareesh, G.; Supradeepan, K.; Penumakala, P. Integrated condition monitoring scheme for bearing fault diagnosis of a wind turbine gearbox. J. Vib. Control 2019, 25, 1852–1865. [Google Scholar] [CrossRef]
- Lopez, P.; Mabe, J.; Miró, G.; Etxeberria, L. Low Cost Photonic Sensor for in-Line Oil Quality Monitoring: Methodological Development Process towards Uncertainty Mitigation. Sensors 2018, 18, 2015. [Google Scholar] [CrossRef] [PubMed]
- Stoyanov, P.; Chromik, R.R. Scaling Effects on Materials Tribology: From Macro to Micro Scale. Materials 2017, 10, 550. [Google Scholar] [CrossRef]
- Broitman, E. The nature of the frictional force at the macro-, micro-, and nano-scales. Friction 2014, 2, 40–46. [Google Scholar] [CrossRef]
- Lim, K.F. Negative pH does exist. J. Chem. Educ. 2006, 83, 1465. [Google Scholar] [CrossRef]
- Gan, Z.; Yao, T.; Zhang, M.; Hu, J.; Liao, X.; Shen, Y. Effect of Temperature on the Composition of a Synthetic Hydrocarbon Aviation Lubricating Oil. Materials 2020, 13, 1606. [Google Scholar] [CrossRef]
- Wolak, A. Changes in Lubricant Properties of Used Synthetic Oils Based on the Total Acid Number. Meas. Control 2018, 51, 65–72. [Google Scholar] [CrossRef]
- Idros, M.M.; Ali, S.; Islam, M.S. Optical analysis for condition-based monitoring of oxidation degradation in lubricant oil. In Proceedings of the 2012 4th International Conference on Intelligent and Advanced Systems (ICIAS2012), Kuala Lumpur, Malaysia, 12–14 June 2012; Volume 2, pp. 735–740. [Google Scholar]
- Mujahid, A.; Dickert, F.L. Monitoring automotive oil degradation: Analytical tools and onboard sensing technologies. Anal. Bioanal. Chem. 2012, 404, 1197–1209. [Google Scholar] [CrossRef]
- Santos, J.C.O.; Lima, L.N.; Santos, I.M.G.; Souza, A.G. Thermal, spectroscopic and rheological study of mineral base lubricating oils. J. Therm. Anal. Calorim. 2007, 87, 639–643. [Google Scholar] [CrossRef]
- De Rivas, B.L.; Vivancos, J.-L.; Ordieres-Meré, J.; Capuz-Rizo, S.F. Determination of the total acid number (TAN) of used mineral oils in aviation engines by FTIR using regression models. Chemom. Intell. Lab. Syst. 2017, 160, 32–39. [Google Scholar] [CrossRef]
- Cao, W.; Yan, J.; Jin, Z.; Han, Z.; Zhang, H.; Qu, J.; Zhang, M. Image Denoising and Feature Extraction of Wear Debris for Online Monitoring of Planetary Gearboxes. IEEE Access 2021, 9, 168937–168952. [Google Scholar] [CrossRef]
- Cao, W.; Zhang, H.; Wang, N.; Wang, H.W.; Peng, Z. The gearbox wears state monitoring and evaluation based on on-line wear debris features. Wear 2019, 426, 1719–1728. [Google Scholar] [CrossRef]
- Wang, S.; Wu, T.; Shao, T.; Peng, Z. Integrated model of BP neural network and CNN algorithm for automatic wear debris classification. Wear 2019, 426, 1761–1770. [Google Scholar] [CrossRef]
- Peng, Y.; Wu, T.; Wang, S.; Peng, Z. Wear state identification using dynamic features of wear debris for on-line purpose. Wear 2017, 376, 1885–1891. [Google Scholar] [CrossRef]
- Ikhlef, B.; Rahmoune, C.; Toufik, B.; Benazzouz, D. Gearboxes fault detection under operation varying condition based on MODWPT, Ant colony optimization algorithm and Random Forest classifier. Adv. Mech. Eng. 2021, 13, 16878140211043004. [Google Scholar] [CrossRef]
- De Feo, M.; Minfray, C.; Bouchet, M.D.B.; Thiebaut, B.; Le Mogne, T.; Vacher, B.; Martin, J. Ageing impact on tribological properties of MoDTC-containing base oil. Tribol. Int. 2015, 92, 126–135. [Google Scholar] [CrossRef]
- Cen, H.; Morina, A.; Neville, A. Effect of lubricant ageing on lubricants’ physical and chemical properties and tribological performance; Part I: Effect of lubricant chemistry. Ind. Lubr. Tribol. 2018, 70, 385–392. [Google Scholar] [CrossRef]
- Nagy, A.L.; Rohde-Brandenburger, J.; Zsoldos, I. Artificial Aging Experiments of Neat and Contaminated Engine Oil Samples. Lubricants 2021, 9, 63. [Google Scholar] [CrossRef]
- Seidel, B.; Meyer, D. Influence of artificial aging on the lubricating ability of water miscible metalworking fluids. Prod. Eng. 2019, 13, 425–435. [Google Scholar] [CrossRef]
- Gupta, B.; Kumar, N.; Titovich, K.A.; Ivanovich, K.V.; Vyacheslavovich, S.A.; Dash, S. Lubrication properties of chemically aged reduced graphene-oxide additives. Surfaces Interfaces 2017, 7, 6–13. [Google Scholar] [CrossRef]
- Zhang, J.; Tang, C.; Qiu, Q.; Yang, L. Effect of water on the diffusion of small molecular weight acids in nano-SiO2 modified insulating oil. J. Mol. Liq. 2020, 314, 113670. [Google Scholar] [CrossRef]
- Dong, J. Quantitative Condition Monitoring of Lubricating Oils by Fourier Transform Infrared (FTIR) Spectroscopy. Ph.D. Thesis, McGill University, Montréal, QC, Canada, 2000. [Google Scholar]
- Muniyappa, A.; Chandramohan, S.; Seethapathy, S. Detection and Diagnosis of Gear Tooth Wear through Metallurgical and Oil Analysis. Tribol. Online 2010, 5, 102–110. [Google Scholar] [CrossRef]
- Kattelus, J.; Miettinen, J.; Lehtovaara, A. Detection of gear pitting failure progression with on-line particle monitoring. Tribol. Int. 2018, 118, 458–464. [Google Scholar] [CrossRef]
- Feng, S.; Fan, B.; Mao, J.; Xie, Y. Prediction on wear of a spur gearbox by on-line wear debris concentration monitoring. Wear 2015, 336–337, 1–8. [Google Scholar] [CrossRef]
- Sheng, S. Monitoring of Wind Turbine Gearbox Condition through Oil and Wear Debris Analysis: A Full-Scale Testing Perspective. Tribol. Trans. 2016, 59, 149–162. [Google Scholar] [CrossRef]
- Hirani, H.; Jangra, D.; Sidh, K.N. Experimental Investigation on the Wear Performance of Nano-Additives on Degraded Gear Lubricant. Lubricants 2023, 11, 51. [Google Scholar] [CrossRef]
- Rezasoltani, A.; Khonsari, M.M. On monitoring physical and chemical degradation and life estimation models for lubri-cating greases. Lubricants 2016, 4, 34. [Google Scholar] [CrossRef]
- Available online: https://chem.libretexts.org/Bookshelves/Physical_and_Theoretical_Chemistry_Textbook_Maps/Supplemental_Modules_(Physical_and_Theoretical_Chemistry)/Acids_and_Bases/Acids_and_Bases_in_Aqueous_Solutions/The_pH_Scale (accessed on 20 April 2023).
- Singh, T.; Kumar, N.; R&D Centre, Bharat Petroleum Co., Ltd., Mumbai, India. Personal communication, October 2022.
- Spikes, H.A. Additive-additive and additive-surface interactions in lubrication. Lubr. Sci. 1989, 2, 3–23. [Google Scholar] [CrossRef]
- Hironaka, S.; Yahagi, Y.; Sakurai, T. Heats of Adsorption and Anti-wear Properties of Some Surface Active Substances. Bull. Jpn. Pet. Inst. 1975, 17, 201–205. [Google Scholar] [CrossRef]
- Studt, P. Zusammenhang zwischen Adsorbierbarkeit und Wirksamkeit von Hochdruckzusätzen in Schmierölen. Erdöl Kohle Erdgas Petrochem. 1968, 21, 784–785. [Google Scholar]
- Spikes, H.; Cameron, A. Additive Interference in Dibenzyl Disulfide Extreme Pressure Lubrication. ASLE Trans. 1974, 17, 283–289. [Google Scholar] [CrossRef]
- Li, J.; Wang, S.; Yang, J.; Zhang, H.; Zhao, H. A Digital Twin-Based State Monitoring Method of Gear Test Bench. Appl. Sci. 2023, 13, 3291. [Google Scholar] [CrossRef]
- Hansen, E.; Vaitkunaite, G.; Schneider, J.; Gumbsch, P.; Frohnapfel, B. Establishment and Calibration of a Digital Twin to Replicate the Friction Behaviour of a Pin-on-Disk Tribometer. Lubricants 2023, 11, 75. [Google Scholar] [CrossRef]
Figure 1.
Photographs of the (a) experimental test setup, (b) different sensor locations, (c) metallic wear debris sensor, and (d) oil sensor suite.
Figure 1.
Photographs of the (a) experimental test setup, (b) different sensor locations, (c) metallic wear debris sensor, and (d) oil sensor suite.

Figure 2.
A comprehensive framework of the study.

Figure 3.
Graph showing the variation of (a) oil quality index, (b) temperature, and (c) relative humidity.
Figure 3.
Graph showing the variation of (a) oil quality index, (b) temperature, and (c) relative humidity.

Figure 4.
Graph showing the variation of Ferrous concentration.

Figure 5.
ATR-FTIR spectra for the different concentrations of aqueous HCl in lubricant.

Figure 6.
The variation of the absorbance peak intensity with pH value (change in pH due to increase in v/v% of aqueous HCl in lubricant).
Figure 6.
The variation of the absorbance peak intensity with pH value (change in pH due to increase in v/v% of aqueous HCl in lubricant).

Figure 7.
ATR-FTIR spectra of the fresh oil (O1 and O21) and chemically degraded oil (O1 and O21) (doped with aqueous HCl /0.0025 % v/v).
Figure 7.
ATR-FTIR spectra of the fresh oil (O1 and O21) and chemically degraded oil (O1 and O21) (doped with aqueous HCl /0.0025 % v/v).

Figure 8.
(a) Wear scar diameter (WSD) value and (b) the load-carrying capacity of gear oils with and without aqueous HCl [52].
Figure 8.
(a) Wear scar diameter (WSD) value and (b) the load-carrying capacity of gear oils with and without aqueous HCl [52].

Figure 9.
Photographs of the wear scar and wear track for the weld load experiment for oils without aqueous HCl and with aqueous HCl.
Figure 9.
Photographs of the wear scar and wear track for the weld load experiment for oils without aqueous HCl and with aqueous HCl.

Figure 10.
(a) Schematic diagram of the lubricity tester and (b) photographs of the lubricity tester.
Figure 10.
(a) Schematic diagram of the lubricity tester and (b) photographs of the lubricity tester.

Figure 11.
Variation of coefficient of friction with or without aqueous HCl mix.

Figure 12.
Graphs showing the (a) oil quality index, (b) oil temperature, and (c) relative humidity for normal gear lubricant and chemically degraded (doped with 0.0025 v/v % aqueous HCl) gear lubricant.
Figure 12.
Graphs showing the (a) oil quality index, (b) oil temperature, and (c) relative humidity for normal gear lubricant and chemically degraded (doped with 0.0025 v/v % aqueous HCl) gear lubricant.

Figure 13.
(a) Lubricant samples after mixing aqueous HCl and after the end of experiments and (b) ATR-FTIR spectra of the fresh oil, chemically degraded oil (doped with aqueous HCl/0.0025 % v/v), and oil used in the gearbox (fresh oil and chemically degraded oil).
Figure 13.
(a) Lubricant samples after mixing aqueous HCl and after the end of experiments and (b) ATR-FTIR spectra of the fresh oil, chemically degraded oil (doped with aqueous HCl/0.0025 % v/v), and oil used in the gearbox (fresh oil and chemically degraded oil).

Figure 14.
Graphs showing the variation of ferrous particles concentration (FePPM) for (a) Test 21 (fresh oil without aqueous HCl mix) and (b) Test 22 (chemically degraded oil (0.0025 % v/v of aqueous HCl mix)) and (c) showing the number of FePPM particles generated during 90 min of test and total wear out the mass (µg) measured online and offline using a centrifuge.

Figure 15.
SEM images of wear particles generated during (a) Test 1: without the aqueous HCl mix and (b) Test 2: with an aqueous HCl mix.
Figure 15.
SEM images of wear particles generated during (a) Test 1: without the aqueous HCl mix and (b) Test 2: with an aqueous HCl mix.


Table 1.
Gear test rig and test specifications.
| Parameters | Pinion | Gear |
|---|---|---|
| Material | EN24 | EN24 |
| Hardness (HRC) | 30 ± 2 | 30 ± 2 |
| Module (mm) | 2 | 2 |
| Pitch circle diameter (mm) | 54 | 106 |
| Base circle diameter (mm) | 50.74 | 99.60 |
| Tip radius (mm) | 58 | 110 |
| Pressure angle (°) | 20 | 20 |
| Face width (mm) | 33 | 33 |
| Number of teeth | 27 | 54 |
| Speed (rpm) | 1200, 500 | - |
| Torque (Nm) | 40, 50 | - |
| Contact ratio | 1.6 | 1.6 |
| Roughness (µm) (Ra) | 0.363 ± 0.027 | 0.357 ± 0.037 |
| Roughness (µm) (Rq) | 0.579 ± 0.066 | 0.556 ± 0.095 |
| Youngs Modulus (GPa) | 207 | 207 |
| Lubricant | O1: API GL-4 SAE 90 | |
| O21: API GL-4 EP 90 (March 2022) O22: API GL-4 EP 90 (January 2017) | ||
| Test description | ||
| Test 1 | “40 Nm, 1200 rpm, 198 h, O1” | |
| Test 2 | Test 21: “50 Nm, 500 rpm, 90 min, O21 (Fresh oil)” Test 22: “50 Nm, 500 rpm, 90 min, O21 (artificially degraded oil with aqueous HCl mixing)” | |
| Physicochemical and Tribological Tests | Lubricity tester: “load—12.86 kg, speed—100 rpm, the oil used—O21 with and without aqueous HCl | |
| Four ball testers: “Standard ASTM D2783 and IP-239 and the oil used O1 and O21 with and without aqueous HCl” | ||
Table 2.
Variation of pH value and the absorbance peak intensity in the ATR-FTIR spectra due to the change in aqueous HCl concentration.
Table 2.
Variation of pH value and the absorbance peak intensity in the ATR-FTIR spectra due to the change in aqueous HCl concentration.
| Aqueous HCl Concentration (v/v%) | pH Value (Std. Dev.) | Peak Intensity about 723 cm−1 | Peak Intensity about 1720 cm−1 | Peak Intensity about 3410 cm−1 |
|---|---|---|---|---|
| 0 | 5.703 (0.04) | 0.0212 | 0.00431 | 0.00168 |
| 0.0005 | 4.598 (0.02) | 0.02152 | 0.00483 | 0.0024 |
| 0.0010 | 2.866 (0.05) | 0.02196 | 0.00535 | 0.00319 |
| 0.0015 | 2.105 (0.02) | 0.02209 | 0.00571 | 0.00347 |
| 0.0020 | 1.179 (0.03) | 0.0221 | 0.00625 | 0.00398 |
| 0.0025 | 0.904 (0.06) | 0.02265 | 0.00744 | 0.00574 |
Table 3.
Chemical properties (TAN, TBN, and pH value) of lubricant oils without and with 0.0025 % v/v aqueous HCl.
Table 3.
Chemical properties (TAN, TBN, and pH value) of lubricant oils without and with 0.0025 % v/v aqueous HCl.
| TAN | Std. Dev. | TBN | Std. Dev. | pH | Std. Dev. | Absorbance Peak Intensity @723 cm−1 | pH Value Using ATR-FTIR Fit (Equation (1)) | Absorbance Peak Intensity @1720 cm−1 | pH Value Using ATR-FTIR Fit (Equation (2)) | ||
|---|---|---|---|---|---|---|---|---|---|---|---|
| O1 | Without aqueous HCl | 0.039 | 0.002 | 0.06 | 0.003 | 5.762 | 0.01 | 0.02099 | 6.263 | 0.00434 | 5.216 |
| With aqueous HCl | 0.151 | 0.006 | 0.018 | 0.001 | 2.905 | 0.02 | 0.022 | 2.596 | 0.00542 | 3.146 | |
| O21 | Without aqueous HCl | 0.08 | 0.002 | 0.15 | 0.005 | 5.742 | 0.01 | 0.0211 | 5.855 | 0.00408 | 5.7924 |
| With aqueous HCl | 0.189 | 0.008 | 0.073 | 0.003 | 1.657 | 0.01 | 0.0222 | 1.890 | 0.00629 | 1.759 | |
| O22 | Without aqueous HCl | 0.12 | 0.005 | 0.127 | 0.004 | 4.786 | 0.01 | - | - | - | - |
| With aqueous HCl | 0.21 | 0.01 | 0.056 | 0.002 | 1.263 | 0.01 | - | - | - | - |
Table 4.
The pH value and kinematic viscosity values for both experiments.
| Without Aqueous HCl Mix (Test 21) | With an Aqueous HCl Mix (Test 22) | Without Aqueous HCl Mix (Test 21) | With an Aqueous HCl Mix (Test 22) | |||||
|---|---|---|---|---|---|---|---|---|
| Time (Minutes) | pH Value | Std. Dev. | pH Value | Std. Dev. | Kinematic Viscosity (cSt@40 °C) | Std. Dev. | Kinematic Viscosity (cSt@40 °C) | Std. Dev. |
| 0 | 5.86 | 0.01 | 1.55 | 0.03 | 134.78 | 0.006 | 127.60 | 0.007 |
| 10 | 6.06 | 0.01 | 0.75 | 0.03 | 113.00 | 0.008 | 112.20 | 0.001 |
| 20 | 5.77 | 0.01 | 0.54 | 0.03 | 106.78 | 0.002 | 110.53 | 0.002 |
| 30 | 5.51 | 0.01 | −1.35 | 0.02 | 107.20 | 0.004 | 106.52 | 0.004 |
| 40 | 5.35 | 0.02 | −1.48 | 0.02 | 107.04 | 0.001 | 104.33 | 0.005 |
| 50 | 5.29 | 0.01 | −1.75 | 0.03 | 102.54 | 0.001 | 103.51 | 0.005 |
| 60 | 5.18 | 0.01 | −2.01 | 0.02 | 104.56 | 0.002 | 101.12 | 0.007 |
| 70 | 5.16 | 0.01 | −2.04 | 0.03 | 104.43 | 0.004 | 101.12 | 0.006 |
| 80 | 5.05 | 0.02 | −2.17 | 0.02 | 93.68 | 0.004 | 92.44 | 0.006 |
| 90 | 4.98 | 0.02 | −2.28 | 0.02 | 91.80 | 0.001 | 90.64 | 0.004 |
Disclaimer/Publisher’s Note: The statements, opinions and data contained in all publications are solely those of the individual author(s) and contributor(s) and not of MDPI and/or the editor(s). MDPI and/or the editor(s) disclaim responsibility for any injury to people or property resulting from any ideas, methods, instructions or products referred to in the content. |
© 2023 by the authors. Licensee MDPI, Basel, Switzerland. This article is an open access article distributed under the terms and conditions of the Creative Commons Attribution (CC BY) license (https://creativecommons.org/licenses/by/4.0/).
Share and Cite
MDPI and ACS Style
Hirani, H.; Jangra, D.; Sidh, K.N. Experimental Analysis of Chemically Degraded Lubricant’s Impact on Spur Gear Wear. Lubricants 2023, 11, 201. https://doi.org/10.3390/lubricants11050201
AMA Style
Hirani H, Jangra D, Sidh KN. Experimental Analysis of Chemically Degraded Lubricant’s Impact on Spur Gear Wear. Lubricants. 2023; 11(5):201. https://doi.org/10.3390/lubricants11050201
Chicago/Turabian StyleHirani, Harish, Dharmender Jangra, and Kishan Nath Sidh. 2023. "Experimental Analysis of Chemically Degraded Lubricant’s Impact on Spur Gear Wear" Lubricants 11, no. 5: 201. https://doi.org/10.3390/lubricants11050201
Note that from the first issue of 2016, this journal uses article numbers instead of page numbers. See further details here.