The Influence of Load and Speed on the Initial Breakdown of Rolling Bearings Exposed to Electrical Currents


1
Institute for Product Development and Machine Elements, Technical University of Darmstadt, Otto-Berndt-Str. 2, 64287 Darmstadt, Germany
2
Valeo Powertrain Electrified Mobility, Siemensstr. 15, 97616 Bad Neustadt, Germany
3
Electrical Drive Systems, Technical University of Darmstadt, Landgraf-Georg-Str. 4, 64283 Darmstadt, Germany
*
Author to whom correspondence should be addressed.
Lubricants 2024, 12(1), 1; https://doi.org/10.3390/lubricants12010001
Submission received: 31 August 2023
/
Revised: 27 November 2023
/
Accepted: 14 December 2023
/
Published: 19 December 2023
(This article belongs to the Special Issue Behavior of Lubricated Bearings in Electric Circuits)
Abstract
:The reason for the failure of electric vehicle drives is increasingly current-induced damage to rolling bearings. Studies show that rolling bearings are more susceptible to current pass-through after the first occurrence of unwanted bearing currents. To investigate this effect, a test plan is introduced with variations in axial and radial loads, as well as rotational speeds. A new bearing is mechanically run-in for each test point and then subjected to a realistic voltage signal of gradually increasing amplitude. After the initial breakdown, the different voltage amplitudes are applied again to investigate the behavior after the initial breakdown. During the whole test, the maximum current, the duration and the dissipated energy of each breakdown are measured. The results provide insights into the processes after the initial breakdown and the stochastic nature of the breakdown behavior.
1. Introduction
Current-induced rolling bearing damage is increasingly the reason for the failure of electric vehicle motors [1]. Those vehicles commonly use frequency converters to drive the alternating current (AC) motor with the battery providing direct current (DC). This is achieved by switching at a frequency of several tens or hundreds of kHz in order to approximate a sinusoidal signal for up to three phases. As the voltage sum of all phases does not always yield 0 , a so-called common-mode voltage is generated. This voltage can cause damaging currents through the rolling contact, depending on the electrical system architecture, and the trend towards increasing switching frequencies and operating voltages intensifies this effect. In order to effectively reduce the likelihood of bearing damage due to bearing currents during the development phase, a better understanding of the influences on the probability of occurrence of damaging current breakdown is required [2].
If the dielectric strength of the lubricant film is exceeded by the applied bearing voltage, dielectric breakdown occurs. The dielectric strength depends in particular on the minimum lubricant film thickness present in operation and the electrical properties of the lubricant. If, for example, the temperature of the lubricant film increases, the threshold value is lower because the lubricant film thickness decreases due to the lower viscosity [3]. If the dielectric strength is exceeded, an arc occurs between the rolling element and the inner or outer ring, causing the bearing to adopt an ohmic behavior with low resistance for the duration of the breakdown. The arc causes localized melting of the rolling element and raceway surfaces, resulting in the formation of small craters that cause long-term damage to the bearing [4]. There are several possible explanations how exactly a breakdown occurs in the bearing [5,6]. One of the most common is the theory of the formation of microbubbles in the lubricant, in which the breakdown follows the behavior of a discharge in gases [7,8]. According to the percolation theory, when the electric field is low, electrons travel from the cathode to the anode only gradually, from atom to atom. If a higher electric field is applied, predefined current paths are created in which the electrons can move freely. These individual streamers multiply, allowing a high current to flow [9,10,11].
Different types of bearing currents are distinguished [12,13,14]. In this work, the focus is on the so-called rotor-to-earth currents, which occur due to potential differences between the rotor and earth potential. Then, the high-frequency ground currents flow via the path of lowest impedance through the bearings [15]. Depending on the motor power, rotor-to-ground currents reach currents of several amperes, as well as frequencies of several hundred kHz [16].
The investigations by Harder [17] and Joshi [18] show that rolling bearings have a higher susceptibility to current passage after the first electrical breakdown (initial breakdown). On the one hand, this may be due to the roughened surface caused by the initial damage, because the resulting roughness peaks mean that a homogeneous electric field can no longer be assumed between the contact partners, and breakdowns occur more quickly due to the field elevation there [17]. On the other hand, a chemical change in the lubricant due to the initial breakdown can also be decisive for the increased susceptibility to breakdown. In this paper, an experimental design is presented to investigate the influences and effects of the initial breakdown.
However, in the case of low AC-voltage levels being applied to rolling element bearings, the risk of electric discharge events is drastically reduced and the load, speed and temperature-dependent capacity can be used as a mutual sensor. Schirra et al. [19] sketched the idea of a sensing rolling element bearing that was consequently brought forward, e.g., by inclusion of the effect of unloaded rolling elements [20]. Martin [21] used the impedance measurement to detect and size-estimate rolling element damage patterns due to excessive contact pressure as an alternative condition monitoring approach for rolling element bearings.
In this work, the influence of load and speed on both the initial and following electrical damage of grease lubricated deep groove ball bearings is investigated. Therefore, a specific test schedule, as well as sophisticated evaluation algorithms for the high-frequency sampled data, are developed. Then, the results of an exemplary test point are displayed and discussed, and subsequently, the data from all test points are gathered and evaluated.
2. Materials and Methods
To investigate the influences on initial and secondary breakdown behavior, practical experiments are key. In the following, the experimental design, the mechanical and electrical test setup and the design of experiments are described.
2.1. Experimental Design
Figure 1 shows the chronological test sequence: first, each test bearing is run in to reduce manufacturing-related roughness peaks and, thus, produce comparable initial conditions. In addition, this achieves uniform electrical lubricant properties, which may exhibit variations while running-in [22]. During the first half of the run-in phase, a pure radial load of is set for 3 h. Subsequently, an axial force of is additionally applied for a further three hours, so that the raceway area of the outer ring relevant for all test points has been run in under load. After the running-in phase, the bearing is preconditioned for at least 30 min at the operating conditions specific to the test point in order to heat the bearing to the stationary test temperature, as no external heating or cooling is applied.
Subsequently, the voltage application and measurement is started. The amplitude is increased stepwise by every . If more than breakdowns are detected at the end of a stage, the bearing is defined as initially damaged, the stress amplitude is designated as , and the first stage test is terminated. This high threshold is necessary to prevent the voltage fluctuations of the test bench from distorting the test results. Thereafter, no voltage is applied for five minutes under unchanged mechanical conditions. This pause is for lubricant circulation to distribute the chemically damaged lubricant caused by the breakdowns, since the lubricant within the bearing could have different local damage grades [23]. The stress amplitude is then increased again in steps to investigate the effect of the initial damage in the first step test on the current entry limit in the second test. The voltage is now increased every by up to the voltage at which the initial breakdown occurred in the previous experiment. However, at this stage, the critical voltage is at a lower stage than . This avoids a strongly different circulation time for experiments with different . Finally, a specific voltage amplitude is set over a period of three hours to investigate whether effects that positively or negatively influence the current breakdown occur during this prolonged time. Finally, the voltage supply is switched off and the experiment is terminated.
2.2. Mechanical Test Setup
On the test rig used, Figure 2, the radial and axial loads are applied via hydraulic actuators and a closed loop control. GTM series K force transducers with a nominal force of 40 are used to control the hydraulic pressure in order to achieve the desired forces. The axial load is transferred from the hydraulic actuator’s piston through the force transducer and a ball joint to the pressure plate depicted in Figure 2. The radial load is transferred directly on the ram in Figure 2 via the transducer. The frictions of the bushes and rams were considered by a calibration before any tests were carried out. Due to the constantly controlled pressure, thermal expansion will not cause a change in load throughout the test. The maximum controllable load is axial and radial per bearing in the configuration used. An electric motor provides speeds up to , and the shaft is electrically contacted via a slip ring. The bearing seats are electrically insulated and allow contact to be made with the inner part in which the test bearing is located, Figure 2. Radial deep groove ball bearings type 6008 with high speed grease sealed on both sides are tested. External heating or cooling of the test bearing is not possible on the test rig used, so the bearing temperature is measured continuously, and a steady-state temperature condition is waited for before starting the measurement.
2.3. Electrical Test Setup and Evaluation
The voltage is applied by using a bearing voltage signal measured on a real electrical machine, which, in the configuration used, resembles a square-wave signal with transients, see Figure 3a. The root-mean-square (rms) value of the generated voltage signal is . An arbitrary function generator remotely controlled by the measurement program generates the signal, which is amplified by a circuit based on a MP111 power operational amplifier up to and . To limit the current in the breakdown case to realistic values, a resistor is connected in series, Figure 3b. For the available voltage range of 0 V to 24 V, a value of has proven to adequately limit the current flow and, at the same time, allow a sped up electrical damaging during the longtime damage phase, cf. Figure 1.
The generator voltage at the amplifier output and the bearing voltage with a sampling rate of and 12 resolution are measured using a PicoScope® 4444 oscilloscope by Pico Technology Ltd., Cambridgeshire, UK. The bearing current is calculated as
and is used for breakdown detection by means of slope evaluation. The limit values are selected as and . The time average between the last exceedance of before the exceedance of is defined as the start of the breakdown and, in reverse order, the end of the breakdown . In addition to breakdown start and duration, the maximum value of the current during breakdown is saved, as well as the breakdown energy, which is calculated from the integral of the product of the bearing voltage and current,
In addition to the values stored for each breakdown event, the rms values of the measured voltages, current and bearing power are also stored.
2.4. Design of Experiments
To be able to measure the bearing current in different bearing conditions, the experiments are designed using a central composite design (ccd), Figure 4. This allows five experimental points per design parameter to be investigated while keeping the total number of experiments at a low level. This is achieved by building up the experimental points around a single central point. The design parameters in this central point should correspond to normal operating conditions. Unchanged are the bearing type, the lubricant, the voltage signal applied on the bearing and the test bench. At the central point, the bearing is loaded with a radial force of , an axial force of and a speed of . Built around that is a cubic pattern whose points are changed for all three parameters separately. By looking at level and 1, these values can be found in Table 1. According to the ccd experimental design, in addition to the center and the cubic values, the star points are investigated (level and in Table 1). For these star points, each design parameter is operated with a very high and very low value, while the others remain at the level of the central point. Since the test rig has limited abilities in building up the rotational speed, the maximum value had to be adjusted to the test bench used. To investigate even higher loads, two extra test points were added, one with a radial force of and one with an axial force of . Again, the rest of the test parameters remain at the center point values. Table A1 in Appendix A summarizes all the experiments carried out with their corresponding unique V-numbers in randomized order.
3. Results and Discussion
3.1. Exemplary Measurement Results at a Single Test Point
In the following, the results of a central test point experiment (Level 0, Table 1) are presented as an example. Figure 5 shows the curves of the rms values of bearing voltage and bearing current recorded during the two-step tests, cf. Figure 1. At the voltage steps to , the bearing current remains below , which corresponds to the measurement noise of the arrangement. At the stage, brief increases in the bearing current rms value are observed. At stages to , the bearing voltage is approximately equal to the generator voltage. At , a significant increase in the rms current can be observed. At this stage, 14,722 breakdowns per second were recorded. The average of the maximum current recorded for each breakdown was , while individual breakdowns occurred with a maximum current of up to . With the Hertz’ian area at operating conditions , this yields an apparent bearing current density of , which, according to Mütze, can be classified in the transition region between supercritical and subcritical damage [24]. The apparent bearing power of can be assumed to be subcritical according to [25]. The average breakdown energy was , and the maximum was . Within the five minutes, of electrical work were, thus, performed in the bearing, corresponding to an average power of .
In the second step test, Figure 5b, approx. breakdowns per second can already be observed at the step at an average of and or a maximum of and . Thus, breakdowns are already evident at half the voltage amplitude at which the initial damage occurred. At the step, 18,219 breakdowns per second were registered at an average of and or a maximum of and . Thus, a comparable behavior to the first step test at the same voltage step is shown here.
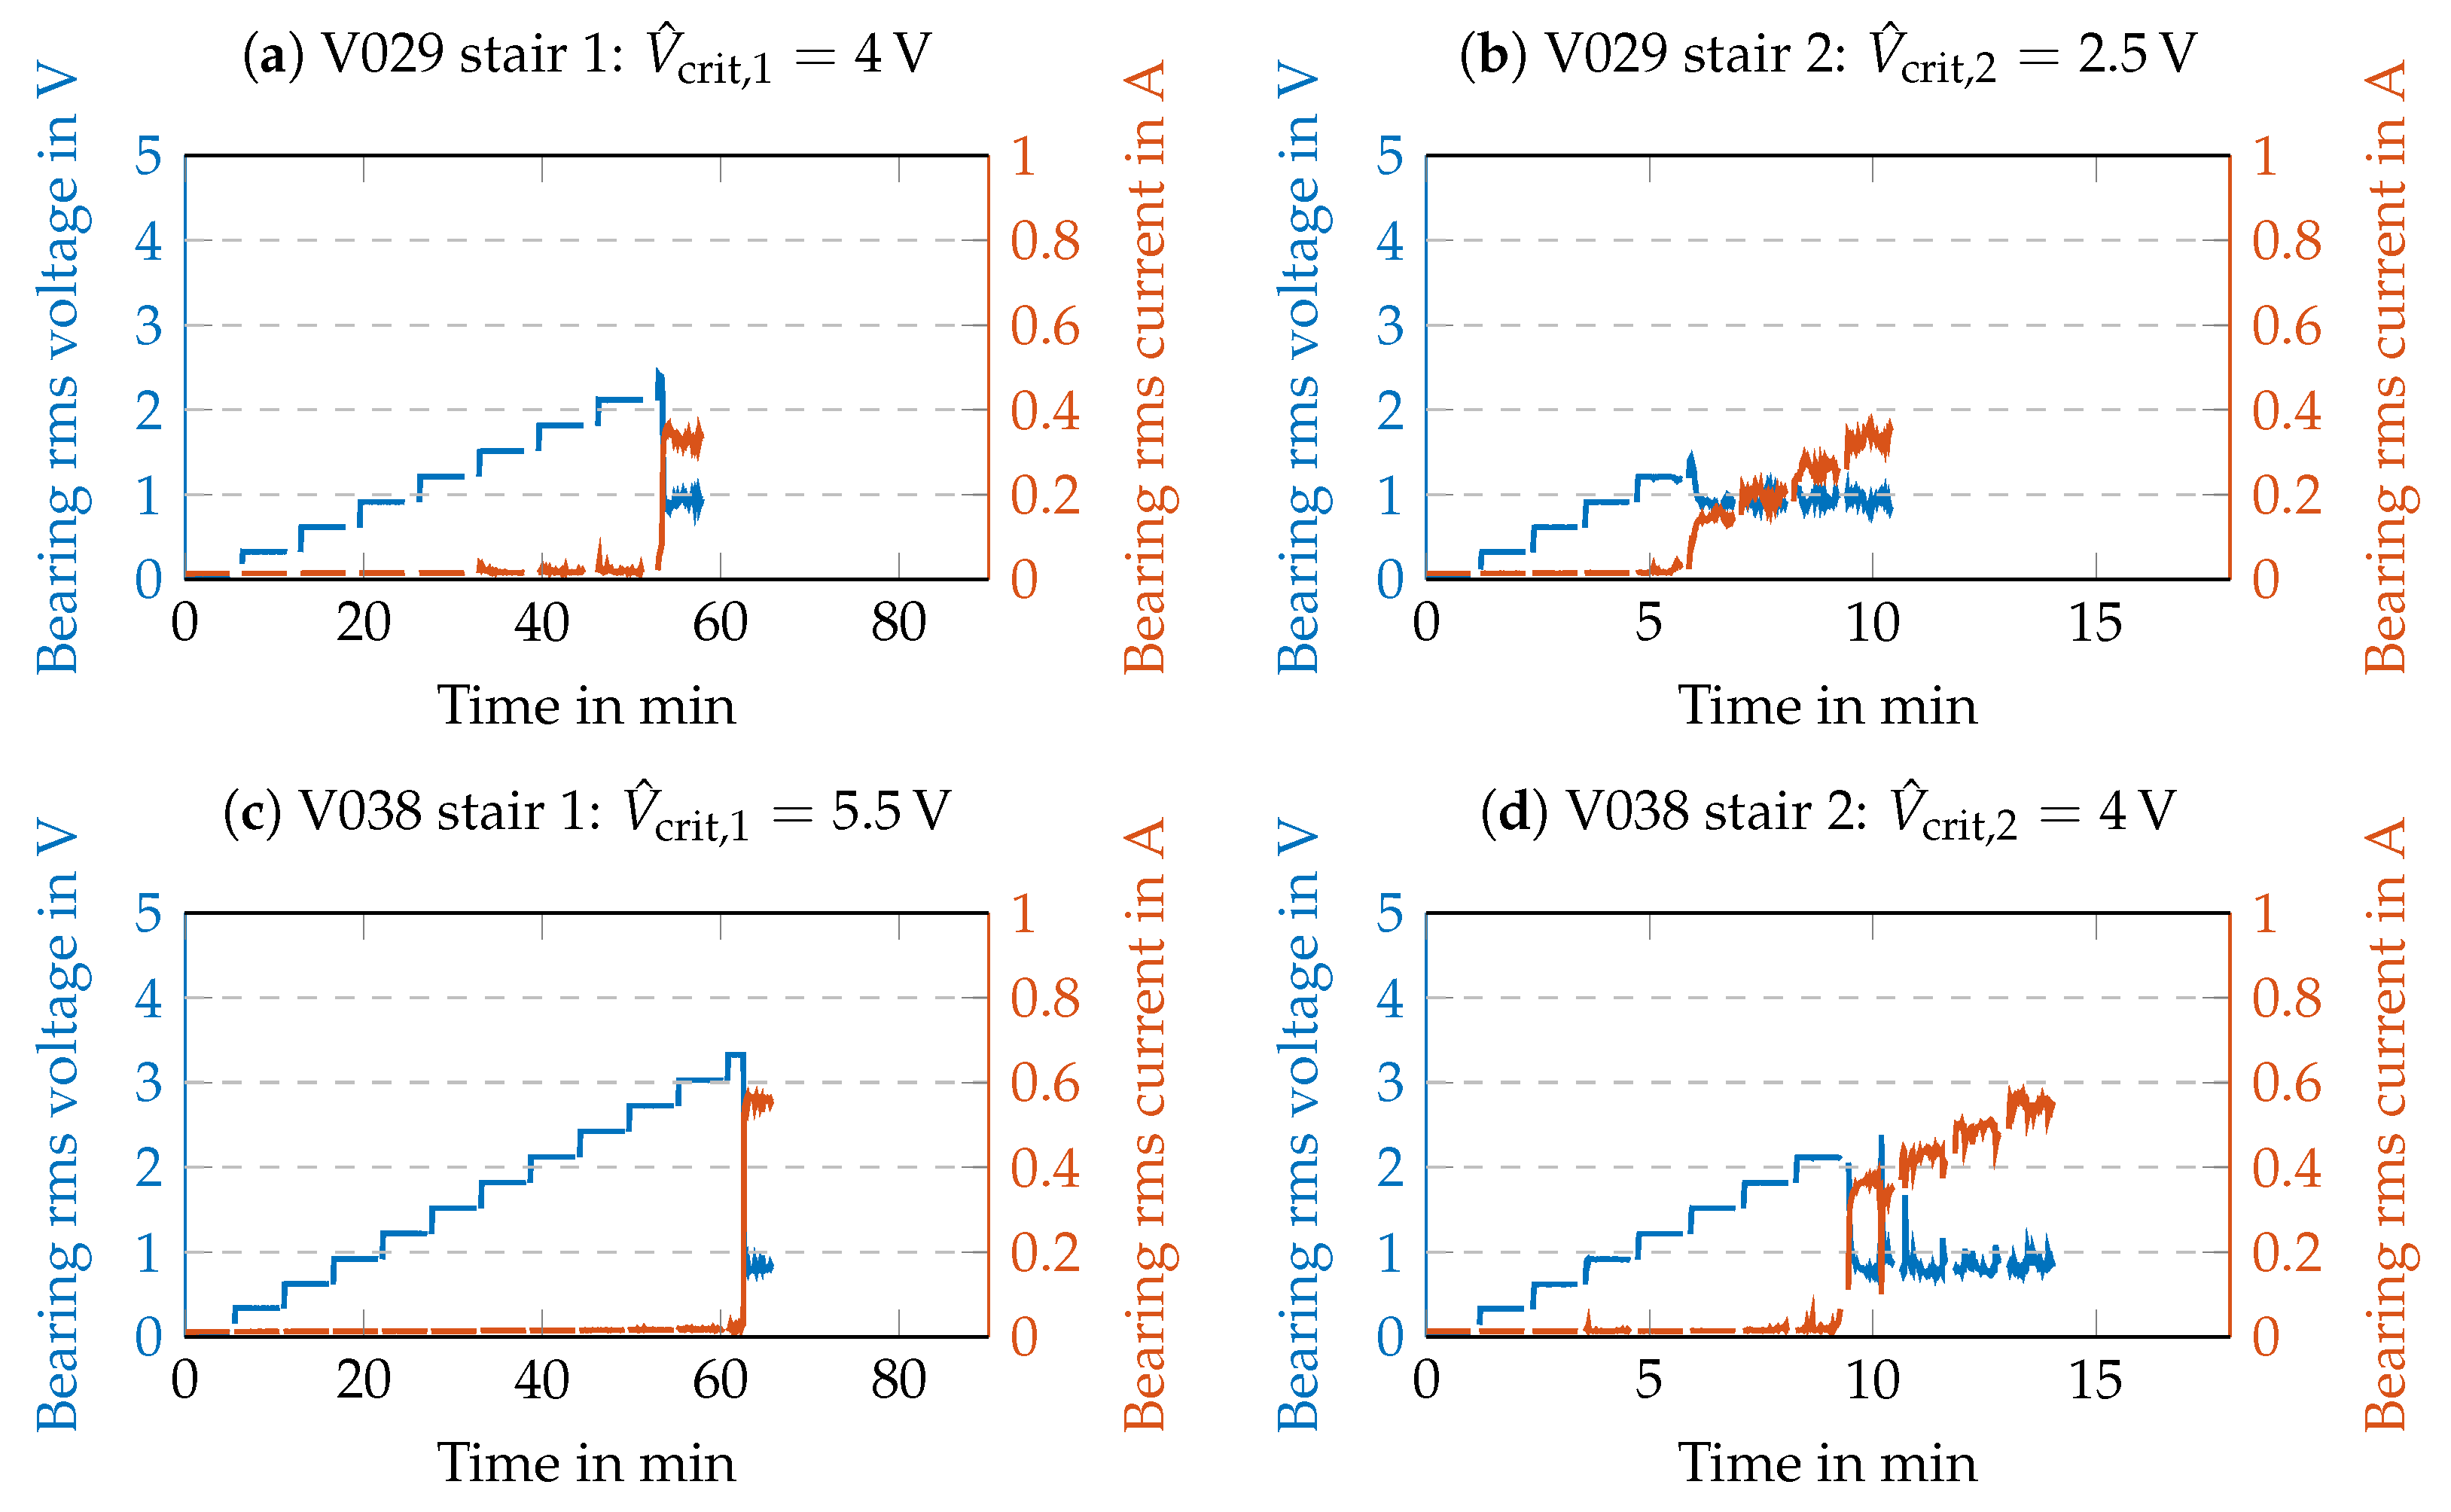
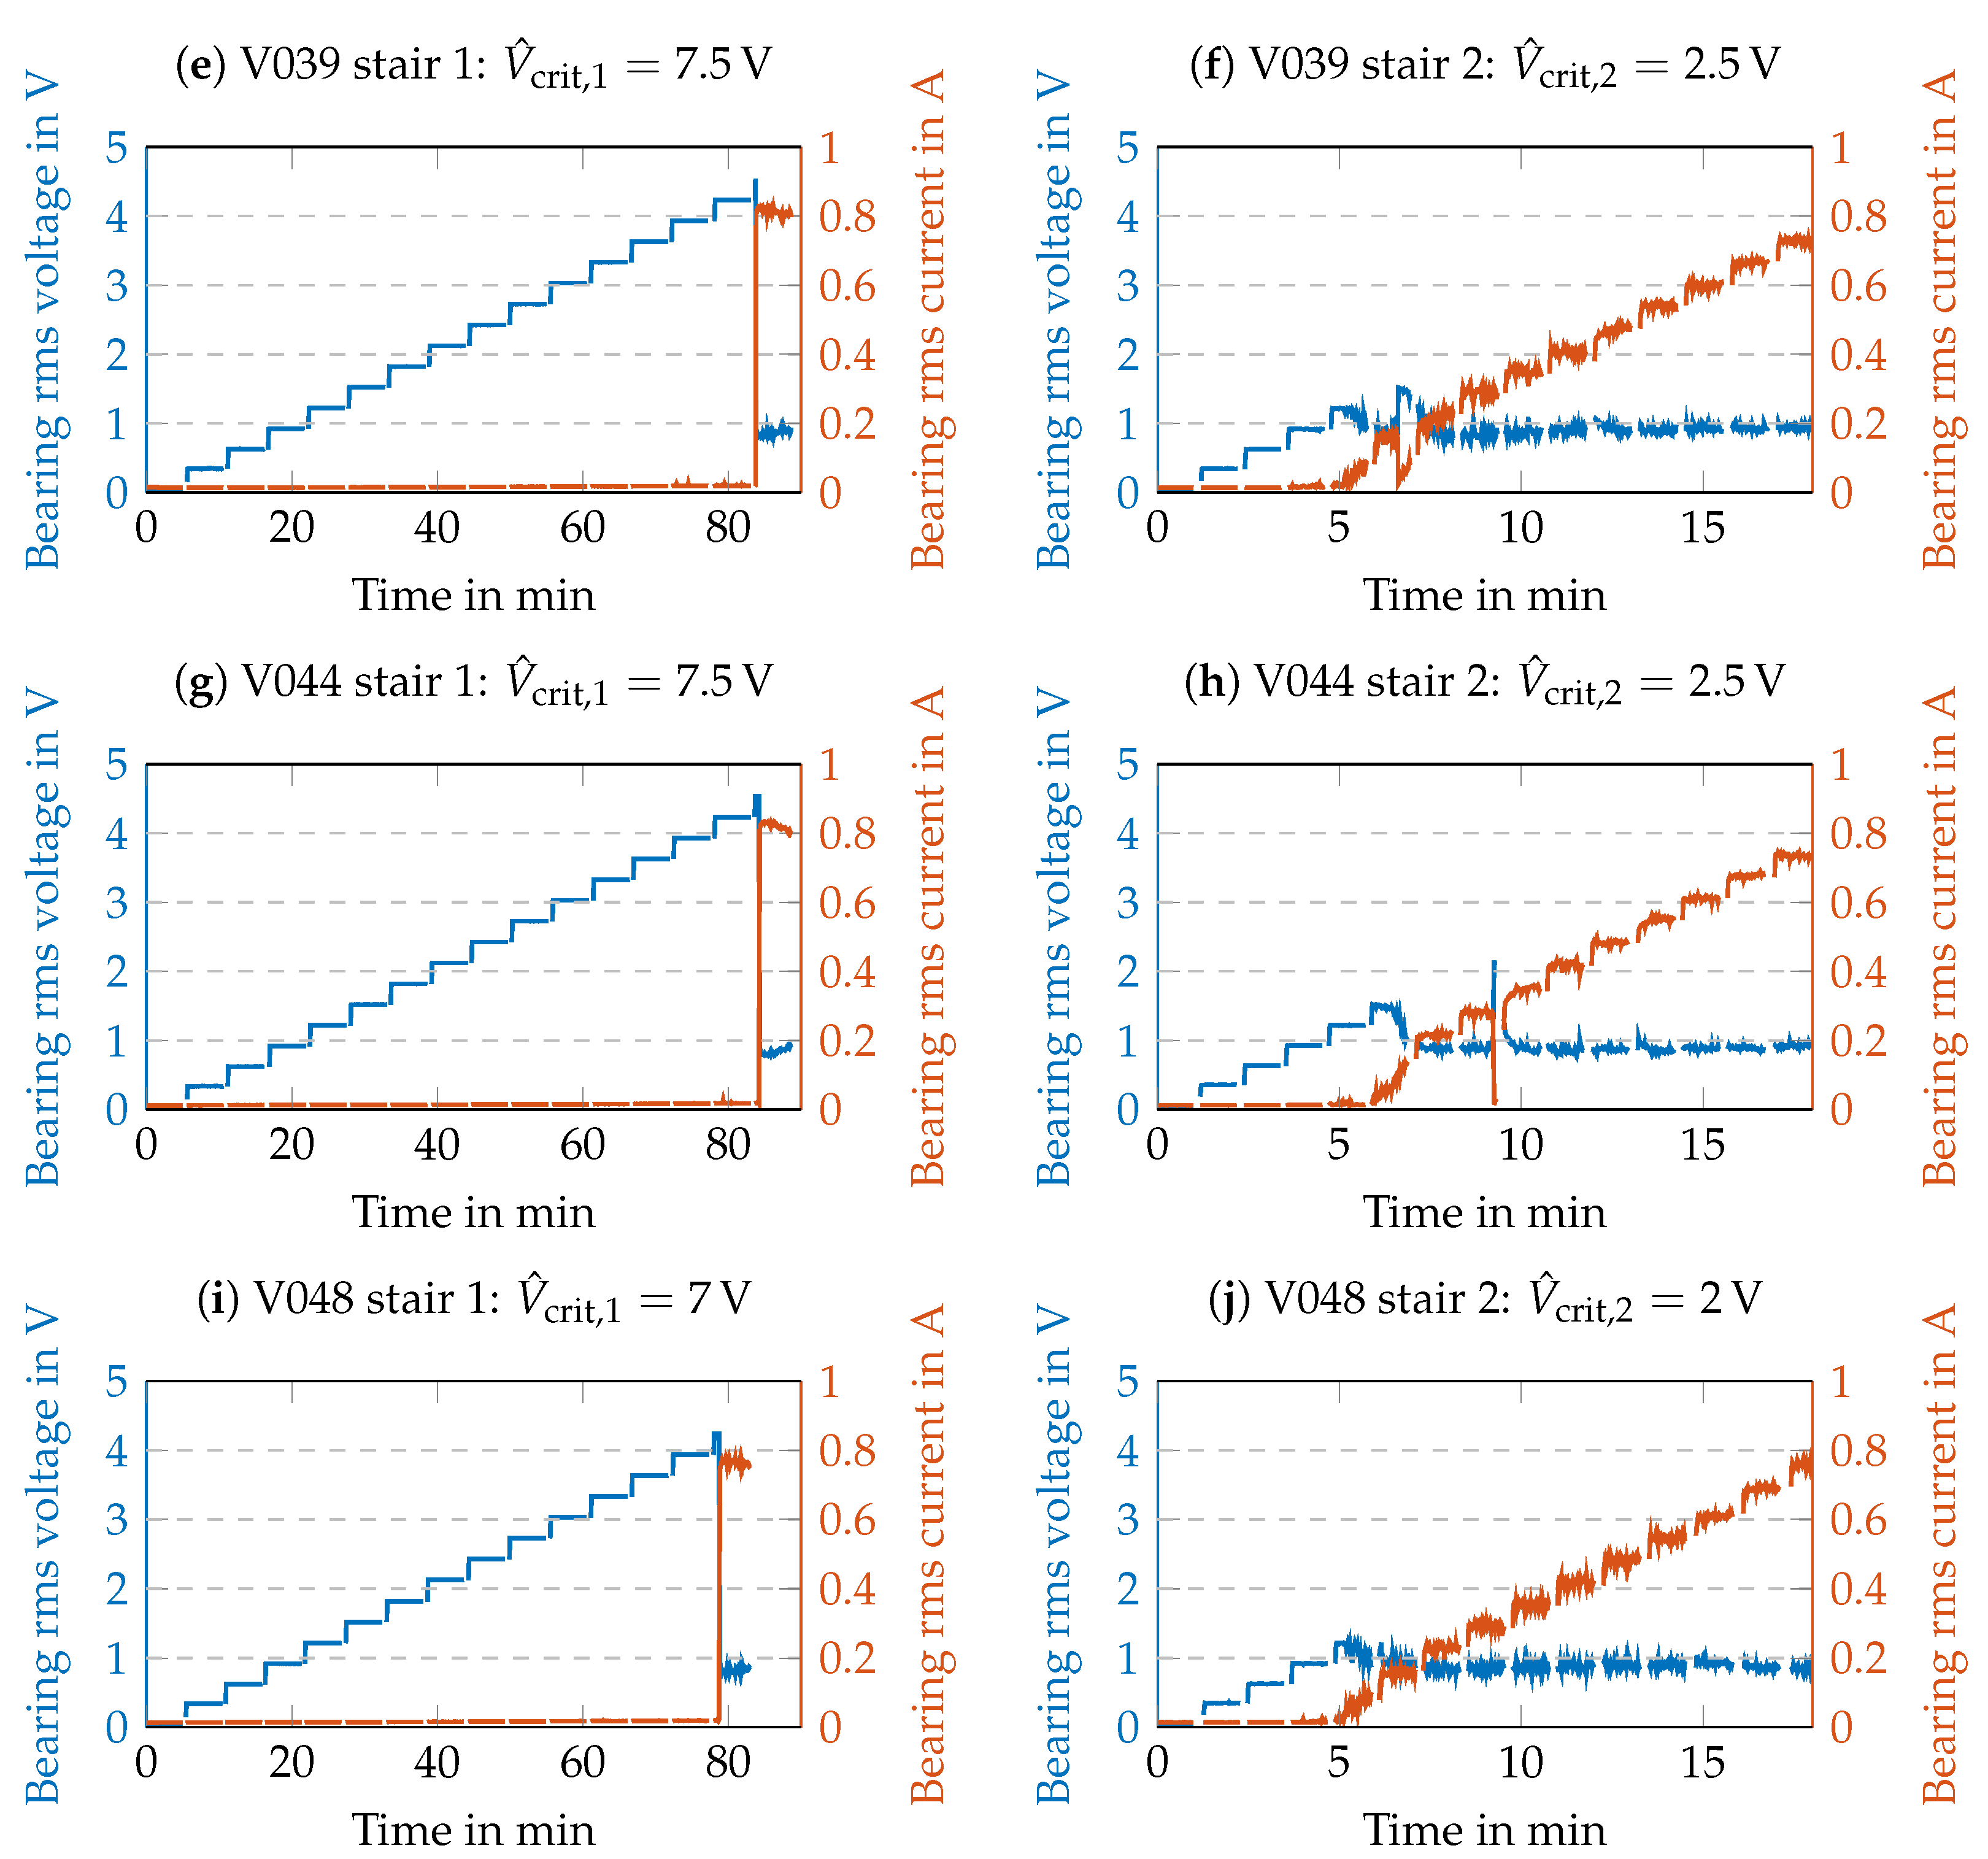
In Appendix B, Figure A1, rms plots are shown for other bearings of the same type tested at the same test point after the same run-in procedure, cf. Section 2.1. A significant variance can be observed in the critical voltage of the initial damage (stair 1) , as well as in the critical voltage secondary damage procedure (stair 2) . For all tests, the critical voltage was reduced after the initial damage. At the stair 2 test at voltage steps , an almost constant rms bearing voltage of could be observed. The current rises with each voltage step in a mostly linear fashion. In V039, an interruption of approx. 40 can be observed, while V038 and V044 show short interruptions where the current dropped towards 0 briefly. A comparison of the same voltage step for different test shows similar rms current values, most likely due to the similar rms bearing voltages.
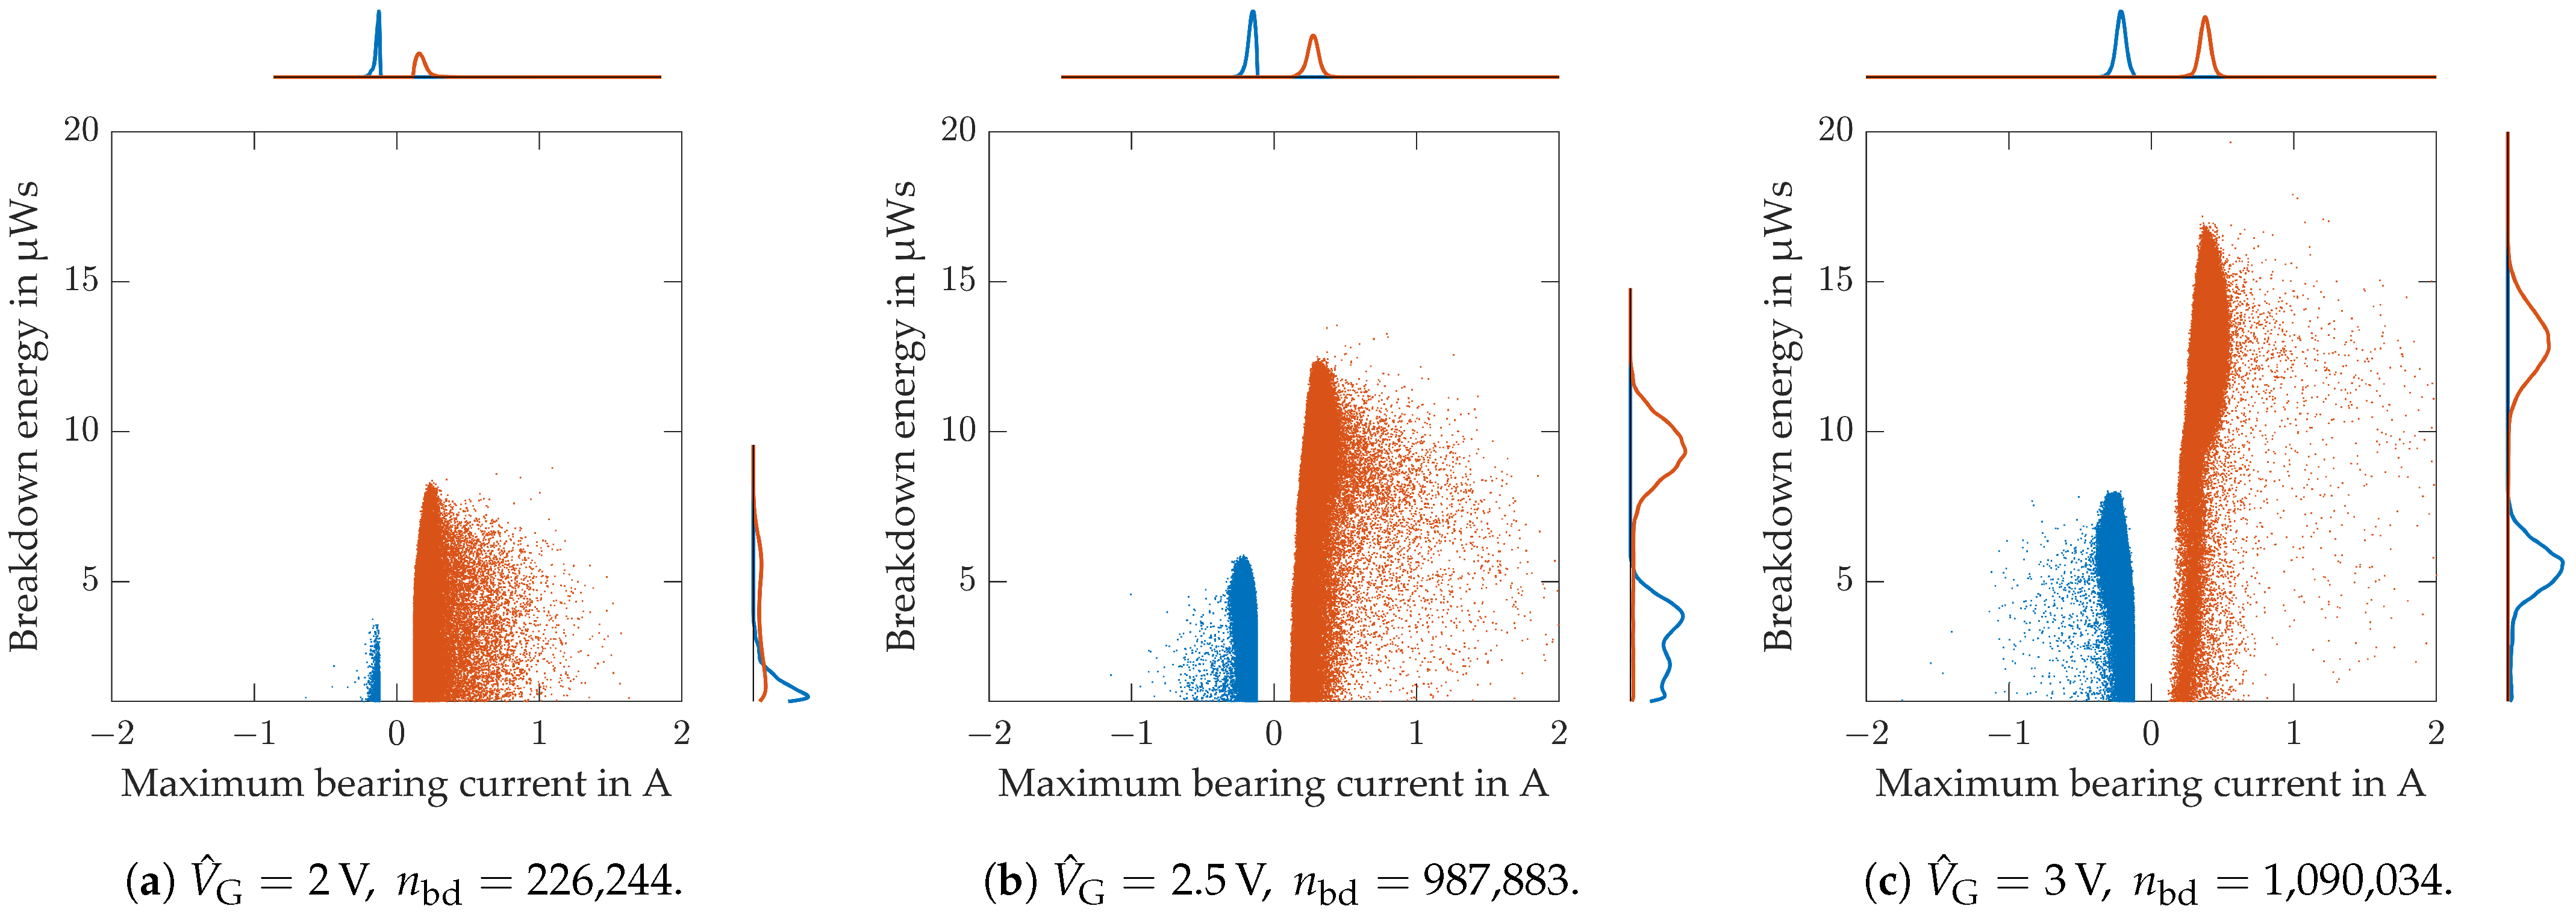
Figure 6 shows scatter plots of the last three voltage steps of the second stair test, Figure 5b. The maximum bearing current of each breakdown is plotted on the x-axis and the energy E on the y-axis. Positive breakdowns are marked in red and negative ones in blue. The histograms on both axes display the qualitative distribution of the corresponding quantity. In the range of −0.12 A to 0.12 A, no breakdowns were considered as this was chosen as the detection criterion, cf. Section 2.3. The asymmetry of positive and negative breakdowns can be explained by the DC component of the applied signal, cf. Figure 3a. Thus, the higher magnitude positive voltage during the positive half-wave also produces higher magnitude currents in the case of a breakdown. The average of the positive maximum breakdown currents increases almost linearly from via to , which corresponds to the behavior of the rms current. The average breakdown energy , on the other hand, increases non-linearly from via to . As the bearing voltage was almost constant and the current was rising linearly, the non-linearity is due to the increased total of breakdowns over which the energy is averaged.
For the longtime damage, an excessive voltage application of was selected in this test, which is, thus, a multiple of the voltages applied to the bearing in real operation. On the one hand, this serves to speed up the electrical damage, and on the other hand, it allows the influence of the applied voltage signal to be investigated in more detail. Within the three hours of measurement, an average of 16,030 breakdowns per second were registered at an average of and , or a maximum of and , which corresponds to an average power of . The apparent bearing current density is on the edge of the critical damage classification, and the apparent bearing current density is in the critical range.
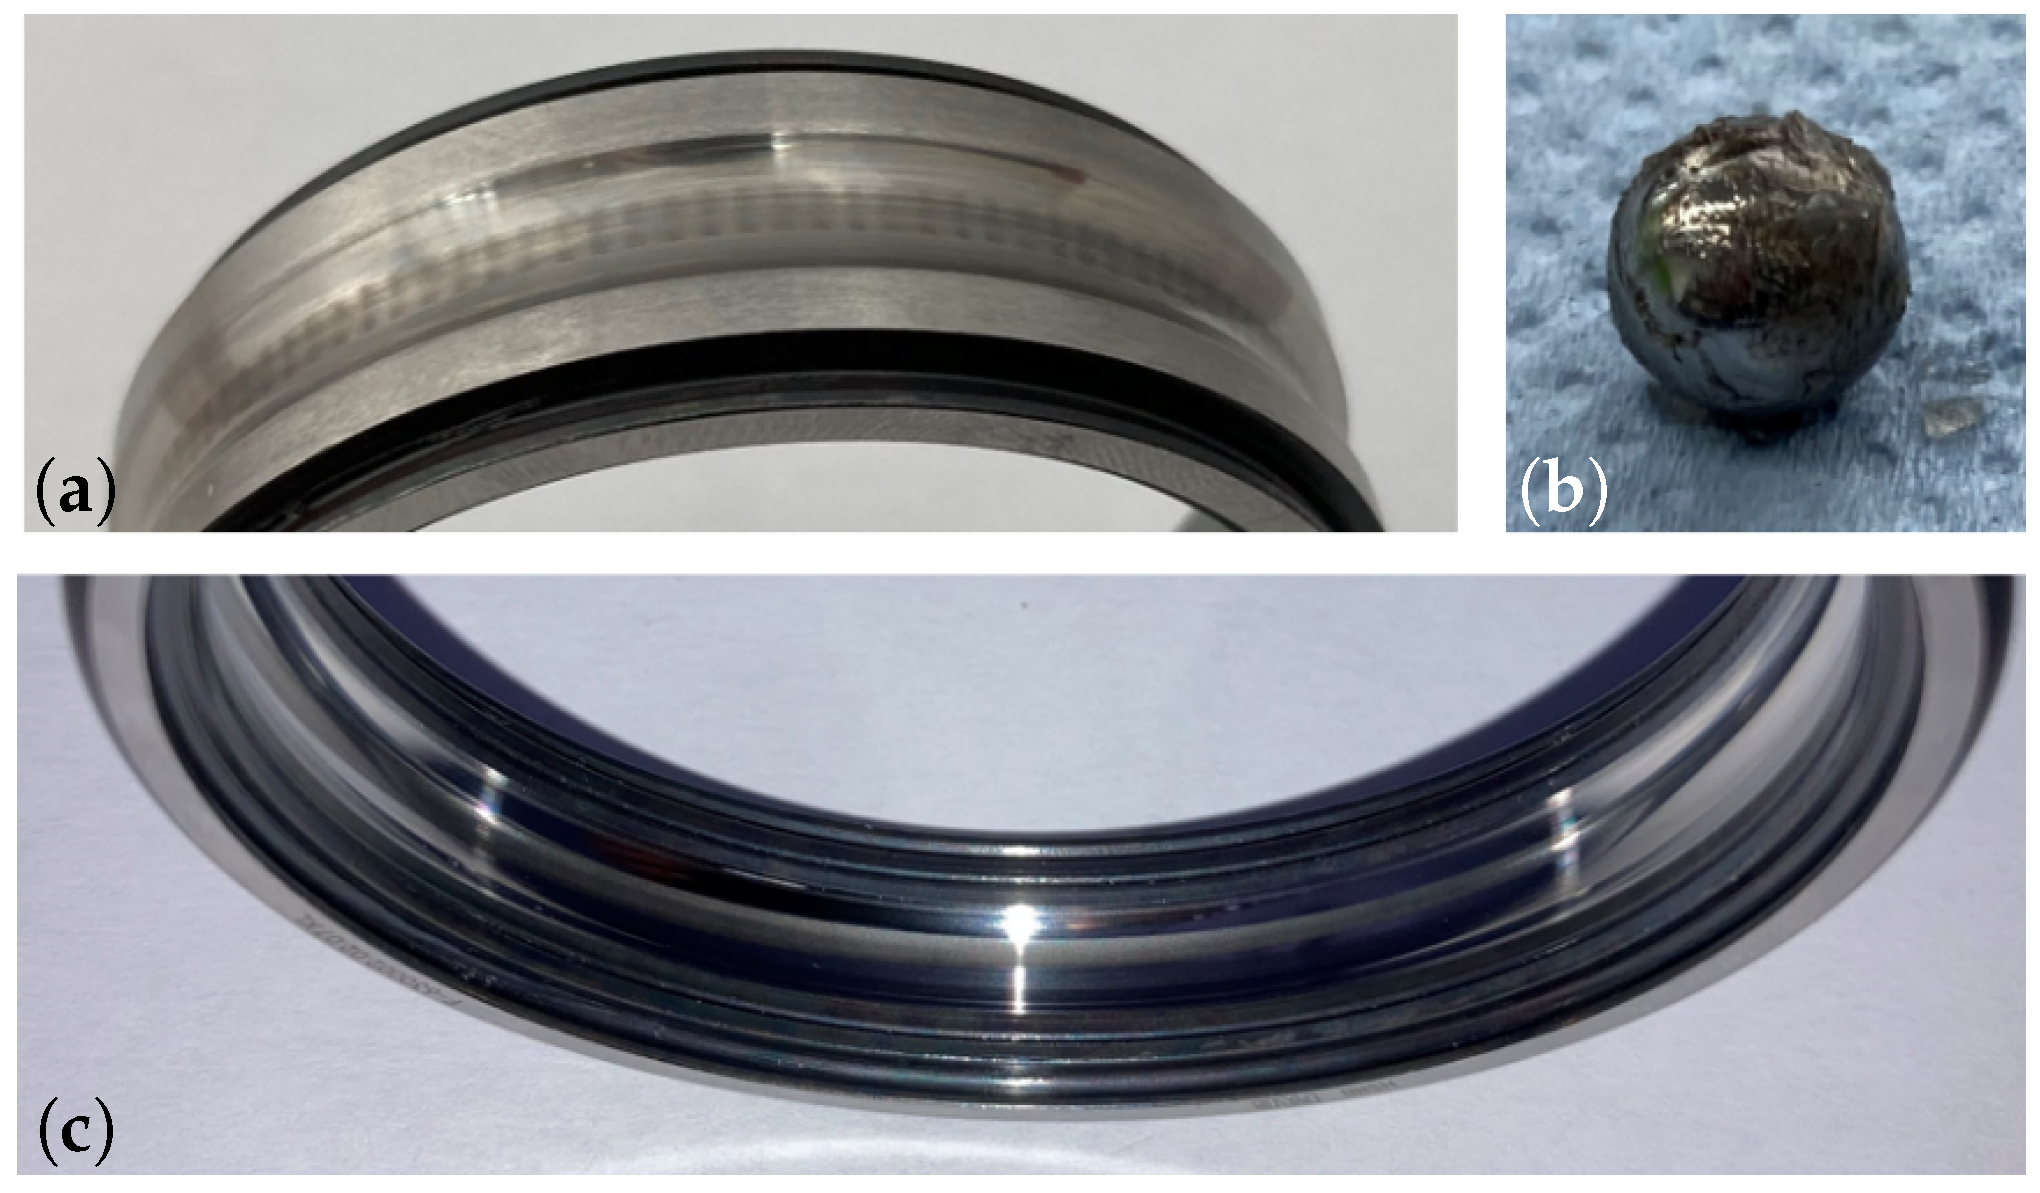
The bearing was assessed after the test period, i.e., after the two-step tests, Figure 5, and the long-term damage at for a total of , which is longer than the measurement period of due to the saving periods during which voltage was also applied to the bearing. During this time, characteristic damage patterns on the bearing could be identified: The inner ring showed fluting in the raceway, while the raceway of the outer ring in the load zone showed a dull surface, so-called gray frosting [12], cf. Figure 7. This corresponds to experiments by Safdarzadeh [6], where the negative ring exhibited corrugations first. Due to the asymmetric voltage signal, Figure 3a, the inner ring was the negative ring at the higher absolute voltage amplitude. On and around the raceway and rolling element surfaces, a discoloration of the high-speed grease from white to gray/black could be detected. The lubricant on the outside of the cage or the sealing washers did not show any discoloration, as expected.
3.2. Influence of the Operating Point
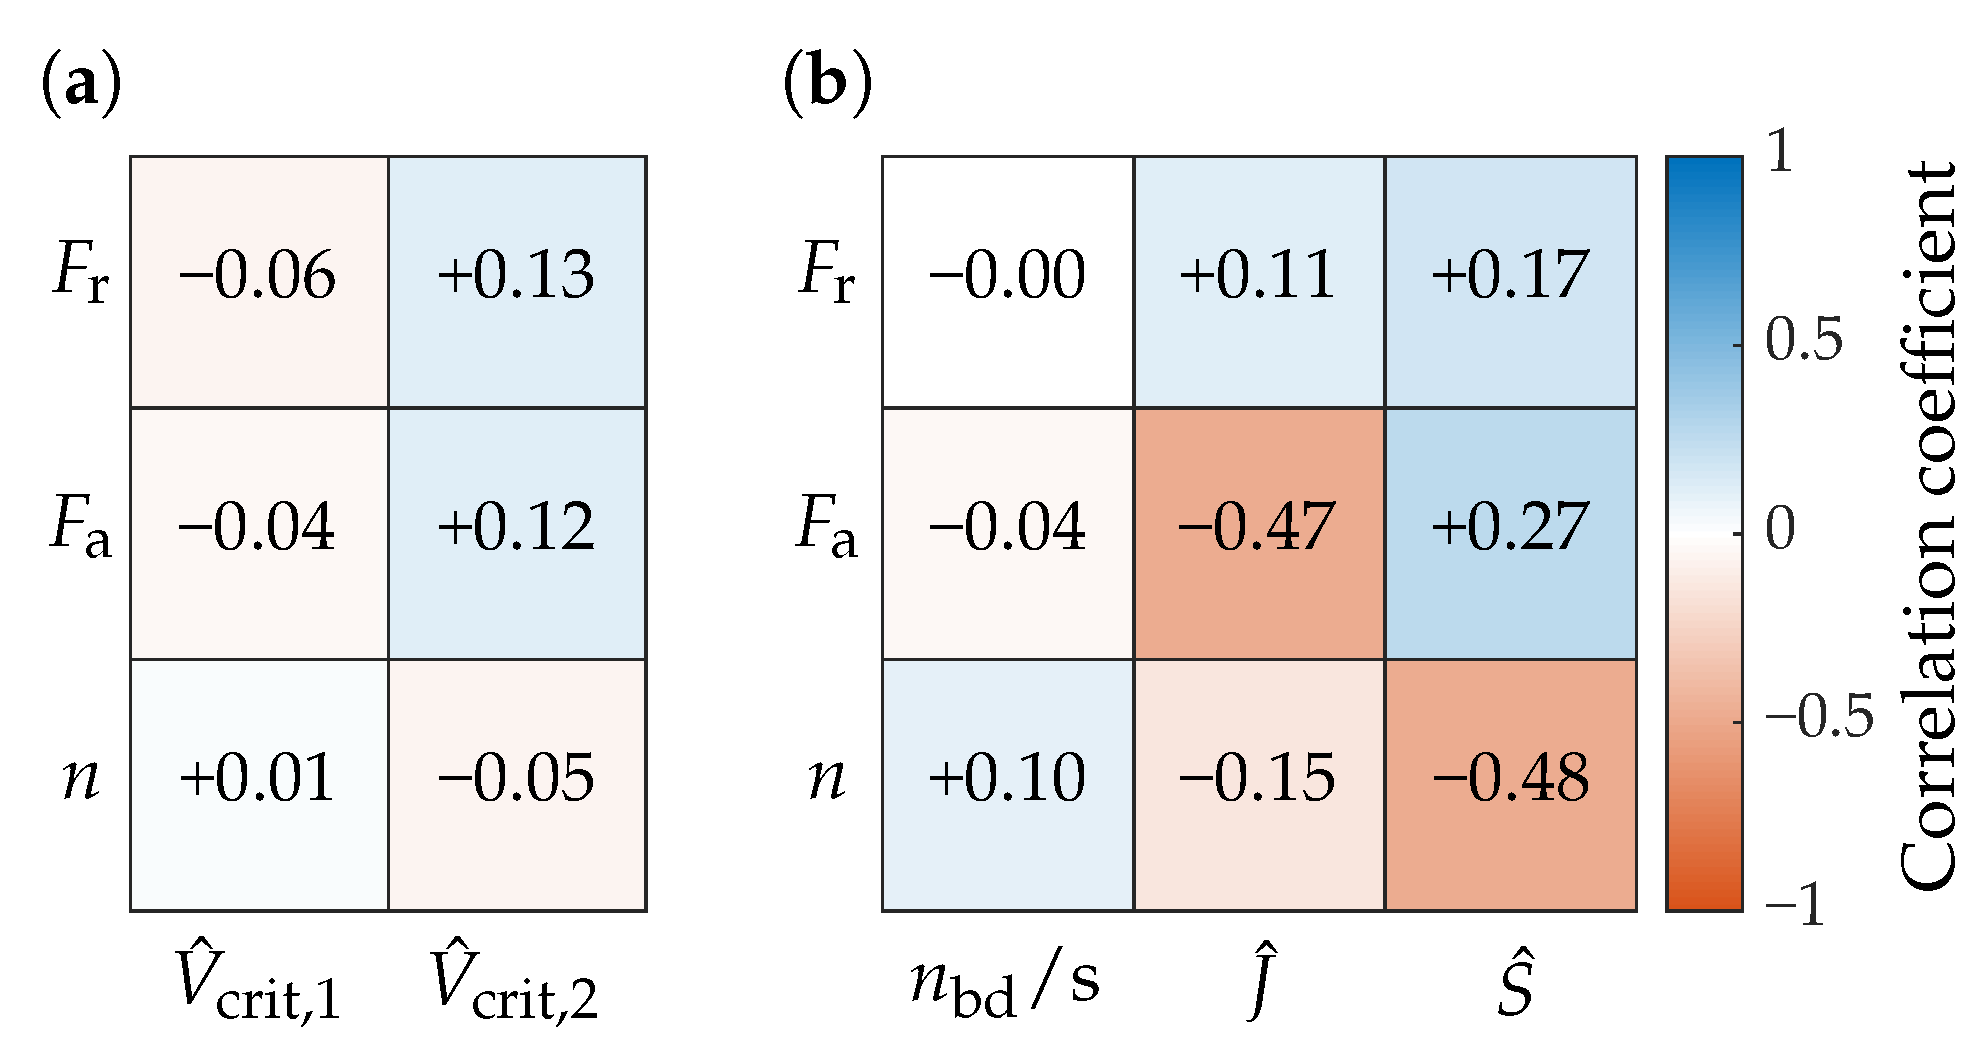
Next, the correlation of speed, as well as axial and radial load, on the bearing is investigated. Therefore, the experiments as derived in Section 2.1 and listed in Appendix A, Table A1 were carried out. Figure 8a shows the correlation of the set parameters radial load , axial load , rotational speed n with the measured critical voltage amplitudes for the initial and the secondary damage . Due to issues with the test rig, test numbers V019, V021, V022, V028, V031 and V049 to V055 had to be excluded from the evaluation. The results show no relevant correlation between the operating state of the bearing and the critical voltage steps. The slight correlation between the bearing loads and is surprising. One might expect a reduced breakdown voltage due to the reduced lubrication film thickness. A possible explanation might be the different behavior of the additives in the bearing grease under high pressures.
Figure 8b shows the correlation between the same set parameters and the measured number of breakdowns per second , the apparent bearing current density and the apparent bearing power . To make the input data comparable, only results from the secondary damage period with were investigated, and the extra experiments, cf. Table A1, were also excluded due to their asymmetric nature. At the step, this criterion was met for, in total, 14 experiments. The results show a weak dependency of the number of breakdowns per second on the operating point. Loads have a negative influence on the bearing current, which, in return, influences the apparent bearing current density and power. Only the axial load reduces the apparent bearing current density as it increases the Hertz’ian contact area size significantly. The rotational speed, on the other hand, reduces bearing currents, as the lubrication film is increased and the resistance is, therefore, higher. The number of breakdowns increases slightly as the breakdown is more likely to last less than a whole half period, cf. Figure 3a.
4. Conclusions
In the present work, a procedure for investigating the initial electrical damage of rolling bearings to the breakdown limit was examined. By using run-in, new bearings for each test point, the initial damage can be provoked and recorded by gradually increasing the applied voltage. In a subsequent second step test, the changed behavior after the initial damage can be observed. The initial tests show how the current entry limit drops significantly after the initial damage. Novel investigation methods arise by recording the individual breakdowns and statistically evaluating them. The experiments at the same operating point showed a high scatter of results despite the carefully reproduced experimental conditions. While the initial breakdown threshold voltage varies highly statistically, subsequent breakdowns are likely to occur at a more consistent voltage level. A correlation analysis showed an increase in current flow with load and a decrease with rotational speed. For the axial load, the increase in the Hertz’ian area is larger than the increase in current flow. Therefore, the apparent bearing current density decreased with the axial load. The results suggest that both load and speed play a subordinate role compared to stochastic influences. In order to gain a deeper understanding of damaging bearing currents, further factors must be taken into account, such as the acceleration and recuperation processes, temperature influences and lubricant additives.
Author Contributions
Conceptualization, S.P., M.K. and Y.B.; software, S.P. and R.M.; formal analysis, S.P.; investigation, S.P. and R.M.; data curation, S.P.; writing—original draft preparation, S.P. and R.M.; writing—review and editing, M.K. and Y.B.; visualization, S.P.; supervision, Y.B.; project administration, S.P. All authors have read and agreed to the published version of the manuscript.
Funding
This research was funded by Valeo eAutomotive Germany GmbH. The APC was funded by the Deutsche Forschungsgemeinschaft (DFG—German Research Foundation) and the Open Access Publishing Fund of Technical University of Darmstadt.
Data Availability Statement
The data presented in this study are available on request from the corresponding author.
Conflicts of Interest
The design of the study, collection, analyses and interpretation of data and the decision to publish the results were made in consultation with the funding sponsors.
Abbreviations
The following abbreviations are used in this manuscript:
| AC | alternating current |
| bd | breakdown |
| ccd | central composite design |
| DC | direct current |
| DoE | design of experiments |
| ir | inner ring |
| or | outer ring |
| rms | root mean square |
Appendix A

Table A1.
Tabular overview of the experiments carried out. The V-number is analog to the order in which the experiments were conducted.
Table A1.
Tabular overview of the experiments carried out. The V-number is analog to the order in which the experiments were conducted.
| Number | in N | in N | in mm2 | n in min | in V | DoE | in V | in V | |
|---|---|---|---|---|---|---|---|---|---|
| V015 | 1800 | 900 | 20.0 | 5.68 | 7000 | 4 | cubic | 5 | 3 |
| V014 | 1800 | 900 | 20.0 | 5.68 | 7000 | 16 | cubic | 6 | 3.5 |
| V032 | 1800 | 900 | 20.0 | 5.68 | 2000 | 4 | cubic | 3 | 2.5 |
| V035 | 1800 | 900 | 20.0 | 5.68 | 2000 | 16 | cubic | 4.5 | 3 |
| V046 | 1800 | 300 | 9.4 | 5.03 | 7000 | 4 | cubic | 2.5 | 2 |
| V047 | 1800 | 300 | 9.4 | 5.03 | 7000 | 16 | cubic | 3 | 2 |
| V025 | 1800 | 300 | 9.4 | 5.03 | 2000 | 4 | cubic | 3 | 2.5 |
| V016 | 1800 | 300 | 9.4 | 5.03 | 2000 | 16 | cubic | 3.5 | 2 |
| V053 | 600 | 900 | 9.1 | 5.70 | 7000 | 4 | cubic | 2 | 2 |
| V051 | 600 | 900 | 9.1 | 5.70 | 7000 | 16 | cubic | 2.5 | 2 |
| V056 | 600 | 900 | 9.1 | 5.70 | 2000 | 4 | cubic | 1.5 | 1.5 |
| V020 | 600 | 900 | 9.1 | 5.70 | 2000 | 16 | cubic | 2 | 2 |
| V052 | 600 | 300 | 6.7 | 5.03 | 7000 | 4 | cubic | 4.5 | 2 |
| V030 | 600 | 300 | 6.7 | 5.03 | 7000 | 16 | cubic | 2.5 | 2 |
| V054 | 600 | 300 | 6.7 | 5.03 | 2000 | 4 | cubic | 4.5 | 2 |
| V055 | 600 | 300 | 6.7 | 5.03 | 2000 | 16 | cubic | 1.5 | 1.5 |
| V024 | 2040 | 600 | 7.8 | 5.32 | 4500 | 4 | star | 7 | 3 |
| V045 | 2040 | 600 | 7.8 | 5.32 | 4500 | 16 | star | 4.5 | 2 |
| V049 | 360 | 600 | 13.8 | 5.34 | 4500 | 4 | star | 3 | 2 |
| V050 | 360 | 600 | 13.8 | 5.34 | 4500 | 16 | star | 2.5 | 2 |
| V013 | 1200 | 1020 | 7.0 | 5.84 | 4500 | 4 | star | 2.5 | 2.5 |
| V012 | 1200 | 1020 | 7.0 | 5.84 | 4500 | 16 | star | 6 | 2.5 |
| V017 | 1200 | 180 | 14.1 | 4.95 | 4500 | 4 | star | 5.5 | 2.5 |
| V037 | 1200 | 180 | 14.1 | 4.95 | 4500 | 16 | star | 4 | 2.5 |
| V022 | 1200 | 600 | 10.0 | 5.33 | 8000 | 4 | star | 6.5 | 6.5 |
| V042 | 1200 | 600 | 10.0 | 5.33 | 8000 | 16 | star | 4.5 | 2.5 |
| V041 | 1200 | 600 | 10.0 | 5.33 | 1000 | 4 | star | 5 | 2 |
| V036 | 1200 | 600 | 10.0 | 5.33 | 1000 | 16 | star | 2.5 | 2 |
| V044 | 1200 | 600 | 10.0 | 5.33 | 4500 | 4 | central | 7.5 | 2.5 |
| V034 | 1200 | 600 | 10.0 | 5.33 | 4500 | 16 | central | 3.5 | 2 |
| V039 | 1200 | 600 | 10.0 | 5.33 | 4500 | 4 | central | 7.5 | 2 |
| V031 | 1200 | 600 | 10.0 | 5.33 | 4500 | 16 | central | 5.5 | 5.5 |
| V018 | 1200 | 600 | 10.0 | 5.33 | 4500 | 4 | central | 4 | 4 |
| V029 | 1200 | 600 | 10.0 | 5.33 | 4500 | 16 | central | 4 | 2.5 |
| V033 | 1200 | 600 | 10.0 | 5.33 | 4500 | 4 | central | 6 | 6 |
| V038 | 1200 | 600 | 10.0 | 5.33 | 4500 | 16 | central | 5.5 | 4 |
| V043 | 1200 | 600 | 10.0 | 5.33 | 4500 | 4 | central | 7 | 3.5 |
| V011 | 1200 | 600 | 10.0 | 5.33 | 4500 | 16 | central | 3 | 2.5 |
| V023 | 1200 | 600 | 10.0 | 5.33 | 4500 | 4 | central | 0.5 | 0.5 |
| V048 | 1200 | 600 | 10.0 | 5.33 | 4500 | 16 | central | 7 | 2 |
| V027 | 4000 | 600 | 4.2 | 5.28 | 4500 | 4 | extra | 3.5 | 3 |
| V040 | 4000 | 600 | 4.2 | 5.28 | 4500 | 16 | extra | 3 | 2 |
| V028 | 1200 | 2000 | 4.2 | 6.99 | 4500 | 4 | extra | 6 | 6 |
| V026 | 1200 | 2000 | 4.2 | 6.99 | 4500 | 16 | extra | 3 | 2.5 |
Appendix B
Figure A1.
RMS values of bearing voltage and current for the first stair (left) and for the second stair test (right) for six different, newly run-in bearings (V029 (a,b), V038 (c,d), V039 (e,f), V044 (g,h),V0484 (i,j) at , and .
Figure A1.
RMS values of bearing voltage and current for the first stair (left) and for the second stair test (right) for six different, newly run-in bearings (V029 (a,b), V038 (c,d), V039 (e,f), V044 (g,h),V0484 (i,j) at , and .

References
- Graf, S.; Capan, R.; Koch, O.; Sauer, B. Electrically induced damage of rolling bearings due to parasitic converter currents in electrical drive trains. In Commercial Vehicle Technology 2022; Proceedings; Berns, K., Dressler, K., Kalmar, R., Stephan, N., Teutsch, R., Thul, M., Eds.; Springer Fachmedien Wiesbaden: Wiesbaden, Germany, 2022; pp. 199–209. [Google Scholar] [CrossRef]
- Schneider, V.; Behrendt, C.; Höltje, P.; Cornel, D.; Becker-Dombrowsky, F.M.; Puchtler, S.; Gutiérrez Guzmán, F.; Ponick, B.; Jacobs, G.; Kirchner, E. Electrical Bearing Damage, A Problem in the Nano- and Macro-Range. Lubricants 2022, 10, 194. [Google Scholar] [CrossRef]
- Furtmann, A.; Tischmacher, H.; Poll, G. Extended HF equivalent model of a drive train. In Proceedings of the 2016 XXII International Conference on Electrical Machines (ICEM), Lausanne, Switzerland, 4–7 September 2016; pp. 2244–2250. [Google Scholar] [CrossRef]
- Kriese, M.; Wittek, E.; Gattermann, S.; Tischmacher, H.; Poll, G.; Ponick, B. Influence of bearing currents on the bearing lifetime for converter driven machines. In Proceedings of the 2012 XXth International Conference on Electrical Machines, Marseille, France, 2–5 September 2012; pp. 1735–1739. [Google Scholar] [CrossRef]
- Mütze, A.; Strangas, E.G. The Useful Life of Inverter-Based Drive Bearings: Methods and Research Directions from Localized Maintenace to Prognosis. IEEE Ind. Appl. Mag. 2016, 22, 63–73. [Google Scholar] [CrossRef]
- Safdarzadeh, O.; Binder, A.; Weicker, M. Measuring Electric Contact in an Axial Ball Bearing at DC Current Flow. IEEE Trans. Ind. Appl. 2023, 59, 3341–3352. [Google Scholar] [CrossRef]
- Dumke, K.; Borsi, H.; Gockenbach, E. Experimental investigations on the behavior of decomposition gases in insulating liquids caused by partial discharge and breakdown. In Proceedings of the 12th International Conference on Conduction and Breakdown in Dielectric Liquids, Roma, Italy, 15–19 July 1996; Mazzetti, C., Ed.; IEEE: Piscataway, NJ, USA, 1996; pp. 436–439. [Google Scholar] [CrossRef]
- Tobazeon, R. Prebreakdown phenomena in dielectric liquids. In Proceedings of the 1993 IEEE 11th International Conference on Conduction and Breakdown in Dielectric Liquids (ICDL’93), Baden-Dattwil, Switzerland, 19–23 July 1993; pp. 172–183. [Google Scholar] [CrossRef]
- Kist, K. Streamerausbreitung im Mischdielektrikum Isolieröl/Transformerboard. Ph.D. Thesis, Logos-Verlag, Berlin, Germany, 1999. [Google Scholar]
- Badent, R.; Julliard, Y.; Kist, K.; Schwab, A. Streamer inception and propagation in insulating liquids with inserted scavenger electrodes. In Proceedings of the 2000 Annual Report Conference on Electrical Insulation and Dielectric Phenomena (Cat. No.00CH37132), Victoria, BC, Canada, 15–18 October 2000; Volume 1, pp. 268–271. [Google Scholar] [CrossRef]
- Ye, W.; Hao, J.; Gao, C.; Zhang, J.; Zhang, J.; Liao, R. Discharge Mechanism Difference Analysis Between Natural Ester and Mineral Oil Under Impulse Electric Field: A DFT Investigation. IEEE Trans. Dielectr. Electr. Insul. 2022, 29, 1803–1810. [Google Scholar] [CrossRef]
- Graf, S.; Koch, O.; Sauer, B. Influence of Parasitic Electric Currents on an Exemplary Mineral-Oil-Based Lubricant and the Raceway Surfaces of Thrust Bearings. Lubricants 2023, 11, 313. [Google Scholar] [CrossRef]
- Graf, S.; Werner, M.; Koch, O.; Götz, S.; Sauer, B. Breakdown voltages in thrust bearings: Behavior and Measurement. Tribol. Trans. 2023, 66, 488–496. [Google Scholar] [CrossRef]
- Ma, J.; Xue, Y.; Han, Q.; Li, X.; Yu, C. Motor Bearing Damage Induced by Bearing Current: A Review. Machines 2022, 10, 1167. [Google Scholar] [CrossRef]
- Mütze, A.; Binder, A. Calculation of Circulating Bearing Currents in Machines of Inverter-Based Drive Systems. IEEE Trans. Ind. Electron. 2007, 54, 932–938. [Google Scholar] [CrossRef]
- Mütze, A.; Binder, A. Calculation of Motor Capacitances for Prediction of the Voltage Across the Bearings in Machines of Inverter-Based Drive Systems. IEEE Trans. Ind. Appl. 2007, 43, 665–672. [Google Scholar] [CrossRef]
- Harder, A.; Piske, L.; Neu, M.; Kirchner, E. Initiierungs- und Abklingeffekte von elektrischen Schädigungsmechanismen im Wälzlager. In Gleit- und Wälzlagerungen 2021; VDI-Berichte, VDI Verlag GmbH: Düsseldorf, Germany, 2021; pp. 65–74. [Google Scholar]
- Joshi, A.; Blennow, J. Investigation of the Static Breakdown Voltage of the Lubricating Film in a Mechanical Ball Bearing. In Proceedings of the Nordic Insulation Symposium, Trondheim, Norway, 9–12 June 2018. [Google Scholar] [CrossRef]
- Schirra, T.; Martin, G.; Neu, M.; Kirchner, E. Feasibility study of impedance analysis for measuring rolling bearing loads. In Proceedings of the 74th STLE Annual Meeting & Exhibition, Nashville, TN, USA, 19–23 May 2019. [Google Scholar]
- Schirra, T.; Martin, G.; Puchtler, S.; Kirchner, E. Electric impedance of rolling bearings—Consideration of unloaded rolling elements. Tribol. Int. 2021, 158, 106927. [Google Scholar] [CrossRef]
- Martin, G.; Becker, F.M.; Kirchner, E. A novel method for diagnosing rolling bearing surface damage by electric impedance analysis. Tribol. Int. 2022, 170, 107503. [Google Scholar] [CrossRef]
- Harder, A.; Zaiat, A.; Becker-Dombrowsky, F.M.; Puchtler, S.; Kirchner, E. Investigation of the Voltage-Induced Damage Progression on the Raceway Surfaces of Thrust Ball Bearings. Machines 2022, 10, 832. [Google Scholar] [CrossRef]
- Gonda, A.; Capan, R.; Bechev, D.; Sauer, B. The Influence of Lubricant Conductivity on Bearing Currents in the Case of Rolling Bearing Greases. Lubricants 2019, 7, 108. [Google Scholar] [CrossRef]
- Mütze, A. Bearing Currents in Inverter-Fed AC-Motors; Berichte aus der Elektrotechnik; Shaker: Aachen, Gernamy, 2004. [Google Scholar]
- Tischmacher, H. Bearing Wear Condition Identification on Converter-fed Motors. In Proceedings of the 2018 International Symposium on Power Electronics, Electrical Drives, Automation and Motion (SPEEDAM), Amalfi, Italy, 20–22 June 2018; pp. 19–25. [Google Scholar] [CrossRef]
- Puchtler, S.; Maier, R.; Kuhn, M.; Burkhardt, Y. Der initiale elektrische Durchschlag: Einflüsse und Auswirkungen. In Gleit- und Wälzlagerungen 2023; VDI-Berichte, VDI Verlag GmbH: Düsseldorf, Germany, 2023; pp. 21–29. [Google Scholar]
Figure 1.
Schematic representation of the experimental procedure to investigate the initial electrical breakdown.
Figure 1.
Schematic representation of the experimental procedure to investigate the initial electrical breakdown.

Figure 2.
Sectional view of the rolling bearing test rig.
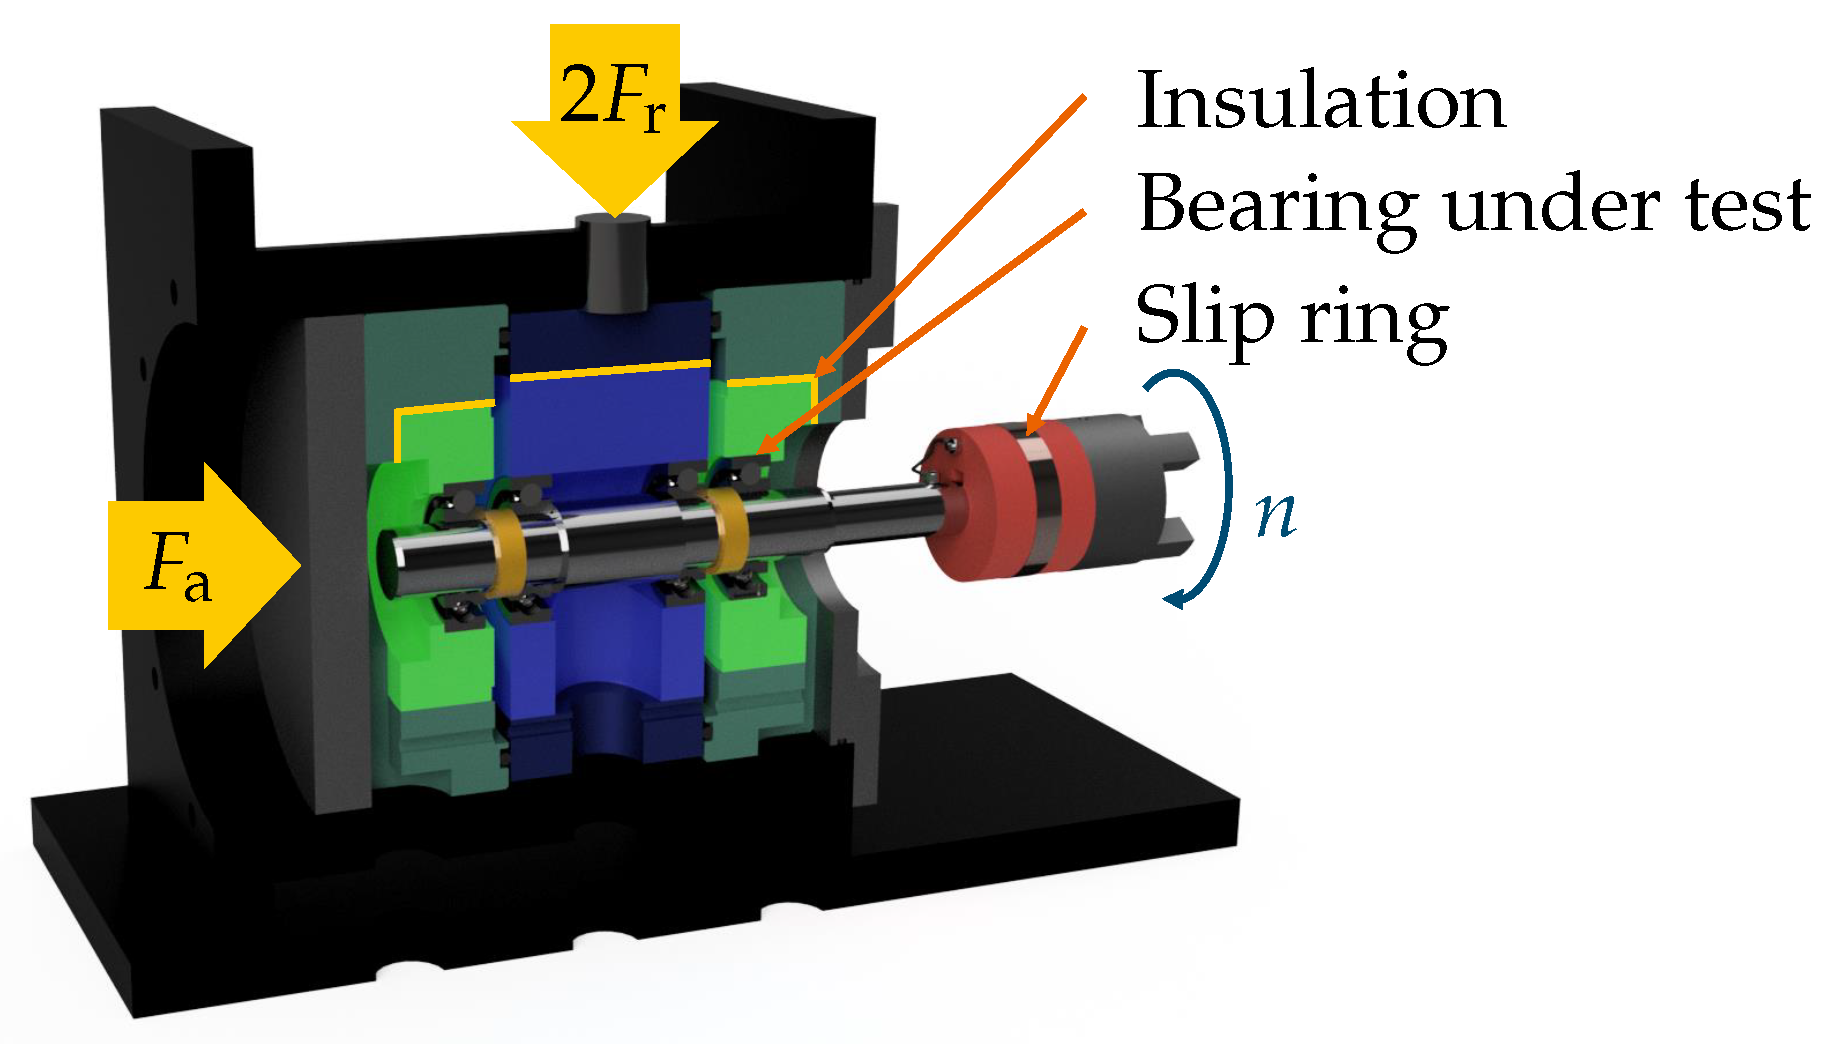
Figure 3.
Electrical setup: (a) Signal normalized to for realistic voltage application. (b) circuit diagram with signal generator, voltage amplifier, current limiting resistor and test bearing, inner (ir) and outer ring (or).
Figure 3.
Electrical setup: (a) Signal normalized to for realistic voltage application. (b) circuit diagram with signal generator, voltage amplifier, current limiting resistor and test bearing, inner (ir) and outer ring (or).

Figure 4.
Graphic representation of the central composite experimental design.
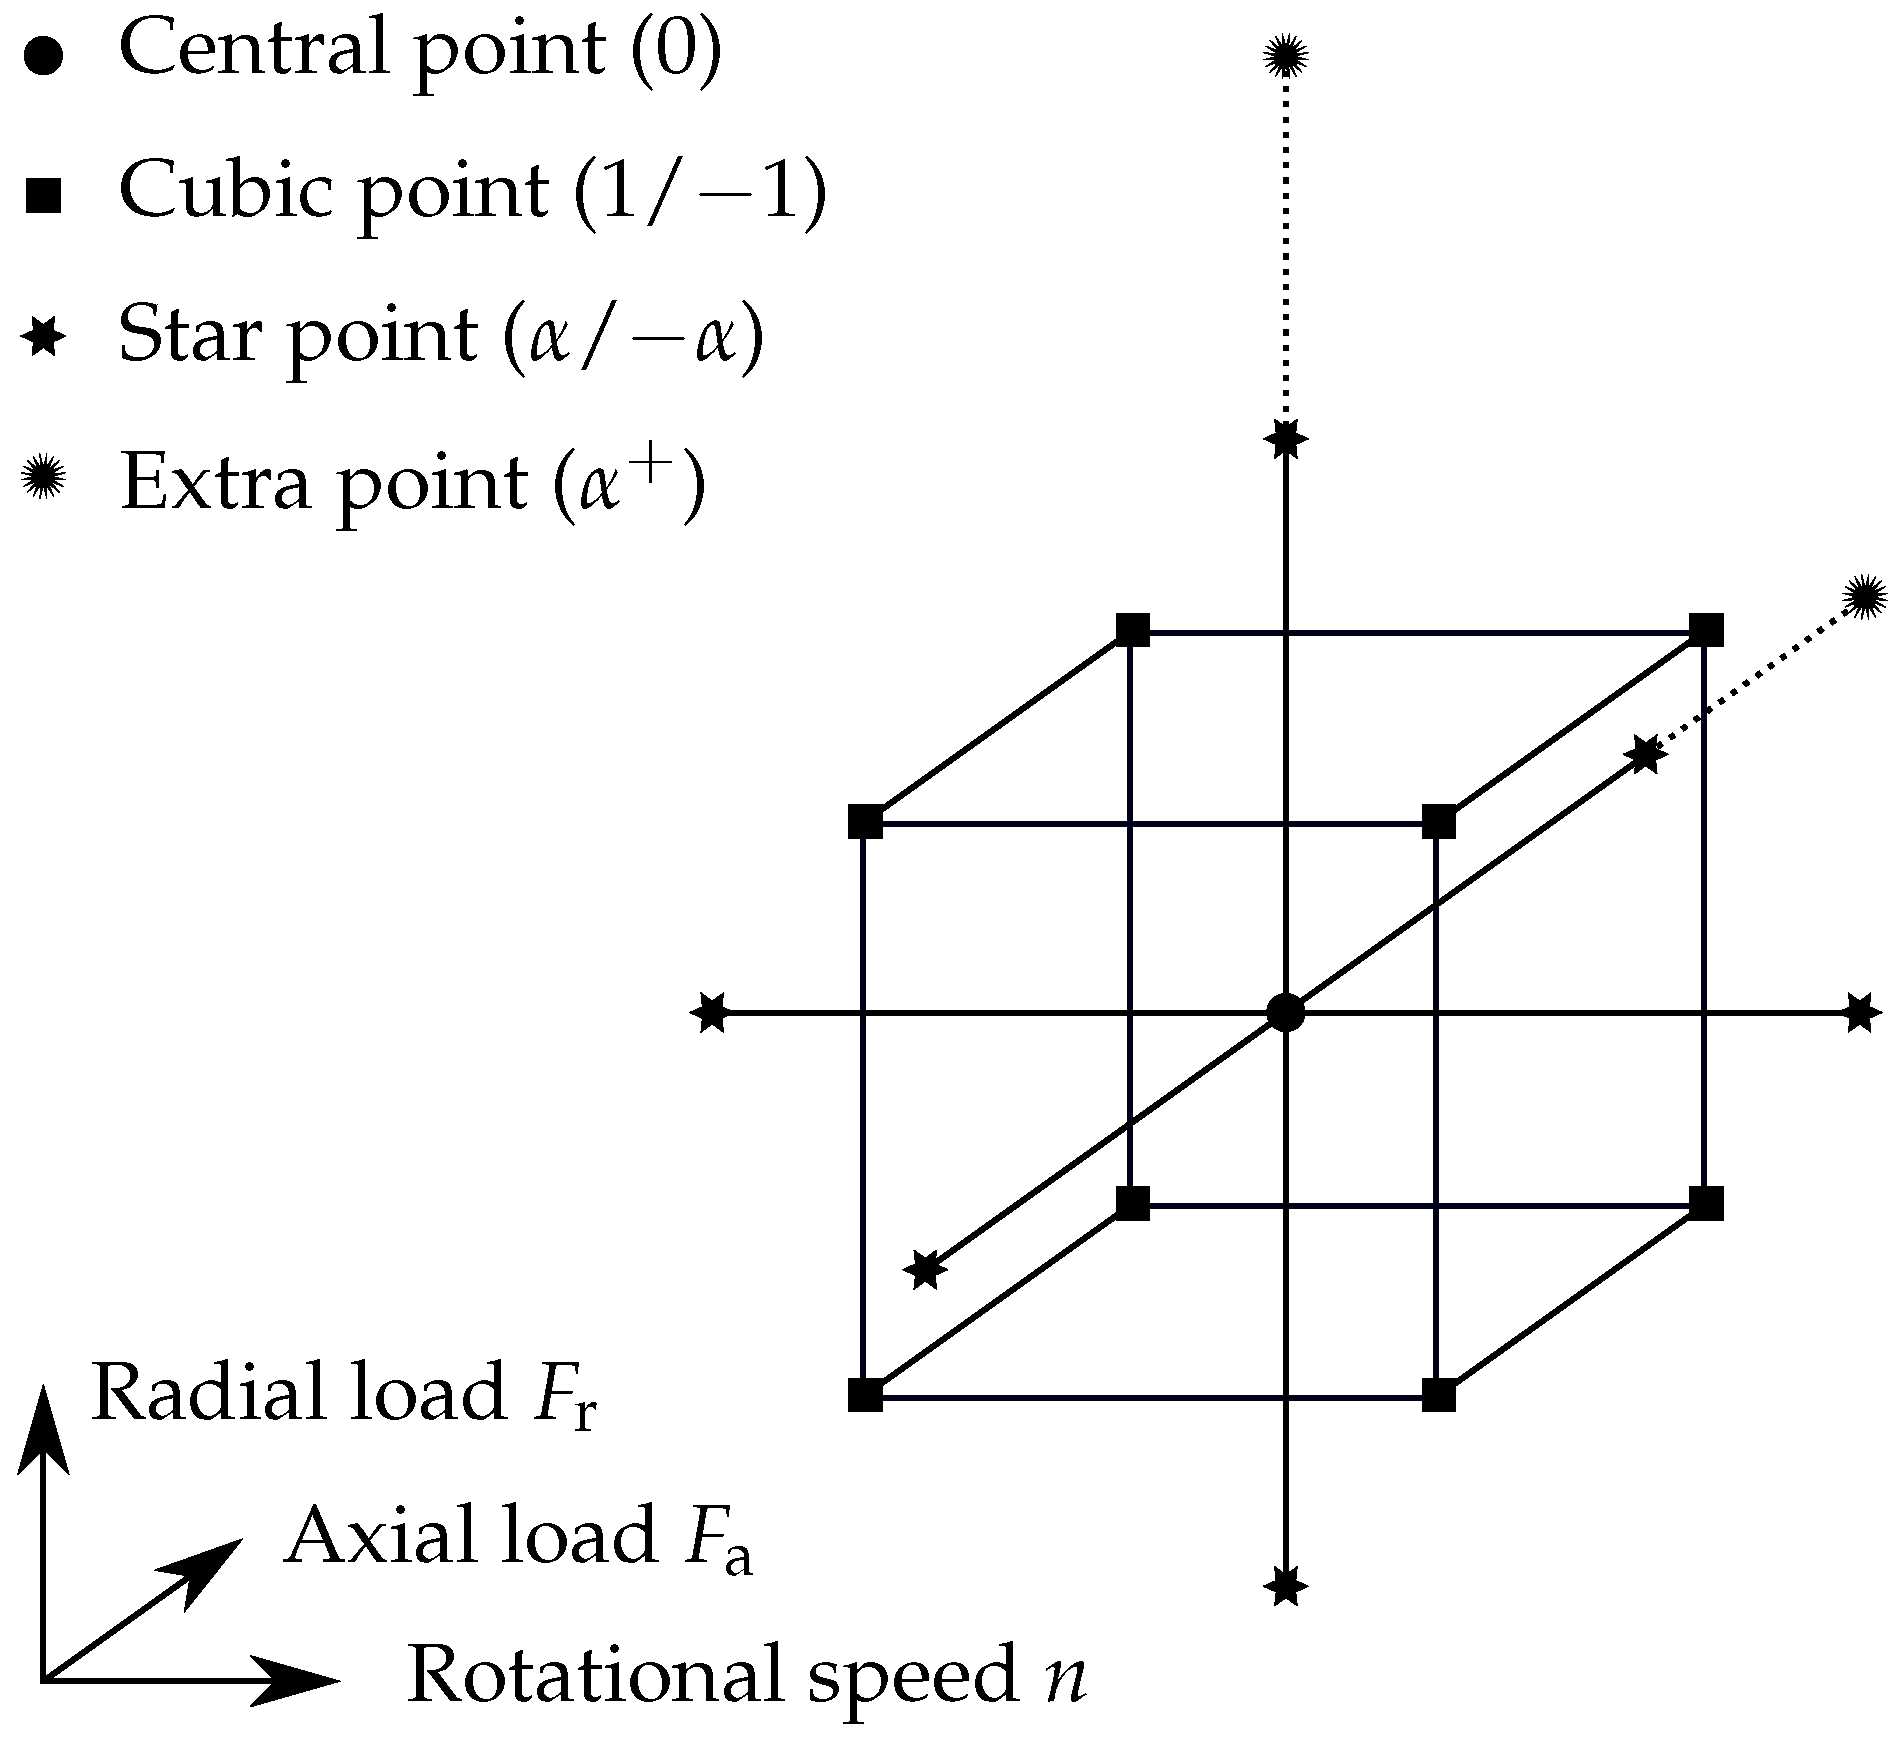
Figure 5.
rms values of bearing voltage and bearing current (a) for the first stair and (b) for the second stair test at , and . The gaps in the measurement data are due to the saving time.
Figure 5.
rms values of bearing voltage and bearing current (a) for the first stair and (b) for the second stair test at , and . The gaps in the measurement data are due to the saving time.
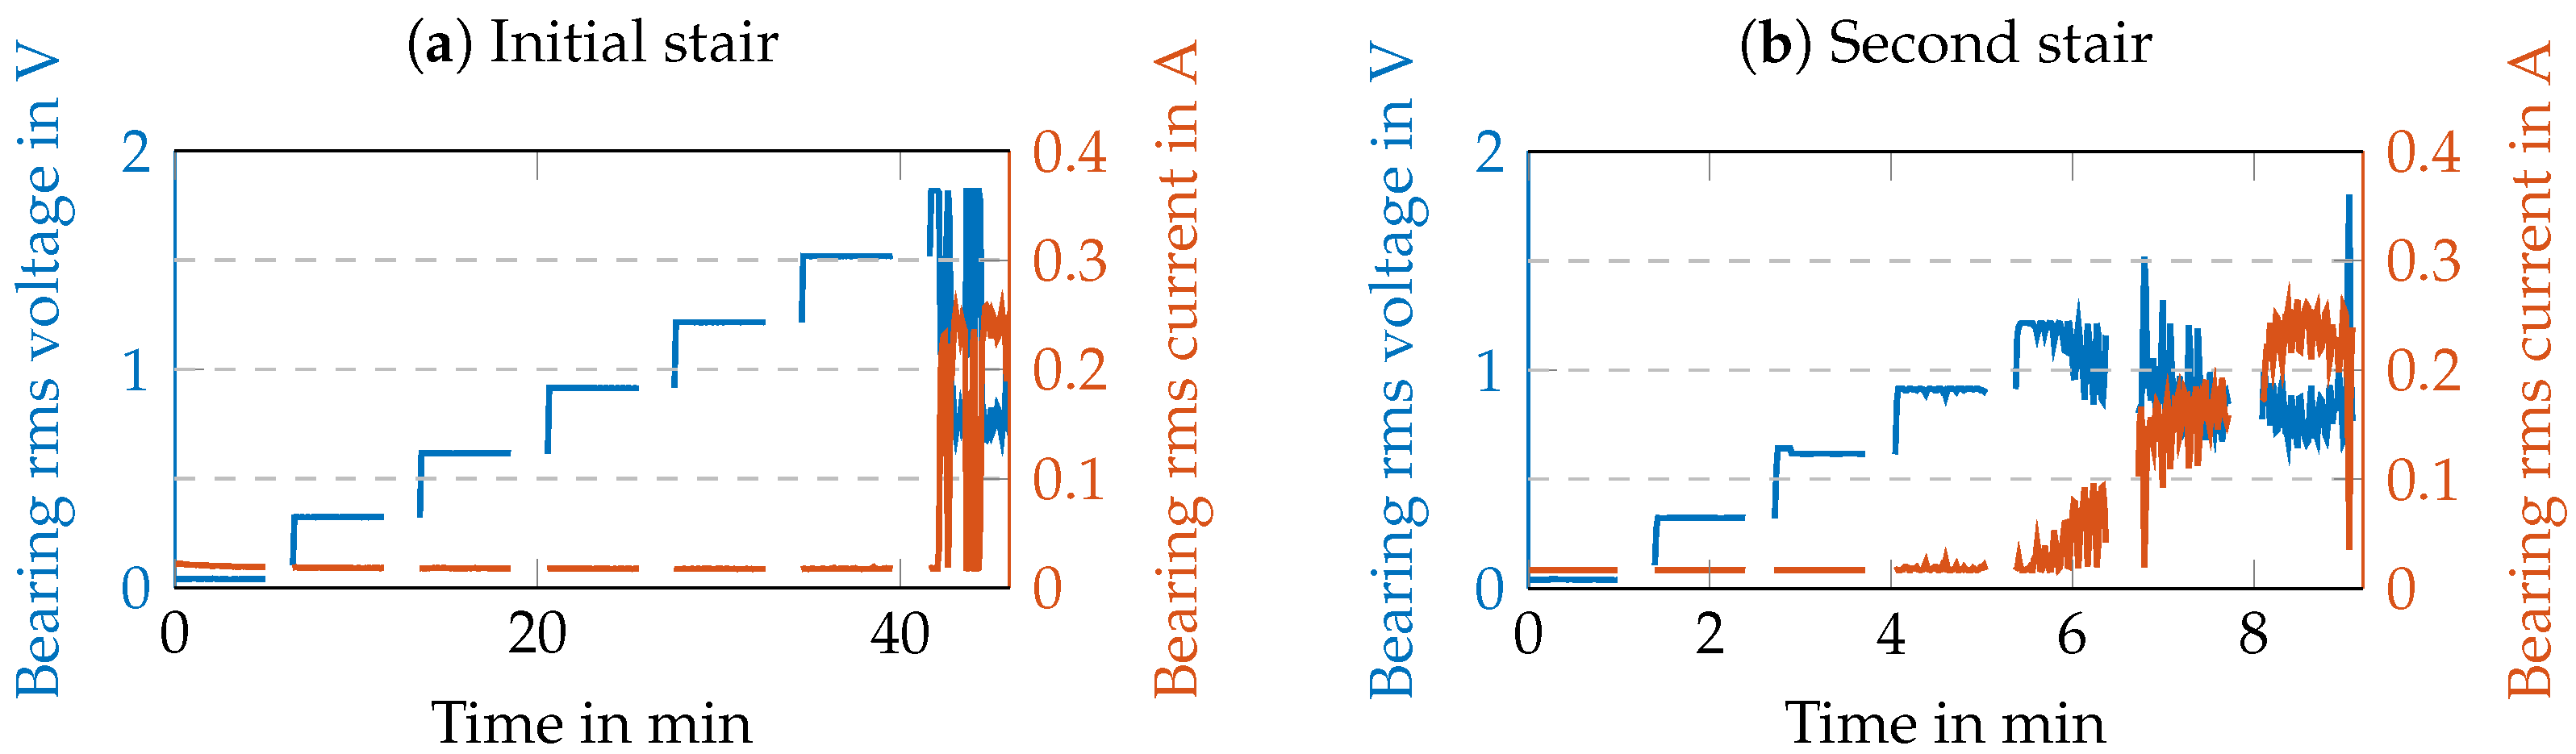
Figure 6.
Scatter plots of the last three steps (a), (b) and (c) of the second stair test of V011. Each red dot represents a positive breakdown, each blue one a negative. Histograms display the distribution over each axis. The total number of breakdowns is given in each caption.
Figure 6.
Scatter plots of the last three steps (a), (b) and (c) of the second stair test of V011. Each red dot represents a positive breakdown, each blue one a negative. Histograms display the distribution over each axis. The total number of breakdowns is given in each caption.

Figure 7.
Electrical rolling bearing damage after test run: fluting on the inner ring (a), discoloration of the lubricant on the rolling element (b) and gray frosting on the outer ring (c) [26].
Figure 7.
Electrical rolling bearing damage after test run: fluting on the inner ring (a), discoloration of the lubricant on the rolling element (b) and gray frosting on the outer ring (c) [26].

Figure 8.
Correlation matrices for input parameters radial load , axial load and rotational speed n. Output as well as output parameters critical voltage amplitude for the initial and the secondary damage (a) and the number of breakdowns per second , the apparent bearing current density and the apparent bearing power (b) for the secondary damage period with .

Table 1.
Detailed overview of the experimental design used.
| Level | Radial Load in | Axial Load in | Speed in |
|---|---|---|---|
| 360 | 180 | 1000 | |
| 600 | 300 | 2000 | |
| 0 | 1200 | 600 | 4500 |
| 1 | 1800 | 900 | 7000 |
| 2040 | 1020 | 8000 | |
| 4000 | 2000 | - |
Disclaimer/Publisher’s Note: The statements, opinions and data contained in all publications are solely those of the individual author(s) and contributor(s) and not of MDPI and/or the editor(s). MDPI and/or the editor(s) disclaim responsibility for any injury to people or property resulting from any ideas, methods, instructions or products referred to in the content. |
© 2023 by the authors. Licensee MDPI, Basel, Switzerland. This article is an open access article distributed under the terms and conditions of the Creative Commons Attribution (CC BY) license (https://creativecommons.org/licenses/by/4.0/).
Share and Cite
MDPI and ACS Style
Puchtler, S.; Maier, R.; Kuhn, M.; Burkhardt, Y. The Influence of Load and Speed on the Initial Breakdown of Rolling Bearings Exposed to Electrical Currents. Lubricants 2024, 12, 1. https://doi.org/10.3390/lubricants12010001
AMA Style
Puchtler S, Maier R, Kuhn M, Burkhardt Y. The Influence of Load and Speed on the Initial Breakdown of Rolling Bearings Exposed to Electrical Currents. Lubricants. 2024; 12(1):1. https://doi.org/10.3390/lubricants12010001
Chicago/Turabian StylePuchtler, Steffen, Robert Maier, Martin Kuhn, and Yves Burkhardt. 2024. "The Influence of Load and Speed on the Initial Breakdown of Rolling Bearings Exposed to Electrical Currents" Lubricants 12, no. 1: 1. https://doi.org/10.3390/lubricants12010001
Note that from the first issue of 2016, this journal uses article numbers instead of page numbers. See further details here.