Simulation Analysis and Experimental Research on Electric Thermal Coupling of Current Bearing


School of Mechatronics Engineering, Henan University of Science and Technology, Luoyang 471003, China
*
Author to whom correspondence should be addressed.
Lubricants 2024, 12(3), 73; https://doi.org/10.3390/lubricants12030073
Submission received: 30 January 2024
/
Revised: 20 February 2024
/
Accepted: 22 February 2024
/
Published: 26 February 2024
(This article belongs to the Special Issue Tribological Characteristics of Bearing System, 2nd Edition)
Abstract
:With the advancement of industries such as high-speed railways, new energy vehicles, and wind power, bearings are frequently exposed to various electric field environments, leading to the need for lubricating oil films of bearings to withstand voltage. One of the major issues caused by the breakdown discharge process of the lubricating oil film in bearings is the generation of local instantaneous high temperatures. This temperature rise is a key factor contributing to problems such as high operating temperature of bearings, surface damage in the contact area, and degradation of lubrication performance. This research article focuses on the comprehensive influence of bearing friction and electrical factors. It establishes a heat source calculation model and a temperature field simulation model specifically for current-carrying bearings. This study analyzes both the overall temperature rise of bearings and the local temperature rise resulting from breakdown discharge. Furthermore, the accuracy of the simulation analysis is verified through experiments. The temperature field simulation and experimental results consistently indicate that electrical environmental factors can cause an increase in the overall temperature rise of a bearing. Additionally, the breakdown and discharge of the lubricating oil film generate local instantaneous high temperatures in the contact area of the bearing.
1. Introduction
With the development of industries such as high-speed railways, new energy vehicles, and wind power, bearings are increasingly exposed to various electric field environments. This electrical intervention can result in a new type of damage known as electrical corrosion in bearings [1]. In sectors like high-speed railways and new energy vehicles, AC motors are widely utilized due to their excellent operational and control characteristics when driven by a variable-frequency power supply, which has led to significant economic benefits. However, despite the substantial economic advantages brought about by variable-frequency drive technology, it also has negative consequences, with electrical corrosion of bearings being a particularly severe issue [2,3,4]. When the shaft voltage remains below the threshold voltage of the bearing oil film, the bearing functions as a capacitor, and the dv/dt current represents the charging and discharging current of the bearing capacitor. Typically, this value is minimal and does not cause any damage to the bearing. However, when the shaft voltage exceeds the threshold voltage of the lubricating grease film, the electrical energy stored in the parasitic capacitor will generate a discharge pulse current, which is referred to as the discharge bearing current [5,6]. The amplitude of the change in electric field strength in the lubricating oil film is a crucial factor in determining the level of bearing discharge. The breakdown field strength is influenced by several factors, including the viscosity of the base oil, the use of additives, and humidity. The breakdown strength of the lubricating oil film typically falls within the range of 15–50 kV/mm [7]. In the Hertz contact area of bearings, the thickness of the oil film center is generally around 0.2–0.8 μm [8]. If the shaft voltage exceeds 3 V, it can result in breakdown discharge in the Hertz contact area, leading to local high temperatures and potential electrical corrosion damage to the bearing.
The issue of motor shaft current caused by frequency converters has become increasingly prominent with their widespread use in driving AC motors. Since the 1990s, this topic has received significant attention in academic reports [9,10]. Scholars have conducted research on the phenomenon of bearing electrical corrosion during this period. Tischmacher et al. [11] demonstrated through experiments that the thickness of the lubricating oil film and its breakdown are influenced by the magnitude of the applied voltage, conductivity of lubricating grease, and bearing speed. El Hadj Miliani [12] highlighted the detrimental effects of axle current on the service life of bearings in railway locomotives and electric vehicles. Romanenko et al. [13] analyzed the changes in the dielectric strength and chemical properties of various lubricating greases under the influence of current, providing an explanation for bearing damage. Niu K. et al. [14] described the mechanism of shaft voltage and shaft current generation, and analyzed the associated hazards such as material weakening, surface ablation, and lubrication deterioration, along with their relative mechanisms. The calculation of the capacitance of the bearing lubricating oil film and the shaft current is a crucial step in analyzing the phenomenon of bearing electrical corrosion. Binder et al. [15] considered the bearing as a flat plate capacitor, with the Hertz contact surface as the polar plate and the lubricating oil film center thickness as the polar plate spacing. They analyzed the bearing based on this model. Lu F.M. [16] developed circuit models for ordinary bearings and insulated bearings to analyze performance indicators such as the insulation resistance, AC voltage value, and coating capacitance of insulated bearing coatings. Liu R.F. et al. [17] proposed a bearing capacitance calculation method based on electromagnetic field and determined the center thickness of the bearing oil film using the theory of elastohydrodynamic lubrication. They established a finite element analysis model and calculated the equivalent capacitance of the bearing. Xiong F. et al. [18] took into account the variation in the radial clearance of bearings and the eccentricity of motor air gaps. They divided the equivalent capacitance of bearings into Hertz contact capacitance and non-Hertz contact capacitance based on Hertz contact theory, and established a calculation model for the equivalent capacitance of bearings. From a microscopic perspective, the bearing raceway and rolling element act as the electrodes, with the medium being an oil film. Bearing breakdown is considered a form of fine electric spark breakdown. The breakdown mechanism of liquid media in general electric spark breakdown is usually explained using the electron avalanche theory [19]. Subsequently, J M. Meek and L.B. Loeb proposed the streamer theory to address the limitations of the electron avalanche theory in terms of breakdown time [20]. When the lubricating oil film of a bearing is disrupted, it can lead to local instantaneous high temperature, resulting in partial melting of the contact area. Analyzing the temperature field of the bearing is an important step in evaluating its performance indicators. Lei J. et al. [21] developed a steady-state calculation model for bearings using the thermal network method. They considered various factors that affect the friction power consumption of bearing components. Liu Y.Y. et al. [22] established the dynamic differential equations of the double-row angular contact ball bearing based on the rolling bearing dynamics theory. Li J.S. et al. [23] used a local method to construct a calculation model for friction power consumption in bearings. They established a heat transfer model and analyzed the impact of rotational speed, axial force, and lubricating oil temperature on the temperature rise in the bearing system. Xie Y.B. et al. [24] developed a mathematical model for heat generation in bearings at different speeds based on friction and heat transfer theories. They used finite element software to simulate and calculate the temperature field distribution of bearings and bearing seats without cooling structures. Wang Q.Q. et al. [25] established a model for bearing discharge breakdown and conducted electric–thermal coupling simulations to determine the temperature rise at the breakdown channel and point over time. They also proposed a method for determining the critical current of bearing electrical corrosion. While there are numerous comprehensive theories and methods available for analyzing the temperature fields of conventional bearings, there is a noticeable lack of research on the analysis of temperature fields in bearings operating in electrical environments.
This article presents a calculation model for two types of heat sources: comprehensive friction power consumption and electric heating power consumption. It provides simulation analysis models and methods for the temperature rise in the outer ring of the bearing and the local temperature rise in the contact area, which are then validated through experiments.
2. Simulation Model of Heat Generation in Current-Carrying Bearings
In previous studies on temperature field analysis of bearings, researchers have often focused solely on the power loss caused by friction. However, in the case of current-carrying bearings, it is necessary to consider both the power consumption due to friction and the power consumption due to electric heating. Therefore, this section presents a heat generation model that accounts for both factors in current-carrying bearings.
2.1. Equivalent Circuit of Current Bearing
During the operation of a current bearing, a shaft current is generated. As the current passes through the bearing, it encounters resistance, leading to energy loss. This lost energy is converted into heat, causing the bearing temperature to increase. Hence, it is crucial to construct an equivalent circuit for current-carrying bearings, establish a model for heat generation due to current, and analyze it.
The insulation coating (ceramic layer attached to the outer diameter surface of the bearing and the two outer ring end faces) capacitance, inner and outer ring resistance, steel ball resistance, and oil film capacitance of the current-carrying bearing collectively form a hybrid circuit during operation. In the non-load-bearing area, the surface of the steel ball is covered by a thicker liquid film compared to the lubricating oil film in the load-bearing area, and the capacitance can be disregarded. Hence, when constructing an equivalent circuit, only the load-bearing area needs to be taken into account.
In the case of bearings with multiple steel balls, the capacitance and resistance between the steel balls and the inner and outer raceways are connected in series. However, the steel balls themselves are connected in parallel. When a bearing is coated with a ceramic coating, the capacitance of the ceramic coating is connected in series with the equivalent capacitance of the bearing. The equivalent circuit of a single steel ball in a bearing consists of a combination of a capacitor and an oil film resistance. This oil film is formed by the lubricating oil between the steel ball and the inner and outer rings. The schematic diagram of the bearing is depicted in Figure 1.
According to Figure 2, the circuit model of the bearing can be represented as a parallel connection of steel ball units, combined with the inner and outer ring resistors, coating capacitors, and resistors. From a circuit equivalence perspective, when the bearing is intact, the steel ball, inner and outer raceways, lubricating oil film, and coating together form the equivalent capacitance of the bearing. The lubricating oil film primarily carries the voltage in this state. However, when the lubricating oil film breaks down, the steel ball and inner and outer raceways enter a resistive state with a very small resistance value. In this case, the majority of the voltage is borne by the coating.
2.2. Calculation of Current-Carrying Bearing Capacitance
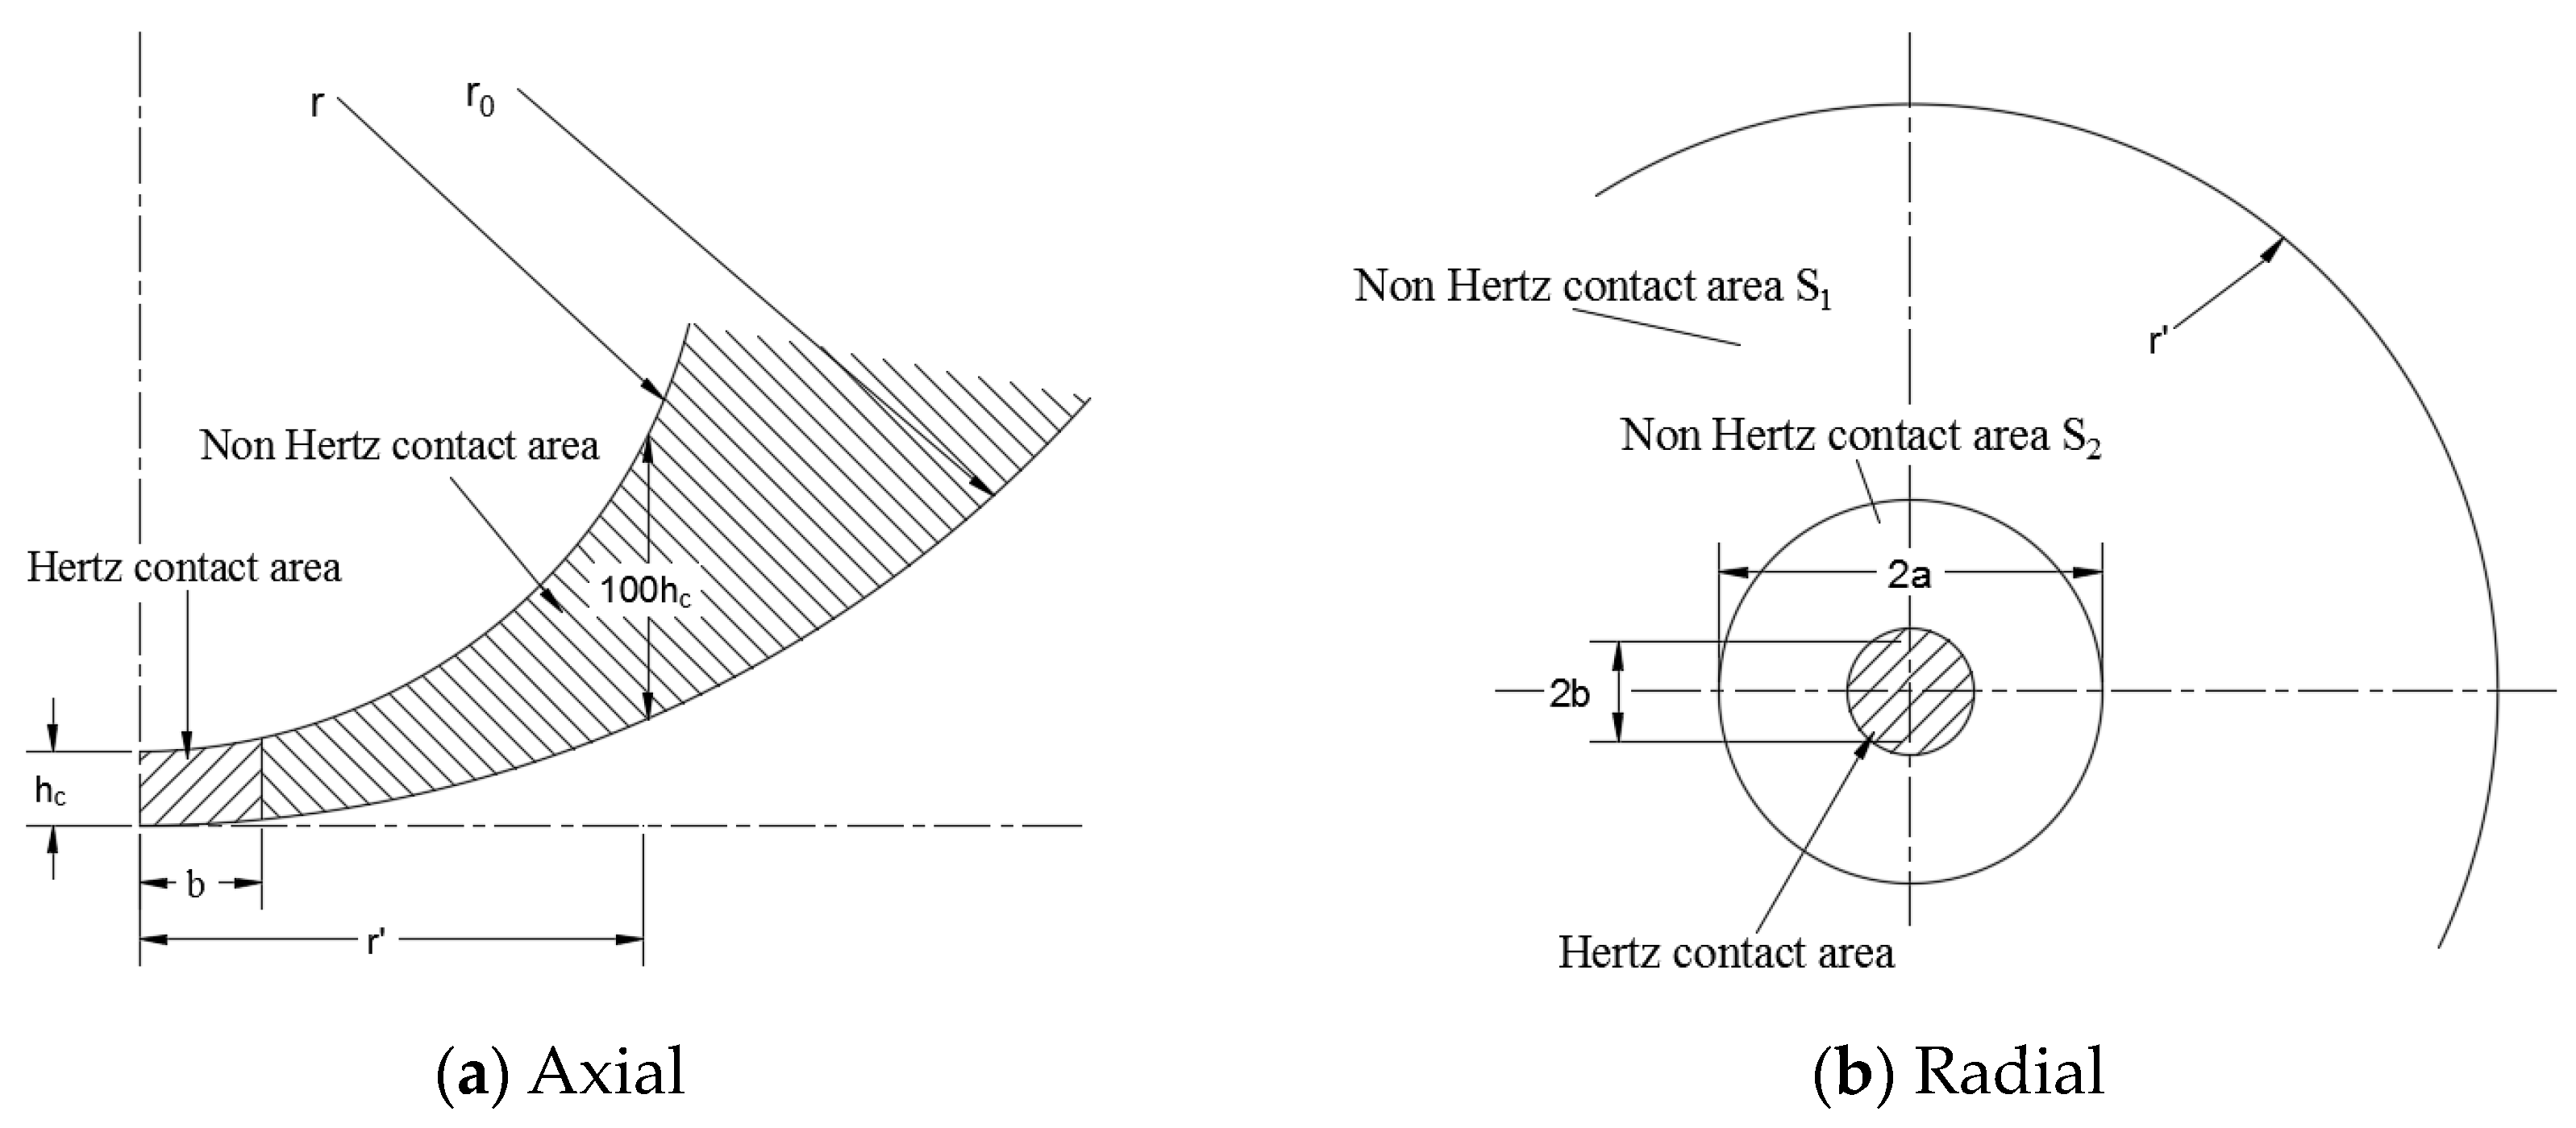
Constructing an equivalent circuit and calculating the equivalent capacitance of current-carrying bearings are important steps in the analysis. Figure 3 illustrates the structure of the bearing and the Hertz contact deformation diagram. It can be observed that the bearing capacitance in the bearing area can be considered as a parallel connection of two types of capacitors. The first type is the Hertz contact capacitance, denoted as , which is formed in the Hertz contact region. The second type is the non-Hertz contact capacitance, denoted as , which is formed in the non-Hertz contact region. These two capacitances are connected in series to obtain the total capacitance, and , of the inner and outer rings of a single steel ball. The capacitance formed by the steel ball and the inner and outer raceway oil film is also connected in series to obtain the capacitance of a single steel ball. The capacitance formed by the steel balls in the bearing area is connected in parallel, ultimately resulting in the total bearing capacitance, .
The steel ball and raceway experience elastic deformation upon contact, transitioning from point contact to surface contact and eventually creating an elliptical Hertz contact area. The Hertz contact capacitance between the steel ball and the inner or outer raceway is as follows:
In the formula, is the vacuum dielectric constant, is the relative dielectric constant, is the Hertz contact area, and is the central oil film thickness.
When a bearing is only subjected to radial force, the central oil film thickness between a single steel ball and raceway in the load zone can be calculated using the theory of elastohydrodynamic lubrication and by considering the structure of the bearing steel ball and raceway. The formula for this calculation is provided in reference [26].
In the formula, is the viscosity pressure index of the lubricating grease; is the density of the lubricating grease; is the viscosity of the lubricating grease base oil, which is related to the temperature of the working environment of the lubricating grease; is the average velocity of the contact surface between the steel ball and the raceway; is the equivalent curvature radius along the rolling direction of the steel ball; is the equivalent curvature radius in the axial plane; is the ellipticity of the stress area; is the equivalent elastic modulus of the steel ball and ring; and is the maximum load borne by the steel ball.
According to Hertz contact theory, the contact area between the steel ball and raceway of deep groove ball bearings is elliptical [27]. Therefore, the formula for calculating the area of the ellipse formed by contact deformation at the contact point is as follows:
In the formula, and are the major and minor axes of the elliptical surface, respectively.
Figure 3 illustrates the plane projection of the contact deformation between the steel ball and the raceway in the non-Hertz contact area of the bearing. When calculating the capacitance in this area for a ball bearing, only the portion that has a notable influence on the capacitance is taken into account. The capacitance between the steel ball and the inner or outer raceway, within the axial and radial contact points, is determined as follows [8]:
In the formula, is the horizontal distance projected from this point to the surface of the raceway when the gap thickness between the steel ball and the raceway is , is the radius of the steel ball, and is the raceway radius.
For both the inner and outer raceways of the bearing, there are and . The total capacitance between each steel ball in the bearing area and the inner raceway is . This capacitance is the parallel connection of the Hertz contact area capacitance of the inner raceway and the non-Hertz contact area capacitance of the inner raceway. It can be represented as follows:
The formula for calculating the equivalent capacitance of bearings is as follows:
After applying an insulation coating to the outer ring of the bearing, the capacitance of the insulation coating is connected in series with the capacitance of the lubricating oil film of the bearing. The calculation formula for the total capacitance of the bearing is as follows:
The electric thermal energy loss caused by the presence of a shaft current in the current-carrying bearing can be determined by calculating the shaft current and the equivalent impedance of the bearing , based on the established equivalent circuit. As stated in [28], the formula for calculating the current through the capacitor and the equivalent impedance of the capacitor is as follows:
In the formula, is the frequency value of the applied excitation signal.
2.3. Calculation Model of Bearing Heat Source
In the case of grease-lubricated current-carrying bearings guided by steel balls, the power consumption generated during operation is a combination of various factors. These include friction power consumption caused by elastic hysteresis between steel balls and raceways, friction power consumption caused by differential sliding between steel balls and raceways, friction power consumption caused by spin sliding of steel balls, friction power consumption between steel balls and cages, and friction power consumption caused by oil film viscosity loss [21]. Additionally, current-carrying bearings may experience electrical energy losses due to the shaft current.
Combining Equations (8) and (9), the formula for calculating the electric thermal energy loss of current bearings due to the presence of a shaft current is as follows:
The formula for calculating the total friction power consumption of ball bearings is as follows:
In the formula, is the friction power consumption caused by the elastic hysteresis of the steel ball, is the friction power consumption caused by the differential sliding between the steel ball and the raceway, is the friction power consumption caused by the spin sliding of the steel ball, is the friction power consumption between the steel ball and the cage, is the friction power consumption caused by the loss of oil film viscosity, and is the total friction power consumption of the bearing.
3. Simulation and Analysis of Temperature Field in Current-Carrying Bearings
In this article, we first simulate the temperature field to study the frictional heat generation in current-carrying bearings. The simulation helps us to determine the temperature in the contact area between the bearing steel ball and the inner and outer rings. Subsequently, we use this temperature as the initial temperature to perform electric thermal coupling simulation on the bearings.
3.1. Temperature Field Simulation Model
This article focuses on the modeling and analysis of 6215 bearings with insulation coatings for motors. The structural parameters of the bearing are shown in Table 1, and the relevant parameters of the lubricating grease are shown in Table 2.
A simplified model of the bearing is illustrated in Figure 4. It comprises an air fluid domain, a simplified model of the bearing seat, a simplified model of the bearing’s inner and outer rings, and a lubricating grease fluid domain (consisting of the bearing cavity and grease storage chamber). The outermost layer is the air layer, with the outer air wall set to room temperature. Heat exchange occurs between the air and the bearing seat through convection. The bearing seat wraps around the bearing and the lubricating grease storage chamber. The inner ring comes into contact with the main shaft, and the bearing seat exhibits better heat dissipation performance compared to the shaft. The issue of shaft heat dissipation is not taken into consideration. The lubricating grease outlet is located in the red section on the side of the bearing, and the outlet is assumed to dissipate heat through air convection.
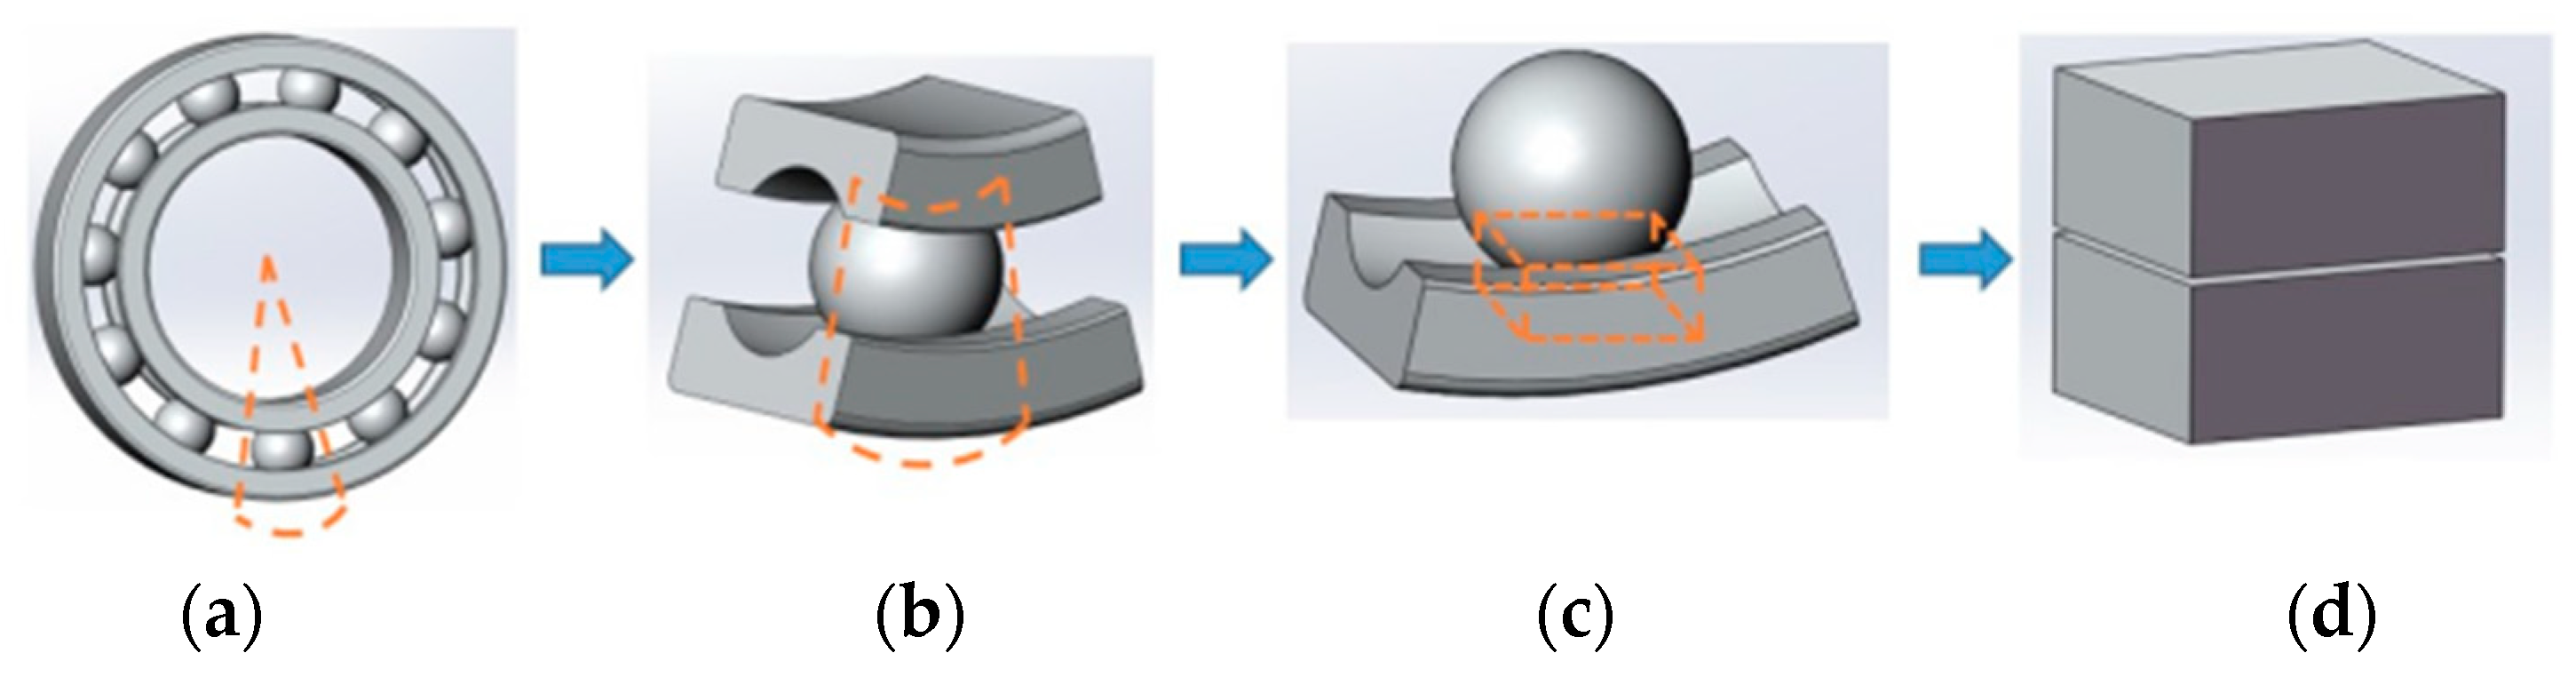
The erosion pit area between the current bearing steel ball and the raceway is very small. In order to improve calculation efficiency without compromising simulation accuracy, it is necessary to reasonably simplify the bearing electric thermal coupling simulation model. When the bearing is subjected to radial load, the steel ball directly beneath the bearing area bears the maximum load. The lubricating oil film thickness in this contact area is the smallest, making it more susceptible to breakdown. Therefore, the steel ball and the inner and outer local raceways in contact with it were selected as the objects of the electric thermal coupling simulation (refer to Figure 5a,b). Since the breakdown of the bearing oil film only occurs locally, only a small portion of the oil film is considered when simulating the temperature field of the bearing’s electric thermal coupling. Consequently, the simulation model will be further simplified by focusing on a cube centered on the Hertz contact part between the steel ball and the raceway (refer to Figure 5c). Finally, the remaining parts were removed, and the intercepted steel balls and raceways were locally enlarged to obtain the corresponding bearing electric thermal coupling simulation model, as shown in Figure 5d.
In order to analyze the breakdown of the bearing’s lubricating oil film involving electromagnetics and thermodynamics, a simulation analysis was conducted using Comsol. The analysis involved adding the current physical field and transient temperature field. The temperature and its variation patterns at different positions in the current channel of the bearing’s lubricating oil film were analyzed. Figure 6 shows the points selected for analysis in the current channel. Point a, located at the center of the plane where the excitation current is applied, is the breakdown point within the current channel and serves as the connection between the outer raceway of the bearing and the current channel. Point B, located at the junction of the current channel and the lubricating oil film, belongs to the outer layer of the current channel. Point c is located at the center of the current channel. Point d, located on the other side of the penetration point that is symmetrical with point a in the horizontal plane of the model center, serves as the connection between the current channel and the steel ball.
During the operation of the bearing, the outer ring remains stationary while the steel ball and inner raceway rotate. The contact between the steel ball and any point on the inner and outer raceway is dynamic. This contact area experiences electrical erosion and breakdown, which involves the establishment of a breakdown channel, breakdown, and elimination processes. The duration of this process is determined by the relative motion speed. Additionally, it is important to calculate the time it takes for the steel ball to roll over the breakdown area and simulate the resulting temperature rise in the current channel during this time.
The calculation formula for the time required for the steel ball to roll over the current path area is as follows:
In the formula, is the cross-sectional diameter of the current channel, which is the short half axis of the contact elliptical surface; is the relative velocity of the steel ball relative to the inner and outer raceways, which can be obtained from [26].
3.2. Simulation Results of Frictional Heat Generation Temperature Field
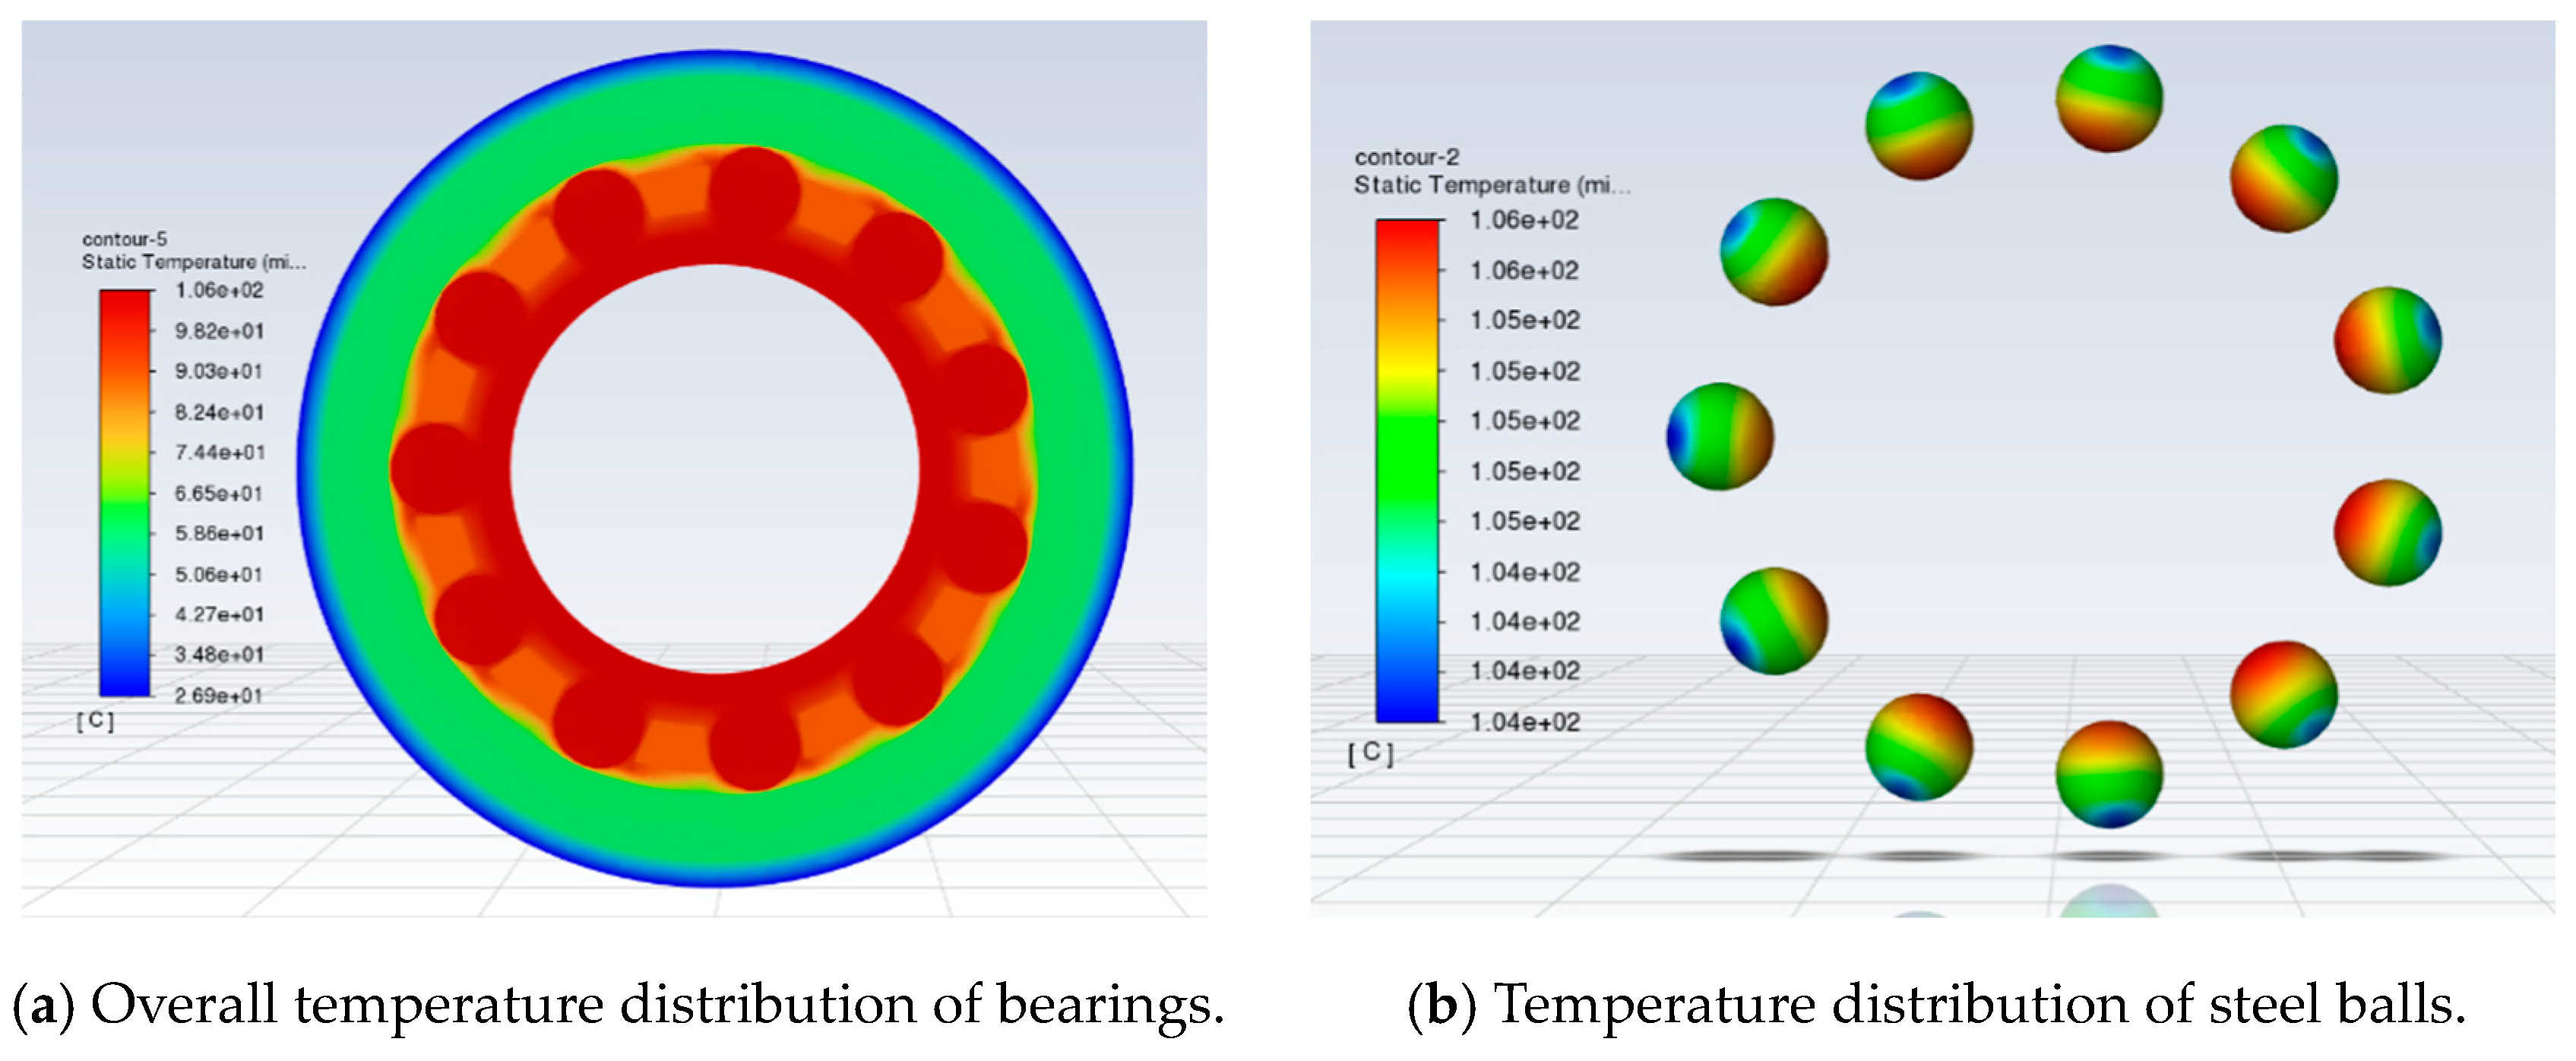
According to Section 2.1, the power consumption resulting from friction heat in the bearing under the specified working conditions was calculated to be 220 W. This power was then allocated and used to simulate the temperature distribution using the Ansys Fluent module, as shown in Figure 7. From the figure, it can be observed that the outer ring of the bearing reached a maximum temperature of 58.6 °C, whereas the contact area between the steel ball and the inner raceway reached a maximum temperature of 106 °C, and the contact area between the steel ball and the outer raceway reached a maximum temperature of 104 °C.
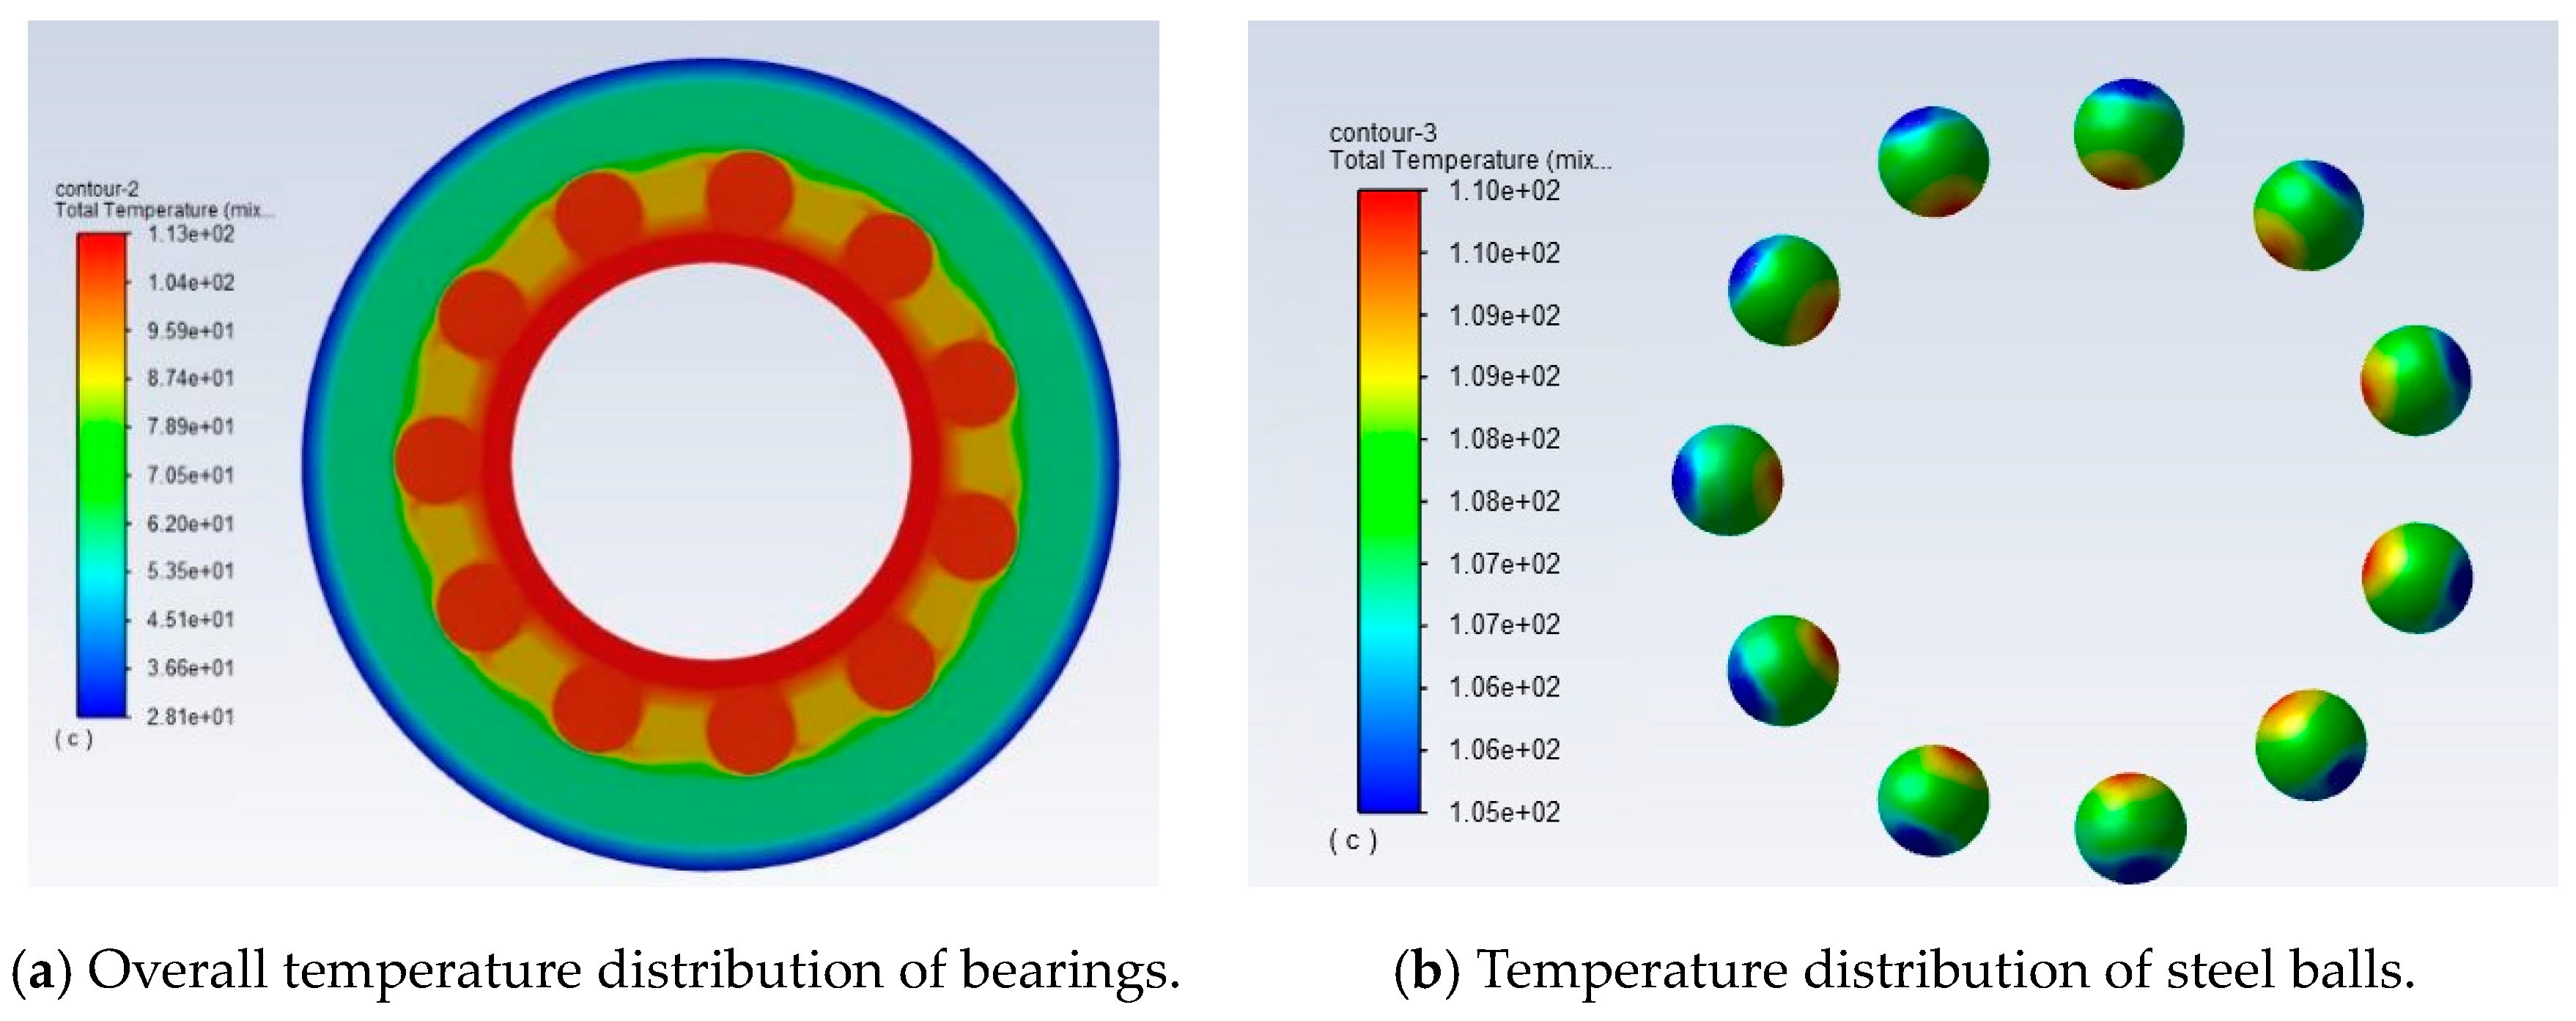
After applying a peak voltage of 90 V and a frequency of 100 kHz to the bearing, the electric heating generated a power consumption of 18.76 W. The temperature distribution was obtained through temperature field simulation, as shown in Figure 8. From the figure, it can be observed that the outer ring of the bearing reached a maximum temperature of 62 °C after applying the voltage. The contact area between the steel ball and the inner raceway reached a maximum temperature of 110 °C, while the contact area between the steel ball and the outer raceway reached a maximum temperature of 105 °C.
Under specific operating conditions, the temperature in the contact area between the steel ball and the inner ring of the bearing surpassed that of the outer ring. This was attributed to the higher relative speed of the steel ball to the inner ring compared to the outer ring. Following power activation, the temperature of all bearing components increased, aligning with the electric heating phenomenon.
3.3. Simulation Analysis of Local Temperature Rise in the Contact Area of Current Bearing
After conducting measurements, the capacitance range of the insulation coating of the insulated ball bearing used in the experiment was found to be between 1.3 nF and 1.6 nF. For the purpose of this article, a value of 1.45 nF was considered. When the operating conditions included an inner ring speed of 4500 r/min and a radial load of 4.6 kN, the calculated bearing capacitance value was as shown in Table 3.
A sinusoidal AC signal with a peak-to-peak voltage of 60 V and 90 V, as well as a voltage frequency of either 100 kHz or 130 kHz, were applied to the bearing. The shaft current values before and after the breakdown of the lubricating oil film were calculated, as indicated in Table 4.
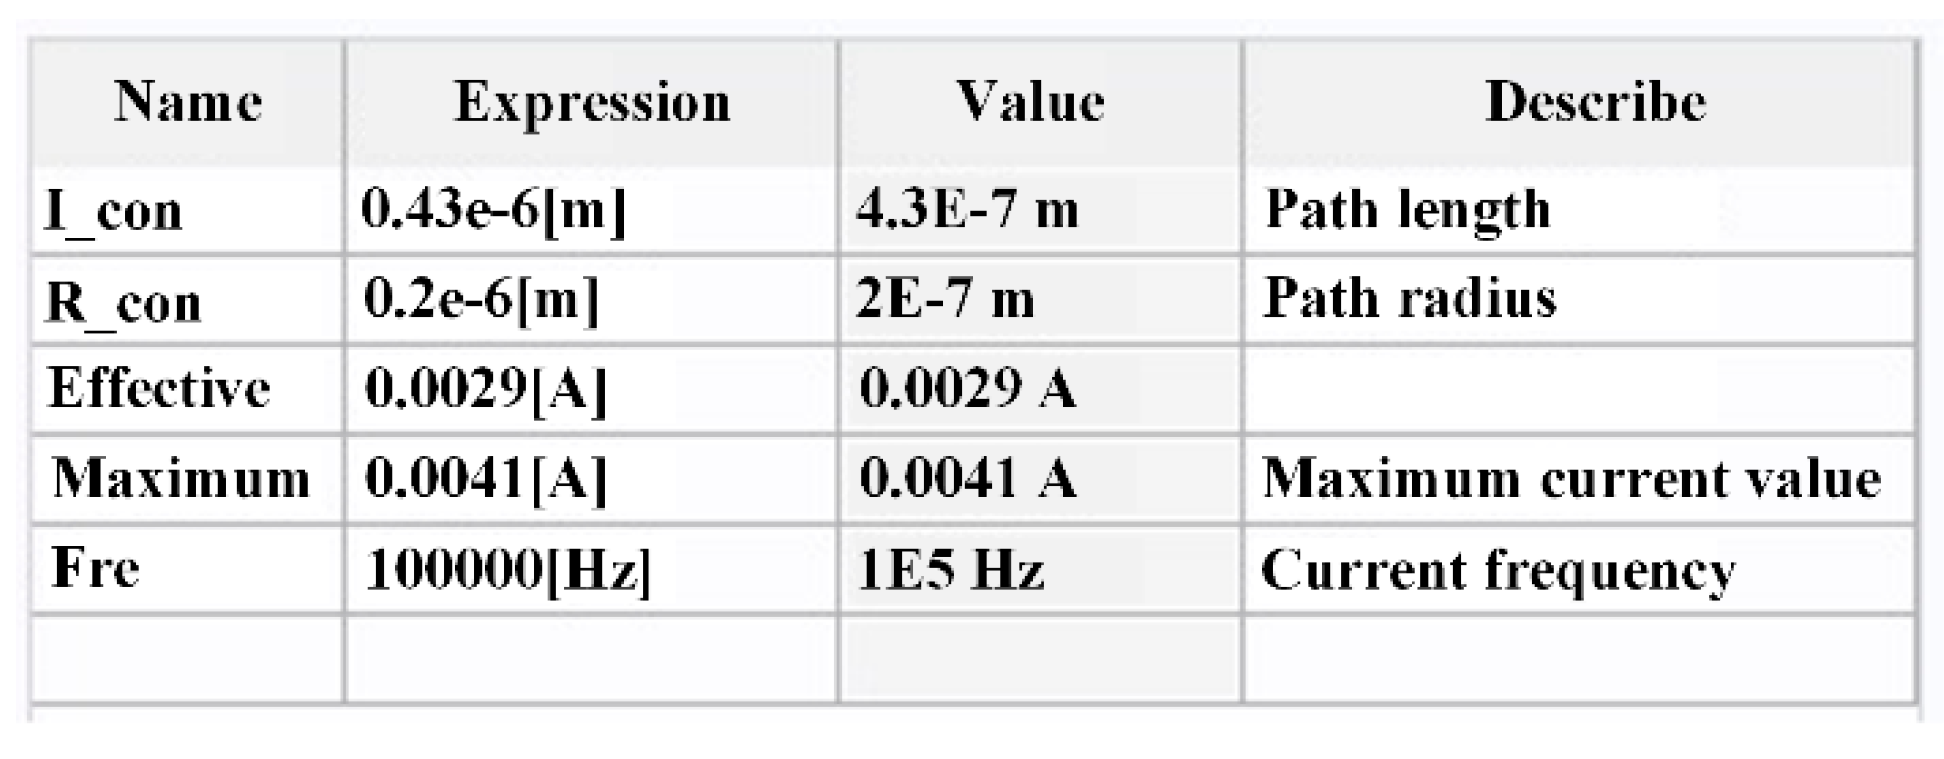
The simulation model of the electric thermal coupling temperature field, as described in Section 3.1, was established. The Comsol 6.0 software was used to simulate the electric thermal coupling temperature field, and the relevant parameters were set according to Figure 9.
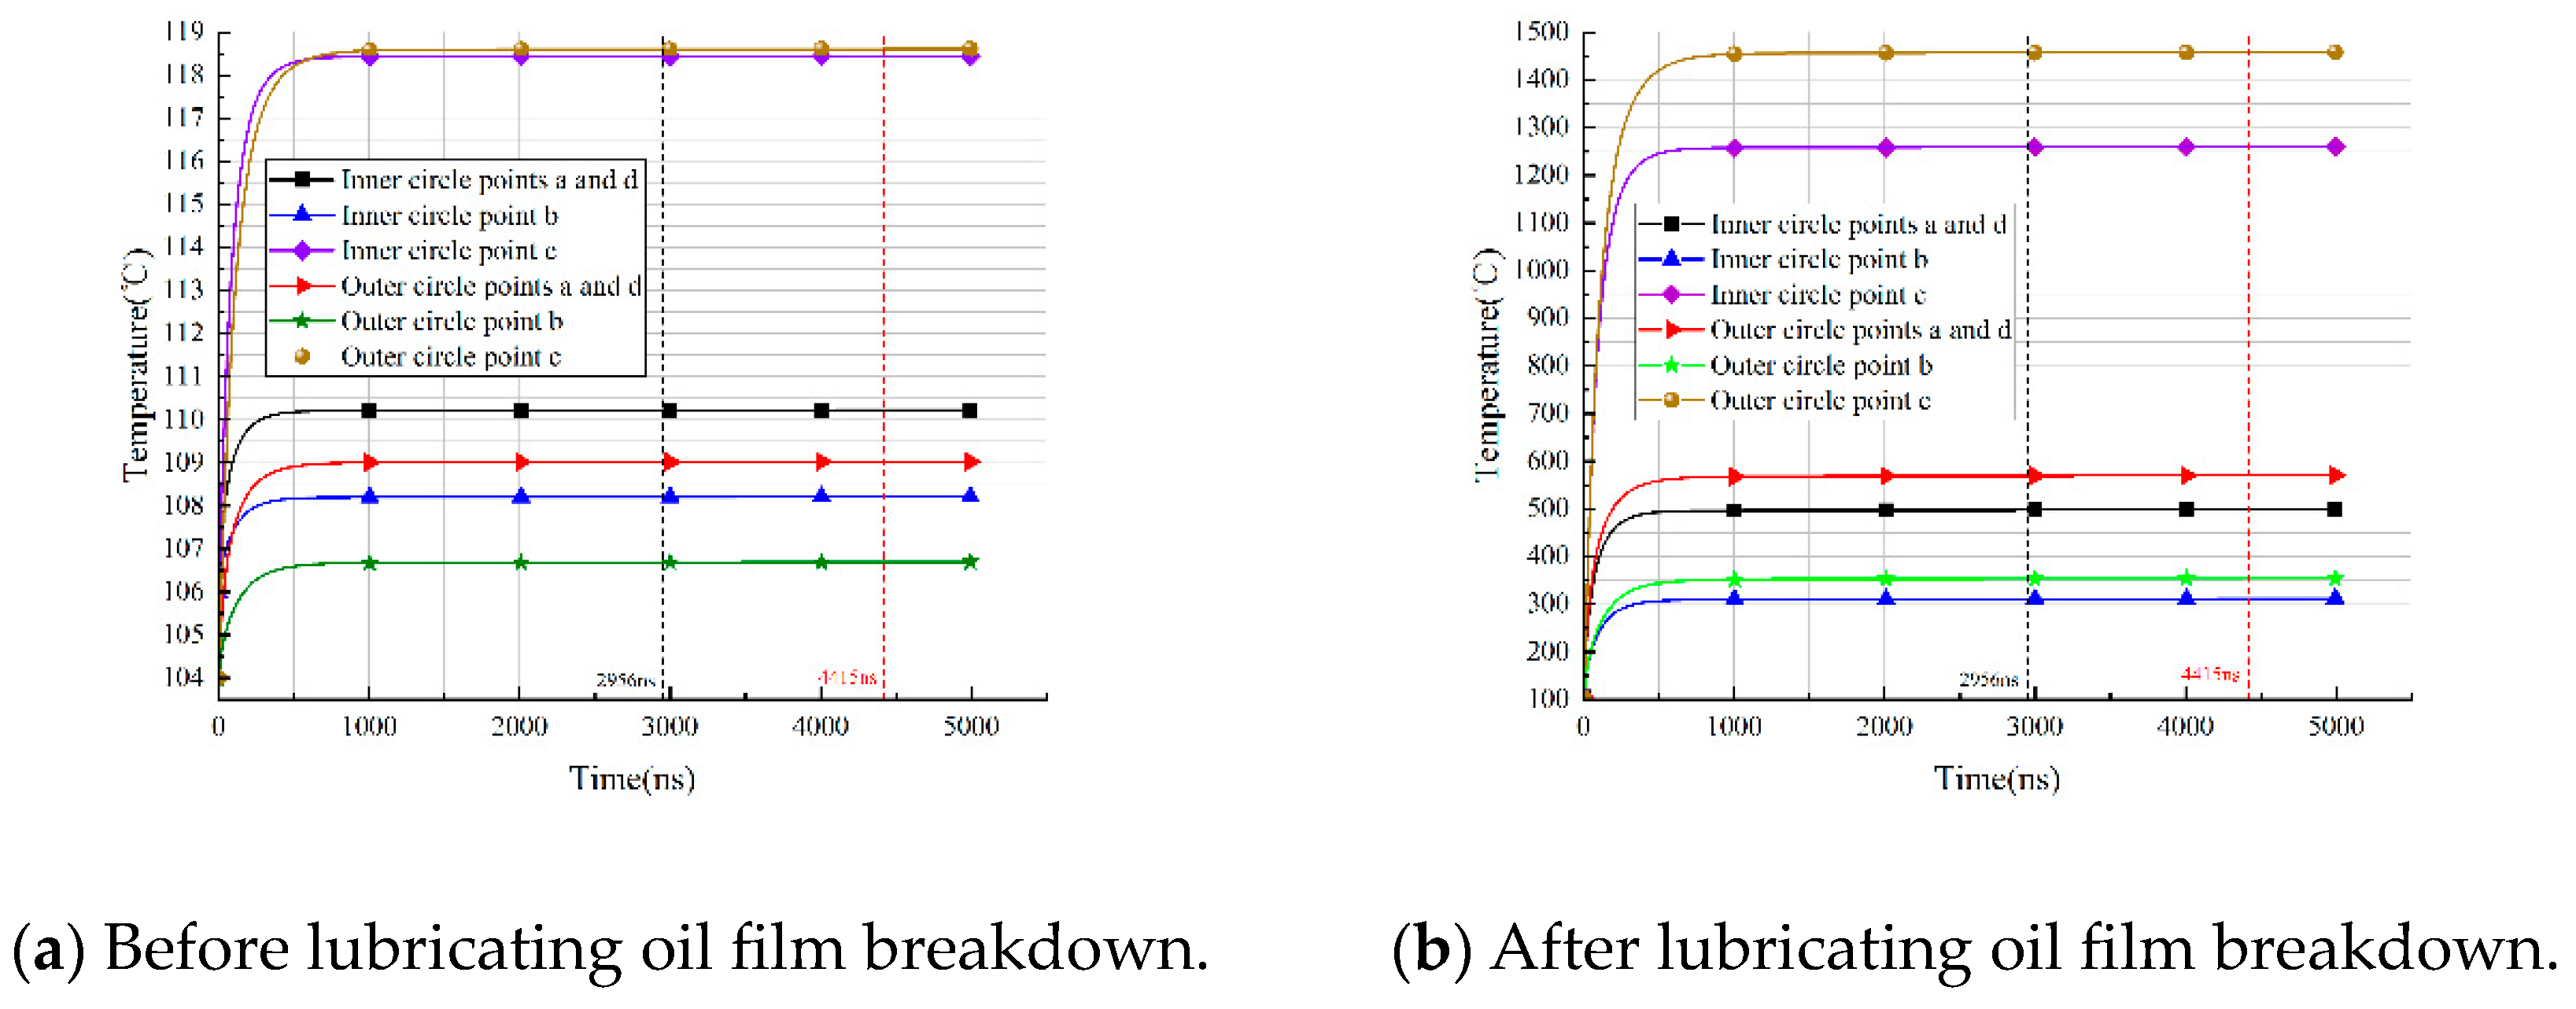
The lubrication micro zone of the bearing experiences Joule heat loss due to current breakdown. This heat can lead to changes in the film-forming characteristics between the bearing steel ball and the raceway, resulting in degradation of lubrication conditions. In severe cases, the local temperature can reach the melting temperature of the bearing steel, causing mechanical damage and damaging the raceway and steel ball surface. To study this phenomenon, a simulation was conducted by coupling multiple physical fields to calculate the transient heat generated by current loss. The temperature changes at different times in the current path and breakdown point of the bearing model were obtained from the temperature field. Figure 10, Figure 11, Figure 12 and Figure 13 show the simulation results of electric thermal coupling at different positions under different frequencies and voltages before and after the breakdown of the lubricating oil film. As shown in the figures, the heat in the current path continuously increased over time, with the temperature at each point gradually rising. The highest temperature was observed at point c, which was located at the center of the path. Point a, which was the current excitation input point, had a temperature equal to the symmetric point d at the other end of the path. Both temperatures were lower than point c, but higher than point b. Point b, located outside the current path, had the smallest current density, and the heat generated there dissipated into the lubricating oil film. As a result, the temperature at point b was the lowest. Eventually, the temperature at each point stabilized at around 1000 ns. The calculation shows that it took 4415 ns for the steel ball to roll over the outer ring channel area and 2956 ns to roll over the inner ring channel area. The black vertical dashed line represents the inner ring, while the red vertical dashed line represents the outer ring.
The variation curve of the channel temperature with time is shown in Figure 10, before and after the breakdown of the lubricating oil film under the conditions of a voltage of 60 V and a frequency of 100 kHz. For the inner ring, prior to breakdown, the temperature at point c reached 109 °C, while the temperatures at points a and d reached 107.2 °C, and at point b it reached 106.6 °C. After breakdown, the temperature at point c increased up to 405 °C, while the temperatures at points a and d rose up to 207 °C, and at point b, it reached up to 160 °C. As for the outer ring, before breakdown, the temperature at point c reached 107.5 °C, the temperatures at points a and d reached 105.2 °C, and at point b, it reached 104.6 °C. After breakdown, the temperature at point c rose up to 455 °C, while the temperatures at points a and d reached up to 225 °C, and at point b, it reached up to 170 °C.
The variation curve of the channel temperature with time is shown in Figure 11, before and after the breakdown of the lubricating oil film under the conditions of a voltage of 90 V and a frequency of 100 kHz. For the inner ring, prior to breakdown, the temperature at point c reached 113 °C, while the temperatures at points a and d reached 108.2 °C, and at point b, it reached 107.2 °C. After breakdown, the temperature at point c increased up to 797 °C, while the temperatures at points a and d rose up to 340 °C, and at point b, it reached up to 229 °C. As for the outer ring, before breakdown, the temperature at point c reached 112 °C, the temperatures at points a and d reached 106.6 °C, and at point b, it reached 105.4 °C. After breakdown, the temperature at point c rose up to 915 °C, while the temperatures at points a and d reached up to 383 °C, and at point b, it reached up to 253 °C.
The variation curve of the channel temperature with time is shown in Figure 12, before and after the breakdown of the lubricating oil film under the condition of a voltage of 60 V and a frequency of 130 kHz. For the inner ring, prior to breakdown, the temperature at point c reached 111 °C, while the temperatures at points a and d reached 107.7 °C, and at point b, it reached 106.8 °C. After breakdown, the temperature at point c increased up to 638 °C, while the temperatures at points a and d rose up to 287 °C, and at point b, it reached up to 200 °C. As for the outer ring, before breakdown, the temperature at point c reached 110 °C, the temperatures at points a and d reached 106 °C, and at point b, it reached 105 °C. After breakdown, the temperature at point c rose up to 728 °C, while the temperatures at points a and d reached up to 319 °C, and at point b, it reached up to 219 °C.
The variation curve of the channel temperature with time is shown in Figure 13, before and after the breakdown of the lubricating oil film under the condition of a voltage of 90 V and a frequency of 130 kHz. For the inner ring, prior to breakdown, the temperature at point c reached 118.2 °C, while the temperatures at points a and d reached 109.8 °C, and at point b, it reached 108 °C. After breakdown, the temperature at point c increased up to 1260 °C, while the temperatures at points a and d rose up to 498 °C, and at point b, it reached up to 311 °C. As for the outer ring, before breakdown, the temperature at point c reached 118 °C, the temperatures at points a and d reached 108.5 °C, and at point b, it reached 106.5 °C. After breakdown, the temperature at point c rose up to 1458 °C, while the temperatures at points a and d reached up to 570 °C, and at point b, it reached up to 354 °C.
Based on the simulated results, it is evident that the application of current to the bearing led to an increase in temperature across different parts of the bearing. Specifically, as the voltage and frequency of the current increased, the temperature in the contact area between the bearing and the inner and outer rings also increased. Moreover, when the lubricating oil film broke down, localized high temperatures occurred in the contact area.
4. Experimental Verification of Electric Thermal Coupling Temperature Field for Current Bearing
This article uses a self-developed current bearing testing machine to conduct electric thermal coupling temperature field tests on the current bearing, verifying the accuracy of the above simulation model.
4.1. Test Conditions
Figure 14 presents a schematic diagram illustrating the overall structural layout of the testing machine. The testing machine utilized in this article comprised a testing device, a control system, a power supply system, and a measurement device. These system modules collaborated with each other to conduct comprehensive tests on the performance of bearings under current-carrying conditions.
This article describes the use of a signal generator and a power amplifier to apply excitation signals to the test bearing. The excitation current was input from the main shaft of the testing machine through a carbon brush and output from the outer ring voltage terminal via the main shaft inner ring steel ball outer ring coating bearing seat. This created a closed current circuit, as shown in Figure 15, to power the test bearing. The voltage signal changes between different parts of the bearing were measured using an oscilloscope. Channel 1 displays the total voltage change applied to the bearing, channel 2 shows the voltage change at both ends of the bearing coating, and channel 3 shows the voltage change at both ends of the bearing oil film.
4.2. Results and Discussion of Outer Ring Temperature Rise Test
The current-carrying bearing performance testing machine described in Section 4.1 was utilized to conduct a current-carrying test on the 6215-type test bearing. The test was conducted under the following conditions: the inner ring speed of the bearing was set at 3500 rpm, the radial load applied was 3.5 kN, and an excitation signal with a voltage Vpp = 90 V and frequency f = 100 kHz was applied to the bearing.
As depicted in Figure 16a, the temperature rise in the outer ring of the bearing was shown before power was applied. The figure illustrates that, after the test bearing began running, the temperature of the outer ring gradually stabilized from the initial room temperature of 25 °C to 55 °C. Similarly, Figure 16b presents the temperature rise in the outer ring of the bearing after power was applied. It can be observed from Figure 16 that an excitation signal was applied to the bearing once it began running. However, due to the interference of the excitation signal on the temperature sensor, the measured outer ring temperature fluctuated within a certain range. Between 0 and 25,000 s, the outer ring temperature exhibited an upward trend and eventually fluctuated within the range of 54°C–62 °C. To determine the average value, the excitation signal was applied, causing the temperature of the outer ring to gradually stabilize from the initial room temperature of 25 °C to 58 °C. Before the excitation signal was applied, the temperature of the outer ring remained stable at 55 °C at the same room temperature, with an error of 6.14% compared to the simulation results. After the excitation signal was applied, the temperature rise of the outer ring stabilized at 58 °C, with an error of 6.45% compared to the simulation results. Within the acceptable error range, the accuracy of the simulation model was verified.
4.3. Verification of Temperature Rise Test in Contact Area
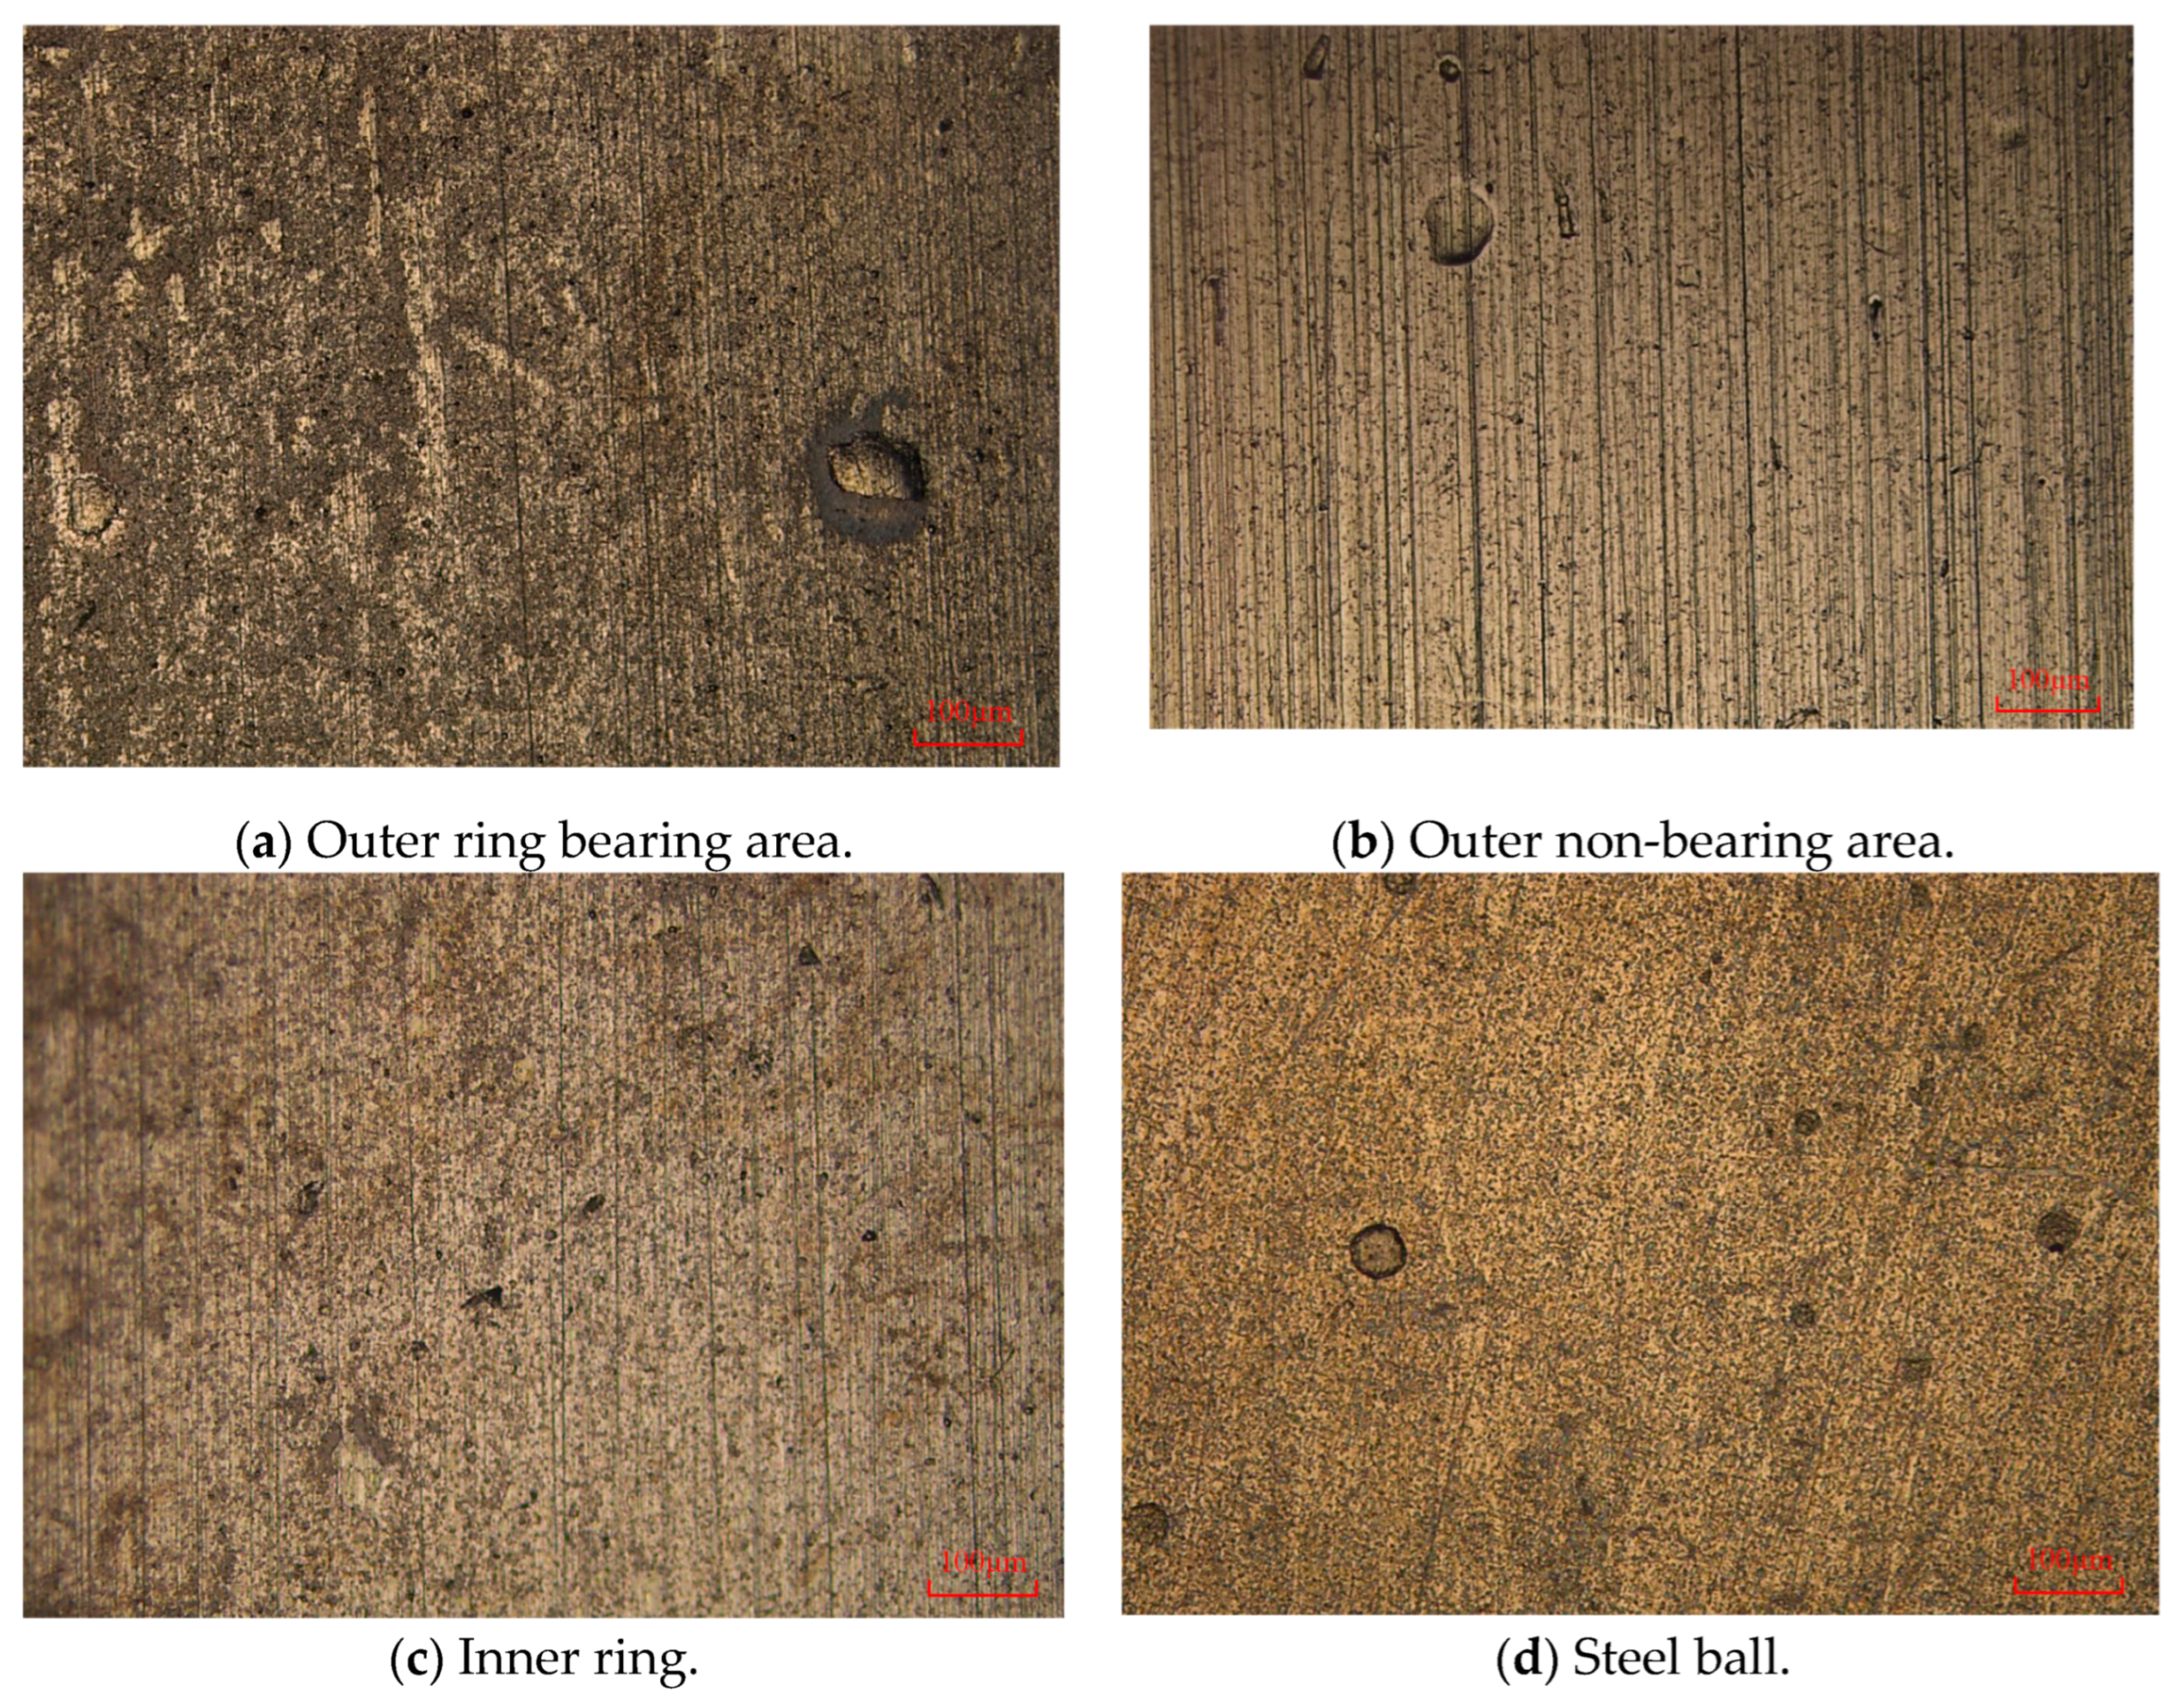
The slice diagram in Figure 17 illustrates the condition of the bearing after 25 h of operation under the specified working conditions mentioned in Section 4.2. When the lubricating oil film of the bearing was penetrated, it resulted in an immediate increase in temperature, causing the lubricating grease to darken and some of it to adhere to the raceway. This, in turn, led to pitting corrosion in the contact area of the bearing. The figure indicates that the corrosion marks on the outer ring of the bearing were more severe compared to those on the inner ring. Therefore, it can be inferred that the temperature rise in the contact area of the outer ring of the bearing was higher than that of the inner ring after the lubricating oil film was breached, which aligns with the simulation results.
5. Conclusions
This article presents a simulation analysis of the temperature field of deep groove ball bearings under an electric environment, considering electric thermal coupling. The study also includes experimental verification. The following conclusions can be drawn:
- (1)
- Electrical environmental factors can cause an increase in the overall temperature rise in the bearing. Specifically, the temperature of the outer ring of the bearing can increase by approximately 3 °C compared to the temperature before powering on.
- (2)
- In an electrical environment, the contact areas of bearings experience localized high temperatures due to the breakdown and discharge of the lubricating oil film. The temperature rise in the contact area between the rolling element and the outer raceway is particularly significant, increasing the likelihood of electrical corrosion damage.
- (3)
- The consistency between the experimental results and simulation results is good, which verifies the accuracy of the simulation model.
Author Contributions
Conceptualization, Z.W., S.M. and H.T.; data curation, S.M. and H.T.; formal analysis, S.M. and Z.W.; funding acquisition, Y.C.; investigation, S.M., B.S. and Z.W.; methodology, Z.W. and Y.C.; project administration, Z.W. and Y.C.; resources, Y.C.; software, S.M.; supervision, Y.C. and Z.W.; validation, H.T., B.S. and S.M.; writing—original draft, H.T. and Z.W.; writing—review and editing, S.M. and Z.W. All authors have read and agreed to the published version of the manuscript.
Funding
This research was funded by the National Natural Science Foundation of China (52105182) and Zhejiang Province Key R&D Plan (2021C01095).
Data Availability Statement
The data used to support the findings of this study are available from the corresponding author upon request.
Acknowledgments
The authors would like to thank the National Natural Science Foundation of China (52005158) and Zhejiang Province Key R&D Plan (2021C01095) for the financial support.
Conflicts of Interest
The authors declare no conflicts of interest.
References
- Lou, Z.F. The Analysis and Suppression of Bearing Current in Varied Frequency Supply AC Motor. Master’s Thesis, Beijing Jiaotong University, Beijing, China, 2015. [Google Scholar]
- Ma, J.J.; Xue, Y.J.; Han, Q.K.; Li, X.J.; Yu, C.X. Motor Bearing Damage Induced by Bearing Current: A Review. Machines 2022, 10, 1167. [Google Scholar] [CrossRef]
- Liu, R.F.; Sang, B.Q.; Cao, J.C. Investigation on the Influence of Motors Grounding States on Bearing Voltage in Inverter Drive System. Proc. CSEE 2015, 35, 177–183. (In Chinese) [Google Scholar]
- He, F.; Xie, G.X.; Luo, J.B. Electrical bearing failures in electric vehicles. Friction 2020, 8, 4–28. [Google Scholar] [CrossRef]
- Wang, Y.; Bai, B.D.; Liu, W.F. Determination of Key Parameters in Distribution Parameters Common Mode Equivalent Circuit and Calculation of the Bearing Currents. Trans. China Electrotech. Soc. 2014, 29, 124–131. (In Chinese) [Google Scholar]
- Ma, S.Y.; Wang, Z.W.; Li, C. Computational Analysis and Experimental Verification of Equivalent Capacitance of Cylindrical Roller Bearings Under Current-Carrying Condition. Bearing 2023, 9, 11–18. (In Chinese) [Google Scholar]
- Busse, D.; Erdman, J.; Kerkman, R.; Schlegel, D.; Skibinski, G. The effects of PWM voltage source inverters on the mechanical performance of rolling bearings. IEEE Trans. 1997, 33, 567–576. [Google Scholar] [CrossRef]
- Wang, Q.Q. Research on Capacitances Calculation and the Bearing Damage Degree in Bearing Currents of AC Motors. Master’s Thesis, Beijing Jiaotong University, Beijing, China, 2021. [Google Scholar]
- Puchtler, S.; Maier, R.; Kuhn, M.; Burkhardt, Y. The Influence of Load and Speed on the Initial Breakdown of Rolling Bearings Exposed to Electrical Currents. Lubricants 2024, 12, 1. [Google Scholar] [CrossRef]
- Li, Y.; Qiu, L.; Zhi, Y.J.; Gao, Z.F.; Ma, J.E.; Zhang, J.; Fang, Y.T. An overview of bearing voltages and currents in rail transportation traction motors. Appl. Phys. Eng. 2023, 24, 226–242. [Google Scholar] [CrossRef]
- Tischmacher, H.; Gattermann, S. Investigations on Bearing Currents in Converter-Fed Electrical Motors. In Proceedings of the 20th International Conference on Electrical Machines, Marseille, France, 2–5 September 2012; pp. 1764–1770. [Google Scholar]
- Miliani, E.H. Leakage current and commutation losses reduction in electric drives for Hybrid Electric Vehicle. J. Power Sources 2014, 255, 266–273. [Google Scholar] [CrossRef]
- Romanenko, A.; Ahola, J.; Muetze, A. Influence of electric discharge activity on bearing lubricating grease degradation. In Proceedings of the IEEE Energy Conversion Congress and Exposition, Montreal, QC, Canada, 20–24 September 2015; SEP: Montreal, QC, Canada, 2015; Volume 18–24, pp. 4851–4856. [Google Scholar]
- Niu, K.; Zeng, Z.X.; Chen, T.H. Research Progress of the Mechanism of Shaft Current Corrosion in Bearing and the Protection Technology. Lubr. Eng. 2023, 48, 179–188. (In Chinese) [Google Scholar]
- Binder, A.; Muetze, A. Scaling Effects of Inverter-Induced Bearing Currents in AC Machines. IEEE Ind. Appl. 2008, 44, 769–776. [Google Scholar] [CrossRef]
- Lu, F.M. Principle of Electrical Erosion and Insulation Protection Indexes of PWM Frequency Modulation Motor Bearing. Bearing 2019, 5, 6–9. (In Chinese) [Google Scholar]
- Liu, R.F.; Sang, B.Q.; Li, W.L. Calculations and Measurements of Bearing Capacitance in AC Motor Bearings. Proc. CSEE 2017, 37, 2986–2993. (In Chinese) [Google Scholar]
- Xiong, F.; Shi, W.; Liao, A.H. Calculation of Equivalent Capacitance of Traction Motor Bearings for Rail Vehicle Considering Radial Clearance Variation of Bearings and Air Gap Eccentricity of Motor. Bearing 2023, 10, 49–56. (In Chinese) [Google Scholar]
- Suo, L.C.; Zhao, W.S.; Liang, L.P. Research on the Mechanism of Dielectric Breakdown in Powder Mixing Electric Discharge Machining. Electromachining Mould. 2001, 5, 10–13. (In Chinese) [Google Scholar]
- Nakao, Y.; Hamano, N.; Naito, T.; Nakagami, Y.; Shimizu, R.; Sakai, Y.; Tagashira, H. Influence of Molecular Structure on Propagation of Positive Streamer Discharge in Dielectric Liquids. Electr. Eng. Jpn. 2004, 149, 15–20. [Google Scholar] [CrossRef]
- Lei, J.T.; Su, B.; Zhang, S.L. Dynamics-Based Thermal Analysis of High-Speed Angular Contact Ball Bearings with Under-Race Lubrication. Machines 2023, 11, 691. [Google Scholar] [CrossRef]
- Liu, Y.Y.; Yang, H.S.; Su, B. Simulation Analysis of the Friction Power Consumption of Double Row Angular Contact Ball Bearings for Aero-engine. J. Mech. Transm. 2021, 45, 129–135. (In Chinese) [Google Scholar]
- Li, J.S.; Yuan, Y.; Hao, D.Q. Analysis and Experimental Study on Bearing Temperature Rise of High Speed Machine Tools. J. Mech. Transm. 2023, 47, 129–136. (In Chinese) [Google Scholar]
- Xie, Y.B.; Zhang, M.Z.; Wang, D.F. Simulation Analysis on Temperature Field of Grease-Lubricated Bearings for Motorized Spindles with Cooling Systems of Different Structures. Bearing 2023, 11, 22–26. (In Chinese) [Google Scholar]
- Wang, Q.Q.; Liu, R.F.; Ren, X.J. The Motor Bearing Discharge Breakdown Based on the Multi-Physics Field Analysis. Trans. China Electrotech. Soc. 2020, 35, 4251–4257. (In Chinese) [Google Scholar]
- Deng, S.E.; Jia, Q.Y.; Xue, J.X. Principles of Rolling Bearing Design, 2nd ed.; China Standard Press: Beijing, China, 2014; pp. 138–139. [Google Scholar]
- Muetze, A.; Binder, A. Practical Rules for Assessment of Inverter-Induced Bearing Currents in Inverter-Fed AC Motors up to 500 kW. IEEE T. Ind. Electron. 2007, 54, 1614–1622. [Google Scholar] [CrossRef]
- Tang, J. Electrotechnics, 2nd ed.; Higher Education Press: Beijing, China, 2005; pp. 64–65. [Google Scholar]
Figure 1.
Bearing schematic diagram (without cage).
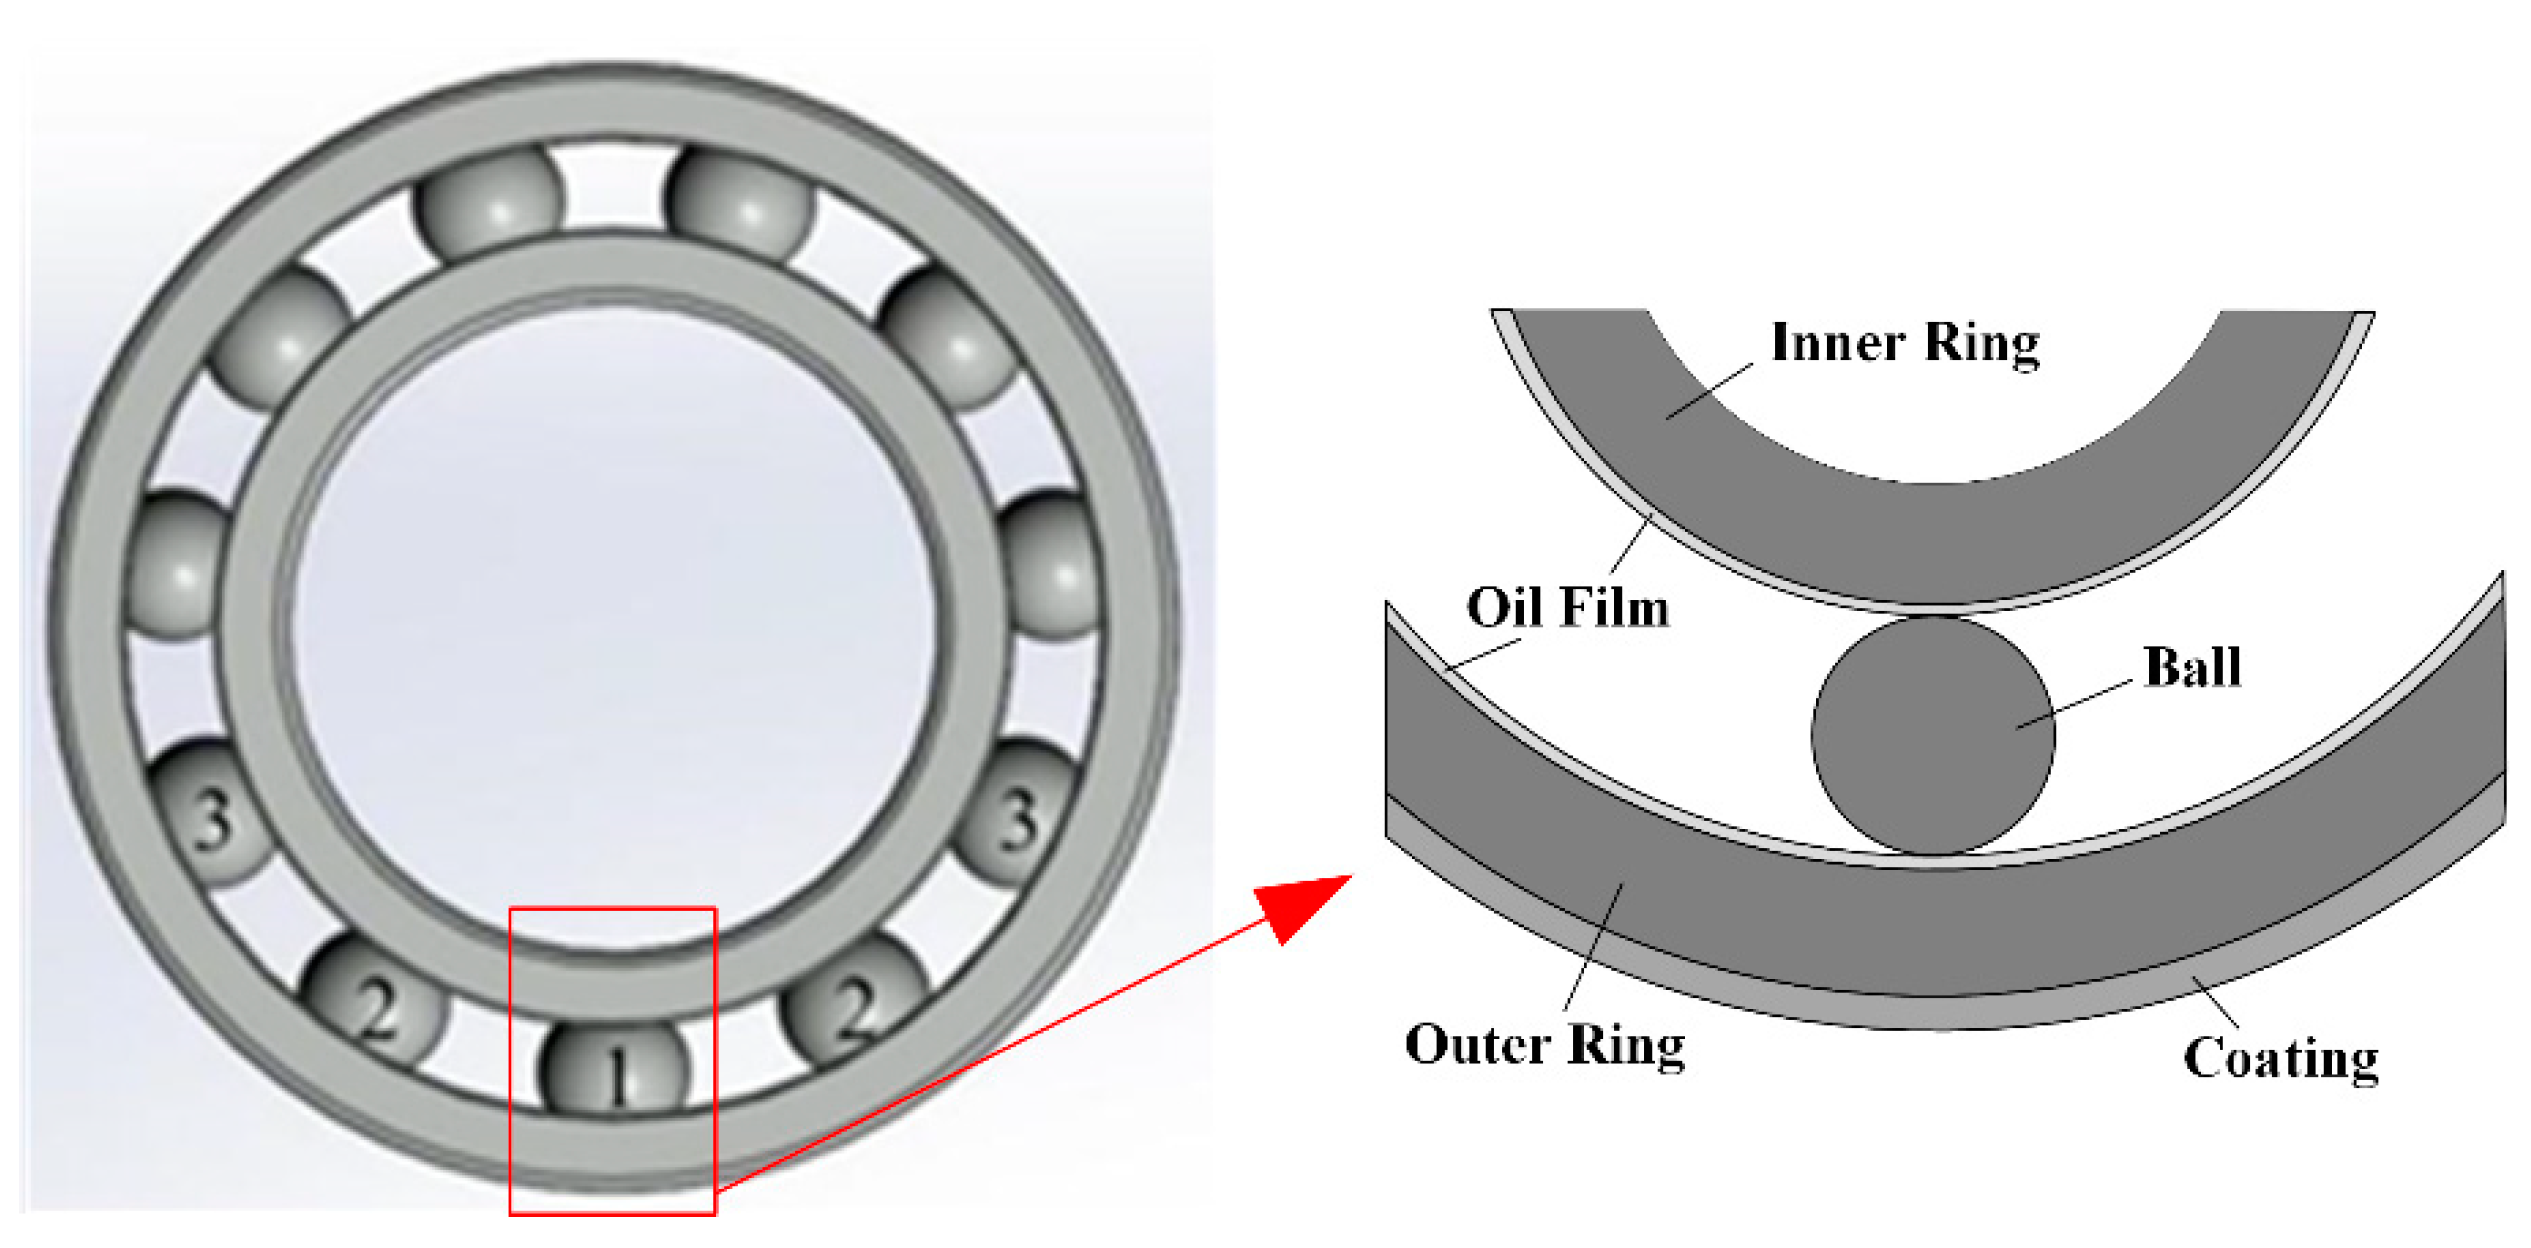
Figure 2.
Equivalent model of bearing circuit.
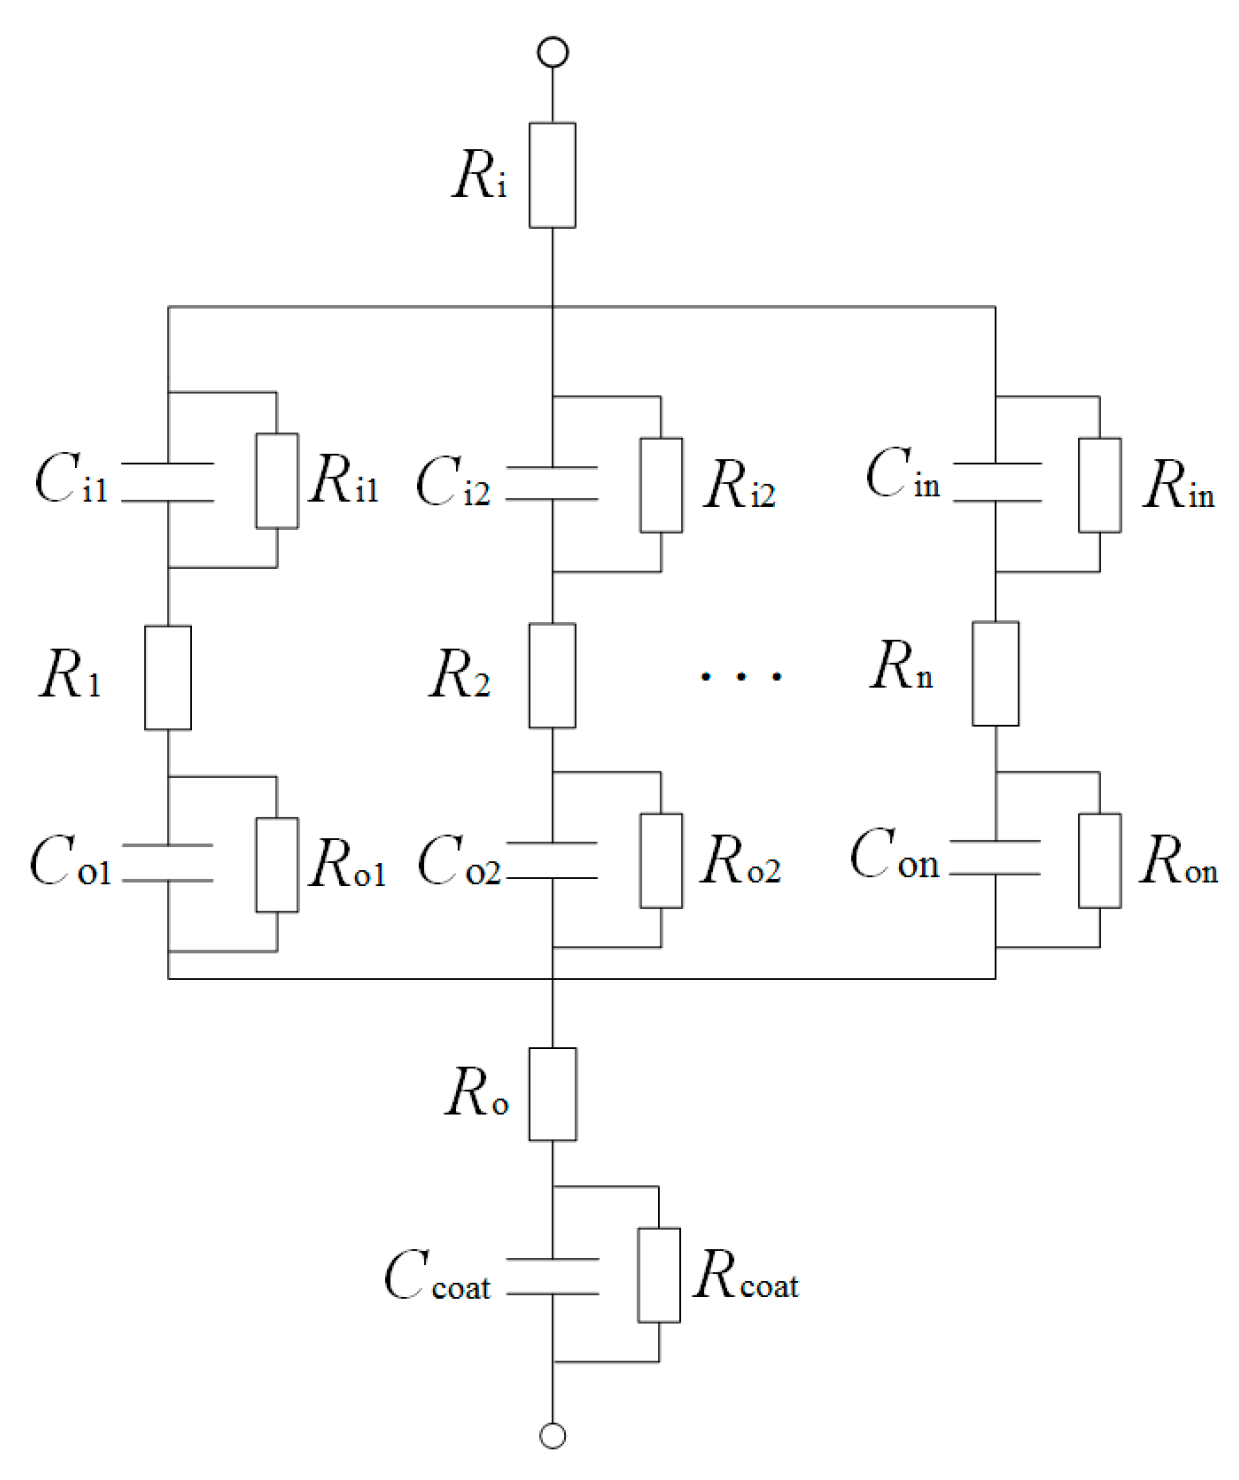
Figure 3.
Schematic diagram of contact area between steel ball and raceway.

Figure 4.
Simplified analysis diagram of temperature field simulation bearings.

Figure 5.
Simplification of bearing electric thermal coupling model.
Figure 6.
Electric thermal coupling simulation model.
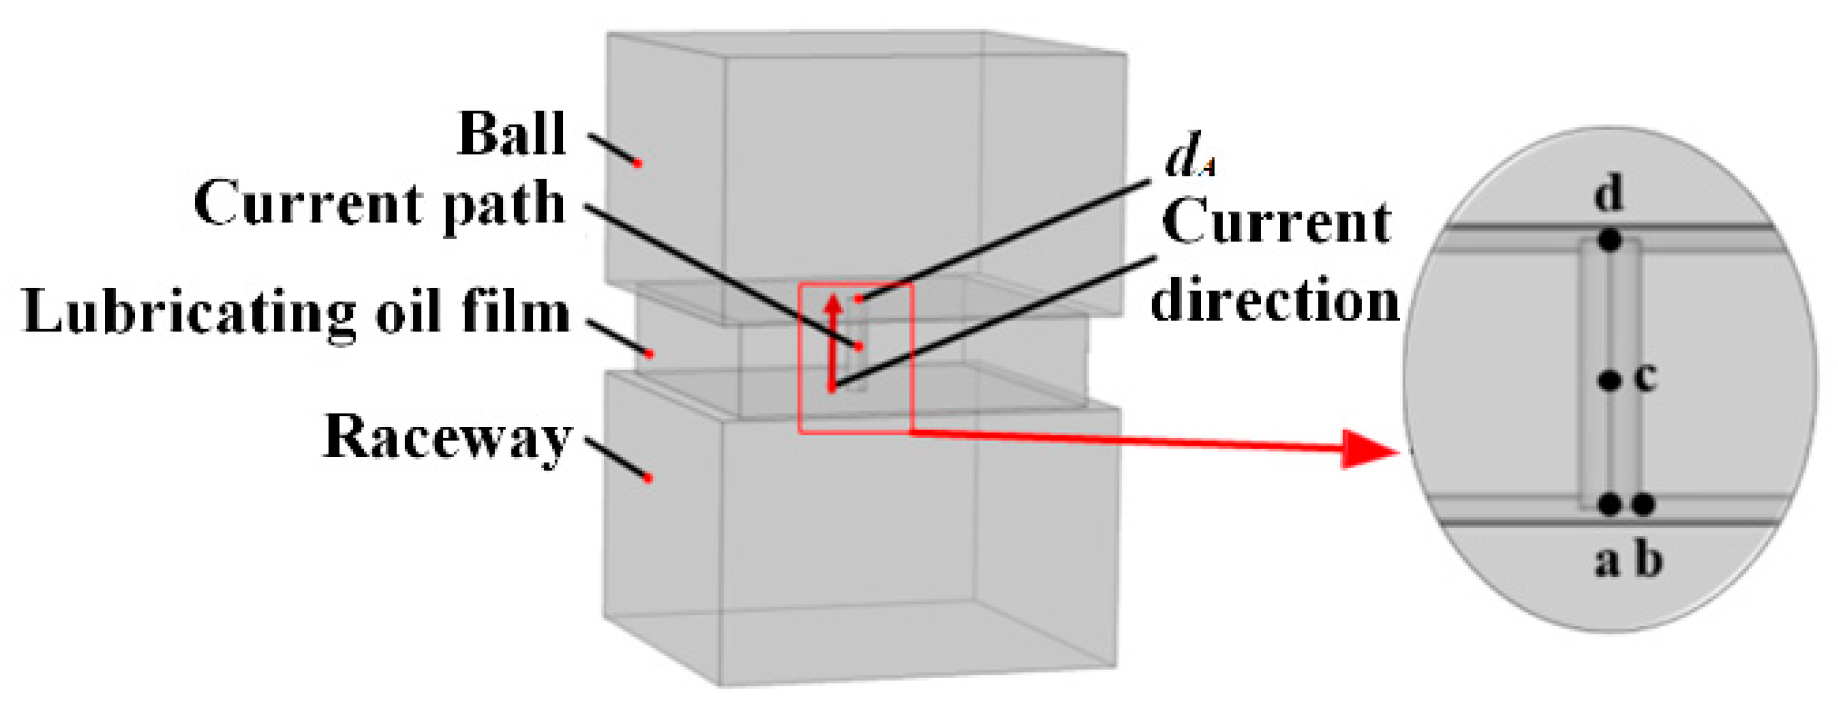
Figure 7.
Temperature distribution diagram of bearings before turning power on.
Figure 8.
Temperature distribution diagram of bearings after turning power on.
Figure 9.
Parameter settings for electric thermal coupling simulation.
Figure 10.
Time variation curve of channel temperature at voltage of 60 V and frequency of 100 kHz.

Figure 11.
Time variation curve of channel temperature at voltage of 90 V and frequency of 100 kHz.
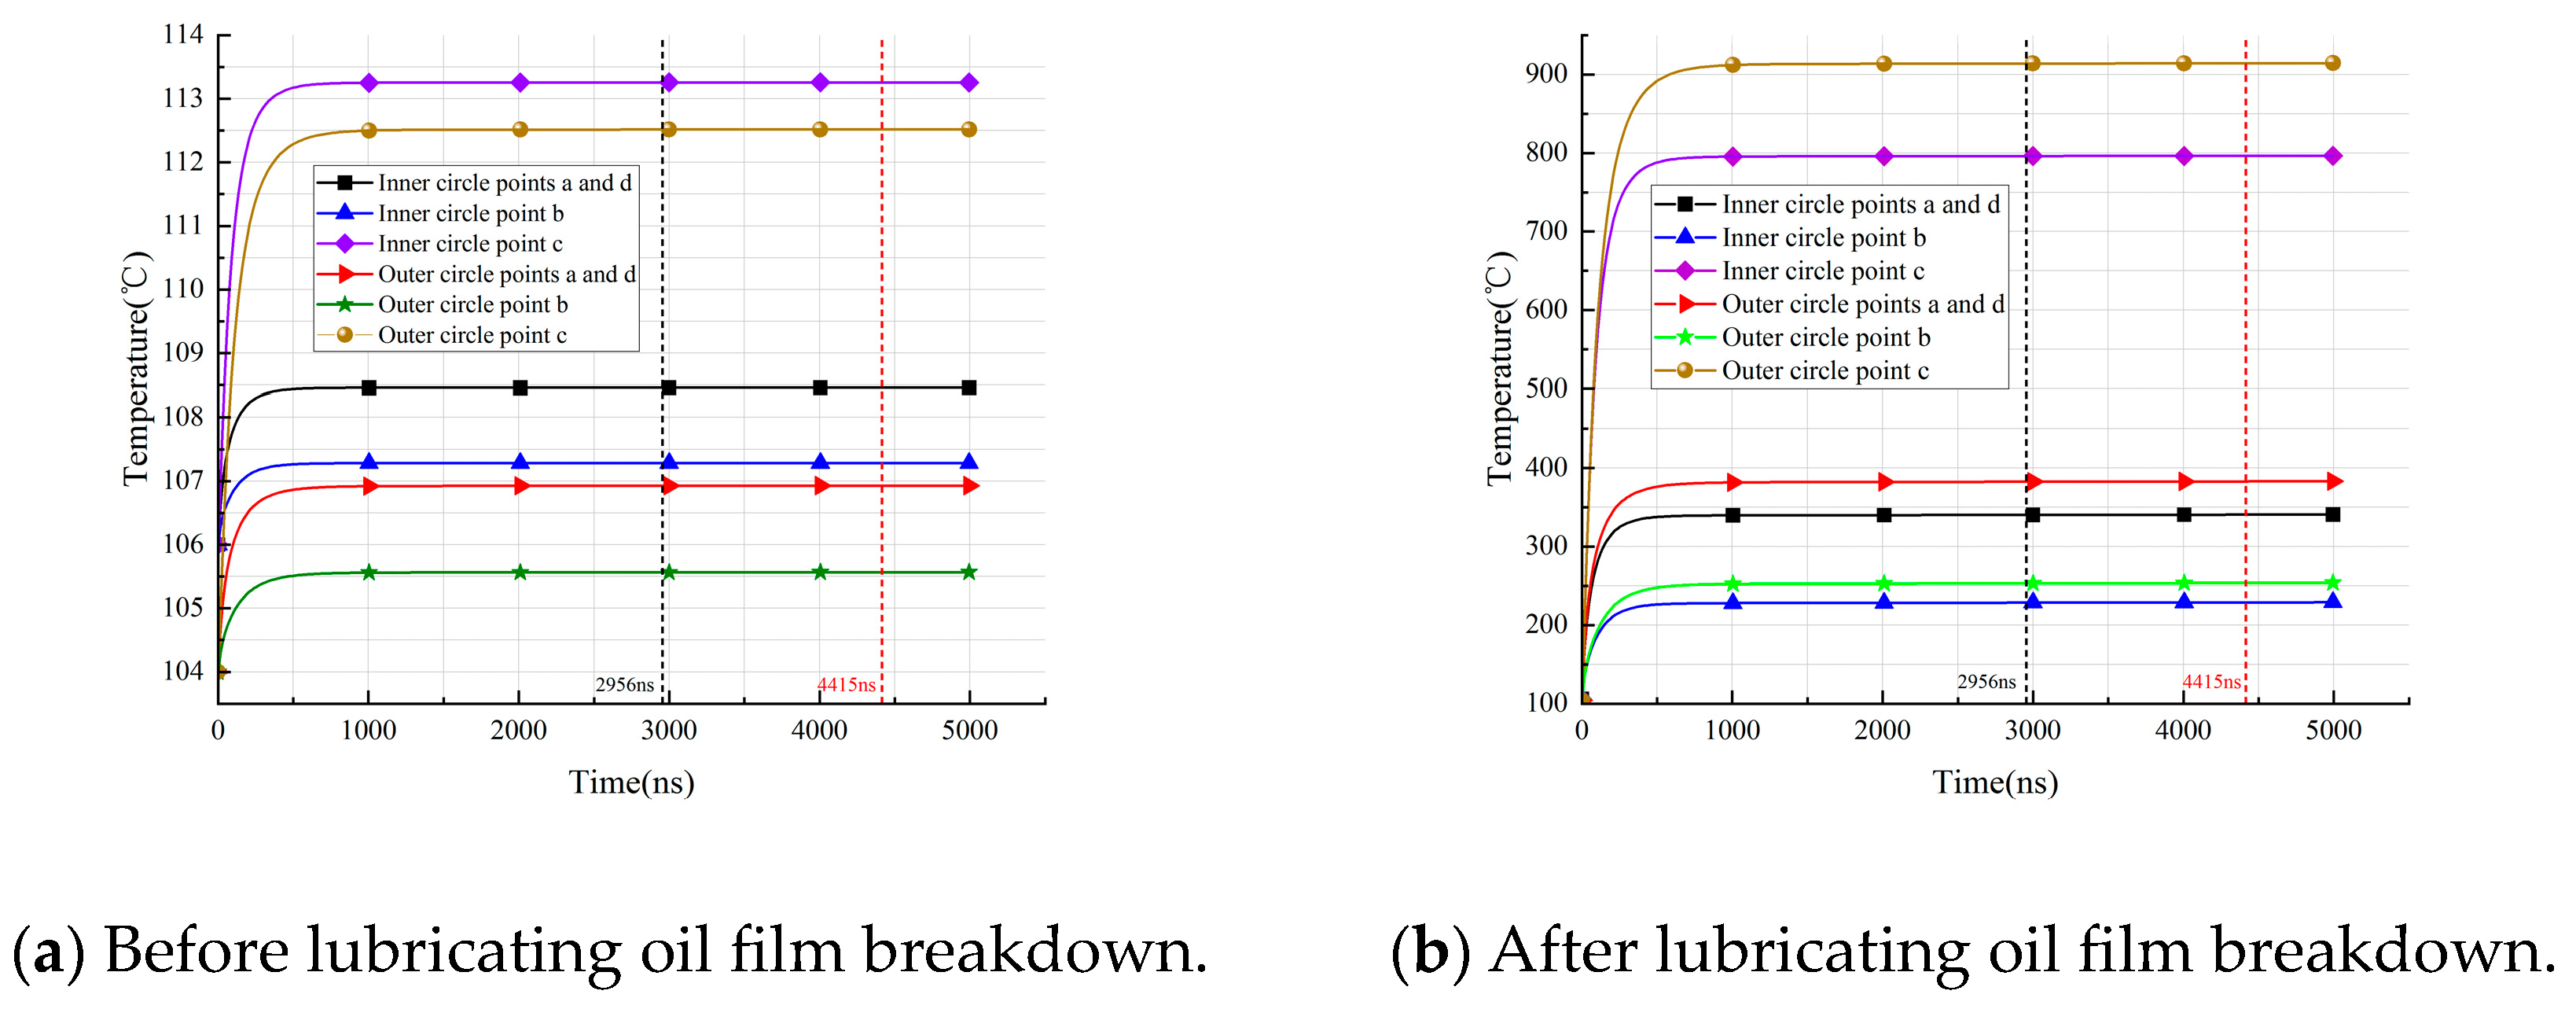
Figure 12.
Time variation curve of channel temperature at voltage of 60 V and frequency of 130 kHz.
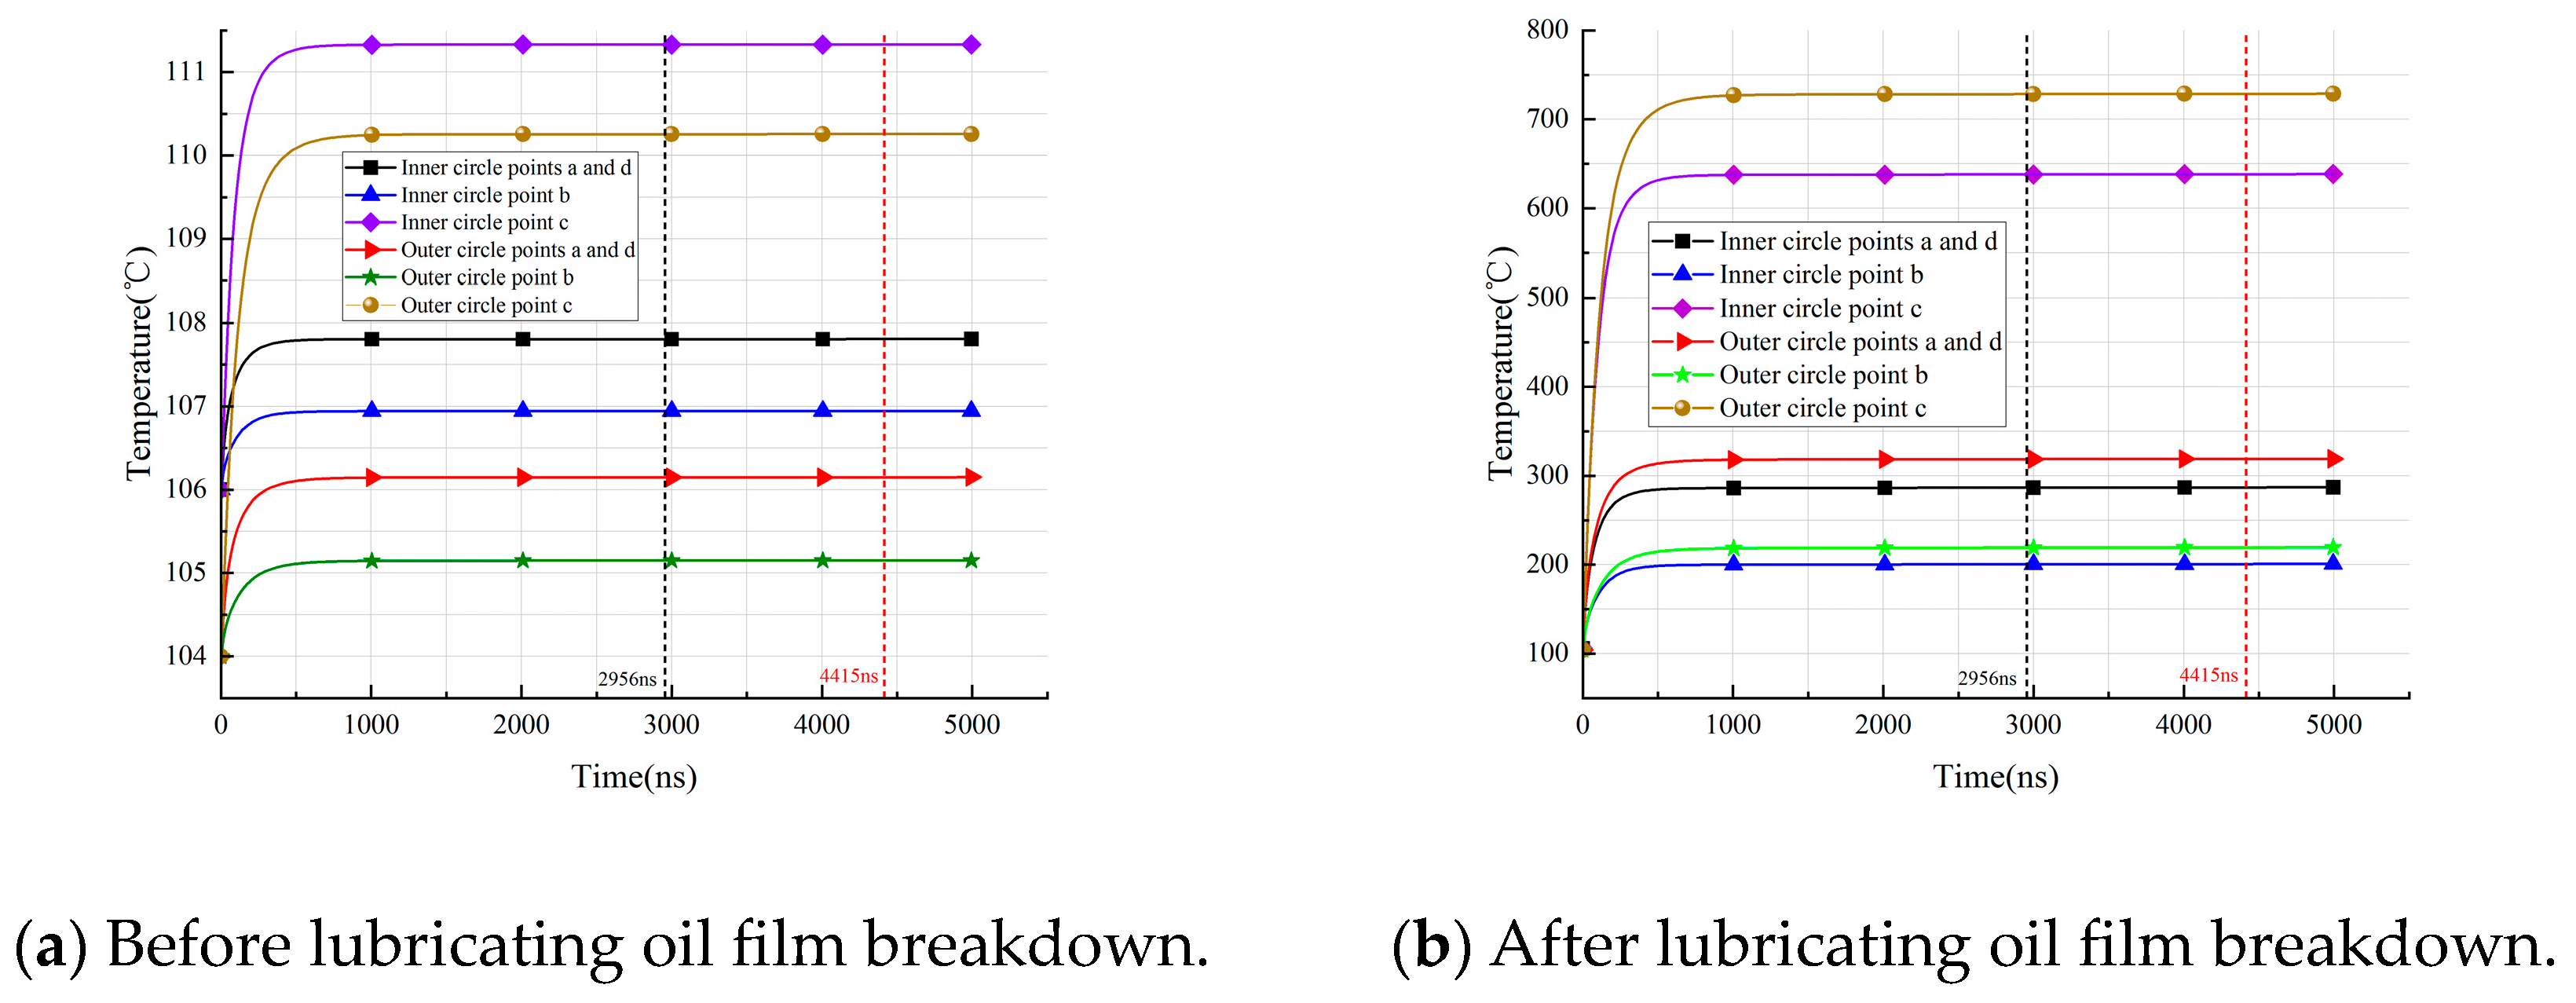
Figure 13.
Time variation curve of channel temperature at voltage of 90 V and frequency of 130 kHz.
Figure 14.
Testing and measurement equipment.
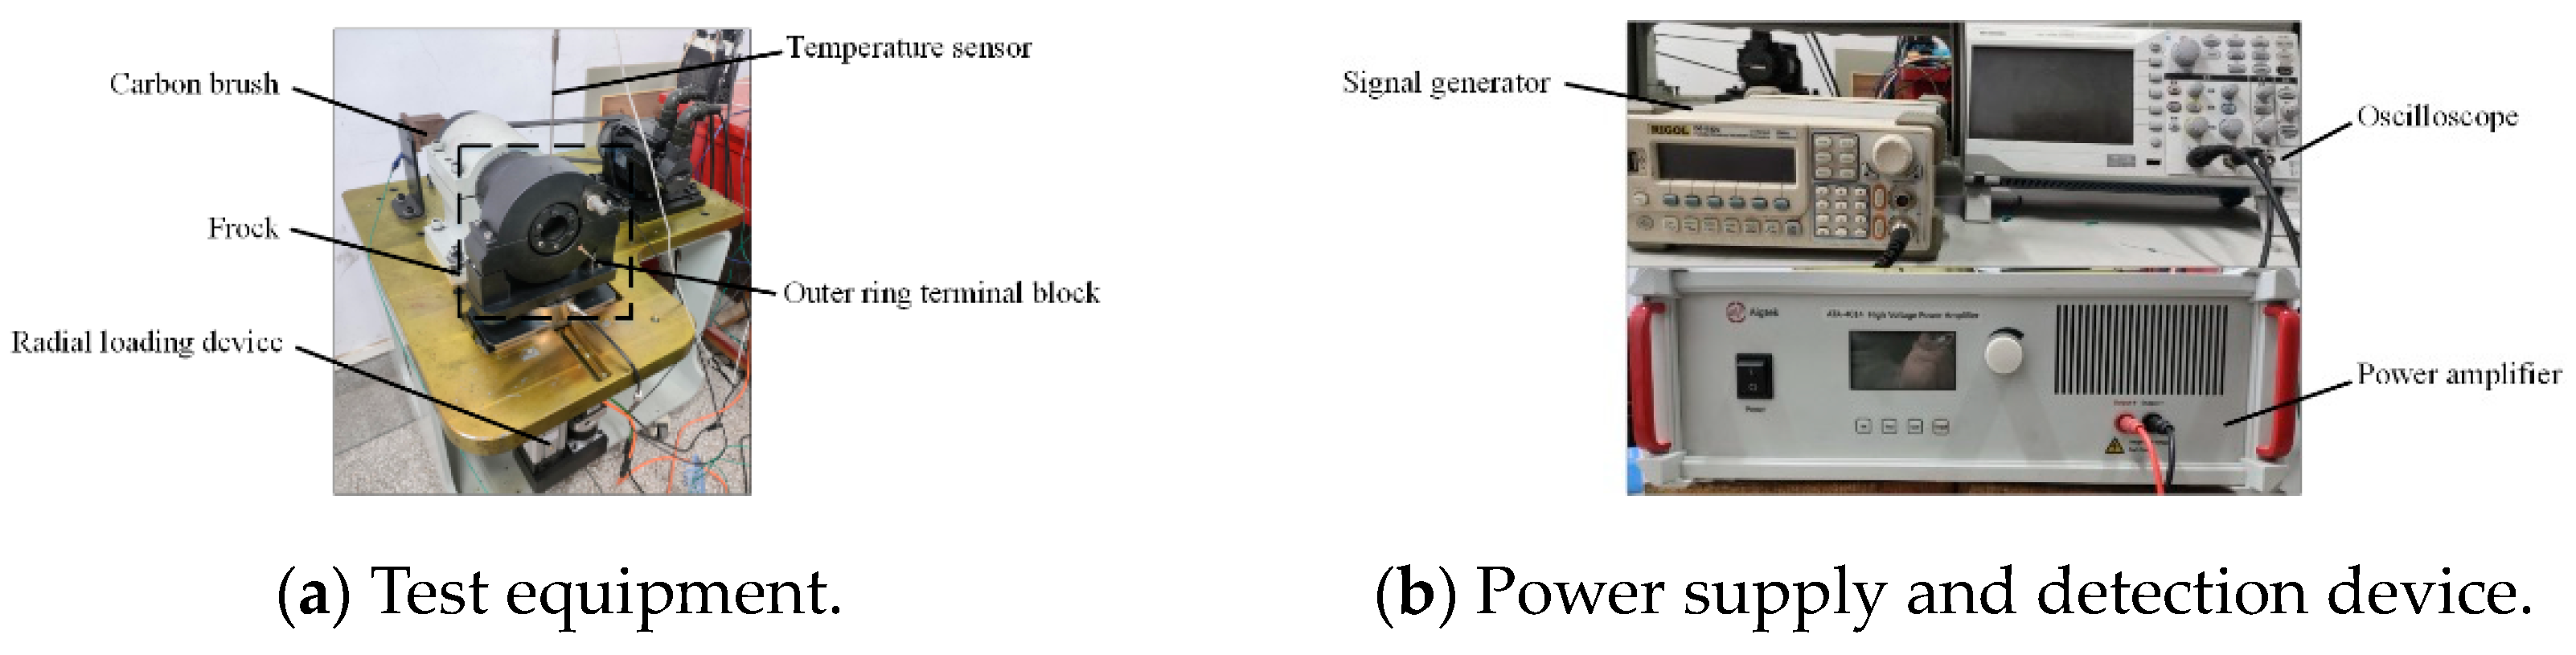
Figure 15.
Experimental circuit diagram.
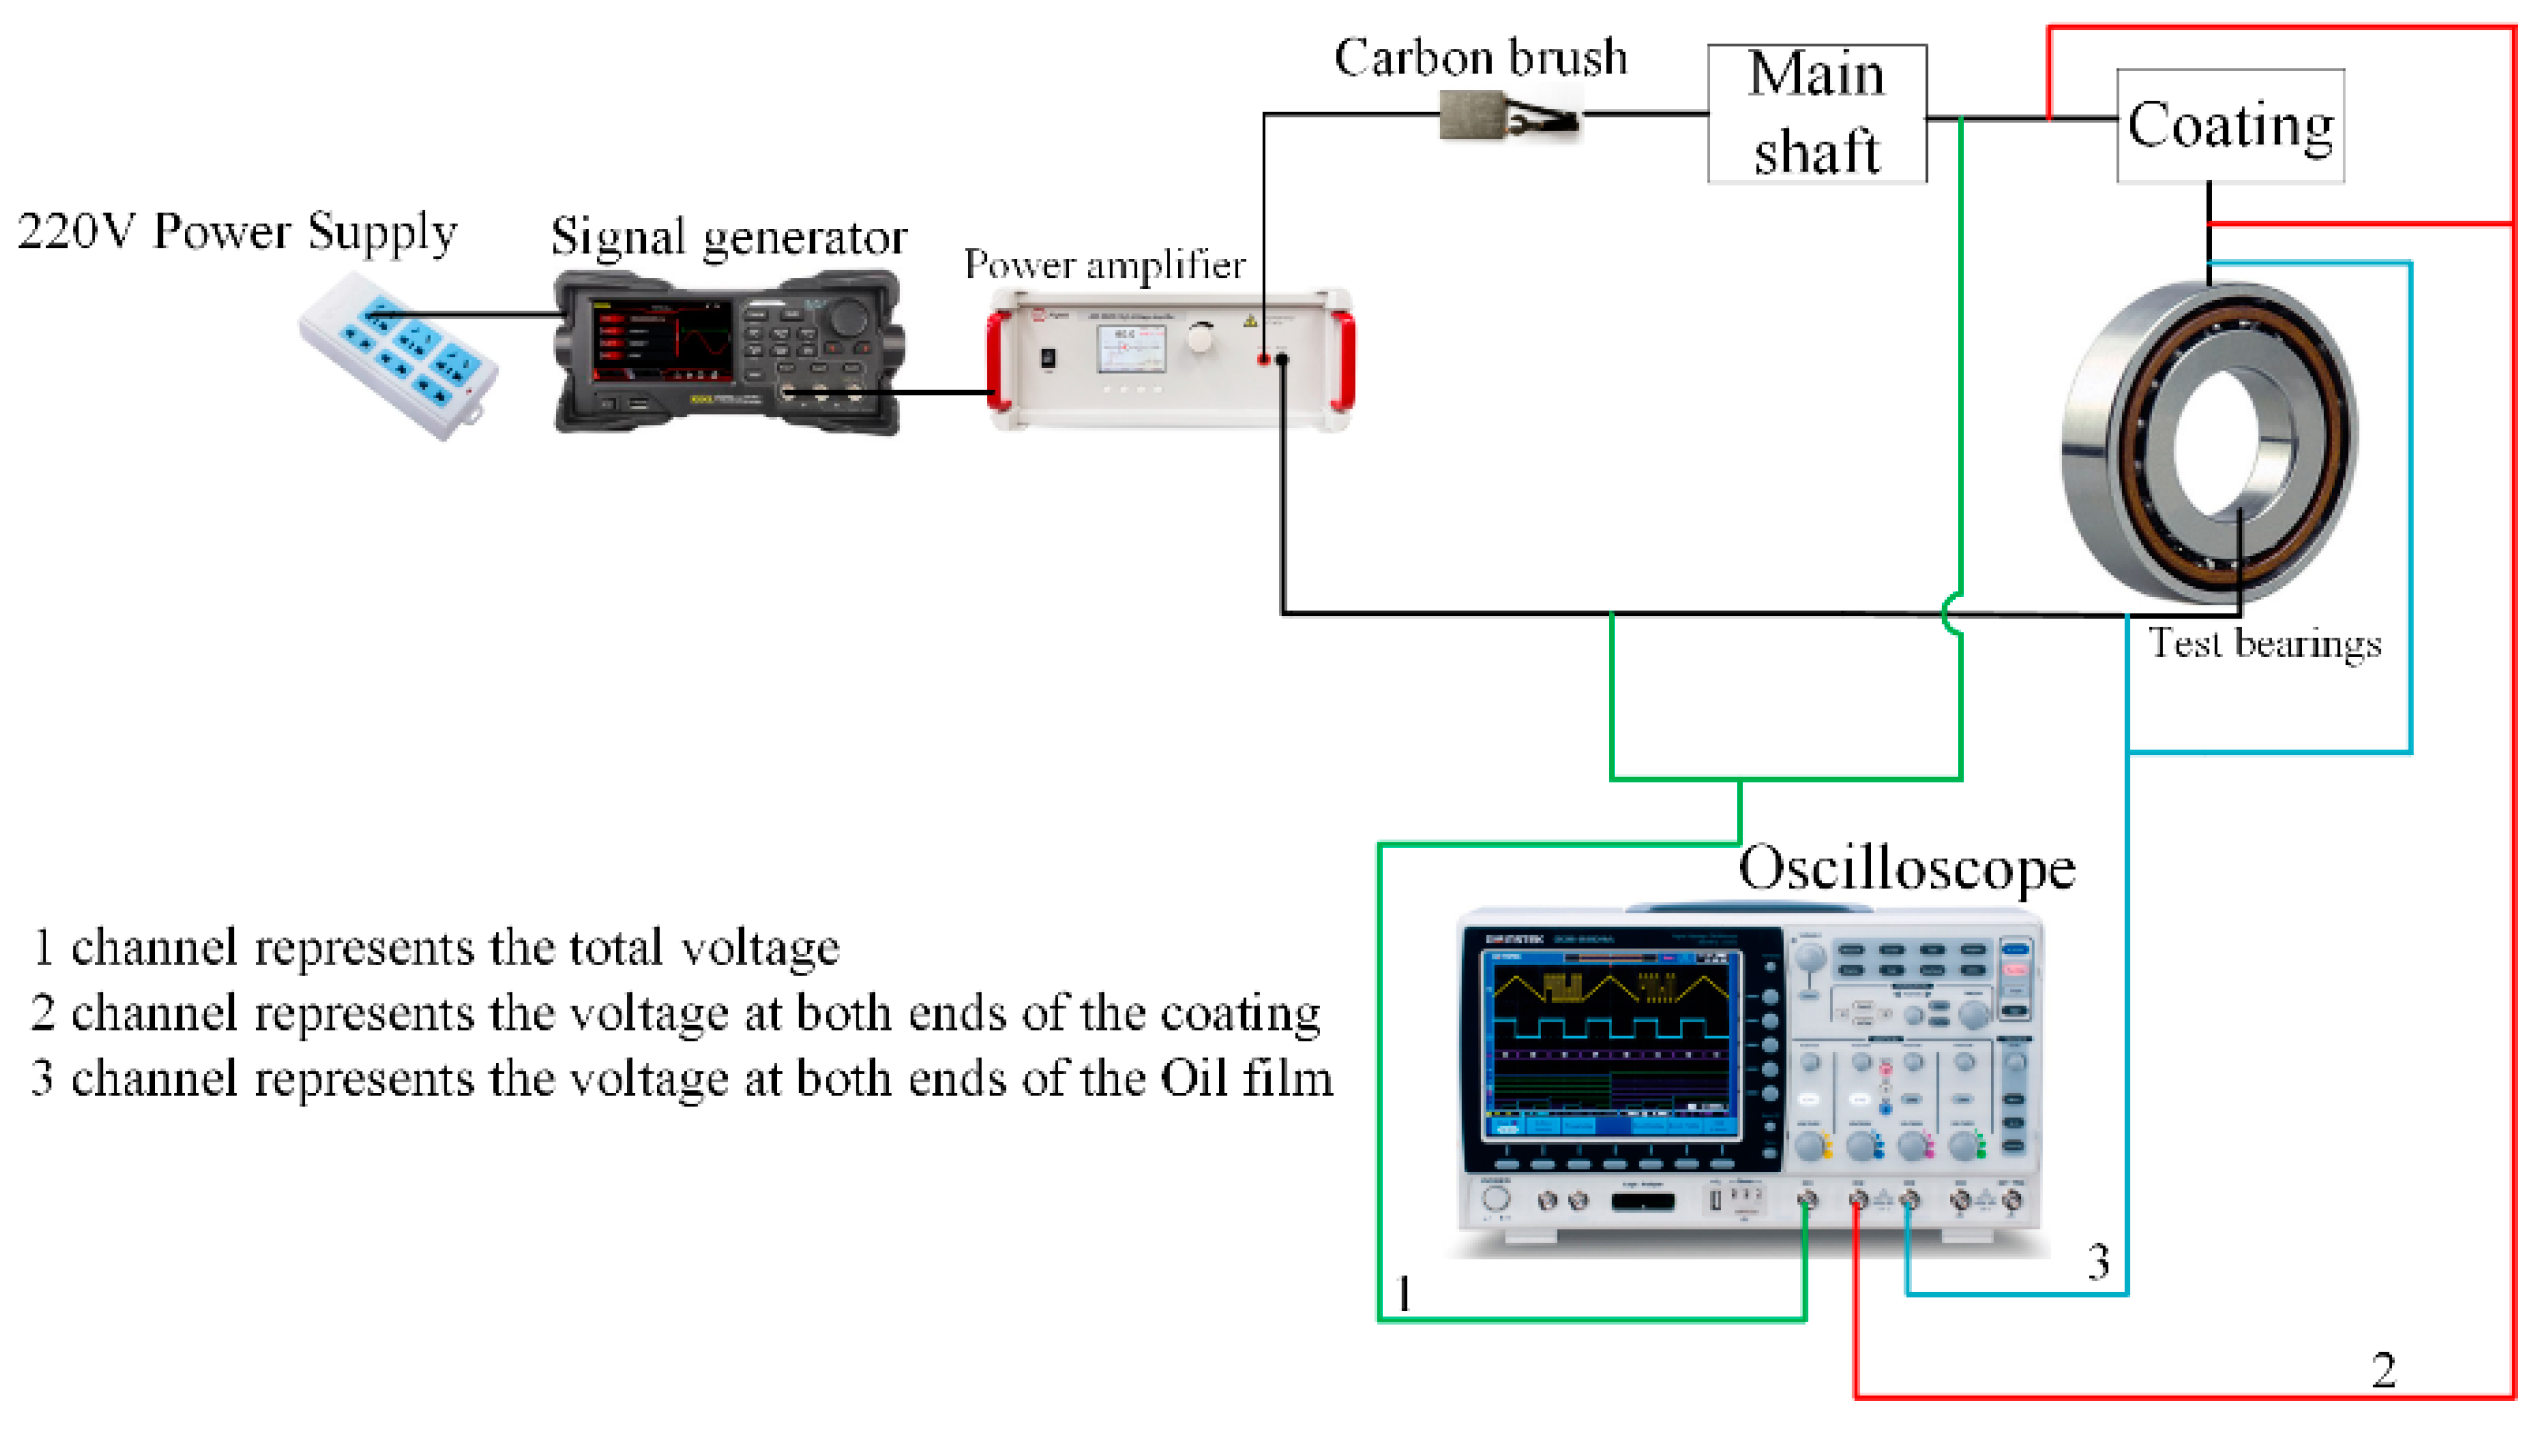
Figure 16.
Temperature rise and partial enlargement of the outer ring before and after turning power on.
Figure 16.
Temperature rise and partial enlargement of the outer ring before and after turning power on.
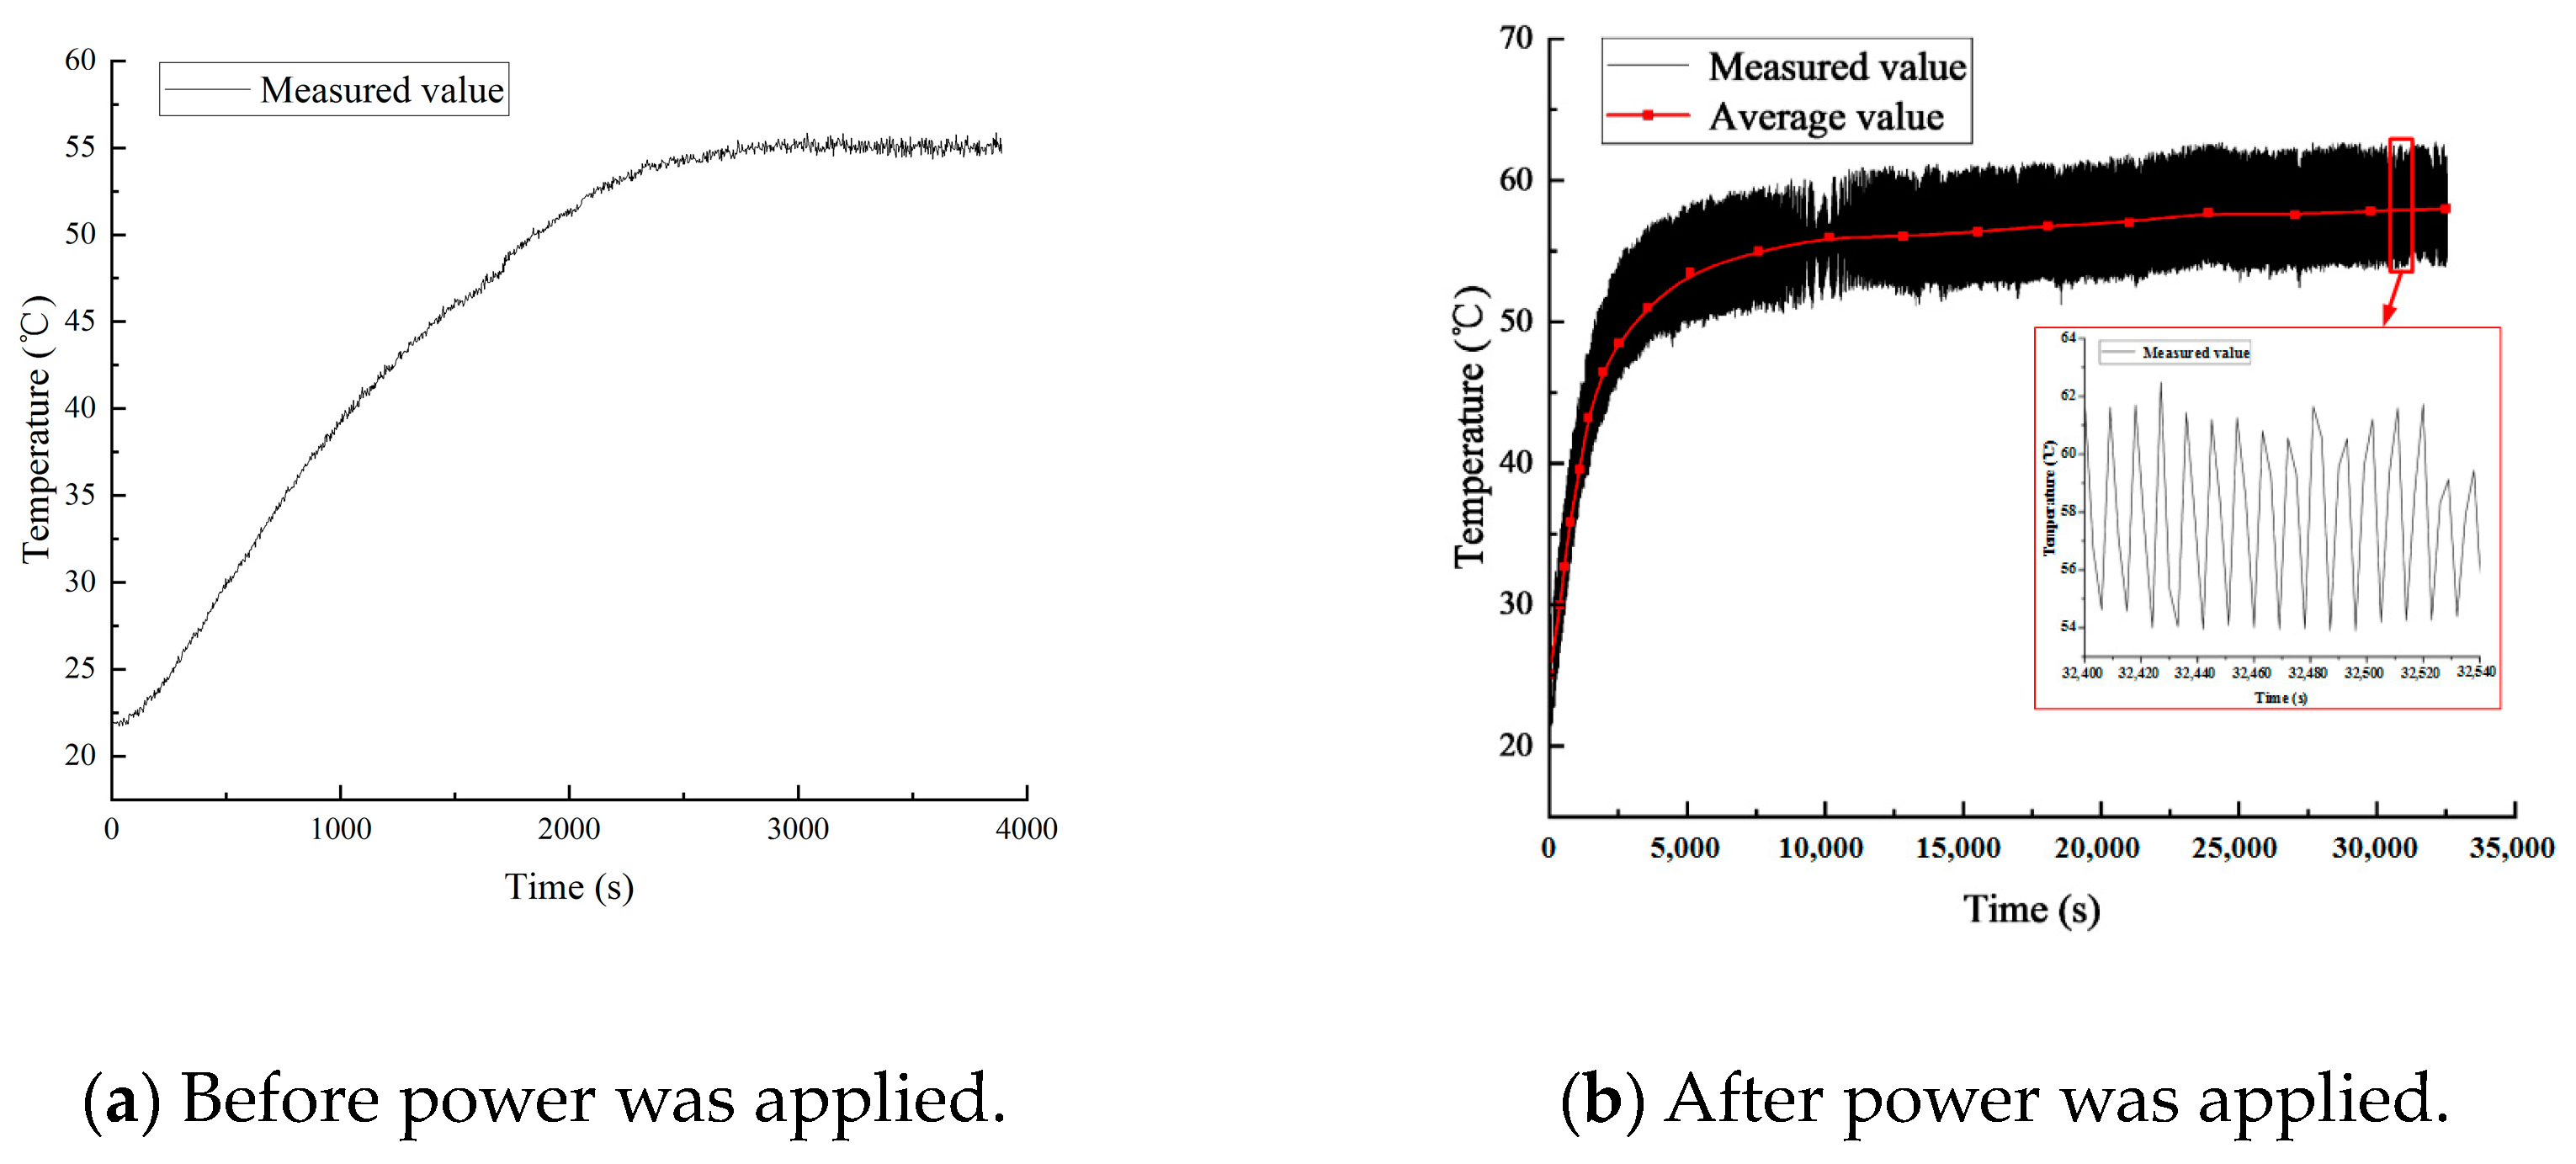
Figure 17.
Slice diagram of test bearings.

Table 1.
Structural parameters of bearings.
| Parameter | Meaning | Value |
|---|---|---|
| Inside diameter | 75 mm | |
| Width | 25 mm | |
| Coefficient of curvature radius of inner raceway groove | 0.5097 | |
| Steel ball diameter | 17.462 mm | |
| Radial clearance | 46~71 μm | |
| The elastic modulus of steel | ||
| Vacuum dielectric constant | 8.85 × 10⁻¹² F/m | |
| Outside diameter | 130 mm | |
| Bearing pitch diameter | 102.5 mm | |
| Coefficient of curvature radius of outer raceway groove | 0.5268 | |
| Number of steel balls | 11 | |
| Dimensionless geometric parameters | 0.17 | |
| Viscosity–pressure coefficient | ||
| Dielectric constant of lubricating grease | 2.5 |
Table 2.
Lubricating grease-related parameters.
| Parameter | Value |
|---|---|
| 40 °C base oil viscosity | 220 mm2/s |
| Density | 880 kg/m3 |
| 100 °C base oil viscosity | 19 mm2/s |
Table 3.
Calculation results of bearing capacitance.
| Steel Ball Number | 1 | 2 | 3 |
|---|---|---|---|
| /pF | 93.36 | 79.95 | 45.35 |
| /pF | 79.12 | 67.96 | 38.83 |
| /pF | 42.83 | 36.73 | 20.92 |
| /pF | 158.13 | ||
| /pF | 142.58 | ||
Table 4.
Axis currents at different voltages and frequencies.
| Voltage Peak to Peak Value (V) | Frequency (kHz) | Unbreakable Shaft Current (mA) | Breakdown Rear Axle Current (mA) |
|---|---|---|---|
| 60 | 100 | 2.69 | 27.33 |
| 90 | 100 | 4.03 | 41.00 |
| 60 | 130 | 3.49 | 35.53 |
| 90 | 130 | 5.24 | 53.31 |
Disclaimer/Publisher’s Note: The statements, opinions and data contained in all publications are solely those of the individual author(s) and contributor(s) and not of MDPI and/or the editor(s). MDPI and/or the editor(s) disclaim responsibility for any injury to people or property resulting from any ideas, methods, instructions or products referred to in the content. |
© 2024 by the authors. Licensee MDPI, Basel, Switzerland. This article is an open access article distributed under the terms and conditions of the Creative Commons Attribution (CC BY) license (https://creativecommons.org/licenses/by/4.0/).
Share and Cite
MDPI and ACS Style
Wang, Z.; Mao, S.; Tian, H.; Su, B.; Cui, Y. Simulation Analysis and Experimental Research on Electric Thermal Coupling of Current Bearing. Lubricants 2024, 12, 73. https://doi.org/10.3390/lubricants12030073
AMA Style
Wang Z, Mao S, Tian H, Su B, Cui Y. Simulation Analysis and Experimental Research on Electric Thermal Coupling of Current Bearing. Lubricants. 2024; 12(3):73. https://doi.org/10.3390/lubricants12030073
Chicago/Turabian StyleWang, Zhiwei, Shuanglong Mao, Heng Tian, Bing Su, and Yongcun Cui. 2024. "Simulation Analysis and Experimental Research on Electric Thermal Coupling of Current Bearing" Lubricants 12, no. 3: 73. https://doi.org/10.3390/lubricants12030073
Note that from the first issue of 2016, this journal uses article numbers instead of page numbers. See further details here.