Article

Green-Emitting Carbon Quantum Dots: Highly Sensitive Temperature Sensing Probe in Nanocomposite and Lubrication System

1
Key Laboratory of Education Ministry for Modern Design & Rotor-Bearing System, Xi’an Jiaotong University, Xi’an 710049, China
2
Department of Chemistry, School of Chemistry, Xi’an Jiaotong University, Xi’an 710049, China
*
Authors to whom correspondence should be addressed.
Lubricants 2024, 12(3), 88; https://doi.org/10.3390/lubricants12030088
Submission received: 15 December 2023 / Revised: 13 February 2024 / Accepted: 18 February 2024 / Published: 11 March 2024

Abstract

:
Carbon quantum dots (CQDs) have already demonstrated their utility as lubricant additives, and non-contact temperature sensing based on CQDs offers considerable potential for condition monitoring in mechanical, electrical, and other fields, as well as lubrication-temperature multifunctional applications in lubricants. In this paper, we have successfully synthesized and designed high-brightness carbon quantum dots/polyvinyl alcohol (PVA) temperature sensor thin film and dispersions of CQDs in a liquid paraffin lubrication system. Based on fluorescence intensity and the fluorescence intensity ratio, the carbon quantum dot/PVA film exhibited exponential temperature-dependent properties with a wide applicability range, a high goodness of fit (R2 > 0.99), and high relative thermal sensitivity (relative sensitivities of 1.74% K−1 and 1.39% K−1 for fluorescence intensity and fluorescence intensity ratio, respectively). In addition, based on the fluorescence intensity, the CQDs exhibited a wide temperature range (20–90 °C), a high goodness of fit (R2 > 0.99), and higher sensitivity (2.84% K−1) in a liquid paraffin lubrication system, which reflects the temperature responsive properties of carbon quantum dots as additives in lubrication systems. These findings provide convenient and effective possibilities for the sensing and monitoring of carbon quantum dots and their multifunctional applications under lubrication systems.

1. Introduction

With the development of high-precision technology, the requirements for the regulation of various physical parameters of critical engineering parts are being tightened, encompassing aerospace, robotics, engineering vehicles, and numerous other application areas [1,2,3,4]. Among these, bearings are crucial to the regular operation and endurance of mechanical equipment since they are a crucial component of machinery. Additionally, bearing lubrication plays a critical role in preventing bearing failure, enhancing the mechanical characteristics of bearings and other parts, and lowering friction and heat dissipation phenomena in the bearing process. Current scientific studies have verified that the lubricant’s rheological state and the frictional response during fluid lubrication are directly influenced by the temperature in the lubrication zone [4,5,6,7]. However, the temperature response for bearing fluid-lubricated films is still a challenge for engineering applications. This also implies that the development of fluid lubrication temperature sensor technology with high precision and versatility to assess the lubrication friction response of bearings is essential to ensure the long-term functioning of machines.
In recent years, temperature measurement methods for non-contact measurements, especially in the field of fluid lubrication, have become a serious challenge. Currently, temperature measurement methods for fluid lubrication can be categorized into three main groups: infrared thermography, Raman spectroscopy, and thin-film sensor technology. In terms of experimental measurements, infrared thermography (IR) is a technique based on the measurement of infrared radiation emitted by a given sample, which can be converted into temperature by a combination of calibration and analysis procedures [8,9,10,11]. In recent years, with the improvement of camera sensitivity and the development of infrared technology, the use of infrared technology to measure the temperature of elastostatic lubrication has become a powerful tool, and now infrared thermography has become the most widely used temperature mapping technique. Reddyhoff et al. [12], in response to the limitation of infrared measurements that a coating is required for the surface of the samples, proposed and tested an improved calibration method that allows the application of a super-resolution algorithm to the recorded images, which was shown to increase the resolution of the infrared microscope. Omasta et al. [13] combined fluid film chromaticity interferometry with infrared microscopy to characterize the effect of kinematic conditions on lubricant film thickness and temperature. He et al. [14] measured infrared thermal images to characterize various health states of a rotor bearing system and used them to train a convolutional neural network to further tune the training model parameters. However, infrared thermography still has inherent drawbacks. On the one hand, the friction specimens employed must be transparent to infrared light for camera observation. On the other hand, the spatial resolution of infrared imaging techniques is usually still limited to infrared wavelengths. Thus, the application of the real-time monitoring of contact zone temperature in bearings is somewhat limited.
Alternatively, Raman spectroscopy provides the capability to measure the temperature and pressure of fluid-lubricated films. Raman spectra contain the vibrational energy of the sample, which is affected by changes in temperature and pressure, thus offering the possibility of temperature and pressure measurements [15,16]. Jubault et al. [17] used a coupled sphere/flat surface device and a Raman microphotometer to measure the pressure distribution of a model lubricant that occurs in a rolling EHD contact. Cheong et al. [18] successfully measured the in situ temperature of polydimethylsiloxane (PDMS) grease using UV Raman spectroscopy, and the results demonstrated that the PDMS temperature in the contact region increased with sliding velocity. The application of Raman spectroscopy to the measurement of the lubricated contact region of an elastic flow results in excellent sensitivity and excellent spatial resolution (can be <1 -μm) by detecting spectral variations and correlating them with temperature and pressure, but in practice, the technique has a very low signal-to-noise ratio and the application is limited to a fraction of the fluid, i.e., a strong Raman scatterer, and it is not possible to quantitatively measure the temperature even though, theoretically, using the Stokes and anti-Stokes can be achieved. Furthermore, it has been shown that this method does not yield sufficient measurement sensitivity for the temperature rise that is expected to occur in an EHD contact. This has limited the engineering applications of Raman spectroscopy for temperature measurement.
In addition to infrared and Raman spectroscopy techniques, electrical resistance has also been used for temperature measurement along the contact point. The advantage of this technique is that sensors made of suitable materials utilizing the resistance sensitivity of certain materials to changes in temperature are placed on the friction surface and, in this way, after proper calibration, one can measure the temperature by monitoring the change in the resistance of the sensor as it passes through the contact point. Kannel et al. [19] first reported the use of a manganese sensor to measure the pressure distribution at EHD contact points and found that the results were reasonably reproducible and consistent. Emmrich et al. [20] proposed an in situ sensor system based on thin-film sensors, which can be used to measure the temperature change in a heavily loaded rolling contact during fluid and mixed friction. Ebner et al. [21] used thin-film sensors to measure elastohydrodynamic temperatures and explored thermal insulation effects on EHL temperature and fluid friction. The main advantage of thin-film sensors over the two previous methods is that they are suitable for contacts formed between two opaque metallic bodies without the need for one of the two surfaces to have a requirement for radiolucency, which is a great advantage for studying temperature and pressure conditions between real machine components. However, thin-film sensors have their inherent drawbacks. Thin-film sensor measurements belong to the contact measurement method, where the thickness of the sensor is non-negligible in relation to the thickness of the fluid in the contact area, and the sensor is structurally fragile and prone to damage under high shear stress. These drawbacks limit the application of thin-film sensors. Therefore, constrained by the high-speed rotation of rotating components in bearings and the complex working environment, traditional temperature measurement techniques have proved elusive in the monitoring process of bearing components. In this case, fiber-optic-based non-contact temperature monitoring methods have gradually gained popularity among researchers [22,23]. Smart et al. [24] pioneered their application in tribology for measuring the lubricant film thickness of rollers and roll-to surfaces by measuring the natural intensity of fluorescence there or the fluorescence of particles dispersed in the oil. Reddyhoff et al. [25] applied such techniques to study the lubricant flow in a rolling contact formed between a steel ball and a glass disk, and deduced the average velocity increasing along the main direction of the contact. Ponjavic et al. [26] measured the velocity profile of the lubricating fluid using laser excitation and fluorescent dyes. In recent years, fluorescent nanomaterials have become a research hotspot in the field of non-contact temperature monitoring, with temperature sensing research based on the fluorescent properties of nanomaterials widely distributed in various research fields such as biology, medicine, and machinery [27,28,29,30,31]. Among them, due to their superior fluorescence quantum yield over conventional fluorescent dyes, as well as their excellent physical and chemical stability performance, quantum dot (QD) materials—a type of semiconductor nanocrystal—have emerged as a favorite in the field of temperature monitoring [32,33,34,35,36].
In recent years, a novel class of carbon-based nanomaterial, known as carbon quantum dots (CQDs), has garnered significant attention from researchers owing to their favorable biocompatibility, distinctive optical characteristics, rich physicochemical characterization, high sensitivity, high stability, and inexpensive preparation [37,38]. Research has indicated that carbon quantum dots have broad use in fluorescence sensors for chemical composition and environmental monitoring [39,40,41,42,43]. Therefore, it is of great practical significance to apply CQDs in optical sensor devices.
Furthermore, research has demonstrated that CQDs serve as a tremendous lubricant and display attractive tribological properties. With further research, CQDs have gradually shown excellent tribological properties, especially as additives in lubricating base oils. Hence, there is considerable potential to employ CQDs as high-performance additives in lubricating fluids to reduce wear and reduce friction [44,45,46,47]. It is conceivable that the combination of the temperature monitoring and lubrication functions of the CQD can be applied in the field of lubricating fluids, such as bearings, and that it is possible to detect the temperature of a mechanical system while realizing mechanical lubrication, which is of great significance for extending the life of the mechanical system and predicting the thermal characteristics of the system. However, it must be mentioned that the research on the temperature response of CQDs is still limited to the traditional solid-state domain (thin films or powders) or biothermal imaging [26,48], and there is still a gap in the research on the temperature sensing properties of CQDs in lubricating systems. Few studies have been conducted on the temperature response of CQDs in lubricants. Therefore, in order to further explore the multifunctional applications of quantum dots in lubrication systems and realize the urgent requirements of temperature and lubrication for equipment components such as bearings, it is imperative that the temperature sensing properties of CQDs in lubricants be investigated.
In this paper, we synthesized carbon quantum dots (CQDs) with green luminescence characteristics and prepared CQD/polyvinyl alcohol (PVA) temperature sensor films with high brightness utilizing a polymer-coating process. By employing temperature-dependent experiments, the temperature-dependent properties of the CQD/PVA film temperature probes were successful analyzed. The temperature response characterization of carbon quantum dots in a liquid paraffin system was carried out to investigate the feasibility of quantum dots in the lubrication system. The results demonstrated that the carbon quantum dots/PVA film exhibited temperature-dependent properties of exponential fitting based on fluorescence intensity and the fluorescence intensity ratio, and exhibited an excellent thermal applicability range, a high goodness of fit (R2 > 0.99), and relative thermal sensitivities (relative sensitivities of 1.74% K−1 and 1.39% K−1 for fluorescence intensity and fluorescence intensity ratio, respectively). In addition, the carbon quantum dots in the liquid paraffin lubrication system exhibited high fitting properties (R2 > 0.99), and high sensitivity (2.84% K−1) over a wide temperature range (20–90 °C). These works provide convenience and effective possibilities for the design of carbon quantum dots in fluorescent sensors and the composite functional applications of carbon quantum dots in lubrication systems.

2. Materials and Methods

2.1. Chemical

All starting materials were obtained from commercial sources and were ready to use without further purification. Citric acid and urea were purchased from Rhawn, Shanghai, China. Sodium cetylbenzene sulfonate was obtained from Sigma-Aldrich Corporation, Shanghai, China.

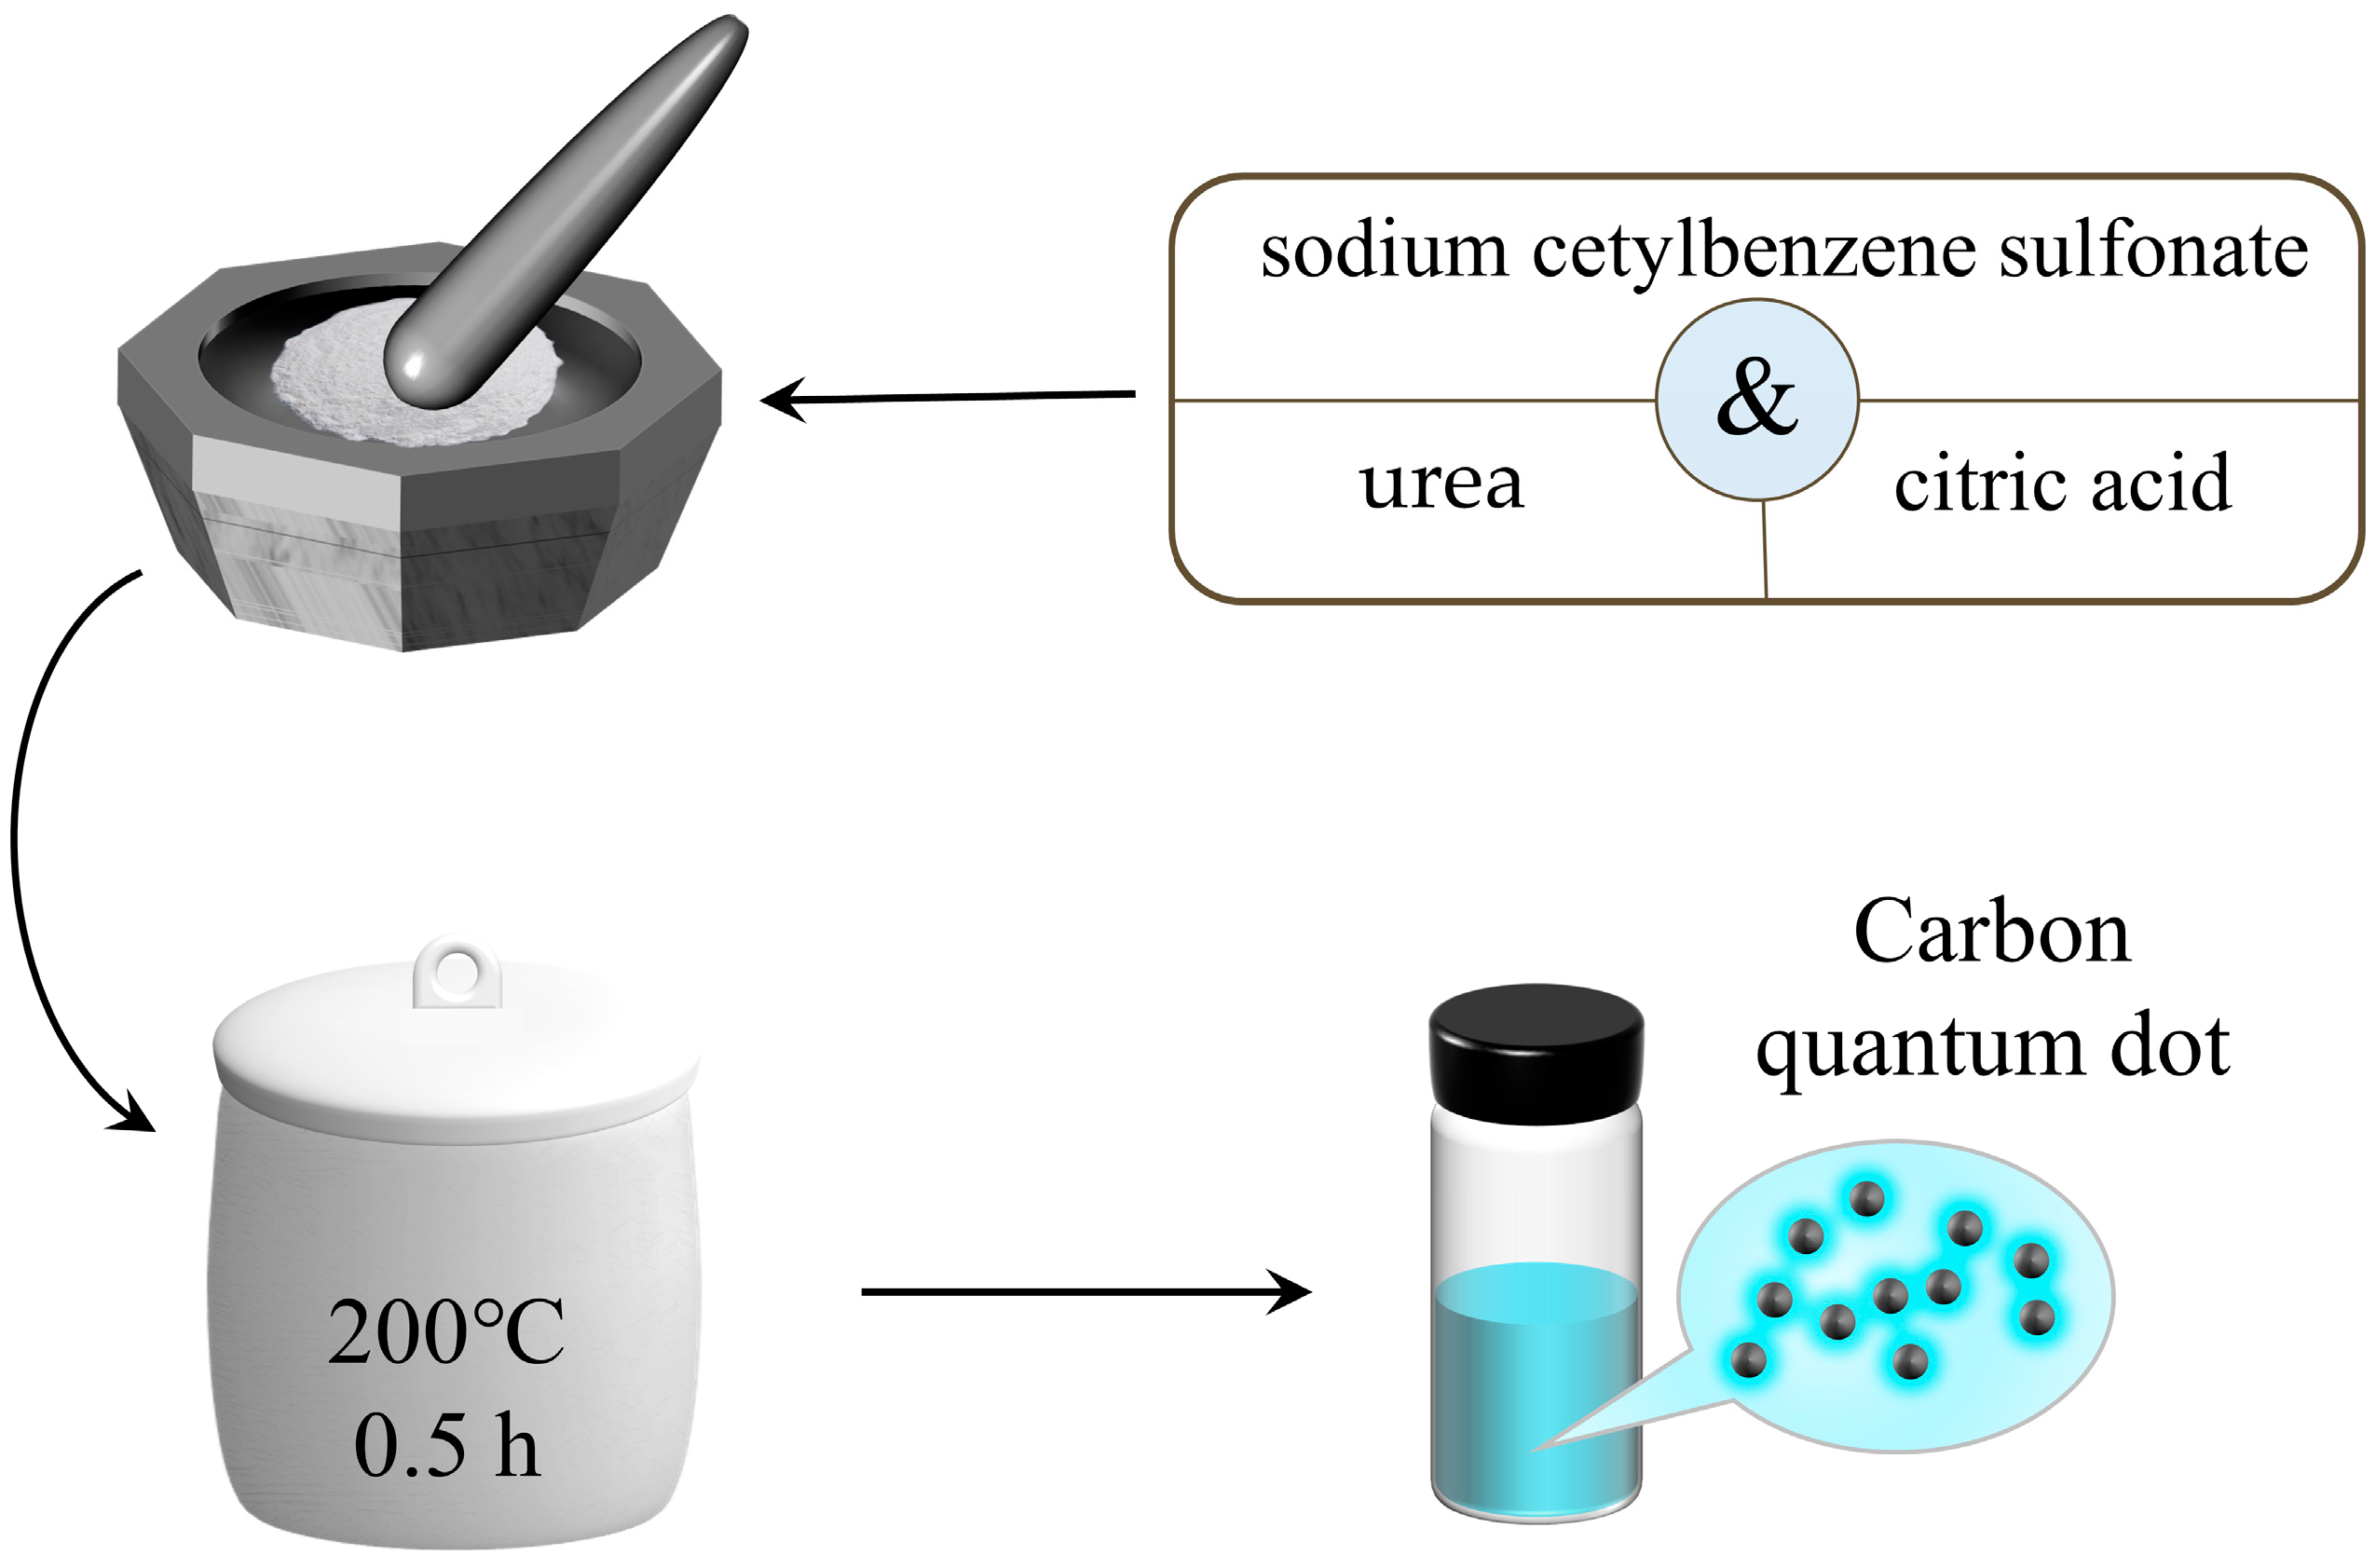
2.2. Synthesis of Green Carbon Quantum Dots

As illustrated in Scheme 1, Citric acid (0.3 g), urea (0.6 g), and sodium cetylbenzene sulfonate (0.3 g) were added to the mortar and ground thoroughly to make a homogeneous mixture of these three precursor powders repetitively, followed by the transfer of the blended powders to the crucible. The crucible was placed in an oven and heated at 200 °C for 0.5 h to obtain the generated product. The fluorescent carbon quantum dot solution was obtained by dissolving the resulting product into 200 mL of deionized water and filtering out the large-sized particles and magazines with a slow filter paper.

2.3. Fabrication of CQD/PVA Films

Next, 5% mass fraction of polyvinyl alcohol (PVA) was added into the carbon quantum dot solution, followed by heating and stirring at 80 °C until dissolved. Then, by uniformly coating the solution on the surface of the glass substrate and evaporating with the solvent, a uniform CQD/PVA sensing film was generated on the substrate.

3. Results and Discussion

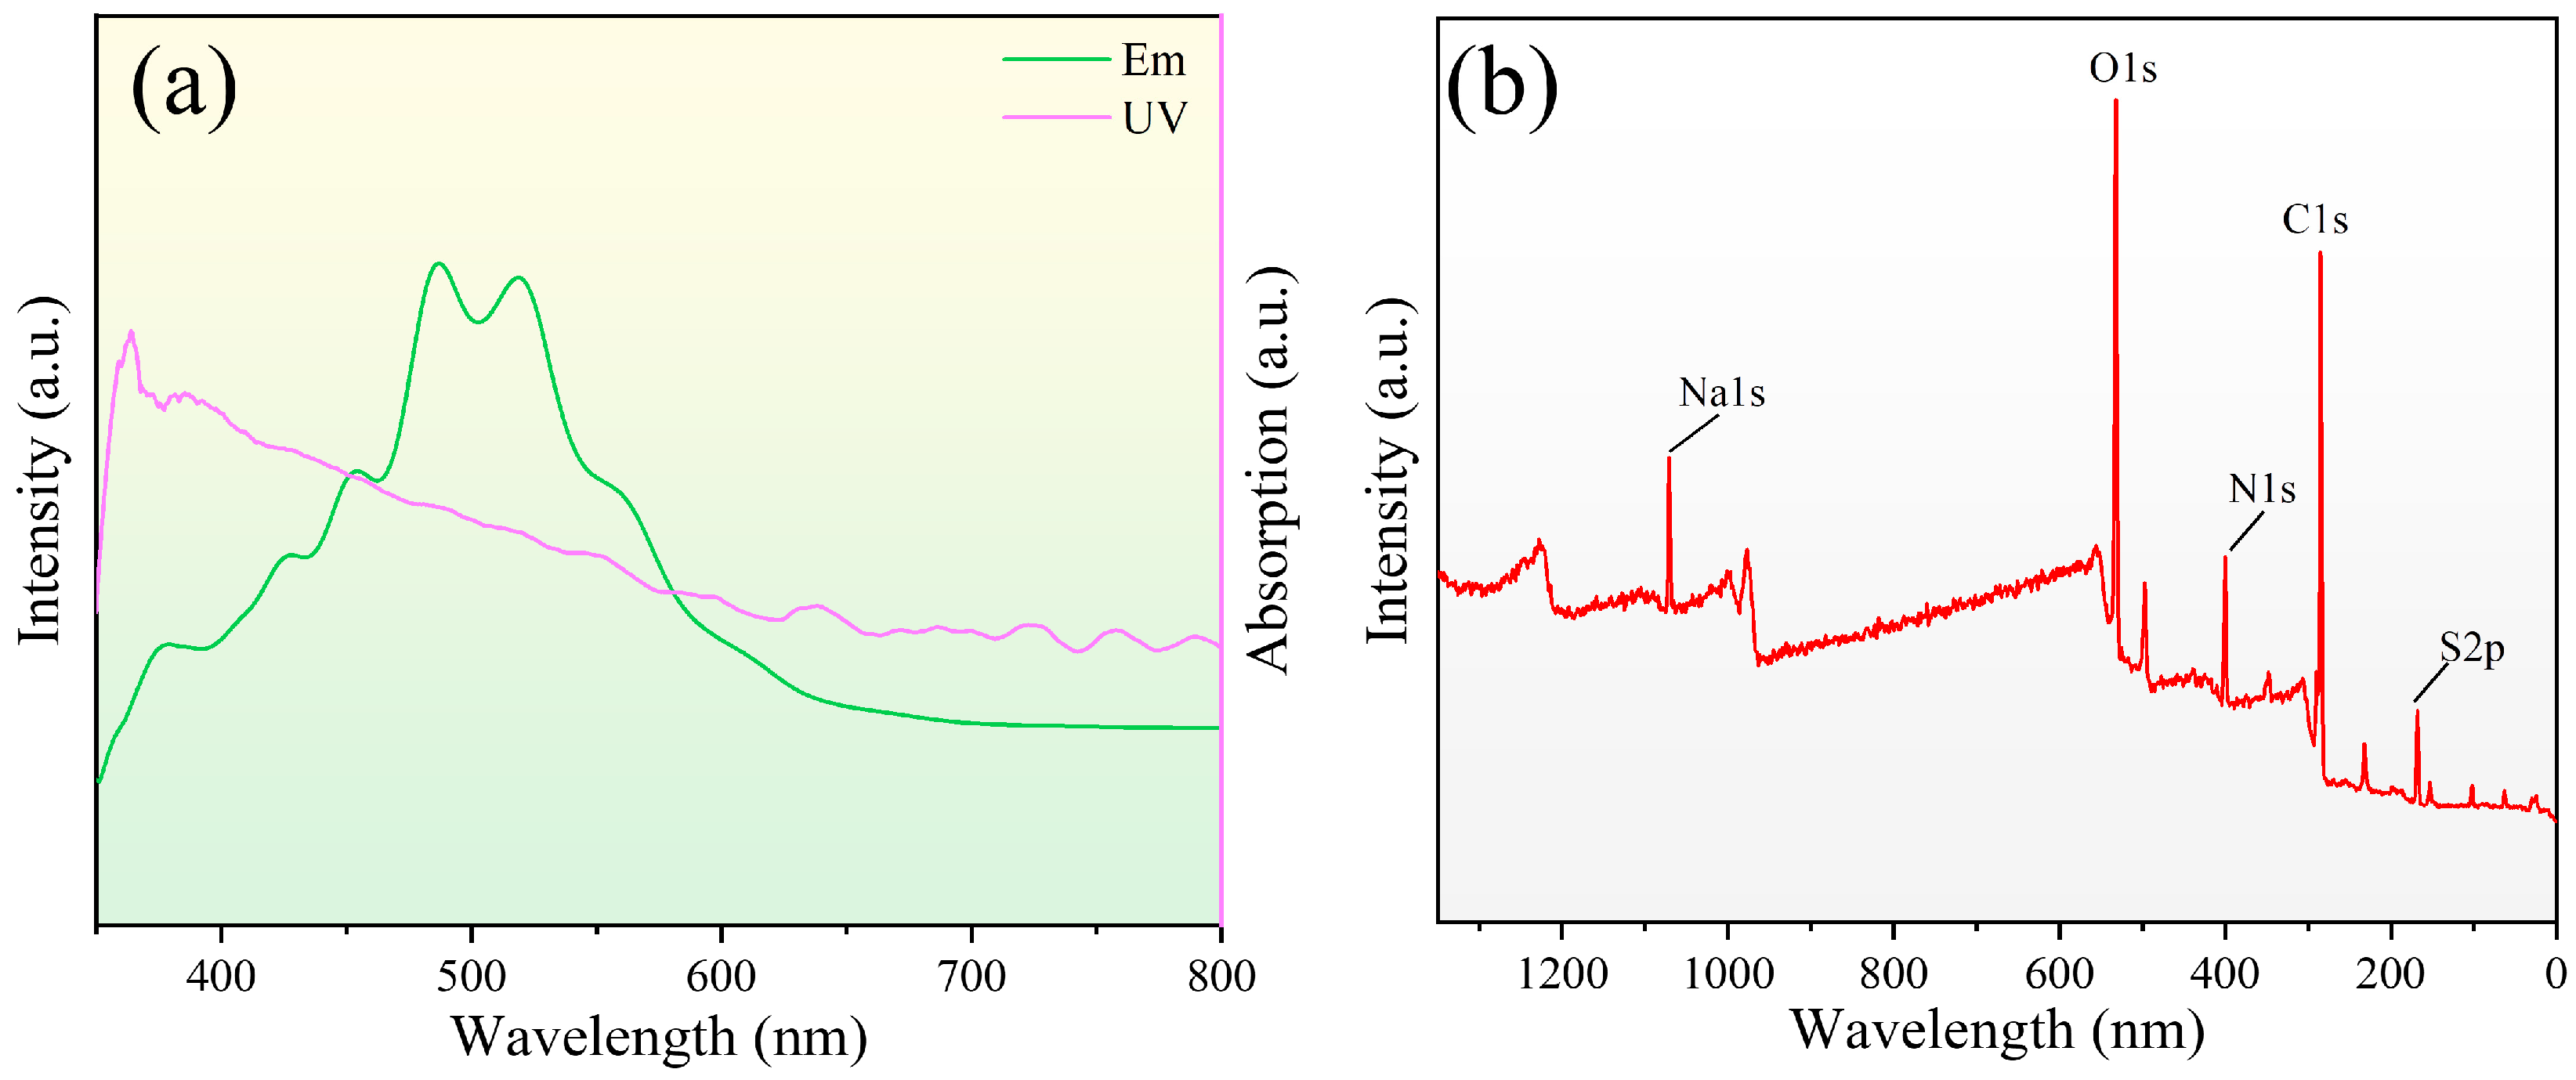
3.1. Structure and Luminescence Characterizations

The quantum dot solution prepared by the pyrolysis method is demonstrated in Figure 1a, which produced bright fluorescence with a green emission under UV light irradiation. Further, we collected solid powders of carbon quantum dots (Figure 1b), and the quantum dots power synthesized in this study still emitted bright fluorescence under UV irradiation at 365 nm, which is distinct from the fluorescence burst phenomenon of carbon dots prepared by many methods. Figure 1c illustrates a typical transmission electron microscopy (TEM) image of the synthesized carbon quantum dots, where the quantum dot particles were uniformly distributed with an approximate circular shape. The high-resolution transmission electron microscopy (HRTEM) image of the carbon quantum dots in this sample was depicted in the upper right corner of the figure, where the lattice stripes of the quantum dots can be clearly observed, proving the successful synthesis of the carbon quantum dots. The particle size distribution of the carbon quantum dots is summarized in Figure 1d, from which it can be appreciated that the average size of the quantum dots was 1.798 nm, and the particle size distribution graph presented a normal distribution, indicating a uniform distribution of the particle size, which is favorable for lubrication applications of the carbon dots.
The fluorescence characteristics of the quantum dots were further investigated. Figure 2a illustrates the photoluminescence spectrum of the carbon quantum dot solution, which has fluorescence emission peaks around 500 nm. Figure 2a presents the UV–visible spectroscopy of the carbon quantum dot solution, which exhibits strong absorption in the range of 400–650 nm; the sharp absorption peaks at 400 nm revealed the occurrence of the n−π* transition of the C==O bond from of carbon quantum dots. For further validation of the successful synthesis of carbon quantum dots, the X-ray photoelectron spectroscopy (XPS) spectrum of the prepared carbon quantum dots is depicted in Figure 2b. The complete XPS spectrum (Figure 2b) revealed five typical peaks at 1071, 532, 400, 285, and 168 eV, respectively, indicating that the carbon quantum dots consisted mainly of Na, O, N, C, and S, retaining all the elements of the precursor, proving the success of the preparation. The high-resolution spectrum of C 1s (Figure S1, Supporting Information) showed that the sharp peak at 284.5 is attributed to the large number of C–C/C=C bonds on the carbon dots [49]. In addition, the spectra of O 1s showed that the introduction of elemental O interferes with the oil solubility of the quantum dots and, therefore, it is necessary to further optimize the dispersion of the quantum dots in subsequent studies. Further analysis of the mechanism of carbon quantum dots in lubrication systems, as mentioned in this paper, is needed in subsequent work.

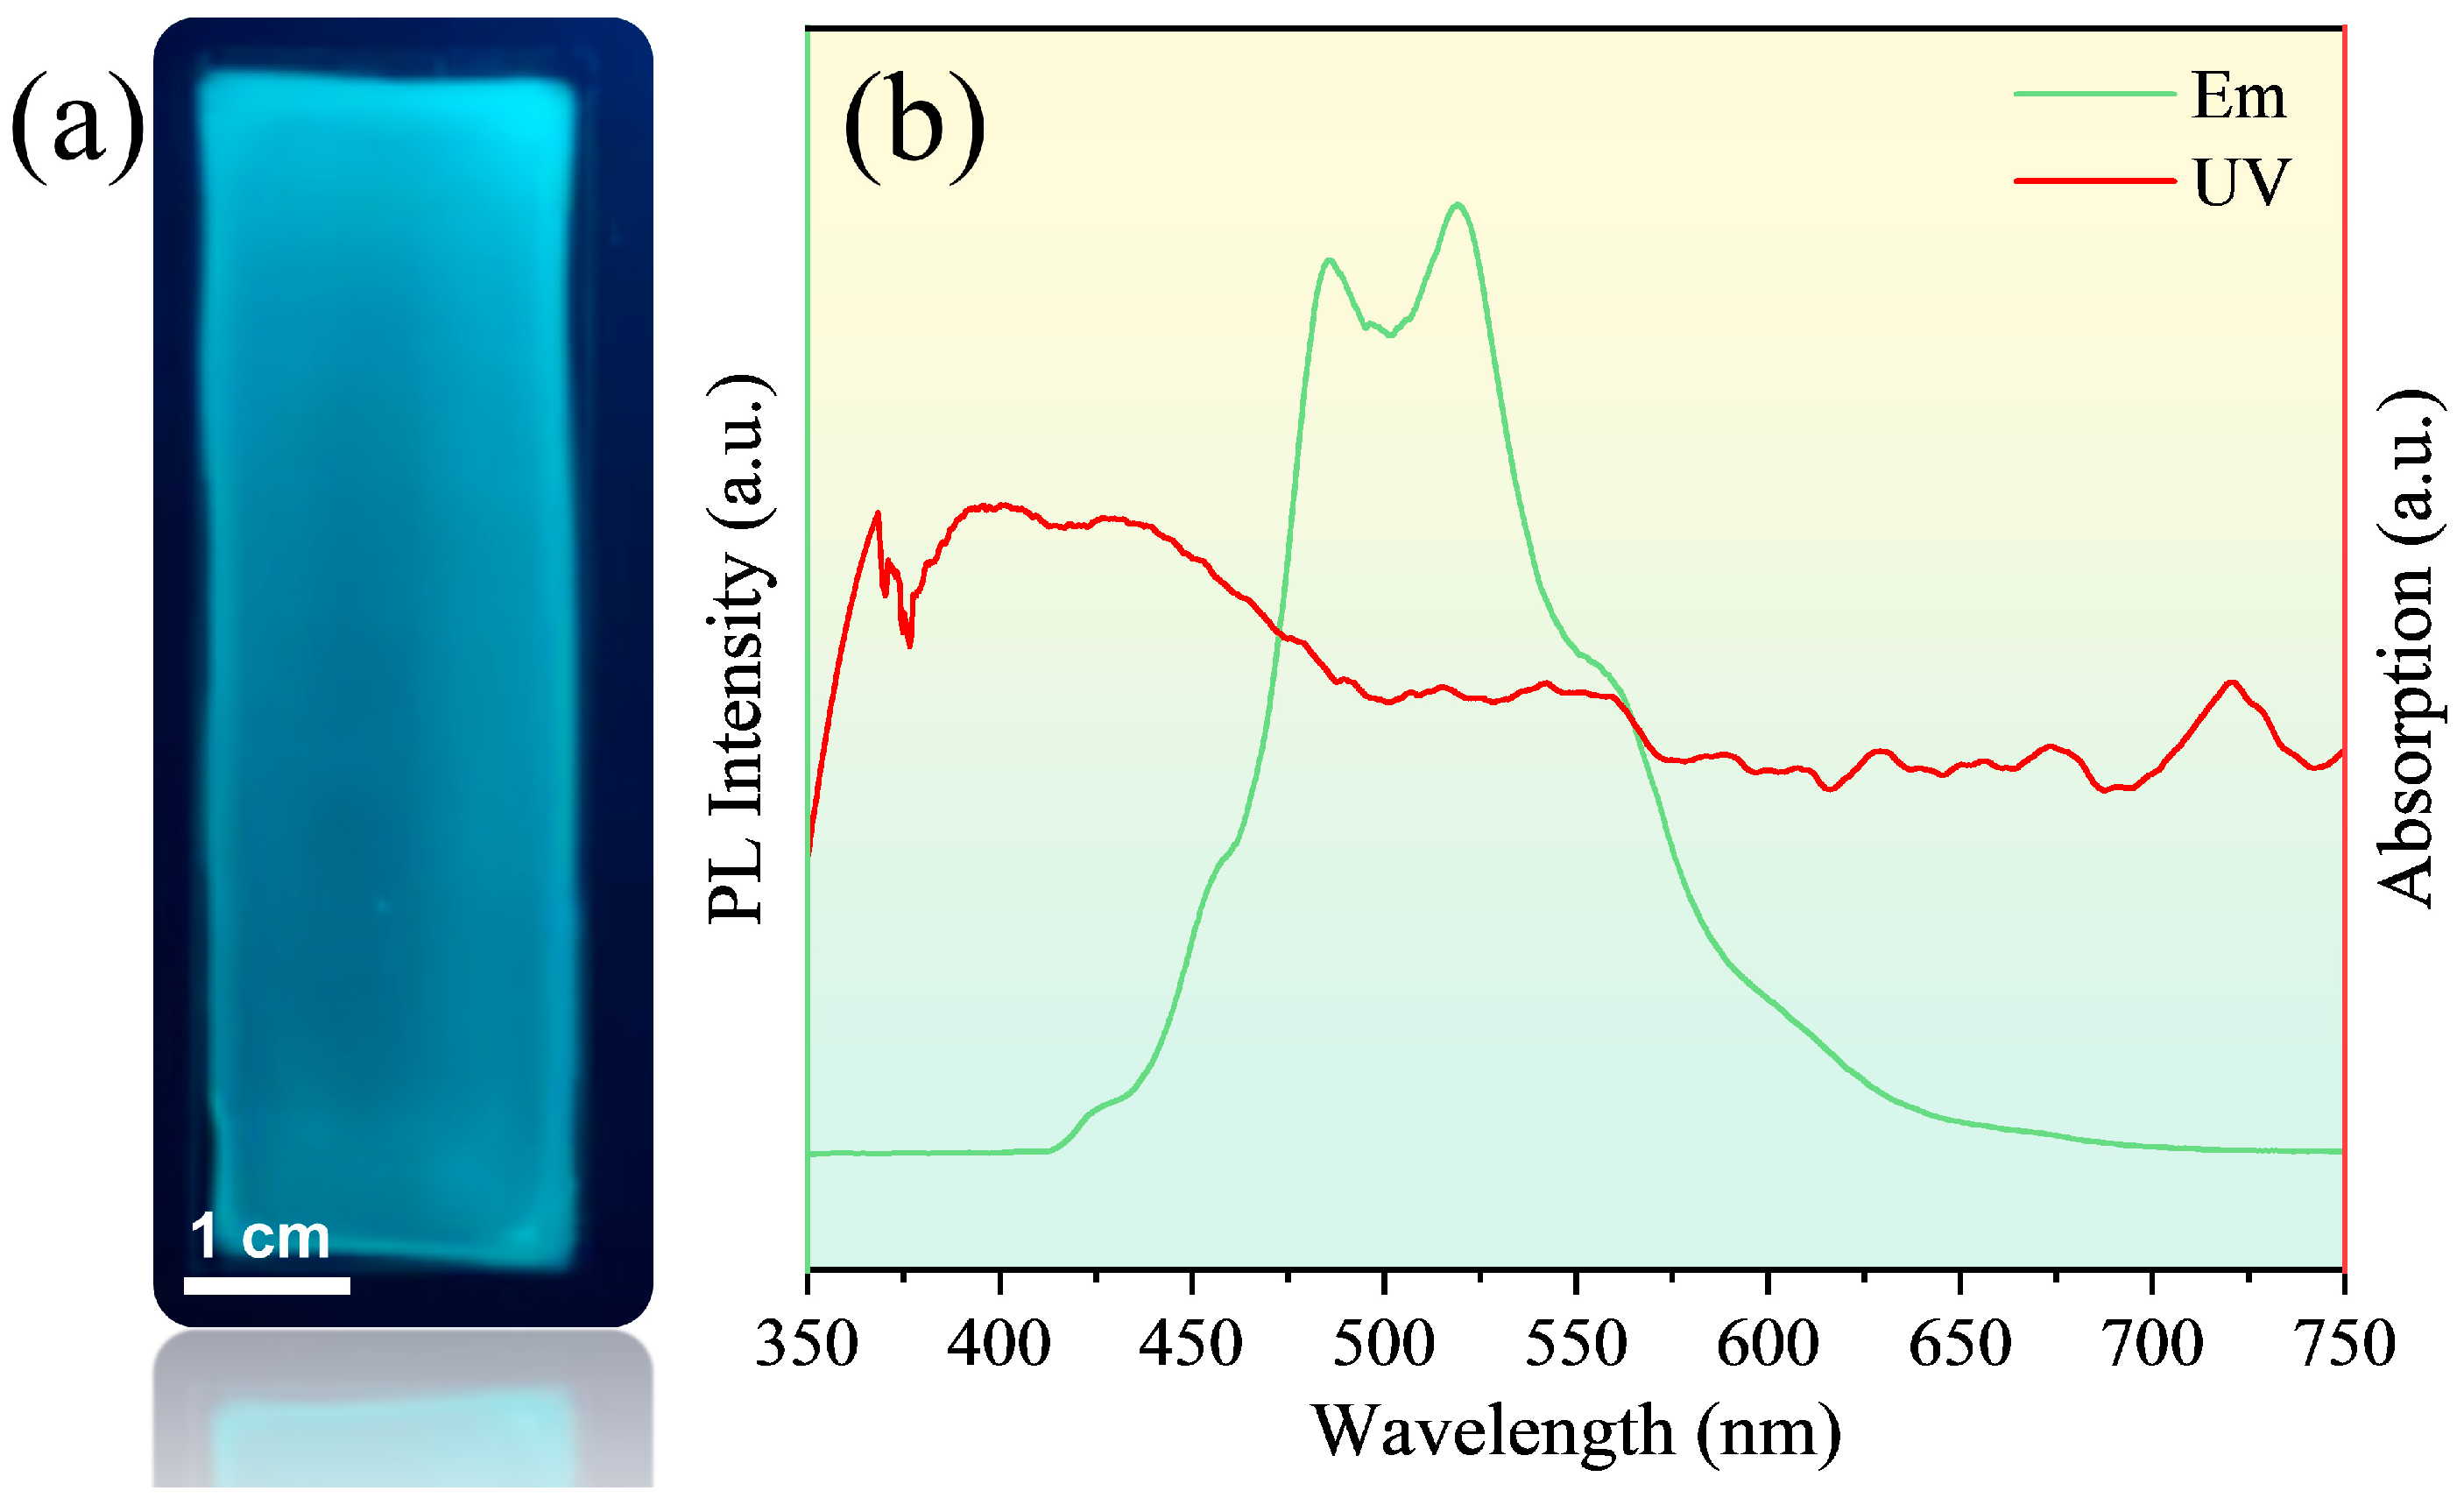
3.2. Optical Characterizations of CQD/PVA Film Probe

The prepared carbon quantum dot/PVA film is demonstrated in Figure 3a, which emitted green fluorescence under UV excitation at 365 nm. The photoluminescence spectra and UV–vis spectra of the films are indicated in Figure 3b, which are basically consistent with the quantum dot solution, indicating the excellent stability of the carbon quantum dot/PVA films.

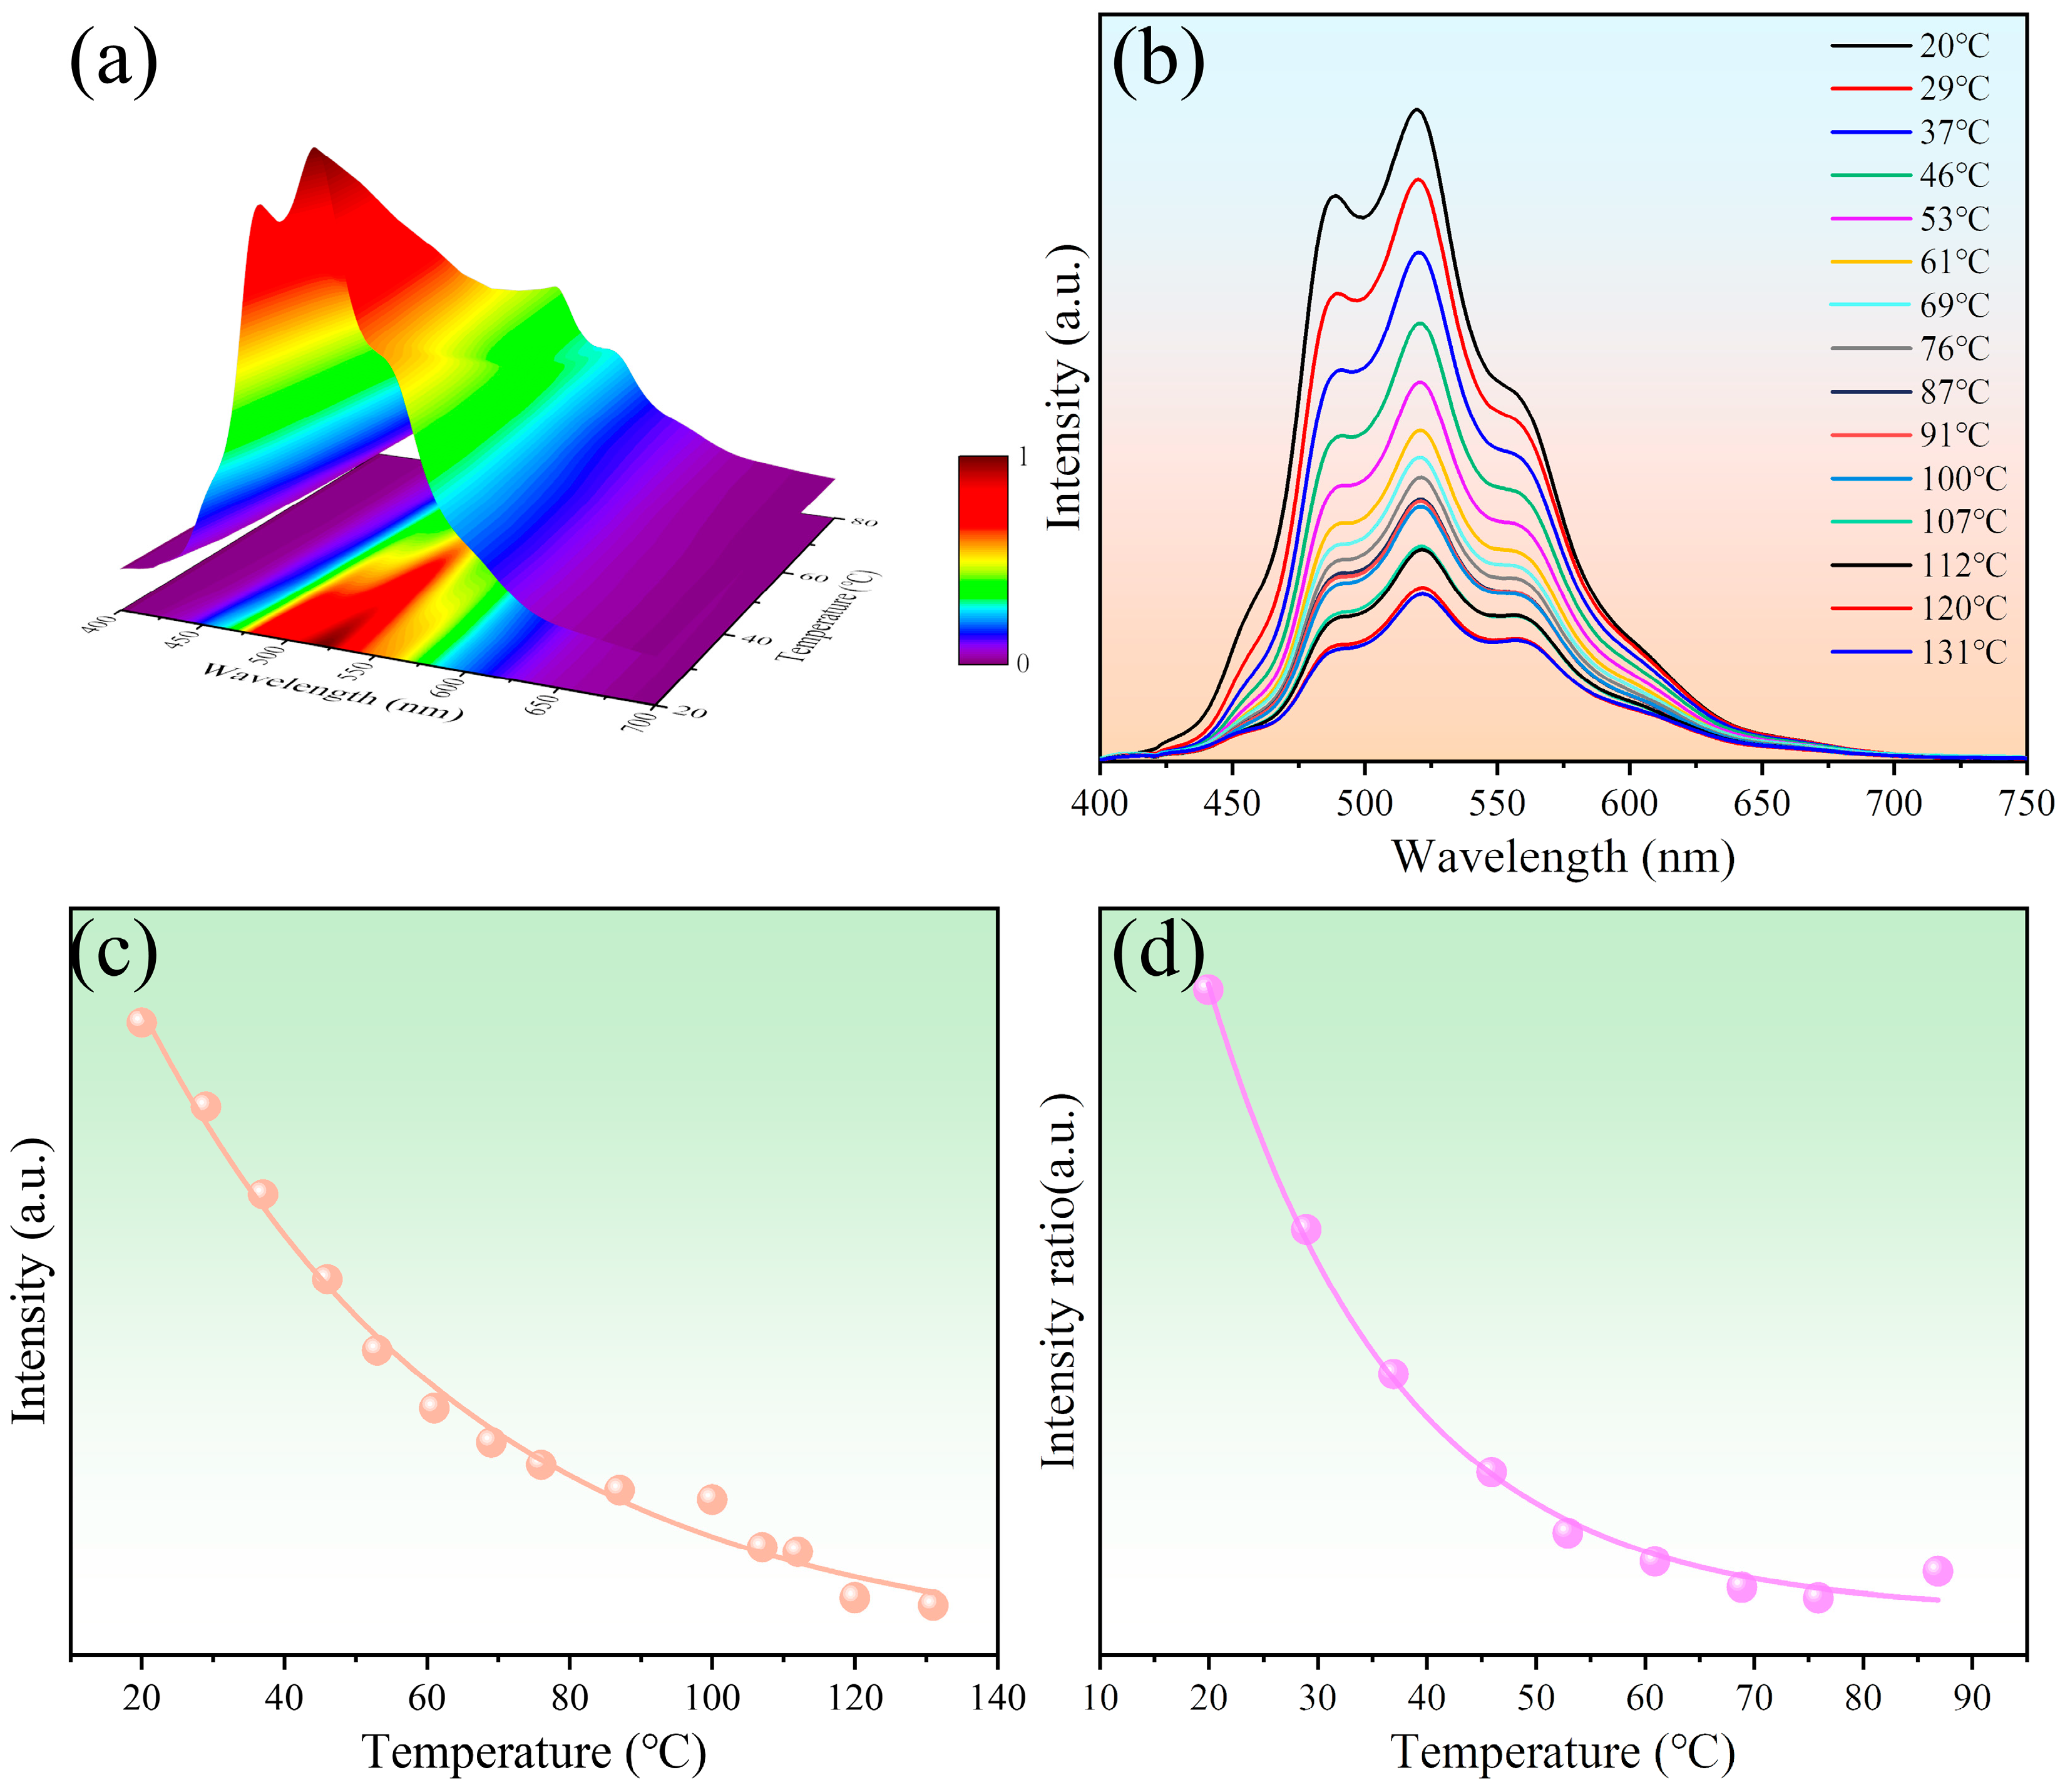
3.3. Temperature Sensing of CQD/PVA Film Probe

It is conceivable that non-contact temperature measurement based on carbon quantum dot films has been of vital significance for applications. In this work, the temperature sensing performance of the quantum dot film sensors was obtained via the constructed temperature-dependent test platform. The quantum dot film sensor on the heating platform was excited by a laser to stimulate the quantum dots into luminescence, and the photoluminescence spectral information was transmitted to the spectrometer through an optical fiber, which was then processed and transmitted to the PC. The temperature information of the quantum dots membrane was collected by an MX 100 data collector and platinum resistance temperature sensor to obtain the correlation relationship between spectrum and temperature.
The photoluminescence spectra of carbon quantum dot/PVA films under varying temperatures are illustrated in Figure 4a,b. It is evident from the figure that the intensity of the quantum dot film decreases as the temperature increases. Among them, the emission peaks at 489 nm and 520 nm appeared to show a decreasing magnitude of different degrees, which seems to imply that the comparison of the two emission peaks has some correlation with the temperature. Firstly, the fluorescence intensity of quantum dots as a function of temperature was obtained by the temperature test system, as shown in Figure 4c. The fluorescence intensity of the 520 nm peak decreased gradually with increasing temperature due to the thermal activation of nonradiative-decay pathways. The intensity of the peak varied exponentially with increasing temperature in the temperature range of 20–130 °C. The gradient of the peak intensity variation per degree Celsius of the quantum dots decreased with increasing temperature, with the specific fitting function shown in Table 1. And after 130 °C, the fit of the fluorescence intensity as a function of temperature decreased, indicating that the quantum dots are not suitable for temperature detection at this time. It is worth stating that there is a remarkably favorable fit between intensity and temperature over a wide temperature range (goodness of fit R2 >0.99, with closer to 1 indicating a better fit), which provided constant thermal sensitivity over the entire dynamic range. It has been investigated that the prepared C quantum dots may contain multiple emission units. Recent reports suggest that the presence of multiple emission peaks may be caused by different surface functional groups [50,51,52,53,54], which makes it possible for the prepared carbon quantum dot film probes to be ratiometric fluorescent temperature sensors. The temperature dependence of the intensity ratio of the two emission peaks at 489 nm and 520 nm under 405 nm excitation is shown in Figure 4d. The fluorescence intensity ratios of the film probes exhibited an exponential fit to temperature over the temperature range of 20–80 °C. In addition, the goodness of fit R2 of the fluorescence intensity ratio is 0.996, indicating the excellent temperature-dependent performance of the quantum dots.
Further, the fitted curves for the temperature-dependent properties of the quantum dots are given in Table 1. Among them, fluorescence intensity-based measurements demonstrated a higher temperature range and goodness of fit R2. Additionally, temperature sensitivity is crucial for the evaluation of thermometers, and in this paper, the sensing performance of quantum dots was evaluated using the relative sensitivity SR, which is expressed as the relative variation in the fluorescence intensity (or fluorescence intensity ratio) of the quantum dots with respect to themselves. The highest relative sensitivity SR of the two thermometry methods for carbon quantum dots was 1.74% and 1.39%, respectively, indicating a higher sensitivity for the intensity-based measurements. Meanwhile, it is worth stating that the measurement method based on the fluorescence intensity ratio has the advantage of avoiding laser fluctuations caused by laser intensity and distance. The above studies suggest that the carbon quantum dot can be employed as an intensity-based temperature sensor with high sensitivity.
In this work, the relative sensitivity is employed to characterize the sensitivity of the temperature probe, which is calculated as follows:
S R = 1 y y x

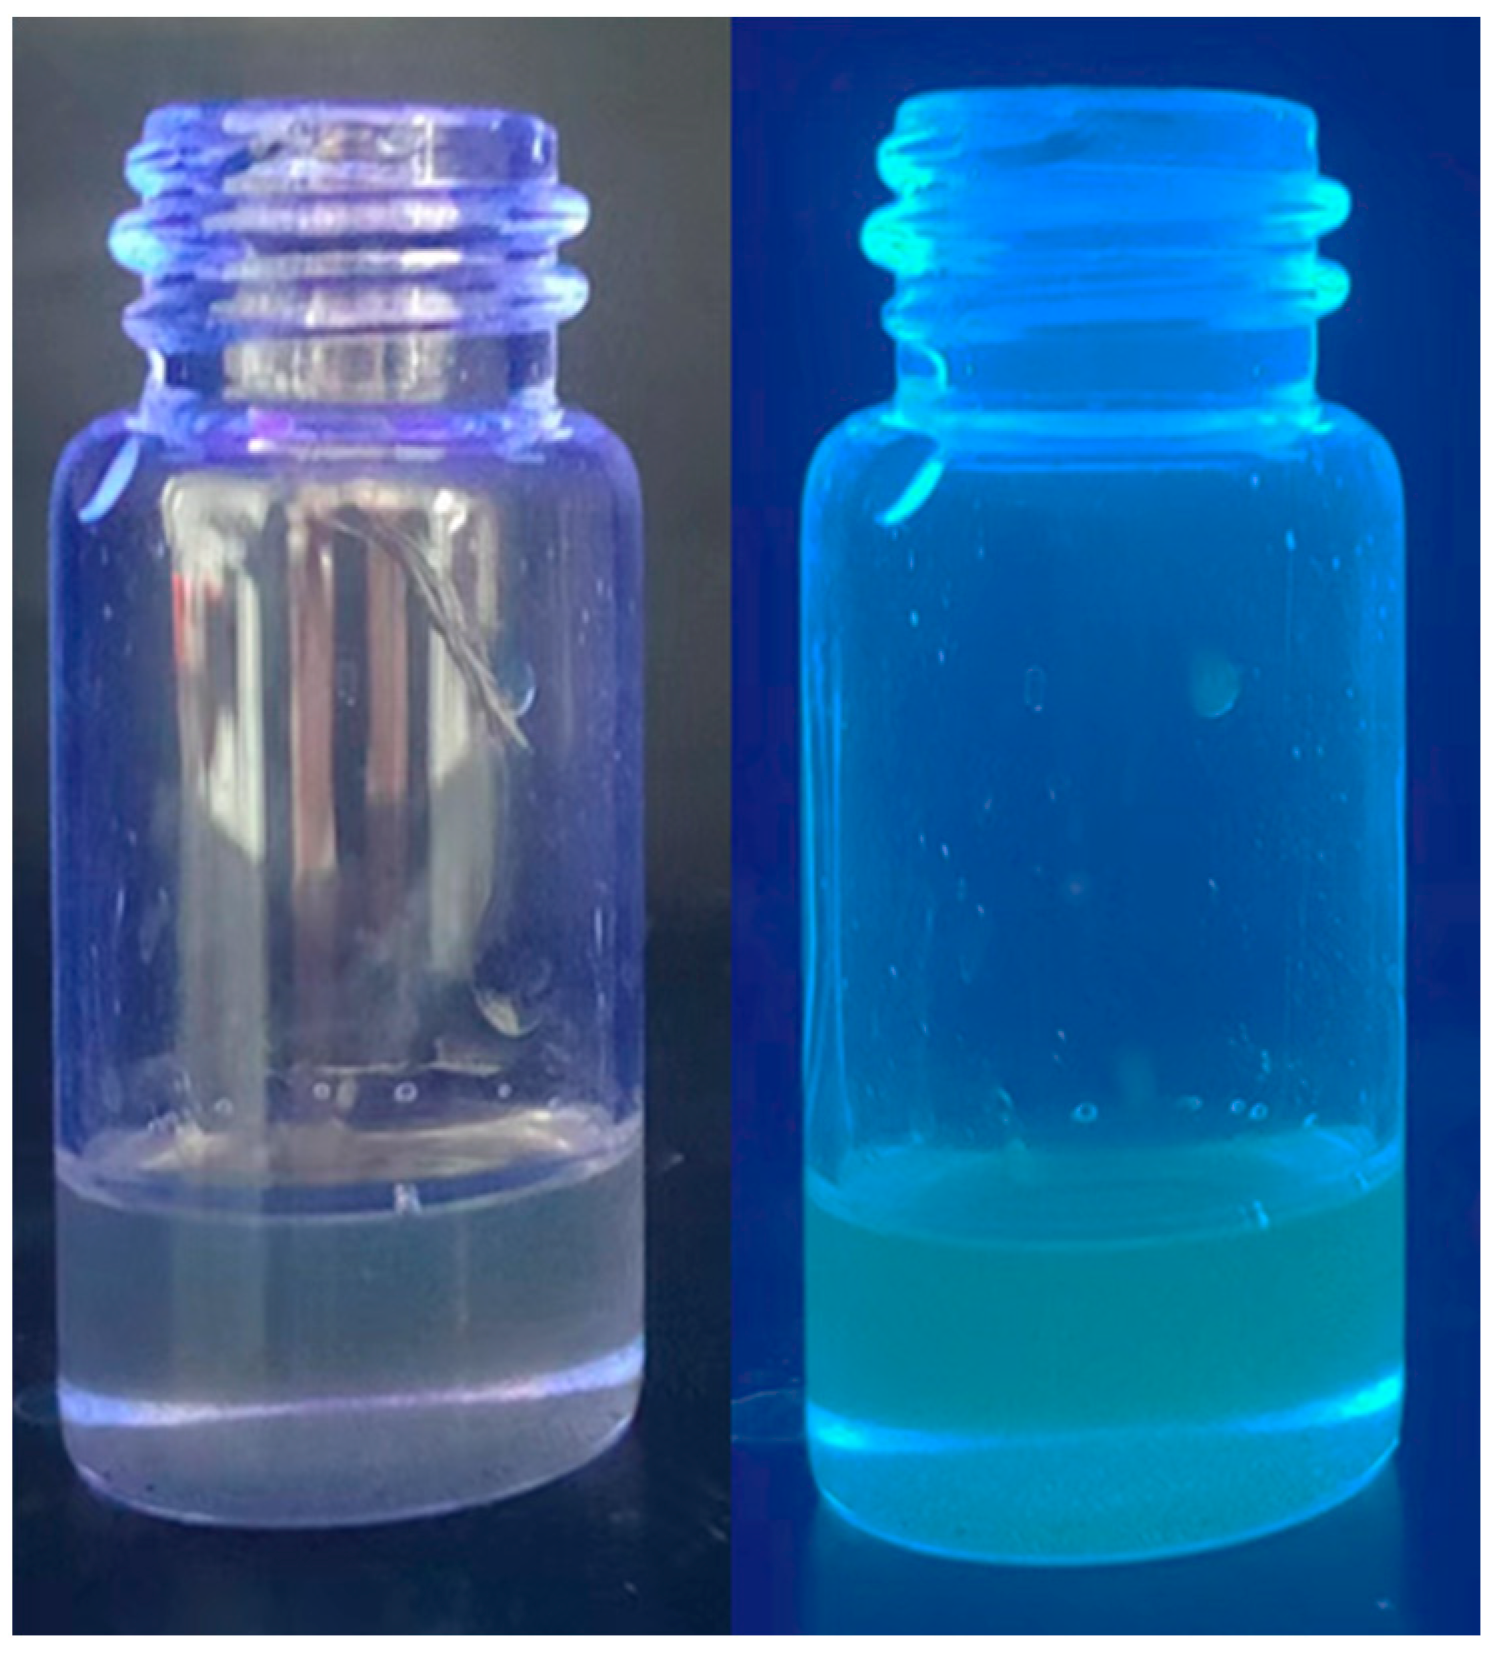
3.4. Behavior of Carbon Quantum Dots in Lubricant System

Lubricant additives based on carbon quantum dot doping have been documented as an effective strategy for improving the tribological properties of lubricants. However, few studies have been conducted for the temperature monitoring of carbon quantum dots in lubrication systems. In this work, we systematically investigated the temperature response properties of carbon quantum dot additives in liquid paraffin systems by preparing mixed solutions containing carbon quantum dots.
The carbon quantum dots were homogeneously dispersed in the liquid paraffin system by dispersing the carbon quantum dot powder with a mass fraction of 0.3% into the liquid paraffin solution, followed by the sufficient stirring of the dispersion and its sonication for 1 h. The prepared carbon quantum dots–liquid paraffin dispersion system is demonstrated in Figure 5, from which it can be observed that the quantum dots was uniformly dispersed in the liquid paraffin, exhibiting green fluorescence under UV irradiation, which is due to the fact that the lipophilic end with long-chain alkanes in sodium cetylbenzene sulfonate was retained during the preparation of the carbon quantum dots. Furthermore, the temperature-dependent properties of the carbon quantum dots in the liquid paraffin system were tested, as illustrated in Figure 6a, and the fluorescence intensity of the quantum dots exhibited a decreasing trend with increasing temperature under the liquid paraffin system, and the specific relationship is shown in Figure 6b. Consistent with the carbon quantum dot/PVA film, the fluorescence intensity of the quantum dots within the liquid paraffin exhibited an exponential function fit to temperature, that is, with the increase in temperature, the fluorescence intensity of the quantum dots tends to follow an exponential function curve. The fluorescence intensity of quantum dots varies greatly at low temperatures, but little at high temperatures, and the relevant parameters are presented in Table 2. Over a broad temperature range, quantum dots in liquid paraffin demonstrated an excellent degree of fit (R2 > 0.99). Furthermore, the results suggest that the carbon quantum dots in liquid paraffin exhibited a broad temperature measurement range, a high relative sensitivity, and the ability to detect fluorescence in lubricated systems, as demonstrated by their relative sensitivity of up to 2.84% K−1, which was significantly higher than that of most nanomaterials for temperature sensing (Table 3). Based on the above experimental results and discussions, the potential of carbon quantum dots for temperature sensing applications in liquid paraffin systems is validated. Furthermore, there is still a necessity to conduct research on carbon quantum dots in subsequent studies to improve the stability of quantum dots under lubrication systems.

4. Conclusions

In this study, carbon quantum dot nanomaterials with green fluorescence were synthesized via a simple method, and a polymeric PVA film probe containing carbon quantum dots was tested for its temperature sensing properties as well as the temperature sensing potential of carbon quantum dots in liquid paraffin lubrication systems. The test results demonstrated that the carbon quantum dots exhibited promising fluorescence properties as well as fluorescence-based temperature dependence under a PVA matrix and liquid paraffin system. The obtained carbon quantum dots/PVA membrane probes can offer an efficient temperature monitoring strategy, as proved by their exponential thermal sensing properties based on fluorescence intensity and fluorescence intensity ratios, respectively. Additionally, they demonstrated a high goodness of fit (R2 > 0.99) and relative thermal sensitivities (relative sensitivities of 1.74% K−1 and 1.39% K−1 for fluorescence intensity and fluorescence intensity ratio, respectively). Further, taking liquid paraffin as the lubrication medium, the carbon quantum dots exhibited a high temperature range, a high goodness of fit (R2 > 0.99), and high thermal relative sensitivity (2.84% K−1) in the lubrication system. This research is expected to provide an effective strategy for highly sensitive equipment condition monitoring as well as temperature detection in lubrication systems.

Supplementary Materials

The following supporting information can be downloaded at: https://www.mdpi.com/article/10.3390/lubricants12030088/s1, Method; Figure S1: XPS fine spectra of the prepared Carbon quantum dot materials.

Author Contributions

Conceptualization, K.Y. and A.P.; Data curation, K.Y.; Formal analysis, J.S.; Funding acquisition, K.Y.; Investigation, J.S.; Methodology, J.S., K.Y., A.P. and P.Z.; Project administration, K.Y.; Software, J.S.; Supervision, K.Y. and A.P.; Validation, J.S.; Visualization, J.S.; Writing—original draft, J.S.; Writing—review and editing, P.Z., X.C. and X.S. All authors have read and agreed to the published version of the manuscript.

Funding

The financial support was received from the National Natural Science Foundation of China (52175250); Key Special Project of Ministry of Industry and Information Technology (TC220H05VHZ).

Data Availability Statement

Data are contained within the article.

Conflicts of Interest

The authors declare no conflicts of interest.

References

  1. Zhang, J.; Drinkwater, B.W.; Dwyer-Joyce, R.S. Monitoring of Lubricant Film Failure in a Ball Bearing Using Ultrasound. J. Tribol. 2006, 128, 612–618. [Google Scholar] [CrossRef]
  2. Abdeljaber, O.; Sassi, S.; Avci, O.; Kiranyaz, S.; Ibrahim, A.A.; Gabbouj, M. Fault Detection and Severity Identification of Ball Bearings by Online Condition Monitoring. IEEE Trans. Ind. Electron. 2019, 66, 8136–8147. [Google Scholar] [CrossRef]
  3. Han, Y.; Song, Y.H. Condition monitoring techniques for electrical equipment-a literature survey. IEEE Trans. Power Deliv. 2003, 18, 4–13. [Google Scholar] [CrossRef]
  4. Singh, V.; Verma, N.K. Intelligent Condition-Based Monitoring Techniques for Bearing Fault Diagnosis. IEEE Sens. J. 2021, 21, 15448–15457. [Google Scholar] [CrossRef]
  5. Zhang, J.; Spikes, H. Measurement of EHD Friction at Very High Contact Pressures. Tribol. Lett. 2020, 68, 42. [Google Scholar] [CrossRef]
  6. Deolalikar, N.; Sadeghi, F.; Marble, S. Numerical Modeling of Mixed Lubrication and Flash Temperature in EHL Elliptical Contacts. J. Tribol. 2007, 130, 011004. [Google Scholar] [CrossRef]
  7. Liang, H.; Guo, D.; Reddyhoff, T.; Spikes, H.; Luo, J. Influence of thermal effects on elastohydrodynamic (EHD) lubrication behavior at high speeds. Sci. China Technol. Sci. 2015, 58, 551–558. [Google Scholar] [CrossRef]
  8. Turchina, V.; Sanborn, D.M.; Winer, W.O. Temperature Measurements in Sliding Elastohydrodynamic Point Contacts. J. Lubr. Technol. 1974, 96, 464–469. [Google Scholar] [CrossRef]
  9. Lauer, J.L.; Peterkin, M.E. Infrared Emission Spectra of Elastohydrodynamic Contacts. J. Lubr. Technol. 1976, 98, 230–235. [Google Scholar] [CrossRef]
  10. Cann, P.M.; Spikes, H.A. In Lubro Studies of Lubricants in EHD Contacts Using FTIR Absorption Spectroscopy. Tribol. Trans. 1991, 34, 248–256. [Google Scholar] [CrossRef]
  11. Reddyhoff, T.; Spikes, H.A.; Olver, A.V. Improved infrared temperature mapping of elastohydrodynamic contacts. Proc. Inst. Mech. Eng. Part J J. Eng. Tribol. 2009, 223, 1165–1177. [Google Scholar] [CrossRef]
  12. Le Rouzic, J.; Reddyhoff, T. Development of Infrared Microscopy for Measuring Asperity Contact Temperatures. J. Tribol. 2013, 135, 021504. [Google Scholar] [CrossRef]
  13. Omasta, M.; Adam, J.; Sperka, P.; Krupka, I.; Hartl, M. On the Temperature and Lubricant Film Thickness Distribution in EHL Contacts with Arbitrary Entrainment. Lubricants 2018, 6, 101. [Google Scholar] [CrossRef]
  14. Zhiyi, H.; Haidong, S.; Xiang, Z.; Yu, Y.; Junsheng, C. An intelligent fault diagnosis method for rotor-bearing system using small labeled infrared thermal images and enhanced CNN transferred from CAE. Adv. Eng. Inform. 2020, 46, 101150. [Google Scholar] [CrossRef]
  15. Li, Y.; Fan, A.; Zhang, X.; Zhang, X. A two-step in situ measurement method for temperature and thermal stress of power device based on a single Raman peak. Int. J. Heat Mass Transf. 2023, 216, 124555. [Google Scholar] [CrossRef]
  16. Kumar Saxena, M.; Sharma, R.K.; Kumar, S.; Kishore, J.; Nathwani, R.K.; Gupta, A.M.; Kumar, A.; Kumar, A.; Bhatnagar, V.K.; Prakash, O.; et al. Studies on thermal profile measurement and fire detection in a power supply cable of a synchrotron radiation source by Raman optical fiber distributed temperature sensor system. Opt. Fiber Technol. 2022, 73, 103020. [Google Scholar] [CrossRef]
  17. Jubault, I.; Mansot, J.L.; Vergne, P.; Mazuyer, D. In-situ Pressure Measurements Using Raman Microspectroscopy in a Rolling Elastohydrodynamic Contact. J. Tribol. 2001, 124, 114–120. [Google Scholar] [CrossRef]
  18. Cheong, C.U.A.; Stair, P.C. In Situ Measurements of Lubricant Temperature and Pressure at a Sliding Contact. J. Phys. Chem. C 2007, 111, 11314–11319. [Google Scholar] [CrossRef]
  19. Kannel, J.W.; Bell, J.C.; Allen, C.M. Methods for Determining Pressure Distributions in Lubricated Rolling Contact. ASLE Trans. 1965, 8, 250–270. [Google Scholar] [CrossRef]
  20. Ebner, M.; Ziegltrum, A.; Lohner, T.; Michaelis, K.; Stahl, K. Measurement of EHL temperature by thin film sensors—Thermal insulation effects. Tribol. Int. 2020, 149, 105515. [Google Scholar] [CrossRef]
  21. Smart, A.E.; Ford, R.A.J. Measurement of thin liquid films by a fluorescence technique. Wear 1974, 29, 41–47. [Google Scholar] [CrossRef]
  22. Gangwar, R.K.; Kumari, S.; Pathak, A.K.; Gutlapalli, S.D.; Meena, M.C. Optical Fiber Based Temperature Sensors: A Review. Optics 2023, 4, 171–197. [Google Scholar] [CrossRef]
  23. Zhou, J.; Xu, S.; Liu, J. Review of Photothermal Technique for Thermal Measurement of Micro-/Nanomaterials. Nanomaterials 2022, 12, 1884. [Google Scholar] [CrossRef] [PubMed]
  24. Reddyhoff, T.; Choo, J.H.; Spikes, H.A.; Glovnea, R.P. Lubricant Flow in an Elastohydrodynamic Contact Using Fluorescence. Tribol. Lett. 2010, 38, 207–215. [Google Scholar] [CrossRef]
  25. Ponjavic, A.; Chennaoui, M.; Wong, J.S.S. Through-Thickness Velocity Profile Measurements in an Elastohydrodynamic Contact. Tribol. Lett. 2013, 50, 261–277. [Google Scholar] [CrossRef]
  26. Mohammed, L.J.; Omer, K.M. Carbon Dots as New Generation Materials for Nanothermometer: Review. Nanoscale Res. Lett. 2020, 15, 182. [Google Scholar] [CrossRef] [PubMed]
  27. Llobet, E. Gas sensors using carbon nanomaterials: A review. Sens. Actuators B Chem. 2013, 179, 32–45. [Google Scholar] [CrossRef]
  28. Jayathilaka, W.A.D.M.; Qi, K.; Qin, Y.; Chinnappan, A.; Serrano-García, W.; Baskar, C.; Wang, H.; He, J.; Cui, S.; Thomas, S.W.; et al. Significance of Nanomaterials in Wearables: A Review on Wearable Actuators and Sensors. Adv. Mater. 2019, 31, 1805921. [Google Scholar] [CrossRef]
  29. Rahman, M.T.; Cheng, C.-Y.; Karagoz, B.; Renn, M.; Schrandt, M.; Gellman, A.; Panat, R. High Performance Flexible Temperature Sensors via Nanoparticle Printing. ACS Appl. Nano Mater. 2019, 2, 3280–3291. [Google Scholar] [CrossRef]
  30. Steinegger, A.; Klimant, I.; Borisov, S.M. Purely Organic Dyes with Thermally Activated Delayed Fluorescence—A Versatile Class of Indicators for Optical Temperature Sensing. Adv. Opt. Mater. 2017, 5, 1700372. [Google Scholar] [CrossRef]
  31. Gomez, G.E.; Kaczmarek, A.M.; Van Deun, R.; Brusau, E.V.; Narda, G.E.; Vega, D.; Iglesias, M.; Gutierrez-Puebla, E.; Monge, M.Á. Photoluminescence, Unconventional-Range Temperature Sensing, and Efficient Catalytic Activities of Lanthanide Metal–Organic Frameworks. Eur. J. Inorg. Chem. 2016, 2016, 1577–1588. [Google Scholar] [CrossRef]
  32. Li, X.; Yu, Y.; Hong, J.; Feng, Z.; Guan, X.; Chen, D.; Zheng, Z. Optical temperature sensing of Eu3+-doped oxyhalide glasses containing CsPbBr3 perovskite quantum dots. J. Lumin. 2020, 219, 116897. [Google Scholar] [CrossRef]
  33. Liang, R.; Tian, R.; Shi, W.; Liu, Z.; Yan, D.; Wei, M.; Evans, D.G.; Duan, X. A temperature sensor based on CdTe quantum dots–layered double hydroxide ultrathin films via layer-by-layer assembly. Chem. Commun. 2013, 49, 969–971. [Google Scholar] [CrossRef] [PubMed]
  34. Madhu, M.; Lu, C.-Y.; Tseng, W.-L. Phosphorescent MoS2 quantum dots as a temperature sensor and security ink. Nanoscale Adv. 2021, 3, 661–667. [Google Scholar] [CrossRef] [PubMed]
  35. Ahmed, S.R.; Sherazee, M.; Das, P.; Dondapati, J.; Srinivasan, S.; Rajabzadeh, A.R. Borophene Quantum Dots with Enhanced Nanozymatic Activity for the Detection of H2O2 and Cardiac Biomarkers. ACS Appl. Nano Mater. 2023, 6, 19939–19946. [Google Scholar] [CrossRef]
  36. Ganguly, S.; Margel, S. Fluorescent quantum dots-based hydrogels: Synthesis, fabrication and multimodal biosensing. Talanta Open 2023, 8, 100243. [Google Scholar] [CrossRef]
  37. Li, X.; Zhao, S.; Li, B.; Yang, K.; Lan, M.; Zeng, L. Advances and perspectives in carbon dot-based fluorescent probes: Mechanism, and application. Coord. Chem. Rev. 2021, 431, 213686. [Google Scholar] [CrossRef]
  38. Tian, Z.; Zhang, X.; Li, D.; Zhou, D.; Jing, P.; Shen, D.; Qu, S.; Zboril, R.; Rogach, A.L. Full-Color Inorganic Carbon Dot Phosphors for White-Light-Emitting Diodes. Adv. Opt. Mater. 2017, 5, 1700416. [Google Scholar] [CrossRef]
  39. Macairan, J.-R.; Jaunky, D.B.; Piekny, A.; Naccache, R. Intracellular ratiometric temperature sensing using fluorescent carbon dots. Nanoscale Adv. 2019, 1, 105–113. [Google Scholar] [CrossRef]
  40. Li, C.; Qin, Z.; Wang, M.; Liu, W.; Jiang, H.; Wang, X. Manganese oxide doped carbon dots for temperature-responsive biosensing and target bioimaging. Anal. Chim. Acta 2020, 1104, 125–131. [Google Scholar] [CrossRef]
  41. Zhu, A.; Qu, Q.; Shao, X.; Kong, B.; Tian, Y. Carbon-Dot-Based Dual-Emission Nanohybrid Produces a Ratiometric Fluorescent Sensor for In Vivo Imaging of Cellular Copper Ions. Angew. Chem. Int. Ed. 2012, 51, 7185–7189. [Google Scholar] [CrossRef] [PubMed]
  42. Sharma, V.; Tiwari, P.; Mobin, S.M. Sustainable carbon-dots: Recent advances in green carbon dots for sensing and bioimaging. J. Mater. Chem. B 2017, 5, 8904–8924. [Google Scholar] [CrossRef] [PubMed]
  43. Wang, C.; He, Y.; Huang, J.; Sui, L.; Ran, G.; Zhu, H.; Song, Q. Intramolecular hydrogen bond-tuned thermal-responsive carbon dots and their application to abnormal body temperature imaging. J. Colloid Interface Sci. 2023, 634, 221–230. [Google Scholar] [CrossRef] [PubMed]
  44. Zhang, Y.; Jia, X.; Tian, Q.; Yang, J.; Wang, S.; Li, Y.; Shao, D.; Feng, L.; Song, H. Nitrogen-Doped Carbon Dot as a Lubricant Additive in Polar and Non-polar Oils for Superior Tribological Properties via Condensation Reaction. Langmuir 2023, 39, 3589–3600. [Google Scholar] [CrossRef]
  45. Kumar, V.B.; Sahu, A.K.; Rao, K.B.S. Development of Doped Carbon Quantum Dot-Based Nanomaterials for Lubricant Additive Applications. Lubricants 2022, 10, 144. [Google Scholar] [CrossRef]
  46. Xue, S.; Cui, Y.; Chen, X.; Shi, J.; Liu, S.; Ye, Q.; Zhou, F. Zwitterionic dopamine sulfonate functionalized carbon quantum dots as water-based lubricant additive for friction and wear reduction. Appl. Surf. Sci. 2023, 615, 156411. [Google Scholar] [CrossRef]
  47. Liu, X.; Huang, Z.; Tang, W.; Wang, B. Remarkable Lubricating Effect of Ionic Liquid Modified Carbon Dots as a Kind of Water-Based Lubricant Additives. Nano 2017, 12, 1750108. [Google Scholar] [CrossRef]
  48. Zhang, H.; You, J.; Wang, J.; Dong, X.; Guan, R.; Cao, D. Highly luminescent carbon dots as temperature sensors and “off-on” sensing of Hg2+ and biothiols. Dye. Pigment. 2020, 173, 107950. [Google Scholar] [CrossRef]
  49. Chen, X.; Wang, X.; Fang, D. A review on C1s XPS-spectra for some kinds of carbon materials. Fullerenes, Nanotub. Carbon Nanostruct. 2020, 28, 1048–1058. [Google Scholar] [CrossRef]
  50. Kalagatur, N.K.; Karthick, K.; Allen, J.A.; Nirmal Ghosh, O.S.; Chandranayaka, S.; Gupta, V.K.; Krishna, K.; Mudili, V. Application of Activated Carbon Derived from Seed Shells of Jatropha curcas for Decontamination of Zearalenone Mycotoxin. Front. Pharmacol. 2017, 8, 760. [Google Scholar] [CrossRef]
  51. Wang, L.; Zhu, S.-J.; Wang, H.-Y.; Qu, S.-N.; Zhang, Y.-L.; Zhang, J.-H.; Chen, Q.-D.; Xu, H.-L.; Han, W.; Yang, B.; et al. Common Origin of Green Luminescence in Carbon Nanodots and Graphene Quantum Dots. ACS Nano 2014, 8, 2541–2547. [Google Scholar] [CrossRef]
  52. Ding, H.; Yu, S.-B.; Wei, J.-S.; Xiong, H.-M. Full-Color Light-Emitting Carbon Dots with a Surface-State-Controlled Luminescence Mechanism. ACS Nano 2016, 10, 484–491. [Google Scholar] [CrossRef] [PubMed]
  53. Ghosh, S.; Chizhik, A.M.; Karedla, N.; Dekaliuk, M.O.; Gregor, I.; Schuhmann, H.; Seibt, M.; Bodensiek, K.; Schaap, I.A.T.; Schulz, O.; et al. Photoluminescence of Carbon Nanodots: Dipole Emission Centers and Electron–Phonon Coupling. Nano Lett. 2014, 14, 5656–5661. [Google Scholar] [CrossRef] [PubMed]
  54. Nguyen, V.; Si, J.; Yan, L.; Hou, X. Direct demonstration of photoluminescence originated from surface functional groups in carbon nanodots. Carbon 2016, 108, 268–273. [Google Scholar] [CrossRef]
  55. Cerón, E.N.; Ortgies, D.H.; del Rosal, B.; Ren, F.; Benayas, A.; Vetrone, F.; Ma, D.; Sanz-Rodríguez, F.; Solé, J.G.; Jaque, D.; et al. Hybrid Nanostructures for High-Sensitivity Luminescence Nanothermometry in the Second Biological Window. Adv. Mater. 2015, 27, 4781–4787. [Google Scholar] [CrossRef] [PubMed]
  56. Chen, D.; Fang, G.; Chen, X.; Lei, L.; Zhong, J.; Mao, Q.; Zhou, S.; Li, J. Mn-Doped CsPbCl3 perovskite nanocrystals: Solvothermal synthesis, dual-color luminescence and improved stability. J. Mater. Chem. C 2018, 6, 8990–8998. [Google Scholar] [CrossRef]
  57. Zhou, Y.; Zhang, D.; Zeng, J.; Gan, N.; Cuan, J. A luminescent Lanthanide-free MOF nanohybrid for highly sensitive ratiometric temperature sensing in physiological range. Talanta 2018, 181, 410–415. [Google Scholar] [CrossRef]
  58. da Silva, L.E.; Calado, O.L.d.L.; de Oliveira Silva, S.F.; da Silva, K.R.M.; Henrique Almeida, J.; de Oliveira Silva, M.; Viana, R.d.S.; de Souza Ferro, J.N.; de Almeida Xavier, J.; Barbosa, C.D.A.E.S. Lemon-derived carbon dots as antioxidant and light emitter in fluorescent films applied to nanothermometry. J. Colloid Interface Sci. 2023, 651, 678–685. [Google Scholar] [CrossRef] [PubMed]
  59. Monteiro, J.H.S.K.; Sigoli, F.A.; de Bettencourt-Dias, A. A water-soluble TbIII complex as a temperature-sensitive luminescent probe. Can. J. Chem. 2018, 96, 859–864. [Google Scholar] [CrossRef]
  60. Ananias, D.; Brites, C.D.S.; Carlos, L.D.; Rocha, J. Cryogenic Nanothermometer Based on the MIL-103(Tb,Eu) Metal–Organic Framework. Eur. J. Inorg. Chem. 2016, 2016, 1967–1971. [Google Scholar] [CrossRef]
  61. Zhang, Y.; Liu, J.; Zhang, H.; He, Q.; Liang, X.; Xiang, W. Ultra-stable Tb3+: CsPbI3 nanocrystal glasses for wide-range high-sensitivity optical temperature sensing. J. Eur. Ceram. Soc. 2020, 40, 6023–6030. [Google Scholar] [CrossRef]
Scheme 1. Schematic of the synthesis of carbon quantum dots.
Lubricants 12 00088 sch001
Figure 1. (a) Photoluminescence image of the carbon quantum dot solution; (b) Fluorescence image of the carbon quantum dot powder; (c) Typical transmission electron microscopy (TEM) image of the synthesized carbon quantum dots; (d) Particle size distribution of carbon quantum dots.
Lubricants 12 00088 g001
Figure 2. (a) Photoluminescence spectra and the UV–visible spectroscopy of the carbon quantum dot solution; (b) The X-ray photoelectron spectroscopy (XPS) spectrum of the carbon quantum dots.
Lubricants 12 00088 g002
Figure 3. (a) Fluorescence of carbon quantum dot/PVA film under UV excitation; (b) The photoluminescence spectra and UV–vis spectra of the carbon quantum dot/PVA film.
Lubricants 12 00088 g003
Figure 4. (a) Fluorescence spectra of carbon quantum dots/PVA film probe as a function of temperature and (b) their mappings; (c) Temperature-dependent curve based on fluorescence intensity; (d) Temperature-dependent curve based on fluorescence intensity ratio.
Lubricants 12 00088 g004
Figure 5. The prepared carbon quantum dots–liquid paraffin dispersion system.
Lubricants 12 00088 g005
Figure 6. (a) Fluorescence spectra of carbon quantum dots in liquid paraffin at different temperatures; (b) Temperature-dependent curve based on fluorescence intensity.
Lubricants 12 00088 g006
Table 1. Temperature-dependent properties of carbon quantum dot/PVA film probe.
Measurement MethodEquationR2Temperature Range [°C]Maximum Relative Sensitivity SR-max [% K−1]
PL Intensity y = 66102 × e ( x / 46.1865 ) + 10294 0.991520–1301.74
Intensity ratio y = 0.54155 × e ( x / 17.1437 ) + 0.7009 0.99620–901.39
Table 2. Temperature-dependent properties of carbon quantum dots in in liquid paraffin system.
Measurement MethodEquationR2Temperature Range [°C]Maximum Relative Sensitivity SR-max [% K−1]
PL Intensity y = 24005 × e ( x / 39.7653 ) 273 0.990220–902.84
Table 3. Relevant optical parameters of optical temperature measurement materials.
MaterialTemperature RangeMaximum Relative Sensitivity SR-max [% K−1]Ref
PbS/CdS/ZnS QDs10−60 °C2.5[55]
CsPbI3: Mn2+25–60 °C1.4[56]
Rh101@UiO-6725–45 °C1.19[57]
Lemon-derived Carbon QDs25–60 °C2.69[58]
[Tb(dipicCbz)3]3−5–70 °C0.39[59]
Tb0.95Eu0.05(btb)10–320 K2.85[60]
Tb3+: CsPbI380–480 K1.78[61]
Carbon QDs20–90 °C2.84this work
Disclaimer/Publisher’s Note: The statements, opinions and data contained in all publications are solely those of the individual author(s) and contributor(s) and not of MDPI and/or the editor(s). MDPI and/or the editor(s) disclaim responsibility for any injury to people or property resulting from any ideas, methods, instructions or products referred to in the content.

