Optimization of Sustainable Production Processes in C45 Steel Machining Using a Confocal Chromatic Sensor


1
Department of Industrial Engineering and Informatics, Faculty of Manufacturing Technologies, Technical University of Košice, Bayerova 1, 08001 Prešov, Slovakia
2
Department of Biomedical Engineering and Measurement, Faculty of Mechanical Engineering Technical University of Košice, Letná 9, 04200 Košice, Slovakia
3
Department of Automotive and Manufacturing Technologies, Faculty of Manufacturing Technologies, Technical University of Košice, Štúrova 31, 08001 Prešov, Slovakia
*
Author to whom correspondence should be addressed.
Lubricants 2024, 12(3), 99; https://doi.org/10.3390/lubricants12030099
Submission received: 13 January 2024
/
Revised: 5 March 2024
/
Accepted: 14 March 2024
/
Published: 16 March 2024
(This article belongs to the Special Issue Mechanical Tribology and Surface Technology)
Abstract
:Metal machining production faces a myriad of demands encompassing ecology, automation, product control, and cost reduction. Within this framework, an exploration into employing a direct inspection of the machined area within the work zone of a given machine through a confocal chromatic sensor was undertaken. In the turning process, parameters including cutting speed (A), feed (B), depth of cut (C), workpiece length from clamping (D), and cutting edge radius (E) were designated as input variables. Roundness deviation (Rd) and tool face wear (KM) parameters were identified as output factors for assessing process performance. The experimental phase adhered to the Taguchi Orthogonal Array L27. Confirmatory tests revealed that optimizing process parameters according to the Taguchi method could enhance the turning performance of C45 steel. ANOVA results underscored the significant impact of cutting speed (A), feed (B), depth of cut (C), and workpiece length from clamping (D) on turning performance concerning Rd and KM. Furthermore, initial regression models were formulated to forecast roundness variation and tool face wear. The proposed parameters were found to not only influence the machined surface but also affect confocal sensor measurements. Consequently, we advocate for the adoption of these optimal cutting conditions in product production to bolster turning performance when machining C45 steel.
1. Introduction
Laser scanning technology has been well established for several years, with its efficacy in product inspection demonstrated across various research endeavors. While the utilization of scanners in inspecting machined surfaces within the working zone of machines post process completion offers numerous benefits, it also presents limitations [1]. Sustainable and efficient manufacturing serves as the impetus behind the burgeoning Zero Defect Manufacturing (ZDM) trend. ZDM aims not only to detect defective products but also to predict and prevent defects [2]. As concluded by the authors of [3], dry machining proves optimal for clean manufacturing. Laser technology currently finds critical applications in the non-contact inspection of product parameters, with researchers exploring the integration of laser sensors in measuring parameters within the cutting zone during machining. According to [4], CCHS represents a high-precision measuring device, with data analysis stability outweighing mere accuracy. Reflectivity of the beam from the object to be measured and light source fluctuation pose challenges, as noted by [5]. Other researchers [6] delved into the utilization of CCHS in three-dimensional product surface measurement. Meanwhile, in their exploration of product measurement, Ref. [7] employed a high-speed 3D camera system. The authors of [8] investigated the application of CCHS for assessing the surface properties of product layers in [9]. However, the machining process itself can be significantly influenced by factors such as surface topography and microhardness [10,11,12], surface roughness [10,11,13], residual stress [14,15,16], and microstructure [17]. In their analysis in [18], the authors provide insights and solutions for machining hardened steels with regard to surface integrity. Specifically, they explore the impact of hardening on surface roughness, cylindricity, and roundness after turning C45 steel. Research findings [19] indicate a detrimental effect of hardening on surface quality. Furthermore, surface treatment via machining methods can alter parameters associated with surface integrity [20]. The investigation and analysis of the surface quality parameters of milled surfaces were conducted using a confocal laser scanning microscope by the authors of [21]. Mechanical hardening is described in detail in studies by the authors of [22,23]. Additionally, other researchers have endeavored to identify the influence of material properties on the surface hardening of materials such as Al 6061-T6 [24] and Hadfield steels [25,26,27,28,29,30,31]. The issue of surface hardening in AISI 304 steel is addressed in [32]. The authors of [33] examine samples of surface roughness after turning. The influence of surface texture on surface roughness is investigated in [34], while Ref. [35] analyzes the impact of the tip radius of measuring contacts on surface roughness parameters. Additionally, Ref. [36] asserts results that surface roughness significantly affects machined product performance. Investigations into factors affecting the machined surface of metallic materials are carried out by the authors of [37,38]. The authors of [39] observe the deterioration of machined surfaces in Ti6Al4V alloys due to thermal softening using the HSM method. Similarly, results from [40] indicate a trade-off relationship between significant process factors’ influence on material removal rate and surface roughness. Regarding EDM technology, Ref. [41] investigates the performance of machined stainless steel. Changes in machined surfaces affect quality parameter attainment in milling due to thermal deformation [42], in turning due to stress and strain prediction [43], in turning due to cutting tool modification [44] and cutting tool damage [45], and in milling Ti alloys due to elastic deformation [46]. The investigation of the effect of tool wear on surface roughness increase is addressed by [47], while [48] demonstrates through research that low-temperature cooling can enhance machined surface quality while minimizing tool wear. The determination of tool wear in the machining of duplex stainless steel is presented in papers [49,50], with the issue of tool wear and surface topography also discussed in [51,52,53,54,55]. Additional researchers [56] conduct experimental investigations into factors affecting stainless steel turning and assess wear parameters on the cutting tool’s face and back surface. Additionally, surface integrity evaluation parameters encompass shape and position deviations. In this regard, the application of CCHS proves highly beneficial, particularly considering its comprehensive data and swift data acquisition. Nonetheless, the challenge remains in efficiently processing acquired data and accurately interpreting them for theoretical and practical needs, as per the research results in [1]. The authors of [57] utilize CCHS to measure roundness deviation and demonstrate, through experimental results, the method’s steady and reliable evaluation of roundness deviations. Several authors have explored different machinability characteristics of C45 steel through varying heat treatment methods [58], employing coated tools in milling [59], utilizing process media [60], implementing ultrasonics in turning [61], and modifying cutting inserts [62]. Furthermore, the authors of [63,64,65] investigate various parameters of machined surfaces using non-contact methods.
Our primary research focus revolves around controlling factors affecting machined surfaces through non-contact methods, utilizing laser sensors directly within a machine’s working zone. We aim to optimize input parameters and analyze adverse phenomena on machined surfaces.
In this investigation, we explored the feasibility of directly measuring roundness deviation within a machine’s working zone using a confocal chromatic sensor during the turning of C45 steel. In the turning process, parameters such as cutting speed (A), feed (B), depth of cut (C), workpiece length from clamping (D), and cutting edge radius (E) were chosen as input parameters. Roundness deviation and tool face wear (KM) parameters, following ISO 3685 standards, were proposed as output factors for evaluating process performance, measured using a microscope. To measure roundness deviation, we developed new-generation CCHS sensors (CL P070 from Keyence—Mechelen, Belguim). To analyze the effect of cutting insert face wear on roundness deviation under defined cutting conditions using Taguchi Design in Minitab 21.4.2 software, we designed the Orthogonal Array L27 experiment matrix. All research tests were conducted under dry turning conditions, with a key assumption being that machine tool vibrations align with prescribed values certified for specific machine tools (as outlined in Table 1). Currently, several companies in our region manufacture various C45 steel products for the engineering industry.

Table 1.
Experimental data.
| M—Machine | Leadwell T5 CNC machine tool equipped with a FANUC Oi-MATE-TC control system. Maximum radial sweep certified by the manufacturer is 0.030 mm, and maximum axial sweep is 0.020 mm. |
| T—Cutting insert Tool holder Working insert tool geometry | Cutting tool clamped with a tool holder marked SSDCN1212 F09 from Dormer Pramet Ltd., Šumperk, Czech Republic. Cutting insert SCMT 09T308E-FM, T9325 made of sintered carbide, with specific geometry parameters (nose angle εr = 90°, main cutting edge setting angle κr = 45°, clearance angle major α = 7°, and nose radius rε= 0.8 mm). |
| W—Workpiece material and dimensions | Workpiece material C45 steel (1.0503). Test specimen dimensions: diameter (d) = 40 mm, length (L) = 150 mm. The chemical composition of the steel is given in Table 2 and was verified prior to the start of the research. Table 3 shows the main properties of the tested steel. |
| F—Fixture for tool and object | Specimen: A round bar clamped in a chuck. Tool: Clamped in the cutter head. |
| Machining conditions | Dry machining. Machining method—turning. |
| Mobile Measuring System (MMS) is composed of CCHS sensor | PLC Siemens-1511C, Communication module KEYENCE-CL3000, Amplifier KEYENCE-CLP070N, Communication module KEYENCE-DL-PN1 and sensor CL P070 by Keyence. Measurement range: 75 mm to 130 mm. Reference distance: 100 mm. Resolutions: ±1 mm. Spot diameter: 600 mm. Linearity: ±0.15% of F.S. (IL-100: ±20 mm). Repeatability: 4 mm. For the research purposes, a bespoke holder tailored for the CCHS sensor was meticulously designed and subsequently fabricated utilizing advanced 3D printing technology. |
2. Description, Implementation, and Experimental Results
2.1. Experimental Design
In this section, we outline the experimental setup and methodology employed in our study. We proposed to utilize the experimental data within the framework of the technology system (TS) depicted in Figure 1, along with the mobile measurement system (MMS) previously introduced by the authors [1], illustrated in Figure 2 and described in detail in Table 1. The experimental parameters considered in this study are enumerated in Table 1. The range for each controlled parameter was determined based on prior experiments and information obtained from manufacturers of C45 steel products, as summarized in Table 2. Additionally, adhering to recommendations from the tool manufacturer, a specific cutting insert was selected for machining C45 steel, as detailed in Table 1.
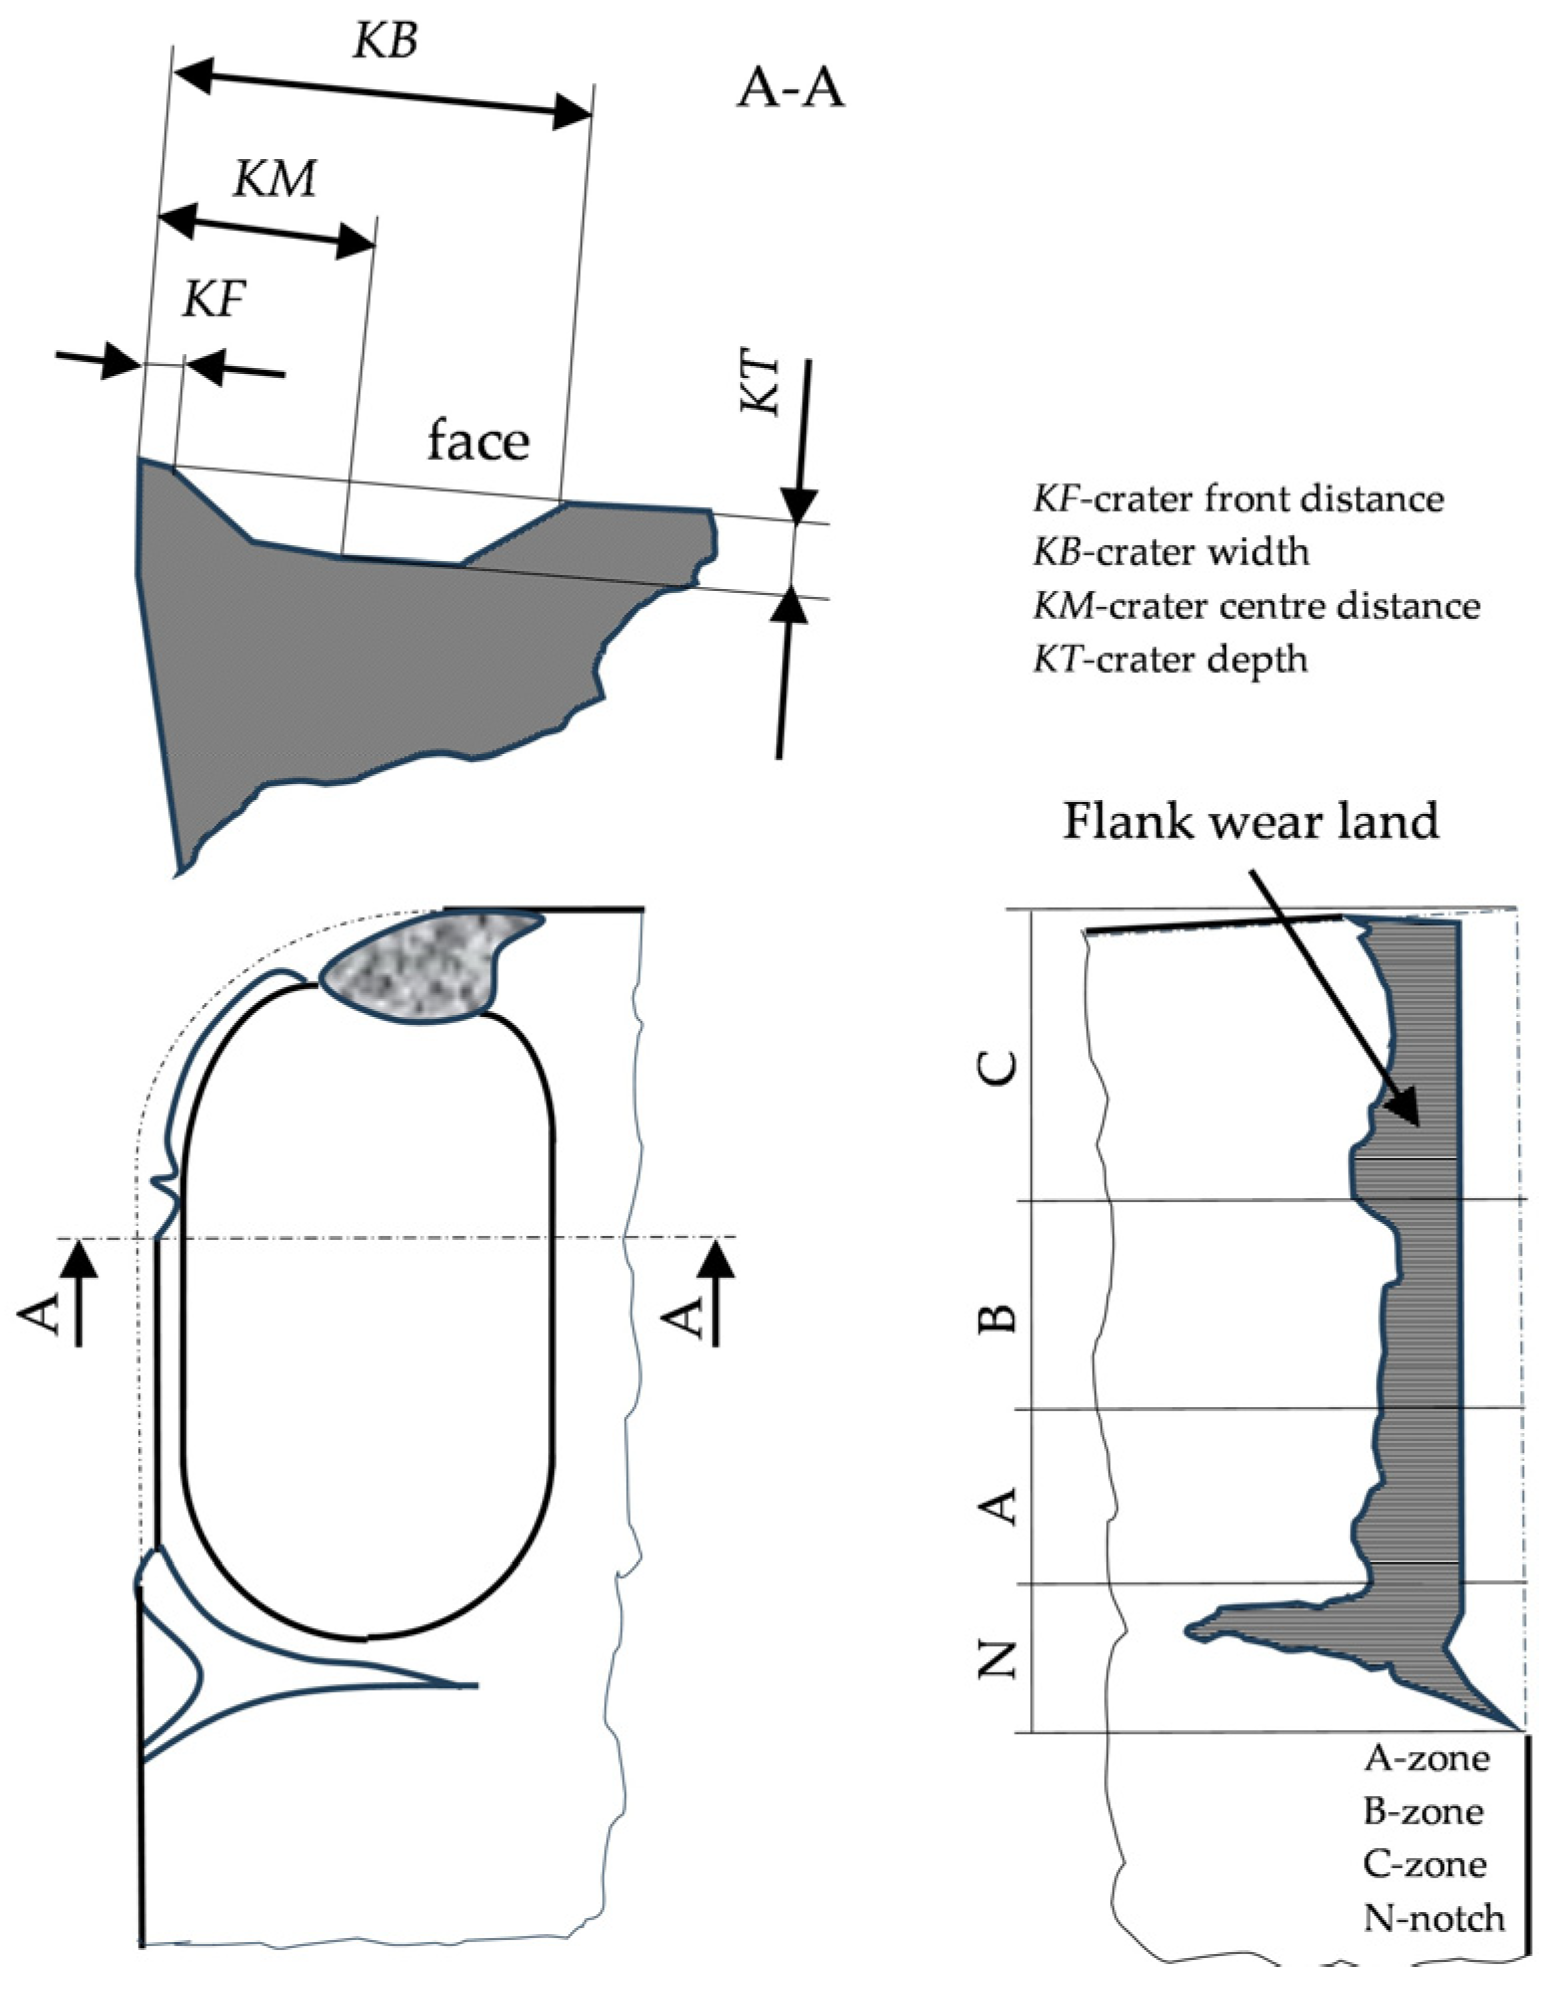
The cutting process conditions are outlined in Table 4, with cutting speed designated as parameter A, feed as parameter B, depth of cut as parameter C, workpiece length from clamping as parameter D, and cutting edge radius as parameter E. The assessment of the output factor, specifically the roundness deviation of the circular bar, was conducted using CCHS. The experimental matrix and resultant output factors, represented as average values from the measurements, are detailed in Table 5 and Table 6. Roundness deviation of the machined surface was directly measured and analyzed within the working zone of the machine tool utilizing CCHS. This measurement was performed post-machining on a 240 mm length workpiece without unclamping, employing MMS (mobile measurement system) for CCHS. Rd was assessed at three points along the machined length (60 mm) of the circular bar, specifically at distances of 5.0 mm, 30.0 mm, and 55.0 mm from the clamping point (refer to Figure 3). KM face wear was gauged following a 240 mm traversal, adhering to ISO 3685 [66] standards, as illustrated in Figure 4. Rd values for specific local locations were determined as averages. Resultant average values of Rd and cutting insert face wear were derived from 12 replicate measurements, with the exclusion of minimum and maximum outliers. Each experiment employed a cutting insert with a new cutting edge. Literature reviews [55,56] highlight the importance of surface integrity research incorporating new technologies, necessitating further investigation. The exploration of roundness deviation control using CCHS on a reference specimen of C45 steel serves as a foundation for other materials. A systematic examination of process parameter effects on the machined surface underscores the potential to influence output factors towards desired values by parameter adjustments. Enhanced machined surface integrity is achievable through the optimization of input parameters such as cutting speed, feed, depth of cut, workpiece clamping length, and cutting edge radius. The alignment of cutting conditions with CCHS requirements is imperative. These adjustable input parameters during turning render them conducive to automation and intelligent processing.
2.2. Optimization of Turning Input Parameters Using Taguchi Method with Ratio Analysis
An experiment matrix employing Orthogonal Array L27 was designed following Taguchi principles using Minitab 21.4.2 software—Coventry, United Kingdom. Five parameters were set at three levels each, resulting in a total of 27 runs.
Researchers [67,68] have noted that Taguchi’s methodology [69] considers factors such as resource wastage, warranty costs, customer complaints, and repair expenses, all of which influence product quality. Taguchi’s approach is particularly beneficial for optimizing products or processes while simultaneously reducing experimentation time and research costs. Orthogonal arrays, coupled with signal-to-noise ratio analysis, are employed to gauge output parameter quality. Various models incorporating Taguchi methods have been applied in research, with parameters’ significance determined through ANOVA. These models include L8OA [70,71,72], L18OA [73], L27OA [74,75], L27OA with ANOVA [58,76,77], L18OA with ANOVA [78], L9OA with ANOVA [37,60,72], and the L8OA model combined with Response Surface Methodology (RSM) and ANOVA [38,79,80]. Additionally, the GRA (Grey Relation Analysis) method with ANOVA has been proposed [74,81,82,83,84], along with other variations by different researchers [85].
Genichi Taguchi [69] introduced a loss function in data processing to represent the disparity between experimental and target values, subsequently converted into signal-to-noise () ratios. The ratio, defined as the ratio of mean value to standard deviation, categorizes into “Larger is Better,” “Medium is Better,” and “Smaller is Better,” based on response requirements. This study focuses on the output factors of roundness deviation and wear on the cutting insert’s face surface, both adopting the “Smaller is Better” methodology, aligned with practical and C45 steel machinability requirements. Equation (1) was utilized for ratio calculation, with the results tabulated in Table 6. Taguchi analysis, mean ratio graphs, and ANOVA were conducted using Minitab 21.4.2 software.
The impact severity of each input parameter on output factors is depicted in Figure 6 and Figure 7. Cutting conditions and cutting insert geometry influence chip evacuation from the cutting zone [37,43,44,78]. Continuous cutting processes yield regular machined surfaces devoid of Plastically Deformed Material (PDM) elements. Conversely, discontinuous cutting may produce irregular chips with PDM, adversely affecting surface quality and increasing roundness deviation (see Figure 6). Increasing Rd may signify elevated cutting insert wear, notably on the KM face, further exacerbating surface quality due to augmented PDM elements.
The ratio (Equation (1)) serves as a quantitative tool, with Rd proposed as a qualitative machined surface factor, ideally minimized. The ratio is as follows:
where
represents parameter values (unit dB)
and
are the observed output values for the test condition repeated n times.
Figure 6a and Figure 7a depict the relationship between mean values of roundness deviation and the face wear of the cutting insert. Cutting speed emerges as the most influential parameter impacting roundness deviation (as evident in Figure 6a), similarly affecting tool wear at the cutting insert face (as observed in Figure 7a). Increased feed, depth of cut, and distance of the workpiece from the fixture also exert a negative effect on Rd. With rising roundness deviation, surface quality diminishes, accompanied by increased tool wear. Elevated cutting speed mitigates roundness deviation but heightens the risk of tool damage and wear. Optimal regions lie between cutting speed levels 1 and 2, as illustrated in Figure 6b and Figure 7b. Figure 6a and Figure 7a highlight the optimal levels of individual parameters to achieve the desired output factors in terms of roundness deviation (Rd) and the face wear of the cutting inserts, respectively. These optimal levels correspond to A3B1C1D1E3 for Rd and A1B1C1D1E3 for the face wear of the cutting inserts, as corroborated by the ratio values in Figure 6b and Figure 7b.
Lower roundness deviation (Rd) values can enhance the operational reliability of the studied functional surface of a product. This improvement stems from increased friction between the tool and workpiece, resulting in higher cutting temperatures with increasing cutting speed. Elevated temperatures in the machining zone cause thermal softening of the workpiece, reducing smeared materials on the machined surface and consequently minimizing roundness deviation [77,85,86]. As depicted in Figure 8, Rd values escalate with rising cutting speed due to heightened tool resistance against the workpiece, particularly as feed increases, leading to the formation of more built-up edges (BUE) on the tool face. This phenomenon induces surface deterioration and consequently elevates Rd values. Moreover, an increasing trend in Rd values accompanies higher depths of cut. These trends align with the existing literature findings on machining difficult-to-machine materials [87]. Precision in determining the local measurement spot on the specimen significantly influences Rd.
Simultaneously, this measurement process provides insights into the cutting tool’s compliance with the specified technical requirements of the product and identifies any undesirable wear. Variations in Rd magnitude may indicate changes in the cutting tool. Consequently, this measurement method facilitates the rapid and accurate identification of local spots on the functional surface and enables the monitoring of changes in cutting tool wear rate. However, the mean values of output factors are contingent on specific conditions, necessitating test repetition for other materials.
The ratio response factor table for Rd is presented in Table 7. Figure 7b illustrates the ratio chart generated using Minitab software. A higher ratio indicates minimal deviation between the desired and measured outputs. As depicted in Figure 9b, the highest average ratio values obtained for Rd are 270 m/min, 0.1 mm/rev., 0.1 mm, 5.0 mm, and 0.008 mm. Therefore, the assumed optimal process parameters for achieving low Rd using Taguchi’s method are 270 m/min, 0.1 mm/rev., 0.1 mm, 5.0 mm, and 0.008 mm. These optimal combinations are highlighted in bold in Table 6 for clarity, with the corresponding levels identified. This predicted optimal combination is represented as A3B1C1D1E3 for roundness deviation.
Table 8 presents the generated ratio factor table for face wear on the cutting insert. Mean values of the ratio for face wear are depicted in Figure 7b. Based on the data from Figure 7b and Table 8, the estimated optimal process parameters for minimizing face wear are 90 m/min, 0.1 mm/rev., 0.1 mm, 5.0 mm, 0.008 mm. This predicted optimal combination is represented as A1B1C1D1E3 for face wear on the cutting insert.
The ratio response table for Rd is also presented in Table 7, while Figure 6b illustrates the mean ratio chart obtained through Minitab software—Coventry, United Kingdom. Again, a higher ratio signifies minimal deviation between the desired and measured outputs. As indicated in Figure 6b, the highest average ratio values obtained for Rd are A3 = 270 m/min, B1 = 0.1 mm/rev., C1 = 0.1 mm, D1 = 5.0 mm, and E3 = 0.008 mm. Thus, the assumed optimal process parameters for achieving low roundness deviation using Taguchi’s method are represented as A3B1C1D1E3, with the corresponding level values highlighted in bold in Table 7. Table 8 presents the obtained ratio response table for face wear on the cutting insert. The average ratio values for the face wear of the cutting insert are illustrated in Figure 7b. From Figure 7a, it can be observed that the estimated optimum process parameters for achieving low wear on the cutting insert face are A1 = 90 m/min, B1 = 0.1 mm/rev., C1 = 0.1 mm, D1 = 5.0 mm, and E3 = 0.008 mm.
Confirmation Test
To validate the optimality of the predicted optimal settings according to Taguchi, confirmatory tests must be conducted. The predicted signal-to-noise () ratio (e) was utilized to estimate and verify the response under the predicted optimal cutting settings, calculated using Equation (2).
where
is the total mean ratio;
is the mean ratio at the optimal level;
p is the number of input process parameters.
Confirmatory tests are essential to validate the predicted optimal cutting settings.
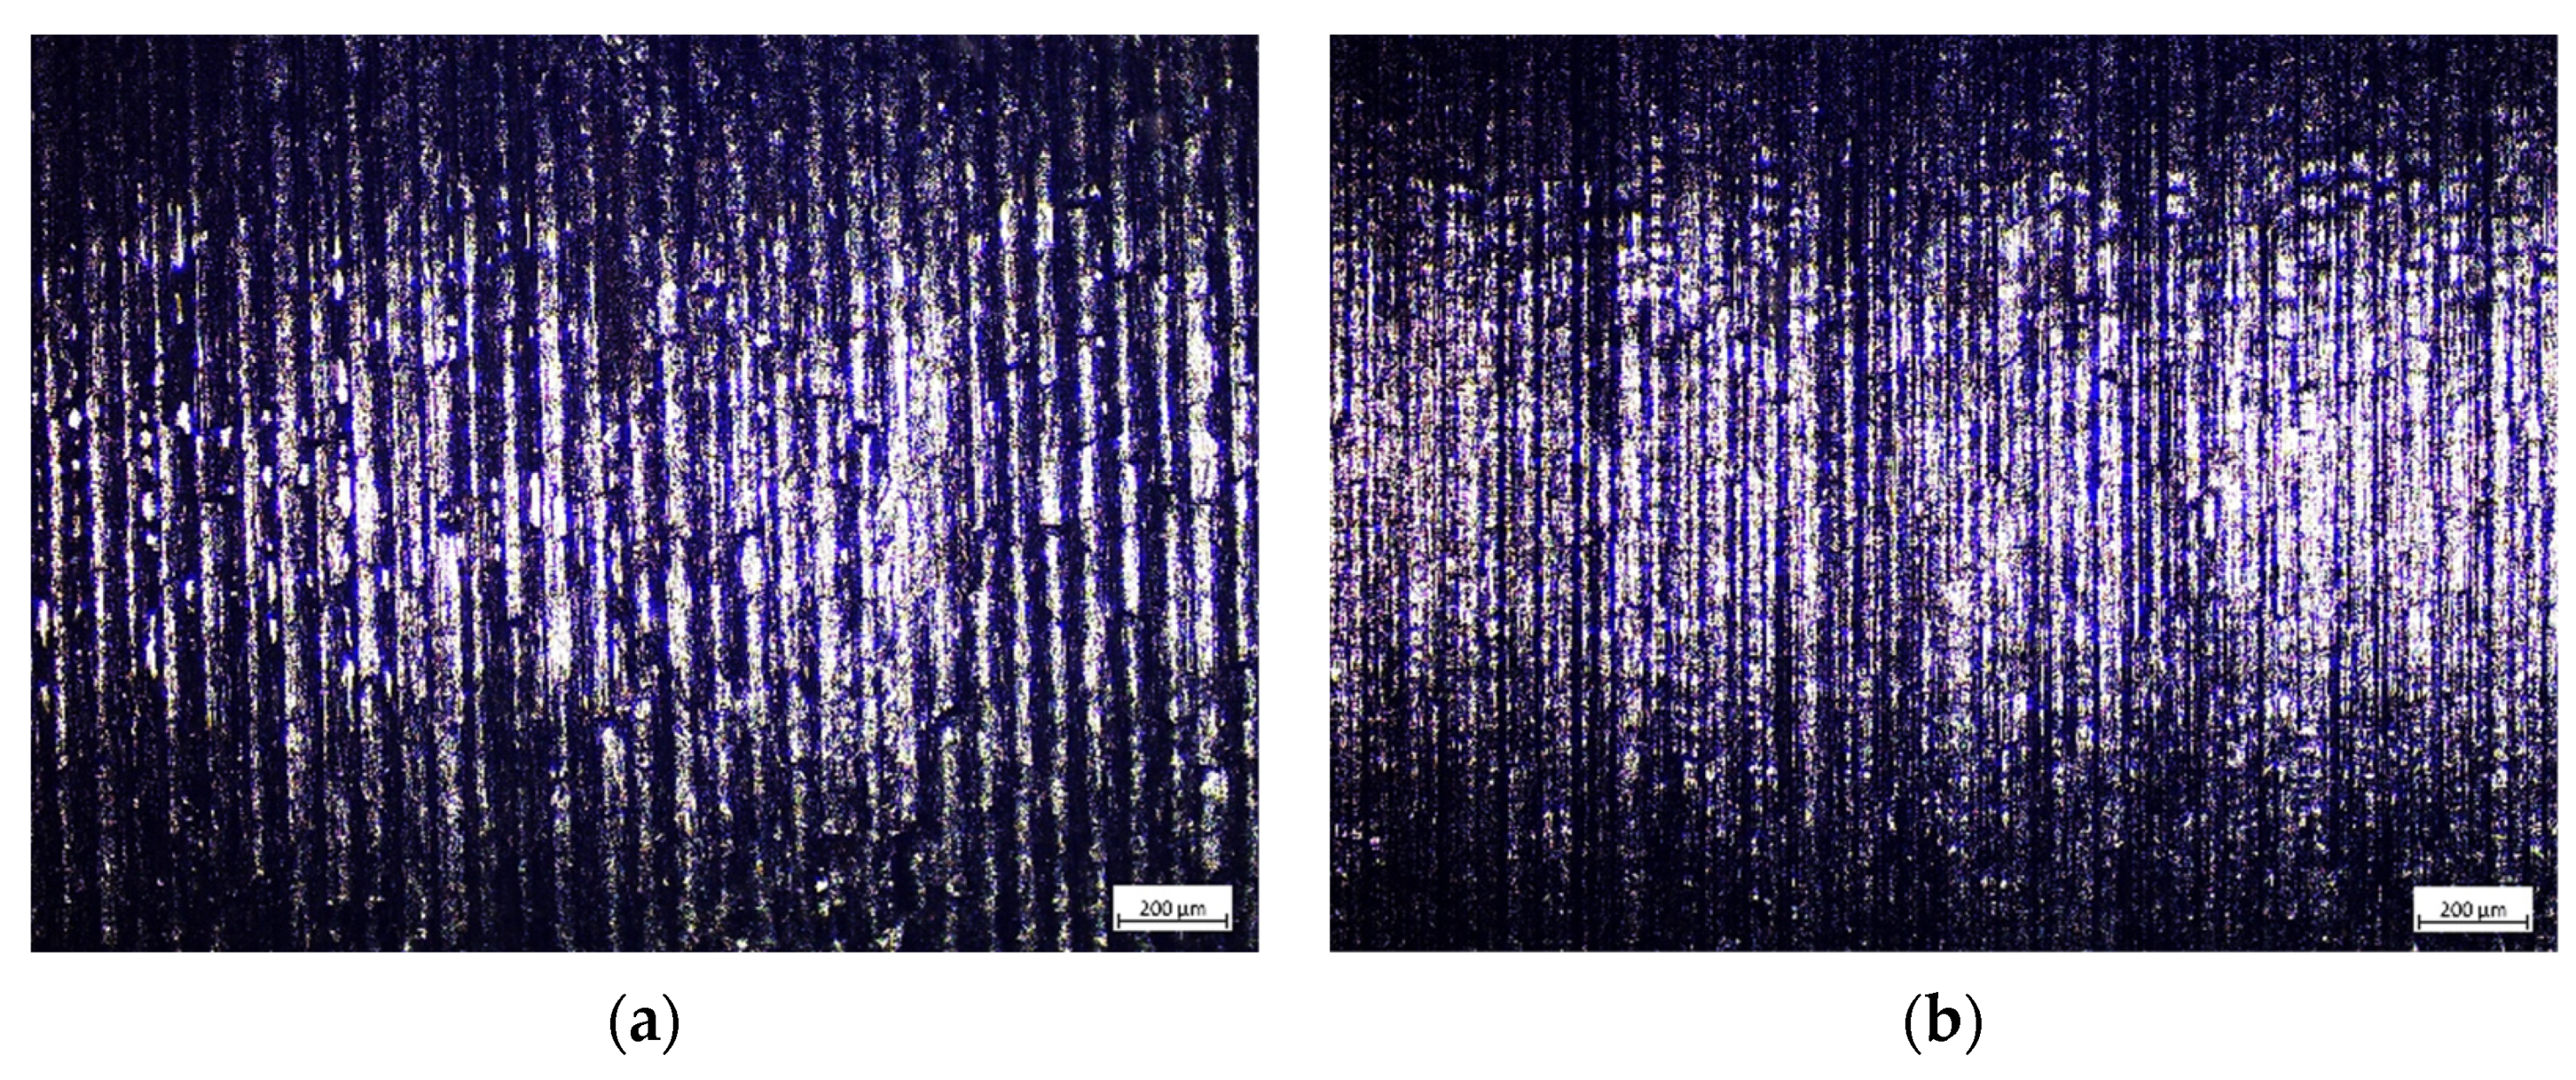
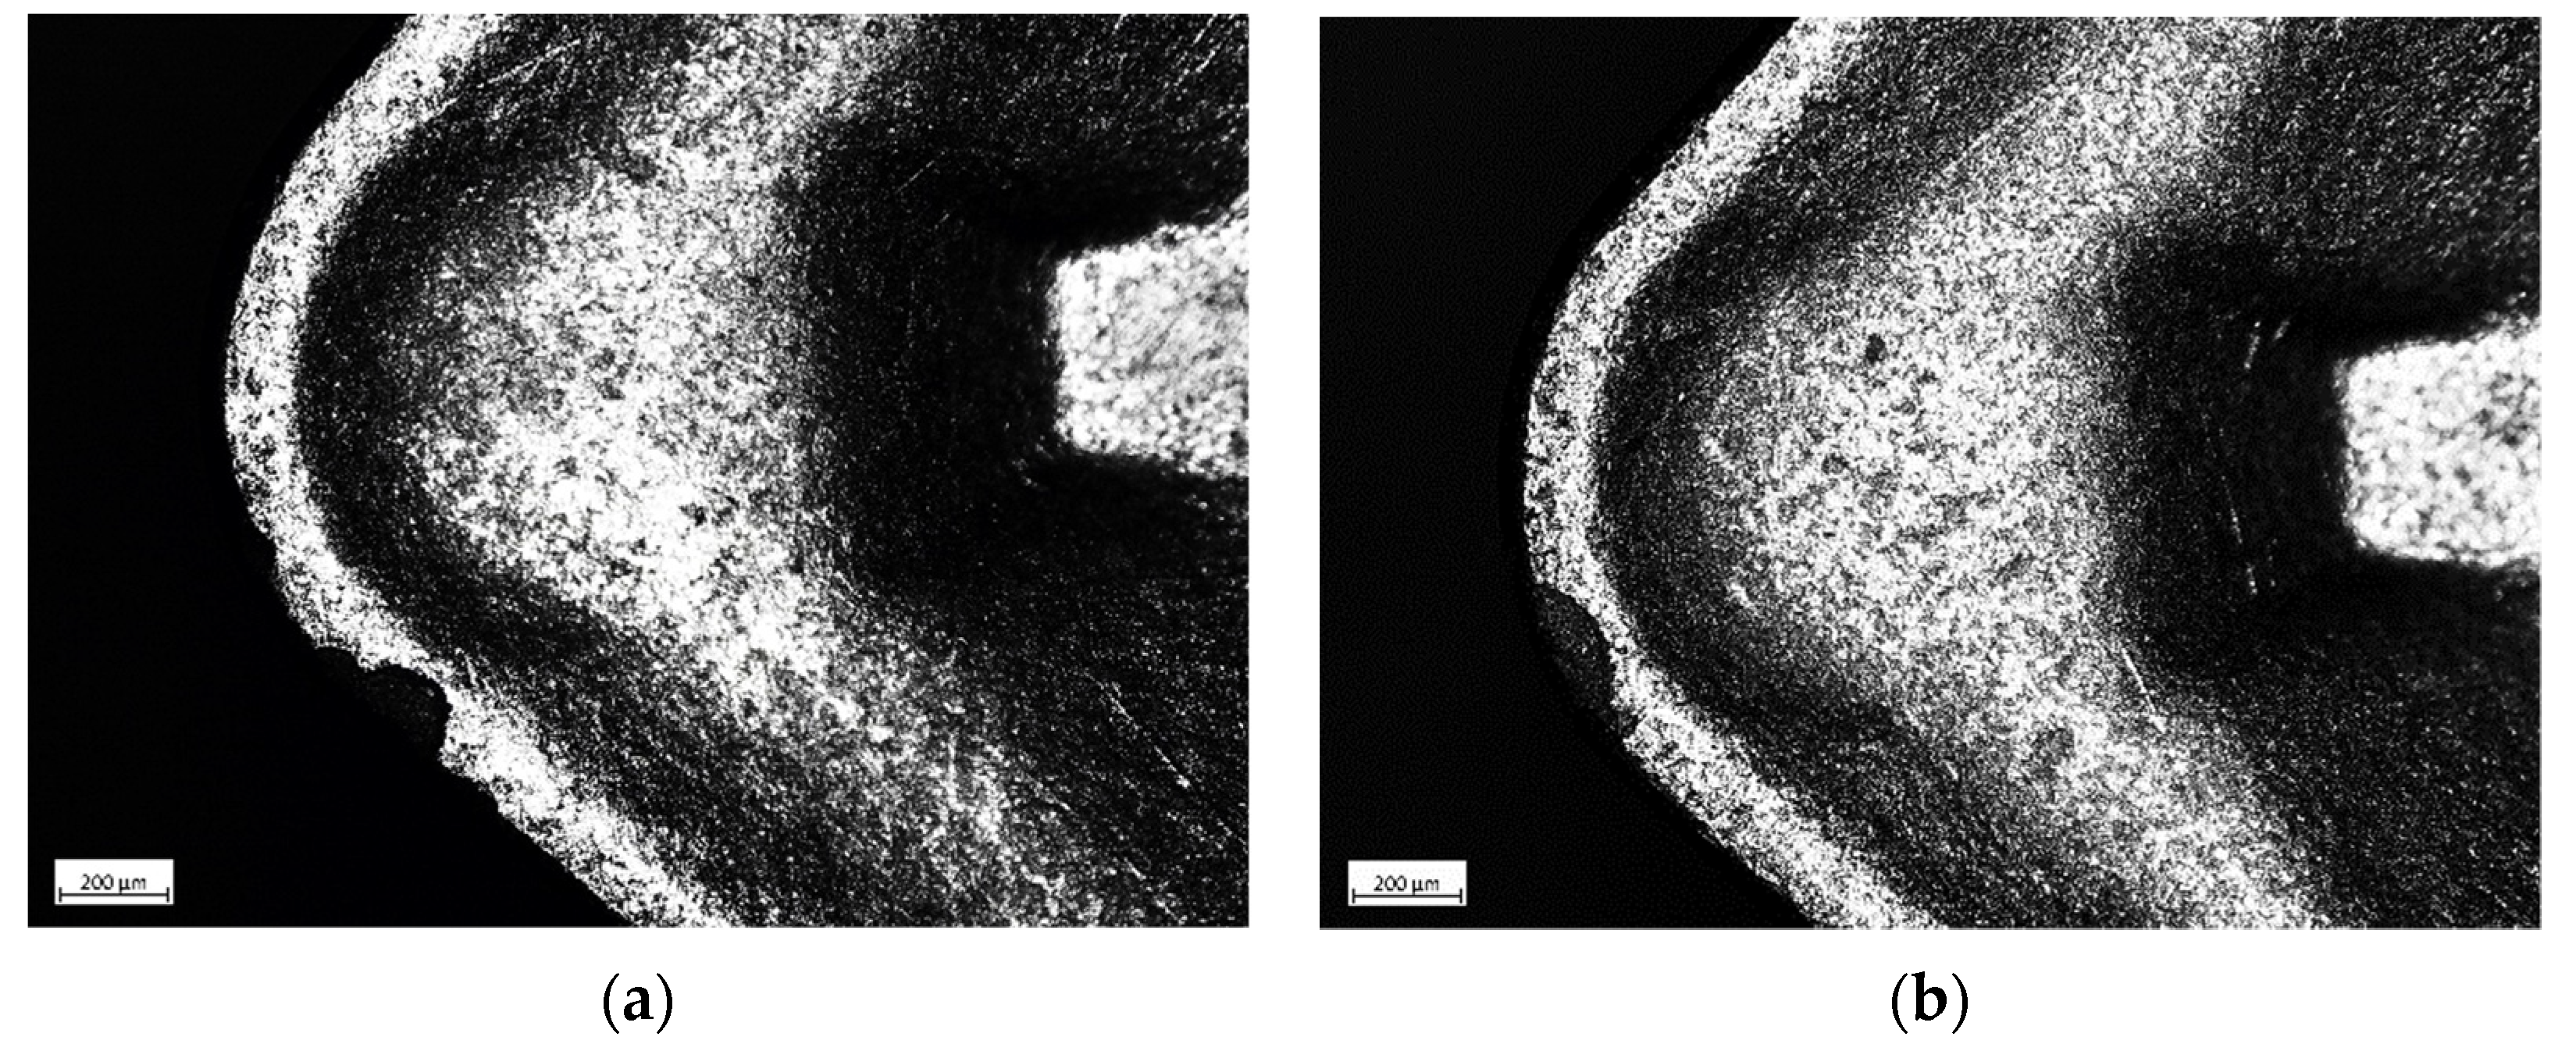
After predicting the optimum cutting settings, confirmation experiments were conducted, and the results are presented in Table 9 and Table 10 for Rd and KM, respectively. The predicted optimal cutting settings for both Rd and KM led to improved process performance outcomes. Table 9 and Table 10 demonstrate that the ratios under the predicted and optimal cutting settings closely align for both Rd and KM. The enhancement in the ratio at the optimal cutting settings for Rd and KM amounted to 4.95 dB and 2.01 dB, respectively, compared to the original parameter settings shown in Table 9 and Table 10. From the confirmation experiments, it was observed that the predicted optimal cutting settings by Taguchi yielded favorable results compared to the initial parameter settings, particularly with regard to the reduction in Rd and KM. Specifically, the reductions in Rd and KM compared to the initial parameter settings were found to be 15.29% and 12.5%, respectively. Hence, the predicted optimal cutting settings by Taguchi are deemed to be the optimum conditions for achieving low Rd and low KM in machining C45 steel under the given conditions. From Figure 8 and Figure 9, it is evident that the optimal cutting settings as per Taguchi led to low Rd and KM values. Figure 10 demonstrates the reduced impact of removed material and fewer smeared particles on the machined surface under the optimum cutting conditions according to Taguchi compared to the initial setup. Similarly, less face wear (smaller pitting) was observed at the optimal cutting setting by Taguchi compared to the initial setting.
3. Optimization of Input Parameters by ANOVA, Regression Analysis, and Modeling
ANOVA identifies the process parameters most influencing performance characteristics. Table 11 presents the analysis of variance for the output factor of roundness deviation (Rd). It indicates that cutting speed, feed, depth of cut, and workpiece length from clamping significantly affect roundness deviation (with p-values less than 0.05 at a 95% confidence interval). However, the significance of the cutting edge radius of the curvature parameter regarding roundness deviation was not demonstrated. Rd is notably influenced by depth of cut (37.51%), workpiece length from clamping (30.29%), cutting speed (10.50%), and feed (6.21%), while cutting edge radius exhibits the least significance (2.85%). Table 12 presents the analysis of variance for the output factor of cutting insert face wear. It indicates that cutting speed, feed, depth of cut, and length of workpiece from clamping significantly affect KM cutting insert face wear (with p-values less than 0.05 at a 95% confidence level). However, the significance of the cutting edge radius parameter for KM was not demonstrated. KM is significantly influenced by feed (25.43%), cutting speed (23.27%), depth of cut (21.83%), and workpiece length from clamping (16.89%), with cutting edge radius exhibiting the least effect (3.56%).
In this study, Minitab 21.4.2 software was utilized to develop predictive mathematical models for the dependent variable of roundness deviation, considering cutting speed (A), feed (B), depth of cut (C), workpiece length from clamping (D), and cutting edge radius (E), through linear regression analysis. No transformation was applied to each response. The prediction equation obtained from the regression analysis for Rd (3) and KM (4) is provided below.
Regression analysis model for roundness deviation versus A, B, C, D, and E with regression Equation (3):
Rd = 0.00764 − 0.00586 A + 0.00453 B + 0.01137 C + 0.01003 D − 0.00317 E,
For Rd, an R2 value of 83.81% was calculated.
Regression analysis model for face wear versus A, B, C, D, and E with regression Equation (4):
KM = 0.0961 + 0.01167 A + 0.01078 B + 0.01089 C + 0.00850.D − 0.00406 E,
For KM, an R2 value of 81.64% was calculated.
The fitness of the developed models was validated using the coefficient of determination R2 [88,89]. The coefficient of determination ranges from zero to one, where a value closer to one indicates a strong agreement between the dependent and independent variables. For instance, an R2 value of 95% signifies that 95% of the variability in new observations has been estimated. In this study, the regression models for Rd and KM achieved high R2 values, namely 83.81% and 81.64%, respectively.
A graph of the residuals was employed to assess the significance of coefficients in the predicted model. The linearity of the residual graph indicates that the residual errors in the model are normally distributed, and the coefficients are significant. Figure 10 displays the residuals for roundness deviation. It illustrates that the residuals closely align with a straight line, indicating the significance of the coefficients in the developed model. Similarly, Figure 11 depicts the residuals for tool face wear. The residuals also fall near a straight line, suggesting the significance of the coefficients in the developed model for KM. To validate the developed models, confirmatory tests were conducted, and the results are presented in Table 11. The test results, taken randomly from the orthogonal array L27, demonstrate good agreement between the predicted and experimental results across a range of parameters. The response was found to be favorable for machining different difficult-to-cut materials [74,75,81].
Confirmation Test
Confirmation tests of the control factors were conducted following the Taguchi method and regression equations for both the optimum level and randomly selected levels. Table 13 provides a comparison between the test results and the predicted values obtained using the Taguchi method and regression equations (Equations (3) and (4)). The proximity of the predicted values to the experimental values indicates a high level of agreement between them. To ensure reliable statistics in the analyses, the error values must be kept below 20% [88]. An examination of the results in terms of percentages reveals that the errors for the output factors of Rd and KM did not exceed the 20% threshold. Consequently, the results of the confirmatory test demonstrate a successful optimization process. According to the authors of [89,90], similar results were obtained during material machining processes, affirming the effectiveness of the Taguchi optimization method in enhancing the machining performance of C45 steel under the specified process parameters.
This validation process was conducted under both practical conditions, addressing the need for controlling the factors of machined surfaces, and under laboratory conditions, ensuring the reliability and robustness of the optimization procedure.
4. Conclusions
The discrepancies between the theoretical and actual values of the machined surface factors stem from the deformation process occurring ahead of the cutting edge of the tool. This process is primarily influenced by the properties of the material being machined and the prevailing working conditions [91,92,93]. The authors of [1,94] presented both positive and negative experiences regarding the use of CCHS in measuring roundness deviation on machined surfaces after turning C45 steel. Furthermore, this research uncovered several concomitant phenomena, including the following:
- Plastic deformation occurred at localized sites on the machined surface, as illustrated in Figure 12. These observations were captured using scanning electron microscopy with a JEOL JSM 7000F autoemission nozzle—JEOL Ltd., Hertfordshire, England, United Kingdom. The results of this analysis warrant further investigation.
The research presented in this paper offers several key conclusions based on the analysis conducted. The confocal chromatic sensor (CCHS) proved to be suitable for measuring the roundness deviation of machined surfaces, particularly on C45 steel. The data collected using CCHS can serve as a reference for further research, potentially extending to the comparison of other types of steels. Roundness deviation values were effectively measured and evaluated within the range of 0.002 to 0.08 mm using CCHS, aligning with the specified limit of 0.1 mm. The observed wear value on the cutting insert face reached up to 0.3 mm under the research conditions.
Key research findings include the following:
- The Taguchi method identified an optimal combination of cutting conditions (A = 270 m/min, B = 0.1 mm/rev., C = 0.1 mm, D = 5.0 mm, and E = 0.008 mm) resulting in a 53% reduction in roundness deviation.
- Similarly, Taguchi’s method determined optimal cutting conditions (A = 90 m/min, B = 0.1 mm/rev., C = 0.1 mm, D = 5.0 mm, and E = 0.008 mm), leading to a 31% reduction in the face wear of the cutting insert.
- ANOVA analysis revealed that depth of cut had the most significant influence on roundness deviation (37.51%), followed by workpiece distance from clamping, cutting speed, and feed. Feed was found to be the most significant factor influencing tool cutting insert wear, with a percentage influence of 25.43%.
These results underscore the effectiveness of the determined optimal cutting settings in reducing roundness deviation and cutting insert face wear during the machining of C45 steel. The findings also highlight the potential of these optimal settings to positively impact roundness deviation.
Practical implications relevant for customers include the following:
- Fine-tuning conditions and controlling factors for laser sensor use on machined surfaces of C45 steel.
- The identification of negative phenomena on machined surfaces after turning C45 steel.
- The consideration of non-contact laser sensor methods for measuring the roundness deviation of machined surfaces in order to implement optimal cutting settings and enhance the quality of turning C45 steel within the specified range.
Author Contributions
Conceptualization, J.J., K.P., and P.M.; methodology, J.J. and P.M.; calculation, J.J.; validation, J.J. and K.P.; formal analysis, M.K.; investigation, J.J.; resources, P.M.; data curation, M.K; writing—original draft preparation, J.J.; writing—review and editing, M.K.; visualization, M.K.; supervision, P.M. and J.J.; project administration, M.K.; funding acquisition, J.J. All authors have read and agreed to the published version of the manuscript.
Funding
This work was supported by the project AMTRteam (Advanced Manufacturing Technology Research Team), awarded by the Ministry of Education, Science, Research and Sport of the Slovak Republic.
Data Availability Statement
Data are contained within the article.
Acknowledgments
As the authors of this article, we would like to thank the support of the project AMTRteam (Advanced Manufacturing Technology Research Team) awarded by the Ministry of Education, Science, Research and Sport of the Slovak Republic.
Conflicts of Interest
The authors declare no conflicts of interest.
References
- Jurko, J.; Miškiv-Pavlík, M.; Hladký, V.; Lazorík, P.; Michalík, P.; Petruška, I. Measurement of the Machined Surface Diameter by a Laser Triangulation Sensor and Optimalization of Turning Conditions Based on the Diameter Deviation and Tool Wear by GRA and ANOVA. Appl. Sci. 2022, 12, 5266. [Google Scholar] [CrossRef]
- Powell, D.; Magnanini, M.C.; Colledani, M.; Myklebust, O. Advancing Zero Defect Manufacturing: A State-of-the-Art Perspective and Future Research Directions. Comput. Ind. 2022, 136, 103596. [Google Scholar] [CrossRef]
- Bagaber, S.A.; Yusoff, A.R. Multi-objective optimization of cutting parameters to minimize power consumption in dry turning of stainless steel 316. J. Clean. Prod. 2017, 157, 30–46. [Google Scholar] [CrossRef]
- Chen, C.; Leach, R.; Wang, J.; Liu, X.; Jiang, X.; Lu, W. Locally adaptive thresholding centroid localization in confocal microscopy. Opt. Lett. 2021, 46, 1616–1619. [Google Scholar] [CrossRef] [PubMed]
- Wang, Z.; Wang, T.; Yang, Y.; Yang, Y.; Mi, X.; Wang, J. Precise Two-Dimensional Tilt Measurement Sensor with Double-Cylindrical Mirror Structure and Modified Mean-Shift Algorithm for a Confocal Microscopy System. Sensors 2022, 22, 6794. [Google Scholar] [CrossRef]
- Saeidi Aminabadi, S.; Jafari-Tabrizi, A.; Gruber, D.P.; Berger-Weber, G.; Friesenbichler, W. An Automatic, Contactless, High-Precision, High-Speed Measurement System to Provide In-Line, As-Molded Three-Dimensional Measurements of a Curved-Shape Injection-Molded Part. Technologies 2022, 10, 95. [Google Scholar] [CrossRef]
- Liu, Y.; Zhang, Q.; Liu, Y.; Yu, X.; Hou, Y.; Chen, W. High-Speed 3D Shape Measurement Using a Rotary Mechanical Projector. Opt. Express 2021, 29, 7885–7903. [Google Scholar] [CrossRef]
- Yang, Y.; Dong, Z.; Meng, Y.; Shao, C. Data-Driven Intelligent 3D Surface Measurement in Smart Manufacturing: Review and Outlook. Machines 2021, 9, 13. [Google Scholar] [CrossRef]
- Ruan, Y.; Xue, M.; Teng, J.; Wu, Y.; Shi, M. Horizontal Oxidation Diffusion Behavior of MEMS-Based Tungsten-Rhenium Thin Film Thermocouples. Materials 2022, 15, 5071. [Google Scholar] [CrossRef]
- Andrea, L.M.; James, W.M.; Zhirong, L.; Alistair, S.; Jose, A.R.; Dragos, A.A.; Mark, C.H.; Adam, T.C. Surface integrity in metal machining-Part II: Functional performance. Int. J. Mach. Tools Manuf. 2021, 164, 103718. [Google Scholar] [CrossRef]
- Liu, G.; Huang, C.; Zhao, B.; Wang, W.; Sun, S. Effect of Machined Surface Integrity on Fatigue Performance of Metal Workpiece: A Review. Chin. J. Mech. Eng. 2021, 34, 118. [Google Scholar] [CrossRef]
- Felho, C.; Varga, G. Theoretical Roughness Modeling of Hard Turned Surfaces Considering Tool Wear. Machines 2022, 10, 188. [Google Scholar] [CrossRef]
- Kovacı, H.; Bozkurt, Y.; Yetim, A.; Aslan, M.; Çelik, A. The effect of surface plastic deformation produced by shot peening on corrosion behavior of a low-alloy steel. Surf. Coat. Technol. 2019, 360, 78–86. [Google Scholar] [CrossRef]
- Böhm, M.; Kowalski, M.; Niesłony, A. Influence of the Elastoplastic Strain on Fatigue Durability Determined with the Use of the Spectral Method. Materials 2020, 13, 423. [Google Scholar] [CrossRef]
- Xiong, Y.; Yue, Y.; He, T.; Lu, Y.; Ren, F.; Cao, W. Effect of Rolling Temperature on Microstructure Evolution and Mechanical Properties of AISI316LN Austenitic Stainless Steel. Materials 2018, 11, 1557. [Google Scholar] [CrossRef] [PubMed]
- Kiran, B.; Nagaraju, D. Simulation and experimental study on the effect of surface residual stresses in dry orthogonal micro turning sample. Aust. J. Mech. Eng. 2022, 21, 1396–1408. [Google Scholar] [CrossRef]
- Yu, C.; Shiue, R.-K.; Chen, C.; Tsay, L.-W. Effect of Low-Temperature Sensitization on Hydrogen Embrittlement of 301 Stainless Steel. Metals 2017, 7, 58. [Google Scholar] [CrossRef]
- Wisley, F.S.; Julius, S.; Leonardo, R.R.D.S.; Álisson, R.M.; Jawahir, I.S. A review of surface integrity in machining of hardened steels. J. Manuf. Process 2020, 58, 136–162. [Google Scholar] [CrossRef]
- Moravčíková, J.; Moravčík, R.; Palcut, M. Effect of Heat Treatment on the Resulting Dimensional Characteristics of the C45 Carbon Steel after Turning. Metals 2022, 12, 1899. [Google Scholar] [CrossRef]
- Chung, Y.-H.; Chen, T.-C.; Lee, H.-B.; Tsay, L.-W. Effect of Micro-Shot Peening on the Fatigue Performance of AISI 304 Stainless Steel. Metals 2021, 11, 1408. [Google Scholar] [CrossRef]
- Groeb, M.; Hagelüken, L.; Groeb, J.; Ensinger, W. Experimental Analysis of Ductile Cutting Regime in Face Milling of Sintered Silicon Carbide. Materials 2022, 15, 2409. [Google Scholar] [CrossRef]
- Peng, C.-H.; Hou, P.-Y.; Lin, W.-S.; Shen, P.-K.; Huang, H.-H.; Yeh, J.-W.; Yen, H.-W.; Huang, C.-Y.; Tsai, C.-W. Investigation of Microstructure and Wear Properties of Precipitates-Strengthened Cu-Ni-Si-Fe Alloy. Materials 2023, 16, 1193. [Google Scholar] [CrossRef]
- Zhu, P.; Zhao, Y.; Agarwal, S.; Henry, J.; Zinkle, S.J. Toward accurate evaluation of bulk hardness from nanoindentation testing at low indent depths. Mater. Des. 2022, 213, 110317. [Google Scholar] [CrossRef]
- Clayton, J.D.; Casem, D.T.; Lloyd, J.T.; Retzlaff, E.H. Toward Material Property Extraction from Dynamic Spherical Indentation Experiments on Hardening Polycrystalline Metals. Metals 2023, 13, 276. [Google Scholar] [CrossRef]
- Luo, Q.; Kitchen, M. Microhardness, Indentation Size Effect and Real Hardness of Plastically Deformed Austenitic Hadfield Steel. Materials 2023, 16, 1117. [Google Scholar] [CrossRef]
- Nix, W.D.; Gao, H. Indentation size effects in crystalline materials: A law for strain gradient plasticity. J. Mech. Phys. Solids 1998, 46, 411–425. [Google Scholar] [CrossRef]
- Sarangi, S.S.; Lavakumar, A.; Singh, P.K.; Katiyar, P.K.; Ray, R.K. Indentation size effect in steels with different carbon contents and microstructures. Mater. Sci. Technol. 2023, 39, 338–346. [Google Scholar] [CrossRef]
- Song, P.; Yabuuchi, K.; Spaetig, P. Insights into hardening, plastically deformed zone and geometrically necessary dislocations of two ion-irradiated FeCrAl (Zr)-ODS ferritic steels: A combined experimental and simulation study. Acta Mater. 2022, 234, 117991. [Google Scholar] [CrossRef]
- Broitman, E. Indentation Hardness Measurements at Macro-, Micro-, and Nanoscale: A Critical Overview. Tribol. Lett. 2017, 65, 23. [Google Scholar] [CrossRef]
- Balos, S.; Rajnovic, D.; Sidjanin, L.; Cekic, O.E.; Moraca, S.; Trivkovic, M.; Dedic, M. Vickers hardness indentation size effect in selective laser melted MSI maraging steel. J. Mech. Eng. Sci. 2021, 235, 1724–1730. [Google Scholar] [CrossRef]
- Das, A.; Altstadt, E.; Kaden, C.; Kapoor, G.; Akhmadaliev, S.; Bergner, F. Nanoindentation Response of Ion-Irradiated Fe, Fe-Cr Alloys and Ferritic-Martensitic Steel Eurofer 97: The Effect of Ion Energy. Front. Mater. 2022, 8, 811851. [Google Scholar] [CrossRef]
- Amanov, A.; Karimbaev, R.; Maleki, E.; Okan, U.; Young-Sik, P.; Amanov, T. Effect of combined shot peening and ultrasonic nanocrystal surface modification processes on the fatigue performance of AISI 304. Surf. Coat. Technol. 2019, 358, 695–705. [Google Scholar] [CrossRef]
- Baleani, A.; Paone, N.; Gladines, J.; Vanlanduit, S. Design and Metrological Analysis of a Backlit Vision System for Surface Roughness Measurements of Turned Parts. Sensors 2023, 23, 1584. [Google Scholar] [CrossRef]
- Jayabarathi, S.B.; Ratnam, M.M. Comparison of Correlation between 3D Surface Roughness and Laser Speckle Pattern for Experimental Setup Using He-Ne as Laser Source and Laser Pointer as Laser Source. Sensors 2022, 22, 6003. [Google Scholar] [CrossRef] [PubMed]
- dos Santos Motta Neto, W.; Leal, J.E.S.; Arantes, L.J.; Arencibia, R.V. The Effect of Stylus Tip Radius on Ra, Rq, Rp, Rv, and Rt Parameters in Turned and Milled Samples. Int. J. Adv. Manuf. Technol. 2018, 99, 1979–1992. [Google Scholar] [CrossRef]
- Maruda, R.W.; Krolczyk, G.M.; Wojciechowski, S.; Powalka, B.; Klos, S.; Szczotkarz, N.; Matuszak, M.; Khanna, N. Evaluation of turning with different cooling-lubricating techniques in terms of surface integrity and tribologic properties. Tribol. Int. 2020, 148, 106334. [Google Scholar] [CrossRef]
- Yıldırım, Ç.V.; Kıvak, T.; Sarıkaya, M.; Şirin, Ş. Evaluation of tool wear, surface roughness/topography and chip morphology when machining of Ni-based alloy 625 under MQL, cryogenic cooling and CryoMQL. J. Mater. Res. Technol. 2020, 9, 2079–2092. [Google Scholar] [CrossRef]
- Leksycki, K.; Feldshtein, E.; Lisowicz, J.; Chudy, R.; Mrugalski, R. Cutting Forces and Chip Shaping When Finish Turning of 17-4 PH Stainless Steel under Dry, Wet, and MQL Machining Conditions. Metals 2020, 10, 1187. [Google Scholar] [CrossRef]
- Yadav, S.P.; Pawade, R.S. Manufacturing Methods Induced Property Variations in Ti6Al4V Using High-Speed Machining and Additive Manufacturing (AM). Metals 2023, 13, 287. [Google Scholar] [CrossRef]
- Naeim, N.; AbouEleaz, M.A.; Elkaseer, A. Experimental Investigation of Surface Roughness and Material Removal Rate in Wire EDM of Stainless Steel 304. Materials 2023, 16, 1022. [Google Scholar] [CrossRef]
- Abu Qudeiri, J.E.; Saleh, A.; Ziout, A.; Mourad, A.-H.I.; Abidi, M.H.; Elkaseer, A. Advanced Electric Discharge Machining of Stainless Steels: Assessment of the State of the Art, Gaps and Future Prospect. Materials 2019, 12, 907. [Google Scholar] [CrossRef] [PubMed]
- Nguyen, D.-K.; Huang, H.-C.; Feng, T.-C. Prediction of Thermal Deformation and Real-Time Error Compensation of a CNC Milling Machine in Cutting Processes. Machines 2023, 11, 248. [Google Scholar] [CrossRef]
- Chodór, J.; Kukiełka, L.; Chomka, G.; Bohdal, Ł.; Patyk, R.; Kowalik, M.; Trzepieciński, T.; Radchenko, A.M. Using the FEM Method in the Prediction of Stress and Deformation in the Processing Zone of an Elastic/Visco-Plastic Material during Diamond Sliding Burnishing. Appl. Sci. 2023, 13, 1963. [Google Scholar] [CrossRef]
- Tagiuri, Z.A.M.; Dao, T.-M.; Samuel, A.M.; Songmene, V. Numerical Prediction of the Performance of Chamfered and Sharp Cutting Tools during Orthogonal Cutting of AISI 1045 Steel. Processes 2022, 10, 2171. [Google Scholar] [CrossRef]
- Wang, R.; Yang, D.; Wang, W.; Wei, F.; Lu, Y.; Li, Y. Tool Wear in Nickel-Based Superalloy Machining: An Overview. Processes 2022, 10, 2380. [Google Scholar] [CrossRef]
- Hailong, M.; Aijun, T.; Shubo, X.; Tong, L. Finite Element Simulation of Bending Thin-Walled Parts and Optimization of Cutting Parameters. Metals 2023, 13, 115. [Google Scholar] [CrossRef]
- Dyl, T. The Designation Degree of Tool Wear after Machining of the Surface Layer of Duplex Stainless Steel. Materials 2021, 14, 6425. [Google Scholar] [CrossRef]
- Wang, W.; Wang, B.; Liu, B.; Gao, H.; Wei, Z. Machinability and chip morphology evolution of hardened stainless steel using liquid nitrogen cryogenic. Int. J. Adv. Manuf. Technol. 2022, 125, 967–987. [Google Scholar] [CrossRef]
- Królczyk, G.M.; Niesłony, P.; Legutko, S. Determination of tool life and research wear during duplex stainless steel turning. Arch. Civ. Mech. Eng. 2015, 15, 347–354. [Google Scholar] [CrossRef]
- Królczyk, G.M.; Niesłony, P.; Legutko, S.; Hloch, S.; Samardzic, I. Investigation of selected surface integrity features of duplex stainless steel after turning. Metalurgija 2015, 54, 91–94. [Google Scholar]
- Sarıkaya, M.; Gupta, M.K.; Tomaz, I.; Pimenov, D.Y.; Kuntoğlu, M.; Khanna, N.; Yıldırım, Ç.V.; Krolczyk, G.M. A state-of-the-art review on tool wear and surface integrity characteristics in machining of superalloys. CIRP J. Manuf. Sci. Technol. 2021, 35, 624–658. [Google Scholar] [CrossRef]
- Dzierwa, A.; Markopoulos, A.P. Influence of Ball-Burnishing Process on Surface Topography Parameters and Tribological Properties of Hardened Steel. Machines 2019, 7, 11. [Google Scholar] [CrossRef]
- Khanna, N.; Airao, J.; Gupta, M.K.; Song, Q.; Liu, Z.; Mia, M.; Maruda, R.; Krolczyk, G. Optimization of Power Consumption Associated with Surface Roughness in Ultrasonic Assisted Turning of Nimonic-90 Using Hybrid Particle Swarm-Simplex Method. Materials 2019, 12, 3418. [Google Scholar] [CrossRef]
- Sousa, V.F.C.; Silva, F.J.G.; Lopes, H.; Casais, R.C.B.; Baptista, A.; Pinto, G.; Alexandre, R. Wear Behavior and Machining Performance of TiAlSiN-Coated Tools Obtained by dc MS and HiPIMS: A Comparative Study. Materials 2021, 14, 5122. [Google Scholar] [CrossRef] [PubMed]
- Wojciechowski, S.; Królczyk, G.M.; Maruda, R.W. Advances in Hard–to–Cut Materials: Manufacturing, Properties, Process Mechanics and Evaluation of Surface Integrity. Materials 2020, 13, 612. [Google Scholar] [CrossRef]
- Cardoso, L.G.; Madeira, D.S.; Ricomini, T.E.P.A.; Miranda, R.A.; Brito, T.G.; Paiva, E.J. Optimization of machining parameters using response surface methodology with desirability function in turning duplex stainless steel UNS S32760. Int. J. Adv. Manuf. Technol. 2021, 117, 1633–1644. [Google Scholar] [CrossRef]
- Cao, Z.-M.; Wu, Y.; Han, J. Roundness deviation evaluation method based on statistical analysis of local least square circles, Meas. Sci. Technol. 2017, 28, 10. [Google Scholar] [CrossRef]
- Kumar, S.; Riyaz, A.M.; Marulaiah, L.; Manjunatha, L. Investigation of machinability characteristics on C45 steel alloy while turning with untreated and cryotreated M2 HSS cutting tools. ARPN J. Eng. Appl. Sci. 2019, 14, 307–317. [Google Scholar] [CrossRef]
- Sivaprakash, E.; Aswin, S.; Dhanaruban, D.; Dinesh, G.; Inbamathi, M. Machining Character Analysis of Coated and Uncoated End Mill on Heat Treated C45 Steel. Int. J. Res. Appl. Sci. Eng. Technol. 2022, 10, 2708–2713. [Google Scholar] [CrossRef]
- Usca, Ü.A. The Effect of Cellulose Nanocrystal-Based Nanofluid on Milling Performance: An Investigation of Dillimax 690T. Polymers 2023, 15, 4521. [Google Scholar] [CrossRef]
- Tuan, B.; Hai, N.; Kien, L.; Hai, N. Investigation of surface topography in ultrasonic-assisted turning of C45 carbon steel. Jpn. J. Appl. Phys. 2023, 63, 016501. [Google Scholar] [CrossRef]
- SreeramaReddy, T.V.; Sornakumar, T.; Venkatarama Reddy, M.; Venkatram, R. Machinability of C45 steel with deep cryogenic treated tungsten carbide cutting tool inserts. Int. J. Refract. Met. Hard Mater. 2009, 27, 181–185. [Google Scholar] [CrossRef]
- Huang, G.; Bai, J.; Feng, F.; Zeng, L.; Feng, P.; Li, X. A Hybrid Strategy for Profile Measurement of Micro Gear Teeth. Micromachines 2023, 14, 1729. [Google Scholar] [CrossRef]
- Lishchenko, N.; O’Donnell, G.E.; Culleton, M. Contactless Method for Measurement of Surface Roughness Based on a Chromatic Confocal Sensor. Machines 2023, 11, 836. [Google Scholar] [CrossRef]
- Cheng, F.; Fu, S.; Chen, Z. Surface Texture Measurement on Complex Geometry Using Dual-Scan Positioning Strategy. Appl. Sci. 2020, 10, 8418. [Google Scholar] [CrossRef]
- ISO 3685:1993 (E); Tool-Life Testing with Single-Point Turning Tools. International Organization for Standardization: Geneva, Switzerland, 1993.
- Belavendram, N. Quality by Design: Taguchi Techniques for Industrial Experimentation; Prentice Hall: London, UK, 1995; ISBN 9780131863620. [Google Scholar]
- Antony, J.; Kaye, M. The Taguchi Approach to Industrial Experimentation. In Experimental Quality; Springer: Boston, MA, USA, 2000. [Google Scholar] [CrossRef]
- Taguchi, G. System of Experimental Design: Engineering Methods to Optimize Quality and Minimize Costs; UNIPUB/Kraus International Publications: White Plains, NY, USA, 1987; p. 1189. ISBN 9780941243001. [Google Scholar]
- Sap, E.; Usca, Ü.A.; Gupta, M.K.; Kuntoğlu, M.; Sarıkaya, M.; Pimenov, D.Y.; Mia, M. Parametric Optimization for Improving the Machining Process of Cu/Mo-SiCP Composites Produced by Powder Metallurgy. Materials 2021, 14, 1921. [Google Scholar] [CrossRef] [PubMed]
- Vora, J.; Chaudhari, R.; Patel, C.; Pimenov, D.Y.; Patel, V.K.; Giasin, K.; Sharma, S. Experimental Investigations and Pareto Optimization of Fiber Laser Cutting Process of Ti6Al4V. Metals 2021, 11, 1461. [Google Scholar] [CrossRef]
- Selvam, M.D.; Senthil, P. Investigation on the effect of turning operation on surface roughness of hardened C45 carbon steel. Aust. J. Mech. Eng. 2016, 14, 131–137. [Google Scholar] [CrossRef]
- Singh, M.; Garg, H.K.; Maharana, S.; Yadav, A.; Singh, R.; Maharana, P.; Nguyen, T.V.T.; Yadav, S.; Loganathan, M.K. An Experimental Investigation on the Material Removal Rate and Surface Roughness of a Hybrid Aluminum Metal Matrix Composite (Al6061/SiC/Gr). Metals 2021, 11, 1449. [Google Scholar] [CrossRef]
- Prakash, K.S.; Gopal, P.; Karthik, S. Multi-objective optimization using Taguchi based grey relational analysis in turning of Rock dust reinforced Aluminum MMC. Measurement 2020, 157, 107664. [Google Scholar] [CrossRef]
- Akhtar, M.N.; Sathish, T.; Mohanavel, V.; Afzal, A.; Arul, K.; Ravichandran, M.; Rahim, I.A.; Alhady, S.S.N.; Bakar, E.A.; Saleh, B. Optimization of Process Parameters in CNC Turning of Aluminum 7075 Alloy Using L27 Array-Based Taguchi Method. Materials 2021, 14, 4470. [Google Scholar] [CrossRef] [PubMed]
- Krolczyk, J.B.; Maruda, R.W.; Krolczyk, G.M.; Wojciechowski, S.; Gupta, M.K.; Korkmaz, M.E. Investigations on surface induced tribological characteristics in MQCL assisted machining of duplex stainless steel. J. Mater. Res. Technol. 2022, 18, 2754–2769. [Google Scholar] [CrossRef]
- Fratila, D.; Caizar, C. Application of Taguchi method to selection of optimal lubrication and cutting conditions in face milling of AlMg3. J. Clean. Prod. 2011, 19, 640–645. [Google Scholar] [CrossRef]
- Lubis, S.M.; Darmawan’Adianto, S. Effect of cutting speed on temperature cutting tools and surface roughness of AISI 4340 steel. IOP Conf. Ser. Mater. Sci. Eng. 2019, 508, 012053. [Google Scholar] [CrossRef]
- Gunjal, S.U.; Patil, N.G. Experimental Investigations into Turning of Hardened AISI 4340 Steel using Vegetable based Cutting Fluids under Minimum Quantity Lubrication. Procedia Manuf. 2018, 20, 18–23. [Google Scholar] [CrossRef]
- Fnides, M. Optimization and Mathematical Modelling of Surface Roughness Criteria and Material Removal Rate when Milling C45 Steel using RSM and Desirability Approach. J. Mech. Eng. 2023, 20, 173–197. [Google Scholar] [CrossRef]
- Jamil, M.; Khan, A.M.; He, N.; Li, L.; Zhao, W.; Sarfraz, S. Multi-response optimisation of machining aluminium-6061 under eco-friendly electrostatic minimum quantity lubrication environment. Int. J. Mach. Mach. Mater. 2019, 21, 459–479. [Google Scholar] [CrossRef]
- Mia, M.; Gupta, M.K.; Lozano, J.A.; Carou, D.; Pimenov, D.Y.; Królczyk, G.; Khan, A.M.; Dhar, N.R. Multi-objective optimization and life cycle assessment of eco-friendly cryogenic N2 assisted turning of Ti-6Al-4V. J. Clean. Prod. 2019, 210, 121–133. [Google Scholar] [CrossRef]
- Pu, Y.; Zhao, Y.; Meng, J.; Zhao, G.; Zhang, H.; Liu, Q. Process Parameters Optimization Using Taguchi-Based Grey Relational Analysis in Laser-Assisted Machining of Si3N4. Materials 2021, 14, 529. [Google Scholar] [CrossRef]
- Mufarrih, A.; Istiqlaliyah, H.; Ilha, M. Optimization of Roundness, MRR and Surface Roughness on Turning Process using Taguchi-GRA. J. Phys. Conf. Ser. 2019, 1179, 012099. [Google Scholar] [CrossRef]
- Jin, L.; Wang, G.; Deng, J.; Li, Z.; Zhu, M.; Wang, R. A New Model for Cleaning Small Cuttings in Extended-Reach Drilling Based on Dimensional Analysis. Appl. Sci. 2023, 13, 12118. [Google Scholar] [CrossRef]
- Tian, P.; He, L.; Zhou, T.; Du, F.; Zou, Z.; Zhou, X. Experimental characterization of the performance of MQL-assisted turning of solution heat-treated and aged Inconel 718 alloy. Int. J. Adv. Manuf. Technol. 2023, 125, 3839–3851. [Google Scholar] [CrossRef]
- Thakur, A.; Gangopadhyay, S. State-of-the-art in surface integrity in machining of nickel-based super alloys. Int. J. Mach. Tool. Manuf. 2016, 100, 25–54. [Google Scholar] [CrossRef]
- Kıvak, T. Optimization of surface roughness and flank wear using the Taguchi method in milling of Hadfield steel with PVD and CVD coated inserts. Measurement 2014, 50, 19–28. [Google Scholar] [CrossRef]
- Debnath, S.; Reddy, M.M.; Yi, Q.S. Influence of cutting fluid conditions and cutting parameters on surface roughness and tool wear in turning process using Taguchi method. Measurement 2016, 78, 111–119. [Google Scholar] [CrossRef]
- Maruda, R.W.; Krolczyk, G.M.; Feldshtein, E.; Nieslony, P.; Tyliszczak, B.; Pusavec, F. Tool wear characterizations in finish turning of AISI 1045 carbon steel for MQCL conditions. Wear 2017, 372–373, 54–67. [Google Scholar] [CrossRef]
- Klocke, F. Fertigungsverfahren 1; Springer Science and Business Media LLC: Dordrecht, The Netherlands, 2018; ISBN 978-3-662-54206-4. [Google Scholar] [CrossRef]
- Hou, Z.; Yuan, Y.; Chen, Y.; Jiang, E.; Wang, H.; Zhang, X. A Review of the Settling Law of Drill Cuttings in Drilling Fluids. Processes 2023, 11, 3165. [Google Scholar] [CrossRef]
- Yin, W.-H.; Yue, H.; Wang, X. A Study on the Depositional Law of Road Cutting in the Tengger Desert. Appl. Sci. 2023, 13, 11967. [Google Scholar] [CrossRef]
- Jurko, J.; Miškiv-Pavlík, M.; Husár, J.; Michalik, P. Turned Surface Monitoring Using a Confocal Sensor and the Tool Wear Process Optimization. Processes 2022, 10, 2599. [Google Scholar] [CrossRef]
Figure 1.
Technological System (TS). The TS comprises the machine (M), tool (T), workpiece (W), and fixture (F).
Figure 1.
Technological System (TS). The TS comprises the machine (M), tool (T), workpiece (W), and fixture (F).

Figure 2.
Mobile Measuring System (MMS).
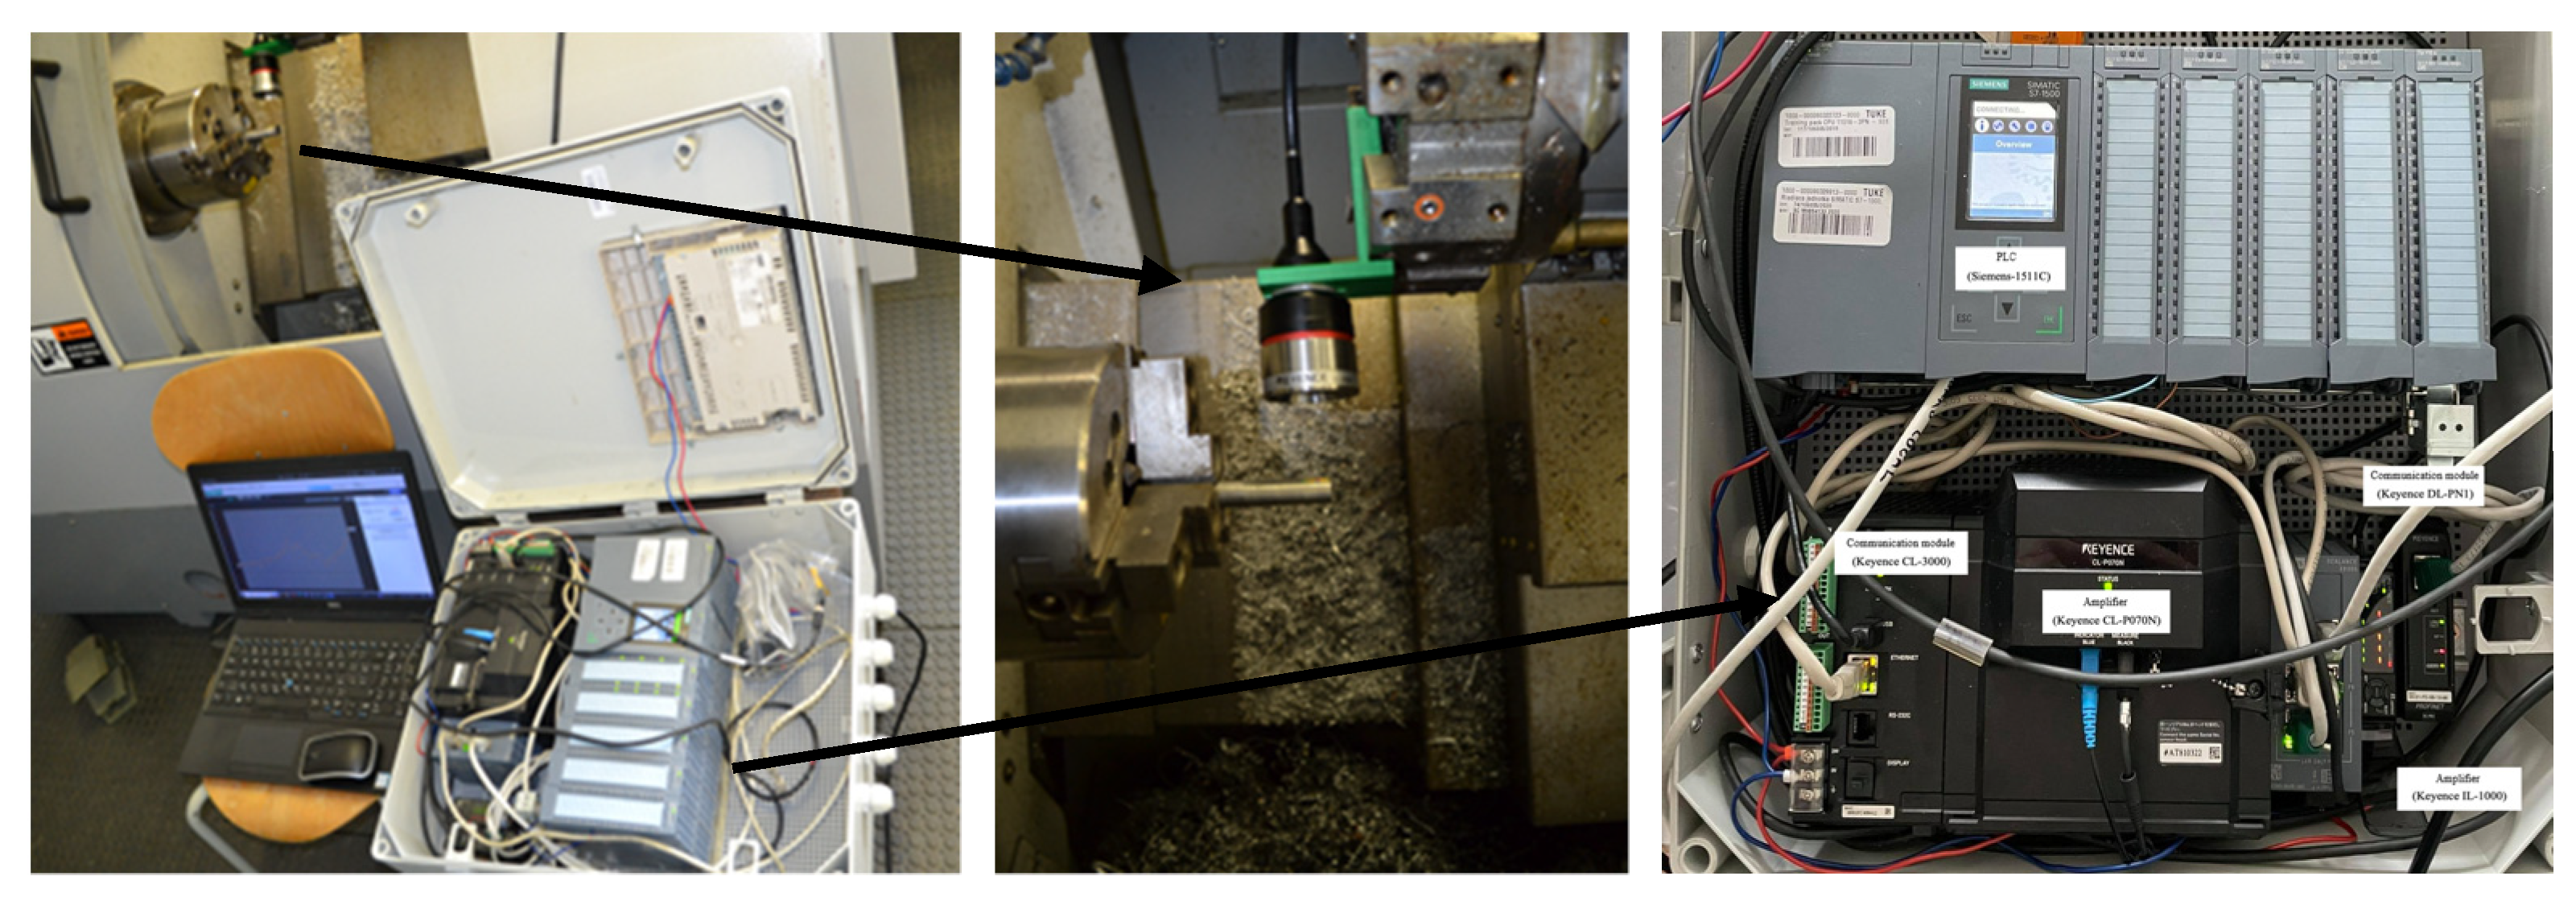
Figure 3.
The measurement layout within the Leadwell T5 CNC machine zone. (a) Measurement scheme utilizing CCHS (confocal chromatic sensor), MMS (Mobile Measuring System), and PC (Personal Computer). (b) Visualization of the working area of the CNC machine.
Figure 3.
The measurement layout within the Leadwell T5 CNC machine zone. (a) Measurement scheme utilizing CCHS (confocal chromatic sensor), MMS (Mobile Measuring System), and PC (Personal Computer). (b) Visualization of the working area of the CNC machine.
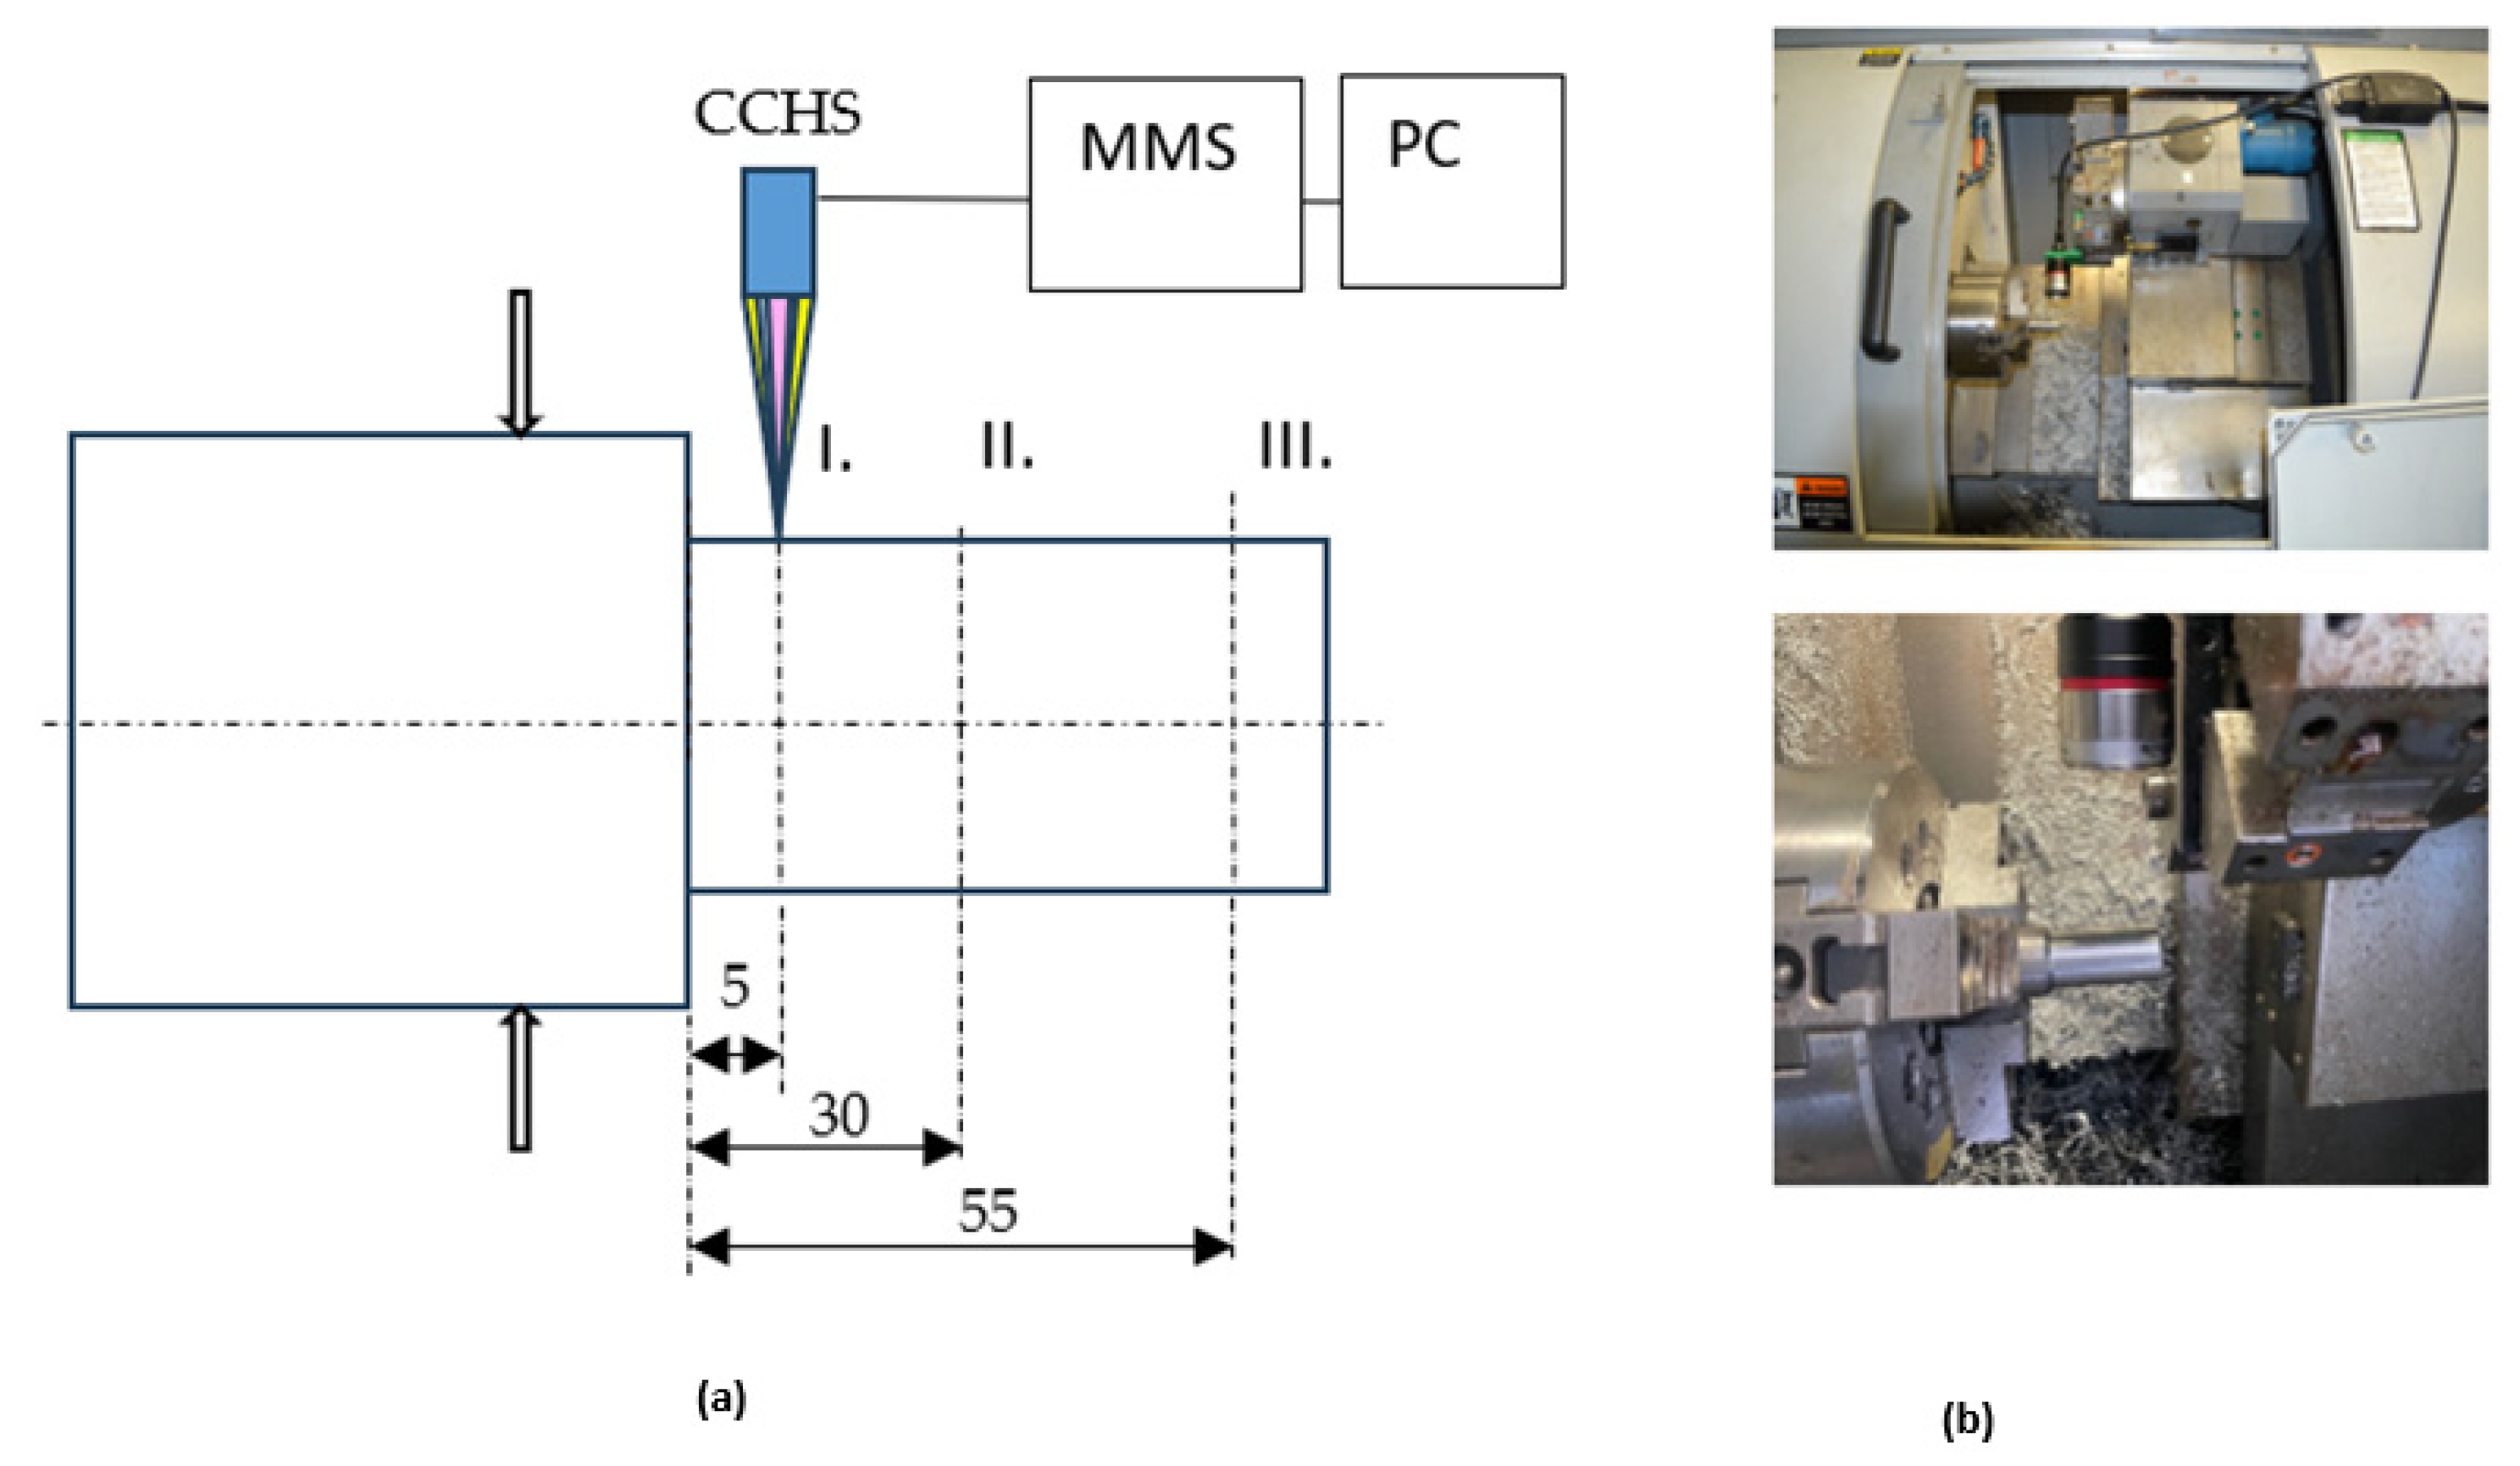
Figure 4.
The cutting tool wear parameters as per ISO 3685 [66].
Figure 4.
The cutting tool wear parameters as per ISO 3685 [66].

Figure 5.
The measurement of wear on the cutting insert face employing a Carl Zeiss Primotech D/A ESD microscope. Magnification 5× The yellow circle characterizes the face wear of tool.
Figure 5.
The measurement of wear on the cutting insert face employing a Carl Zeiss Primotech D/A ESD microscope. Magnification 5× The yellow circle characterizes the face wear of tool.
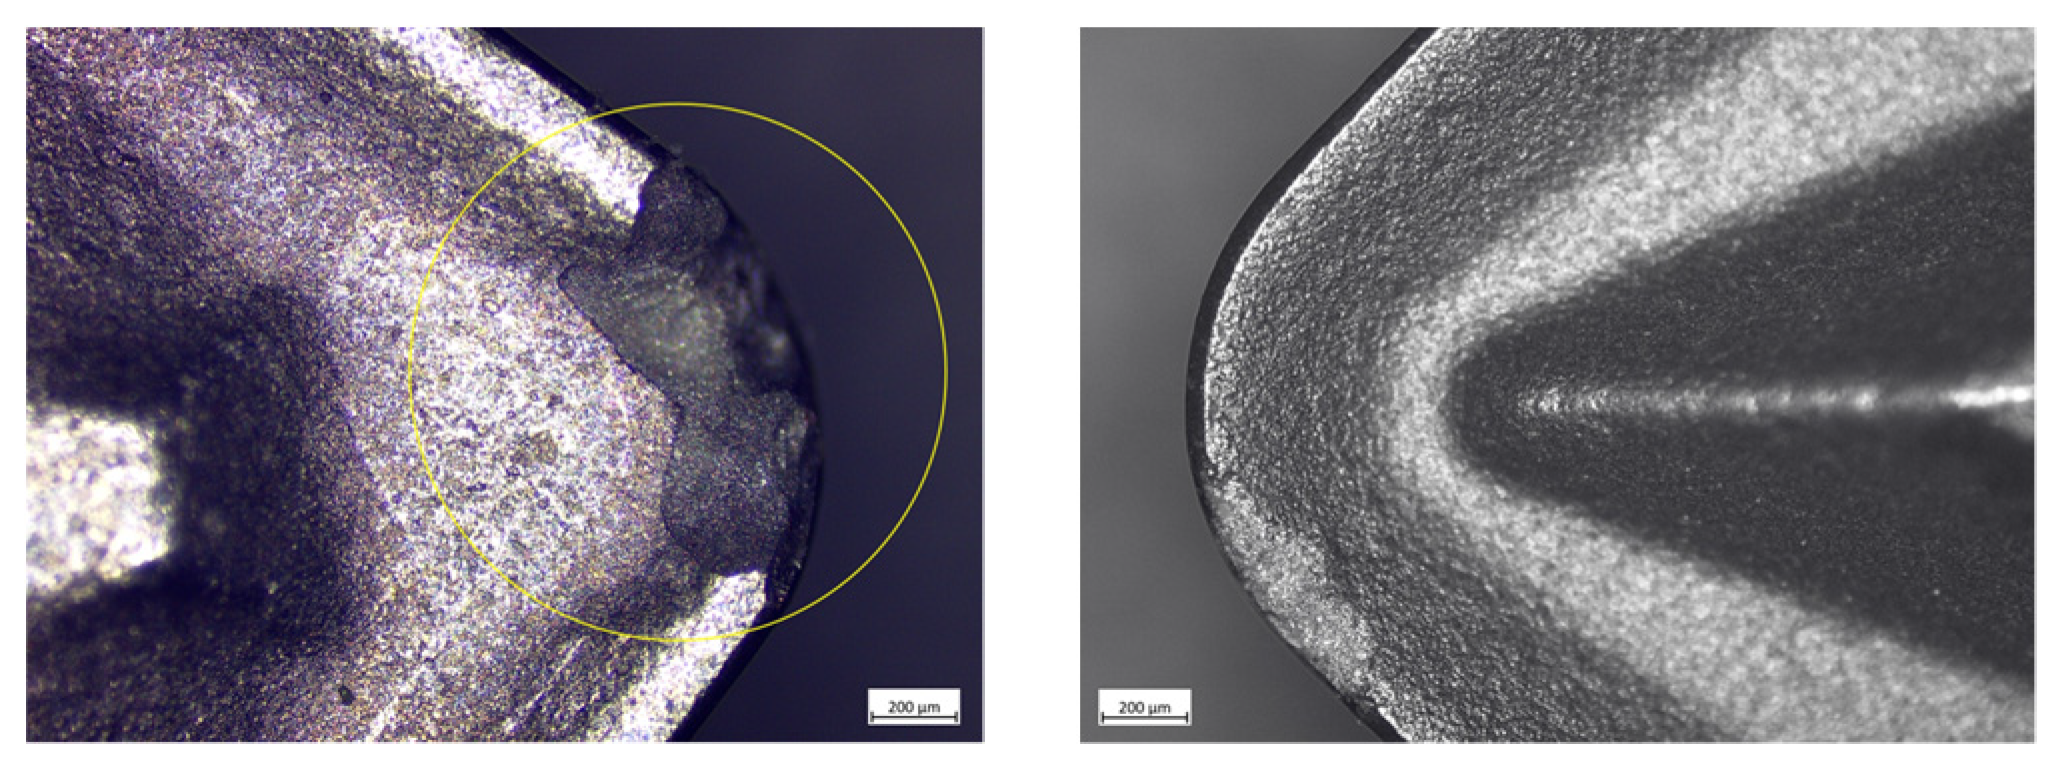
Figure 6.
Main effects plots: (a) illustrates the effects of input factors on roundness deviation, while (b) displays the mean ratios corresponding to roundness deviation.
Figure 6.
Main effects plots: (a) illustrates the effects of input factors on roundness deviation, while (b) displays the mean ratios corresponding to roundness deviation.
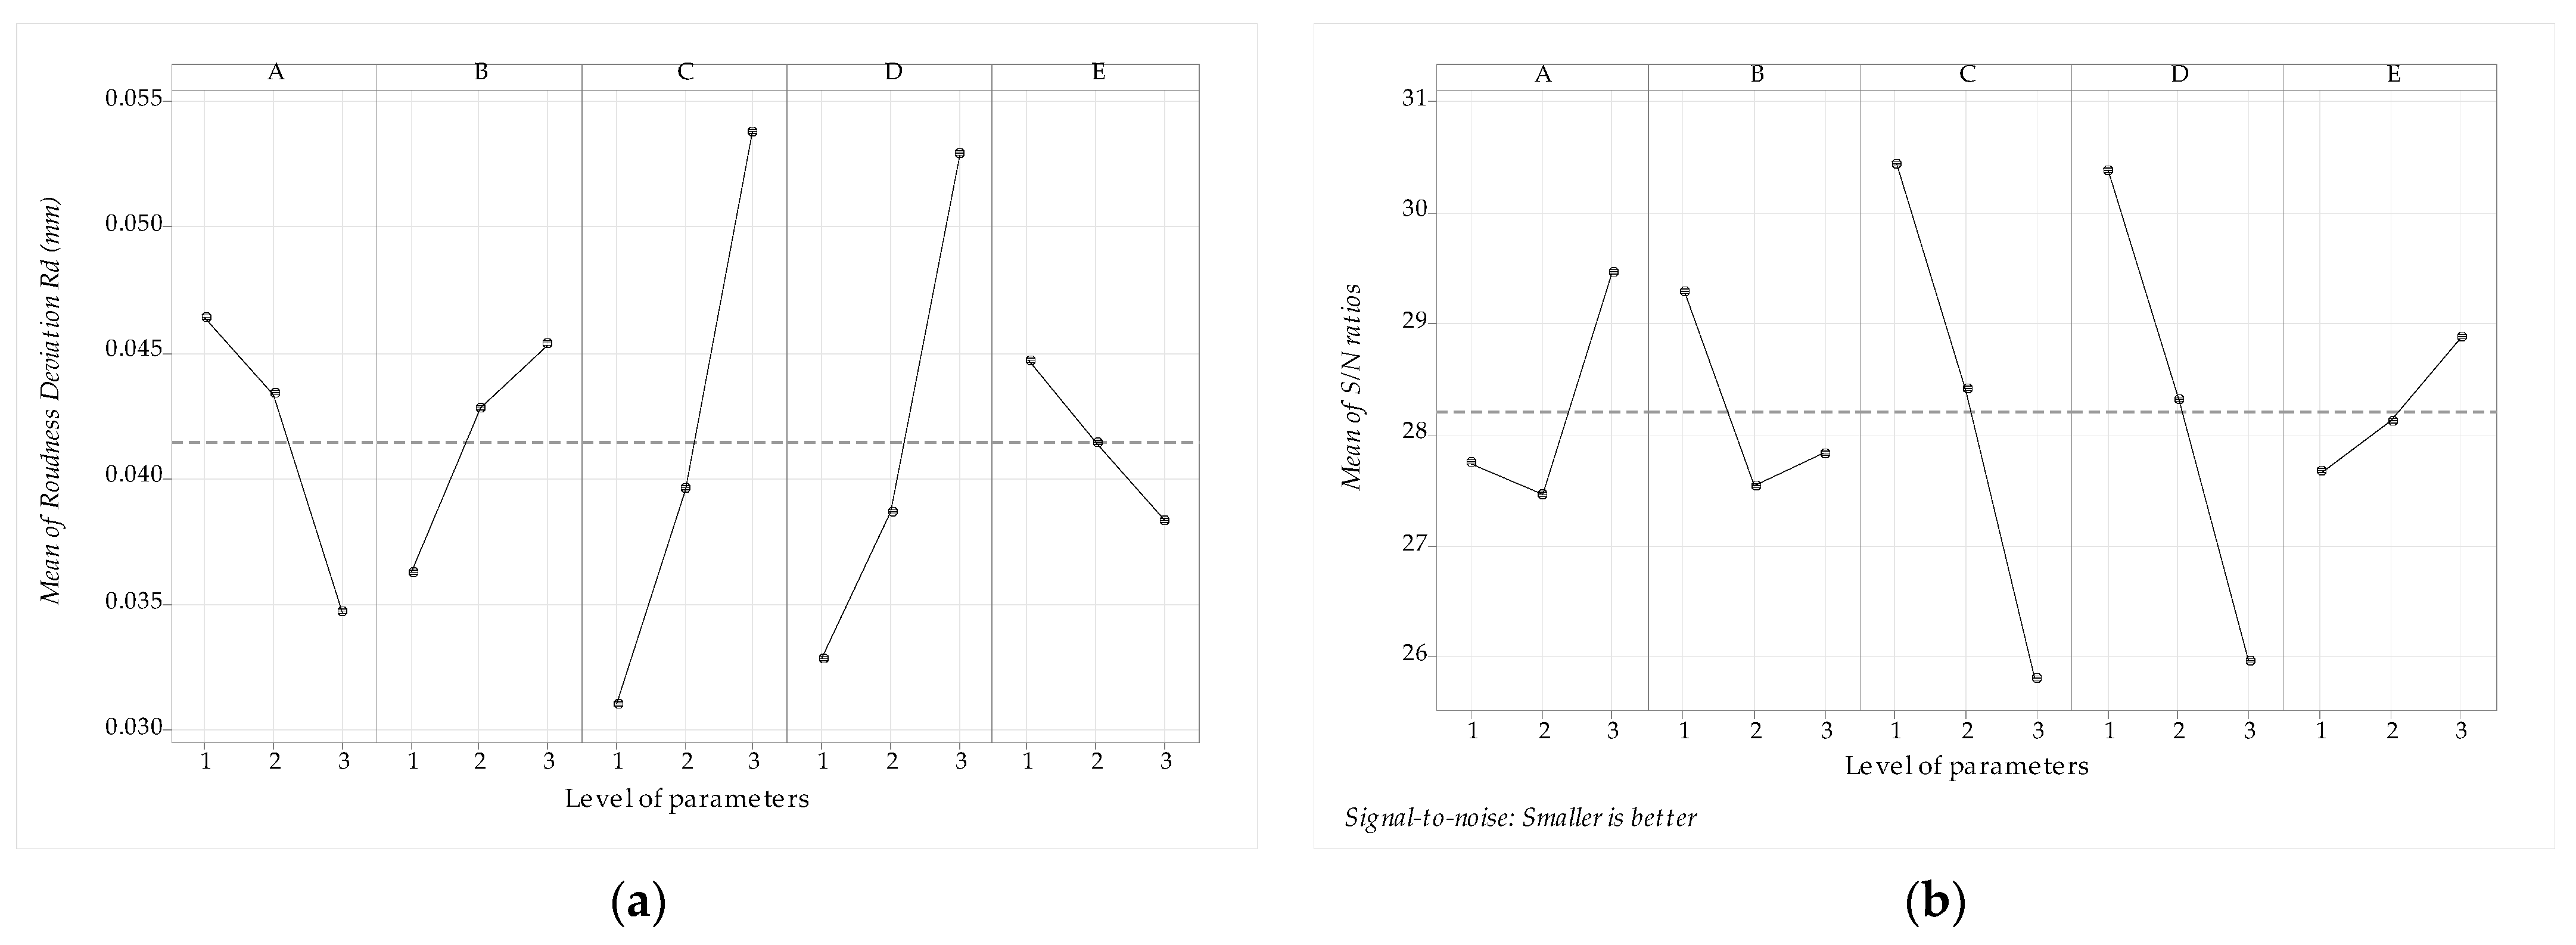
Figure 7.
Main effects plots: (a) the effects of input factors on the tool wear of the face, and (b) the mean ratios corresponding to the tool wear of the face.
Figure 7.
Main effects plots: (a) the effects of input factors on the tool wear of the face, and (b) the mean ratios corresponding to the tool wear of the face.
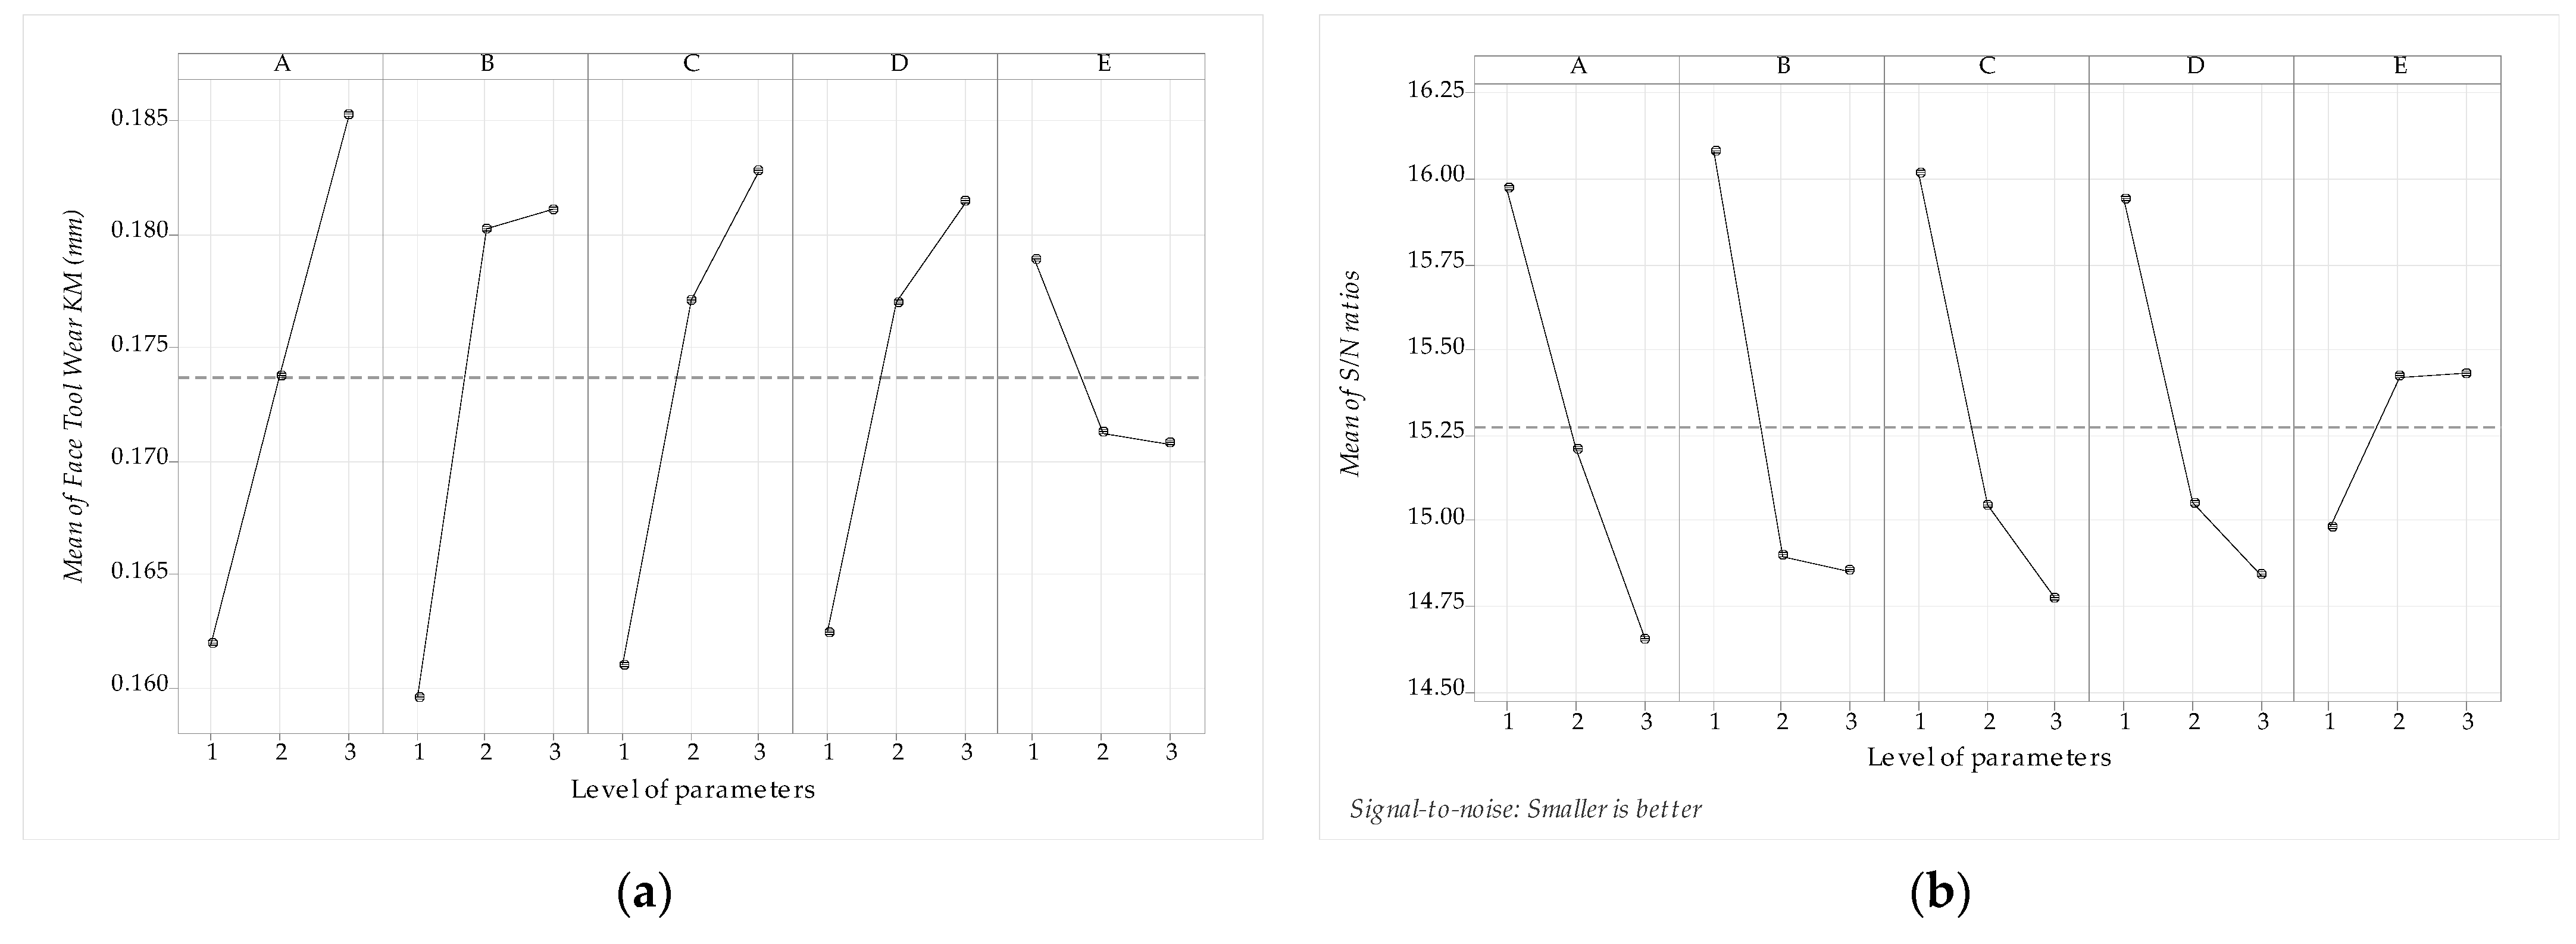
Figure 8.
Visualization of machined surface. (a) Initial parameter settings at A = 180 m/min, B = 0.2 mm/rev., C = 0.4 mm, D = 30 mm, and E = 0.005 mm, (A2B2C2D2E2). Magnification 5×. (b) Taguchi optimum settings at A = 270 m/min, B = 0.1 mm/rev., C = 0.1 mm, D = 5.0 mm, and E = 0.008 mm, (A3B1C1D1E3). Magnification 5×.

Figure 9.
Wear display on cutting insert face. (a) Initial parameter settings at A = 180 m/min, B = 0.2 mm/rev., C = 0.4 mm, D = 30 mm, and E = 0.005 mm, (A2B2C2D2E2). Magnification 5×. (b) Taguchi optimum settings at A = 90 m/min, B = 0.1 mm/rev., C = 0.1 mm, D = 5.0 mm, and E = 0.008 mm, (A1B1C1D1E3). Magnification 5×.

Figure 10.
Normal probability plot of the residuals for roundness deviation.
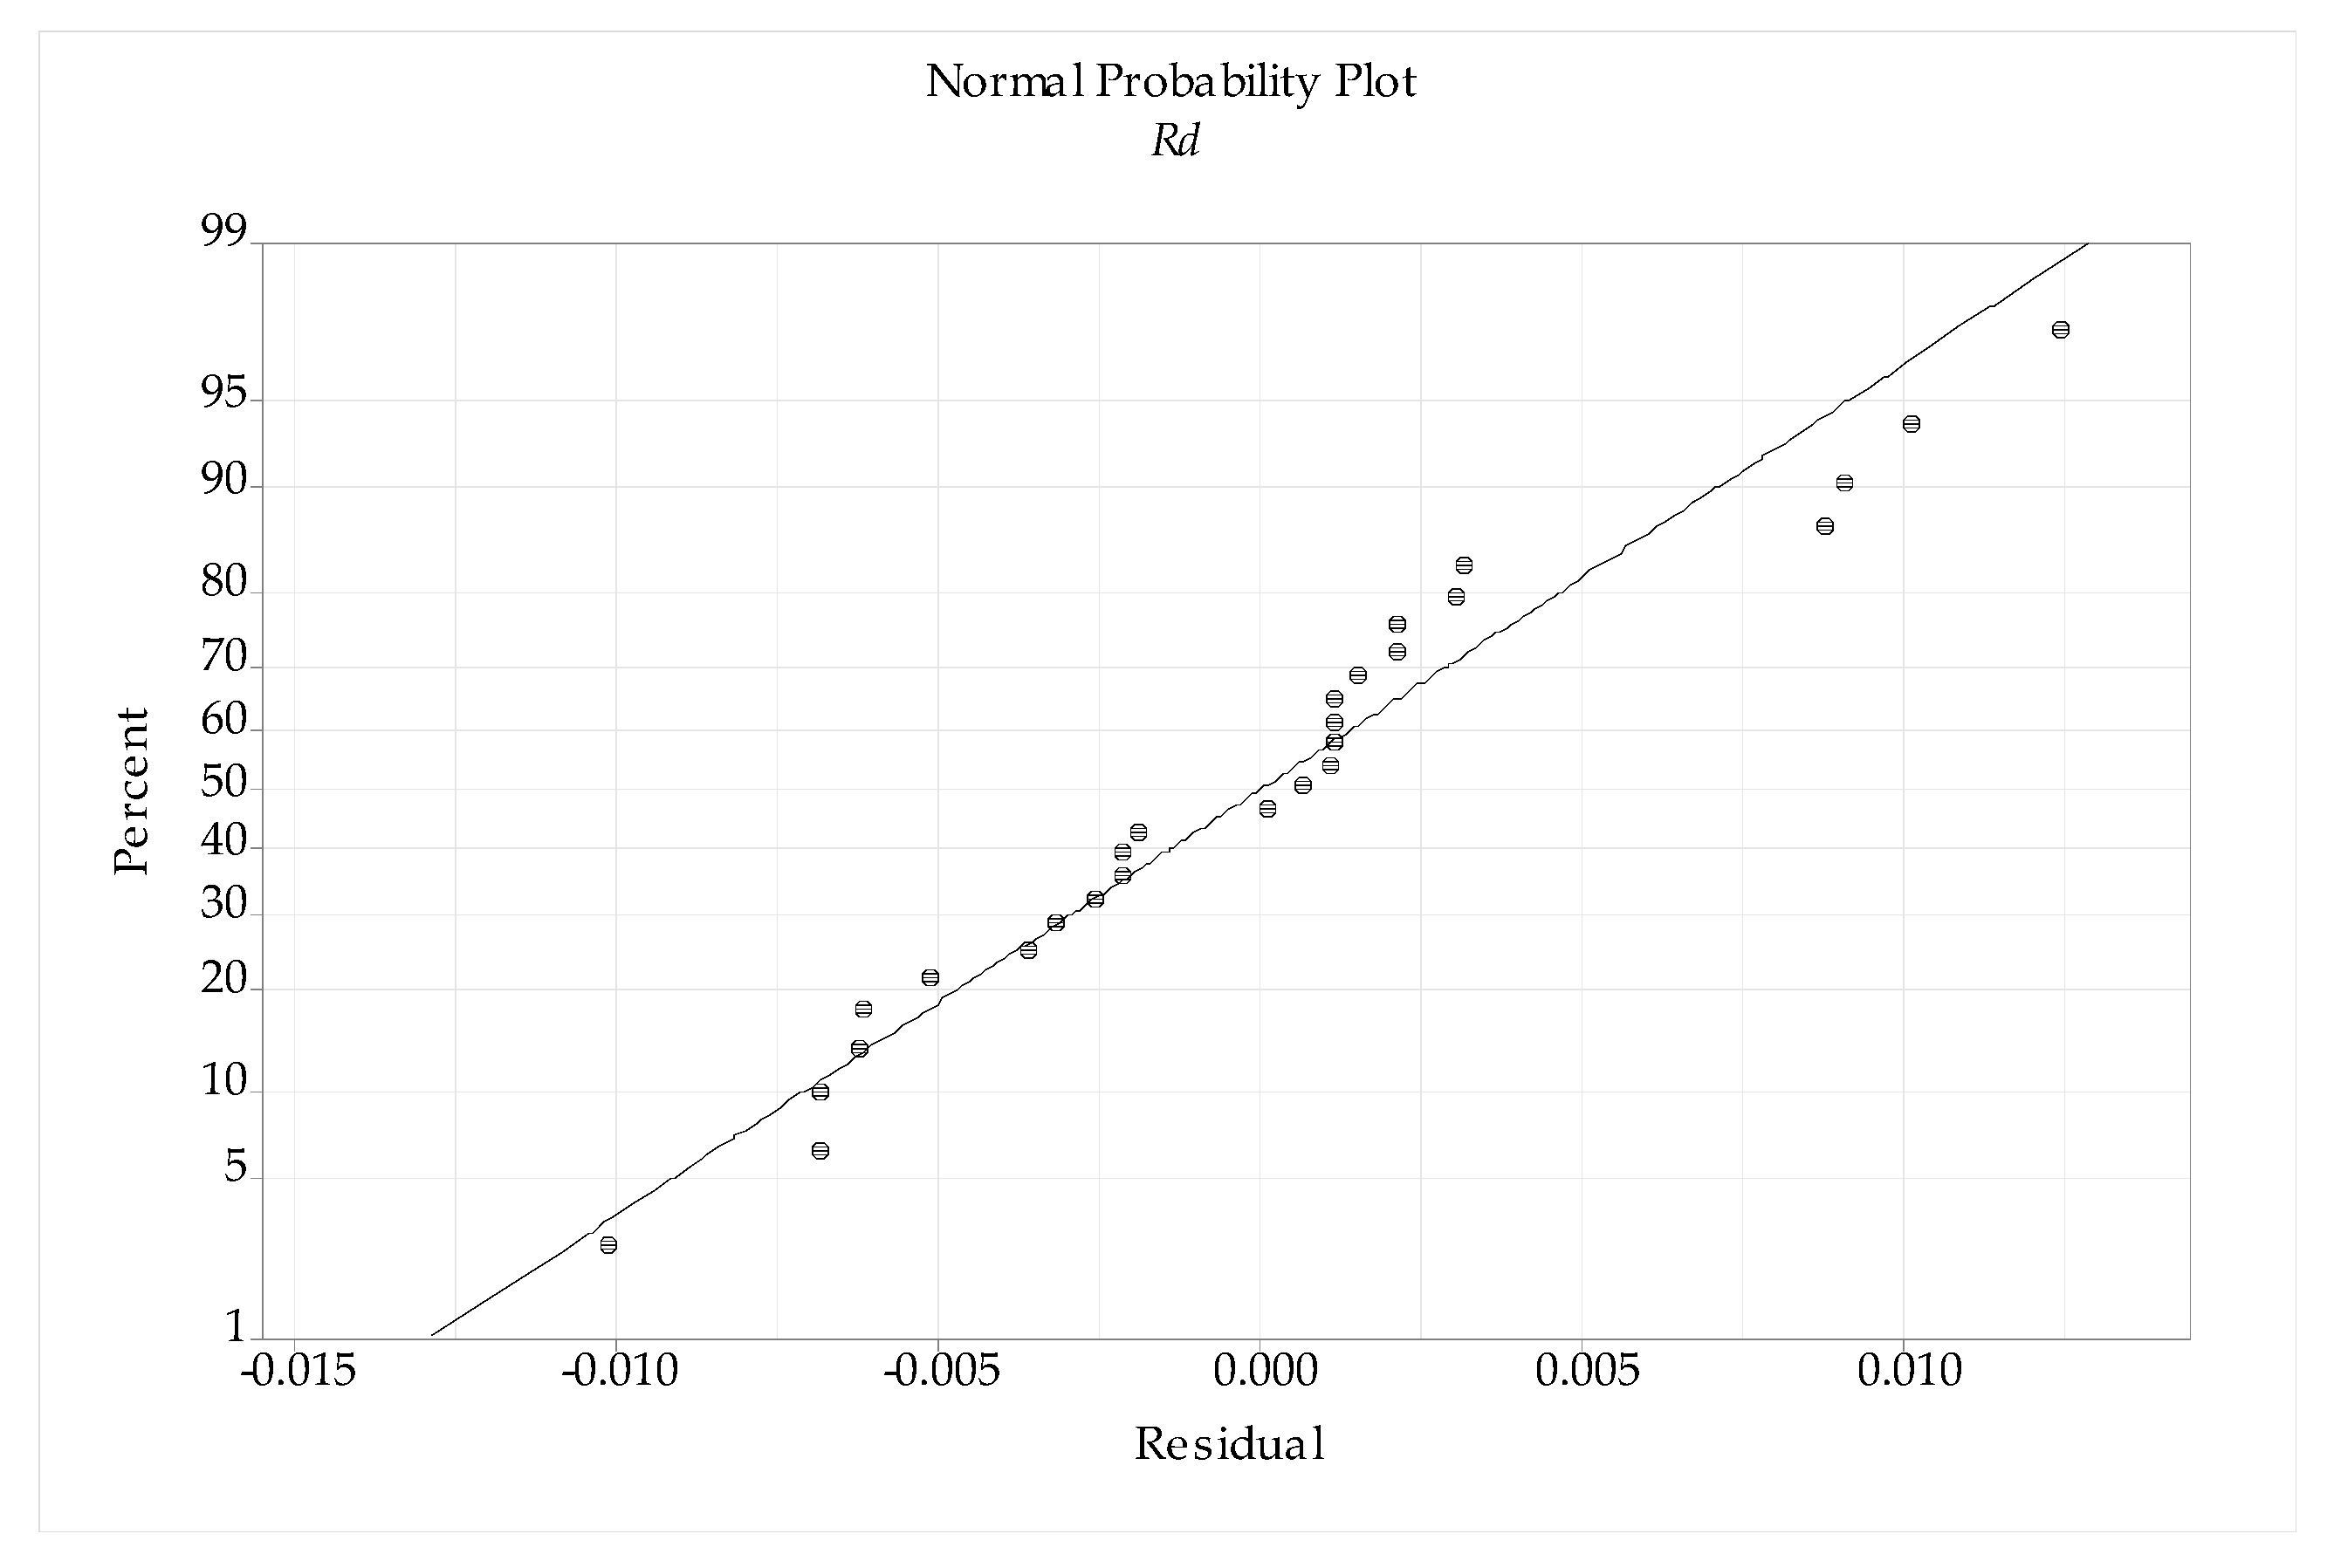
Figure 11.
Normal probability plot of the residuals for tool face wear.
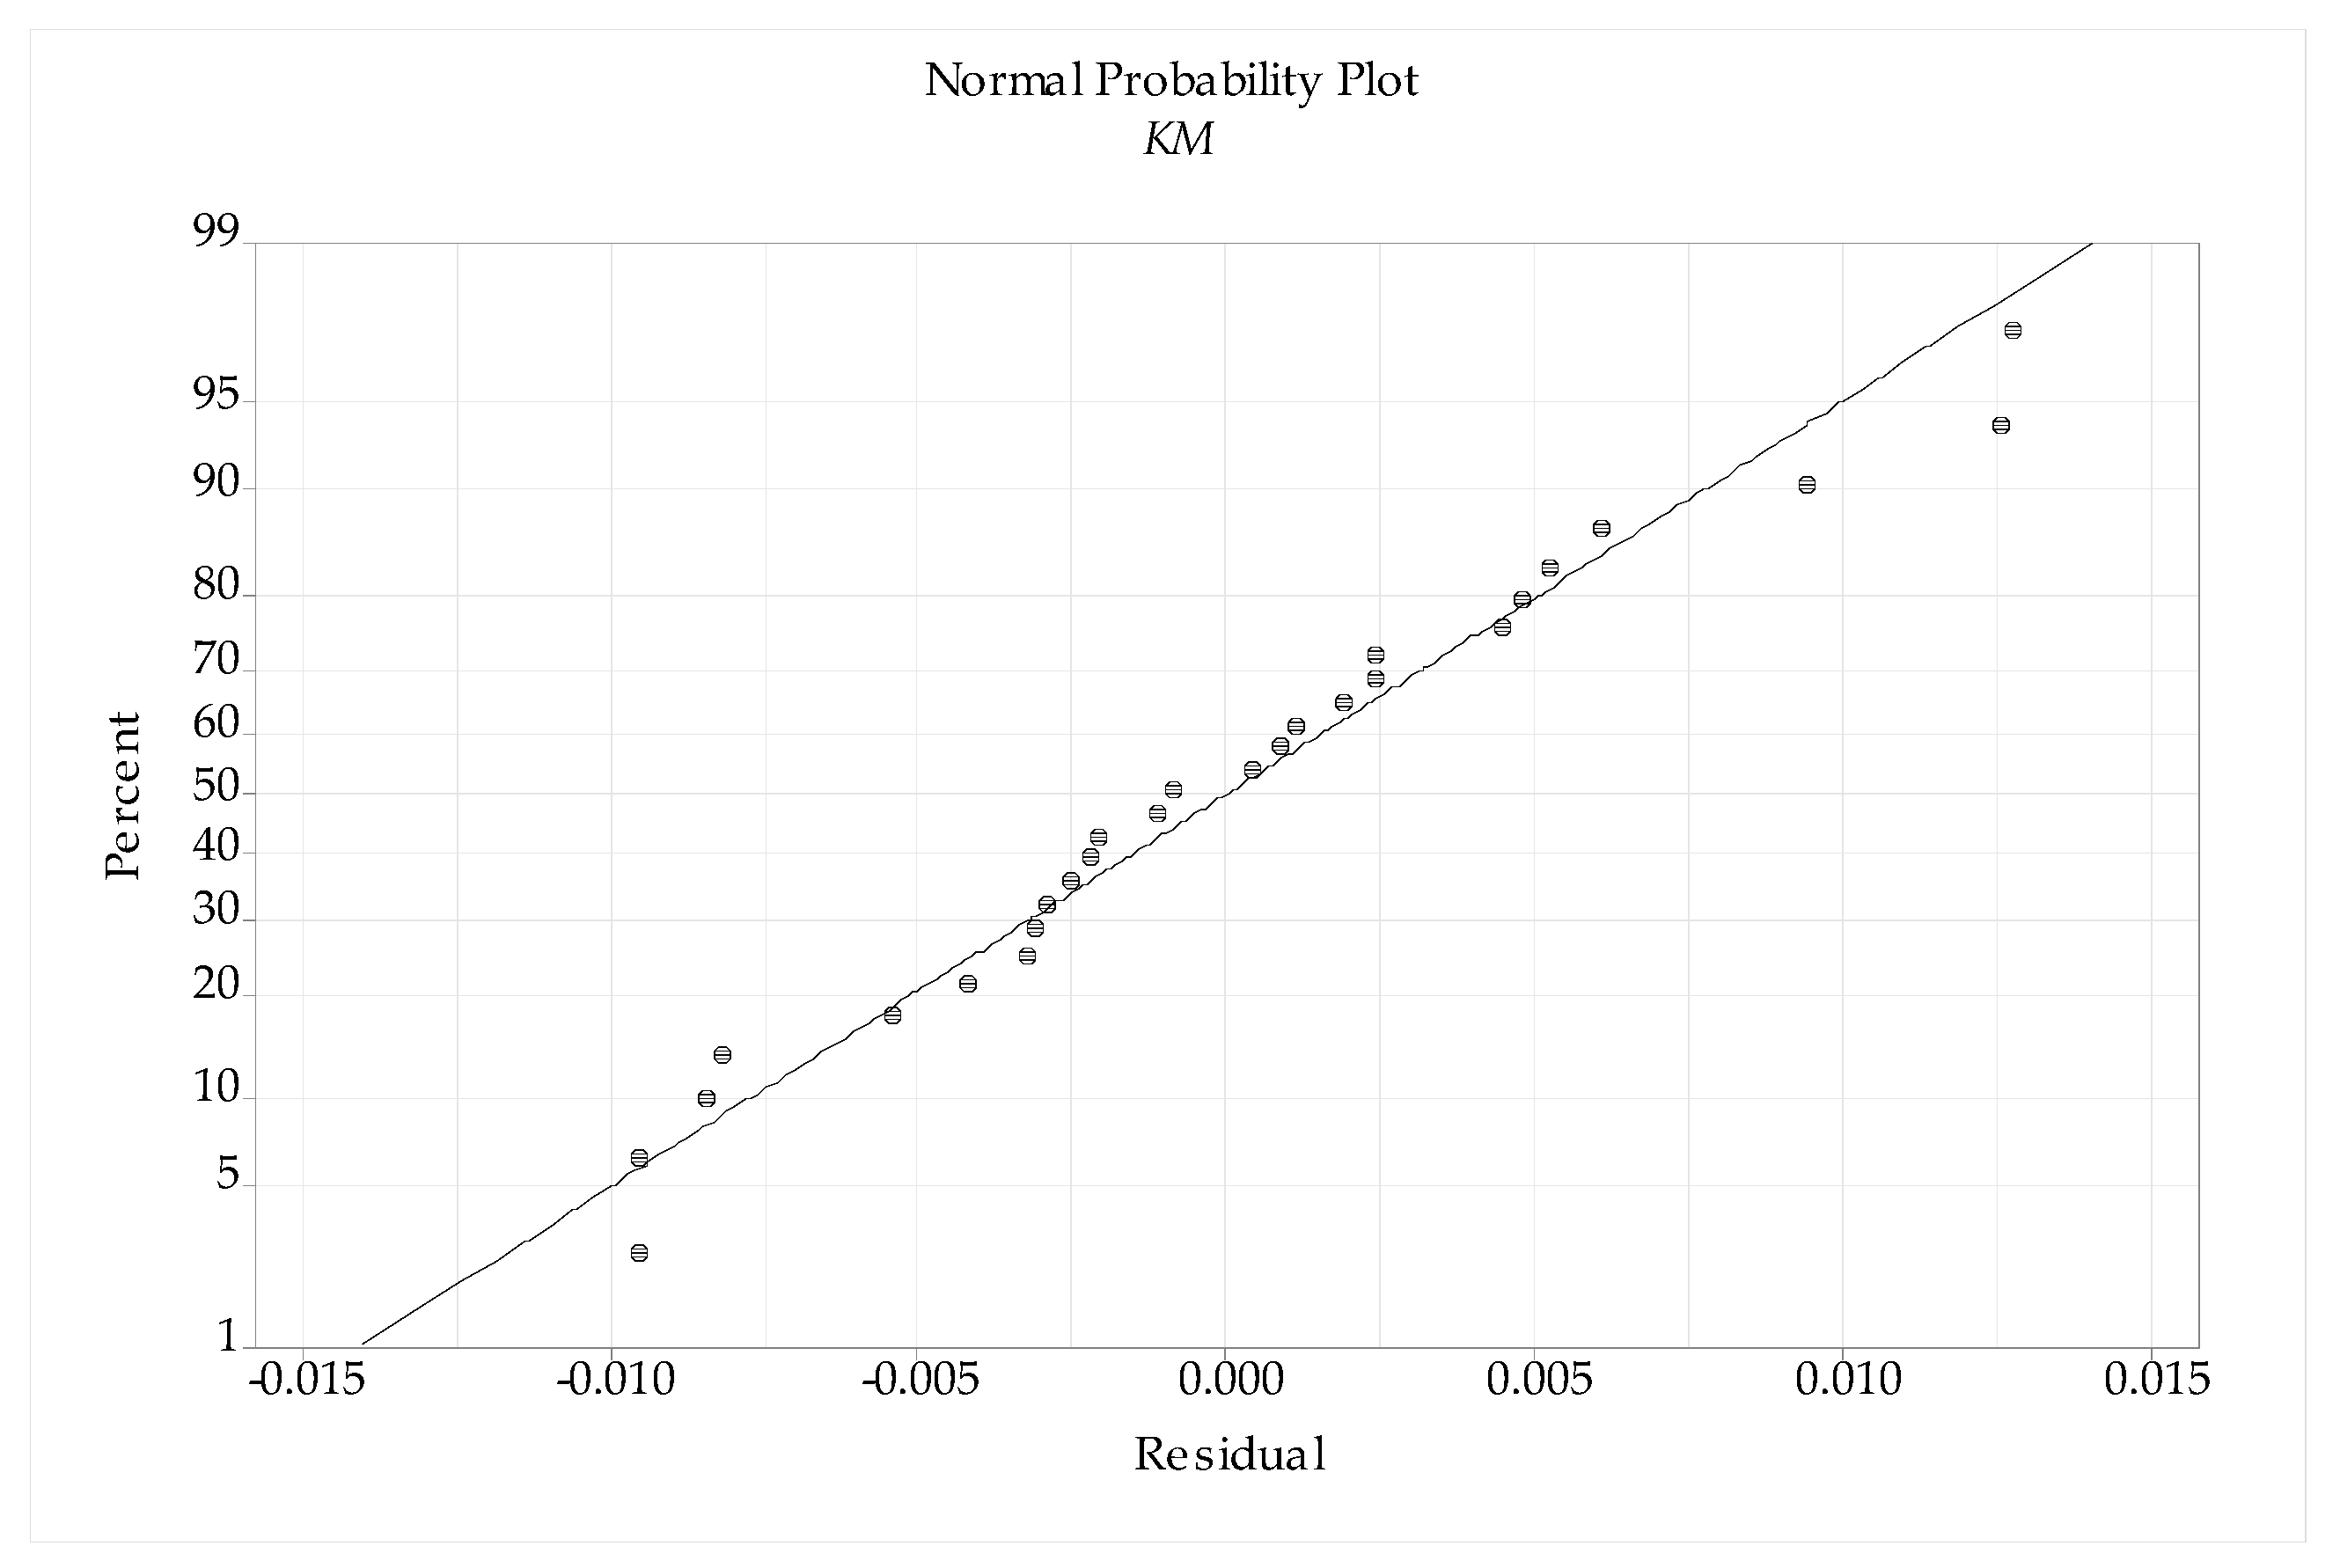
Figure 12.
Examples of machined surfaces after turning C45 steel. (a) Deformation of the machined surface not measurable. Perlite and ferrite. Nital. Magnification 500×, A = 180 m/min, B = 0.2 mm/rev., C = 0.4 mm, D = 30 mm, E = 0.005 mm. (b) Local plastic deformation of machined surface ~34 μm. Perlite and ferrite. Nital. Magnification 500×, A = 270 m/min, B = 0.1 mm/rev., C = 0.1 mm, D = 5.0 mm, E = 0.008 mm. (c) Local plastic deformation of machined surface. Traces of volume extraction of the machined surface. Perlite and ferrite. Nital. Magnification 500×, A = 180 m/min, B = 0.2 mm/rev., C = 0.4 mm, D = 30 mm, E = 0.005 mm. (d) Local plastic deformation of machined surface ~12 μm. Perlite and ferrite. Nital. Magnification 500×, A = 90 m/min, B = 0.1 mm/rev., C = 0.1 mm, D = 5.0 mm, E = 0.008 mm.
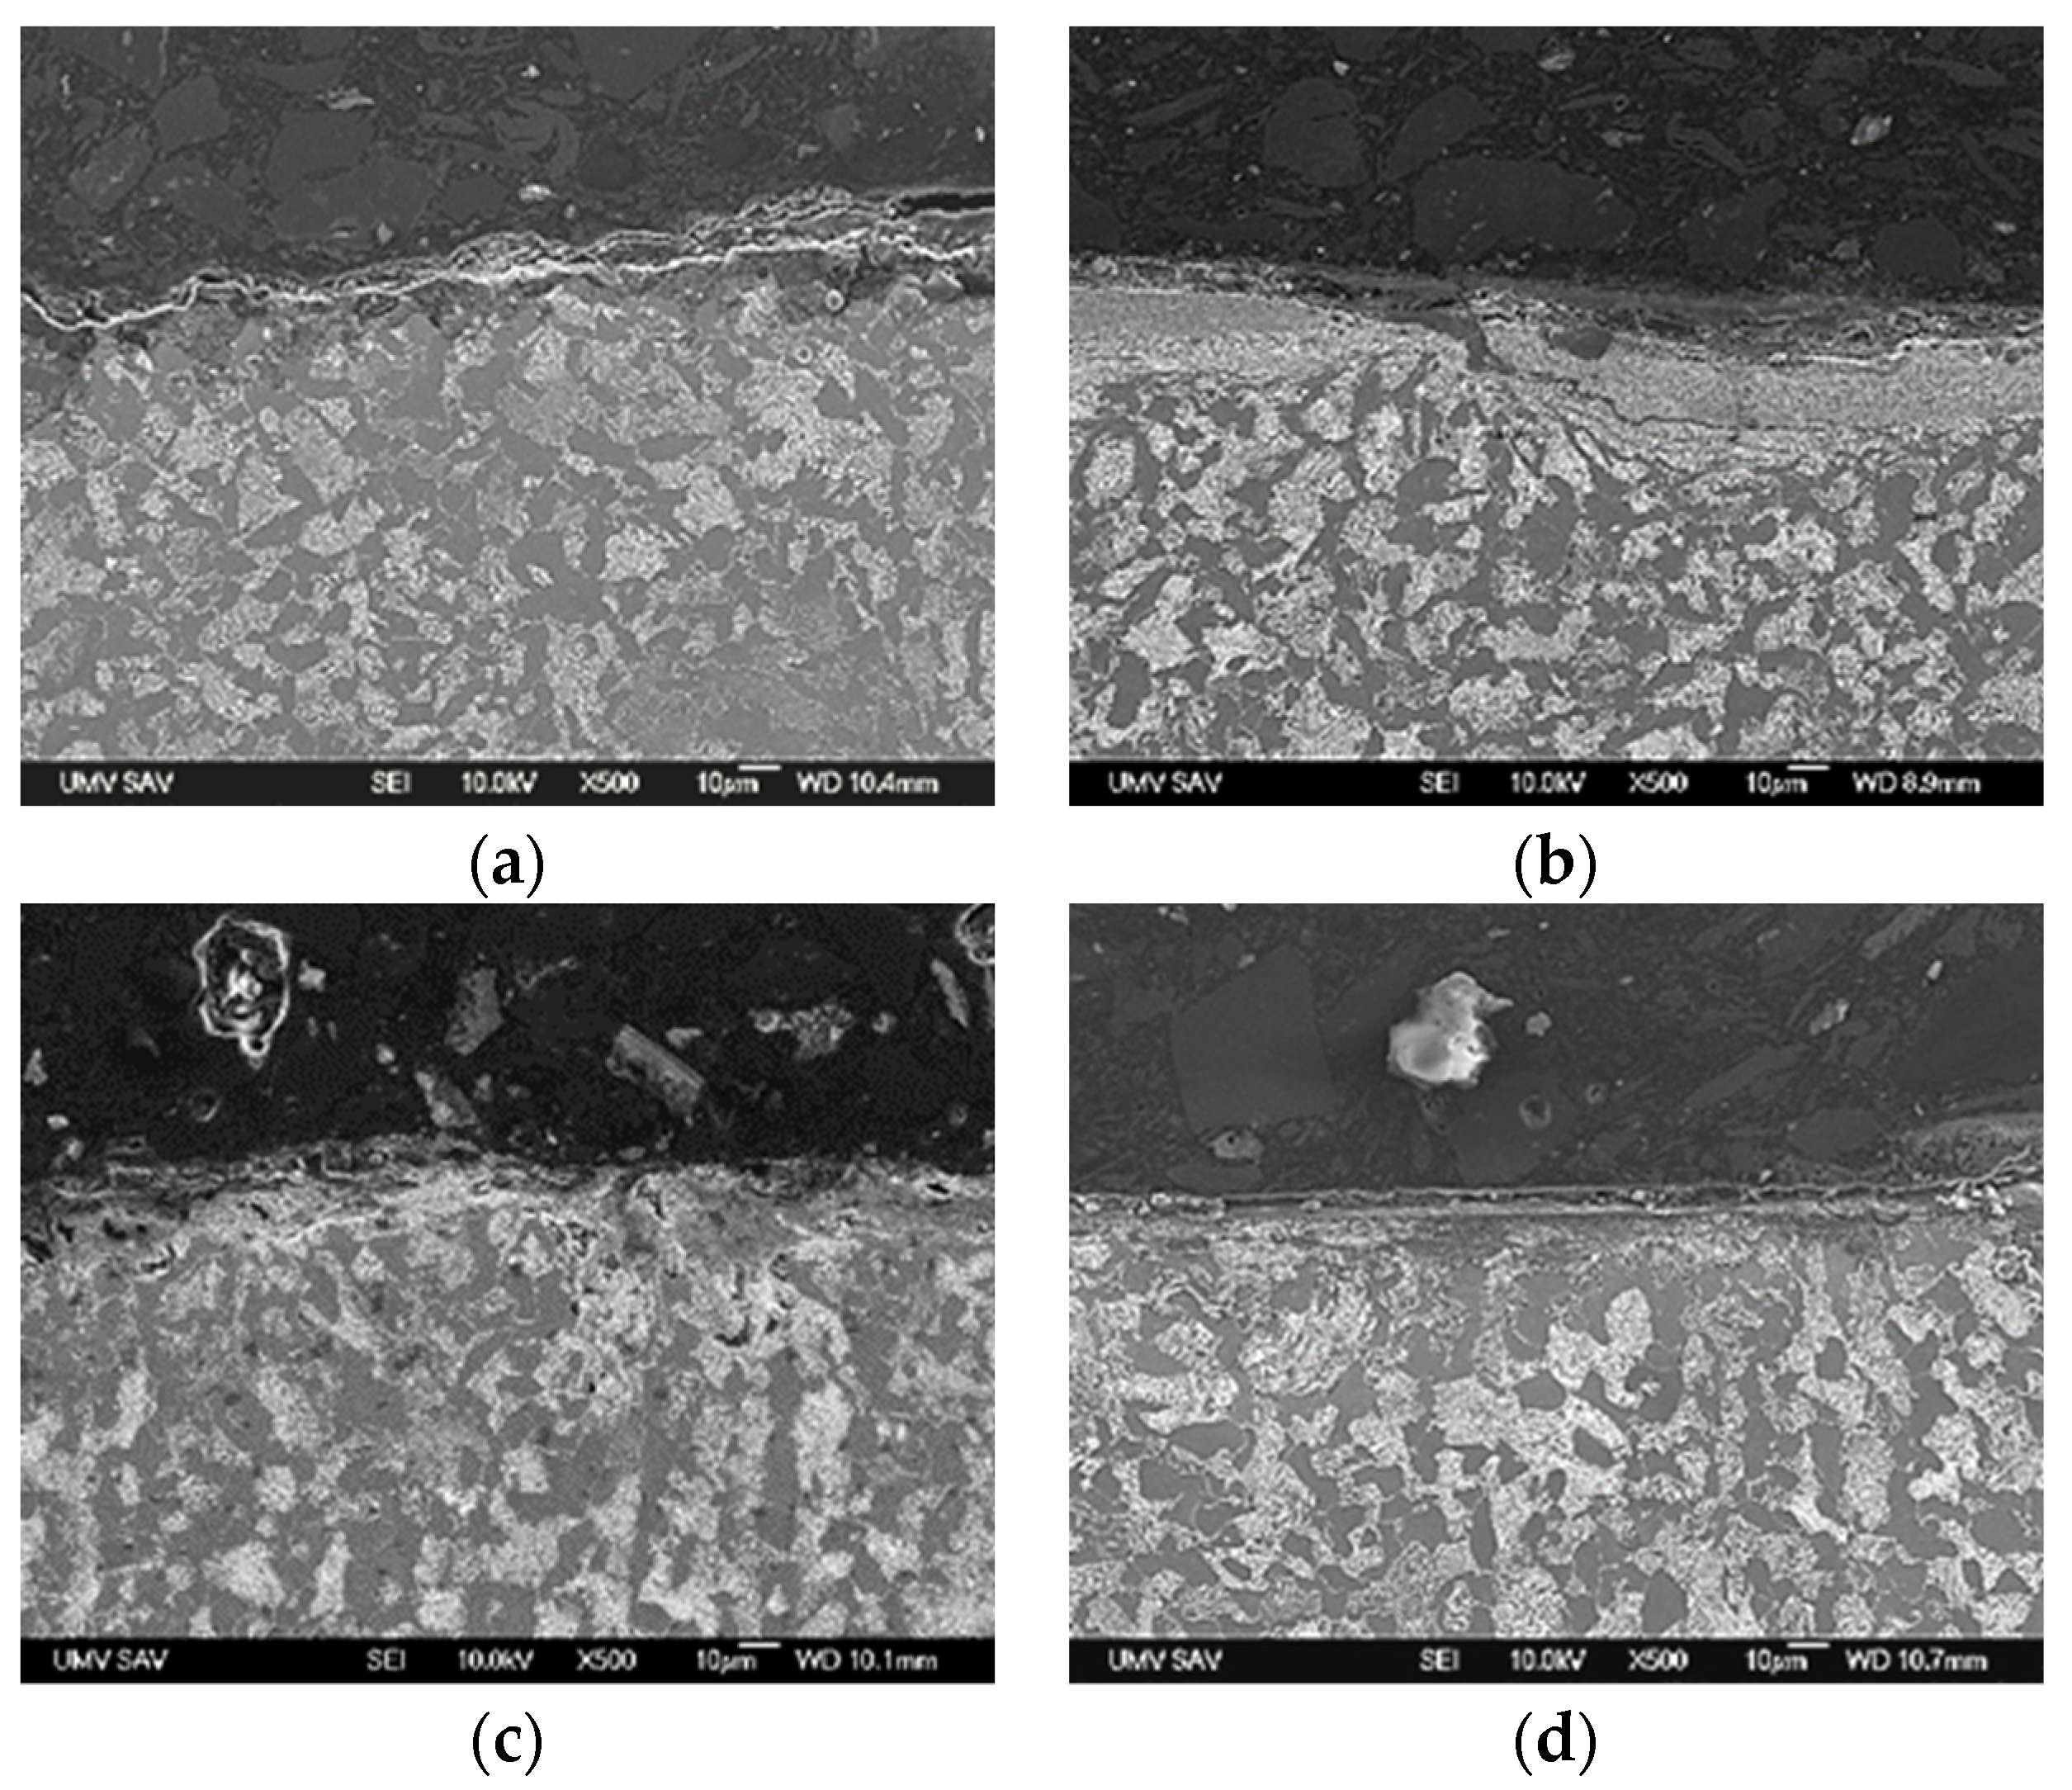
Table 2.
Chemical composition of C45 steel (EN 10083-2-91) *.
| Steel C45 | (%) |
|---|---|
| C | 0.50 |
| Mn | 0.80 |
| Si | 0.37 |
| Cr | 0.22 |
| Ni | 0.28 |
| Cu | 0.18 |
| P | 0.035 |
| S | 0.032 |
* Chemical composition verified through analysis of the sample.
Table 3.
Verified properties of C45 steel products.
| Steel C45 | Values |
|---|---|
| Yield stress Re (MPa) | 202 |
| Tensile strength Rm (MPa) | 650 |
| Density (g/cm3) | 7.85 |
| Hardness HB | max. 220 |
| Elastic modulus (GPa) | 81 |
| Flexural strength (MPA) | 606 |
| Thermal conductivity (W/mK) | 50 |
Table 4.
The primary machining conditions.
| Symbol | Process Parameters Units | Levels | ||
|---|---|---|---|---|
| 1 | 2 | 3 | ||
| A | Cutting speed (m/min) | 90 | 180 | 270 |
| B | Feed (mm/rev.) | 0.1 | 0.2 | 0.3 |
| C | Depth of cut (mm) | 0.1 | 0.4 | 0.8 |
| D | Workpiece length from clamping (mm) | 5.0 | 30.0 | 55.0 |
| E | Cutting edge radius (mm) | 0.003 + 0.0005 | 0.005 + 0.0005 | 0.008 + 0.0005 |
Table 5.
Experimental matrix, design, and experimental results.
| Number of Exp.-RUN | Controllable Process Parameter | Experimental Results | |||||||
|---|---|---|---|---|---|---|---|---|---|
| A | B | C | D | E | Rd (mm) | KM (mm) | |||
| Average Rd | STDVP | STDV ERROR SE (AVERAGE) | |||||||
| 1 | 1 | 1 | 1 | 1 | 1 | 0.0260 | 0.001 | 0.0003 | 0.1420 |
| 2 | 1 | 1 | 1 | 1 | 2 | 0.0184 | 0.001 | 0.0005 | 0.1120 |
| 3 | 1 | 1 | 1 | 1 | 3 | 0.0220 | 0.001 | 0.0006 | 0.1180 |
| 4 | 1 | 2 | 2 | 2 | 1 | 0.0440 | 0.001 | 0.0006 | 0.1850 |
| 5 | 1 | 2 | 2 | 2 | 2 | 0.0440 | 0.002 | 0.0009 | 0.1740 |
| 6 | 1 | 2 | 2 | 2 | 3 | 0.0410 | 0.001 | 0.0006 | 0.1670 |
| 7 | 1 | 3 | 3 | 3 | 1 | 0.0860 | 0.005 | 0.0024 | 0.1820 |
| 8 | 1 | 3 | 3 | 3 | 2 | 0.0720 | 0.003 | 0.0015 | 0.1810 |
| 9 | 1 | 3 | 3 | 3 | 3 | 0.0640 | 0.003 | 0.0012 | 0.1960 |
| 10 | 2 | 1 | 2 | 3 | 1 | 0.0520 | 0.003 | 0.0012 | 0.1730 |
| 11 | 2 | 1 | 2 | 3 | 2 | 0.0450 | 0.002 | 0.0010 | 0.1710 |
| 12 | 2 | 1 | 2 | 3 | 3 | 0.0460 | 0.013 | 0.0059 | 0.1690 |
| 13 | 2 | 2 | 3 | 1 | 1 | 0.0640 | 0.008 | 0.0035 | 0.1860 |
| 14 | 2 | 2 | 3 | 1 | 2 | 0.0420 | 0.012 | 0.0054 | 0.1820 |
| 15 | 2 | 2 | 3 | 1 | 3 | 0.0390 | 0.011 | 0.0051 | 0.1670 |
| 16 | 2 | 3 | 1 | 2 | 1 | 0.0340 | 0.005 | 0.0025 | 0.1750 |
| 17 | 2 | 3 | 1 | 2 | 2 | 0.0360 | 0.007 | 0.0030 | 0.1700 |
| 18 | 2 | 3 | 1 | 2 | 3 | 0.0320 | 0.003 | 0.0012 | 0.1710 |
| 19 | 3 | 1 | 3 | 2 | 1 | 0.0370 | 0.010 | 0.0043 | 0.1880 |
| 20 | 3 | 1 | 3 | 2 | 2 | 0.0410 | 0.001 | 0.0006 | 0.1770 |
| 21 | 3 | 1 | 3 | 2 | 3 | 0.0390 | 0.003 | 0.0013 | 0.1860 |
| 22 | 3 | 2 | 1 | 3 | 1 | 0.0300 | 0.007 | 0.0031 | 0.1970 |
| 23 | 3 | 2 | 1 | 3 | 2 | 0.0370 | 0.008 | 0.0034 | 0.1820 |
| 24 | 3 | 2 | 1 | 3 | 3 | 0.0440 | 0.010 | 0.0045 | 0.1820 |
| 25 | 3 | 3 | 2 | 1 | 1 | 0.0290 | 0.001 | 0.0004 | 0.1820 |
| 26 | 3 | 3 | 2 | 1 | 2 | 0.0370 | 0.002 | 0.0007 | 0.1920 |
| 27 | 3 | 3 | 2 | 1 | 3 | 0.0180 | 0.002 | 0.0009 | 0.1810 |
Table 6.
Calculated ratios.
| Number of Exp.-RUN | Ratios of Results | |
|---|---|---|
| Rd (dB) | KM (dB) | |
| 1 | 31.7005 | 16.9542 |
| 2 | 34.7036 | 19.0156 |
| 3 | 33.1515 | 18.5624 |
| 4 | 27.1309 | 14.6566 |
| 5 | 27.1309 | 15.1890 |
| 6 | 27.7443 | 15.5457 |
| 7 | 21.3100 | 14.7986 |
| 8 | 22.8534 | 14.8464 |
| 9 | 23.8764 | 14.1549 |
| 10 | 25.6799 | 15.2391 |
| 11 | 26.9357 | 15.3401 |
| 12 | 26.7448 | 15.4423 |
| 13 | 23.8764 | 14.6097 |
| 14 | 27.5350 | 14.7986 |
| 15 | 28.1787 | 15.5457 |
| 16 | 29.3704 | 15.1392 |
| 17 | 28.8739 | 15.3910 |
| 18 | 29.8970 | 15.3401 |
| 19 | 28.6360 | 14.5168 |
| 20 | 27.7443 | 15.0405 |
| 21 | 28.1787 | 14.6097 |
| 22 | 30.4576 | 14.1107 |
| 23 | 28.6360 | 14.7986 |
| 24 | 27.1309 | 14.7986 |
| 25 | 30.7520 | 14.7986 |
| 26 | 28.6360 | 14.3340 |
| 27 | 34.8945 | 14.8464 |
Table 7.
Mean ratio response table for roundness deviation.
| Symbol | Process Parameters and Units | Ratios | ||||
|---|---|---|---|---|---|---|
| Level 1 | Level 2 | Level 3 | Max–Min | Rank | ||
| A | Cutting speed (m/min) | 27.73 | 27.45 | 29.45 | 2.00 | 3 |
| B | Feed (mm/rev.) | 29.28 | 27.54 | 27.83 | 1.74 | 4 |
| C | Depth of cut (mm) | 30.44 | 28.41 | 25.80 | 4.64 | 1 |
| D | Workpiece length from clamping (mm) | 30.38 | 28.30 | 25.96 | 4.42 | 2 |
| E | Cutting edge radius (mm) | 27.66 | 28.12 | 28.87 | 1.21 | 5 |
Table 8.
Mean ratio response table for tool face wear.
| Symbol | Process Parameters and Units | Ratio | ||||
|---|---|---|---|---|---|---|
| Level 1 | Level 2 | Level 3 | Max–Min | Rank | ||
| A | Cutting speed (m/min) | 15.97 | 15.21 | 14.65 | 1.32 | 1 |
| B | Feed (mm/rev.) | 16.08 | 14.89 | 14.85 | 1.23 | 3 |
| C | Depth of cut (mm) | 16.01 | 15.04 | 14.77 | 1.24 | 2 |
| D | Workpiece length from clamping (mm) | 15.94 | 15.05 | 14.84 | 1.10 | 4 |
| E | Cutting edge radius (mm) | 14.98 | 15.42 | 15.43 | 0.45 | 5 |
Table 9.
Confirmation test results for roundness deviation.
| Initial Process Parameter | Optimal Process Parameters | ||
|---|---|---|---|
| Prediction | Experiment | ||
| Level | A2B2C2D2E2 | A3B1C1D1E3 | A3B1C1D1E3 |
| Roundness deviation (mm) | 0.041 | 0.024 | |
| ratio (dB) | 27.44 | 35.56 | 32.39 |
| Improvement in S/N ratio (dB) | 4.95 | ||
| Percentage reduction in tool face wear | 15.29% | ||
Table 10.
Confirmation test results for tool face wear.
| Initial Process Parameter | Optimal Process Parameters | ||
|---|---|---|---|
| Prediction | Experiment | ||
| Level | A2B2C2D2E2 | A1B1C1D1E3 | A1B1C1D1E3 |
| Tool face wear (mm) | 0.198 | 0.157 | |
| ratio (dB) | 14.07 | 15.97 | 16.08 |
| Improvement in S/N ratio (dB) | 2.01 | ||
| Percentage reduction in tool face wear | 12.5% | ||
Table 11.
Analysis of variance for roundness deviation.
| Source | DF | Adj SS | Adj MS | F-Value | p-Value | Contribution | Remarks |
|---|---|---|---|---|---|---|---|
| A | 2 | 0.000665 | 0.000332 | 6.65 | 0.008 | 10.50% | Significant |
| B | 2 | 0.000393 | 0.000197 | 3.94 | 0.041 | 6.21% | Significant |
| C | 2 | 0.002375 | 0.001187 | 23.76 | 0.000 | 37.51% | Significant |
| D | 2 | 0.001917 | 0.000959 | 19.18 | 0.000 | 30.29% | Significant |
| E | 2 | 0.000181 | 0.000090 | 1.81 | 0.196 | 2.85% | Insignificant |
| Error | 16 | 0.000800 | 0.000050 | 12.63% | |||
| Total | 26 | 0.006330 | 100.00% |
Table 12.
Analysis of variance for face wear.
| Source | DF | Adj SS | Adj MS | F-Value | p-Value | Contribution | Remarks |
|---|---|---|---|---|---|---|---|
| A | 2 | 0.002450 | 0.001225 | 20.63 | 0.003 | 23.27% | Significant |
| B | 2 | 0.002678 | 0.001339 | 22.54 | 0.001 | 25.43% | Significant |
| C | 2 | 0.002298 | 0.001149 | 19.34 | 0.005 | 21.83% | Significant |
| D | 2 | 0.001778 | 0.000889 | 14.97 | 0.008 | 16.89% | Significant |
| E | 2 | 0.000374 | 0.000187 | 3.15 | 0.070 | 3.56% | Insignificant |
| Error | 16 | 0.000950 | 0.000059 | 9.03% | |||
| Total | 26 | 0.010528 | 100.00% |
Table 13.
Confirmation results for the developed models.
| Run | Experimental | Predicted | Residuals | Error | ||||
|---|---|---|---|---|---|---|---|---|
| Rd (mm) | KM (mm) | Rd (mm) | KM (mm) | Rd (mm) | KM (mm) | Rd (%) | KM (%) | |
| 1 | 0.026 | 0.112 | 0.025 | 0.122 | 0.001 | −0.01 | 3.846 | 8.929 |
| 6 | 0.041 | 0.167 | 0.040 | 0.172 | 0.001 | −0.005 | 2.439 | 2.994 |
| 10 | 0.052 | 0.173 | 0.051 | 0.176 | 0.001 | −0.003 | 1.923 | 1.734 |
| 11 | 0.045 | 0.169 | 0.048 | 0.168 | −0.003 | 0.001 | 6.667 | 0.592 |
| 16 | 0.034 | 0.167 | 0.037 | 0.175 | −0.003 | −0.008 | 8.824 | 4.79 |
| 19 | 0.037 | 0.188 | 0.042 | 0.189 | −0.005 | −0.001 | 13.513 | 0.532 |
| 23 | 0.037 | 0.182 | 0.036 | 0.184 | 0.001 | −0.002 | 2.703 | 1.099 |
| 25 | 0.029 | 0.182 | 0.031 | 0.191 | −0.002 | −0.009 | 6.896 | 4.945 |
Disclaimer/Publisher’s Note: The statements, opinions and data contained in all publications are solely those of the individual author(s) and contributor(s) and not of MDPI and/or the editor(s). MDPI and/or the editor(s) disclaim responsibility for any injury to people or property resulting from any ideas, methods, instructions or products referred to in the content. |
© 2024 by the authors. Licensee MDPI, Basel, Switzerland. This article is an open access article distributed under the terms and conditions of the Creative Commons Attribution (CC BY) license (https://creativecommons.org/licenses/by/4.0/).
Share and Cite
MDPI and ACS Style
Jurko, J.; Paľová, K.; Michalík, P.; Kondrát, M. Optimization of Sustainable Production Processes in C45 Steel Machining Using a Confocal Chromatic Sensor. Lubricants 2024, 12, 99. https://doi.org/10.3390/lubricants12030099
AMA Style
Jurko J, Paľová K, Michalík P, Kondrát M. Optimization of Sustainable Production Processes in C45 Steel Machining Using a Confocal Chromatic Sensor. Lubricants. 2024; 12(3):99. https://doi.org/10.3390/lubricants12030099
Chicago/Turabian StyleJurko, Jozef, Katarína Paľová, Peter Michalík, and Martin Kondrát. 2024. "Optimization of Sustainable Production Processes in C45 Steel Machining Using a Confocal Chromatic Sensor" Lubricants 12, no. 3: 99. https://doi.org/10.3390/lubricants12030099
Note that from the first issue of 2016, this journal uses article numbers instead of page numbers. See further details here.