Mechanical and Tribological Behaviour of Surface-Graphitised Al-1100 Alloy


1
School of Mechanical Engineering, Maharashtra Institute of Technology-World Peace University, Pune 411038, India
2
Department of Mechanical Engineering, National Institute of Technology, Calicut 673601, India
3
Research Division of Materials Joining Mechanism, Joining & Welding Research Institute, Osaka University, Osaka 567-0047, Japan
*
Author to whom correspondence should be addressed.
Lubricants 2024, 12(4), 139; https://doi.org/10.3390/lubricants12040139
Submission received: 1 March 2024
/
Revised: 12 April 2024
/
Accepted: 15 April 2024
/
Published: 18 April 2024
Abstract
:This study details the mechanical incorporation of graphite particles into the surface of aluminium (Al-1100) to fabricate surface composites using an electrical resistance heating-assisted pressing method. Initially, the aluminium surface is coated with graphite via solution casting. Incorporation is accomplished by locally heating the graphite–aluminium interface with electrical resistance heating and subsequent mechanical pressure application. The magnitude of softening of the aluminium surface can be regulated by process considerations such as the applied current and heating duration. Microstructural assessment of the aluminium–graphite composite was conducted using SEM, TEM, Raman spectroscopy, and XRD. The surface mechanical properties and reduced Young’s modulus were improved by more than 200% and 150%, respectively. A detailed tribological study was conducted, and the study suggested that the wear resistance and COF improved by more than 50%. The progress in wear resistance and COF is corroborated by the microstructural changes in the matrix suggested by the Raman spectroscopy and XRD results.
1. Introduction
Aluminium alloys are significantly favoured in aviation and automotive industries owing to their exceptional strength by weight proportion and outstanding thermal conductivity. Within the automotive sector, aluminium alloys are predominantly utilised in reciprocating and rotating components like pistons, brake rotors, driveshafts, and cylinder liners along with various other critical components across automotive and aerospace applications. However, the inadequate tribological behaviour exhibited by aluminium and its alloys can potentially cause component failure under unfavourable situations. To mitigate friction, wear, and associated failures, researchers typically employ solid and liquid lubricants. However, the pursuit of an ideal lubricant that not only decreases friction and wear but also prevents biohazards and chemical additives remains a significant question. These challenges have prompted researchers to explore MMCs (metal matrix composites), especially AMCs (aluminium matrix composites), which offer low density, excellent corrosion resistance, thermal conductivity, and comparatively low production costs. Although monolithic aluminium alloys boast elevated specific strength, their subdued hardness and inadequate wear properties limit their suitability in demanding mechanical environments. Hence, to enhance the tribological characteristics of aluminium and its alloys numerous efforts have been made to incorporate reinforcements such as carbides [1], oxides [2], and intermetallics [3]. Nevertheless, the presence of carbides and oxides within the aluminium matrix results in significant thermal internal stresses owing to the substantial disparity in thermal expansion coefficients. Utilizing intermetallics as reinforcements results in lowered internal stresses, but at the same time, they do not confer self-lubricating characteristics.
From examination of the latest reinforcements, carbonaceous materials have emerged as the most fitting choice due to their array of advantageous properties, including an insignificant thermal expansion coefficient, elevated strength, extraordinary thermal conductivity, self-lubricating capabilities, and excellent damping properties [4]. These materials can manifest in various forms, including three-dimensional (graphite), two-dimensional (graphene), and one-dimensional (CNT) materials. Many researchers have delved into the self-lubricating effects of graphite, a three-dimensional carbon form, in aluminium matrix composites (AMCs) [4,5,6,7,8,9,10,11,12,13].
Various approaches have been employed by different researchers for the production of aluminium–graphite composites. The methods used for fabricating these composites can be mostly arranged under two sets: (i) solid-state methodology [14,15,16,17,18] and (ii) liquid-state methodology [7,19,20]. Although liquid-state processing methods are cost-effective, they encounter challenges like a lack of proper wetting of graphite particles by molten aluminium alloys and disparities in the densities of the two materials. This makes it difficult to introduce and retain graphite particles in the liquid melt, resulting in composite materials with heterogeneous distributions, weak linkage amid the matrix and reinforcements, and interfacial porosity [21]. On the other hand, solid-state processing methods face limitations due to oxidation, material complexity, and size constraints [22].
Research indicates that graphite incorporation reduces the wear rate along with the COF (coefficient of friction) owing to its self-lubricating characteristics in combination with the decreased mechanical performance of the material. When different weight percentages of graphite were added to Al 6016 to fabricate composites, improved wear resistance and deteriorated mechanical characteristics such as compressive and tensile strength were observed [9]. In another study, the fabrication of A356/graphite composite led to improved tribological behaviour but inferior mechanical behaviour [10]. To improve the mechanical behaviour along with the tribological behaviour, graphite particles along with SiC [4] or Al2O3 [23] are used.
The studies mentioned above primarily concentrate on creating bulk composite materials. In this regard, we utilised a simple method involving electrical resistance heating coupled with mechanical induction to fabricate aluminium graphite composites [24]. The current method involves two distinct steps: (a) localised heating, facilitated by a specialised electrical circuit assembly, and (b) mechanical insertion through the application of pressure. The aluminium substrate undergoes localised heating until its surface attains a semisolid position. This solid-state bond formation involving aluminium and graphite occurs at low temperatures and in an exposed environment, leading to enhanced surface mechanical properties. A thorough examination and connection of surface mechanical behaviour with the processing conditions were performed.
2. Materials and Methods
2.1. Materials
This investigation utilised plates of aluminium 1100 alloy with a square geometry and dimensions of 100 × 100 × 1 mm, which were selected as the matrix. The matrix includes almost 0.83% Fe, 0.75% Si, 98.2% Al, and trace amounts of additional constituents as suggested in Table 1, detailing the chemical ingredients of the Al-1100 alloy.
PVA (polyvinyl alcohol) from LOBA Chemie (Mumbai, India) was utilised, with specifications of a pH of 5–7 (0.2% in H2O), a polymerization degree of 1700–1800, and a viscosity of 25–32 cps.
Graphite flakes with a mesh size of 325 were obtained from Alfa Aesar, containing over 98% carbon, less than 0.4% Fe, and less than 0.1% S. Particle size analysis was conducted using the Malvern Instruments Mastersizer 2000 (Malvern Panalytical Ltd., Malvern, UK), employing DLS (dynamic light scattering) to determine particle dimensions (Figure 1). The mean particle dimension resolved through this procedure was realised as 14.159 μm.
2.2. Experimental Setup
The fabrication process for the graphite–aluminium composite involved the use of a heating arising due to electrical resistance and pressing instruments, specifically the ELECTROWELD SP30PR (Electroweld, Mumbai, India) spot welding machine. The operating voltage of this machine is 415 V, the maximum short circuit current is 12 kA, and the power yield (with 50% duty cycle) is 30 kVA. The applied force during the process ranged from 0.098–0.392 MPa [25]. The pressure on the sample from the spot-welding machine was controlled pneumatically, and it was set to 0.224 MPa in the second stage after carrying out several experiments. The composite fabrication process included several steps. First, completely diffused graphite particles and polyvinyl alcohol (PVA) solution were drop-cast onto a shiny, cleared, and etched aluminium surface. The etching was necessary to remove any dirt or oxide layer present over the surface. After etching, the pre-treated Al-substrate was observed to have a surface roughness (Ra) value of 3.451 μm (Figure 2). Subsequently, the coated surface was dried inside an oven maintained for 4 h at 60 °C to eliminate the solvent and establish a fully adhered graphitic layer. The average coating thickness was found to be 100 μm. The insertion step was carried out mechanically utilizing the spot-welding device; with the following parameters: current (1–3 kA), time (0.1–0.7 s), force (1.5–1.96 N), and force application time (1.7 s). The selection of the force application duration was optimised through experiments, which revealed that the optimal properties were achieved with a duration of 1.7 s.
The as-coated aluminium plate was then positioned among the pair of copper electrodes in the experimental setup, serving the multiple purposes of providing support, completing the electrical circuit, and transmitting a specified amount of pressure onto the surface. The transmitted pressure was adjusted pneumatically. During the application of current between the upper and lower electrodes through the aluminium coating, heat was generated at the graphite–aluminium interface due to elevated electrical resistance. The heat generation at the interface was quantified using the equation Q = i2Rt, where Q is the total heat produced, i is the amount of current utilised, R is the interface resistance, and t is the duration for which the current is flown [26]. The interface resistance depends on the applied pressure. With increased applied pressure, the real contact area increases, which helps to decrease the contact resistance [27]. The interface resistance and thus the heat generated was manipulated by altering the applied pressure. The controlled combination of current and duration allowed for the regulation of localised heat production, influencing the softening or melting of the surface. The investigational setup is shown in Figure 3.
2.3. Characterization
Microstructural examination of the as-received powder of graphite and surface-altered aluminium was accomplished using FE-SEM (ZEISS, Bengaluru, India) (field emission scanning electron microscopy) on a ZEISS MERLIN instrument (ZEISS, Bengaluru, India) with an operational voltage of 5 kV. Various current and time settings were employed during the treatment process. EDS (Energy dispersive X-ray spectroscopy) was used to identify the occurrence of different elements and determine their relative quantities in specified zones.
For interface characterization, FEG-TEM (Carl Zeiss Microscope GmbH, Oberkochen, Germany) (high-resolution field emission transmission electron microscopy) was utilised with a JEOL model JEM 2100F instrument (Carl Zeiss Microscope GmbH, Oberkochen, Germany). TEM sample preparation involves mechanical polishing at the beginning to reduce the thickness to approximately 60 μm, followed by dimple formation and ion milling for further thickness reduction.
Raman spectroscopy was carried out by utilizing a HORIBAJOBINYVON T6400 Raman Spectrometer (Jobin Yvon Horiba, Palaiseau, France) accompanied by Olympus microscope and an ArCr laser (wavelength (λ) = 514 nm). This helps in analysing the different bands of graphite particles in both powder and infused states.
XRD (X-ray diffraction) analysis was executed in the span of 5–85° using a PANalytical XPERT PRO (Bruker, Bremen, Germany) with Cukα. The acquired data were investigated using X-pert Highscore software (Version 4) to identify several phases developed during processing under various time and current conditions.
Microhardness tests (HV) were conducted on various samples, including bare aluminium, bare but processed aluminium, and graphite-impregnated aluminium, using an OMNITECH-S-AUTO instrument (OMNITECH, Rajkot, India). The load was chosen as 200 gm along with a dwell period of 10 s.
Nanoindentation characterization was performed using a HYSITRON TI 950 Tribo Indenter (Hysitron Inc., Eden Prairie, MN, USA) and a diamond Berkovich indenter (curvature radius ~100 nm). The optimum applied load and loading rate were chosen as 5000 μN and 500 μN/s respectively. The loading as well as unloading periods each lasted for 10 s. Mechanical characterization involved a minimum of 8 indentations on each surface for bare aluminium, bare but processed aluminium, and graphite-infused aluminium.
Tribological investigations were conducted according to ASTM G-99 [28] using a Ducom ball-on-plate wear tester (model: TR-208-M1) (Ducom, Bengaluru, India) in an open environment under ambient conditions. The testing conditions included a normal load of 20 N, a rotational speed of 20 rpm, and a track radius set at 2 mm. The steel ball utilised in the tests had a 2 mm diameter. A Hertz contact pressure of 2349 MPa resulted, with a corresponding contact area of 0.009 mm2. The duration of the test was 20 min.
Frictional wear, also known as abrasive or sliding wear, occurs when two surfaces slide against each other and is characterised by the gradual removal of material from the surface of one or both interacting materials due to frictional forces. Mechanical interaction between the surface asperities due to relative motion results in material removal. This leads to surface degradation and loss of material in the form of debris generation. Several factors can lead to this type of wear such as surface roughness, temperature, pressure, and sliding velocity. To account for the effect of plastic deformation of the material during on geometric wear measurements, tests like mechanical characterization of the material before testing, real-time monitoring, examination of the worn surface under SEM, and post-test profilometry of the worn track were carried out.
3. Results and Discussions
3.1. Microstructural Characterization
Predicting the behaviour of composites requires deep knowledge of the morphology and microstructure of reinforcements, accompanied by the impact of processing parameters on composite morphology. The surface morphology of the Al-1100 samples infused with graphite was inspected through SEM to visualise the effects of processing factors. Figure 4a,b illustrates the microstructural analyses of the as-received powder graphite particles and infused graphite particles. Figure 4a reveals the flaky morphology of the as-obtained powder graphite, while Figure 4b displays the surface of the graphite-inserted Al processed with 2200 A and 0.1 s. Figure 4c shows the cross-sectional view of the graphite-inserted Al. SEM image analysis indicates that the well-infused graphite flakes are securely embedded in the matrix. The EDAX study in Figure 4d confirmed the existence of graphite (17.39 wt.%) and a minor amount of oxygen (1.26 wt.%). The low oxygen content, likely from open environment processing or residual PVA, suggests possible alumina (Al2O3) formation with minimal impact on the material properties. The line scanning carried out on the cross section (Figure 4f) suggested that the graphite particles were embedded to a depth of nearly 200 µm.
TEM (high-resolution transmission electron microscopy) was used to explore the morphology of the powder graphite along with the interfacial microstructure of the graphite–aluminium composite. Figure 4g shows that the TEM image of the powder graphite reveals an undulating and stacked particle structure. The transparent regions indicate a reduced number of layers. The SAED (selected area electron diffraction) pattern (inset of Figure 4g) confirmed the crystallinity of the particle. As shown in Figure 4h,i, the TEM images show well-dispersed and bonded graphite particles in the matrix with no evidence of aggregation. Figure 4i provides a detailed view of the aluminium–graphite composite interface, revealing the absence of a physical gap between the two materials. Three distinct parts are identifiable: the layered carbon structure, aluminium, and the Al–graphite interface. The existence of graphite is supported by the FFT (fast Fourier transform) pattern in Figure 4j of the encircled area in Figure 4i, highlighting the comprehensive characterization of the composite structure.
3.2. Spectroscopic Studies
Figure 5a illustrates patterns of X-ray diffraction (XRD) for unprocessed aluminium (Al), graphite powder, and composites produced under optimal conditions. Unprocessed Al (Figure 5a(i)) exhibits prominent peaks of (111), (200), (220), and (311) at 2θ 38.67°, 44.83°, 65.15°, and 78.26° respectively. Similarly, the XRD pattern of as-received graphite (Figure 5a(ii)) reveals sharp peaks for (002) and (004) at 2θ 26.54° and 54° respectively. Figure 5a(iii–v) present XRD analyses of Al–graphite composites under different processing conditions, showing peak shifts due to residual stresses. The absence of peaks associated with intermetallic compounds like aluminium carbide suggests lower processing temperatures, aided by silicon hindering diffusion between aluminium and graphite [29].
Figure 5b shows the variation in crystallite size for composites produced under different processing parameters. The crystallite dimension was determined by Scherrer’s estimation, t = (K × λ)/(β × Cos(θ)) (where K is Scherrer’s constant, λ is the incident X-ray wavelength, β is the full width at half maximum (FWHM) of the peak, and θ is Bragg’s diffraction angle). The results indicate that the size of the crystallite decreases with increasing current, which is attributed to rapid heating and cooling during fabrication. This fine-tuning occurs during recrystallization, where newly formed crystals develop around reinforced particles, impeding further g rain growth. With decreasing grain size, according to the Hall–Petch equation, = + ( characterises the yield stress, σ0 characterises stress essential for initiating dislocation to move forward, k signifies the material constant, and d denotes the average grain size) strengthens the composite.
Using the XRD results, the lattice strain is determined using the calculation Bstrain = ȵ tan(θ) (where Bstrain signifies peak widening owing to strain in the lattice, ȵ signifies the strain in the lattice, and θ characterises the angle of diffraction). The findings presented in Figure 5b indicate that the information that integration of graphite with matrix induces nonuniform lattice strain, resulting in observable peak shifts [30]. The existence of lattice strain increases the free energy, contributing to the enrichment of the composite’s mechanical properties [31].
The dislocation density of the composites, produced under various processing conditions, is computed from XRD data using a modified Williamson equation [32], as shown in Figure 5c. In the context of the Williamson–Hall peak-widening analysis, the broadening of peaks (∆K nm−1) results from an amalgamation of grain size (0.9/D) and strain (∆KD) outcomes. Thus, it can be expressed as ∆K = (0.9/D) + ∆KD. The Williamson–Hall equation was modified by replacing K with K√C in the equations [32] as follows:
where θ stands for Bragg’s angle, β denotes the FWHM (full width at half maximum), λ characterises wavelength of the incident X-ray, D signifies the particle dimension, density of dislocation is represented by ρ, b denotes the Burgers vector, M is the material constant, C denotes the average contrast factor owing to dislocation strain field, and O—representing the higher-order factor of K√C—is disregarded in this case. For calculation purposes, a value of 3.06 is assigned to M [33].
The slope of the line plotted between and K gives the dislocation density as . Here, m denotes the slope of the line. Figure 5c clearly shows that the density of dislocations rises as the processing condition transition from 1000 A to 2200 A. However, a subsequent shift in the processing conditions, specifically from 2200 A to 3000 A, results in a decrease in dislocation density, possibly attributed to annihilation occurring under elevated temperature conditions.
Defects portray a decisive role in boosting the function of carbon-based materials by influencing their mechanical and electrical properties. Anisotropy in in-plane and out-of-plane paths is heightened by flaws, improving the overall mechanical potential. Raman spectroscopy is commonly employed to analyse nanocrystalline, crystalline, and amorphous carbons [34].
Graphite Raman analysis yields three distinct bands, namely D, G, and 2D. The G band signifies Sp2-hybridised graphite atom in-plane bond expansion. The D peak involves A1g symmetry phonons near the K zone periphery [25,35]. The D band is typically absent in pristine graphite but emerges in the presence of structural flaws. Its strength increases when transitioning from stress-annealed pyrolytic graphite to carbon black over commercial graphite due to factors like disordered carbon atoms and reduced crystallite size. Additionally, the D band intensity highlights imperfections at the edges; in armchair-like conditions, the band strengthens, while in zigzag arrangements, a weaker band is observed. Graphite disturbance offers broadened G and D bands, with the D band exhibiting relatively elevated strength than G band [34,35,36]. The 2D band reveals graphite plane stacking, with distinct properties for 2D and 3D graphitic structures. Information on the layer count, stacking character, and order along the c-axis is inferred from the band strength. A lower intensity suggests graphitization, while a broader 2D band indicates stacking defects [37].
In Figure 6, shows the Raman spectra of graphite in powder form and graphite-introduced aluminium under varying current and time settings. Figure 6(i) displays the Raman spectra of as-received graphite with G, D, and 2D bands at approximately 1573 cm−1, 1344 cm−1, and 2716 cm−1, respectively. For the aluminium–graphite composites fabricated at different conditions (Figure 6(ii–iv)), variations in the D, G, and 2D bands are noted. Band shifting, evident in the comparison of the peaks from the as-received graphite to the infused graphite, indicates that compressive stress was experienced by graphite within the matrix. This shifting provides understandings of the structural changes encouraged by the fabrication process [38]. Compressive stress in graphite particles arises from thermal expansion coefficient (COE) dissimilarities amid the particle and matrix. The heightened ratio between surface and volume of smaller particles accelerates heat dissipation, causing the vicinity around reinforced particles to cool faster, creating compressive stress [39]. In Figure 6, the 2D band in reinforced graphite is wider, indicating structural stacking defects [37].
Table 2 displays the ID/IG and I2D/IG intensity proportions for the D-to-G band and 2D-to-G band, respectively. The intensity relationship between the D and G bands increases when transitioning from as-received graphite to graphite infused in the aluminium matrix under varying current and time conditions. Heat treatment during this process contributes to a heightened intensity, potentially caused by sudden thermal changes affecting disorganised carbon atoms. Graphite particles embedded in aluminium exhibit ends surrounded and enveloped in recrystallised or resolidified Al grains, introducing defects at the particle ends and increasing the ID/IG ratio [40]. The embedded graphite flakes experience stresses owing to the dissimilarity in thermal expansion coefficients among aluminium and graphite, enhancing the D band intensity. The heightened ID/IG relation suggests increased impurity or disorder within the structure [10]. In-plane crystal clustering, gaps, and cracks are the possible deficiencies, and they have detrimental consequences on mechanical characteristics. The intensity relationship between the 2D and G bands (I2D/IG) is a way of measuring the degree of graphitization [26].
3.3. Surface Mechanical Characterization
Figure 7a–c presents an outline of the microhardness values (HV) for bare aluminium and graphite-strengthened aluminium subjected to diverse current and time conditions. Untreated aluminium has a microhardness of 44 HV. Upon processing, aluminium reinforced with graphite particles exhibits improved hardness compared to that of its unreinforced counterpart under corresponding current and time provisions. The optimum bare aluminium hardness is 107 HV at I = 3000 A and t = 0.3 s, while the graphite-reinforced aluminium reaches 140 HV at I = 2200 A and t = 0.1 s.
The depth of indenter penetration for bare and unprocessed aluminium was 13.11 µm. With a processing current of 1000 A, the unreinforced aluminium had a minimum penetration depth of 10.07 µm, whereas the reinforced one had a minimum penetration depth of 9.91 µm. When the processing current was 2200 A, the minimum penetration depths for the unreinforced and reinforced samples were found to be 9.94 µm and 7.35 µm, respectively. With a further increase in the processing current, i.e., 3000 A, the depth of penetration changes to 8.39 µm and 8.12 µm for the unreinforced and reinforced aluminium, respectively.
The nanoindentation results, as shown in Figure 7d,e, reveal a bare unprocessed aluminium hardness of 0.12 ± 0.02 GPa. The hardness of the processed aluminium was consistently greater than that of the unprocessed aluminium across all conditions. Interestingly, the hardness of the graphite-reinforced aluminium sample was lower than that of the bare aluminium according to the nanoindentation results, in contrast to the microhardness results. This discrepancy may be attributed to differences in the applied forces and interaction depths between the two testing methods. Nanoindentation applied a maximum force of 5000 μN, which is significantly lower than the 1.962 N used in microindentation, leading to variations in indentation depth.
The rise in hardness observed in unreinforced aluminium results from surface oxidation during processing in an open environment, along with changes in the grain dimension during the course of dynamic recrystallization. Conversely, in graphite-reinforced aluminium, the presence of graphite particles partially inhibits surface oxidation. Consequently, the heightened hardness in graphite-reinforced aluminium can be attributed, in part, to the collective influence of the following factors: (i) the materialization of oxides/carbides at the aluminium–graphite interface [22], (ii) residual compressive stress as a consequence of disparities in the thermal expansion coefficient amid graphite and aluminium [41], (iii) pinning resulting from graphite particles, and (iv) increase in dislocation density [42]. The Raman, TEM, XRD, and EDS results considered in the preceding sections validate the investigational opinion regarding the upsurge in the surface hardness.
3.4. Tribological Properties
The tribological investigation was conducted in ambient air using a ball-on-plate wear tester under dry sliding conditions. A hardened steel ball (SAE 52100, 848 HV) served as the counterface. The computer carefully measured and recorded the real-time lateral force. Although the temperature of the contact zone was not directly measured during the tribological tests, the literature indicates that the temperature elevation caused by friction remains below 100 °C [43]. The existence of moisture may also have resulted in decreased coefficient of friction and wear [44]. The coefficient of friction (COF) was established by establishing the ratio of the lateral to the normal load. The wear rate was computed by the method (V/F × S), where V represents the wear volume (mm3), F stands for the applied normal load in newtons (N), and S denotes the entire sliding distance in meters (m). The analysis of the profiles of the worn track cross-sections facilitated the determination of the wear volume. The wear volume (V) was computed by multiplying the cross-sectional area (A) of the worn-out track (mm2) by the perimeter (L) of the track (mm).
3.4.1. Specific Wear Rate Analysis
Figure 8a provides a review of the volume wear rates for untreated aluminium, processed aluminium, and aluminium reinforced with graphite, all treated at a current intensity of 1000 A across diverse time intervals. For untreated aluminium, the specific wear rate was measured as 0.25 ± 0.018 × 10⁻² (mm3/N.m). Initially, with an increase in processing time up to 0.3 s, there is a decrease in the specific wear rate for the bare processed Al. However, beyond 0.3 s, as the processing time extends to 0.5 s and then 0.7 s, the specific wear rate escalates. In contrast, for aluminium impregnated with graphite particles, the specific wear rate drops as processing time reaches 0.3 s. However, as the processing period surpasses 0.3 s and extends to 0.5 s and then 0.7 s, the specific wear rate starts to rise. Notably, the aluminium impregnated with graphite exhibited a reduction in the volume wear rate equal to the untreated processed aluminium. Comparing the least wear rate of the processed untreated aluminium with that of treated aluminium, there was a decrease of approximately 66%. Similarly, when comparing the lowest volume wear rate of graphite-infused aluminium with that of untreated aluminium, the reduction amounts to 69%.
At a current intensity of 2.2 kA, bare aluminium demonstrates a drop in the specific wear rate as the time interval increases to 0.5 s. Conversely, for graphite-impregnated aluminium, the wear rate decreases initially at 0.1 s, but with further time increments, it begins to rise (Figure 8b). The lowest wear rate for processed aluminium, recorded at t = 0.5 s, is measured at 0.083 ± 0.005 × 10⁻² (mm3/N.m). Similarly, for graphite-impregnated aluminium, the lowest wear rate is observed at 0.1 s, with a value of 0.072 ± 0.008 × 10⁻² (mm3/N.m). Comparing the lowest wear rate of graphite-induced aluminium with that of bare aluminium, there was a decrease of approximately 71%.
In Figure 8c, the specific wear rate at an elevated current of I = 3000 A displays a consistent trend, reaffirming the observations. This indicates that the addition of graphite results in a slashed specific wear rate compared to both untreated and treated bare aluminium. These findings align with the hardness values previously discussed. For a more comprehensive interpretation of the impact of graphite addition on the tribological characteristics of aluminium, further analysis of the Raman spectra, SEM, and XRD of worn tracks is necessary.
3.4.2. SEM Analysis of Worn Surfaces
SEM images of the worn-out surfaces revealed that both bare Al (Figure 9a,b) as well as treated Al (Figure 9c–h), showcased various macroscopic features such as deep grooves, cracks, and delamination. These features suggest a combination of wear mechanisms including adhesion, abrasion, and delamination. The occurrence of longitudinal grooves indicates acute abrasive wear, likely caused by the significant volume of debris produced in the course of the wear analysis, which can be judged in the sliding direction [45]. The increased debris volume stems from localised adhesion followed by breakdown induced by the work hardening of surface as well as subsurface areas, leading to initiation of cracks. As these cracks propagate and interconnect, they facilitate the removal of material in sheet form. In the wear assessment of bare Al, the frictional temperature rise gives rise to the materialization of alumina on the surface, which is evident from the SEM figures (Figure 9a,b) displaying shiny particles on the worn-out surface. The alumina formed is not firmly attached to the Al surface and can be readily dislodged by abrasive forces. Consequently, debris accumulation on the bare Al surface is substantial, comprising primarily sizable flaky particles. The morphology of the worn out surface (Figure 9a) implies that adhesion predominates as the primary wear mechanism [46].
Upon processing, the aluminium undergoes dynamic recrystallization and grain refinement within the processed zone, facilitated by immediate heating and cooling. These processes enhance the material’s mechanical properties. Additionally, a significant accumulation of dislocations occurs through work hardening in the course of the wear analysis. This accumulation initiates subsurface cracking, which propagates to the surface, ultimately causing delamination of the sample, as shown in Figure 9c,d [47]. The wear morphology observed in the treated aluminium (Figure 9c–h) indicates the involvement of both adhesion and abrasion mechanisms. Evidence of adhesion is derived from the observed metal flow patterns, while the occurrence of deep ploughed grooves within the wear track suggests the contribution of abrasion. Although all wear mechanisms are at play, abrasion emerges as the dominant mode. The materialization of alumina on the surface in the course of processing serves as a solid lubricant, creating a tribolayer at the interface which helps in reducing any direct interaction between the surfaces. This results in a minimal wear rate, as demonstrated in the specific wear rate investigation of modified aluminium (Figure 8a–c). Delamination is also observable within the wear track for the treated aluminium (Figure 9c–h). Furthermore, the wear debris formed is notably smaller in dimension compared to unprocessed Al.
The SEM images in Figure 10a–f depict the worn-out surfaces of the graphite impregnated with Al processed under diverse current and time conditions. In Figure 10a, the occurrence of grooves aligned along the sliding path reveals the activation of the abrasion wear mechanism. Additionally, bright particles, i.e., alumina formed in the course of the test owing to the frictional heat rise can be discerned on the worn surfaces. Upon comparing the worn-out surfaces of modified Al and graphite-infused Al, it becomes evident that the latter exhibits a comparatively cleaner and more homogeneous surface as well as reduced wear debris. Insignificant scratch marks are witnessed on the graphite-infused Al in contrast with the unprocessed Al, which displays significant scratches along with an elevated quantity of debris, delamination, and craters. Adhesive wear marks are also visible on the worn-out surface of the graphite-impregnated Al (Figure 10a). Initially, due to the insufficient availability of graphite particles at the tribosurface, a durable tribofilm fails to form. Consequently, there is extensive metal-to-metal interaction, leading to the formation of adhesive junctions at the points of real contact. These adhesive connections undergo shearing during sliding [11].
The occurrence of grooves on the worn track indicates that the matrix has plastically deformed during sliding, causing the introduction of graphite particles at the interface. Upon compacting with the metal layer, these uncovered graphite particles contribute towards the development of a thin tribolayer at the interface, thereby limiting additional distortion. Moreover, the even distribution of smeared graphite particles on the worn surface impedes additional plastic deformation and reduces the wear rate. However, inspection of the worn-out surface of the composite (Figure 10a) revealed the presence of detached graphite particles, resulting in the development of a nonuniform graphite tribofilm. This inadequately lubricated surface leads to an increased wear rate and heightened plastic deformation of the matrix, culminating in the generation of cracks and delamination, as evident in Figure 10b [47]. The smearing of graphite particles on the worn-out surface is evident in Figure 10b; nevertheless, the limited amount of graphite particles results in insufficient lubrication being provided by the smearing.
The SEM figures of graphite-induced aluminium treated with 2200 A for 0.1 s (Figure 10c,d) exhibit debris, grooves, and detached graphite particles on the worn-out surface. Nonetheless, the dimensions of the grooves in terms of width and depth are smaller than those observed for the graphite-particle-reinforced Al treated at 1000 A and 0.3 s, which suggests elevated wear endurance of the composite because of the growth of graphitic film on the worn surface by graphite particle smearing. This smearing reduces the wear rate and heat generated by friction [7,48]. The interconnected graphite structures and clustered islands serve as a continual supply source for graphite, ensuring the maintenance of the graphite film that has formed [8]. The transfer of graphite particles from the composite to the interface is generally carried out through an adhesive wear mechanism [10]. Additionally, fragmented alumina particles are discernible on the worn surface. In the case of graphite-particle-impregnated Al treated at significantly elevated current settings of 3000 A and 0.3 s (Figure 10e), detached graphite particles are observable on the worn surface, accompanied by debris and delamination. Here, decreased wear resistance of the composite is again observed. This occurs because of the increased amount of graphite that is reinforced into the matrix due to the generation of higher amounts of heat at greater depths. As it has already been proven that more graphite leads to an increased wear rate, a decreased wear rate is observed for the composite [6].
3.4.3. Raman Analysis of Worn Surfaces
Raman spectroscopy examination of the worn-out surface (Figure 11) results in the development of D and G bands, which advocates for a carbon tribolayer on top of the aluminium surface. The G band location review and intensity quotient between the D band and G bands (ID/IG) are communicated in Table 3. A positive shift in the G band location can be attributed to the impregnation of Al into the carbon structure [49] or residual strain experienced by the graphite particles because shear stress occurring at pairing surfaces leads to structural disorder [50]. The debris detected over the worn surface (Figure 10a–f) generates a fluorescence effect, which is the reason behind the absence of the 2D band in the Raman study of the graphite particles [51]. The upsurge in the intensity relationship between the D and G bands (ID/IG) reveals the amplified disorderliness associated with the graphite on the worn sample. Due to this added quantity of exfoliated and fragmented graphite, the particles can be visualised on the worn track. This helps in creating a graphite tribolayer on the surface [52].
3.4.4. Coefficient of Friction (COF)
Figure 12a–c shows the deviations in the COF (coefficient of friction) under diverse processing situations. The typical COF of untreated Al was 0.629 ± 0.007. Upon processing at 1 kA (Figure 12a), the COF deteriorates at the beginning with increasing processing time, but beyond 0.3 s, the COF was discovered to be rising. The minimum COF is 0.492 ± 0.006 under these conditions. Examination of graphite impregnated Al has shown some fascinating results. The average COF estimates decrease. At 1 kA, the minimum COF is experienced after 0.3 s, with a value of 0.341 ± 0.005 (Figure 12a). Likewise, at 2.2 kA (Figure 12b), the least COF of bare aluminium is detected at 0.5 s, and the value is 0.438 ± 0.006. For graphite-infused Al, the least COF is observed at 0.1 s, with a value of 0.143 ± 0.007. With a further increase in the processing current i.e., at 3 kA (Figure 12c), a moderately elevated COF is attained for the graphite-infused Al composite. Nevertheless, at every processing parameter, the COF values for graphite induced Al are inferior compared to those of bare Al. The reduced COF obtained for the composite is because of the soft nature and solid lubrication offered by the graphite. The graphite particles smear over the surface and hinder direct metal-to-metal interactions, which supports enhanced wear resistance and decreased friction. The variation of COF with time is presented in Figure 12d. The noise for the bare Al (Figure 12d(i)) is greater. At the beginning of the test, the COF sharply increased and did not come down until the end of the test. This graph also shows many crests and troughs because of matrix softening arising from frictional heat rise. The greatest amount of debris is generated in this case, which leads to an increased COF. With 1000 A current and 0.3 s processing conditions, the COF versus time curve for the impregnated Al (Figure 12d(ii)) shows few crests and troughs in the beginning, but the variation continues to rise as time increases. The reason for this can be stated as the insufficient supply of graphite particles to the mating surface. The variation of COF with time with impregnated Al at a current of 2200 A and 0.1 s time is represented in Figure 12d(iii). This graph shows few crests and troughs in the beginning. Similarly, for the 3000 A current and 0.3 s conditions (Figure 12d(iv)), little variation can be seen in the beginning, but severe variation in the COF can be observed towards the end of the test. Carrying out wear tests at high load (load >10 N) results in increased ploughing force and increased frictional temperature. The increased ploughing force pulls out the reinforcement to the surface and helps in lowering the COF.
4. Conclusions
Surface alteration of aluminium alloy (Al-1100) involves mechanically embedding graphite particles using the electrical-resistance-heat-assisted pressing technique. This method raises the surface temperature of aluminium to below its melting point, facilitating the creation of a surface composite with graphite particles. It emphasises low-temperature processing in an open environment. Optimal conditions initiate noticeable improvements in the mechanical properties of the Al alloy. Upon analysing multiple experiments, definitive conclusions can be drawn.
- The process of surface heating and infusion of graphite particles into the Al matrix primarily depends on key factors such as current and time. The recommended optimal range is 1–3 kA for current and 0.1–0.7 s for time.
- Microstructural examination confirms the effective incorporation of graphite particles into the Al matrix along with observed oxidation. Other chemical responses and carbide materialisation are less expected due to minimal involvement of processing temperatures, indicating that the bonding amid reinforcement and matrix is mainly mechanical.
- Raman analysis reveals upward shifts in band frequencies and increased intensity, indicating compressive stress on graphite particles due to elevated heat. XRD investigation demonstrates alterations in grain structure and enhanced lattice strain, a consequence of varied heat exposure.
- Under optimal processing conditions, graphite-infused aluminium exhibits 2.1 times increase in microhardness due to various strengthening mechanisms from the presence of graphite particles. However, nanoindentation experiments suggest that the surface mechanical properties of graphite-infused aluminium are poorer to those of unprocessed aluminium.
- The wear test results indicate that graphite impregnation enhances the wear resistance of aluminium. Both the specific wear rate and the coefficient of friction (COF) of the graphite-infused aluminium decrease by over 50% as a result of graphite particles smearing across the wear track.
Author Contributions
Conceptualization, B.S.; Methodology, B.S.; Formal analysis, B.S.; Investigation, B.S.; Resources, A.S.; Data curation, A.S.; Writing—original draft, B.S.; Writing—review & editing, J.P. and A.S.; Visualization, J.P. and A.S.; Supervision, J.P. All authors have read and agreed to the published version of the manuscript.
Funding
This research received no external funding.
Data Availability Statement
All the data are represented in this paper.
Conflicts of Interest
The authors declare no conflict of interest.
References
- Alpas, A.T.; Zhang, J. Effect of SiC particulate reinforcement on the dry sliding wear of aluminium-silicon alloys (A356). Wear 1992, 155, 83–104. [Google Scholar] [CrossRef]
- Kok, M. Production and mechanical properties of Al2O3 particle-reinforced 2024 aluminium alloy composites. J. Mater. Process. Technol. 2005, 161, 381–387. [Google Scholar] [CrossRef]
- Walker, J.C.; Rainforth, W.M.; Jones, H. Lubricated sliding wear behaviour of aluminium alloy composites. Wear 2005, 259, 577–589. [Google Scholar] [CrossRef]
- Garg, H.K.; Sharma, S.; Kumar, R.; Manna, A.; Dwivedi, S.P.; Abbas, M.; Kumar, A.; Khan, M.I.; Bisht, Y.S. Mechanical, tribological, and morphological properties of SiC and Gr reinforced Al-0.7Fe-0.6Si-0.375Cr-0.25Zn based stir-casted hybrid metal matrix composites for automotive applications: Fabrication and characterizations. J. Mater. Res. Technol. 2024, 28, 3267–3285. [Google Scholar] [CrossRef]
- Liu, Y.; Rohatgi, P.K.; Ray, S. Tribological characteristics of aluminum-50 Vol Pct graphite composite. Metall. Trans. A 1993, 24, 151–159. [Google Scholar] [CrossRef]
- Sharma, P.; Paliwal, K.; Garg, R.K.; Sharma, S.; Khanduja, D. A study on wear behaviour of Al/6101/graphite composites. J. Asian Ceram. Soc. 2017, 5, 42–48. [Google Scholar] [CrossRef]
- Baradeswaran, A.; Perumal, A.E. Wear and mechanical characteristics of Al 7075/graphite composites. Compos. Part B Eng. 2014, 56, 472–476. [Google Scholar] [CrossRef]
- Akhlaghi, F.; Zare-Bidaki, A. Influence of graphite content on the dry sliding and oil impregnated sliding wear behavior of Al 2024—Graphite composites produced by in situ powder metallurgy method. Wear 2009, 266, 37–45. [Google Scholar] [CrossRef]
- El-Sayed Seleman, M.M.; Ahmed, M.M.Z.; Ataya, S. Microstructure and mechanical properties of hot extruded 6016 aluminum alloy/graphite composites. J. Mater. Sci. Technol. 2018, 34, 1580–1591. [Google Scholar] [CrossRef]
- Akhil, M.G.; Manoj, V.; Suja, P.; Rajan, T.P.D. Squeeze infiltration processing of lightweight smart aluminum graphite functionally graded composite for enhanced wear resistance. J. Manuf. Process. 2023, 104, 177–188. [Google Scholar] [CrossRef]
- Hasan, M.S.; Kordijazi, A.; Rohatgi, P.K.; Nosonovsky, M. Machine learning models of the transition from solid to liquid lubricated friction and wear in aluminum-graphite composites. Tribol. Int. 2022, 165, 107326. [Google Scholar] [CrossRef]
- Yi, L.-F.; Noguchi, K.; Liu, L.; Otsu, A.; Onda, T.; Chen, Z.-C. Deformation behavior of graphite and its effect on microstructure and thermal properties of aluminum/graphite composites. J. Alloys Compd. 2023, 933, 167752. [Google Scholar] [CrossRef]
- Mohamad, S.; Liza, S.; Yaakob, Y. Strengthening of the mechanical and tribological properties of composite oxide film formed on aluminum alloy with the addition of graphite. Surf. Coat. Technol. 2020, 403, 126435. [Google Scholar] [CrossRef]
- Deaquino-Lara, R.; Gutiérrez-Castañeda, E.; Estrada-Guel, I.; Hinojosa-Ruiz, G.; García-Sánchez, E.; Herrera-Ramírez, J.M.M.; Pérez-Bustamante, R.; Martínez-Sánchez, R. Structural characterization of aluminium alloy 7075–graphite composites fabricated by mechanical alloying and hot extrusion. Mater. Des. 2014, 53, 1104–1111. [Google Scholar] [CrossRef]
- Zhou, Y.; Li, Z.Q. Structural characterization of a mechanical alloyed Al–C mixture. J. Alloys Compd. 2006, 414, 107–112. [Google Scholar] [CrossRef]
- Son, H.T.; Kim, T.S.; Suryanarayana, C.; Chun, B.S. Homogeneous dispersion of graphite in a 6061 aluminum alloy by ball milling. Mater. Sci. Eng. A 2003, 348, 163–169. [Google Scholar] [CrossRef]
- Pai, B.C.; Rohatgi, P.K. Production of cast aluminium-graphite particle composites using a pellet method. J. Mater. Sci. 1978, 13, 329–335. [Google Scholar] [CrossRef]
- Zamani, N.A.B.N.; Asif Iqbal, A.K.M.; Nuruzzaman, D.M. Mechanical and Tribological Behavior of Powder Metallurgy Processed Aluminum–Graphite Composite. Russ. J. Non-Ferrous Met. 2019, 60, 274–281. [Google Scholar] [CrossRef]
- Krishnan, B.P.; Surappa, M.K.; Rohatgi, P.K. The UPAL process: A direct method of preparing cast aluminium alloy-graphite particle composites. J. Mater. Sci. 1981, 16, 1209–1216. [Google Scholar] [CrossRef]
- Hassan, A.M.; Tashtoush, G.M.; Al-Khalil, J.A. Effect of Graphite and/or Silicon Carbide Particles Addition on the Hardness and Surface Roughness of Al-4 wt% Mg Alloy. J. Compos. Mater. 2007, 41, 453–465. [Google Scholar] [CrossRef]
- Akhlaghi, F.; Pelaseyyed, S.A. Characterization of aluminum/graphite particulate composites synthesized using a novel method termed “in-situ powder metallurgy”. Mater. Sci. Eng. A 2004, 385, 258–266. [Google Scholar] [CrossRef]
- Sahoo, B.; Kumar, R.; Joseph, J.; Sharma, A.; Paul, J. Preparation of aluminium 6063-graphite surface composites by an electrical resistance heat assisted pressing technique. Surf. Coat. Technol. 2017, 309, 563–572. [Google Scholar] [CrossRef]
- Radhika, N.; Subramanian, R.; Venkat Prasat, S.; Anandavel, B. Dry sliding wear behaviour of aluminium/alumina/graphite hybrid metal matrix composites. Ind. Lubr. Tribol. 2012, 64, 359–366. [Google Scholar] [CrossRef]
- Sahoo, B.; Paul, J. Solid state processed Al-1100 alloy/MWCNT surface nanocomposites. Materialia 2018, 2, 196–207. [Google Scholar] [CrossRef]
- Sahoo, B.; Joseph, J.; Sharma, A.; Paul, J. Particle size and shape effects on the surface mechanical properties of aluminium coated with carbonaceous materials. J. Compos. Mater. 2019, 53, 261–270. [Google Scholar] [CrossRef]
- Sahoo, B.; Joseph, J.; Sharma, A.; Paul, J. Surface modification of aluminium by graphene impregnation. Mater. Des. 2017, 116, 51–64. [Google Scholar] [CrossRef]
- Wilson, W.E.; Angadi, S.V.; Jackson, R.L. Surface separation and contact resistance considering sinusoidal elastic–plastic multi-scale rough surface contact. Wear 2010, 268, 190–201. [Google Scholar] [CrossRef]
- ASTM G99-23; Standard Test Method for Wear and Friction Testing with a Pin-on-Disk or Ball-on-Disk Apparatus 1. ASTM: West Conshohocken, PA, USA, 2023; pp. 1–6. [CrossRef]
- Pelleg, J.; Ashkenazi, D.; Ganor, M. The influence of a third element on the interface reactions in metal-matrix composites (MMC): Al-graphite system. Mater. Sci. Eng. A 2000, 281, 239–247. [Google Scholar] [CrossRef]
- Sahoo, B.; Narsimhachary, D.; Paul, J. Tribological Behavior of Solid-State Processed Al-1100/GNP Surface Nanocomposites. J. Mater. Eng. Perform. 2018, 27, 6529–6544. [Google Scholar] [CrossRef]
- Ungár, T.; Leoni, M.; Scardi, P. The dislocation model of strain anisotropy in whole powder-pattern fitting: The case of an Li–Mn cubic spinel. J. Appl. Crystallogr. 1999, 32, 290–295. [Google Scholar] [CrossRef]
- Kishor, R.; Sahu, L.; Dutta, K.; Mondal, A.K. Assessment of dislocation density in asymmetrically cyclic loaded non-conventional stainless steel using X-ray diffraction profile analysis. Mater. Sci. Eng. A 2014, 598, 299–303. [Google Scholar] [CrossRef]
- Adachi, H.; Miyajima, Y.; Sato, M.; Tsuji, N. Evaluation of Dislocation Density for 1100 Aluminum with Different Grain Size during Tensile Deformation by Using In-Situ X-ray Diffraction Technique. Mater. Trans. 2015, 56, 671–678. [Google Scholar] [CrossRef]
- Tuinstra, F.; Koenig, L. Raman Spectrum of Graphite. J. Chem. Phys. 1970, 53, 1126–1130. [Google Scholar] [CrossRef]
- Pimenta, M.A.; Dresselhaus, G.; Dresselhaus, M.S.; Cançado, L.G.; Jorio, A.; Saito, R. Studying disorder in graphite-based systems by Raman spectroscopy. Phys. Chem. Chem. Phys. 2007, 9, 1276–1291. [Google Scholar] [CrossRef] [PubMed]
- Ferrari, A.C.; Robertson, J. Interpretation of Raman spectra of disordered and amorphous carbon. Phys. Rev. B 2000, 61, 14095–14107. [Google Scholar] [CrossRef]
- Wang, Y.; Alsmeyer, D.C.; McCreery, R.L. Raman spectroscopy of carbon materials: Structural basis of observed spectra. Chem. Mater. 1990, 2, 557–563. [Google Scholar] [CrossRef]
- del Corro, E.; Kavan, L.; Kalbac, M.; Frank, O. Strain Assessment in Graphene Through the Raman 2D′ Mode. J. Phys. Chem. C 2015, 119, 25651–25656. [Google Scholar] [CrossRef]
- Sahoo, B.; Narsimhachary, D.; Paul, J. Tribological characteristics of aluminium-CNT/graphene/graphite surface nanocomposites: A comparative study. Surf. Topogr. Metrol. Prop. 2019, 7, 034001. [Google Scholar] [CrossRef]
- Katagiri, G.; Ishida, H.; Ishitani, A. Raman spectra of graphite edge planes. Carbon 1988, 26, 565–571. [Google Scholar] [CrossRef]
- Arsenault, R.J.; Fisher, R.M. Microstructure of fiber and particulate SiC in 6061 Al composites. Scr. Metall. 1983, 17, 67–71. [Google Scholar] [CrossRef]
- Sahoo, B.; Das, T.; Paul, J. Effect of ball milling and subsequent size reduction of graphite flakes on the surface mechanical properties of graphitized Al-1100 alloy. Results Surf. Interfaces 2023, 12, 100134. [Google Scholar] [CrossRef]
- Kestursatya, M.; Kim, J.K.; Rohatgi, P.K. Friction and wear behavior of a centrifugally cast lead-free copper alloy containing graphite particles. Metall. Mater. Trans. A 2001, 32, 2115–2125. [Google Scholar] [CrossRef]
- Imada, Y.; Nakajima, K. Effect of Humidity on the Friction and Wear Properties of Sn. J. Tribol. 1995, 117, 737. [Google Scholar] [CrossRef]
- El-Ghazaly, A.; Anis, G.; Salem, H.G. Effect of graphene addition on the mechanical and tribological behavior of nanostructured AA2124 self-lubricating metal matrix composite. Compos. Part A Appl. Sci. Manuf. 2017, 95, 325–336. [Google Scholar] [CrossRef]
- Jafari, M.; Enayati, M.H.; Abbasi, M.H.; Karimzadeh, F. Compressive and wear behaviors of bulk nanostructured Al2024 alloy. Mater. Des. 2010, 31, 663–669. [Google Scholar] [CrossRef]
- Suh, N.P. The delamination theory of wear. Wear 1973, 25, 111–124. [Google Scholar] [CrossRef]
- Singh, J. Fabrication characteristics and tribological behavior of Al/SiC/Gr hybrid aluminum matrix composites: A review. Friction 2016, 4, 191–207. [Google Scholar] [CrossRef]
- Iqbal, M.W.; Singh, A.K.; Iqbal, M.Z.; Eom, J. Raman fingerprint of doping due to metal adsorbates on graphene. J. Phys. Condens. Matter 2012, 24, 335301. [Google Scholar] [CrossRef]
- Tsoukleri, G.; Parthenios, J.; Papagelis, K.; Jalil, R.; Ferrari, A.C.; Geim, A.K.; Novoselov, K.S.; Galiotis, C. Subjecting a Graphene Monolayer to Tension and Compression. Small 2009, 5, 2397–2402. [Google Scholar] [CrossRef]
- Park, J.G.; Keum, D.H.; Lee, Y.H.; Gil, J.; Hoon, D.; Hee, Y. Strengthening mechanisms in carbon nanotube-reinforced aluminum composites. Carbon 2015, 95, 690–698. [Google Scholar] [CrossRef]
- Choi, H.J.; Lee, S.M.; Bae, D.H. Wear characteristic of aluminum-based composites containing multi-walled carbon nanotubes. Wear 2010, 270, 12–18. [Google Scholar] [CrossRef]
Figure 1.
Particle size variation investigation of as received graphite powder.

Figure 2.
Surface roughness of pretreated Al.
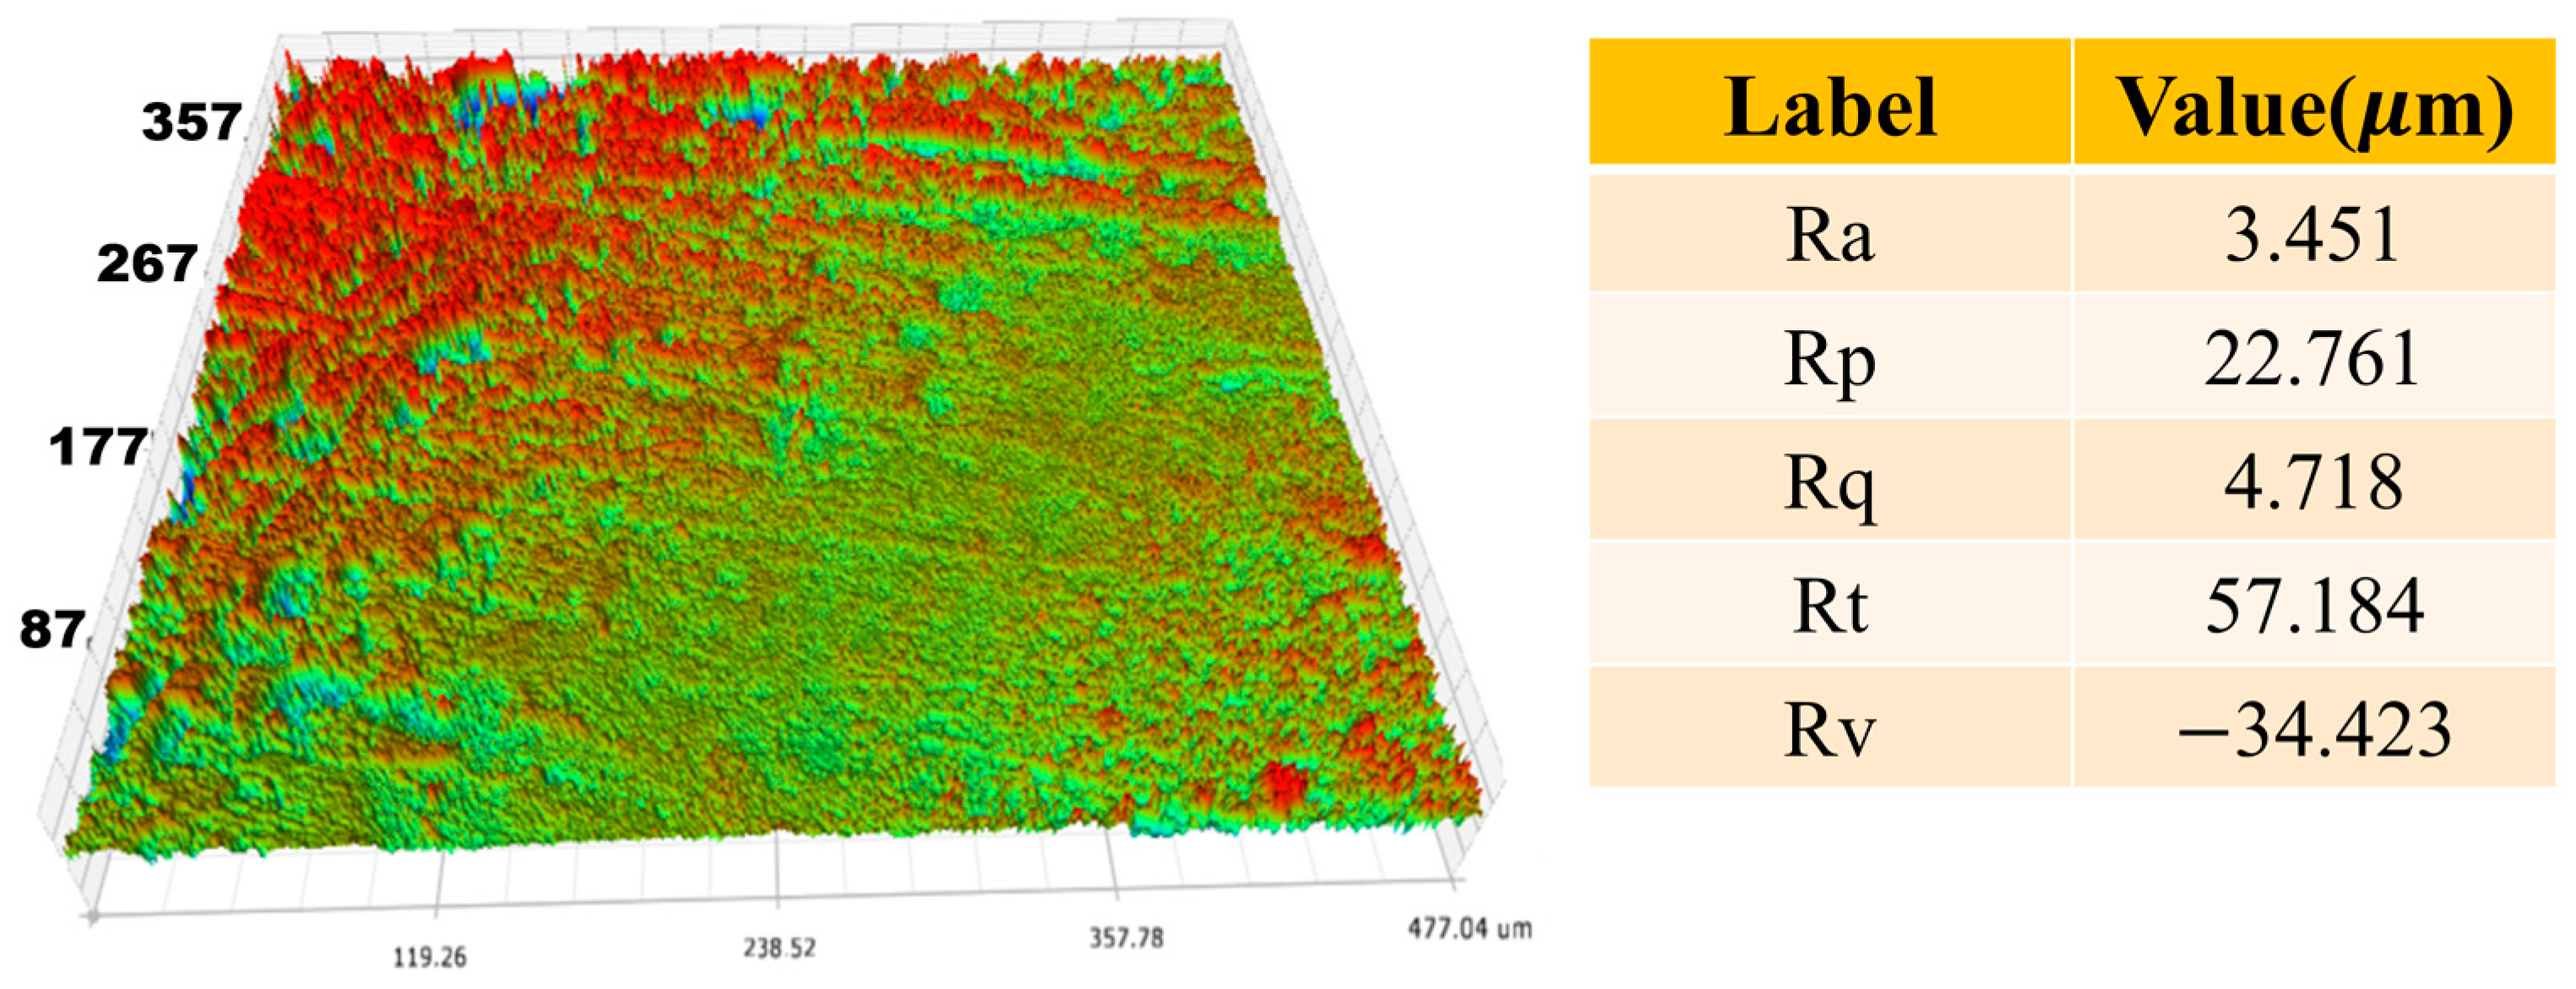
Figure 3.
Experimental illustration for the production of aluminium–graphite surface composite.
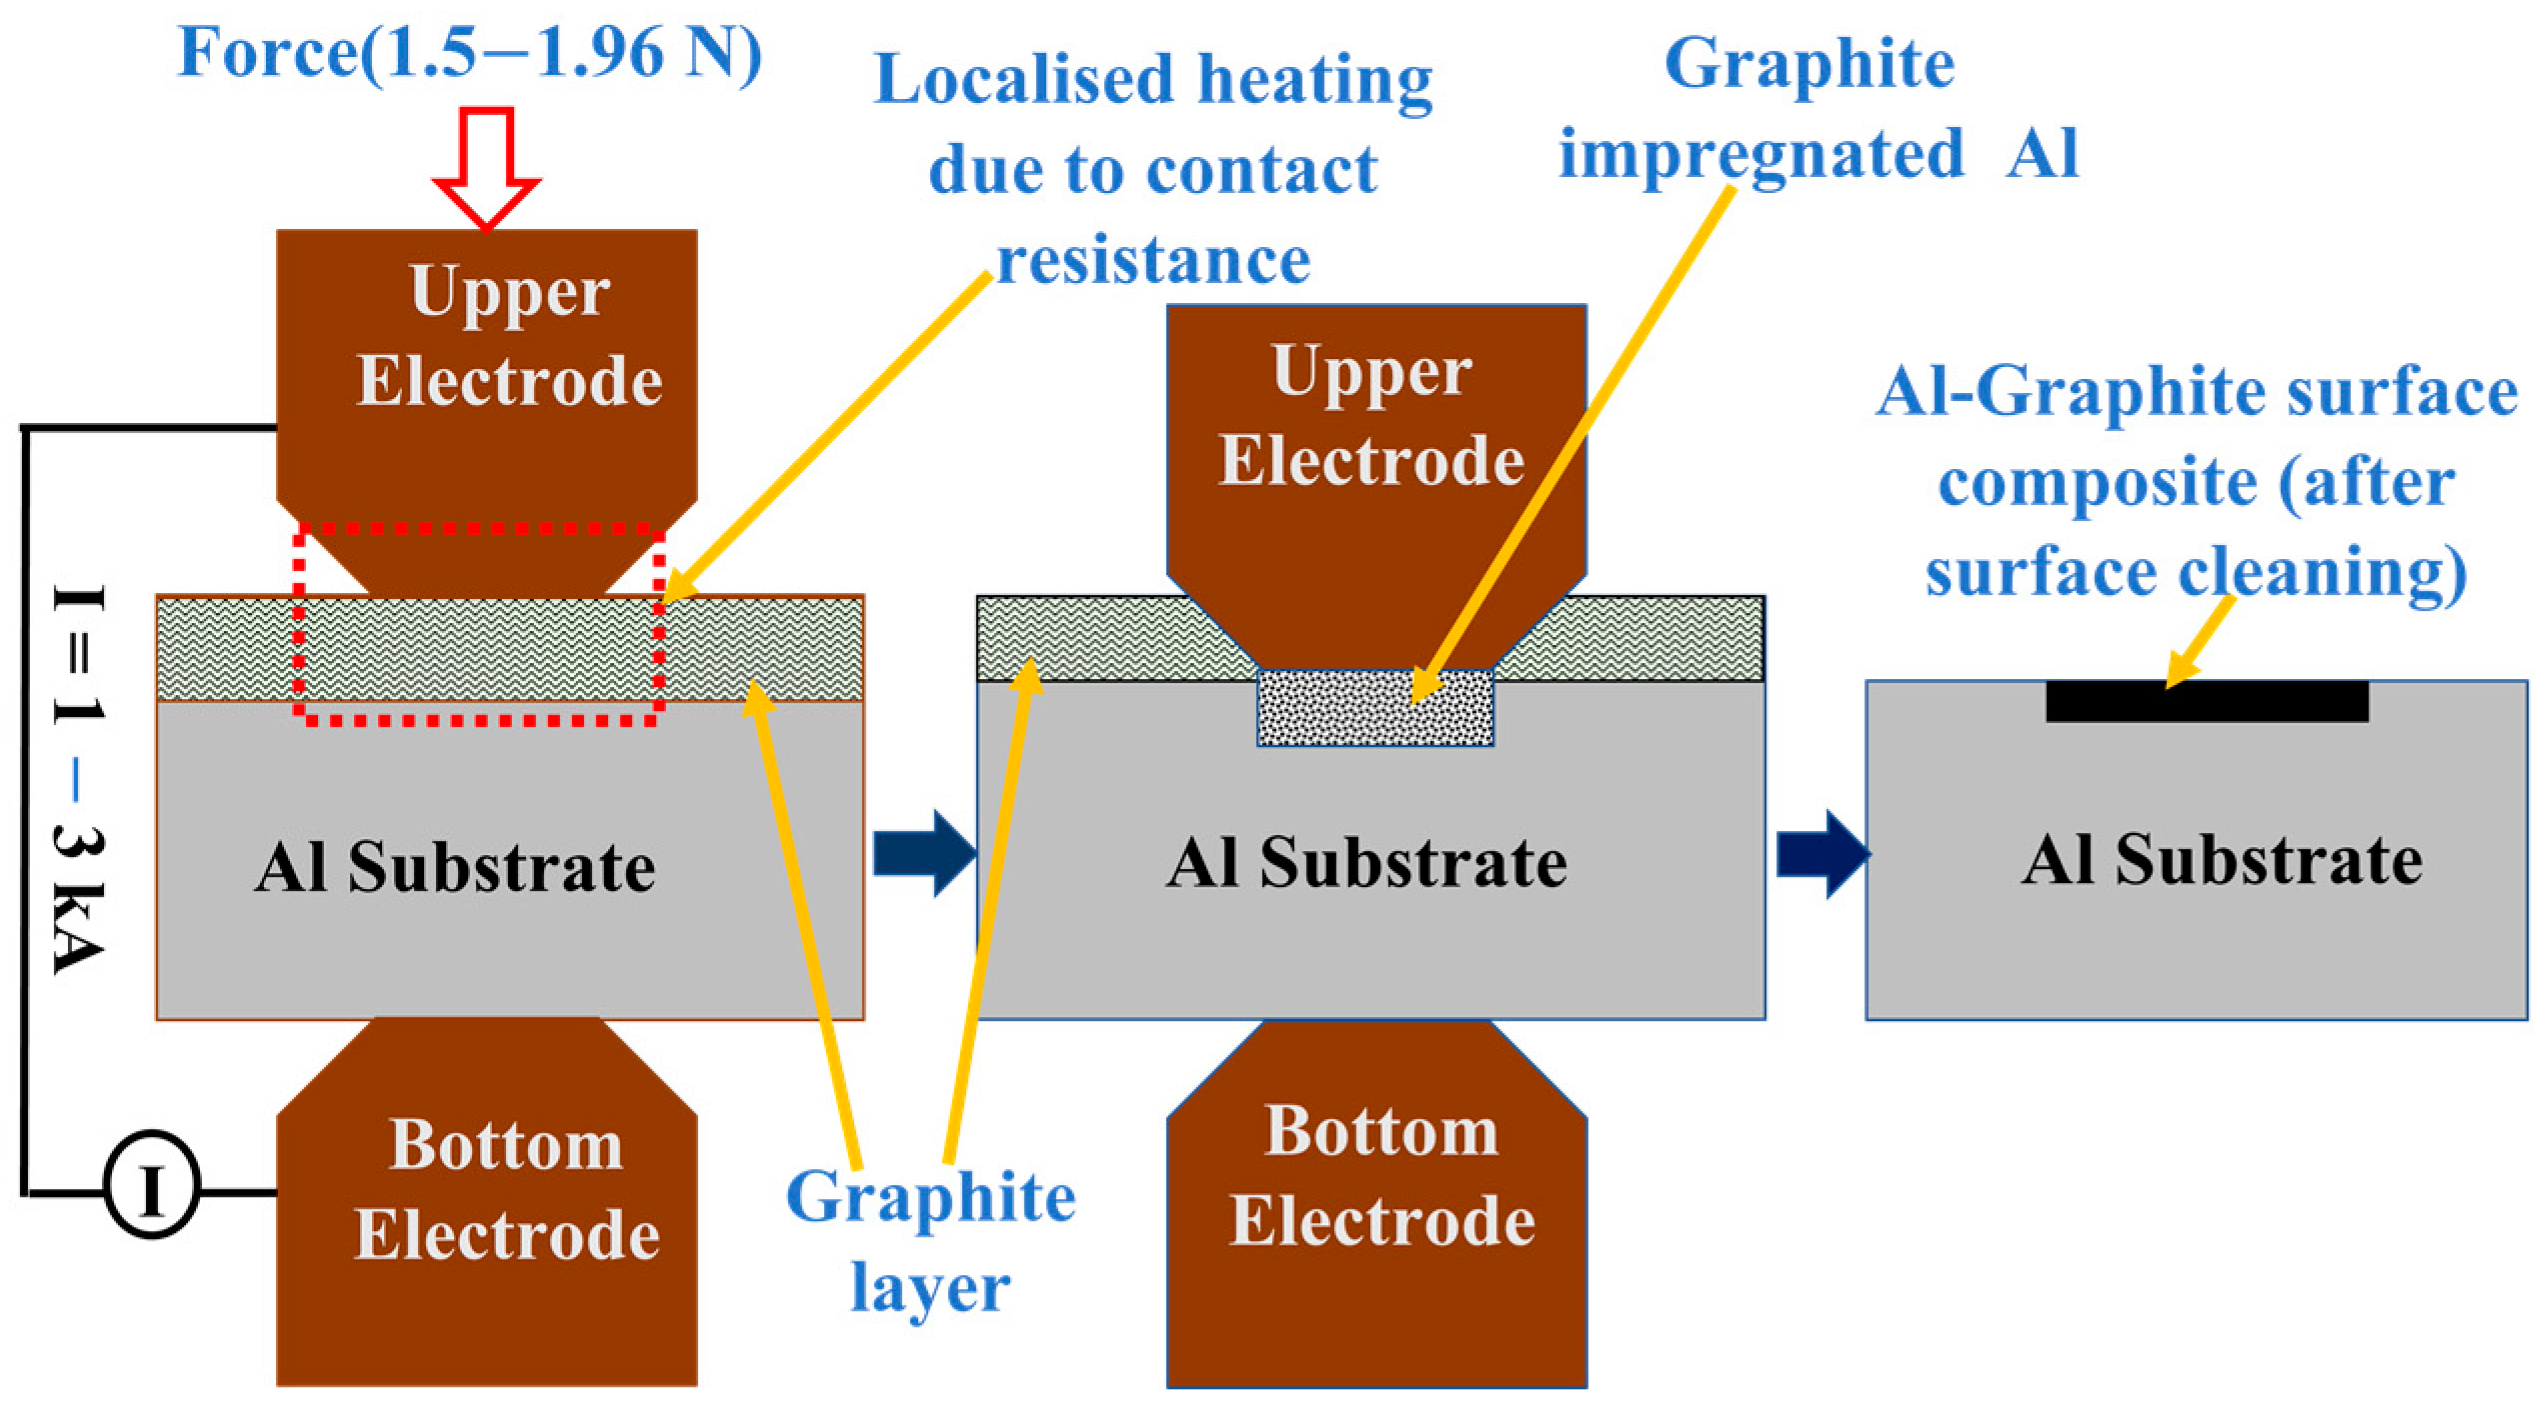
Figure 4.
(a) SEM figure of as-received graphite powder, (b,c) graphite-induced Al treated at 2200 A current and 0.1 s time, (c,e) high and low magnification view of the cross-section (d) EDX of graphite-infused Al, (f) line scan image of the cross section, (g) TEM images of as-received graphite powder, (h,i) aluminium–graphite composite, (j) FFT pattern of the circled area.

Figure 5.
(a) XRD investigation; (b) crystallite size and lattice strain; and (c) dislocation density of (i) unprocessed Al, (ii) powder graphite, and Al–graphite composite fabricated at (iii) 1000 A and 0.3 s, (iv) 2200 A and 0.1 s, and (v) 3000 A and 0.3 s.
Figure 5.
(a) XRD investigation; (b) crystallite size and lattice strain; and (c) dislocation density of (i) unprocessed Al, (ii) powder graphite, and Al–graphite composite fabricated at (iii) 1000 A and 0.3 s, (iv) 2200 A and 0.1 s, and (v) 3000 A and 0.3 s.

Figure 6.
Raman spectrum of (i) graphite powder and Al—graphite composite produced at (ii) 1000 A and 0.3 s (iii) 2200 A and 0.1 s, and (iv) 3000 A and 0.3 s.
Figure 6.
Raman spectrum of (i) graphite powder and Al—graphite composite produced at (ii) 1000 A and 0.3 s (iii) 2200 A and 0.1 s, and (iv) 3000 A and 0.3 s.

Figure 7.
(a–c) Microhardness (HV), (d,e) nanohardness, and reduced Young’s modulus comparison of the uncoated and graphite inserted aluminium produced at I = 1000, 2200, and 3000 A and t = 0–0.7 s.
Figure 7.
(a–c) Microhardness (HV), (d,e) nanohardness, and reduced Young’s modulus comparison of the uncoated and graphite inserted aluminium produced at I = 1000, 2200, and 3000 A and t = 0–0.7 s.
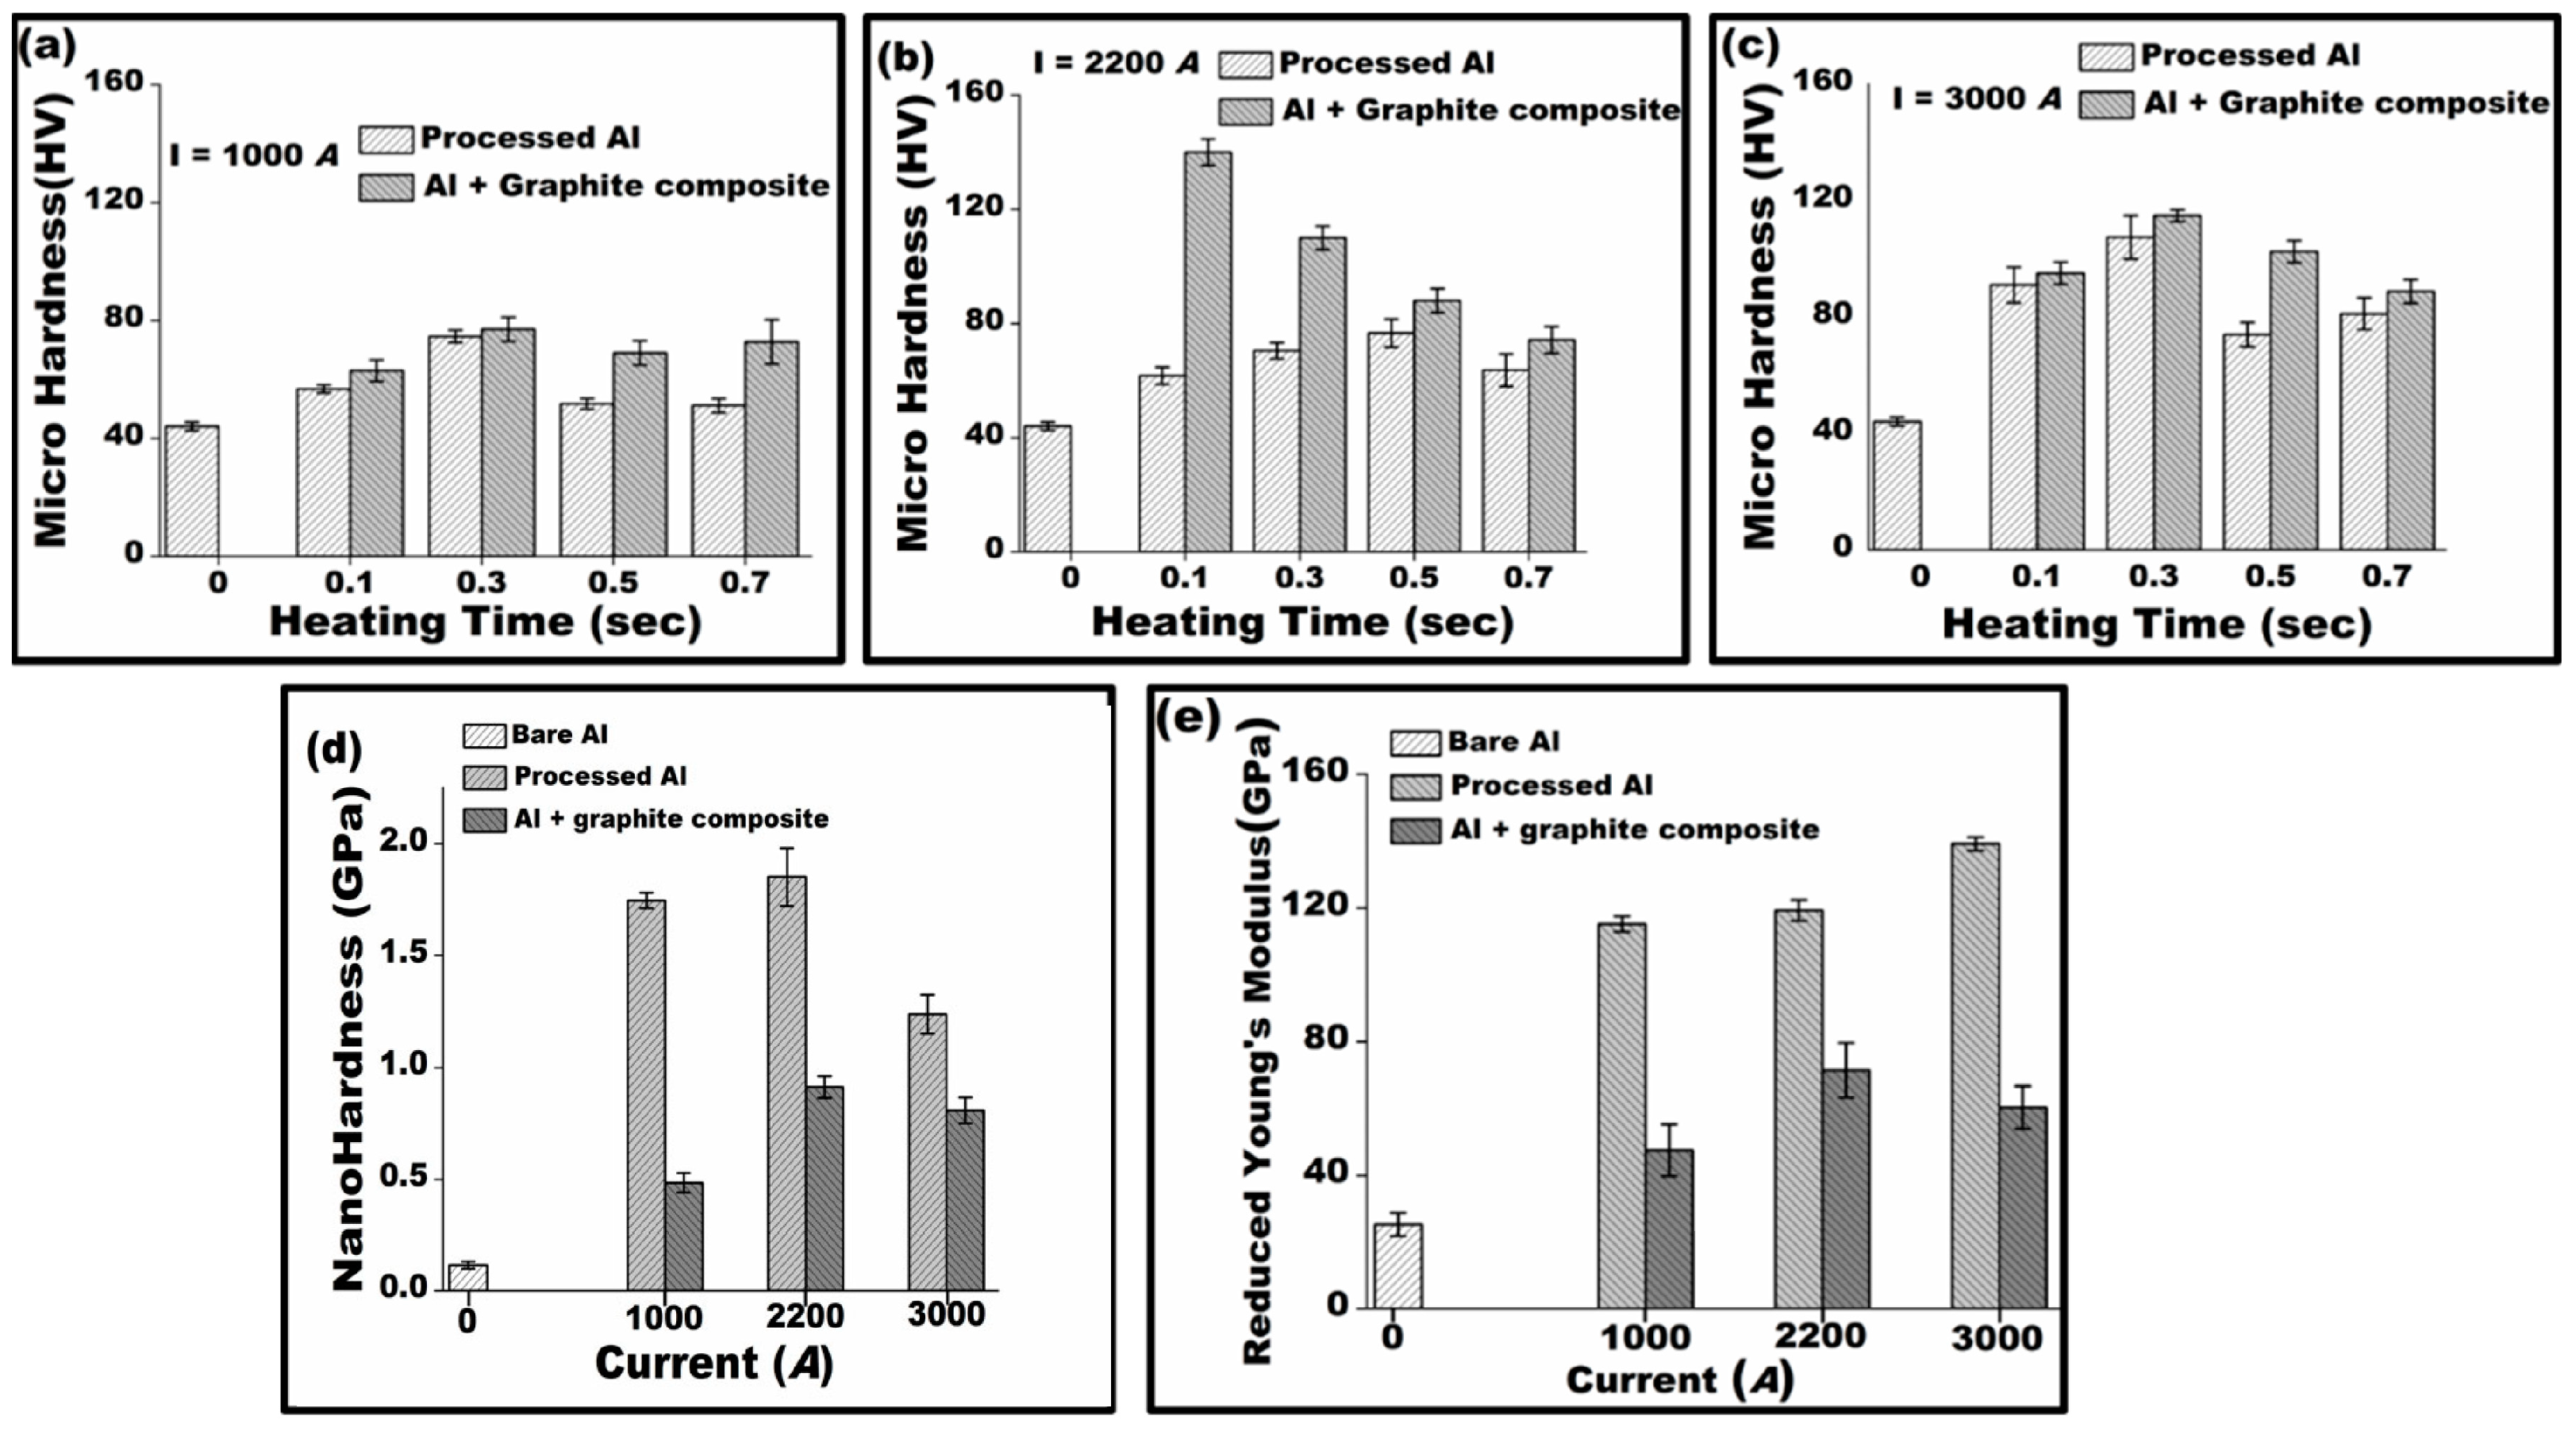
Figure 8.
Comparison of the specific wear rates of untreated aluminium and aluminium induced with graphite particles processed at three different current intensities—(a) 1000 A, (b) 2200 A, and (c) 3000 A over a time duration of 0 to 0.7 s.
Figure 8.
Comparison of the specific wear rates of untreated aluminium and aluminium induced with graphite particles processed at three different current intensities—(a) 1000 A, (b) 2200 A, and (c) 3000 A over a time duration of 0 to 0.7 s.
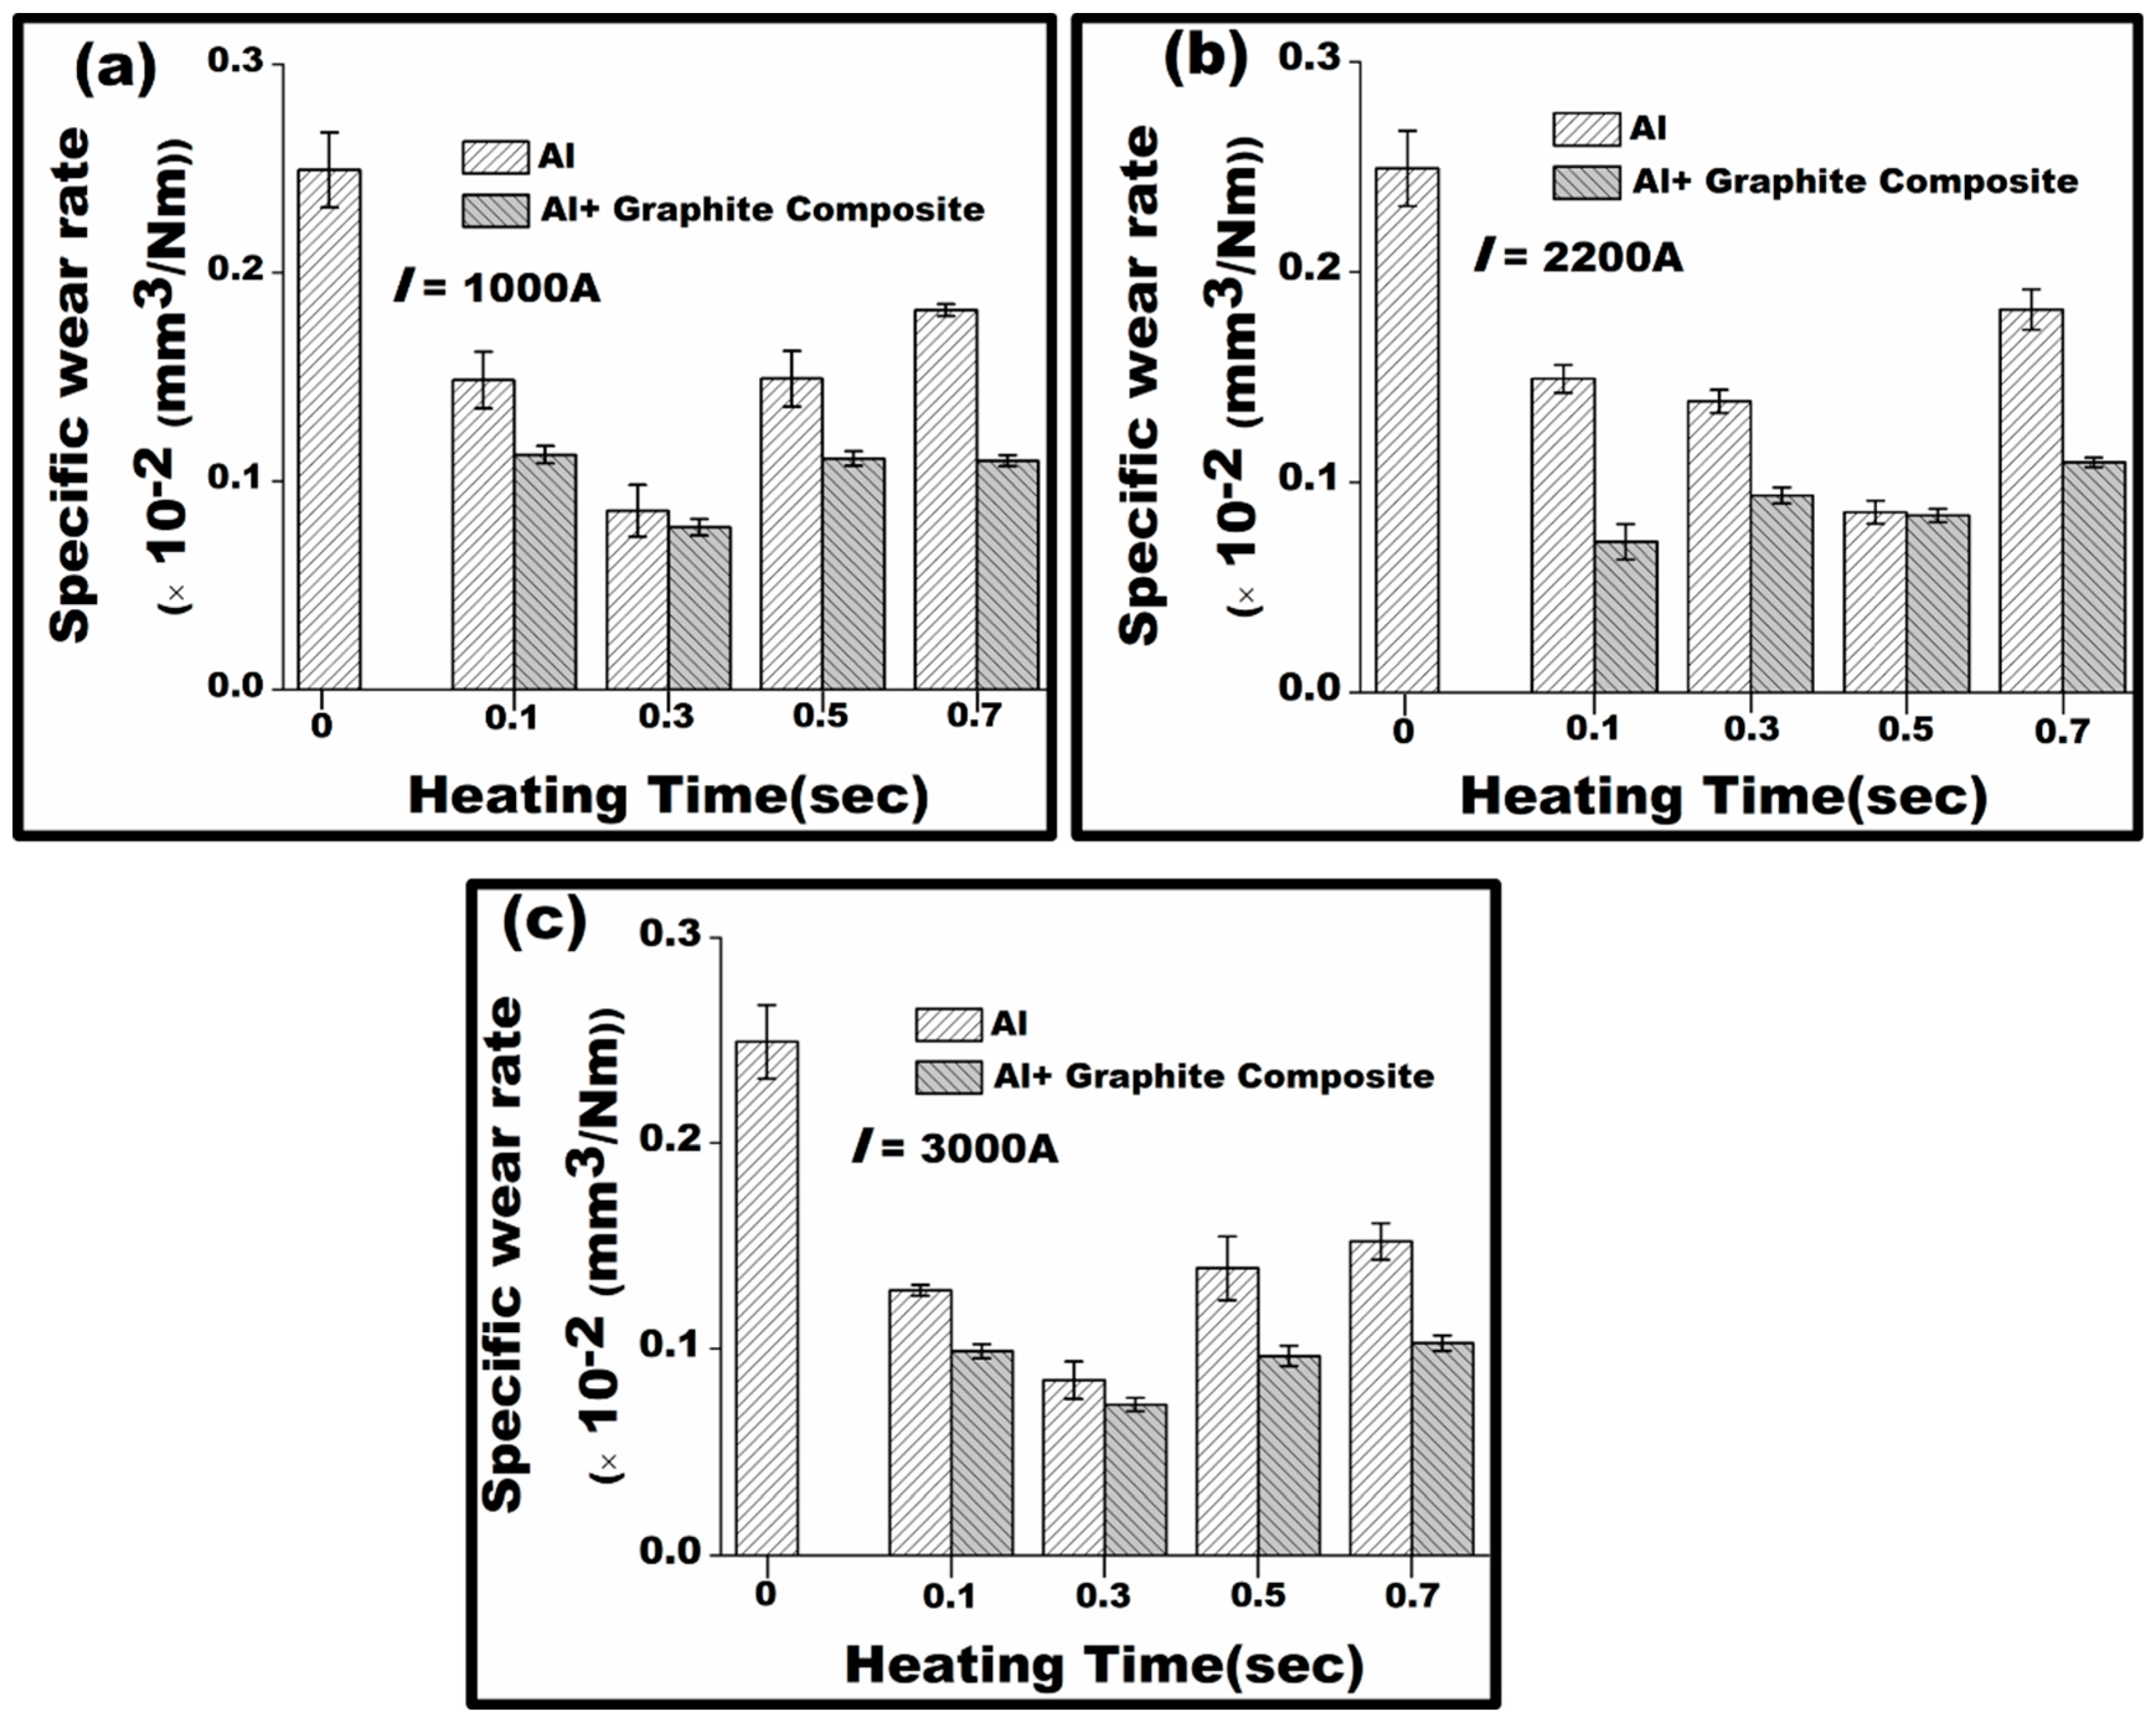
Figure 9.
Wear track SEM images of bare and unprocessed Al (a,b) and bare and processed Al with processing conditions of I = 1000 A and t = 0.3 s (c,d), I = 2200 A and t = 0.3 s (e,f), and I = 3000 A and t = 0.3 s (g,h).
Figure 9.
Wear track SEM images of bare and unprocessed Al (a,b) and bare and processed Al with processing conditions of I = 1000 A and t = 0.3 s (c,d), I = 2200 A and t = 0.3 s (e,f), and I = 3000 A and t = 0.3 s (g,h).

Figure 10.
Wear track SEM images of graphite reinforced Al at (a,b) I = 1000 A and t = 0.3 s (c,d), I = 2200 A and t = 0.1 s (e,f), and I = 3000 A and t = 0.3 s (g–i) and their respective EDS results.
Figure 10.
Wear track SEM images of graphite reinforced Al at (a,b) I = 1000 A and t = 0.3 s (c,d), I = 2200 A and t = 0.1 s (e,f), and I = 3000 A and t = 0.3 s (g–i) and their respective EDS results.

Figure 11.
Raman spectroscopy of worn Al—graphite composite processed at (i) 1000 A and 0.3 s, (ii) 2200 A and 0.1 s, and (iii) 3000 A and 0.3 s.
Figure 11.
Raman spectroscopy of worn Al—graphite composite processed at (i) 1000 A and 0.3 s, (ii) 2200 A and 0.1 s, and (iii) 3000 A and 0.3 s.
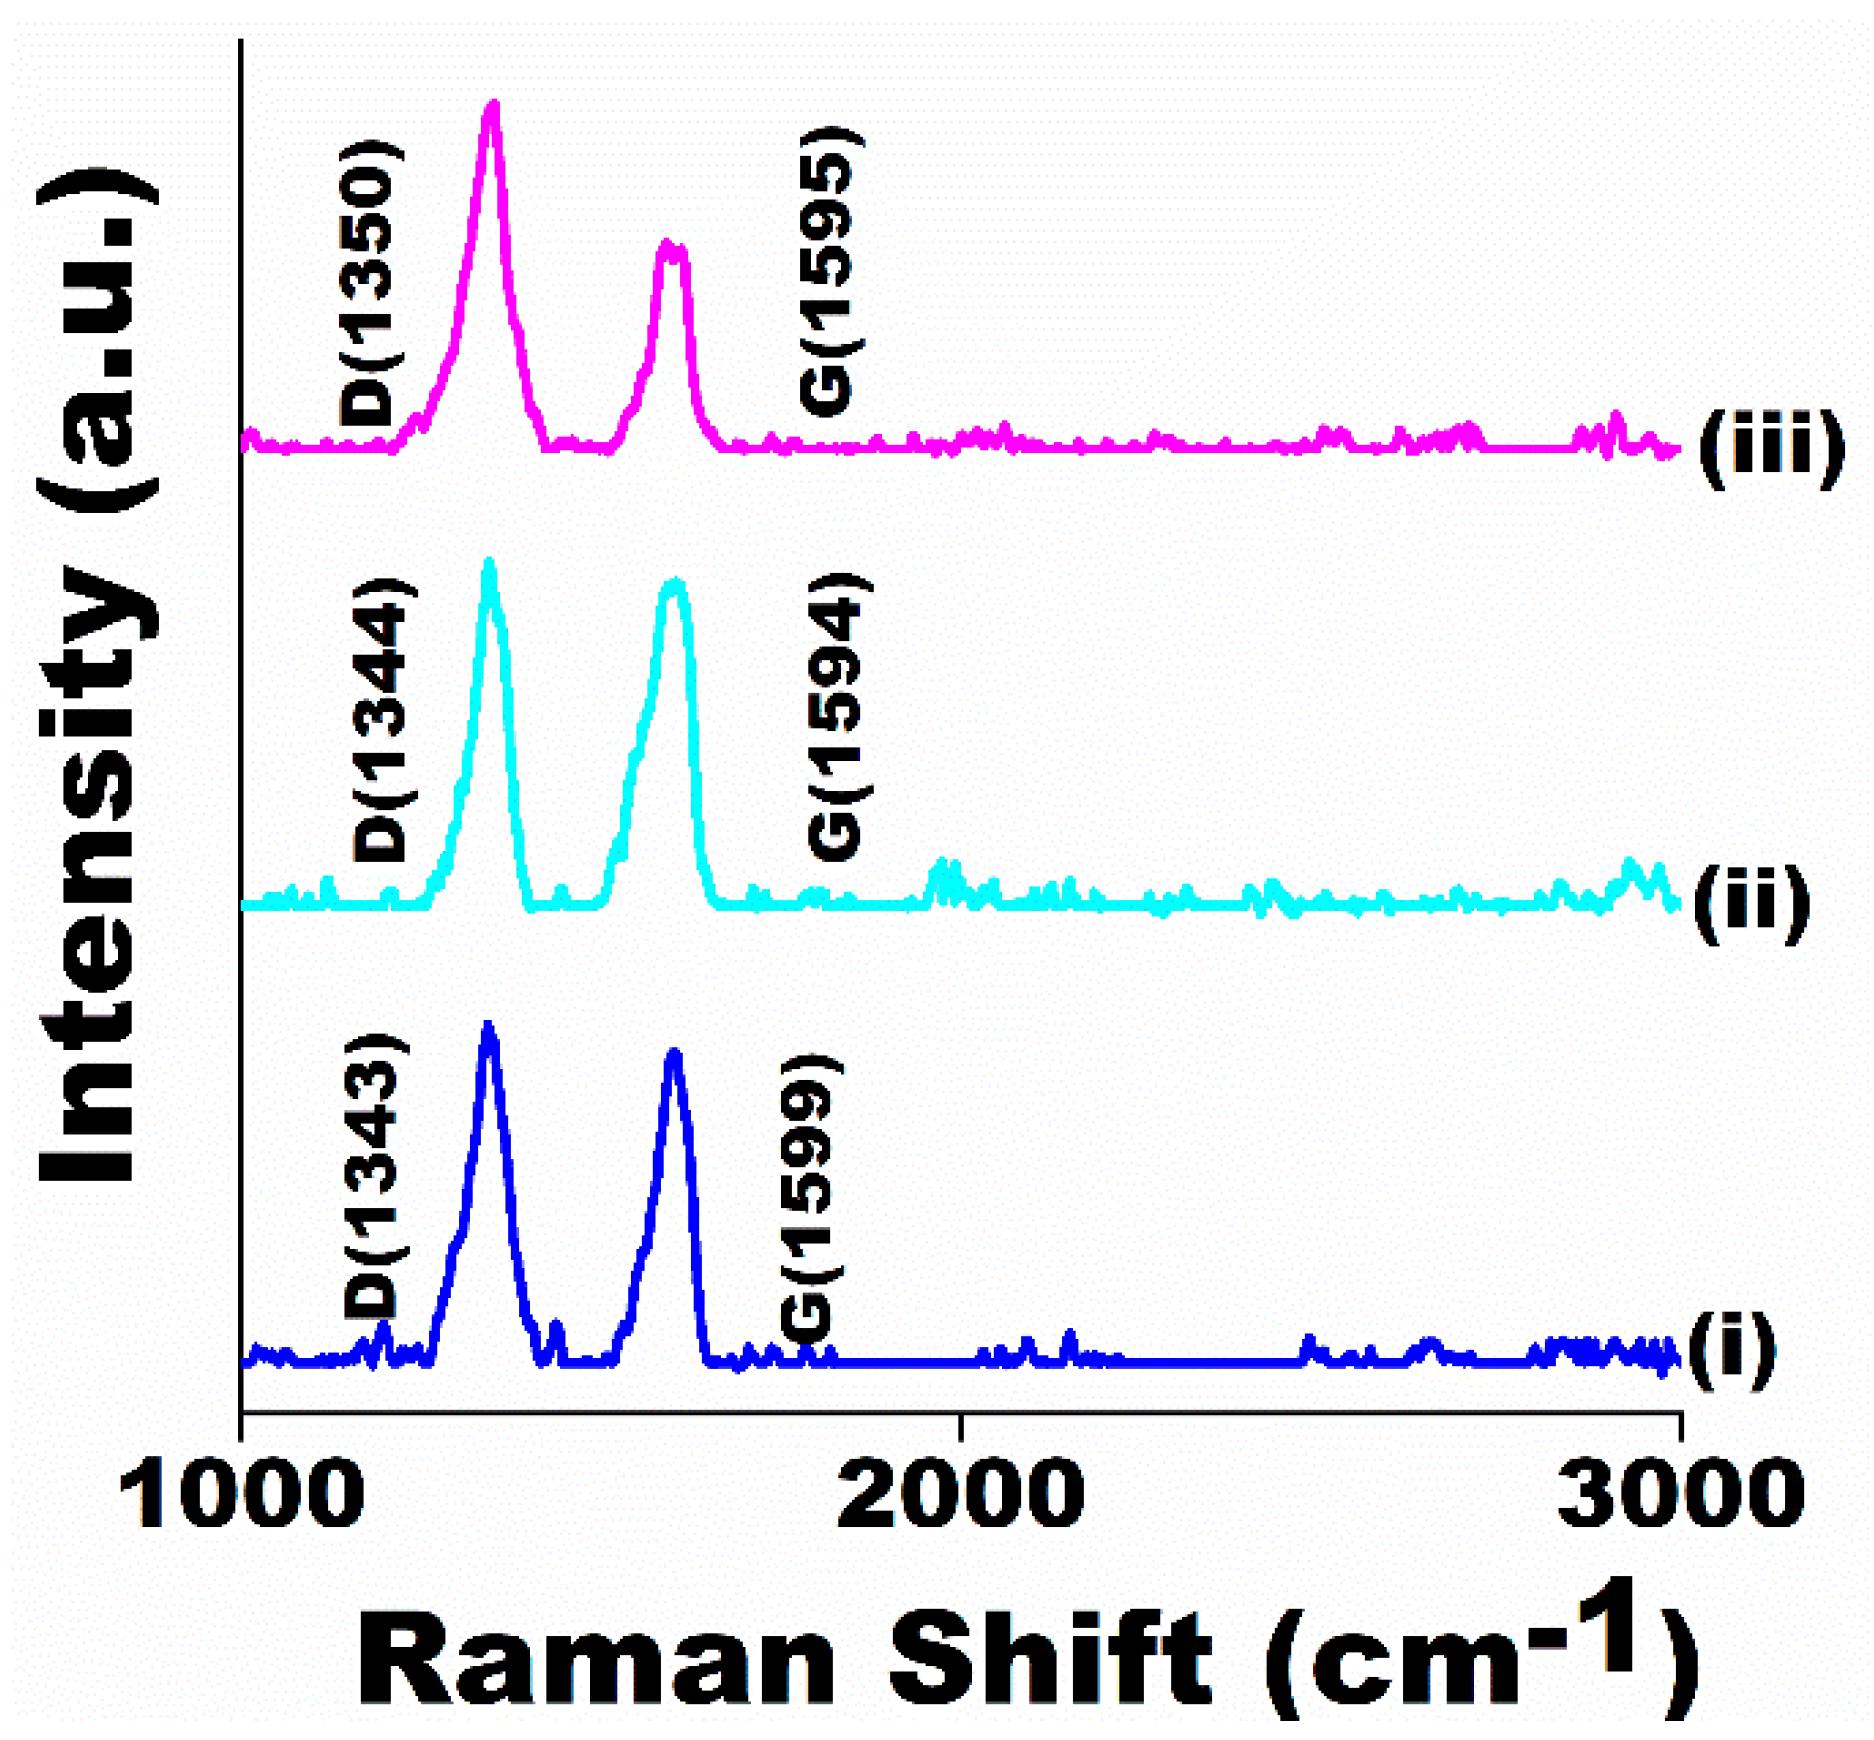
Figure 12.
COF comparison for untreated aluminium and graphite-impregnated aluminium processed at three different currents—(a) 1000 A, (b) 2200 A, and (c) 3000 A—over a time duration of 0 to 0.7 s; (d) variation of COF with time.
Figure 12.
COF comparison for untreated aluminium and graphite-impregnated aluminium processed at three different currents—(a) 1000 A, (b) 2200 A, and (c) 3000 A—over a time duration of 0 to 0.7 s; (d) variation of COF with time.


Table 1.
Chemical constituents of matrix.
| Constituent | Si | Fe | Others | Al |
|---|---|---|---|---|
| Quantity (wt.%) | 0.748 | 0.828 | 0.224 | 98.2 |
Table 2.
Summary of G band location and intensity relations (ID/IG and I2D/IG).
| G Band (cm−1) | ID/IG | I2D/IG | |
|---|---|---|---|
| Graphite | 1573 | 0.113 | 0.327 |
| 1000 A + 0.3 s | 1580 | 0.116 | 0.29 |
| 2200 A + 0.1 s | 1584 | 0.201 | 0.26 |
| 3000 A + 0.3 s | 1586 | 0.5 | 0.238 |
Table 3.
Raman analysis summary before and after wear test.
| Before Wear Test | After Wear Test | |||
|---|---|---|---|---|
| G Band (cm−1) | ID/IG | G Band (cm−1) | ID/IG | |
| 1000 A + 0.3 s | 1580 | 0.116 | 1599 | 1.09 |
| 2200 A + 0.1 s | 1584 | 0.201 | 1594 | 1.07 |
| 3000 A + 0.3 s | 1586 | 0.5 | 1595 | 1.4 |
Disclaimer/Publisher’s Note: The statements, opinions and data contained in all publications are solely those of the individual author(s) and contributor(s) and not of MDPI and/or the editor(s). MDPI and/or the editor(s) disclaim responsibility for any injury to people or property resulting from any ideas, methods, instructions or products referred to in the content. |
© 2024 by the authors. Licensee MDPI, Basel, Switzerland. This article is an open access article distributed under the terms and conditions of the Creative Commons Attribution (CC BY) license (https://creativecommons.org/licenses/by/4.0/).
Share and Cite
MDPI and ACS Style
Sahoo, B.; Paul, J.; Sharma, A. Mechanical and Tribological Behaviour of Surface-Graphitised Al-1100 Alloy. Lubricants 2024, 12, 139. https://doi.org/10.3390/lubricants12040139
AMA Style
Sahoo B, Paul J, Sharma A. Mechanical and Tribological Behaviour of Surface-Graphitised Al-1100 Alloy. Lubricants. 2024; 12(4):139. https://doi.org/10.3390/lubricants12040139
Chicago/Turabian StyleSahoo, Baidehish, Jinu Paul, and Abhishek Sharma. 2024. "Mechanical and Tribological Behaviour of Surface-Graphitised Al-1100 Alloy" Lubricants 12, no. 4: 139. https://doi.org/10.3390/lubricants12040139
Note that from the first issue of 2016, this journal uses article numbers instead of page numbers. See further details here.