Article

Development of a Constitutive Model for Friction in Bulk Metal Forming

1
Institute for Computational Engineering, University of Applied Sciences NTB Buchs, Werdenbergstrasse 4, 9471 Buchs SG, Switzerland
2
Institute of Materials Engineering, TU Dortmund University, Leonhard-Euler-Strasse 2, 44227 Dortmund, Germany
3
V-Research GmbH, Stadtstrasse 33, 6850 Dornbirn, Austria
4
Jansen AG Steel Tubes, Industriestrasse 34, 9463 Oberriet, Switzerland
*
Author to whom correspondence should be addressed.
Lubricants 2018, 6(2), 42; https://doi.org/10.3390/lubricants6020042
Submission received: 13 March 2018 / Revised: 25 April 2018 / Accepted: 25 April 2018 / Published: 28 April 2018
(This article belongs to the Special Issue Tribology in Metal Forming)

Abstract

:
This paper presents a systematic procedure for the development of a constitutive model of friction with focus on the application in bulk metal forming simulations. The empirically based friction model describes friction as a function of sliding distance and the most relevant friction influencing parameters. The latter were determined by means of designed experiments. An optimal friction model is obtained as a trade-off between model accuracy and complexity by using stepwise nonlinear regression and a modified version of the Akaike information criterion. Within this study, the procedure is applied to determine a friction model for tube drawing. However, the same approach can also be used for modeling friction of any other bulk metal forming process.

Graphical Abstract

1. Introduction

The finite element method (FEM) has become a well-accepted and cost-efficient tool for the design and optimization of manufacturing processes in the metal forming industry. To obtain accurate simulation results, an exact description of the material behavior as well as the friction between the workpiece and the tooling is essential [1,2]. However, the modeling of friction in metal forming is a very demanding task since the physical phenomena that occur in the zone of sliding contact are highly complex and usually cannot be described by a simple mathematical function [3,4]. Thus, it is not surprising that, after 500 years of research on friction, following the fundamental experiments of Leonardo da Vinci, no generally valid friction law exists that can be used for the prediction of friction.
The first and probably most popular friction model was proposed by Coulomb [5], based on the experimental work of Amontons [6]. The model assumes that the frictional shear stress is proportional to the contact pressure and independent of contact area and sliding velocity. Following the adhesion theory of Bowden and Tabor [7], the frictional shear stress cannot exceed the shear yield strength k of the workpiece. Thus, friction is overestimated by the Amontons–Coulomb model at high contact pressures. Orowan [8] solved this issue by limiting the frictional shear stress to the shear yield strength of the workpiece, while Shaw et al. [9] proposed a smooth transition from the Amontons–Coulomb model to the limiting shear yield strength. Another popular friction model, often used in metal forming simulation due to its simplicity, is the friction factor model [10]. It describes the frictional shear stress as a constant factor m of the shear yield strength k of the workpiece. However, this model is not very accurate at low contact pressures. This limitation was eliminated by Wanheim and Bay [11] in their general friction model by taking the real area of contact into account.
Based on the adhesion theory, a lot of research activities were focused on the behavior of surface asperities in sliding contact. A review of friction modeling in bulk metal forming in the context of that research activity was published by Nielsen and Bay [12]. Extensive work has also been conducted on the stick–slip friction behavior, which resulted in the development of the rate- and state-dependent friction model [13,14]. A very promising approach in friction modeling is based on multi-scale simulations [15,16,17]. However, for industrial applications, these kind of simulations are currently suitable only to a limited extent since they are computationally expensive and restricted to small cutouts. Thus, the most realistic friction models are still empirically based and obtained by measuring friction under various process conditions [18,19,20]. For this purpose, a variety of customized test rigs have been developed in recent years [21,22,23,24,25,26,27]. Nevertheless, testing and modeling friction is still challenging due to the many parameters of influence and their complex interactions.
The objective of this paper is to present a systematic procedure for testing and modeling of friction with a special focus on the application in numerical simulations. The procedure is based on designed experiments, statistical evaluation, mathematical modeling and optimization using stepwise nonlinear regression. In this way, a mathematical model that accurately describes friction depending on the sliding distance and the most relevant friction influencing parameters is obtained with minimal effort. Within this study, the procedure was applied to determine a friction model for tube drawing. However, the same approach can also be used for modeling friction of any other metal forming process.

2. Materials and Methods

Cold tube drawing is a manufacturing process where the cross-sectional area of a tube is reduced by drawing it through a conical converging die. The tribological conditions in tube drawing are characterized by high contact pressures, moderate surface enlargements, increasing temperatures at high forming velocities and large relative movements between the workpiece and the tooling.

2.1. Test Samples

To simulate such conditions on a pin-on-disk tribometer, special test samples were designed. The test samples were cut from the wall of an original tube made of the medium-carbon steel 34MnB5 to ensure that the material is exactly the same as in the real forming process. The detailed design of the test samples can be found in [27].

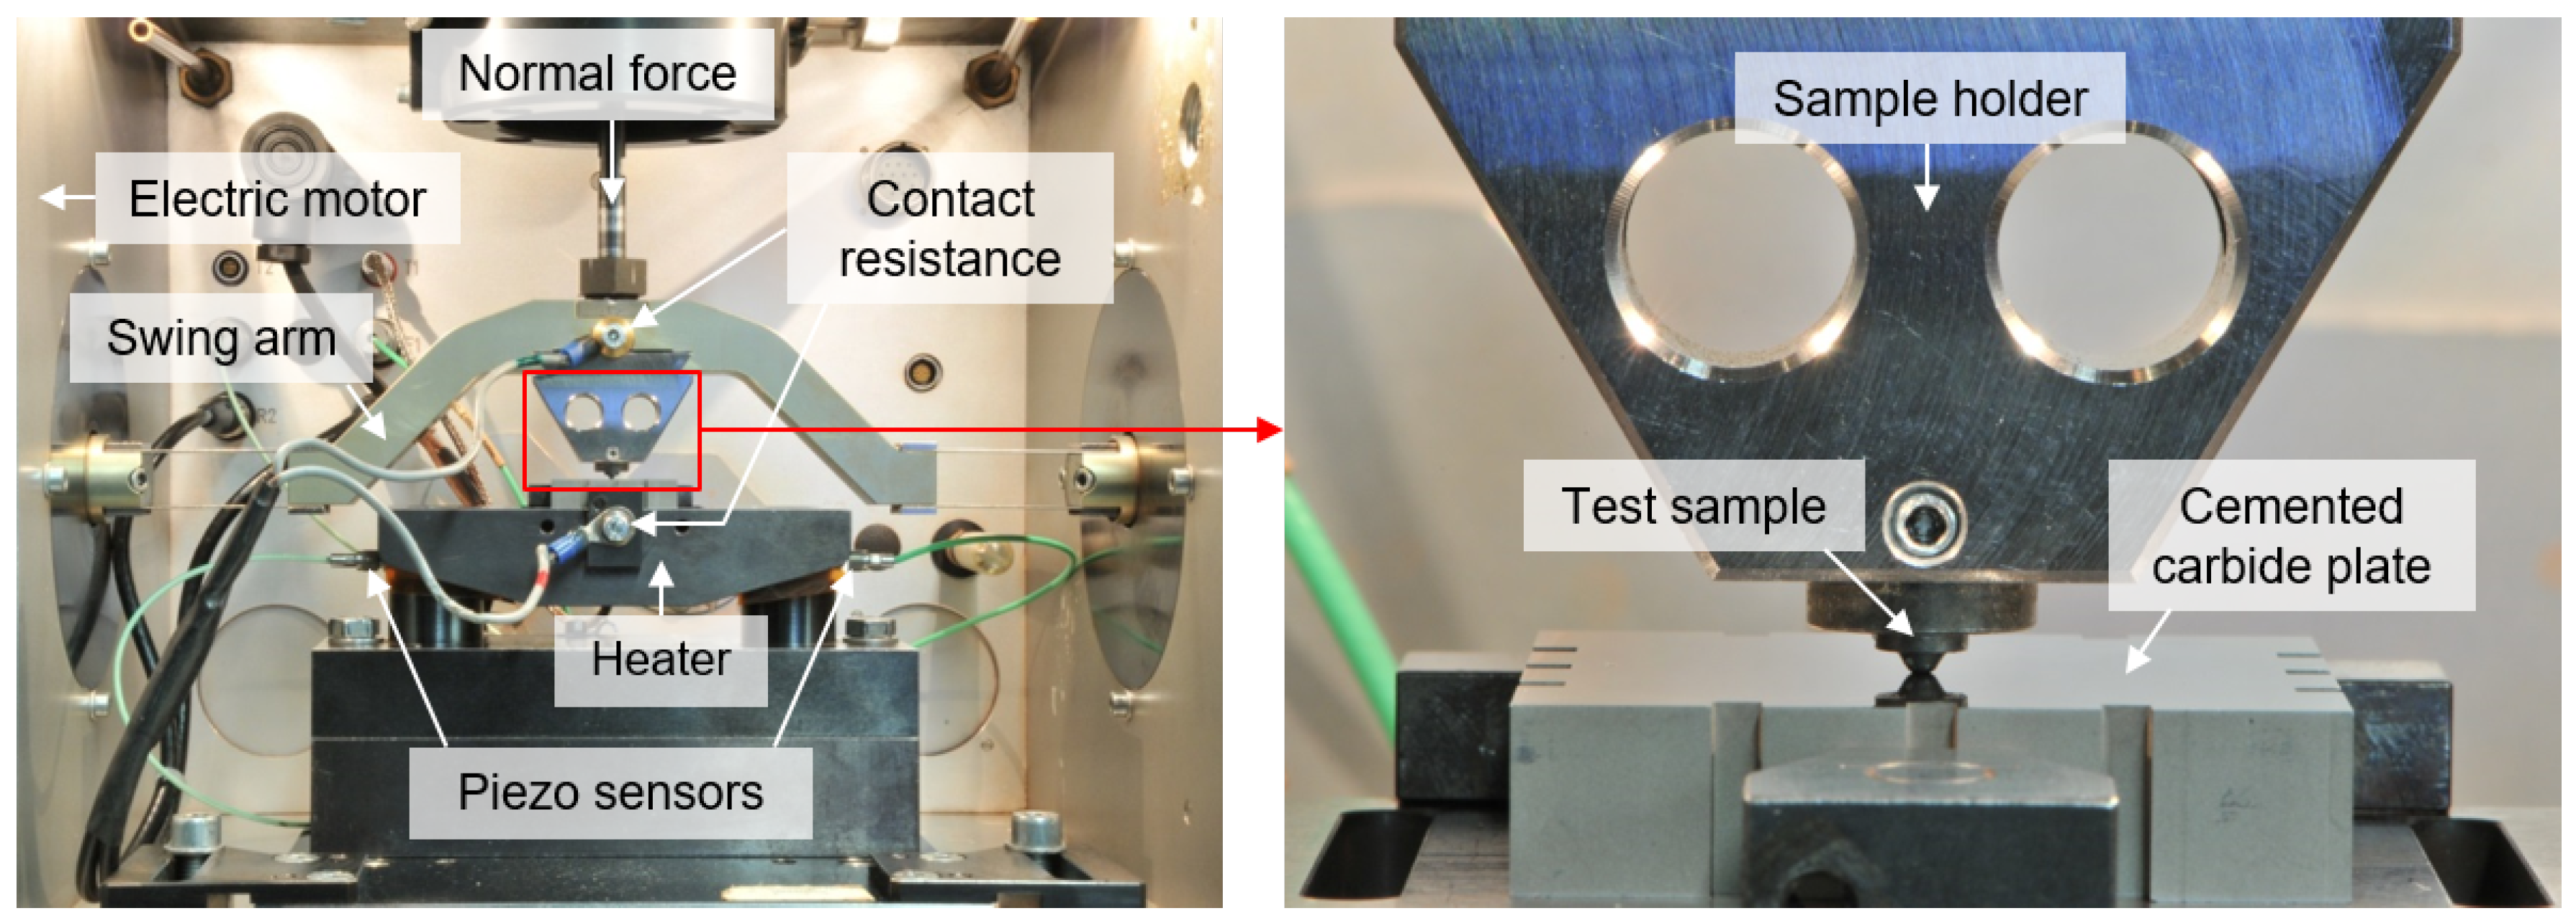
2.2. Pin-on-Disk Tribometer

The tribological tests were performed under laboratory conditions on the SRV4® tribometer (Optimol Instruments Prüftechnik GmbH, Munich, Germany), as shown in Figure 1.
Prior to testing, the load was adjusted according to the experimental design (Section 2.4). Afterwards, the sample was moved over a cemented carbide plate in a linear oscillating motion. The cemented carbide plate (WC > 91.5 wt %, Co = 7.5 wt %) with a medium WC grain size in the range of 0.5–0.9 μ m represented the tooling and was machined by lapping—in the same manner as the tooling in the real application. The frequency of the oscillating motion was 1 Hz with an amplitude of 2 mm and a waiting time of 1 s after each cycle. The movement was produced in a sinusoidal manner with a maximum sliding velocity of around 6.3 mm/s.

2.3. Lubricant System

Prior to testing, the test samples were treated with zinc-phosphate and stearate soap. While the zinc phosphate conversion coating acts as a lubricant carrier and prevents direct solid–solid contact in the case of a lubricant breakdown, the stearate soap enables sliding under low shearing resistance. The main processing steps when applying this kind of lubricant system are pickling, phosphating, neutralizing, lubricating and drying. Pickling and neutralizing were regarded as optional processing steps for cleaning and conditioning the surface.
The samples were treated in chemical process baths under laboratory conditions. After pickling and phosphating, the samples were rinsed with water to stop the chemical reaction. The deposited amount (coating weight) of zinc-phosphate and stearate soap was controlled by the parameters of the baths (e.g., concentration, temperature, and agitation) and the processing time. Detailed information on the control of the coating weights can be found in [28,29,30,31]. It is important to note that during lubricating, part of the stearate soap chemically reacts with the zinc–phosphate coating. This results in a layered lubricant system consisting of zinc–phosphate, zinc stearate soap and sodium stearate soap. After lubricating, some samples were dried to reduce the humidity of the soap.

2.4. Design of Experiments

The parameters which were expected to affect the coefficient of friction in tube drawing are listed in Table 1. Due to the high number of parameters, a screening experiment with only two levels per parameter was performed. It is important that the parameter levels cover the entire range of values possible in the real forming application. Thus, the load values for tube drawing were determined by means of FEM simulations with the commercial software MSC Marc/Mentat® (MSC Software Corporation, Newport Beach, CA, USA). Further details on the selection of the load values can be found in [27].
The velocity was not regarded as a separate parameter. It is well known that an increase of the relative velocity between the workpiece and the tooling leads to an increase of temperature. However, the reduction of the coefficient of friction at high velocities, as it is often observed for lubricants used in bulk metal forming, is rather caused by temperature than by velocity [32]. Further, the effect of velocity is already included in the parameter temperature, which was determined by means of FEM.
To limit the experimental test effort, only the main factors and the most important two-factor interactions were statistically analyzed while higher order interactions were ignored. The most important two-factor interactions were selected by engineering judgment together with process experts. For example, it was assumed that an interaction between the contact pressure and the temperature is very likely, while an interaction between pickling and the humidity of the soap is rather unrealistic. This way, 20 two-factor interactions between pairs of the 10 main factors were selected to be included in the model. Together with the mean value, the underlying regression model consists of n = 31 degrees of freedom. Thus, a 2 I V 10 5 fractional factorial experimental design with 32 runs was adequate to determine the regression constants without aliasing. In addition, eight center point experiments were added to check the linearity assumption attached to the two-level design. Further, each experiment was repeated to check the reproducibility and to estimate the noise more accurately. This resulted in a total of m = 80 experimental runs and an experimental design matrix of the size m × n = 80 × 31 . Theoretical details to the design of experiments can be found in [33].
The experiments were performed with settings according to the randomized experimental design. Typically, a steep increase of the coefficient of friction, indicating the breakdown of the lubricant, occurred during the experiments. If the lubricant breakdown did not occur within a sliding distance of 800 mm, the test was stopped.

3. Results and Discussion

In the following sections, the procedure for friction modeling is presented. To make the procedure more clear for the reader, the main steps are summarized in advance. The steps are:
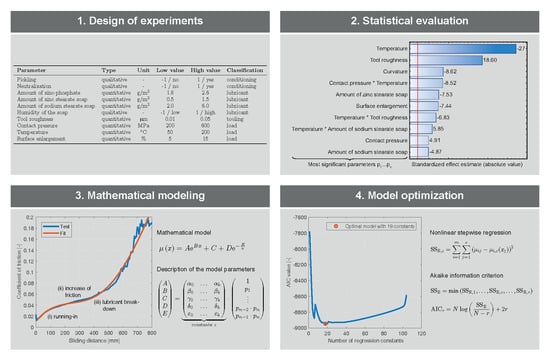
  • Perform the experiments based on the randomized experimental design.
  • Identifiy the friction influencing factors by statistical evaluation.
  • Determine a mathematical function that can describe the measured friction curves.
  • Build a global friction model as a function of the friction influencing factors.
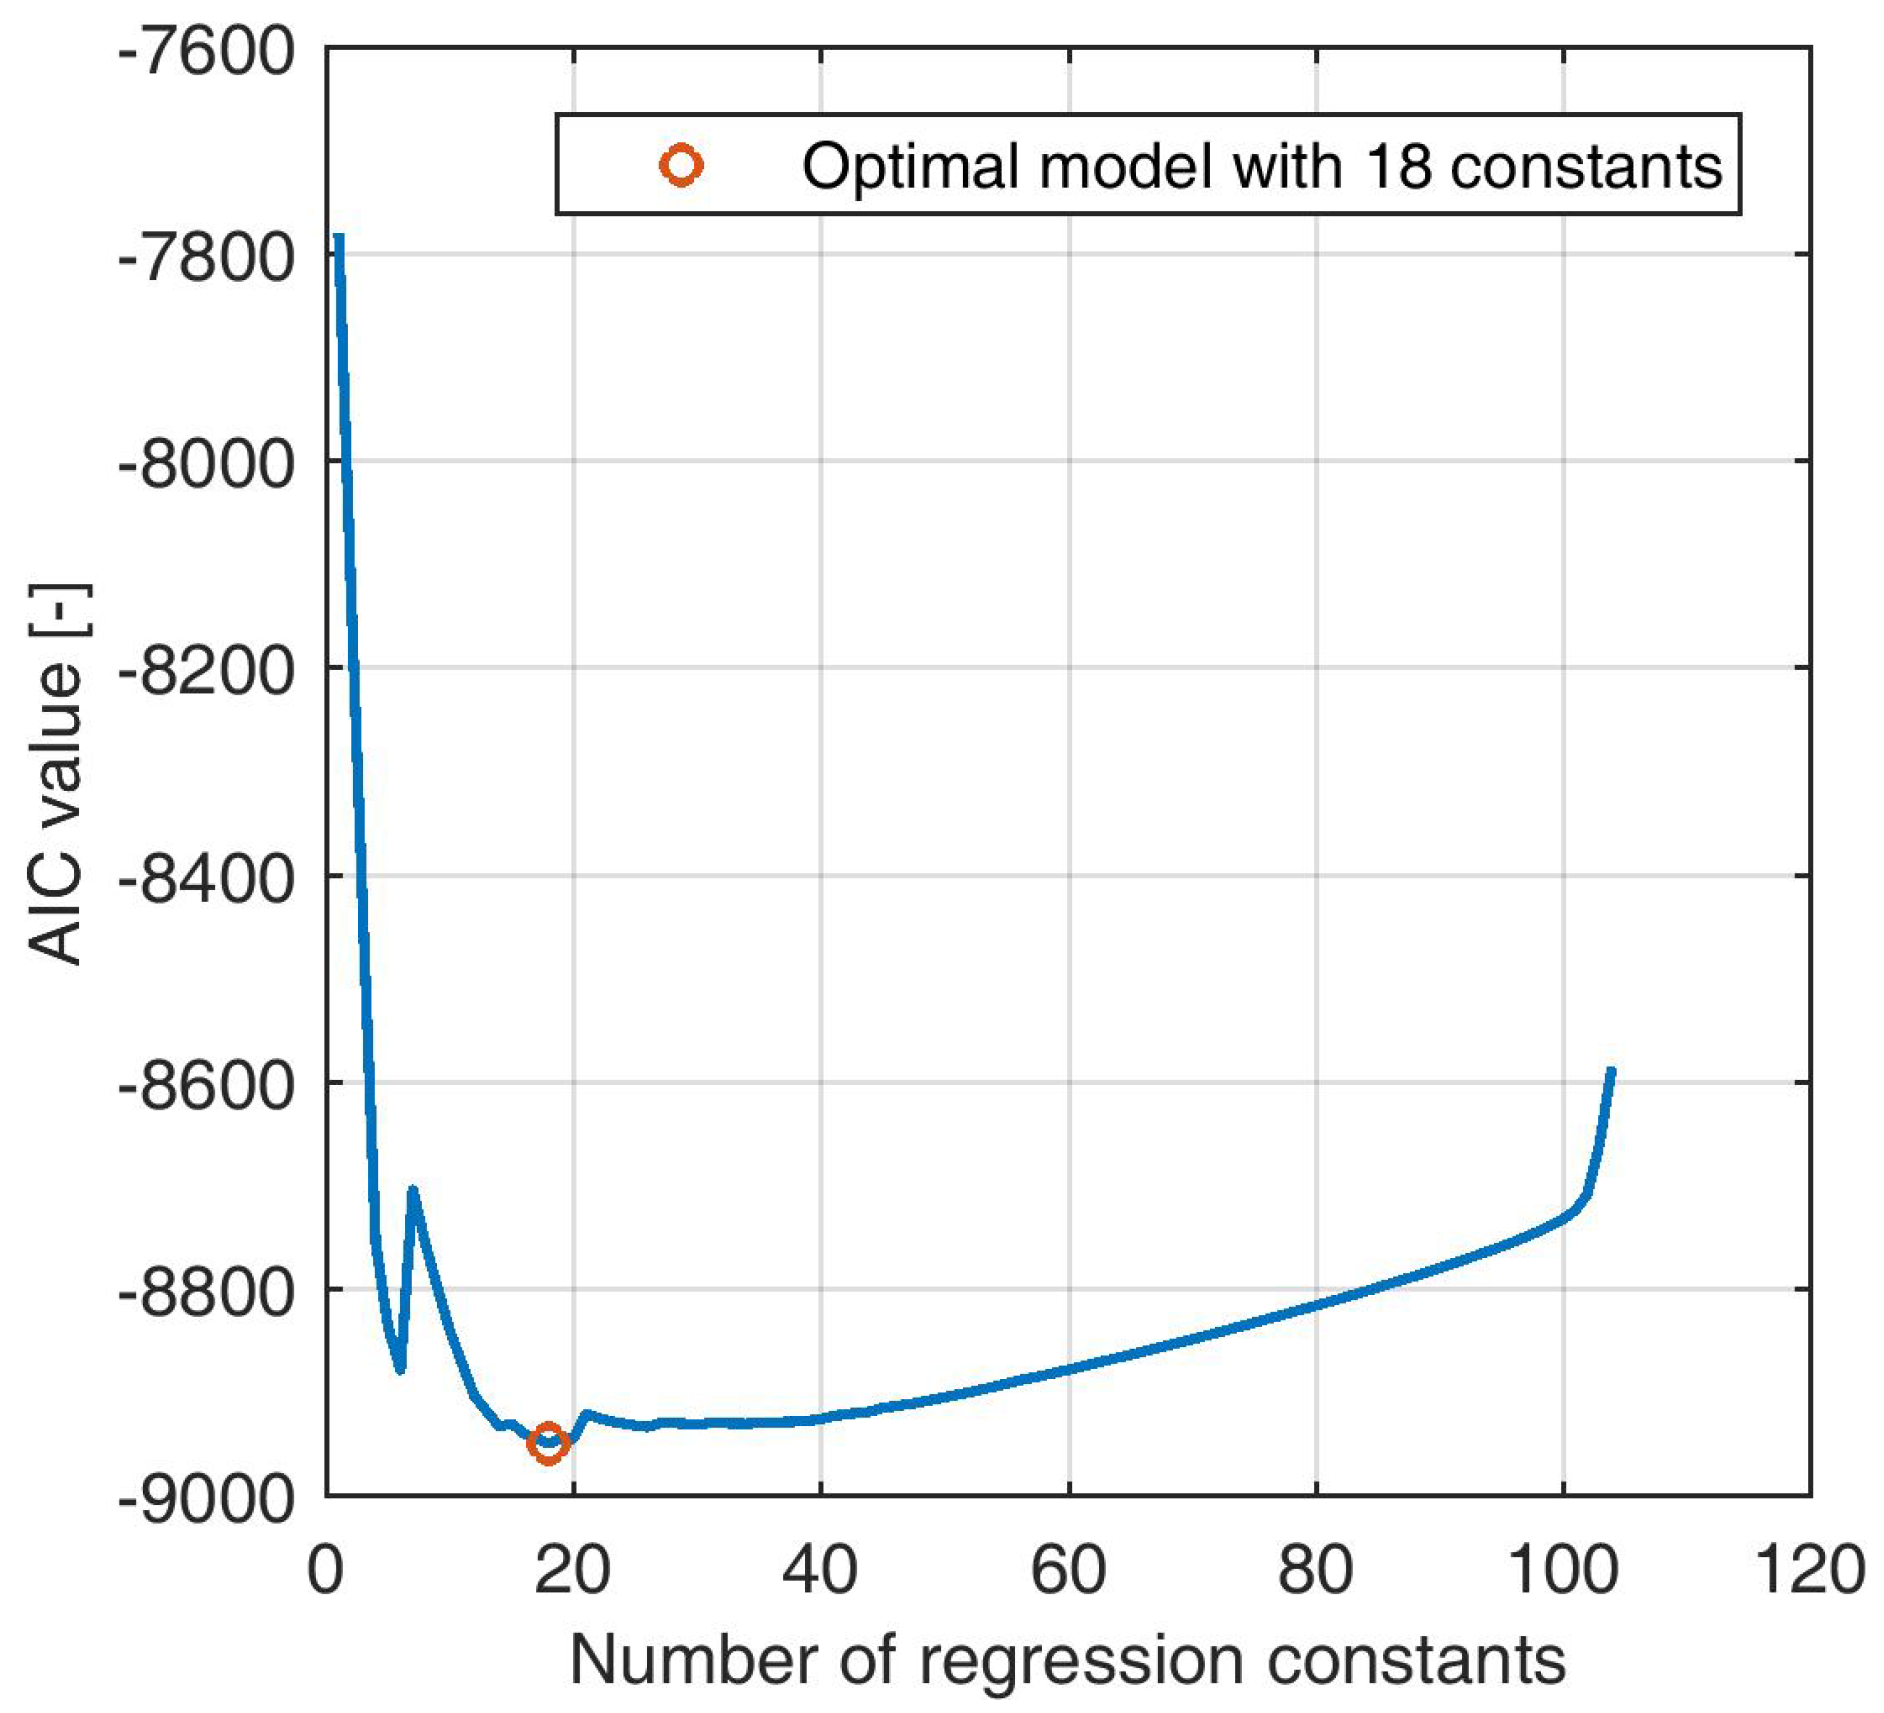
  • Optimize and simplify the friction model by stepwise nonlinear regression.

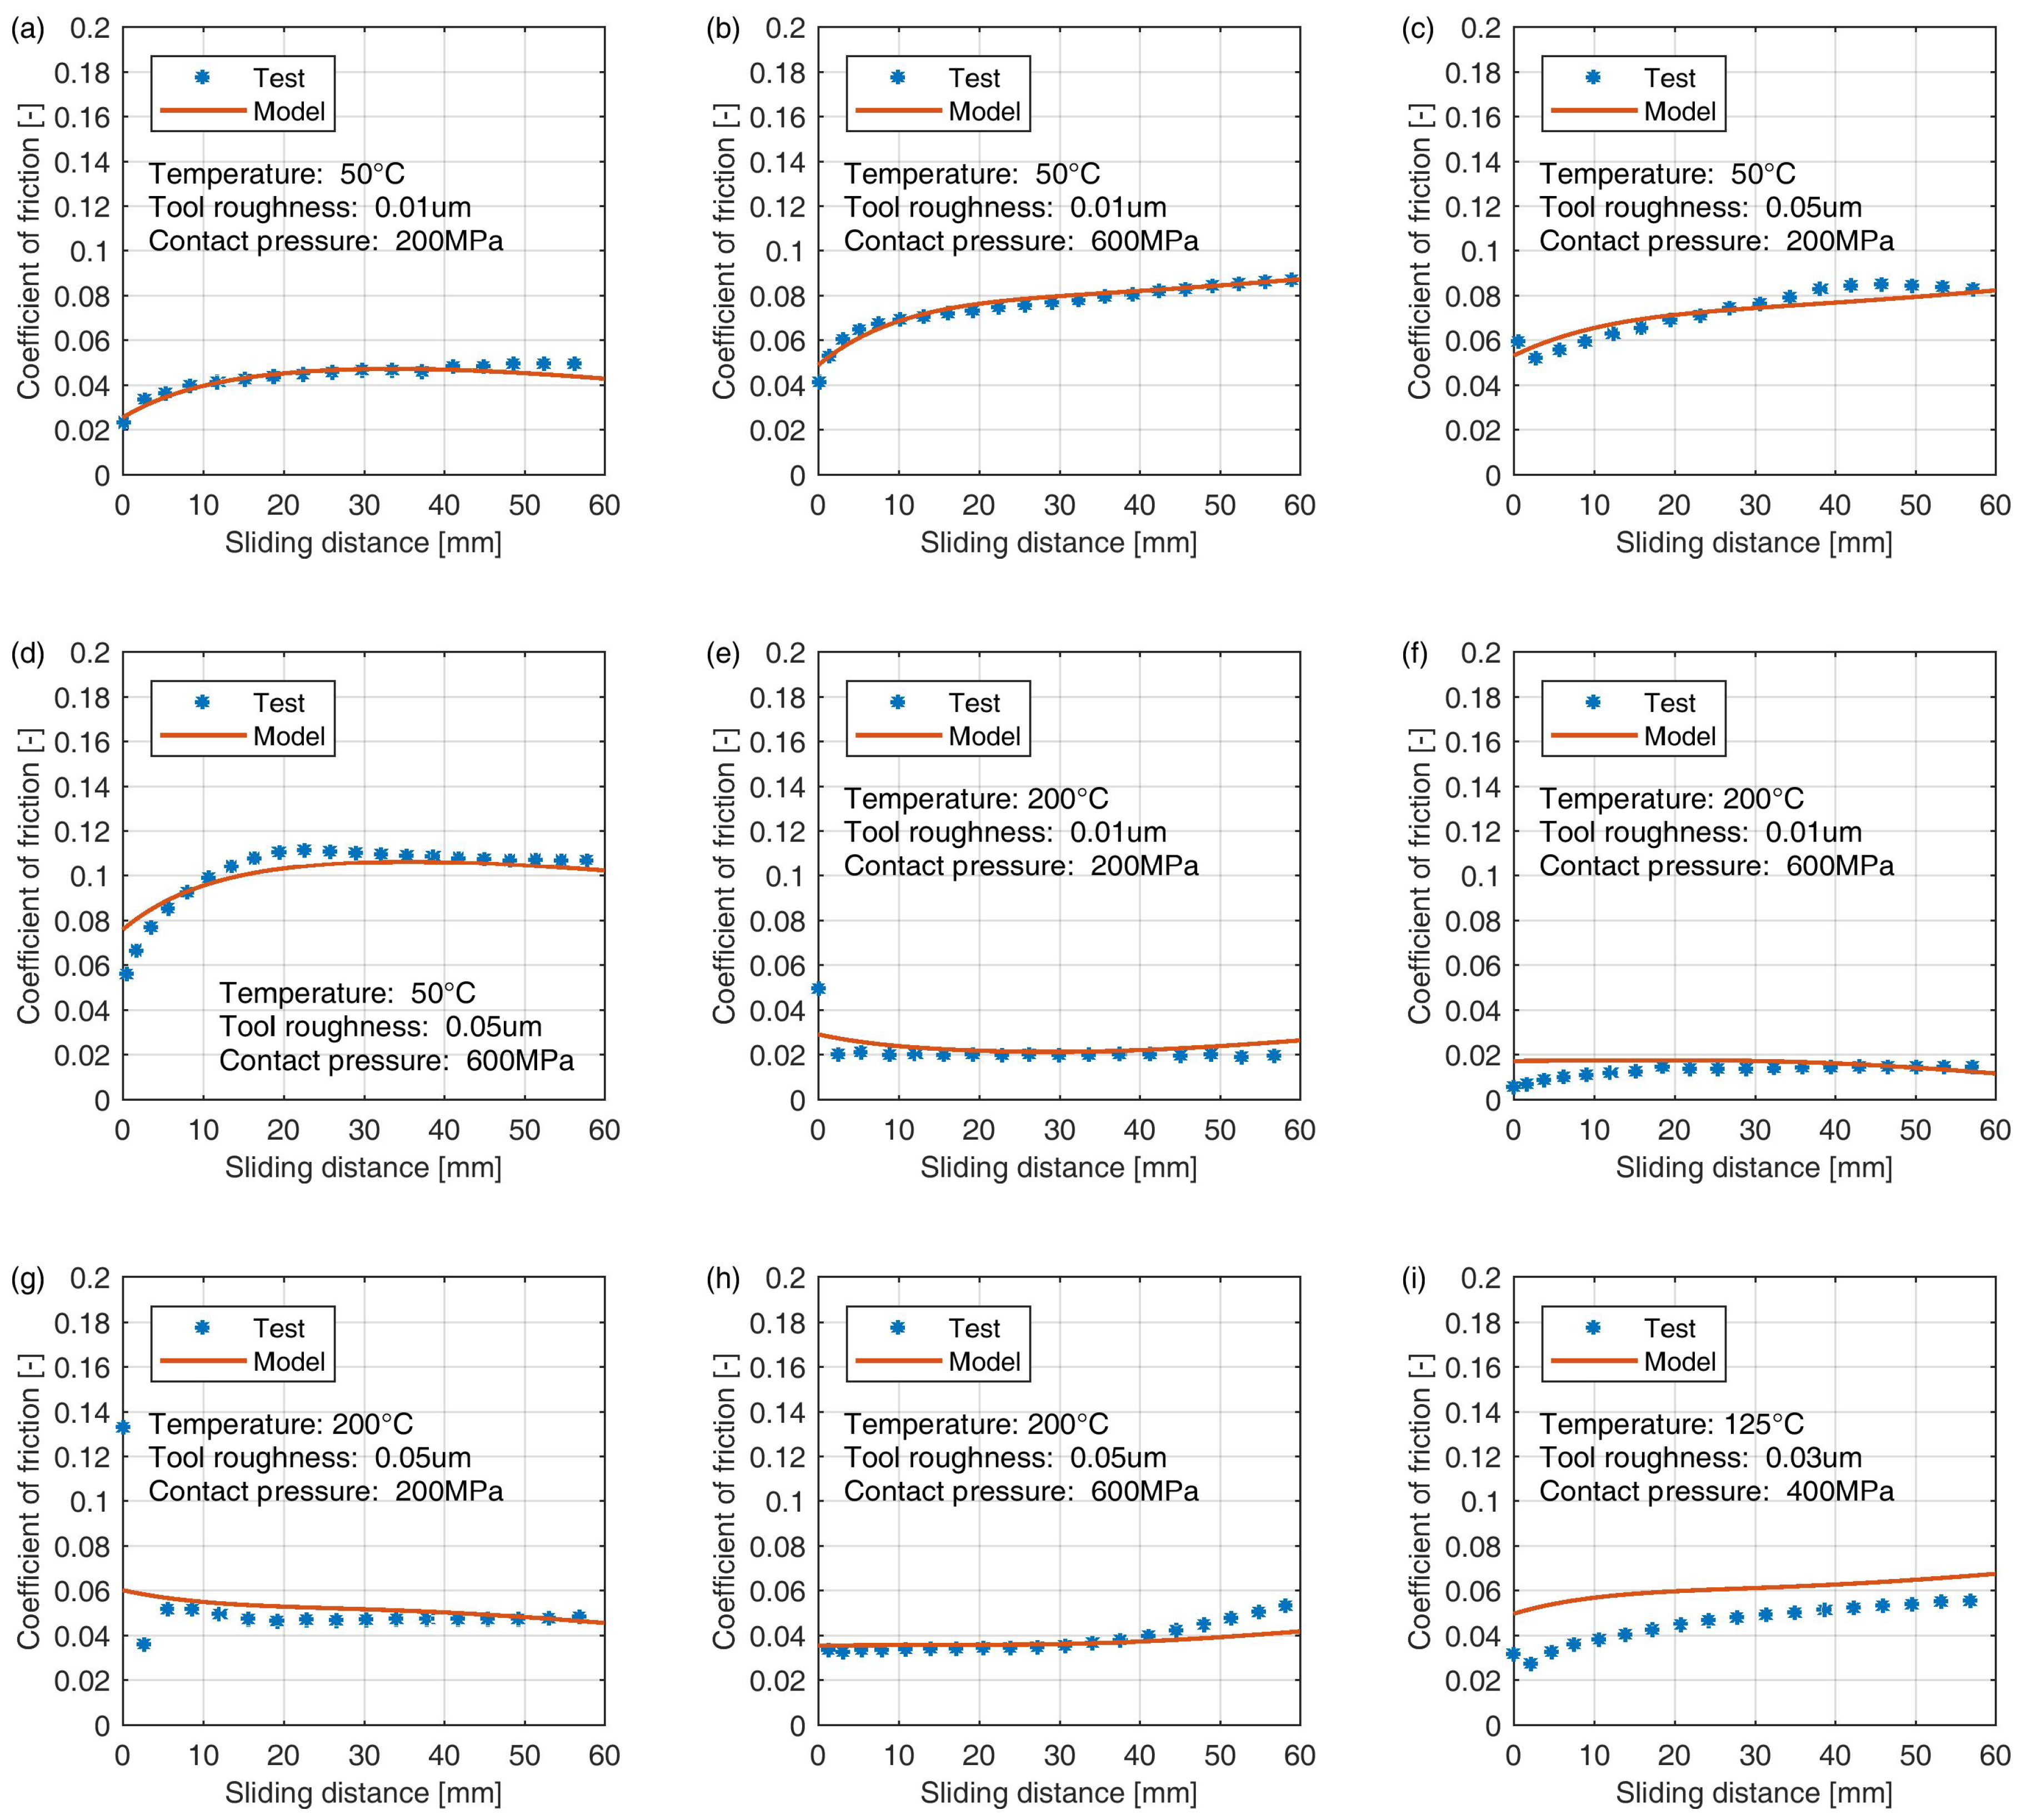
3.1. Friction Curves

Typical friction curves, as they result from experimental testing on the pin-on-disk tribometer for a lubricant system based on zinc–phosphate and stearate soap, are presented in Figure 2.
In Figure 2a, three regimes can be distinguished: (i) running-in; (ii) increase of friction; and (iii) steep increase of friction after the lubricant breakdown. However, not all regimes were observed in all experiments. Depending on the contact conditions, the increase of friction in the second regime was sometimes very slow so that a lubricant breakdown did not occur until the end of the test, as shown in Figure 2b. In general, the experiments on the pin-on-disk tribometer were well reproducible. Larger differences between two identical tests were only observed after a lubricant breakdown. However, lubricant breakdowns were out of scope for friction modeling since they typically occur at sliding distances much larger than the length of the tooling, which was 60 mm in the actual application.

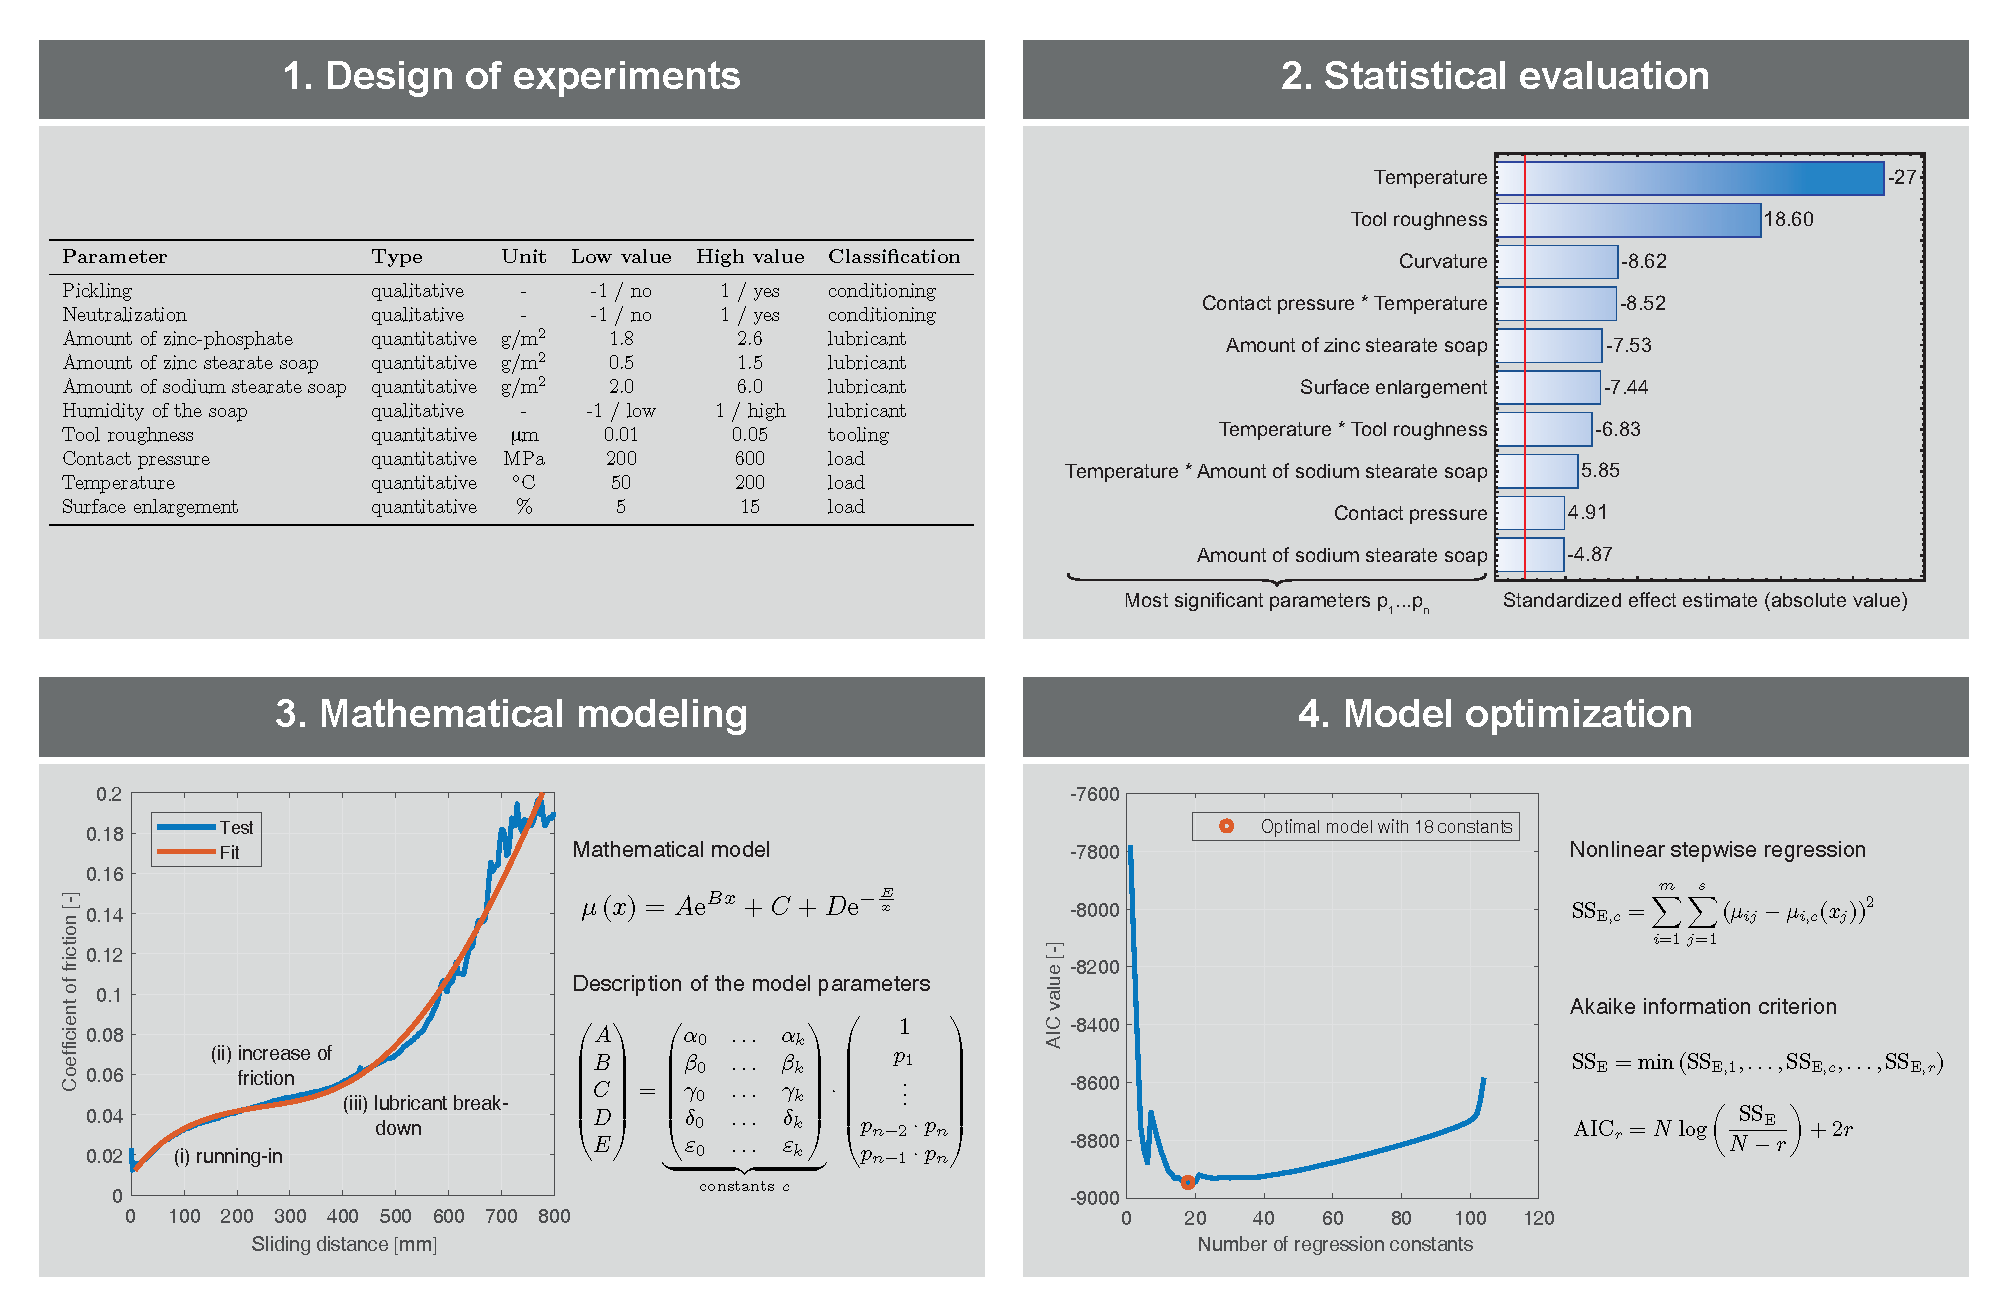
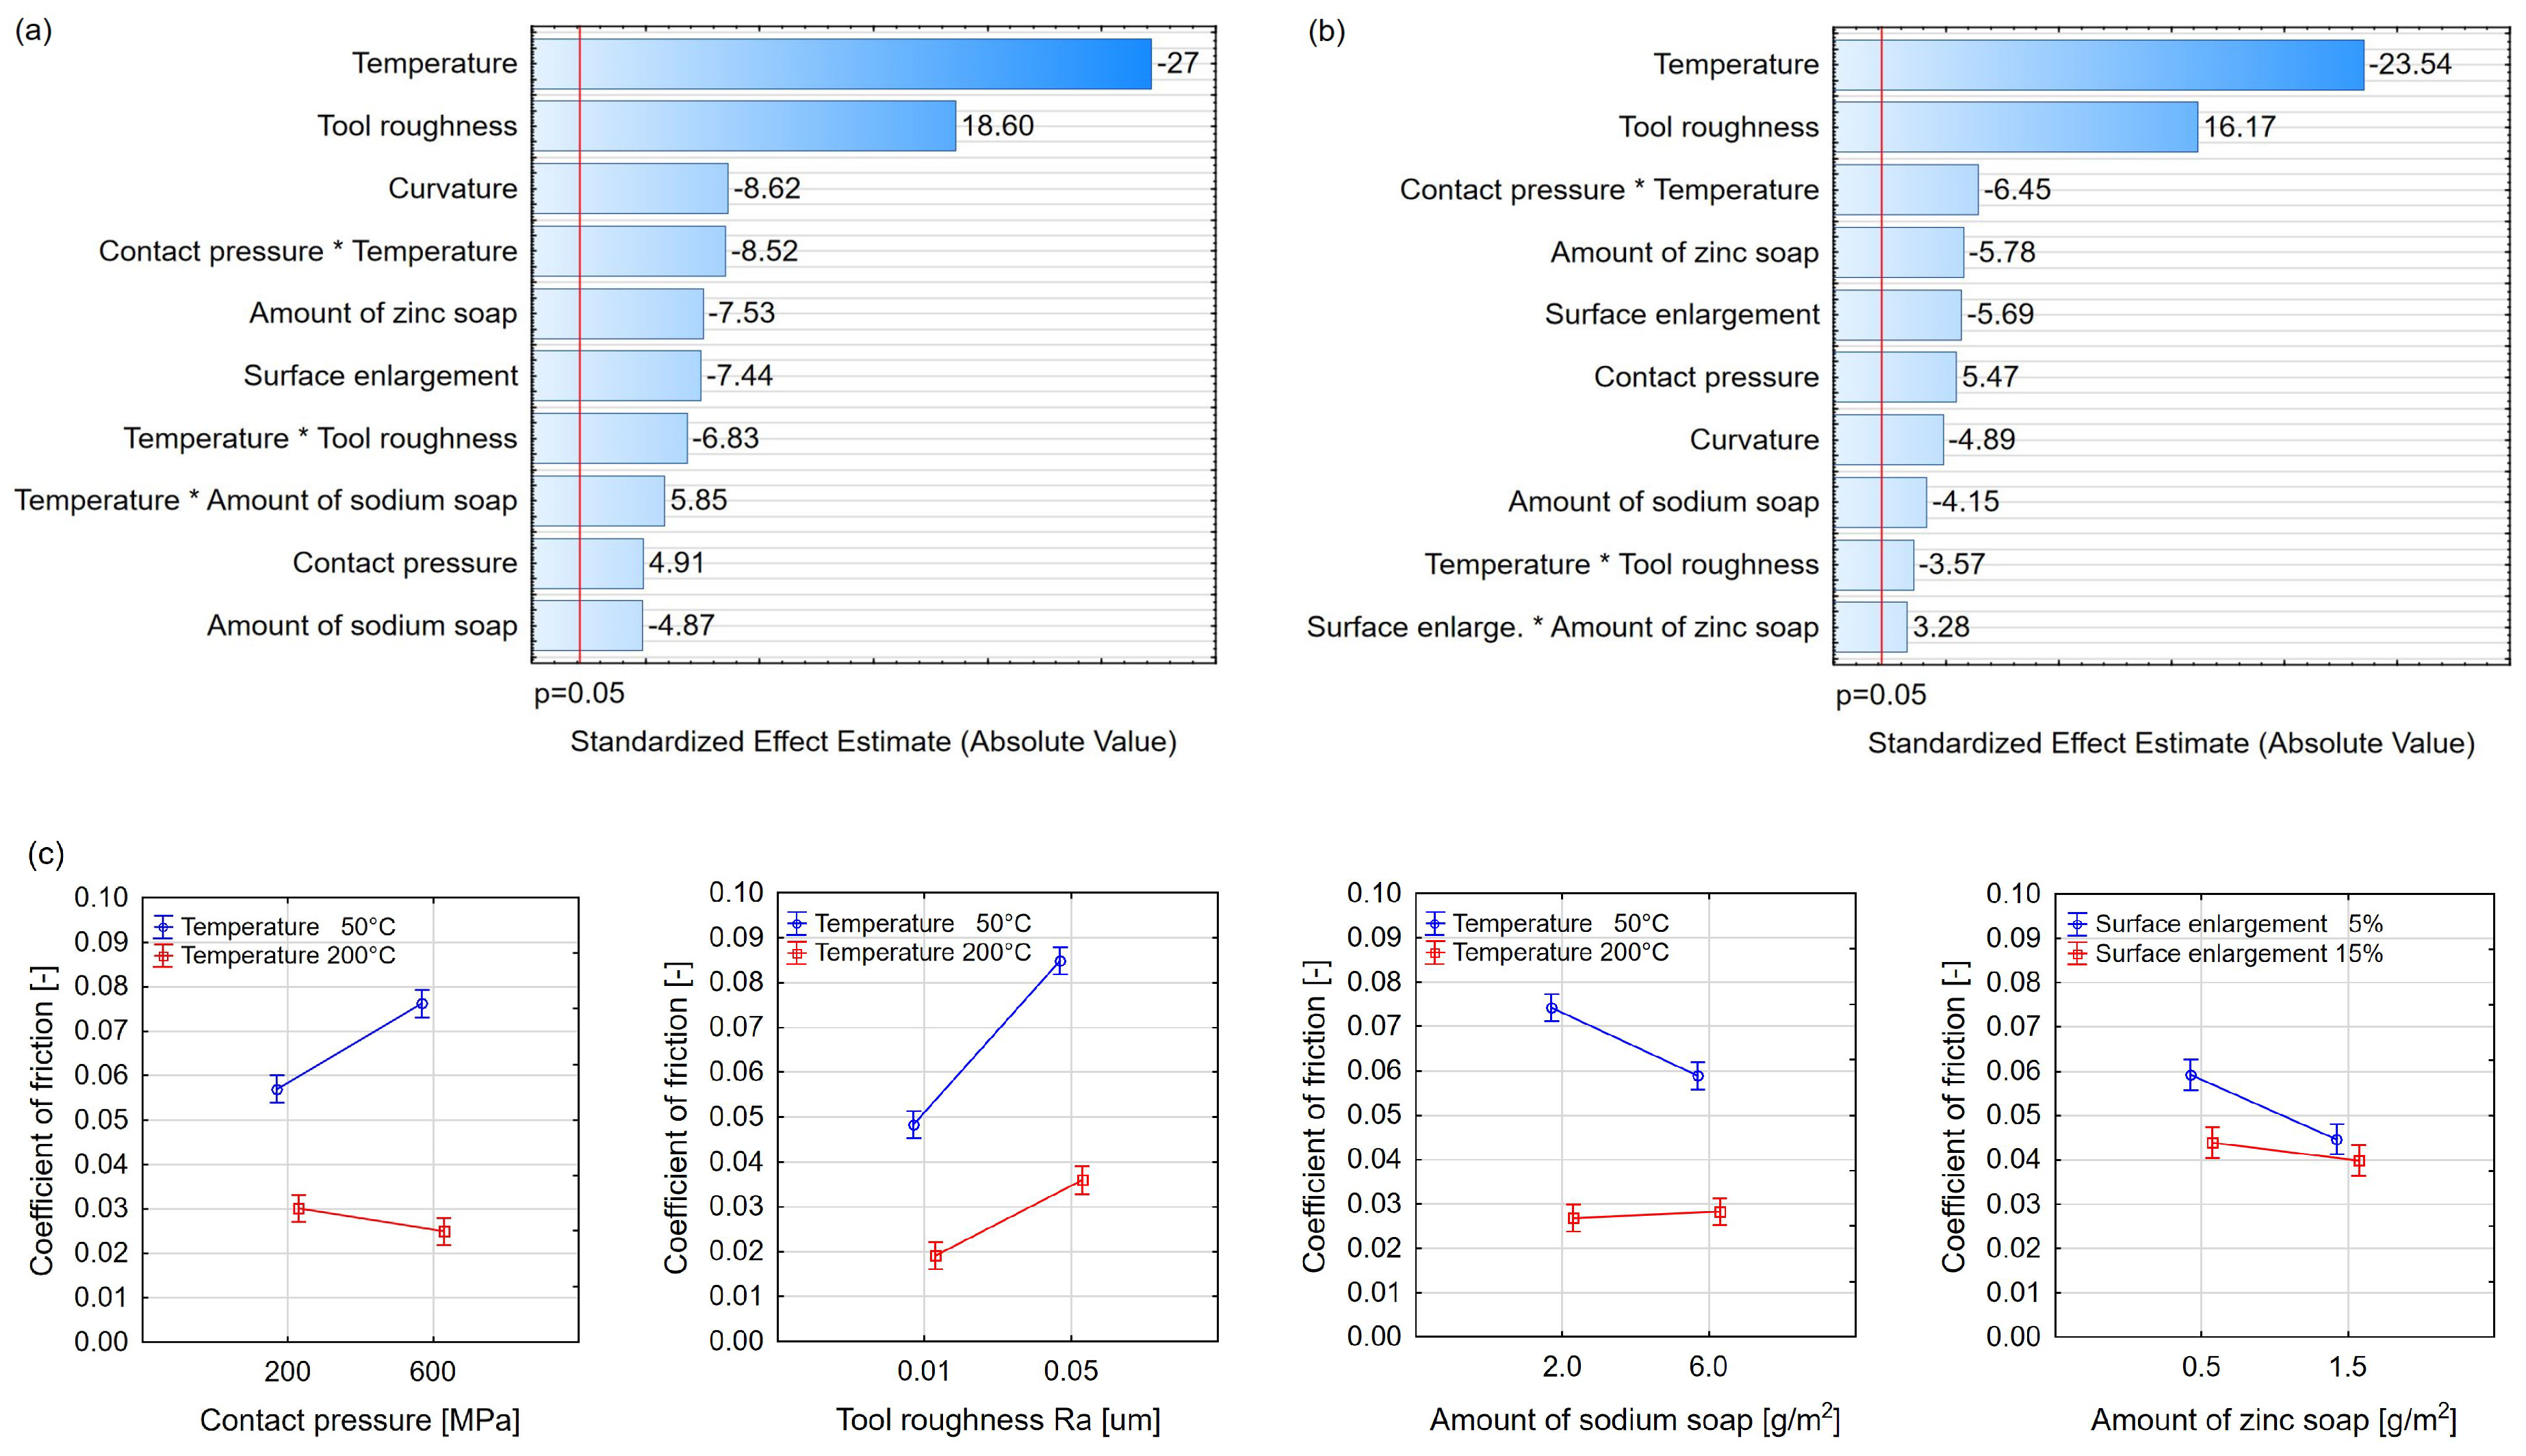
3.2. Friction Influencing Parameters

The most important friction influencing factors were determined by statistical evaluation of the measured coefficients of friction. Since the influence of a factor may change with sliding distance, the statistical evaluation was performed every 5 mm of sliding. Figure 3 shows the 10 most important factors at a sliding distance of 20 mm and 40 mm in a Pareto chart. The standardized estimated effect of each factor is specified at the end of the bars. For the main factors, a negative value indicates that the coefficient of friction gets lower when the parameter value is high and vice versa. The interpretation of two-factor interactions is rather difficult without graphical representation. Thus, a plot of the marginal means for the four most relevant two-factor interactions is shown in Figure 3c.
In the present case, the coefficient of friction was mainly affected by temperature and tool roughness at both distances of sliding. The effect of other parameters such as contact pressure, surface enlargement and the amount of stearate soap was much lower but still statistically significant. Considering two-factor interactions, the interactions of temperature with contact pressure, tool roughness and the amount of sodium stearate soap were most relevant. The significance of curvature in Figure 3 indicates that the linearity assumption was violated and a nonlinear effect may exist. For reasons of simplicity, nonlinear effects were neglected in this work. However, a model with nonlinear functions can be considered in a similar way as presented herein.
To sum up, the coefficient of friction in tube drawing using a multi-component lubricant based on zinc-phosphate and stearate soap was mainly controlled by the parameters:
  • temperature
  • tool roughness
  • amount of zinc stearate soap
  • surface enlargement
  • contact pressure
  • amount of sodium stearate soap
These parameters as well as their two-factor interactions were regarded in friction modeling.

3.3. Friction Modeling

The characteristic shape of the friction curves (Figure 2) was described depending on the sliding distance x by a mathematical function of the form
μ x = A e B x + C + D e E x ,
where the coefficients A , , E were modeled as linear combinations of the n most relevant friction influencing parameters and their two-factor interactions.
The first step was to check whether the mathematical function is able to reproduce the measured friction curves. For that purpose, estimators A ^ i , , E ^ i for each measurement i = 1 , , m were determined by nonlinear regression with the usual least-squares loss function
j = 1 s μ i j μ i ( x j ) 2 ,
where x 1 , , x s are the measuring points, and μ i j is the measured coefficient of friction in the experiment i = 1 , , m and at the position x j . As a result, m individual friction functions
μ ^ i x = A ^ i e B ^ i x + C ^ i + D ^ i e E ^ i x , i = 1 , , m
were obtained. In Figure 4, the approximations of two measurements by Equation (3) are presented. As it can be seen in these examples, the mathematical function accurately reproduces the measured friction curves.
The next step was to derive a global model for the parameters A , , E depending on the n friction influencing parameters and their two-factor interactions. To be more concrete, the parameters p 1 , , p n were related to the model parameters A , , E by
A B C D E = α 0 α 1 α 2 α k 1 α k β 0 β 1 β 2 β k 1 β k γ 0 γ 1 γ 2 γ k 1 γ k δ 0 δ 1 δ 2 δ k 1 δ k ε 0 ε 1 ε 2 ε k 1 ε k · 1 p 1 p 2 p n 2 · p n p n 1 · p n .
To determine the constants α 0 , , ε k , the values for A ^ i , , E ^ i obtained by nonlinear regression in the last step were used. For example, to get the values for α 0 , , α k , the linear model
α 0 α 1 α 2 α 57 α 67 A ^ 1 A ^ 2 A ^ m A ^ = α 0 α 1 α 2 α 57 α 67 1 p 1 , 1 p 1 , 2 p 1 , n 2 · p 1 , n p 1 , n 1 · p 1 , n 1 p 2 , 1 p 2 , 2 p 2 , n 2 · p 2 , n p 2 , n 1 · p 2 , n 1 p m , 1 p m , 2 p m , n 2 · p m , n p m , n 1 · p m , n X · α 0 α 1 α 2 α k 1 α k α ,
was considered. Equation (5) relates the constants in α to the most optimal model coefficients A ^ by the matrix X , in which p i , f is the setting of the parameter f in the experimental run i. The estimators for α 0 , , α k were then obtained by linear regression solving
α ^ = X T X 1 X T A ^ .
In other words, the α 0 , , α k solve the minimization problem
min i = 1 m A ^ i ( α 0 + α 1 p i , 1 + + α k p i , n 1 · p i , n ) 2 .
The same procedure was used to determine the estimators for the coefficients β 0 , , ε k . Since this approach leads to a quite large model with many regression constants, over-fitting may be an issue. Thus, the goal of the final step was to reduce the number of regression constants in the model. This was performed by stepwise nonlinear regression, identifying and removing each time the regression constant with the least effect on the enlargement of the error sum of squares.
Starting with the full set of regression constants determined in Equation (6), the impact of a single regression constant c was analyzed by temporarily removing it from the friction model. Each time, a nonlinear regression problem was solved such that the residual sum of squares
SS E , c = i = 1 m j = 1 s μ i j μ i , c ( x j ) 2
over the entire range of friction measuring points N = m · s becomes minimal. In Equation (8), μ i , c stands for the function μ i where the regression constant c was set to zero. Then, the value of a modified version of the Akaike Information criterion [34]
AIC r = N log min SS E , 1 , S S E , 2 , , SS E , c , , SS E , r 1 , SS E , r N r + 2 r
was calculated to evaluate the quality of the model as a trade-off between accuracy and the number of regression constants r. After removing the regression constant with the smallest impact on the accuracy of the friction model, the analysis was repeated with the new set of r 1 regression constants. The procedure was repeated until only one regression constant remained. The optimal friction model was found as the one with the lowest AIC value.

3.4. Friction Model for Tube Drawing

In the present case of tube drawing, sliding contact was limited to the range of 0–60 mm because of the length of the tooling in the real application. In this range, n = 6 parameters were identified to control the coefficient of friction (Section 3.2). Starting with the full set of 105 regression constants, an optimal model with only 18 regression constants was found by using stepwise nonlinear regression and the modified version of the Akaike information criterion (Figure 5). In this model, the coefficients A , , E were described as
A = 0.0119 + 0.0161 · p 1 0.0046 · p 5 B = 0.0834 + 0.0087 · p 3 · p 4 C = 0.0521 0.0236 · p 1 + 0.0129 · p 2 0.0035 · p 3 0.0045 · p 4 + 0.0044 · p 5 0.0038 · p 1 · p 2 0.0069 · p 1 · p 5 + 0.0033 · p 1 · p 6 0.0017 · p 2 · p 4 + 0.0016 · p 4 · p 6 D = 0.1023 · p 4 · p 6 E = 170.5288
where p 1 is the temperature, p 2 is the tool roughness, p 3 is the amount of zinc stearate soap, p 4 is the surface enlargement, p 5 is the contact pressure and p 6 is the amount of sodium stearate soap. Please note that, to apply Equation (10), real parameter values p i , real must be converted by the linear transformation
p i = 2 · p i , real p i , min p i , max p i , min 1 ,
where p i , min is the low (minimum) parameter value and p i , max is the high (maximum) parameter value specified in Table 1. The transformation is necessary because the parameters were centered and scaled to the range of 1 , , 1 prior to friction modeling.
In Figure 6, the predicted coefficients of friction are compared with experimental measurements at different temperature, tool roughness and contact pressure. The influence of the sliding distance is well captured by the model. The same also applies to the influence of temperature. At 200 C, the coefficient of friction is significantly lower as compared to 50 C, which is properly described by the model. The effect of tool roughness, which is more pronounced at high temperatures, is also modeled correctly. The model properly predicts an increase of friction with increasing tool roughness. Even the complex interaction of contact pressure and temperature, which is different at low and high temperatures, is well captured by the model. While the coefficient of friction is increased with rising contact pressure at low temperatures, it is decreased at high temperatures.
In general, the friction model enables a sound description of the measured friction curves. However, some differences between the model and the test can be noticed in Figure 6i. The deviations are related to the nonlinear behavior of the stearate soap. At 50 C, the stearate soap is in a solid state, while at 200 C at least the zinc stearate soap is in a molten state. Melting of the stearate soap leads to sudden drop of viscosity. Consequently, the coefficient of friction is decreased because viscous friction is reduced. The melting point of the zinc stearate soap is T m 100 C. Since the test in Figure 6i was performed at 125 C, the zinc stearate soap was already in a molten state and behaved similar to the tests at 200 C. However, the nonlinear relation between viscosity and temperature is not captured by the linear nature of the model. Thus, the coefficient of friction is slightly underestimated in the range of 50 C < T < T m , while it is slightly overestimated in the range T m < T < 200 C.
Nonlinear effects, as caused by the melting of the soap, were neglected in the derivation of the friction model for reasons of simplicity. However, they can be incorporated into the friction model by using a nonlinear instead of a linear transformation for a specific parameter in Equation (11). For example, a generalized logistic function would be appropriate for the transformation of temperature in the present case to describe the sudden drop of viscosity associated with melting of the soap.

4. Conclusions

In this paper, a systematic procedure for testing and modeling of friction with focus on the application in numerical simulations is presented. The friction model was developed based on designed experiments and mathematical modeling of the measured friction curves. It describes the coefficient of friction as a function of the sliding distance and the relevant friction influencing parameters. In the present case, a friction model for tube drawing was developed. However, the systematic procedure can also be used to determine a friction model for other processes and is not limited to metal forming applications only. The procedure consists of the following steps:
  • Design of experiments: A two-level screening plan was used for efficient and systematic testing of friction under varying contact conditions. To identify possible nonlinearities, center point experiments were applied. The experiments were conducted on a pin-on-disk tribometer based on a randomized experimental design.
  • Statistical evaluation: Key parameters that mainly affect the coefficient of friction were identified by statistical evaluation of the measured friction curves using the design of experiments approach.
  • Mathematical modeling: Based on the shapes of the measured friction curves, a mathematical model was selected. The model coefficients were described as a function of the key parameters that mainly affect the coefficient of friction. This led to an initial friction model with a high number of regression constants, where over-fitting may be an issue.
  • Optimization: An optimal friction model with less regression constants was obtained as a trade-off between model accuracy and complexity by using stepwise nonlinear regression and a modified version of the Akaike information criterion.
The friction model obtained with the presented approach enabled predicting the coefficient of friction in dependence of the sliding distance and the most relevant friction influencing parameters with high accuracy. However, some small deviations between the measured and the predicted friction curves were observed due to nonlinear effects. The nonlinear effects were identified already in the statistical evaluation of the measured friction curves, but neglected in the derivation of the friction model to make the modeling process clearer for the reader. However, nonlinear effects can easily be incorporated into the friction model by using an appropriate nonlinear transformation for a specific parameter.

Author Contributions

Marco Lüchinger and Michael Schreiner conceived and designed the experiments including the test sample geometry in cooperation with Igor Velkavrh and Stefan Klien; Michael Baumgartner organized and prepared the test samples; Igor Velkavrh and Stefan Klien performed the experiments; Kerstin Kern analyzed the tested samples; Marco Lüchinger and Michael Schreiner analyzed the measured data and developed the procedure for friction modeling; Alexander Diem and Wolfgang Tillmann consulted on the research work and held scientific discussions; and Marco Lüchinger, Igor Velkavrh, and Michael Schreiner wrote the paper.

Acknowledgments

The work presented was funded by the Swiss Federal Commission for Technology and Innovation (CTI) within the project 15031.1 PFIW-IW and carried out at the University of Applied Sciences Buchs and the “Excellence Center of Tribology” (AC2T research GmbH) in cooperation with Jansen AG Steel Tubes, V-Research GmbH and the TU Dortmund University. Financial support by the Austrian COMET Programme (Project XTribology, no. 849109) is gratefully acknowledged.

Conflicts of Interest

The authors declare no conflict of interest.

References

  1. Altan, T.; Vazquez, V. Numerical Process Simulation for Tool and Process Design in Bulk Metal Forming. CIRP Ann. 1996, 45, 599–615. [Google Scholar] [CrossRef]
  2. Tekkaya, A.E.; Martins, P.A.F. Accuracy, reliability and validity of finite element analysis in metal forming: A user’s perspective. Eng. Comput. 2009, 26, 1026–1055. [Google Scholar] [CrossRef]
  3. Bay, N.; Eriksen, M.; Tan, X.; Wibom, O. A friction model for cold forging of aluminum, steel and stainless steel provided with conversion coating and solid film lubricant. CIRP Ann. Manuf. Technol. 2011, 60, 303–306. [Google Scholar] [CrossRef]
  4. Wang, W.; Zhao, Y.; Wang, Z.; Hua, M.; Wei, X. A study on variable friction model in sheet metal forming with advanced high strength steels. Tribol. Int. 2016, 93, 17–28. [Google Scholar] [CrossRef]
  5. De Coulomb, C.A. Théorie des Machines Simples: En Ayant égard au Frottement de Leurs Parties et à la Roideur des Cordages; Bachelier: Paris, France, 1821. [Google Scholar]
  6. Amontons, G. De la resistance cause’e dans les machines. Memoire de l’Académie Royale des Sciences 1699, 2, 206–227. [Google Scholar]
  7. Bowden, F.P.; Tabor, D. Mechanism of metallic friction. Nature 1942, 150, 197–199. [Google Scholar] [CrossRef]
  8. Orowan, E. The Calculation of Roll Pressure in Hot and Cold Flat Rolling. Proc. Inst. Mech. Eng. 1943, 150, 140–167. [Google Scholar] [CrossRef]
  9. Shaw, M.C.; Ber, A.; Mamen, P.A. Friction characteristics of sliding surface undergoing plastic flow. Trans. ASME J.Basic Eng. 1960, 82, 342–346. [Google Scholar] [CrossRef]
  10. Schey, J.A. (Ed.) Metal Deformation Processes: Friction and Lubrication; Dekker: New York, NY, USA, 1970. [Google Scholar]
  11. Wanheim, T.; Bay, N. A Model for Friction in Metal Forming Processes. CIRP Ann. Manuf. Technol. 1978, 27, 189–194. [Google Scholar]
  12. Nielsen, C.V.; Bay, N. Review of friction modeling in metal forming processes. J. Mater. Proc. Technol. 2018, 255, 234–241. [Google Scholar] [CrossRef]
  13. Hashiguchi, K.; Ozaki, S. Constitutive equation for friction with transition from static to kinetic friction and recovery of static friction. Int. J. Plast. 2008, 24, 2102–2124. [Google Scholar] [CrossRef]
  14. Ozaki, S.; Ito, C.; Hashiguchi, K. Experimental verification of rate-dependent elastoplastic analogy friction model and its application to FE analysis. Tribol. Int. 2013, 64, 164–177. [Google Scholar] [CrossRef]
  15. Hol, J.; Cid Alfaro, M.V.; de Rooij, M.B.; Meinders, T. Advanced friction modeling for sheet metal forming. Wear 2012, 286–287, 66–78. [Google Scholar] [CrossRef]
  16. Hol, J.; Meinders, V.T.; Geijselaers, H.; van den Boogaard, A.H. Multi-scale friction modeling for sheet metal forming: The mixed lubrication regime. Tribol. Int. 2015, 85, 10–25. [Google Scholar] [CrossRef]
  17. Hol, J.; Meinders, V.T.; de Rooij, M.B.; van den Boogaard, A.H. Multi-scale friction modeling for sheet metal forming: The boundary lubrication regime. Tribol. Int. 2015, 81, 112–128. [Google Scholar] [CrossRef]
  18. Ludwig, M.; Stahlmann, J.; Groche, P. Advanced Friction Model for Cold Forging Processes. In Metal Forming; Wiley-VCH Verlag GmbH & Co.: Weinheim, Germany, 2012; pp. 1003–1006. [Google Scholar]
  19. Horwatitsch, D. Entwicklung eines Reibmodells für hohe Temperaturen und hohe Umformgrade: @Kassel Univ., 2012, Dissertation; Berichte zur Metallformgebung; Kassel University Press: Kassel, Germany, 2013. [Google Scholar]
  20. Tamai, Y.; Inazumi, T.; Manabe, K.I. FE forming analysis with nonlinear friction coefficient model considering contact pressure, sliding velocity and sliding length. J. Mater. Proc. Technol. 2016, 227, 161–168. [Google Scholar] [CrossRef]
  21. Rigaut, J.M.; Oudin, J.; Bricout, J.P.; Cabezon, J.; Ravalard, Y. A new friction test procedure for the improvement of drawing and similar processes. J. Mater. Proc. Technol. 1990, 21, 3–28. [Google Scholar] [CrossRef]
  22. Bay, N.; Wibom, O.; Nielsen, J.A. A New Friction and Lubrication Test for Cold Forging. CIRP Ann. Manuf. Technol. 1995, 44, 217–221. [Google Scholar] [CrossRef]
  23. Bay, N.; Olsson, D.D.; Andreasen, J.L. Lubricant test methods for sheet metal forming. Tribol. Int. 2008, 41, 844–853. [Google Scholar] [CrossRef]
  24. Groche, P.; Müller, C.; Stahlmann, J.; Zang, S. Mechanical conditions in bulk metal forming tribometers—Part one. Tribol. Int. 2013, 62, 223–231. [Google Scholar] [CrossRef]
  25. Groche, P.; Stahlmann, J.; Müller, C. Mechanical conditions in bulk metal forming tribometers—Part two. Tribol. Int. 2013, 66, 345–351. [Google Scholar] [CrossRef]
  26. Müller, C.; Groche, P. Tribological measurement in cold forging. Tribol. Schmier. 2014, 61, 28–37. [Google Scholar]
  27. Velkavrh, I.; Lüchinger, M.; Kern, K.; Klien, S.; Ausserer, F.; Voyer, J.; Diem, A.; Schreiner, M.; Tillmann, W. Using a standard pin-on-disc tribometer to analyse friction in a metal forming process. Tribol. Int. 2017, 114, 418–428. [Google Scholar] [CrossRef]
  28. Freeman, D.B. Phosphating and Metal Pre-Treatment: A Guide to Modern Processes and Practice; Woodhead-Faulkner: Cambridge, UK, 1986; Volume 1986. [Google Scholar]
  29. Adjerid, S.; Hivart, P.; Bricout, J.P. Some stressing and environmental parameters related to phosphate-stearate coating performance in cold forging of steel. Tribol. Lett. 1996, 2, 55–70. [Google Scholar] [CrossRef]
  30. Bricout, J.P.; Hivart, P.; Oudin, J.; Ravalard, Y. New testing procedure of zinc phosphate coatings involved in cold forging of cylindrical steel billets. J. Mater. Proc. Technol. 1990, 24, 3–12. [Google Scholar] [CrossRef]
  31. Hivart, P.; Bricout, J.P.; Oudin, J. New real-time test for prediction of zinc phosphate/stearate coatings breakdown: optimal stearate settling parameters for steel billets in cold forging. Tribol. Int. 1992, 25, 45–51. [Google Scholar] [CrossRef]
  32. Groche, P.; Zang, S.; Müller, C. Einfluss der Relativgeschwindigkeit auf tribologische Systeme der Kaltmassivumformung. Tribol. Schmier. 2014, 61, 26–32. [Google Scholar]
  33. Montgomery, D.C.; Runger, G.C.; Hubele, N.F. Engineering Statistics, 5th ed.; Wiley: Hoboken, NJ, USA, 2010. [Google Scholar]
  34. Akaike, H. A New Look at the Statistical Model Identification. IEEE Trans. Autom. Control 1974, 19, 716–723. [Google Scholar] [CrossRef]
Figure 1. SRV4® tribometer, sample holder and test sample used for tribological testing [27].
Lubricants 06 00042 g001
Figure 2. Friction curves determined on the pin-on-disk tribometer for a lubricant system based on zinc-phosphate and stearate soap with parameter levels set to: (a) low amount of lubricant, high tool roughness and high load; and (b) high amount of lubricant, low tool roughness and low load.
Lubricants 06 00042 g002
Figure 3. Pareto charts including the 10 most important friction influencing factors: (a) at a sliding distance of 20 mm; and (b) at a sliding distance of 40 mm. In (c) the four most important two-factor interactions are presented in a plot of the marginal means including 95 % confidence limits.
Lubricants 06 00042 g003
Figure 4. Measured friction curves and their mathematical approximation μ ^ i ( x ) . The measured friction values are the same as already presented in Figure 2 with parameter levels set to: (a) low amount of lubricant, high tool roughness and high load; and (b) high amount of lubricant, low tool roughness and low load.
Lubricants 06 00042 g004
Figure 5. Value of the Akaike information criterion vs. number of regression constants.
Lubricants 06 00042 g005
Figure 6. Friction curves measured at different temperature, tool roughness and contact pressure as well as their prediction with the friction model. The values of the parameters in (ai) are specified in the diagrams.
Lubricants 06 00042 g006
Table 1. Friction influencing parameters and their levels tested on the pin-on-disk tribometer.
ParameterTypeUnitLow valueHigh valueClassification
Picklingqualitative-−1/no1/yesconditioning
Neutralizationqualitative-−1/no1/yesconditioning
Amount of zinc-phosphatequantitativeg/m 2 1.82.6lubricant
Amount of zinc stearate soapquantitativeg/m 2 0.51.5lubricant
Amount of sodium stearate soapquantitativeg/m 2 2.06.0lubricant
Humidity of the soapqualitative-−1/low1/highlubricant
Tool roughnessquantitative μ m0.010.05tooling
Contact pressurequantitativeMPa200600load
Temperaturequantitative C50200load
Surface enlargementquantitative%515load

