1. Introduction
The main motivation for this study was to obtain a better understanding of the sliding behavior of amorphous tribofilms. It has been shown experimentally that polymer matrix composites containing carbon fibers and silica nanoparticles provide low wear rates and low coefficients of friction, especially under severe stressing conditions [
1]. On the other hand, a composite with carbon fibers but without silica nanoparticles showed high friction and wear under severe stressing conditions. Our explanation for this behavior is that high flash temperatures developing at the tips of carbon fibers cause decomposition of the polymer matrix and the formation of a silica film coating both the protruding carbon fibers of the composite and the steel counter-body. Thus, the sliding of a thin silica film supported on both sides by rigid bodies was considered in our simulations. The existence of such films under the given stressing conditions has been proved by sophisticated nanostructural characterization in [
1]. Besides the fact that high temperatures must have occurred to decompose the polymer matrix, further experimental evidence was obtained by flash temperature measurements performed by Sebastian in his thesis [
2]. That means that sliding at 1100K is a realistic scenario for the considered tribological system.
Previously, a discrete model based on the method of movable cellular automata (MCA) was applied for simulating the sliding behavior of a simplified tribofilm consisting of silica and graphite nanoparticles [
1,
3]. A prerequisite of such type of modeling is that the stress–strain data of the nanoparticles are known. Since this is usually not the case, these modeling results were not very reliable.
On the other hand, simulation of the sliding behavior of amorphous films can be performed by modeling directly (MD). Although the results of such modeling will be valid only for a small scale, this, nevertheless, gives some understanding of the atomic mechanisms providing sliding. In spite of the fact that at the present time a sufficient number of papers dealing with the plastic deformation of silica under shear strain exists, little attention was given to the tribological aspect of this issue. Thus Rountree et al. [
4] paid close attention to the anisotropy of the properties of the modeled object. Yuan et al. [
5] studied the mechanisms of the development of plastic deformation of densified silica obtained by applying various pressures during quenching are investigated. These authors could show that 5-fold coordination defects and density increased with increasing pressure. They also distinguished two competing mechanisms of destruction: “shear bands” and “cleavage.” In the paper by Mantisi et al. [
6], the response of a model silica glass under shear and pressure is investigated. Sliding simulation studies using MD modeling were done by the present authors for pure silica, carbon, nickel, and Ni-20 at % P films [
7,
8]. Provided that the amorphous structure remains stable during the extremely high shear strains occurring during sliding, such simulations can be done easily at any temperature desired. Nevertheless, only scarce results are reported in the literature. Besides the mentioned papers [
7,
8], amorphous carbon layers formed from diamond were modeled by Pastewka and co-workers [
9,
10,
11], and amorphous polyphosphate films were considered by Martin et al. [
12].
Numerical simulations with the MD method presuppose a physically correct assignment of the interatomic potentials. Therefore, a prerequisite for validation of simulation results is their experimental validation. Unfortunately for nanoscale objects this requirement often presents certain difficulties. Nevertheless, several papers were published recently considering the stress–strain response of nano-objects consisting of amorphous silica [
13,
14,
15,
16,
17,
18,
19,
20]. The first four papers [
13,
14,
15,
16] show MD-results of tensile tests, whereas the rest [
17,
18,
19,
20] deals with in situ nano-mechanical testing of silica nano-wires or nanoparticles within either transmission or scanning electron microscopes. It has been shown that if modeling parameters were chosen carefully, the deformation and fracture behavior of nano-objects consisting of amorphous silica were predicted correctly. As pointed out by Carre et al., the development of empirical potentials that enable us to describe certain material properties correctly is still a challenging task, although quantum mechanical ab initio calculations can be used in principle to build the structure of almost every material [
21]. Nevertheless, even rather simple pair potentials like the ones developed by van Beest, Kramer, and van Santen [
22] could be used to reproduce many properties of silica in a satisfying way [
21]. This encouraged us to reconsider our previous sliding simulations performed with a classical Tersoff’s potential [
7,
23,
24] once more, while using one of the recently developed empirical potentials based on the reactive force field (ReaxFF) [
25,
26]. Thus, both potentials were used for sliding simulations of amorphous silica films with the purpose of validating the impact of potential’s choice on sliding simulation results.
2. Principles of the Numerical Model
The initial structure of amorphous silica sample was created by an algorithm similar to the one suggested in [
15], including the following sequence of actions: At the beginning the bulk sample of alpha-quartz (SiO
2) with a total number of atoms of about 100000 was subjected to a temperature of 4000 K within the framework of a microcanonical ensemble NVE until the system was completely molten. Then it was quenched to the required temperature during the following 170 ps. The melting and quenching processes were repeated twice using the same preparation parameters. At the end of this procedure we obtained a uniform block of amorphous silica with the following geometry: 15.0 nm in width, 11.6 nm in height, and 8.3 nm in thickness along
x,
y, and
z directions, respectively. An additional analysis of coordination numbers and verification of the isotropy of elastic properties were used to control the quality of amorphization of the resulting structure. For generation of positions and velocities sampled from the NVE ensemble time integration with a time step Δ
t of 0.5 fs of Nose–Hoover-style non-Hamiltonian equations of motion were utilized. To imitate the extension into a film, periodic boundary conditions (PBC) were assigned along the
x and
z direction. Thus, for example, each atom crossing the left border of the specimen immediately was moving into the specimen again from the right side. All simulations were performed using Large-scale Atomic/Molecular Massively Parallel Simulator (LAMMPS) software [
27] on the basis of integrated loading and boundary conditions. The visualization of MD simulation data and structure analysis has been carried out using the open source visualization tool OVITO [
28]. The calculations were performed on the SKIF Cyberia supercomputer resource of Tomsk State University. The details about the calculation of interaction forces between atoms can be found in
Appendix A.
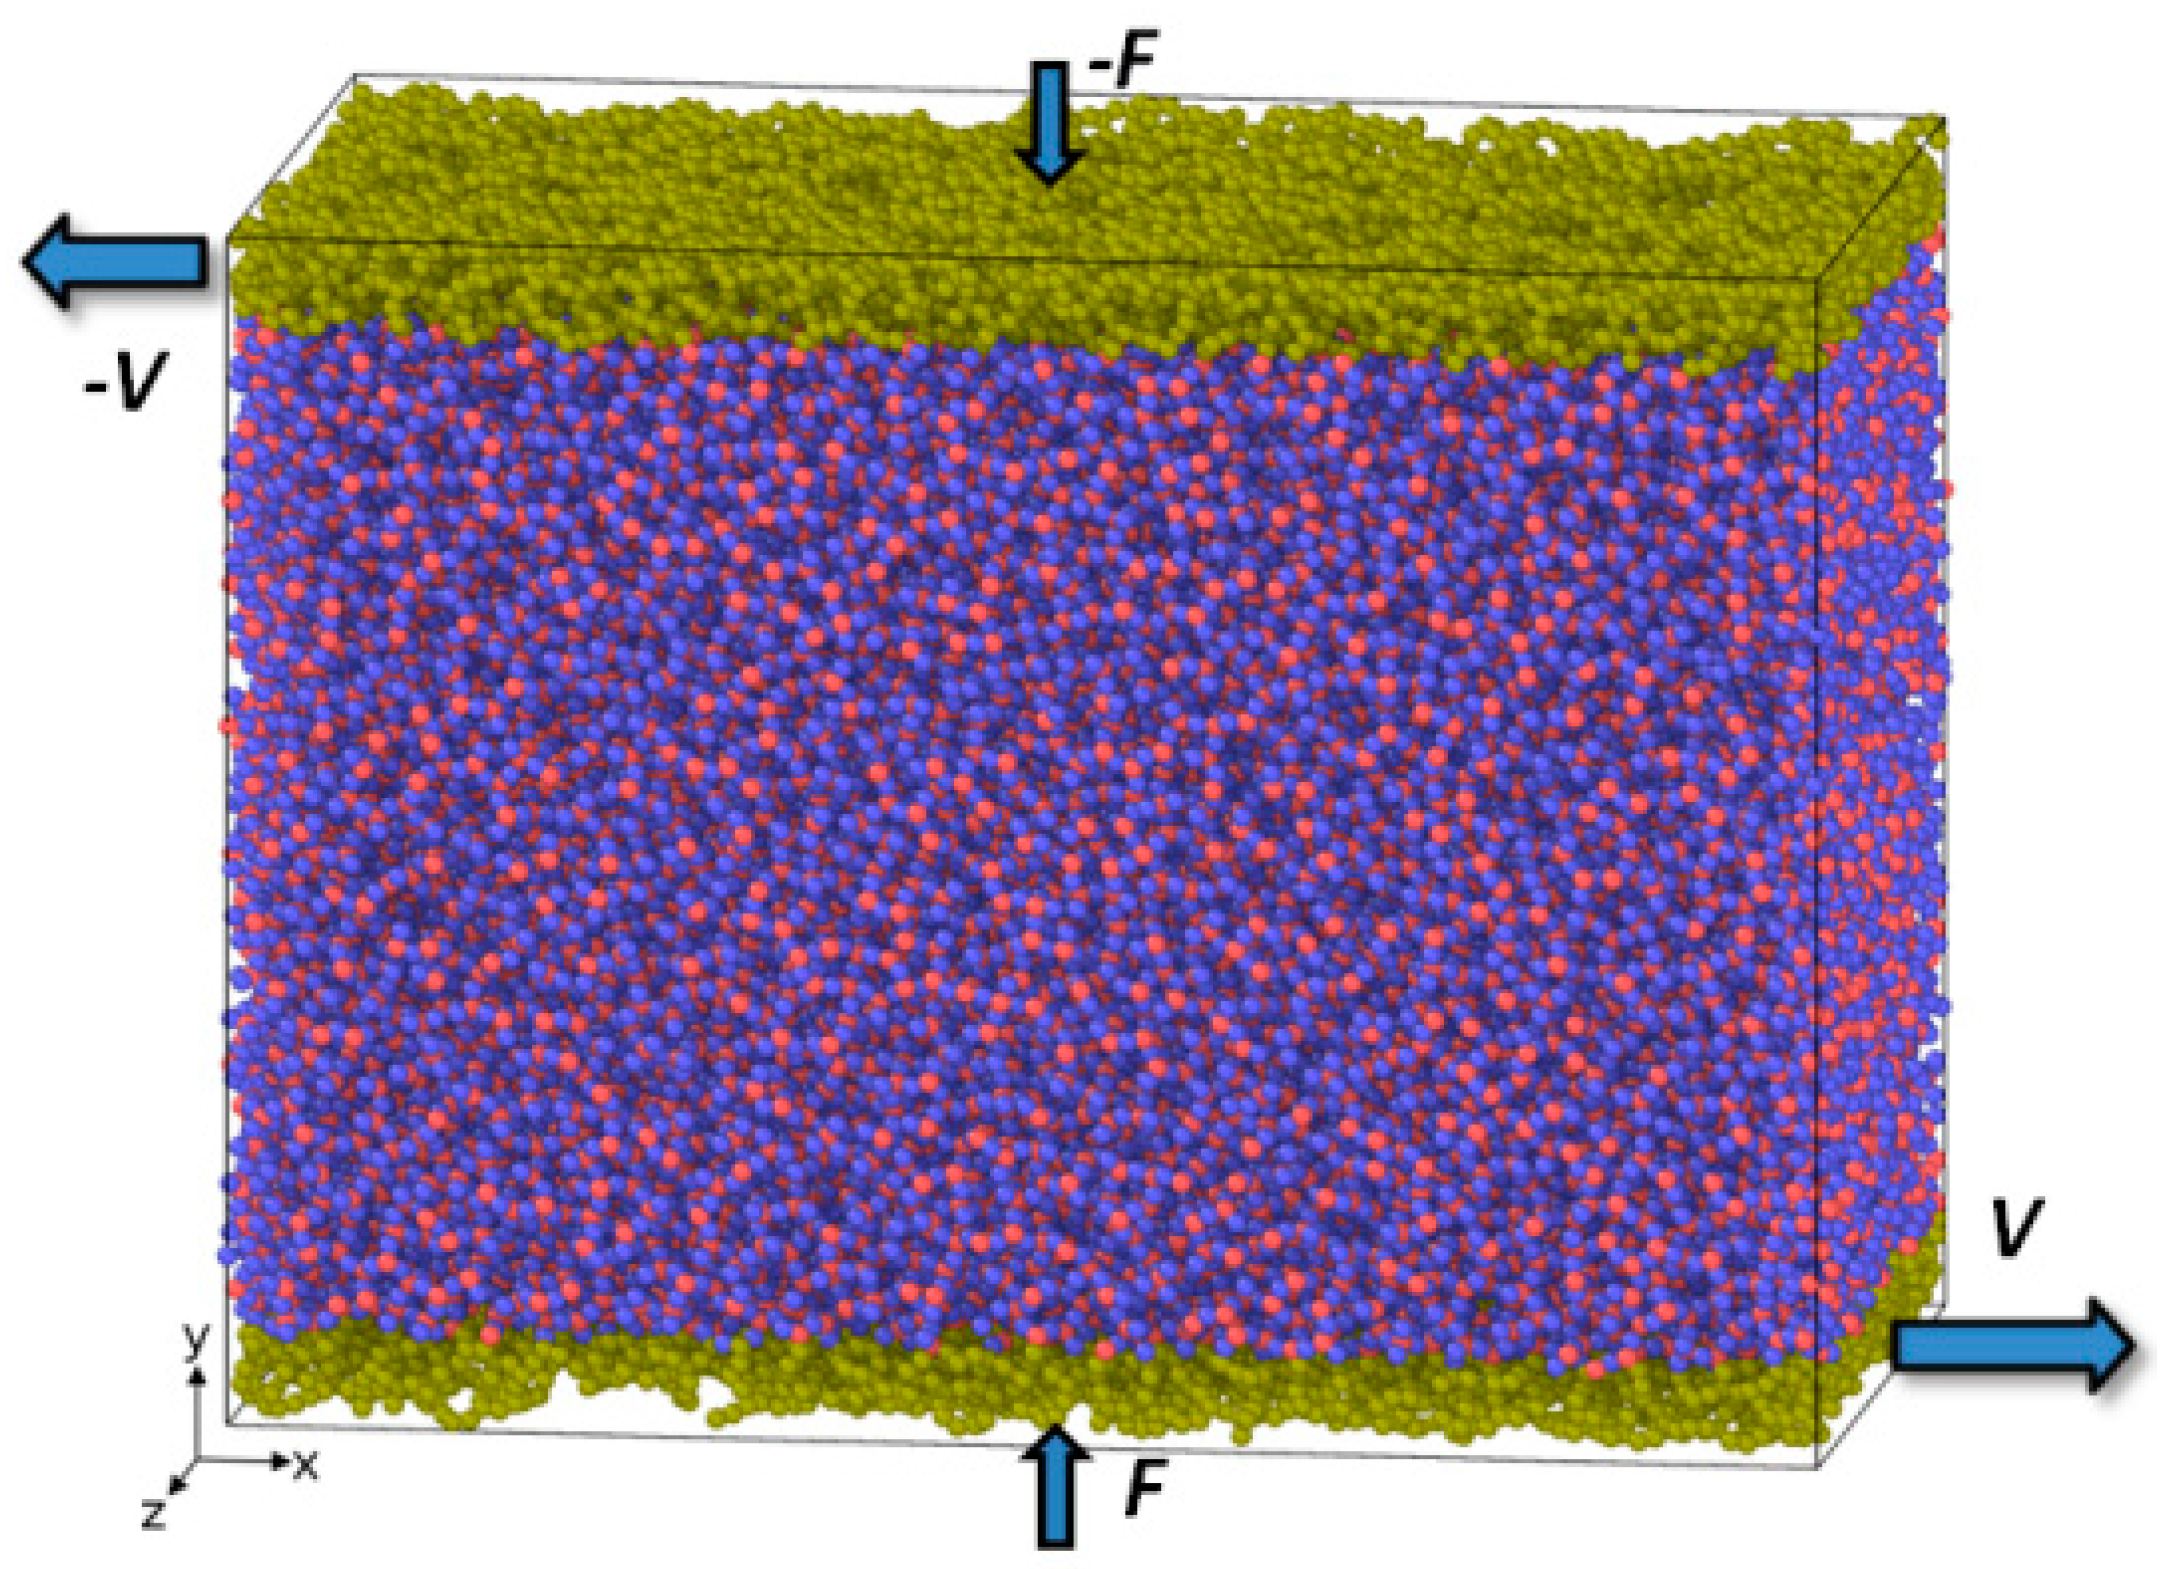
The resulting structure of the specimen for sliding simulation before shear loading is shown in
Figure 1. Sliding simulations were performed by applying a constant sliding velocity (
V) of +15 and −15 m/s to the lower and upper surface layer, respectively. Thus the total sliding velocity was 30 m/s. Atoms belonging to the surface layers are shown in yellow in
Figure 1. The surface layer thickness was 0.7 nm. Simultaneously with shear loading a normal force (
F) of 1.3 nN was applied along +
y- and −
y-directions yielding a total contact pressure of about 350 MPa. Due to periodic boundary conditions the resulting structure corresponds to a thin amorphous silica film with the thickness of approximately 13.5 nm subjected simultaneously to “shear and compression” loading. The influence of temperature on sliding behavior was studied as well. The temperature of the whole specimen was kept constant within NVT ensemble and was equal to 300 K in case of ambient temperature conditions, 500 K for sliding simulation under elevated temperature conditions and 1100 K for simulation under flash temperature conditions at the local contact (typical flash temperature reached during tribological testing under severe conditions [
1,
2]). Since the mechanical properties of amorphous material is closely related to its density, the resulting density was kept constant at 70 at./nm³ (2.25 g/cm
3) for all three tests.
3. Results of Sliding Simulation
The next stage of our research was to simulate the sliding performance of an amorphous silica film, at three characteristic temperatures, as described in
Section 2. It should be noted that the sliding simulation performed earlier using Tersoff’s potential showed a pronounced effect of the system temperature on the ability of a silica tribofilm to exhibit smooth sliding [
7]. The latter was obtained at the high temperature only, whereas at 300 K a stick-slip type of sliding was observed.
In the present study we reproduced the sliding test using the ReaxFF potential, in order to check the impact of the interatomic potential.
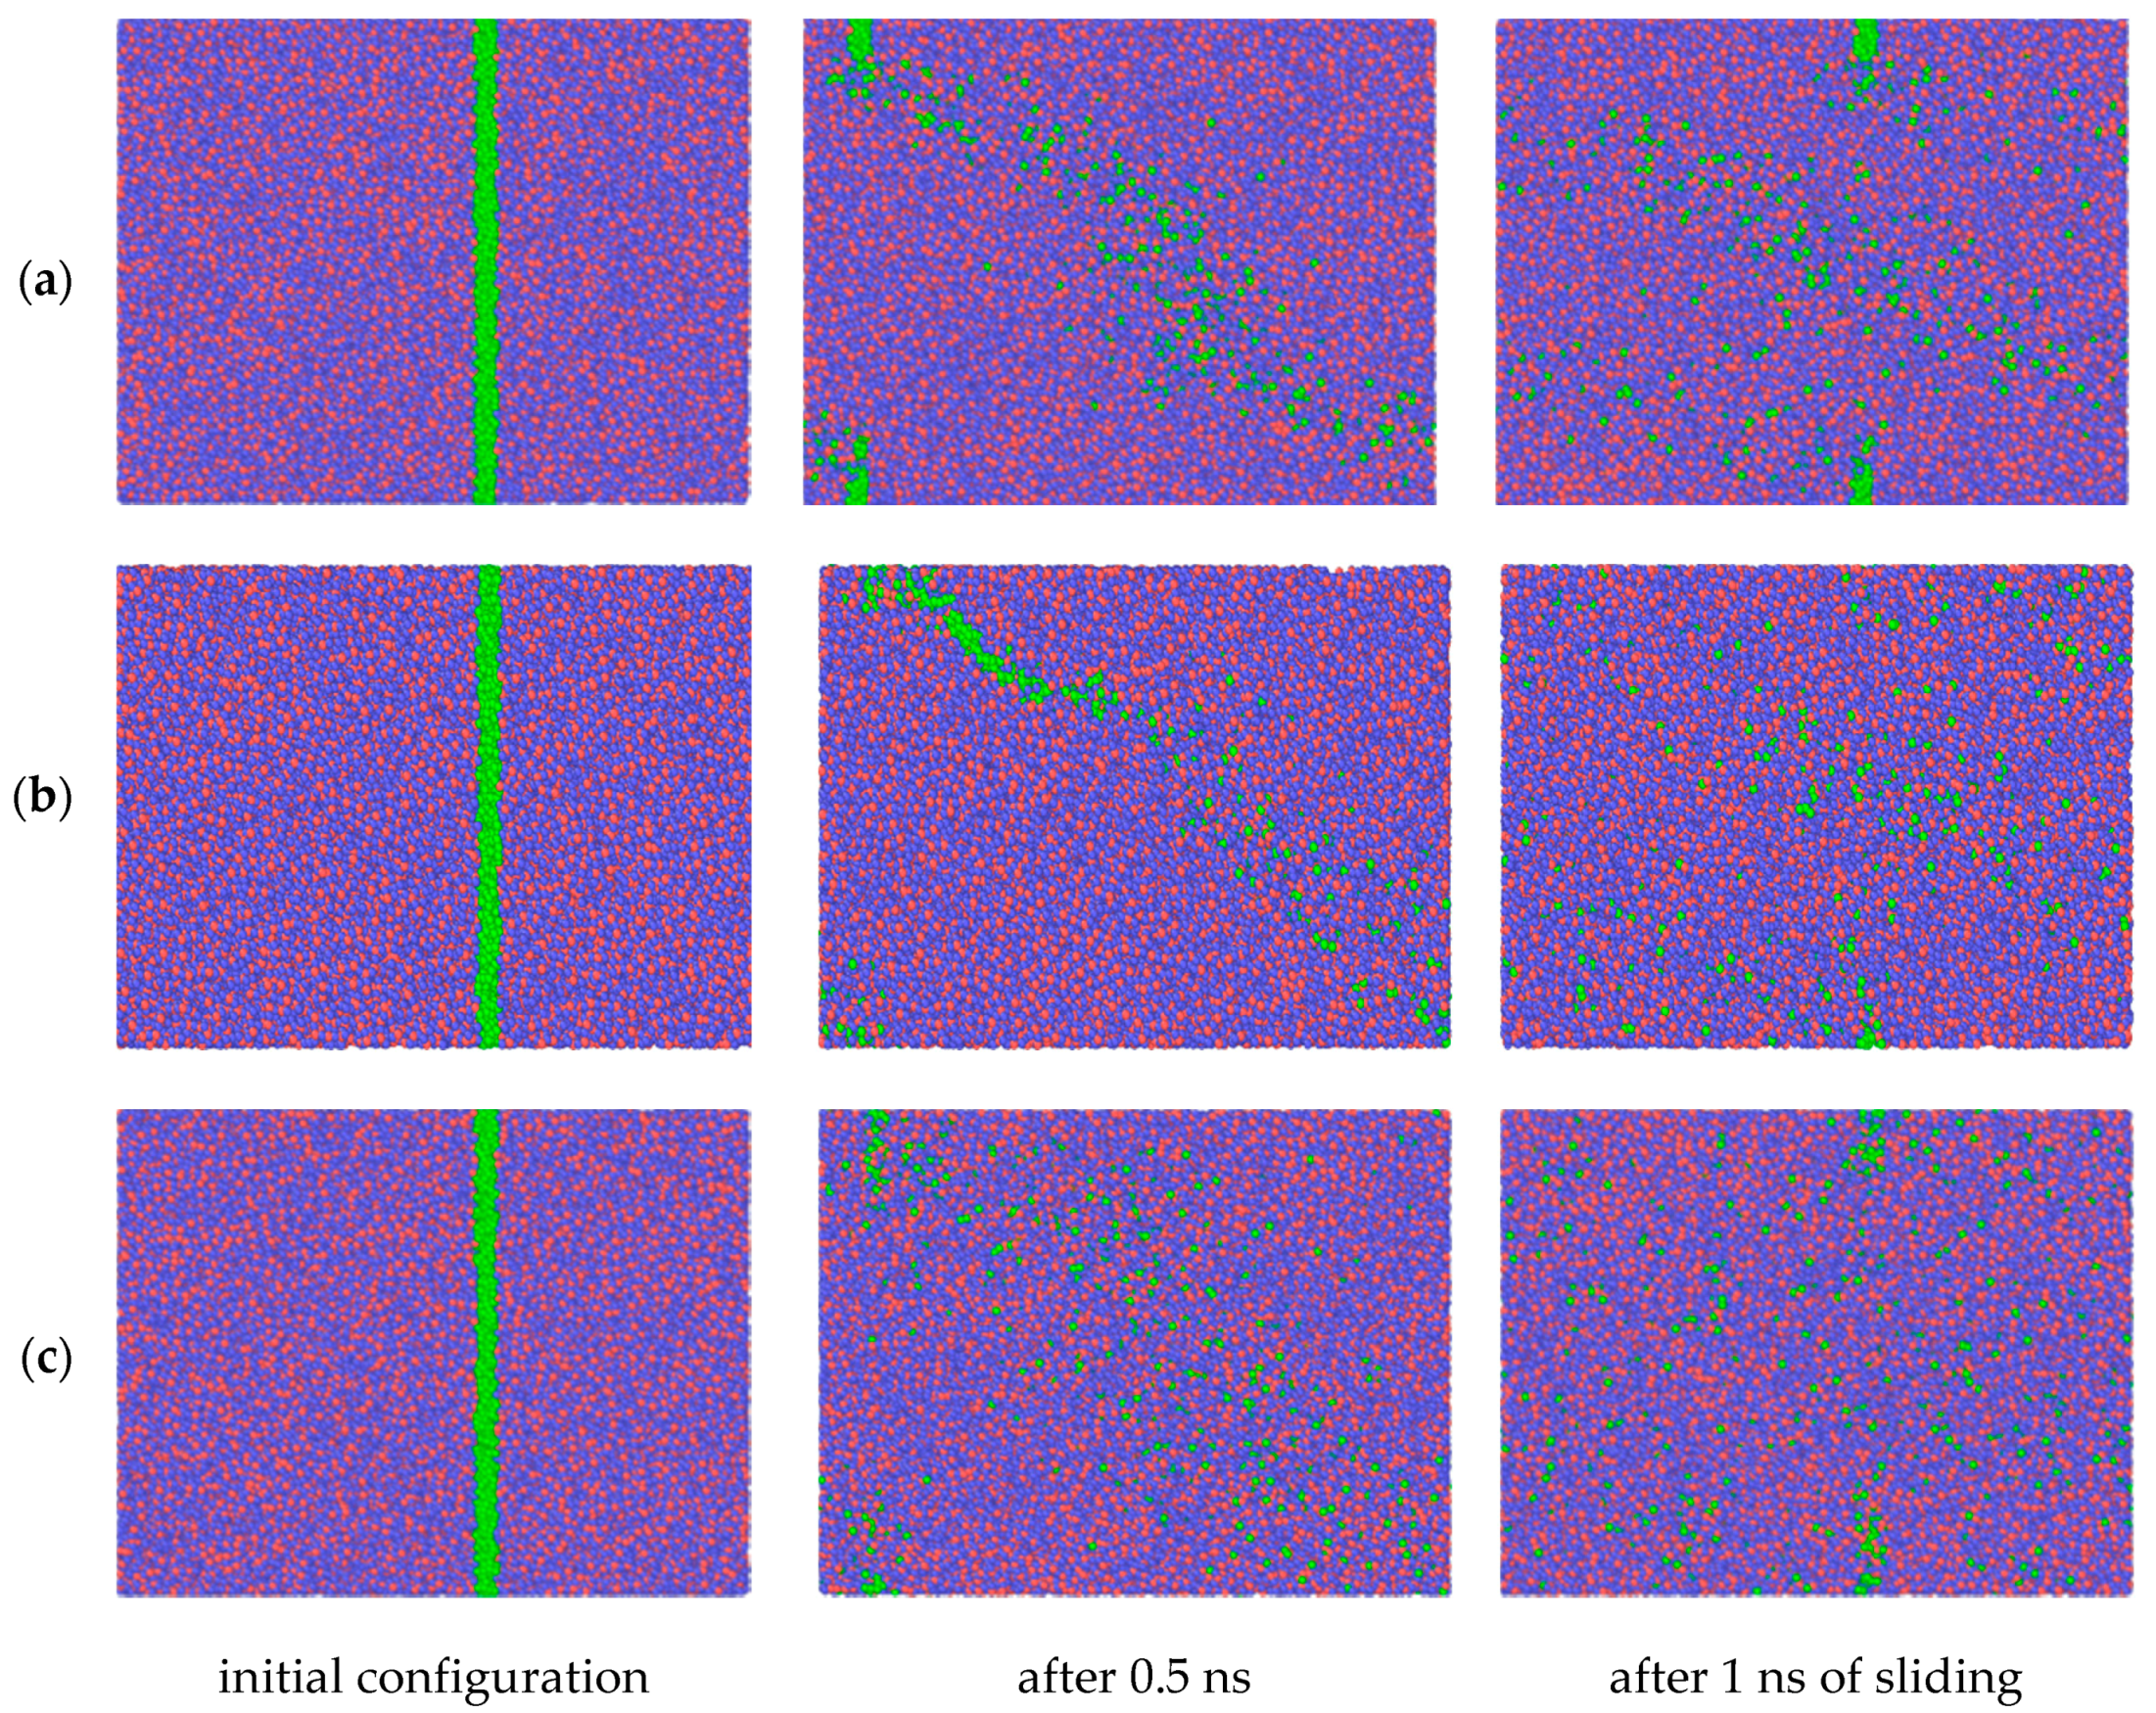
Figure 2 shows the evolution of the atomic configuration of a loaded specimen subjected to shear loading. The temperature of the system was maintained constant at 300, 500, and 1100 K within the NVT ensemble for the series of snapshots shown in
Figure 2a–c, respectively.
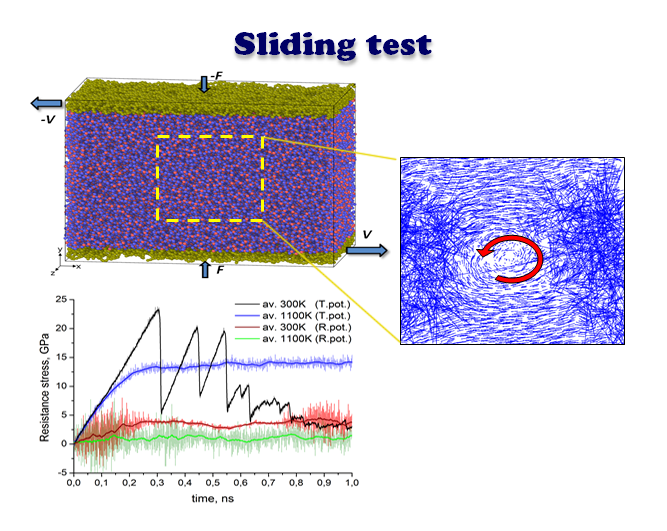
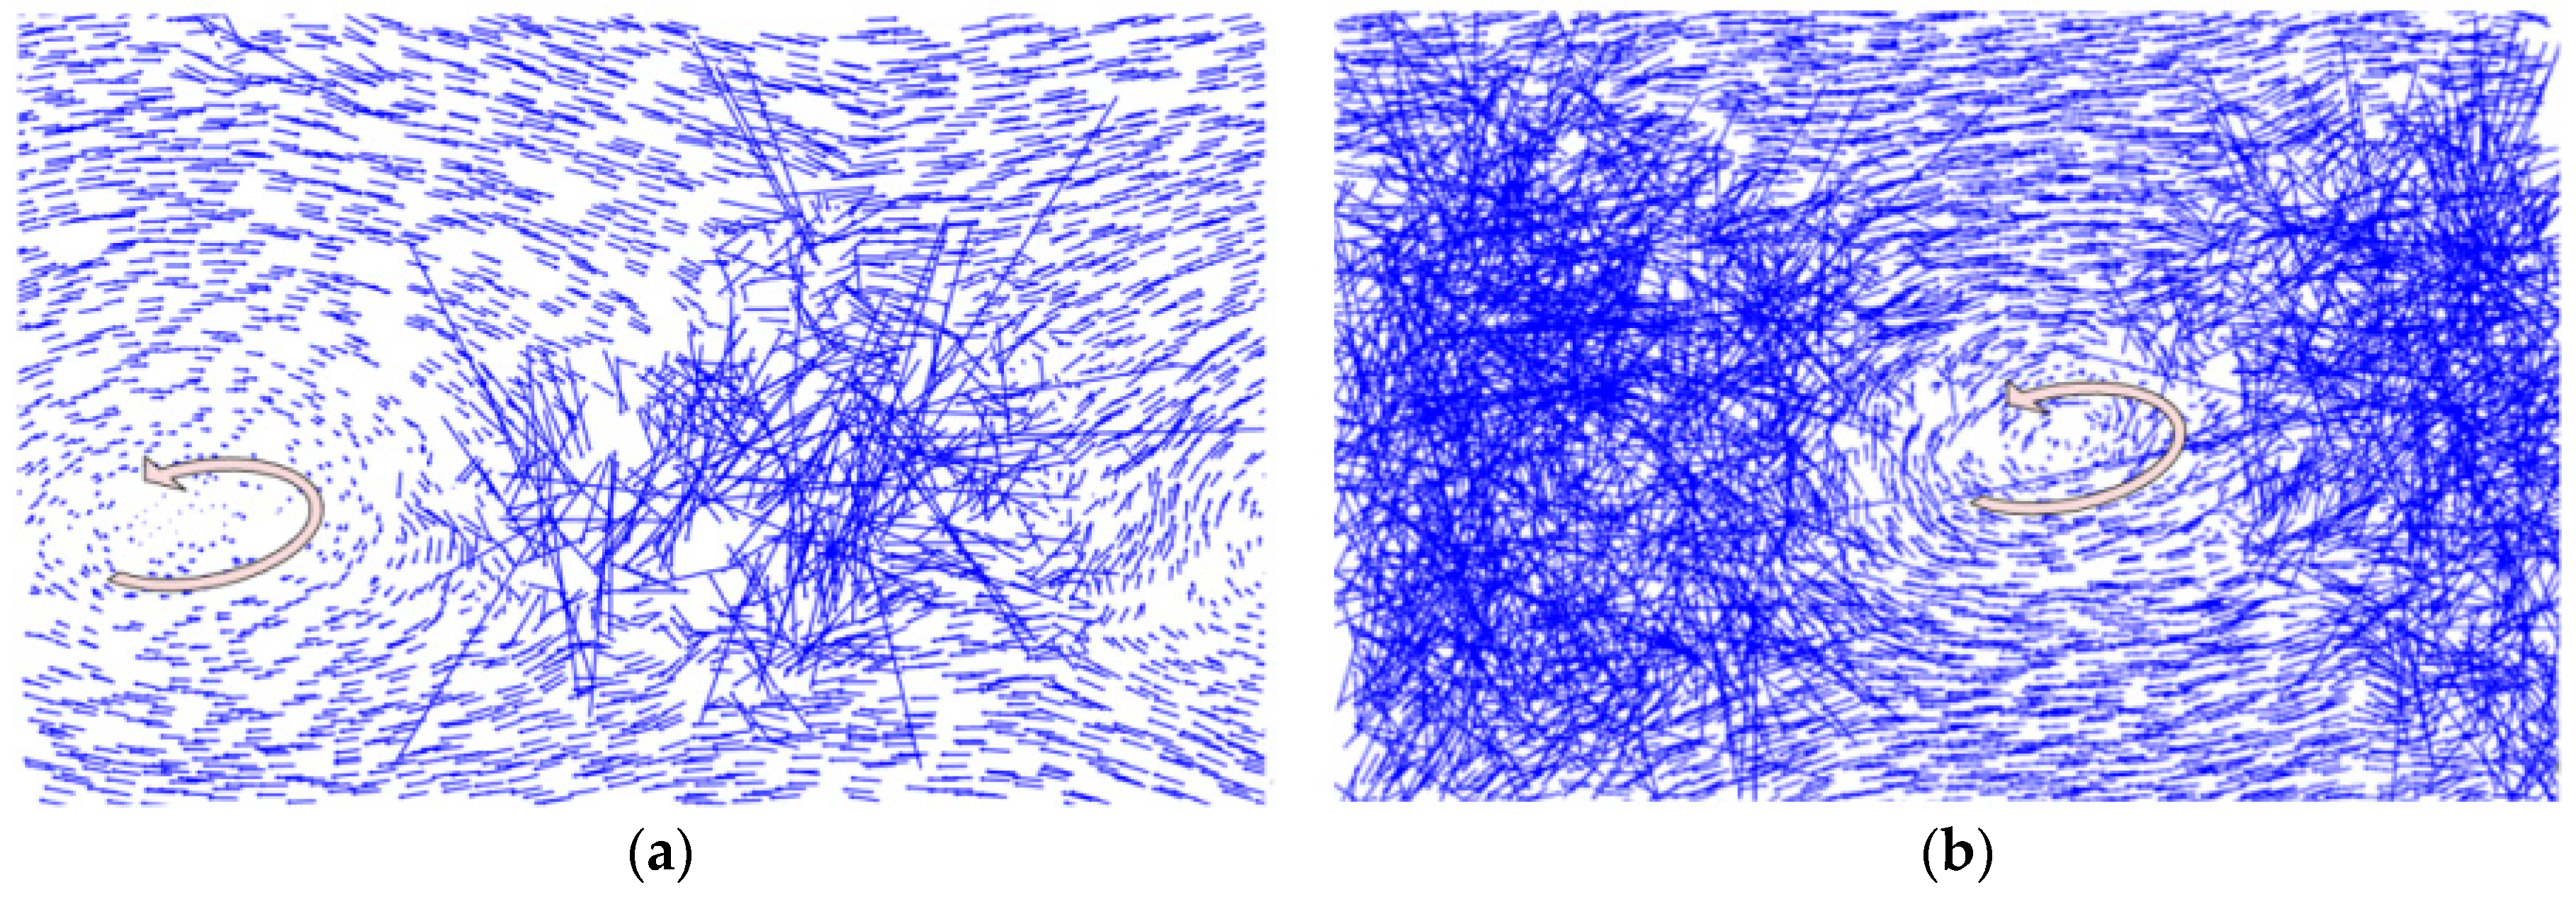
In all three cases, the relative sliding of the boundary loaded layers of the amorphous silica sample results in a uniform velocity distribution between upper and lower part of the specimen along the volume in Y direction. However, as revealed by the position of the marked atoms, the flow is not completely laminar, especially for the highest temperature. It can be seen that after 1 ns of sliding at 1100 K the position of marked atoms is stochastically distributed in the bulk. This indicates the existence of additional mass mixing and vortex like motion, caused by the high temperature of the system. Nice examples of such a motion for selected temperature regimes are shown in
Figure 3.
Nevertheless, in spite of the rotational component in the relative motion of atoms in the amorphous layer the formation of spherical agglomerates, which were observed previously while using Tersoff’s potential at 300 K [
7], did not occur during the simulation if ReaxFF potential is used. What has been observed is a relative longitudinal displacement of the centers of the formed vortices during the shearing. This effect is seen in the
Supplementary Materials, which show the evolution of atomic structure dynamically.
4. Discussion
A comparison of MD results of tensile properties of nano-wires obtained with different potentials was provided recently by Chowdhury et al. [
16]. These authors came to following conclusion: “ReaxFF can better predict the structure and mechanical properties of the amorphous silica compared to other reactive force fields available in the literature.” A similar comparison was also made by Zhang et al. [
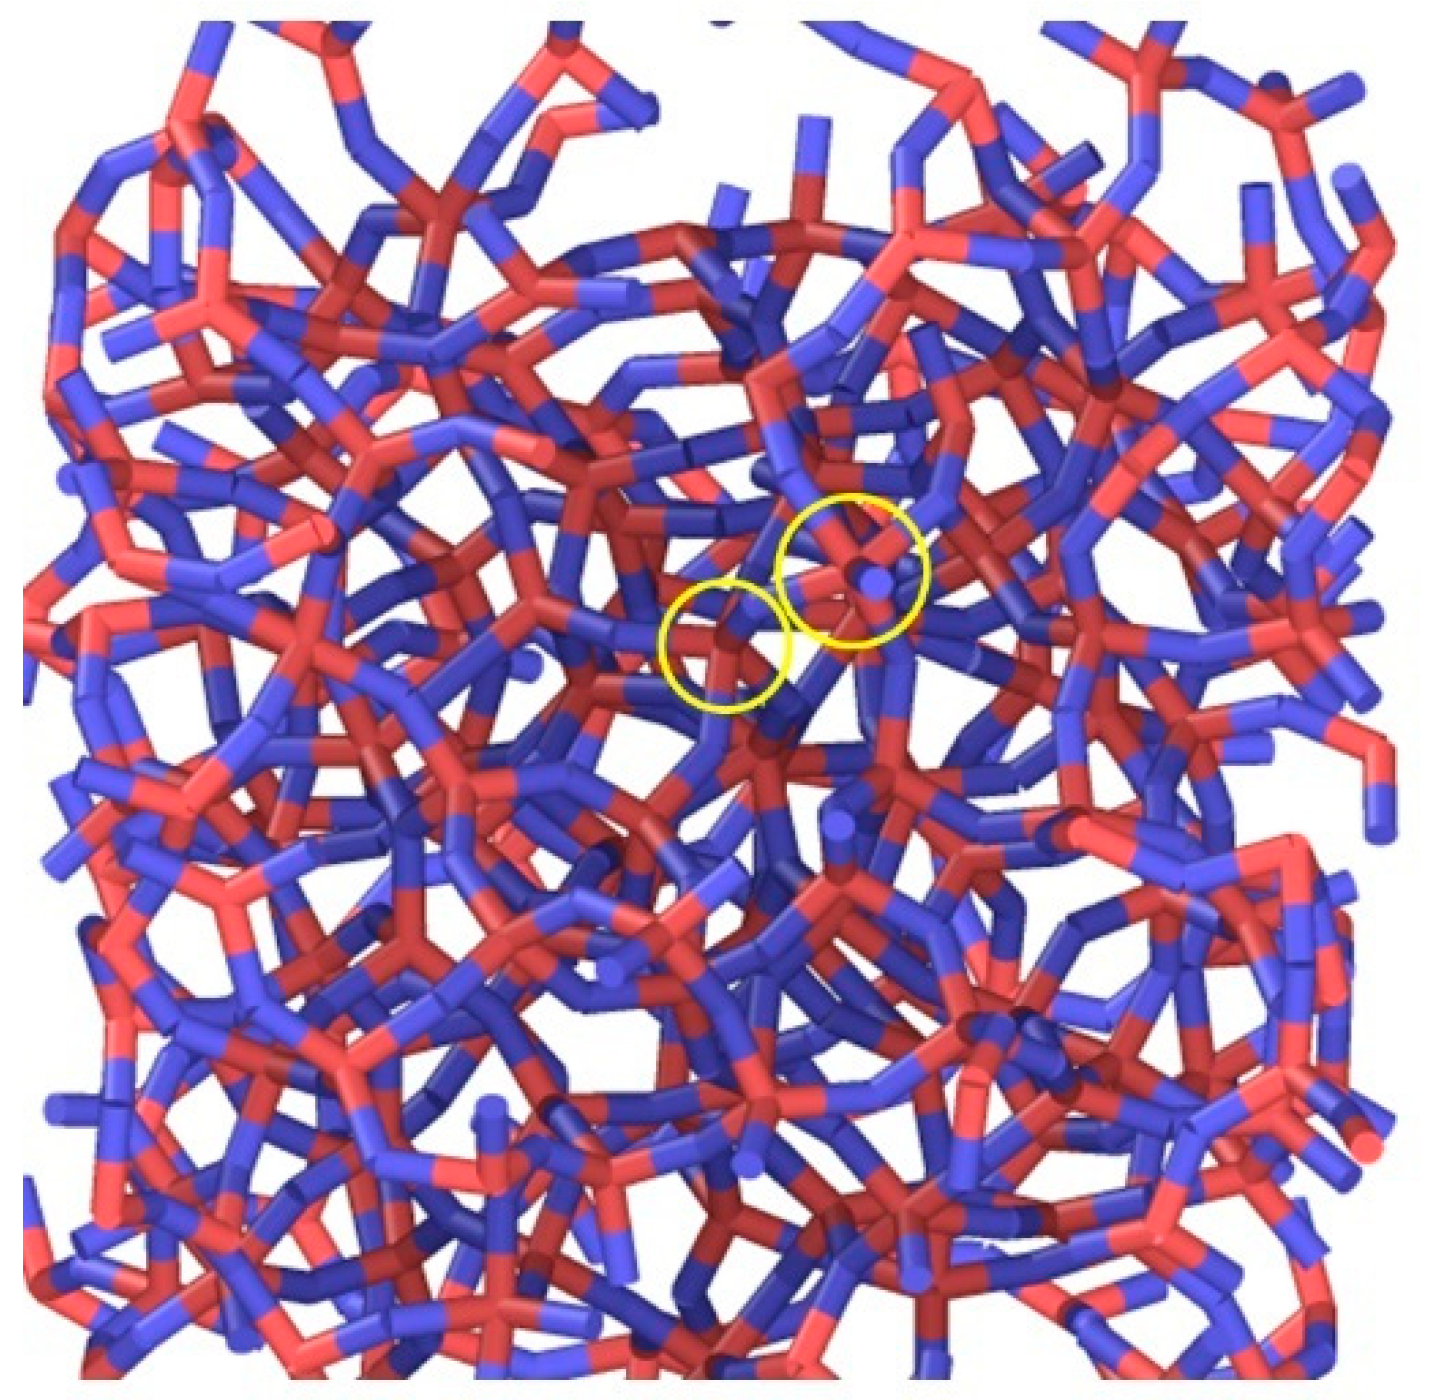
15]. However, if we consider sliding behavior under flash temperature conditions, the results using both potentials do not differ qualitatively from each other. The relative sliding develops within the amorphous layer through the mechanism of rupture and repairing of individual interatomic bonds. In case of Tersoff’s potential, the structure is predominantly characterized by 4-fold Si and a small number of 5-fold Si and 3-fold Si coordination defects, which is consistent with the conclusions of [
5]. Typical structure of Si bonds is shown in
Figure 4. However, for the ReaxFF potential, we observe only 3-fold Si and 4-fold Si. With increasing temperature, the number of 4-fold Si bonds decreases for both potentials, but for Tersoff-style calculations this means that the fraction of 5-fold Si coordination defects increases (
Figure 5a), whereas for the ReaxFF potential, 3-fold Si increases (
Figure 5b). Yuan et al. [
5] have observed an increasing number of 5-fold coordination defects with increasing hydrostatic pressure during quenching and a corresponding increase of ductility. This cannot explain our ReaxFF-results because we did not observe any 5-fold coordination defects neither at 300 K nor at 1100 K.
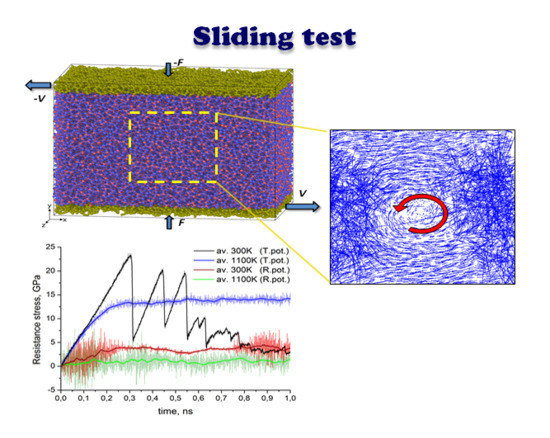
In
Figure 6 the time dependencies of tangential resistance stresses are shown for all three cases considered above (ambient, intermediate elevated and flash temperatures). For comparison similar sliding tests were calculated with both ReaxFF (
Figure 6a) and Tersoff’s (
Figure 6b) potential. The figures depict instantaneous (serrations) as well as average values (broad curve). The instantaneous values of resistance stress at each time step were calculated as a ratio of resistance force and area of the loaded layer, whereas the resistance force was computed as resulting tangential force at this time moment acting on all loaded atoms in that layer. The averaging in all cases consists of calculation of the mean value of 100 neighboring points. As expected, the average value of resistance stress at flash temperature conditions is much lower than the corresponding parameter at 300 K. This is obvious for data calculated with ReaxFF potential, but also valid in general for Tersoff-style calculations. Thus, according to the shown diagrams in
Figure 6a the average value of resistance stress at ambient temperature for ReaxFF potential is saturated at about 4 GPa while at 1100 K it does not exceed 2 GPa. On the other hand, peaks for Tersoff’s potential at room temperature reach 20 GPa and even higher, while the saturation level at 1100 K is about 14 GPa (see
Figure 6b).
In accordance with the differences in mechanical properties of amorphous silica samples discovered in [
15,
16], each potential demonstrates its own level for the average values of resistance stresses. Similar to elastic modulus and ultimate tensile strength the resistance stress in case of ReaxFF potential is much lower than the corresponding values with use of Tersoff’s potential for all three thermal conditions. The above is valid for all calculations during the first 0.5 ns of sliding before of the formation of spherical agglomerates in the case of using Tersoff’s potential at 300 K. The latter causes rolling of spherical aggregates along the separated upper and lower parts of the model structure after 0.5 ns of sliding, which causes a decrease in the average resistance stress. Before this, the sliding mode has an unstable character that is manifested by a spontaneous decrease of the average resistance stress, followed by its further increase. The difference in the features of the system behavior with the use of different potentials becomes especially noticeable when studying the results of sliding at the elevated temperature of 500 K. Whereas in the case of ReaxFF potential, the resistance stress level adopts an intermediate value between the results at 1100 K and 300 K, which corresponds to about 3 GPa, intermittent motions corresponding to a stick-slip type of behavior are clearly observed for the simulation with Tersoff’s potential (see
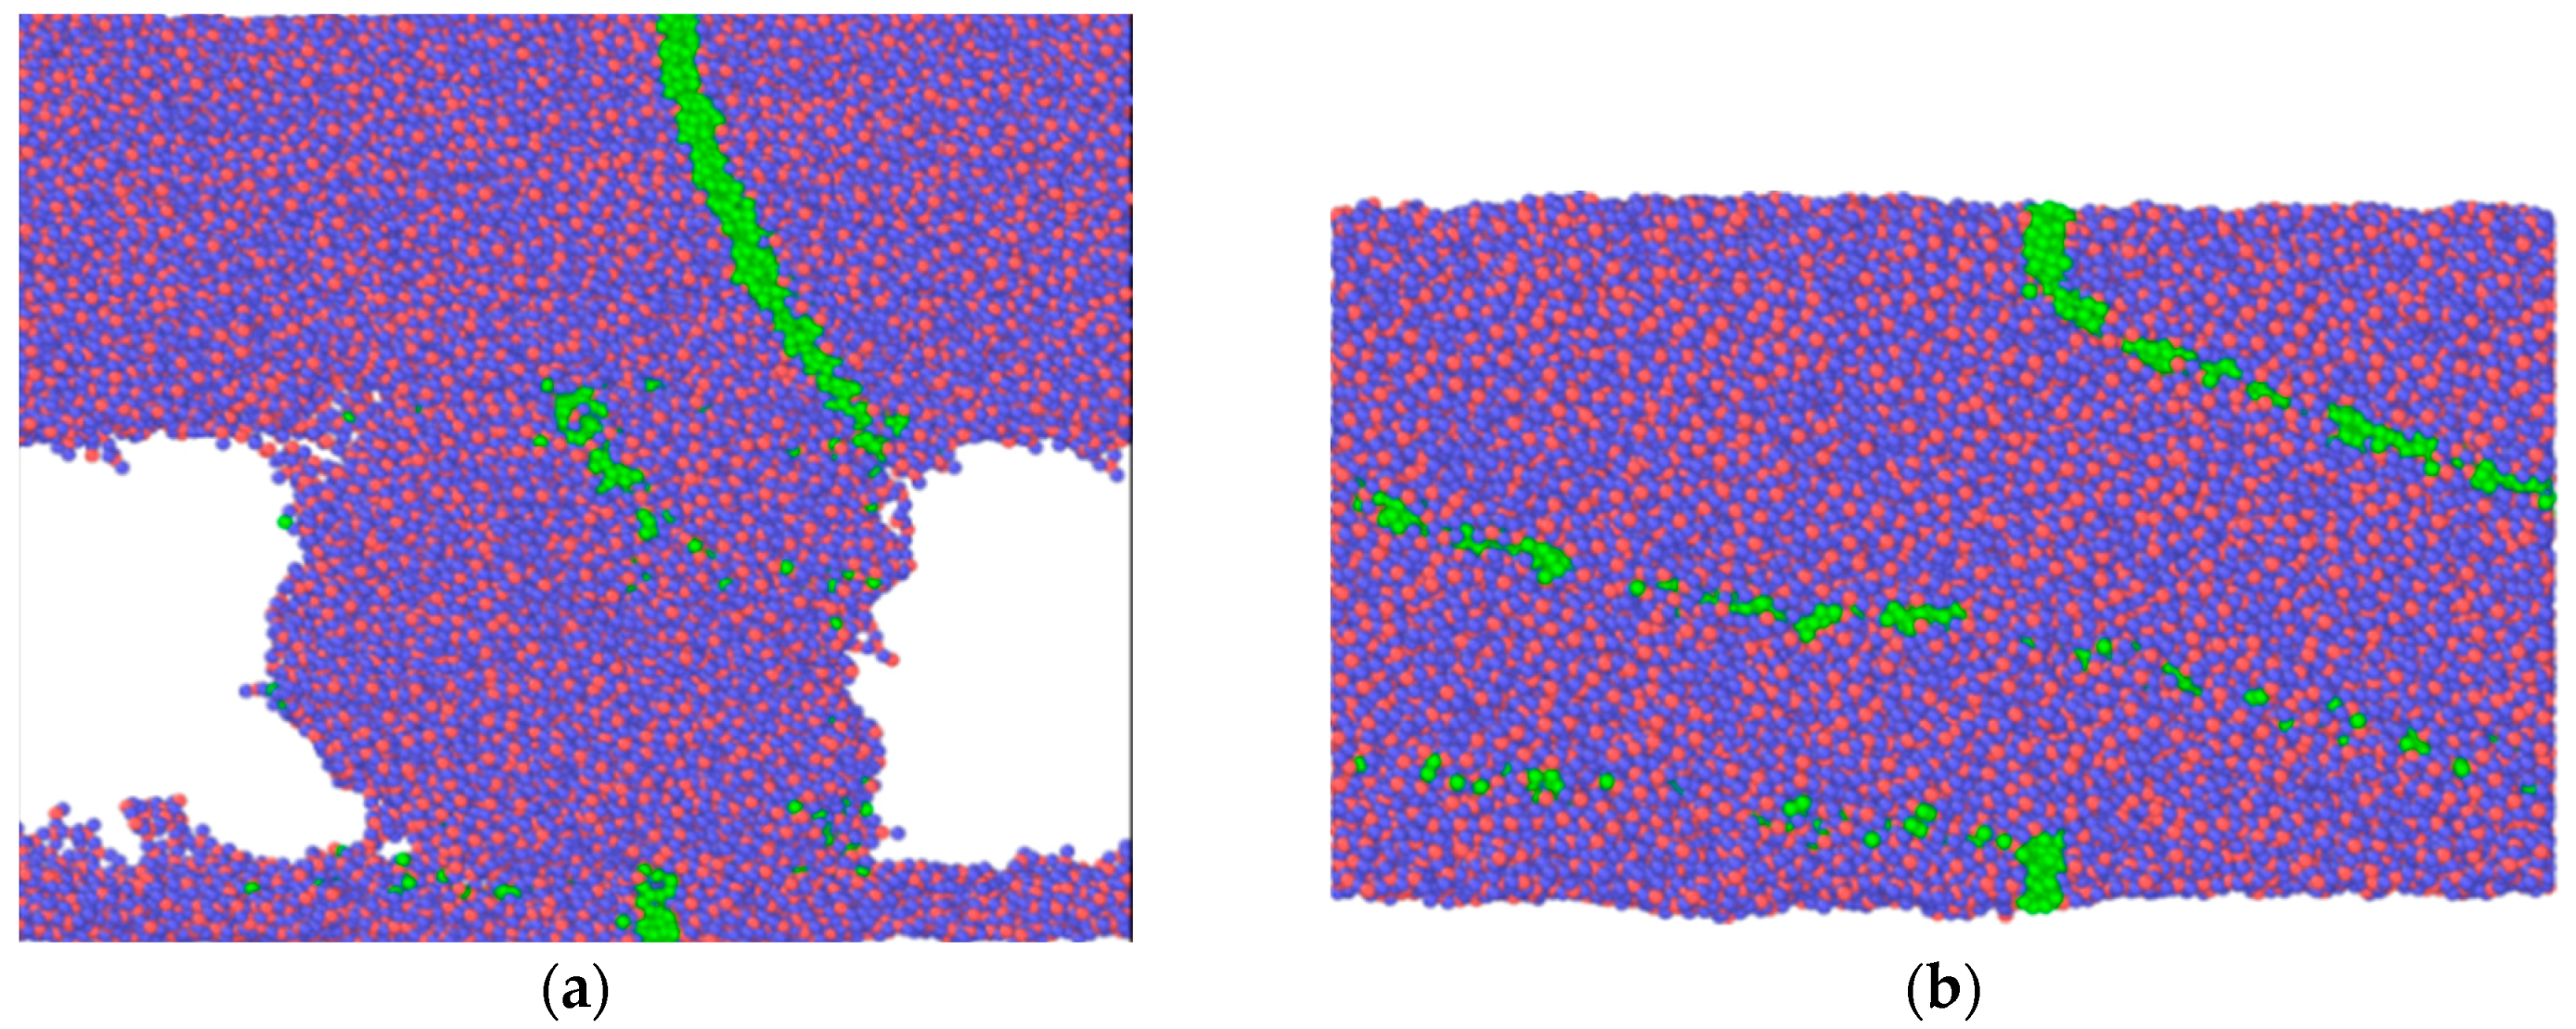
Video S3 “Silica 500 K sliding Tersoff”, Supplementary Materials). The results of atom arrangements of the amorphous silica sample after sliding simulations using Tersoff’s potential at 300 and 1100 K are shown in
Figure 7.
A certain tendency to unstable sliding (oscillation amplitudes of resistance stress instantaneous values) can be also observed while using the ReaxFF potential at 300 K (see red curve in
Figure 6a), although it does not provide a stick-slip mode of sliding. The difference in atomic configuration at flash temperature (1100 K) while using the two different potentials can be seen by considering the evolution of marked atoms. There is no mass mixing in case of Tersoff-style calculations. On the other hand, mass mixing is observed under the same thermal and loading conditions if the ReaxFF potential is used. Corresponding atomic configurations at 1100 K are shown in
Figure 2c and
Figure 7b. From this we might conclude that sliding simulations using Tersoff’s potential are more suitable for predicting the smooth sliding behavior observed experimentally under extremely high thermal conditions, and rough sliding observed at room temperature [
1]. On the other hand, the resistance stress is much lower while applying ReaxFF instead of Tersoff’s potential during simulation. Moreover, the formation of some vortices within the amorphous layer has no effect on the smooth sliding regime if the ReaxFF potential is used. This suggests that the low coefficient of friction (COF) observed experimentally under severe stressing conditions [
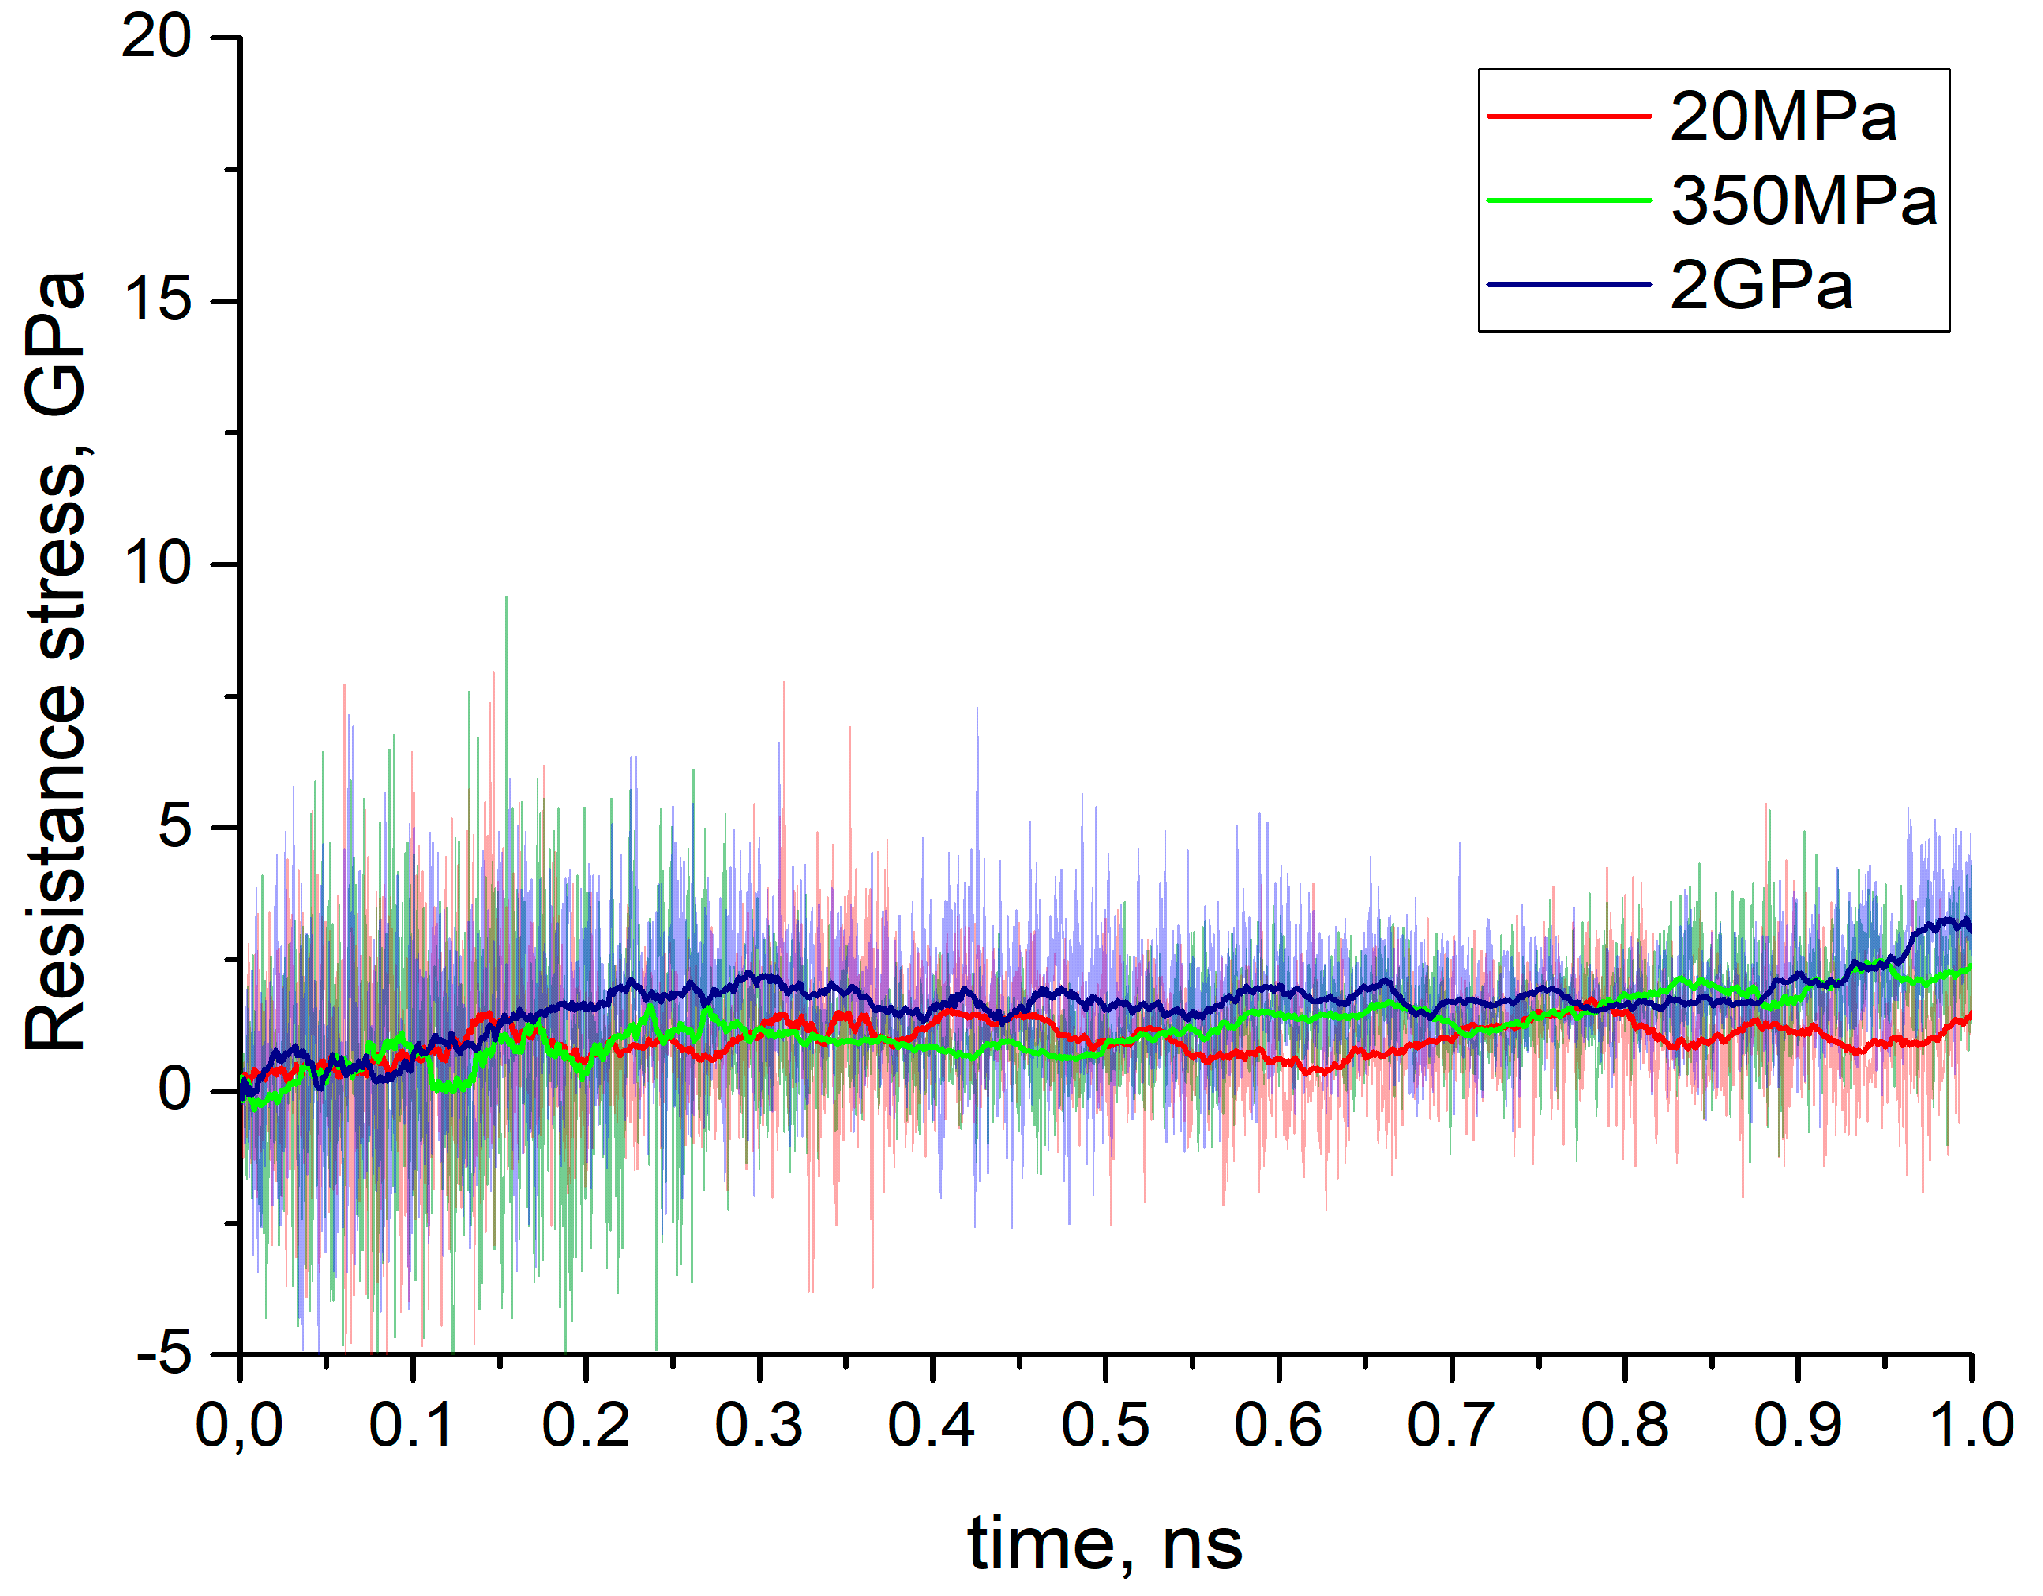
1] can be better explained by ReaxFF type simulations. Unfortunately, it is not possible to derive a plausible COF by dividing the resistance stress with normal pressure indicating that friction on the atomic scale does not correspond to macroscopic friction. Furthermore, additional simulations shown in
Figure 8 reveal that increasing normal pressure exerts almost no impact on resulting resistance stress. This means that classical friction laws do not apply. This is not surprising since the latter depend on roughness profiles and the dynamics of real contact area evolution. Moreover, calculations of density at different normal pressures resulted in only minor changes of resistance stress (see
Table 1).
5. Conclusions
Taking into account the presented results we can conclude that sliding simulations using both Tersoff’s and ReaxFF potentials are useful for obtaining a better understanding of the experimental finding, namely the reduction of friction of a-silica under severe stressing conditions, at least qualitatively. Nevertheless, there are significant quantitative differences between the simulation results in terms of resistance stresses and sliding mechanisms that demonstrate the importance of potential’s choice, especially if they are used beyond the “confidence” region in which they have been fitted and tested. Thus sliding simulation of a pure silica film using ReaxFF potential predicts smooth sliding for all considered thermal conditions. Sliding at 300 K and 500 K provides almost the same shear strength because the process is not temperature-activated but rather is of mechanical origin. The friction forces at 1100 K are considerably lower, most likely due to approaching the glass transition temperature where ductility increases. Doing the same simulations with Tersoff’s potential yields smooth sliding only at the highest temperature (above the glass transition temperature of about 700 K according to our own estimations), whereas at 300 K and 500 K Tersoff-style calculations manifest stick-slip behavior, which is completely absent in the case of ReaxFF. Although our experimental findings also show unstable behavior and high friction for a-silica at room temperature, this must not mean that simulations based on Tersoff’s potential are reproducing experiments correctly. Macroscopic friction mainly depends on processes taking place at the asperity level. Nevertheless, a two-fold reduction of friction forces, as observed by ReaxFF-simulations while comparing flash temperature and room-temperature conditions, will certainly excerpt an effect on macroscopic friction as well. For simulations using Tersoff’s potential the resistance stress at 1100 K is still very high (13 GPa compared to 1 GPa for ReaxFF simulation). It even exceeds the resistance stress simulated at room temperature, after initiation of the stick-slip mechanism leading to the rolling of silica particles. For this reason, and also because of the better correspondence of tensile test results obtained with ReaxFF while compared with experimental results obtained with silica nanowires, we believe that the results of sliding simulations using ReaxFF are more reliable as the ones obtained with Tersoff’s potential.


