Meta-Analysis Comparing Wettability Parameters and the Effect of Wettability on Friction Coefficient in Lubrication


Department of Mechanical Engineering, Rochester Institute of Technology, Rochester, NY 14623, USA
*
Author to whom correspondence should be addressed.
Lubricants 2018, 6(3), 70; https://doi.org/10.3390/lubricants6030070
Submission received: 26 June 2018
/
Revised: 30 July 2018
/
Accepted: 8 August 2018
/
Published: 15 August 2018
(This article belongs to the Special Issue Ionic Liquids: Friction and Lubrication Mechanisms)
Abstract
:This work presents a meta-analysis that compares the suitability of various parameters used to characterize wettability in tribological systems. It also examines the relationship between wettability and the friction factor for multiple lubricant-surface pairings. The characterization of wetting behavior was similar when using the contact angle between a lubricant and surface and various dimensional and dimensionless formulations of a spreading parameter. It was possible to identify hydrodynamic, boundary, and mixed lubrication regimes by combining a dimensionless wettability parameter with the specific film thickness for a variety of neat ionic liquids and magnetorheological fluids in contact with metallic, thermoplastic, and elastic surfaces. This characterization was possible using multiple dimensionless wettability parameters, but those that can be fully determined using only the contact angle may be preferred by experimentalists. The use of dimensional and dimensionless wettability parameters that included polar and disperse components of surface tension and surface energy did not appear to provide additional insight into the wettability or frictional performance for the tribological system examined here.

1. Introduction
The friction and wear of moving components in industrial applications results in economic losses of 1.0 to 1.5% of a country’s Gross Domestic Product [1,2]. These losses represent approximately $170–$300 billion in the United States alone. Research into new materials, coatings, lubricants, and lubrication practices may greatly reduce the undesired effects of friction. Developing a deep understanding of a mechanism’s driving friction and wear under a variety of different operating conditions is critical to this effort.
Three lubrication regimes are typically identified when a liquid lubricant is used between two sliding surfaces [3]: boundary lubrication (BL), mixed lubrication (ML), and hydrodynamic lubrication (HL). The BL regime has appreciable asperity contact, resulting in high friction. A thin film of fluid partially separates the surfaces in the ML regime. This film reduces friction in the system, because the contact pressure is supported by both the fluid film and the solid surfaces. In HL, a thick film of lubricant is interposed between the surfaces in relative motion, avoiding contact of asperities. This regime has the lowest initial friction (elastohydrodynamic lubrication), but viscous effects increase the friction coefficient as the fluid film thickness increases.
The specific film thickness () is a dimensionless parameter that has been used to characterize the lubrication regime of contacting surfaces in relative motion [4,5]. This parameter is also referred to as the lambda parameter or the lubricant film parameter. The specific film thickness is defined as
where h is the lubricant film thickness, and and are the average [4] or root mean square [6] roughness values of the surfaces in contact. Analytical expressions for the film thickness () can be determined from theoretical equations of elastohydrodynamic lubrication and several alternative formulations can be found in reference [7]. When the specific film thickness is large (), the oil film is thick enough to ensure there is no asperity contact between the surfaces and that the system experiences hydrodynamic lubrication [6]. Boundary lubrication is expected when and the lubricating film is not thick enough to prevent contact between the surfaces [3,6]. The transitional ML regime is observed for moderate film thicknesses ().
Viscosity, density, wetting properties, thermostability, and the ability to form tribofilms of fluids are key factors for any oil lubrication system. The effects and relative importance of these properties can be dependent on the lubrication regime. For example, increasing the lubricant viscosity can help to create and maintain an oil film between the contact surfaces in BL. However, in HL, an increased viscosity results in undesirable viscous friction.
While the role of lubricant viscosity is fairly well established [3,8], the effects of wettability across multiple wetting regimes is less well understood [6,7,8,9,10,11,12,13,14,15,16,17]. To improve the understanding of wettability in tribological systems, recent investigations have worked to characterize the wettability of a variety of novel lubricants [6,12,13,14,15] and to understand the role of wettability in tribological performance [6,7,8,10,11,16,17,18]. In HL, high wettability (and low contact angles) are often desirable. This high affinity between the lubricant and the surface improves film stability and makes it easier for a lubricant to penetrate small gaps between surfaces [18,19]. However, low wettability appears to be preferable in BL for a variety of lubricant surface pairings [6,9,10,11]. While the reduction in friction in these cases is often attributed to interfacial slip, the mechanism for that slip has been attributed to a variety of mechanisms including: low wettability [6,9,11,16], high wettability [20,21], and air trapping in the lubricating film [22,23].
Another area of disagreement in the literature relates to how wettability should be characterized in tribological systems [6,9,10,11]. Over a series of works, Kalin and Polajnar concluded that wetting behavior is best characterized by a novel formulation of the spreading parameter that includes disperse and polar components of surface tension and surface energy [9,10,11]. However, Bombard et al. argued that characterizing the wettability with the contact angle provides a better correlation with the tribological performance of ionic liquid (IL) and magnetorheological (MR) lubricants between metallic (steel–steel), thermoplastic (polyoxymethylene: POM–POM), and elastic (polydimethylsiloxane: PDMS–PDMS) contact [6].
The use of apparent contact angles as a parameter to characterize wetting can lead to uncertainty. In particular, the strength of adhesion to the surface relative to cohesion within the fluid can alter the time required for a contact angle measurement to come to a steady state. For example, when cohesive energy is high relative to the adhesion contact angle, measurements only become stable after 15 s [9] to 1000 s [15]. Furthermore, apparent contact angle measurements can suffer from significant uncertainty when taken on rough or heterogeneous surfaces [24,25,26,27]. Future investigations examining wettability in tribological applications could potentially reduce this uncertainty by using advancing contact angles which are more consistent on rough and heterogeneous surfaces [24,25,28].
Another potential issue with using wettability to characterize tribological performance is that chemical interactions between the lubricant and the surface can alter the physiochemical properties of the system. Polar lubricants, such as ionic liquids, have the ability to form tribofilms on the surfaces in contact, reducing friction and wear under specific conditions. The formation of this film is favored by the polarity of the anion and high values of pressure, temperature, and/or sliding speed [29,30,31,32,33]. It may be possible to detect these physiochemical changes by monitoring changes in the wettability of the surface over time. Future investigations could also examine how the wettability of the system changes as a result of chemical interactions between the lubricant and the surface.
The current investigation will initially use data from published works [6,9,15] to determine if the contact angle and multiple formulations of the spreading parameter can be used interchangeably for the characterization of wetting in tribological applications. It will then use experimental data collected in reference [6] to examine how these parameters are correlated to the measured friction coefficient for a variety of lubricants on metallic, thermoplastic, and elastic surfaces.
2. Results and Discussion
2.1. Defining Parameters to Characterize Wettability
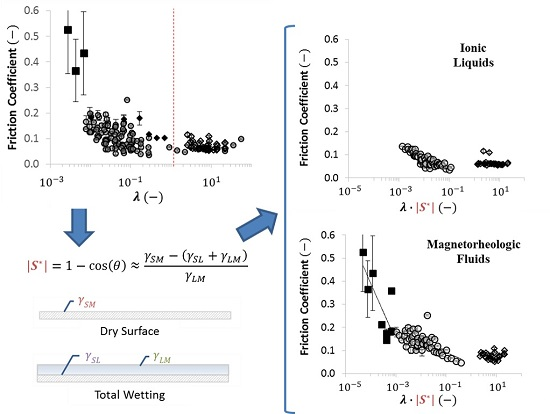
The effect of wettability on lubrication is typically characterized using the contact angle [6,15] or the spreading parameter [9,10,11]. The contact angle () is the angle that the interface of a droplet makes with the surface at the three-phase contact line. The spreading parameter () is defined as
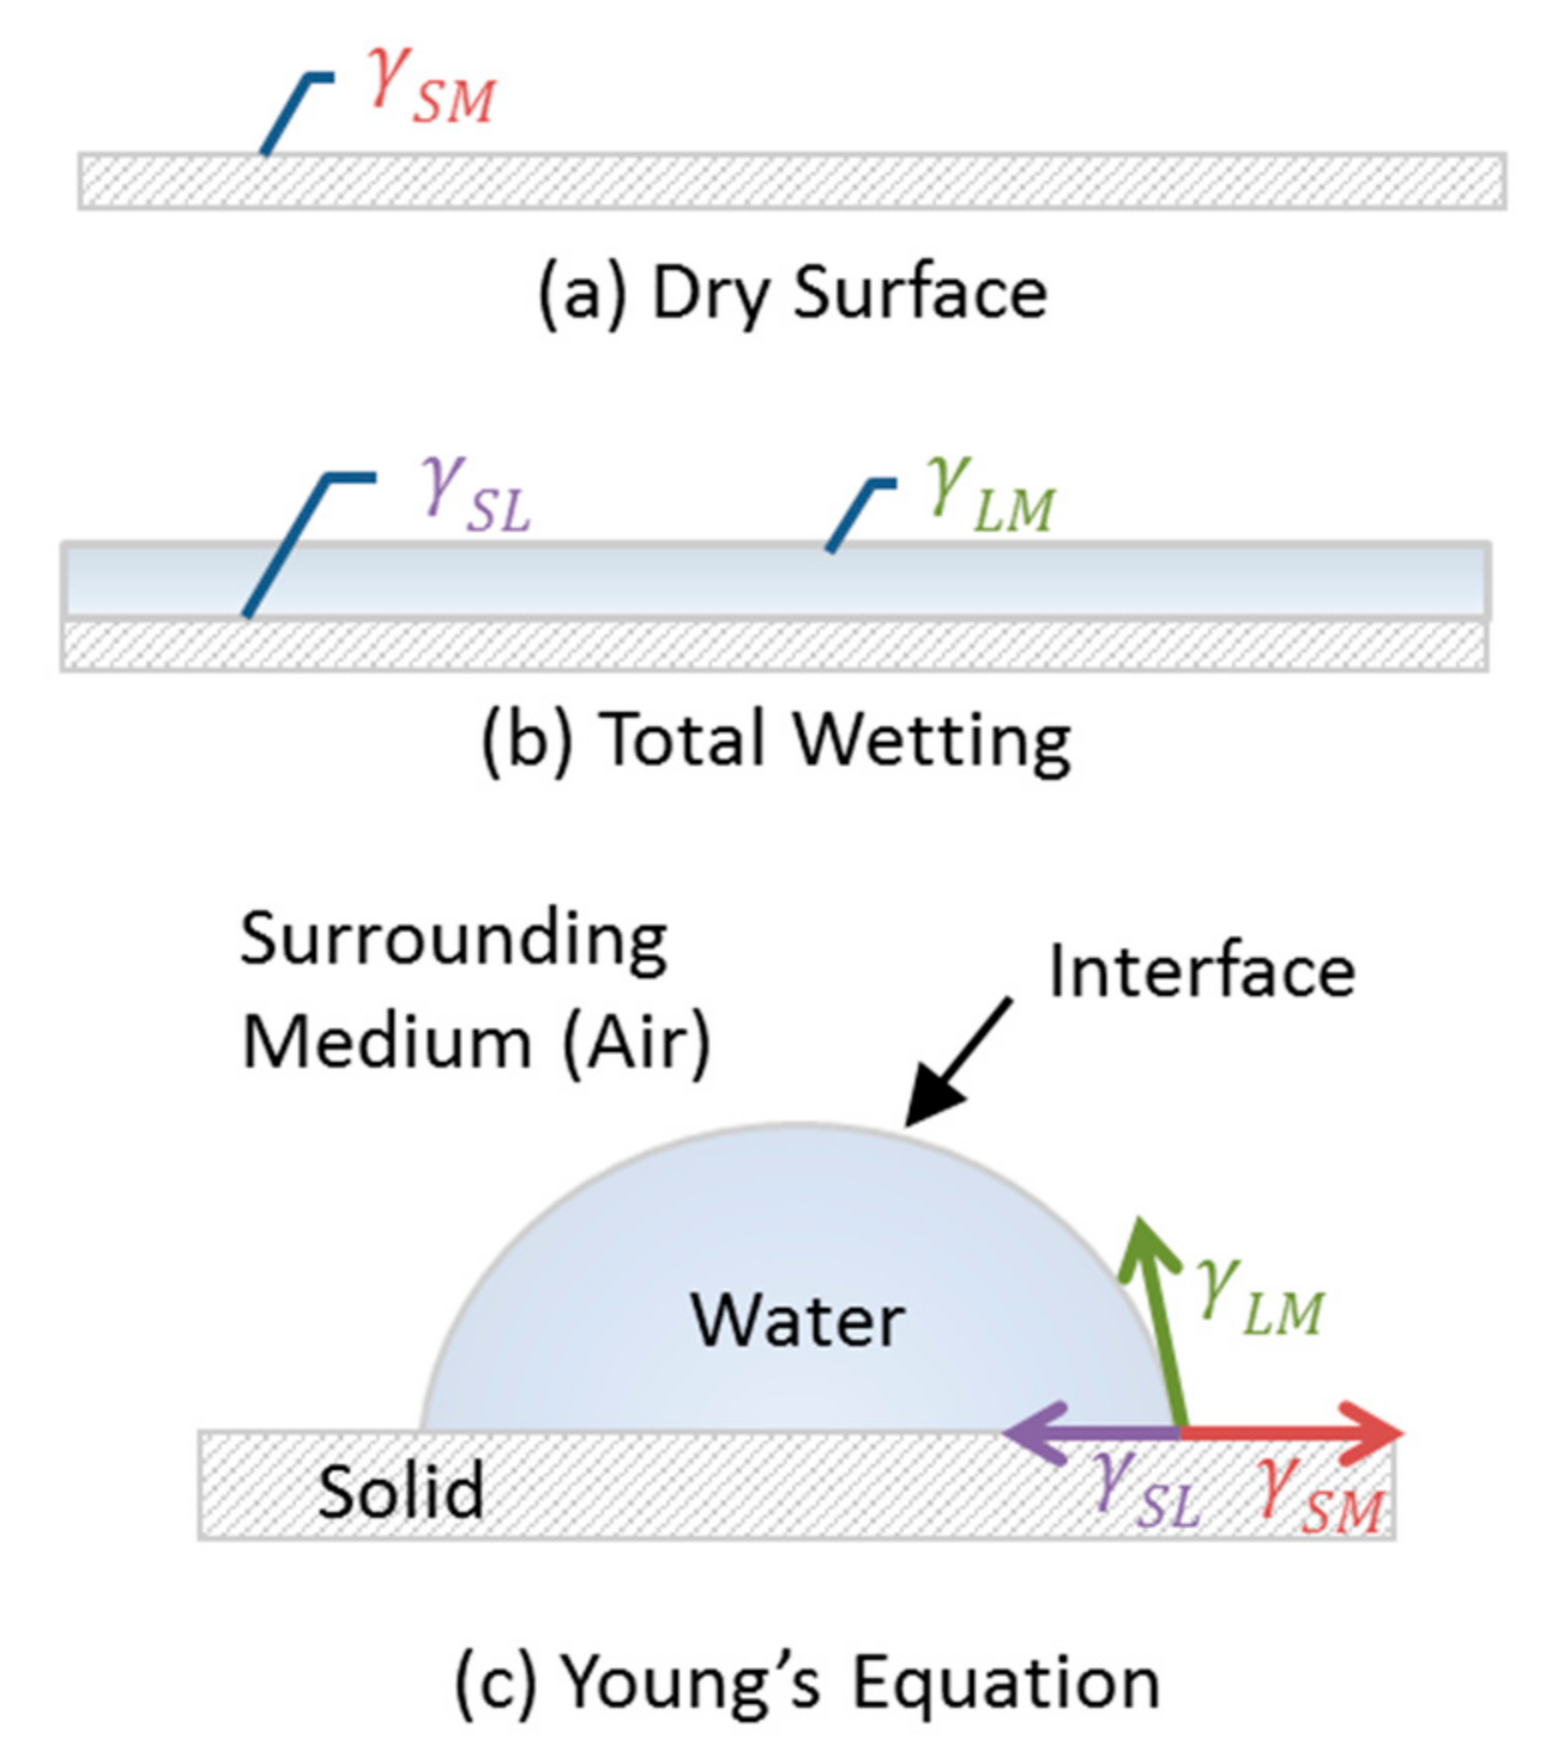
where is the surface tension between the liquid and the surrounding medium (air), is the surface tension between the surface and the surrounding medium, and is the surface tension between the surface and the liquid. The spreading parameter compares the total energy of a dry surface () (Figure 1a) with that of a fully wetted surface () (Figure 1b). When is positive, the surface energy is minimized when the fluid wets the surface. When is negative, the surface energy is minimized when the contact area between the fluid and the surface is minimized. This suggests that a fluid will form droplets on the target surface. While the spreading parameter is physically meaningful, the contact angle () is often preferred as it is typically easier to measure then and .
The spreading parameter can be described as a function of the contact angle by introducing Young’s equation. Young’s equation is a vector sum of the three components of surface tension at the contact line (Figure 1c) such that
Substituting (3) into (2) yields
Since (4) describes the competition between full and partial wetting, it can also be interpreted as the difference between the adhesion work between the fluid and the surface () and the cohesion work between liquid molecules () [12,14]. As shown in [12,14,34,35] adhesion and cohesion work can be estimated as
So, Equation (4) can approximated as
When , and fluid is drawn to the surface to increase the wettability of the surface. When , and fluid beads up on the surface because fluid molecules are drawn more strongly to each other. In Equations (3)–(6), the spreading parameter (), adhesion work (), and cohesion work () can be evaluated with knowledge of the surface tension between the liquid and the surrounding medium () and the contact angle between the liquid and the surface (). Both of these parameters can be attained through optical measurement [15,36,37].
An alternate formulation of the spreading parameter () was proposed by Kalin and Polajnar [9]. This formulation uses the Owens–Wendt–Rabel–Kaelble (OWRK) model [35] to incorporate the polar () and disperse () components of surface tension (). The OWRK model calculates the disperse (van der Waals) and polar (acid base or covalent) components of adhesion work () as
where is the surface energy, is the surface tension between the liquid and the surrounding medium, and superscripts and denote the disperse and polar components of each term [9,10,11,35]. Combining Equations (7) and (8) yields the spreading parameter () proposed by Kalin and Polajnar:
The evaluation of (9) requires knowledge of the total, disperse, and polar components of surface tension between the liquid and the surrounding medium () and the diffuse and polar components of the surface energy of the solid (). The diffuse and polar components of the surface energy can be determined through a series of experiments measuring the contact angles of model liquids on a surface of interest [6,9,10,11,12,14]. The diffuse component of the liquid surface tension is determined by measuring the contact angle of the liquid on a polytetrafluorethylene (PTFE) surface. This information is then entered into the OWRK model (6) as PTFE has a known total surface energy and is accepted to have no polar interactions with fluids.
2.2. Comparing Characteristic Parameters for Wettability
In an effort to examine an apparent disagreement in the literature, this work first compared the relationship between , , and to determine if they can be used interchangeably to characterize wettability. This was accomplished by comparing all three parameters for experimental data gathered in references [6,9,15]. This dataset included the tribological performance of 11 lubricants, including: low (PAO4), moderate (PAO), and high viscosity (PAO9) polyalphaolefin oils, 1-Ethyl-3-methylimdazolium bis(trifluoromethanesulfonyl) imide ([EMIM][NTf2]), 1-Ethyl-3-methylimdazolium trifluoromethanesulfonate ([EMIM][CF3SO3]), 1-Butyl-3-methylimidazolium thiocyanate ([BMIM][SCN]), 1-Butyl-3-methylimidazolium bis(trifluoromethanesulfonyl) imide ([BMIM][NTF2]), 1-Butyl-3-methylimidazolium tetrafluoroborate ([BMIM][BF4]), 1-Butyl-3-methylimidazolium hexafluorophosphate ([BMIM][PF6]), 1-Butyl-3-methylimidazolium ([BMIM][CH3COO]). It also included eight different surface types (steel, Polyoxymethylene (POM), Polydimethylsiloxane (PDMS), and multiple types of diamond: Non-hydrogenated tetrahedral amorphous (ta-C), Hydrogenated amophorous (Si-DLC), N-doped (N-DLC), Hydrogenated amorphous (a-C:H), and Hydrogenated amorphous doped with silicon and fluorine (F-DLC)). The sources of all data and relevant properties for the characterization of wetting behavior can be found in Table 1. Uncertainty in contact angle measurements was only presented in 25% of the cases examined in references [6,9,15], and none of these works included experimental uncertainty for . These investigations also only reported the steady state apparent contact angle of the lubricant on the surface. Future investigations could investigate the potential suitability of using the advancing contact angle measurements which have shown less variability with surface roughness and heterogeneity [24,25,26,27].
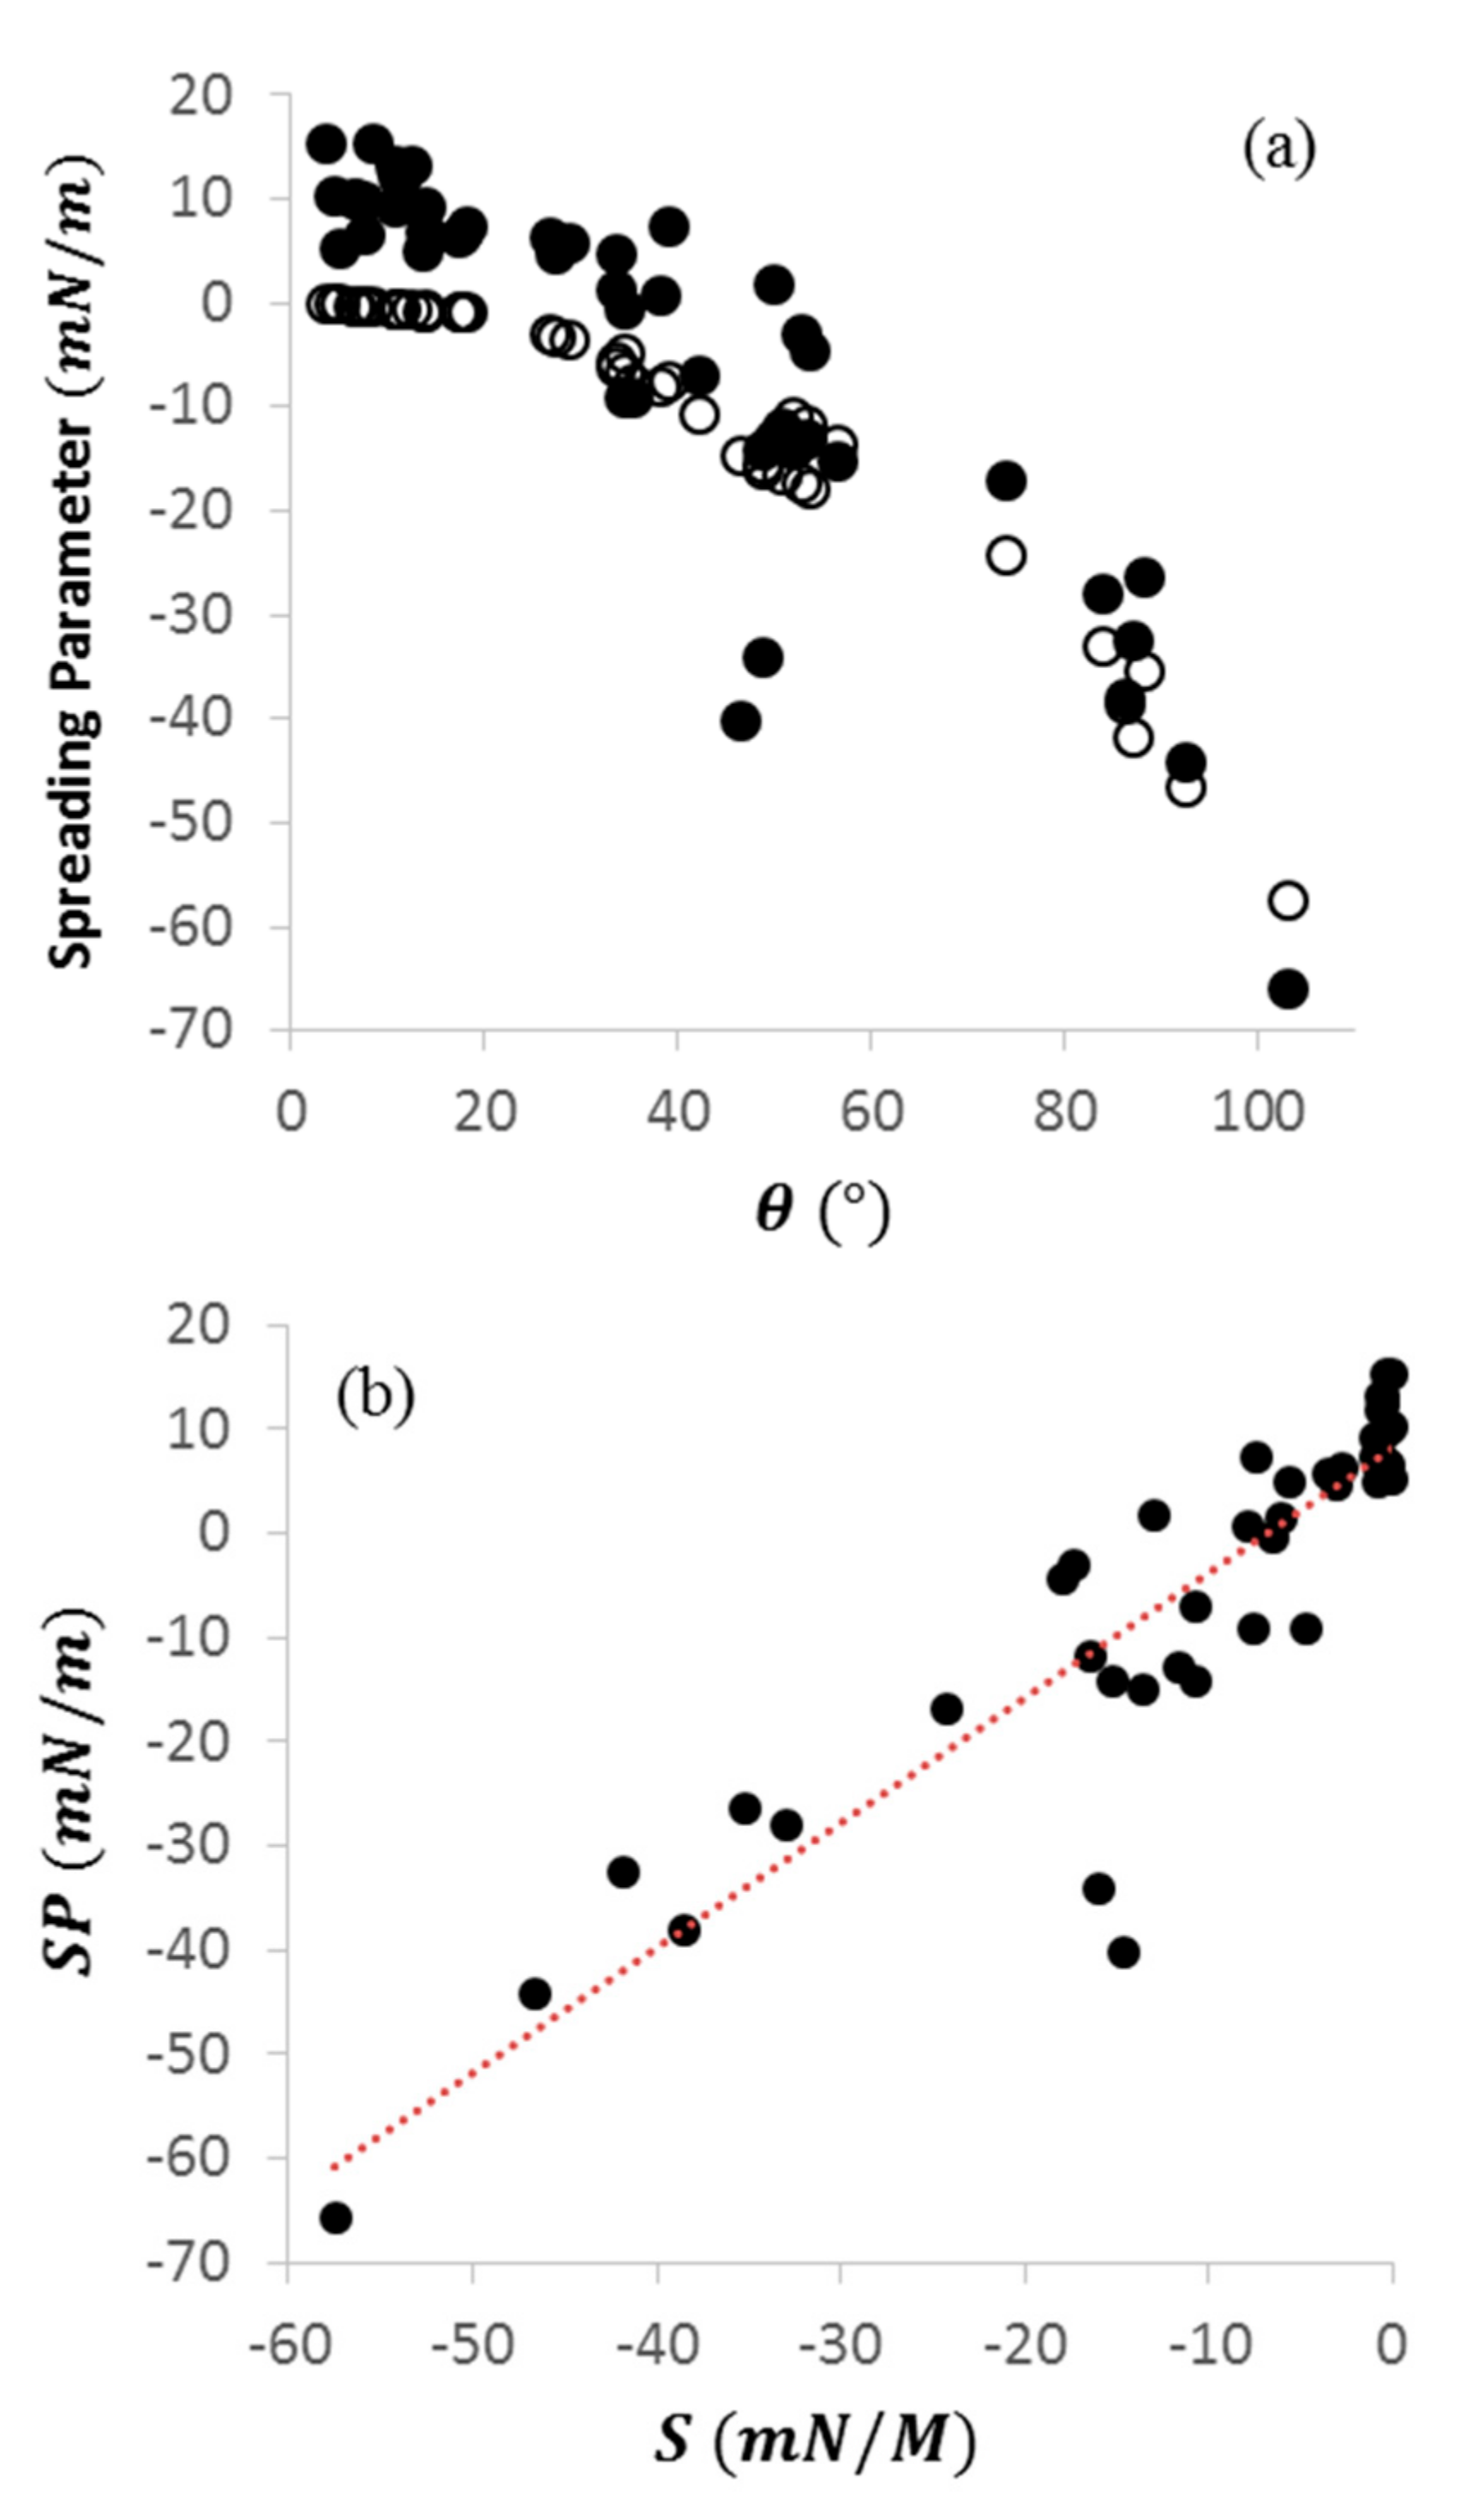
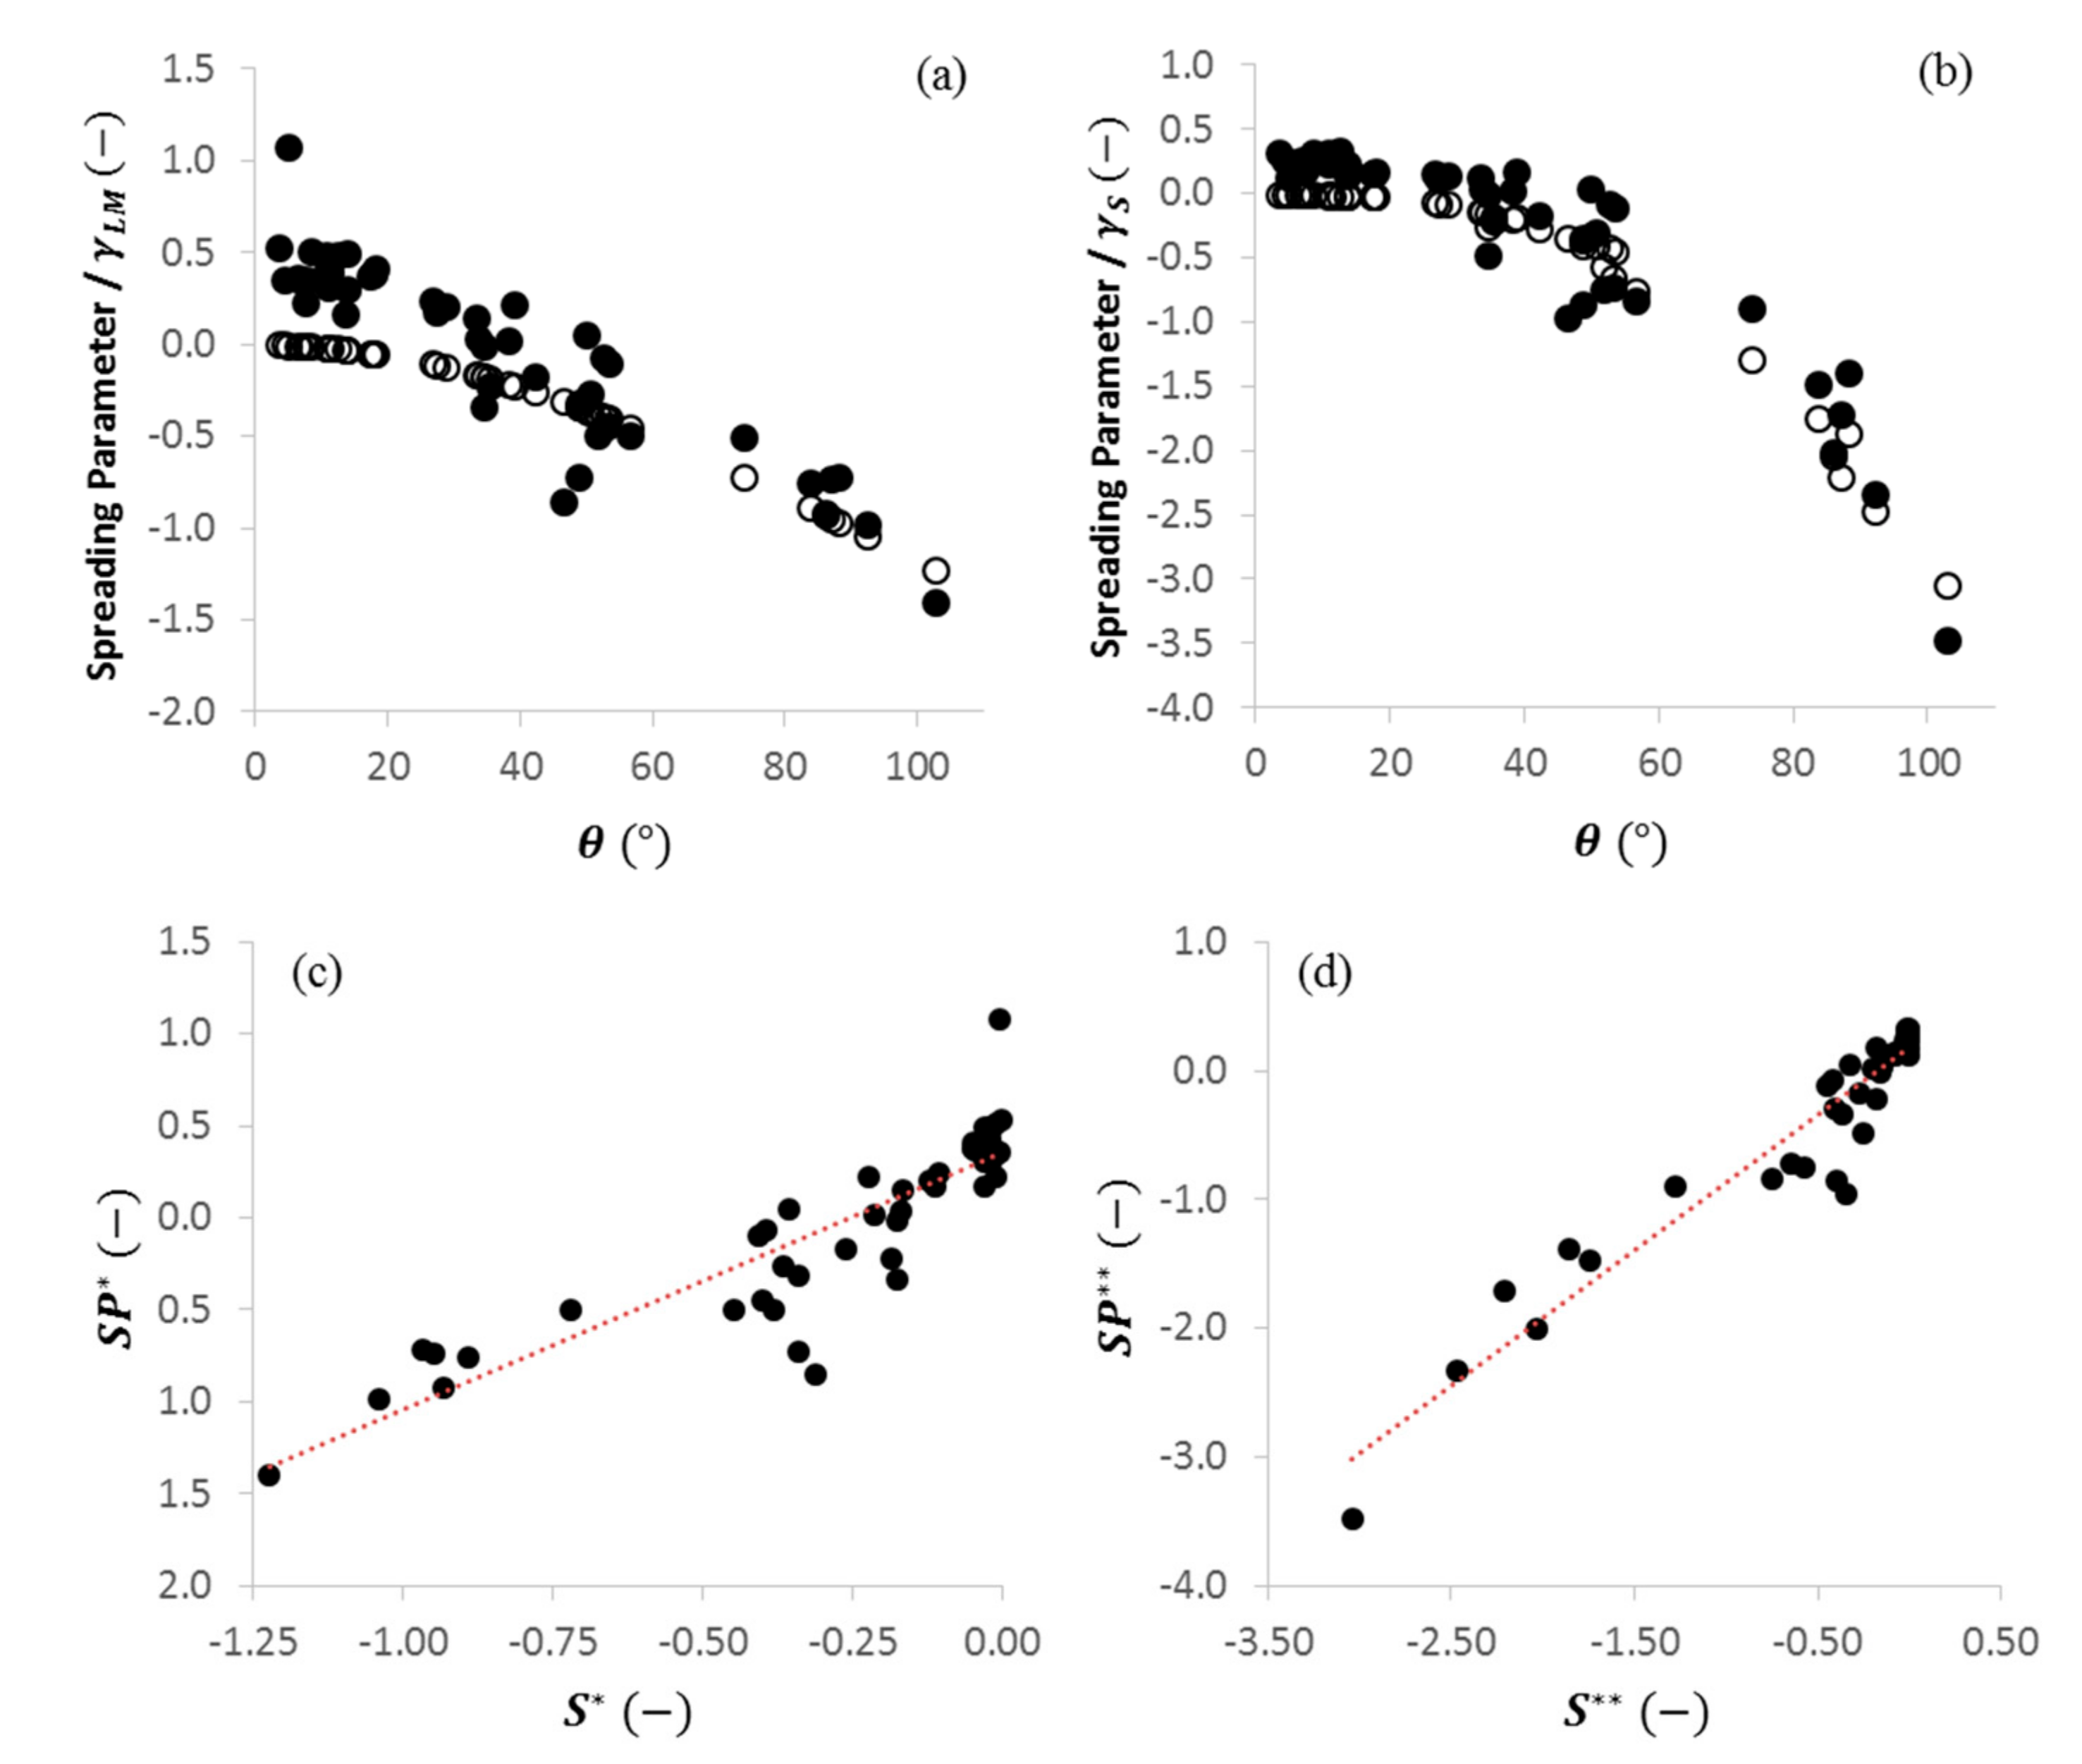
The spreading parameters and are both correlated with the contact angle between the lubricant and the target surface (Figure 2a). The spreading parameter () was more strongly correlated with than , because is an explicit function of . The non-linear relationship between these parameters suggests that characterizing wettability by contact angle may be less accurate than the spreading parameter. This appears to be particularly true at low contact angles, where the spreading parameters are a weaker function of . This is not unexpected as is a function of .
While and are not linear functions of , they appear to be linearly related to each other (Figure 2b). The results presented here showed a strong linear correlation between and with a slope of and a coefficient of determination () value of (Table 2). The uncertainty for the 95% confidence interval of this linear fit is 2.7 . It is unclear how uncertainty in the linear regression compares to experimental uncertainty in the spreading parameters, as this information is not reported in references [6,9,15]. Nevertheless, this data suggests that wettability is similarly described by and . This was not unexpected as is derived from (Equations (4)–(9)).
While and are linearly related, is always negative, while is positive for smaller contact angles and negative for larger contact angles. Kalin and Polajnar suggested that the negative values of indicate good tribological performance [9,10,11]. Similarly, Bombard et al. suggested that better tribological performance in boundary lubrication was achieved when IL and MR lubricants formed higher contact angles with the target surface [6]. The data presented in Figure 2a demonstrates that these two conditions are similar, if not the same. This performance condition can also be identified by the magnitude of . Instead of changing sign at low contact angles, the magnitude of becomes small. The relationship between , , and shown in Figure 2 suggests that all three parameters could be used to provide similar characterizations of wettability across a variety of tribological applications. However, the non-linear relationship between the contact angle and the spreading parameters suggests that is likely a better proxy for spreading parameter than alone.
2.3. Dimensionless Wetting Parameters
A dimensionless wetting parameter may be useful for characterizing the effect of wettability on the friction coefficient across a variety of tribological systems. Since both and have the same units as surface tension () and surface energy (), non-dimensional spreading parameters were constructed by scaling them with either the surface tension between the lubricant and the surrounding medium () or the surface energy of the target surface (). Using Equations (3) and (8), these dimensionless spreading parameters were defined as
These parameters scale the difference between the work of adhesion and cohesion by the surface tension of the lubricant (Equations (10) and (11)) or the energy of surface (Equations (12) and (13)). Like the dimensional spreading parameters, formulations that depend on the contact angle require fewer empirical inputs at the cost of losing information on the relative importance of polar and disperse components of surface tension and surface energy. Interestingly, was only a function of , while requires knowledge of . Since and are already required to calculate , both and can be determined without additional measurements if all variables in are already known.
As expected, the dimensionless spreading parameters proposed in Equations (10)–(13) are non-linearly related to the contact angle between the lubricant and the target surface (Figure 3a,b). Dimensionless spreading parameters calculated using contact angles () are linearly correlated to those using polar and disperse components of surface tension and surface energy () when scaled by the same parameter (Figure 3c,d). Dimensionless versions of and are more strongly correlated when scaled by surface energy () than by surface tension () (Table 2). This is likely the result of the additional information required for the formulation of which is defined by the properties of the lubricant (), the surface (), and the interaction between the lubricant and the surface (). While the linear fit is stronger between , the uncertainty for both fits is similar at and (Table 2). Despite the slightly weaker correlation between and , the use of to characterize wetting is attractive as it can be evaluated with a single contact angle measurement ().
The results in Figure 2 and Figure 3 suggest that , , and are all suitable for the characterization of wetting performance across a wide range of tribological systems, but the use of is likely preferable to alone. Scaling a spreading parameter by or may provide a suitable dimensionless description of wetting behavior in the system. In all cases, parameters described by the contact angle have reasonable correlations with those that use the polar and disperse coordinates of surface tension and surface energy. This suggests that there is limited benefit in knowing the polar and disperse components of surface tension and surface energy for the cases examined here. As such, formulations based on the contact angle may be more attractive because they can be determined using fewer experimental inputs. While uncertainty in and was generally unknown in this meta-analysis, it is likely that the uncertainty in is greater than that in due to the propagation of error from the higher number of required experimental inputs.
2.4. Using Wettability to Characterize Friction
The results presented in Figure 2 and Figure 3 suggest that the wettability of tribological systems can be reasonably characterized by , , and . The remainder of this investigation will characterize the effect of wettability on friction in various tribological systems using . This parameter was chosen because it can be fully determined from a measurement of the contact angle between the lubricant and the surface. Since the sign of does not change with the contact angle, using for log plots does not result in any loss of information. Comments on the suitability of other dimensionless parameters can be found in the Supplemental Information (Figures S1–S3).
This investigation used the friction coefficient data reported by Bombard et al. [6]. This dataset consists of a total of 123 friction coefficient measurements for cases involving multiple neat ILs and MR fluids between metallic (steel–steel), thermoplastic (POM–POM), and elastic (PDMS–PDMS) surfaces. Relevant experimental data for the characterization of friction when using MR fluids and neat ionic liquids (ILs) can be found in Table 3, Table 4 and Table 5, respectively. The specific film thickness in reference [6] was calculated using a correlation for minimum film thickness () found in reference [7]. Bombard et al. provided the uncertainty for friction coefficient measurements, but not for [6]. Friction coefficient information was not provided in reference [9], and the value of was not provided in reference [15].
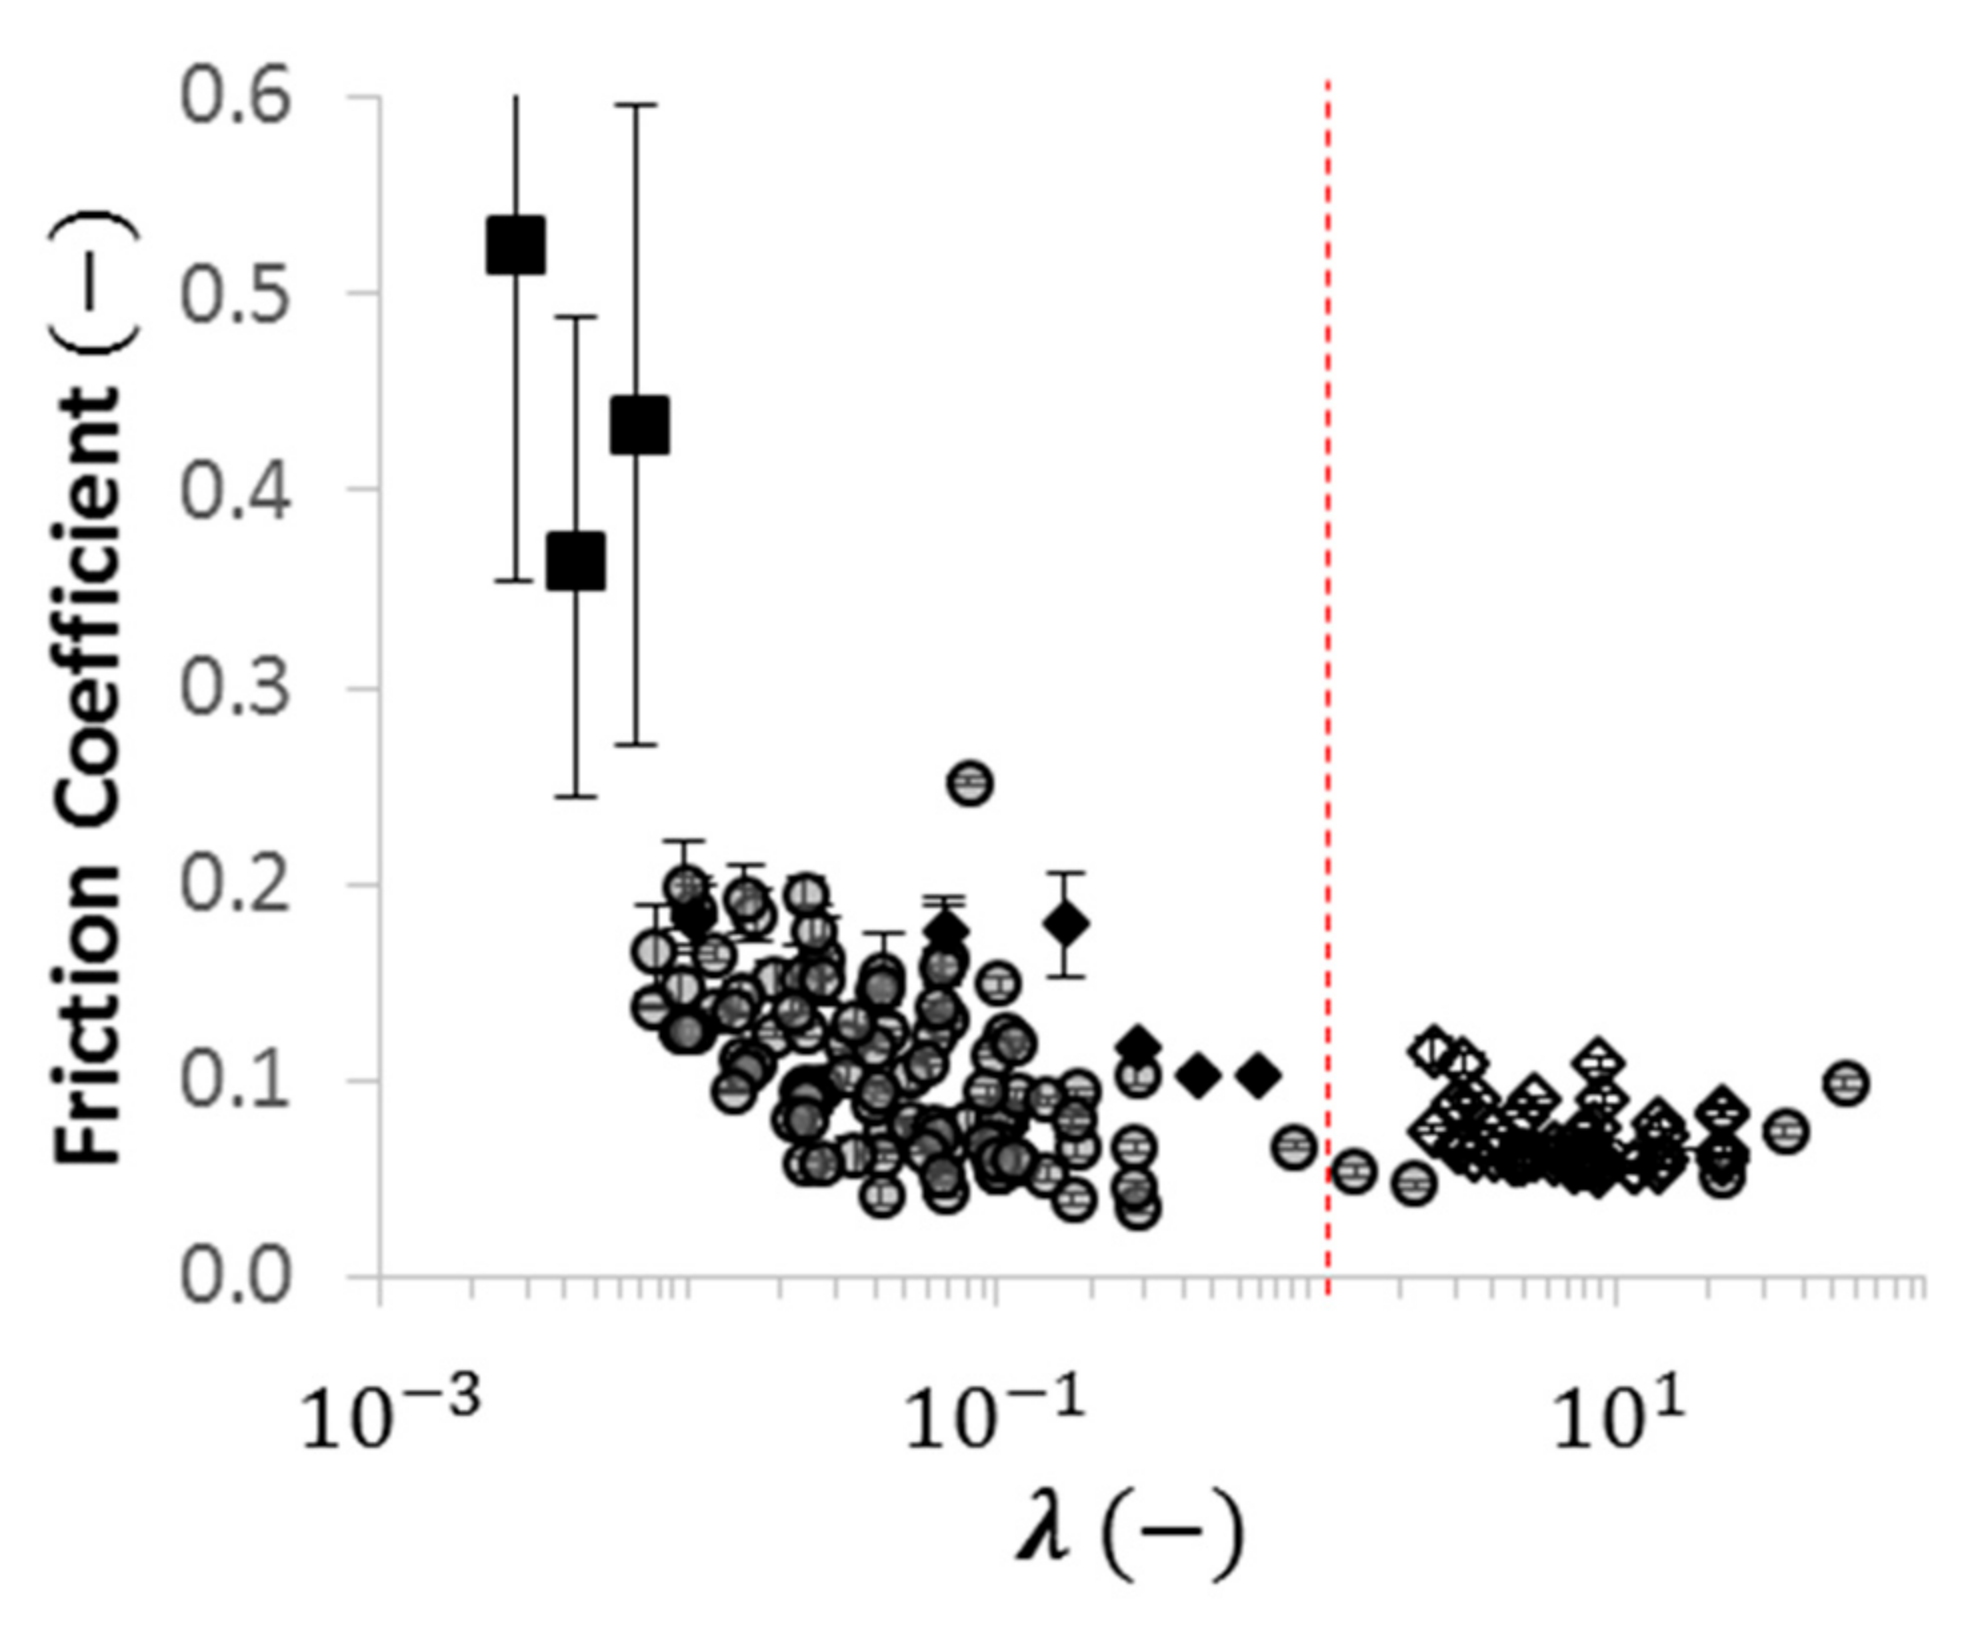
The importance of wettability in lubrication is often determined by the lubrication regime. These regimes are frequently identified by comparing the characteristic thickness of the lubricating film to the root-mean-squared roughness of the mating surfaces. This ratio is defined as the specific film thickness (). The system is thought to be in hydrodynamic lubrication if the specific film thickness is large (i.e., ), and in boundary lubrication when . The mixed lubrication regime has been identified for cases when . The effect of on the friction coefficient for the tribological data in reference [6] is shown in Figure 4. The friction coefficient was low and relatively consistent when and generally increased when .
Wettability is generally considered to be more important in boundary lubrication than in hydrodynamic lubrication [6,15]. In the data analyzed here, hydrodynamic lubrication was always observed when (Figure 4). However, when , friction coefficients tended to be large when spreading parameters were small () and moderate when .
The friction coefficients of the cases examined here were not always well characterized by For example, when PAO was used as a lubricant between PDMS surfaces, friction coefficients were low despite moderate values of (). Another set of outlying cases used IL 104 as a lubricant for steel–steel, POM–POM, and PDMS contacts. Using IL 104 between steel and POM surfaces yielded moderate friction coefficients despite having very low values of (). Similarly, low values of friction coefficient were observed when IL 104 was used between PDMS surfaces, despite moderate values of (). In all of these cases, friction coefficients were lower than what would be expected from alone.
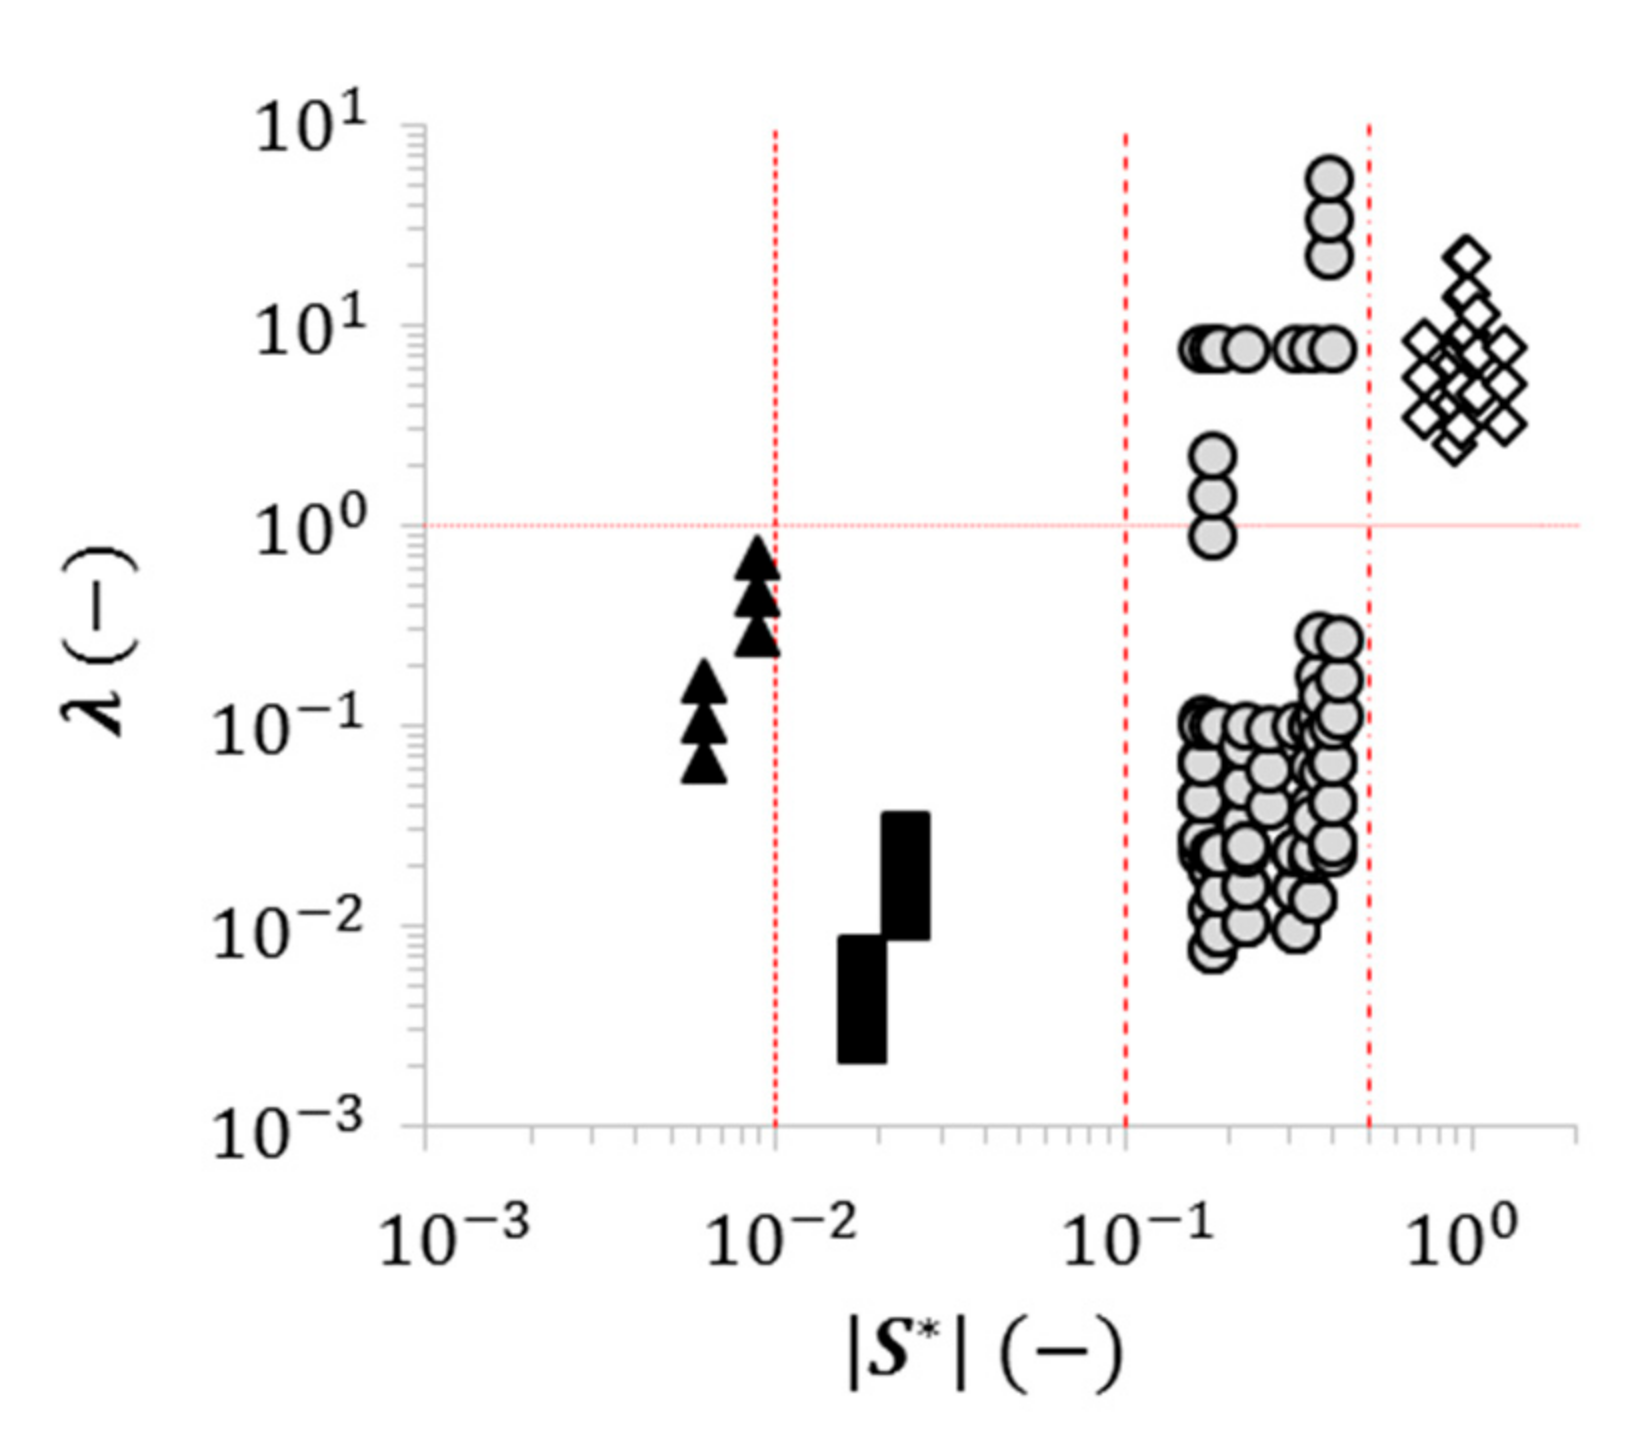
The relationship between and for neat ILs and MR fluids was examined to better understand the role of wettability in the cases examined here (Figure 5). This figure is a log-log plot because the range of both parameters spans several orders of magnitude. The log plot also requires the use of the absolute value of on the x-axis. Friction data for each lubricant surface pairing in reference [6] are presented at either three speeds for a single load (Table 3 and Table 5) or at constant for different lubricant surface pairings (Table 4). For tests where the speed was varied, the dimensionless spreading parameter did not change, and the data fell into vertical groups of three. For a given in these cases, increased with speed. This demonstrates that and are independent variables and that boundary lubrication can be achieved for low values of .
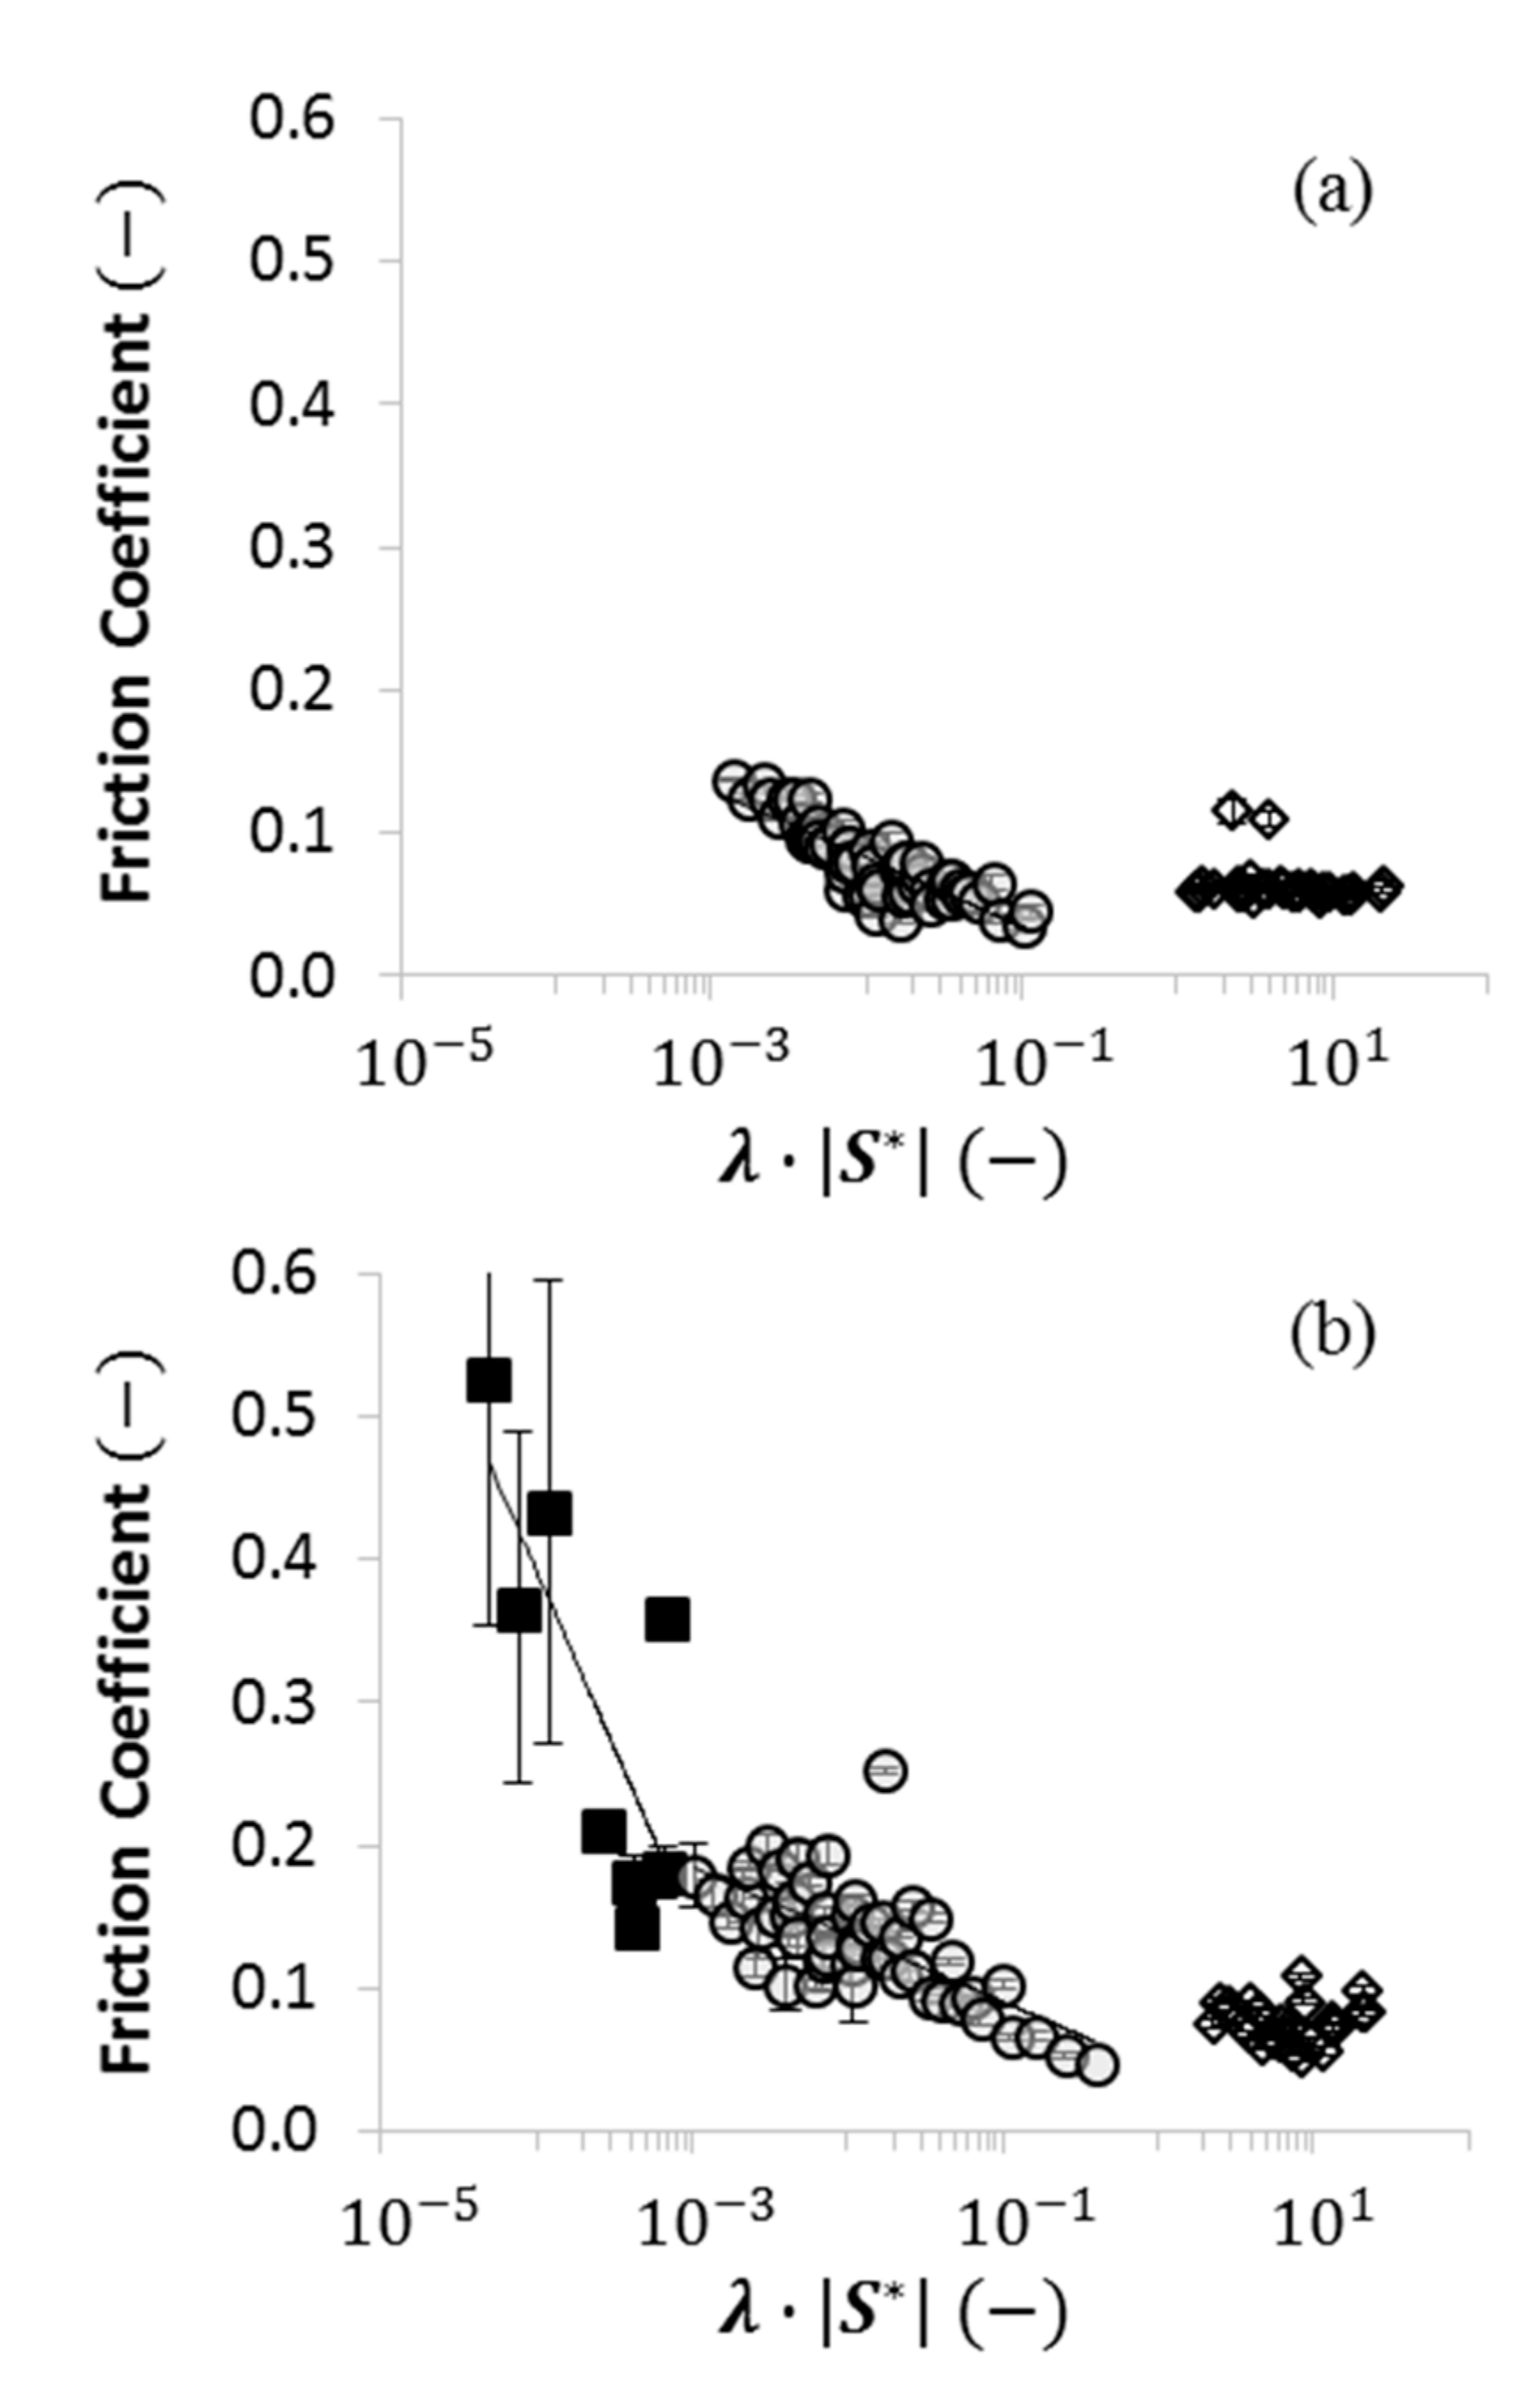
Since and are independent variables, it may be possible to characterize the importance of wettability by plotting friction coefficient as a function of (Figure 6). This is a semi-log plot because spans multiple orders of magnitude. This framework can generally separate the current dataset into three regimes. Specifically, friction coefficients
- were low and consistent when was above approximately ;
- increased dramatically as decreased below approximately ; and
- increased moderately when .
These regions appear to correspond to hydrodynamic lubrication (), boundary lubrication (), and mixed lubrication (). While log-linear fits of all data examined in these regions were reasonable (Table 6), accuracy was improved when friction coefficients for neat ILs and MR fluids were separated (Figure 7). Separating the data in this way does not appear to alter the transition between hydrodynamic lubrication and mixed lubrication. It was not possible to see whether the transition between mixed and boundary lubrication was affected because for all neat ILs examined here.
Friction coefficients were low and relatively consistent as increased above approximately . This was observed for the complete dataset (Figure 6) and when data for neat ILs and MR fluids was separated (Figure 7). This is consistent with the hydrodynamic regime where the lubricating film reduces friction by preventing asperity contact, but viscous effects increase the friction coefficient as the film thickness increases. Subtle differences in the literature regarding the definition of the beginning of the hydrodynamic regime (λ greater than to ) may be related to the role of wettability in this regime.
Friction coefficients tended to increase most dramatically when decreased below approximately (). Since none of the neat IL cases fall in this range, data in this regime is the same on Figure 6 and Figure 7. This region is defined by low values of both and . Low values occur when the lubricating film is thinner than the surface roughness, and low values occur when adhesion between the lubricant and target surface is much larger than cohesion between molecules in the lubricant. This is consistent with observations in references [6] that tribological performance in boundary lubrication is poor when contact angles are low or is positive because both of these conditions indicate a small value of . The outlying cases identified in Figure 4 when IL 104 was used for steel–steel or POM–POM are classified better on Figure 6 and Figure 7b. These cases have low values of and moderate values. When and are multiplied together, these cases are placed near the boundary between the lubrication and transitional regimes.
The small spreading parameter predicts that the friction coefficient will be large as decreases, but the intermediate value of moderates this effect so the friction coefficients were some of the lowest values observed in the boundary lubrication regime for this dataset.
Mixed lubrication was observed when . Like the previous regime, the friction coefficient tended to increase as decreased, but the changes in friction were more moderate than those observed when ( in Figure 6 and Figure 7a,b). In this region, moderate values appeared to reduce friction when was small. Similarly, moderate values of appeared to reduce friction when was small. The accuracy of log-linear fits in this regime showed the greatest improvement when the entire dataset was separated into neat ILs and MR fluids (Table 6). In particular, the coefficient of determination () value for the neat IL data in this regime was more than twice that of the entire dataset (), and the uncertainty in the linear regression () was halved (). The fit and accuracy of the regression for the MR fluids improved to a lesser degree ().
The dataset examined here suggests that the friction coefficient for a variety of neat ILs and MR fluids on metallic, thermoplastic, and elastic surfaces can be reasonably characterized with knowledge of and a dimensionless parameter that accounts for the relative strength of adhesion and cohesion in the system. The dimensionless spreading parameter () was an attractive wetting parameter because effectively characterized hydrodynamic, transitional, and film lubrication, and can be calculated using only . This suggests that it may be possible to collapse Stribeck curves for different lubricants and different surfaces by multiplying by a dimensionless parameter characterization of wetting in the system. Testing this methodology on a wider range of conditions (i.e., lubricants, surfaces, surface textures, testing methodologies, etc.) is necessary to test this hypothesis. Future investigations could also examine whether changes in wettability due to chemical interactions between the lubricant and the surface can be used to describe the changes in the tribological performance of the system and whether use of the advancing contact angle is a more suitable parameter to characterize wettability than the apparent contact angle.
3. Conclusions
The wettability of a lubricant on a target surface was characterized using the contact angle and various dimensional and dimensionless spreading parameters. The calculation of various spreading parameters using contact angles and polar and disperse components of surface tension and surface energy yielded similar results. Furthermore, the inclusion of polar and disperse components of surface tension and surface energy did not appear to provide additional insight into the wetting behavior of the tribological systems examined here.
Wettability alone was not sufficient to characterize the friction coefficients observed for a variety of neat ionic liquids and magnetorheological fluids in contact with metal and polymer surfaces. However, it was possible to identify hydrodynamic, boundary, and mixed lubrication regimes in these cases by combining a dimensionless wettability parameter with the ratio of the film thickness to the surface roughness. Spreading parameters derived using disperse and polar components of surface tension and surface energy did not appear to provide additional benefit over those that use the contact angle. Scaling the spreading parameter using the surface tension of the lubricant provided an attractive combination of performance and ease of experimentation as it only requires knowledge of the contact angle to be computed.
Supplementary Materials
The following are available online at https://www.mdpi.com/2075-4442/6/3/70/s1, Figure S1: Friction coefficient as a function of lambda multiplied by the dimensionless spreading parameter (λ·|S**|), Figure S2: Comparison of (a) WC,DP/WA,DP (closed) and WC,θ/WA,θ (open) to the θ and (b) a direct comparison of WC,DP/WA,DP and WC,θ/WA,θ, Figure S3: Friction coefficient as a function of lambda multiplied by the ratio of cohesion to adhesion formulated using (a) polar and disperse components of surface tension and (b) contact angles.
Author Contributions
Conceptualization, M.J.S. and P.I.; Methodology, M.J.S. and P.I.; Software, M.J.S.; Validation, M.J.S. and P.I.; Formal Analysis, M.J.S.; Investigation, M.J.S. and P.I.; Resources, M.J.S. and P.I.; Data Curation, M.J.S.; Writing-Original Draft Preparation, M.J.S.; Writing-Review & Editing, M.J.S. and P.I.; Visualization, M.J.S. and P.I.; Supervision, M.J.S. and P.I.; Project Administration, M.J.S. and P.I.; Funding Acquisition, M.J.S. and P.I.
Funding
This research received no external funding.
Acknowledgments
The authors wish to thank the financial support of the Kate Gleason College of Engineering at the Rochester Institute of Technology, NY.
Conflicts of Interest
The authors declare no conflict of interest.
Nomenclature
| Parameter/Abbreviation | Description | Unit |
| Subscript for adhesion work per unit area | ||
| a-C:H | Hydrogenated amorphous diamond-like carbon | |
| [BMIM][SCN] | 1-Butyl-3-methylimidazolium thiocyanate | |
| [BMIM][NTF2] | 1-Butyl-3-methylimidazolium bis(trifluoromethanesulfonyl imige/“Triflimide” | |
| [BMIM][BF4] | 1-Butyl-3-methylimidazolium tetrafluoroborate | |
| [BMIM][PF6] | 1-Butyl-3-methylimidazolium hexafluorophosphate | |
| [BMIM][CH3COO] | 1-Butyl-3-methylimidazolium | |
| BL | Boundary lubrication regime | |
| Subscript for cohesion work per unit area | ||
| D | Superscript for disperse component of | |
| [EMIM][NTf2] | 1-Ethyl-3-methylimdazolium bis(trifluoromethanesulfonyl) imide/Triflimide” | |
| [EMIM][CF3SO3] | 1-Ethyl-3-methylimdazolium trifluoromethanesulfonate/“Triflate” | |
| F-DLC | Hydrogenated amorphous diamond-like carbon doped with silicon and fluorine | |
| Lubricant film thickness | ||
| HL | Hydrodynamic lubrication regime | |
| IL | Ionic liquid | |
| IL104 | Trihexyltetradecylphosphonium bis(2,4,4-trimethylpentyl) phosphinate (Cytec) | |
| LM | Subscript for the interface between the liquid and the surrounding medium | |
| ML | Mixed lubrication regime | |
| MR | Magnetorhelogical | |
| N-DLC | N-doped diamond-like carbon | |
| OWRK | Owens–Wendt–Tabel–Kaelble | |
| Superscript for polar component of | ||
| PAO | Polyalphaolefin oil | |
| PAO4 | Low-viscosity polyalphaolefin oil (Chevron Philips) | |
| PAO9 | High-viscosity polyalphaolefin oil (Chevron Philips) | |
| PDMS | Polydimethylsiloxane | |
| POM | Polyoxymethylene | |
| Spreading parameter | ||
| Si-DLC | Hydrogenated amophorous diamond-like carbon | |
| SL | Subscript for the interface between the surface and the liquid | |
| SM | Subscript for the interface between the surface and the surrounding medium | |
| Spreading parameter derived by Kalin and Polajnar | ||
| ta-C | Non-hydrogenated tetrahedral amorphous diamond-like carbon | |
| [THTDP][NTf2] | Trihexyltetradecyl phosphonium bis(trifluoromethylsulfonyl) amide | |
| [THTDA][NTf2] | Trihexyltetradecyl ammonium bis(trifluoromethylsulfonyl) | |
| Work per unit area | ||
| [1TD3HI][NTf2] | 1-Tetradecyl-3-hexyl imidazolium bis(trifluoromethylsulfonyl) amide | |
| Surface tension (and surface energy) | or | |
| Surface roughness (average or root mean square) roughness | ||
| Contact angle | ||
| Specific film thickness | ||
| Superscript for a dimensionless parameter |
References
- Tzanakis, I.; Hadfield, M.; Thomas, B.; Noya, S.M.; Henshaw, I.; Austen, S. Future perspectives on sustainable tribology. Renew. Sustain. Energy Rev. 2012, 16, 4126–4140. [Google Scholar] [CrossRef]
- Stern, D.I. Energy and economic growth in the USA. Energy Econ. 1993, 15, 137–150. [Google Scholar] [CrossRef]
- Hutchings, I.M. Tribology, Friction and Wear of Engineering Materials; Edward Arnold: London, UK, 1992; ISBN 034056184X. [Google Scholar]
- Maru, M.M.; Tanaka, D.K. Consideration of stribeck diagram parameters in the investigation on wear and friction behavior in lubricated sliding. J. Braz. Soc. Mech. Sci. Eng. 2007, 29, 55–62. [Google Scholar] [CrossRef]
- Xie, Z.; Rao, Z.; Ta-Na; Liu, L.; Chen, R. Theoretical and experimental research on the friction coefficient of water lubricated bearing with consideration of wall slip effects. Mech. Ind. 2016, 17, 106. [Google Scholar] [CrossRef]
- Bombard, A.J.F.; Gonçalves, F.R.; Shahrivar, K.; Ortiz, A.L.; de Vicente, J. Tribological behavior of ionic liquid-based magnetorheological fluids in steel and polymeric point contacts. Tribol. Int. 2015, 81, 309–320. [Google Scholar] [CrossRef]
- De Vicente, J.; Stokes, J.R.; Spikes, H.A. The frictional properties of Newtonian fluids in rolling—Sliding soft-EHL contact. Tribol. Lett. 2005, 20, 273–286. [Google Scholar] [CrossRef]
- Stachowiak, G.W.; Batchelor, A.W. Engineering Tribology; Elsevier Science & Technology Books: Amsterdam, The Netherlands, 2013; ISBN 9780123977762. [Google Scholar]
- Kalin, M.; Polajnar, M. The correlation between the surface energy, the contact angle and the spreading parameter, and their relevance for the wetting behaviour of DLC with lubricating oils. Tribol. Int. 2013, 66, 225–233. [Google Scholar] [CrossRef]
- Kalin, M.; Polajnar, M. The effect of wetting and surface energy on the friction and slip in oil-lubricated contacts. Tribol. Lett. 2013, 52, 185–194. [Google Scholar] [CrossRef]
- Kalin, M.; Polajnar, M. The wetting of steel, DLC coatings, ceramics and polymers with oils and water: The importance and correlations of surface energy, surface tension, contact angle and spreading. Appl. Surf. Sci. 2014, 293, 97–108. [Google Scholar] [CrossRef]
- Blanco, D.; Bartolomé, M.; Ramajo, B.; Viesca, J.L.; González, R.; Hernández Battez, A. Wetting Properties of Seven Phosphonium Cation-Based Ionic Liquids. Ind. Eng. Chem. Res. 2016, 55, 9594–9602. [Google Scholar] [CrossRef] [Green Version]
- Brochard, F. Motions of droplets on solid surfaces inducted by chemical or thermal gradients. Langmuir 1989, 5, 432–438. [Google Scholar] [CrossRef]
- Blanco, D.; Viesca, J.L.; Mallada, M.T.; Ramajo, B.; González, R.; Battez, A.H. Wettability and corrosion of [NTf 2] anion-based ionic liquids on steel and PVD (TiN, CrN, ZrN) coatings. Surf. Coat. Technol. 2016, 302, 24–32. [Google Scholar] [CrossRef]
- Matczak, L.; Johanning, C.; Gil, E.; Smith, T.W.; Schertzer, M.J.; Iglesias Victoria, P. Effect of cation nature on the lubricating and physicochemical properties of three ionic liquids. Tribol. Int. 2018, 124, 23–33. [Google Scholar] [CrossRef]
- Chen, W.; Foster, A.S.; Alava, M.J.; Laurson, L. Stick-Slip Control in Nanoscale Boundary Lubrication by Surface Wettability. Phys. Rev. Lett. 2015, 114, 95502. [Google Scholar] [CrossRef] [PubMed]
- Liu, D.; Li, K.; Zhang, S.; Amann, T.; Zhang, C. Anti-spreading behavior of 1,3-diketone lubricating oil on steel surfaces. Tribol. Int. 2018, 121, 108–113. [Google Scholar] [CrossRef]
- Lawes, S.D.; Hainsworth, S.V.; Blake, P.; Ryder, K.S.; Abbott, A.P. Lubrication of steel/steel contacts by choline chloride ionic liquids. Tribol. Lett. 2010, 37, 103–110. [Google Scholar] [CrossRef]
- Qu, J.; Bansal, D.G.; Yu, B.; Howe, J.Y.; Luo, H.; Dai, S.; Li, H.; Blau, P.J.; Bunting, B.G.; Mordukhovich, G.; et al. Antiwear performance and mechanism of an oil-miscible ionic liquid as a lubricant additive. ACS Appl. Mater. Interfaces 2012, 4, 997–1002. [Google Scholar] [CrossRef] [PubMed]
- Bonaccurso, E.; Kappl, M.; Butt, H.-J. Hydrodynamic force measurements: Boundary slip of water on hydrophilic surfaces and electrokinetic effects. Phys. Rev. Lett. 2002, 88, 76103–76104. [Google Scholar] [CrossRef] [PubMed]
- Pit, R.; Hervet, H.; Leger, L. Direct experimental evidence of slip in hexadecane: Solid interface. Phys. Rev. Lett. 2000, 85, 980–983. [Google Scholar] [CrossRef] [PubMed]
- Watanabe, K.; Udagawa, Y.; Udagawa, H. Drag reduction of Newtonian fluid in a circular pipe with a highly water-repellent wall. J. Fluid Mech. 1999, 381, 225–238. [Google Scholar] [CrossRef]
- Maali, A.; Bhushan, B. Nanorheology and boundary slip in confined liquids using atomic force microscopy. J. Phys. Condens. Matter 2008, 20, 315201. [Google Scholar] [CrossRef]
- Raj, R.; Enright, R.; Zhu, Y.; Adera, S.; Wang, E.N. Unified Model for Contact Angle Hysteresis on Heterogeneous and Superhydrophobic Surfaces. Langmuir 2012, 28, 15777–15788. [Google Scholar] [CrossRef] [PubMed]
- Kozbial, A.; Trouba, C.; Liu, H.; Li, L. Characterization of the Intrinsic Water Wettability of Graphite Using Contact Angle Measurements: Effect of Defects on Static and Dynamic Contact Angles. Langmuir 2017, 33, 959–967. [Google Scholar] [CrossRef] [PubMed]
- Extrand, C.; Kumagai, Y. An experimental study of contact angle hysteresis. J. Colloid Interface Sci. 1997, 191, 378–383. [Google Scholar] [CrossRef] [PubMed]
- Lam, C.; Wu, R.; Li, D.; Hair, M.; Neumann, A. Study of the advancing and receding contact angles: Liquid sorption as a cause of contact angle hysteresis. Adv. Colloid Interface Sci. 2002, 96, 169–191. [Google Scholar] [CrossRef]
- Bormashenko, E. Wetting of real solid surfaces: New glance on well-known problems. Colloid Polym. Sci. 2013, 291, 339–342. [Google Scholar] [CrossRef]
- Bermudez, M.; Jimenez, A. Surface interactions in lubrication of titanium, aluminium, and titanium-aluminium alloys with the ionic liquid [C(2)mim]Tf2N under increasing temperature. Proc. Inst. Mech. Eng. Part J. 2012, 226, 977–990. [Google Scholar] [CrossRef]
- Minami, I. Ionic liquids in tribology. Molecules 2009, 14, 2286–2305. [Google Scholar] [CrossRef] [PubMed]
- Mahrova, M.; Conte, M.; Roman, E.; Nevshupa, R. Critical Insight into Mechanochemical and Thermal Degradation of Imidazolium-Based Ionic Liquids with Alkyl and Monomethoxypoly(ethylene glycol) Side Chains. J. Phys. Chem. C 2014, 118, 22544–22552. [Google Scholar] [CrossRef]
- Jiménez, A.E.; Bermúdez, M.D.; Iglesias, P. Lubrication of Inconel 600 with ionic liquids at high temperature. Tribol. Int. 2009, 42, 1744–1751. [Google Scholar] [CrossRef]
- Iglesias, P.; Bermudez, M.; Carrion, F.; Martinez-Nicolas, G. Friction and wear of aluminium–steel contacts lubricated with ordered fluids-neutral and ionic liquid crystals as oil additives. Wear 2004, 256, 386–392. [Google Scholar] [CrossRef]
- Lee, S.J.; Hong, J.; Kang, K.H.; Kang, I.S.; Lee, S.J. Electrowetting-induced droplet detachment from hydrophobic surfaces. Langmuir 2014, 30, 1805–1811. [Google Scholar] [CrossRef] [PubMed]
- Owens, D.K.; Wendt, R.C. Estimation of the surface free energy of polymers. J. Appl. Polym. Sci. 1969, 13, 1741–1747. [Google Scholar]
- Burkhart, C.T.; Maki, K.L.; Schertzer, M.J. Effects of Interface Velocity, Diffusion Rate, and Radial Velocity on Colloidal Deposition Patterns Left by Evaporating Droplets. ASME J. Heat Transf. 2017, 139, 111505. [Google Scholar] [CrossRef]
- Kudtarkar, K.; Johnson, M.; Iglesias, P.; Smith, T.W.; Schertzer, M.J. Effects of chemicla composition on the electromechanical properties of microfluidically synthesized hydrogel beads. ASME J. Fluids Eng. 2018, 140, 101103. [Google Scholar] [CrossRef]
Figure 1.
Sketches of (a) a dry surface (b) total wetting, and (c) a droplet on a surface as described by Young’s equation.
Figure 1.
Sketches of (a) a dry surface (b) total wetting, and (c) a droplet on a surface as described by Young’s equation.

Figure 2.
Comparison of (a) the ratio of adhesive to cohesive energy calculated using the polar and disperse components of surface tension (closed) and contact angles (open) and (b) a direct comparison of the two values for experimental cases from references [6,9,15].

Figure 3.
Dimensionless spreading parameters (a) (open), (closed), and (b) (open) and (closed) as a function of contact angle as well as a comparison of (c) and , (d) and , and (d) and and corresponding linear regression for experimental cases in references [6,9,15].

Figure 4.
Friction coefficient as a function of lambda for a wide range of lubricant-surface pairings at speeds between to . Data includes cases from references [6] where (white diamonds), (black triangles), (black squares), and (gray circles).
Figure 4.
Friction coefficient as a function of lambda for a wide range of lubricant-surface pairings at speeds between to . Data includes cases from references [6] where (white diamonds), (black triangles), (black squares), and (gray circles).

Figure 5.
Log-log plot of as a function of the dimensionless spreading parameter (). Data includes cases from reference [6] where (white diamonds), (black triangles), (black triangles), and (gray circles).
Figure 5.
Log-log plot of as a function of the dimensionless spreading parameter (). Data includes cases from reference [6] where (white diamonds), (black triangles), (black triangles), and (gray circles).

Figure 6.
Friction coefficient as a function of . Logarithmic fits are provided for cases from reference [6] where (white diamond), (black), and (gray).
Figure 6.
Friction coefficient as a function of . Logarithmic fits are provided for cases from reference [6] where (white diamond), (black), and (gray).
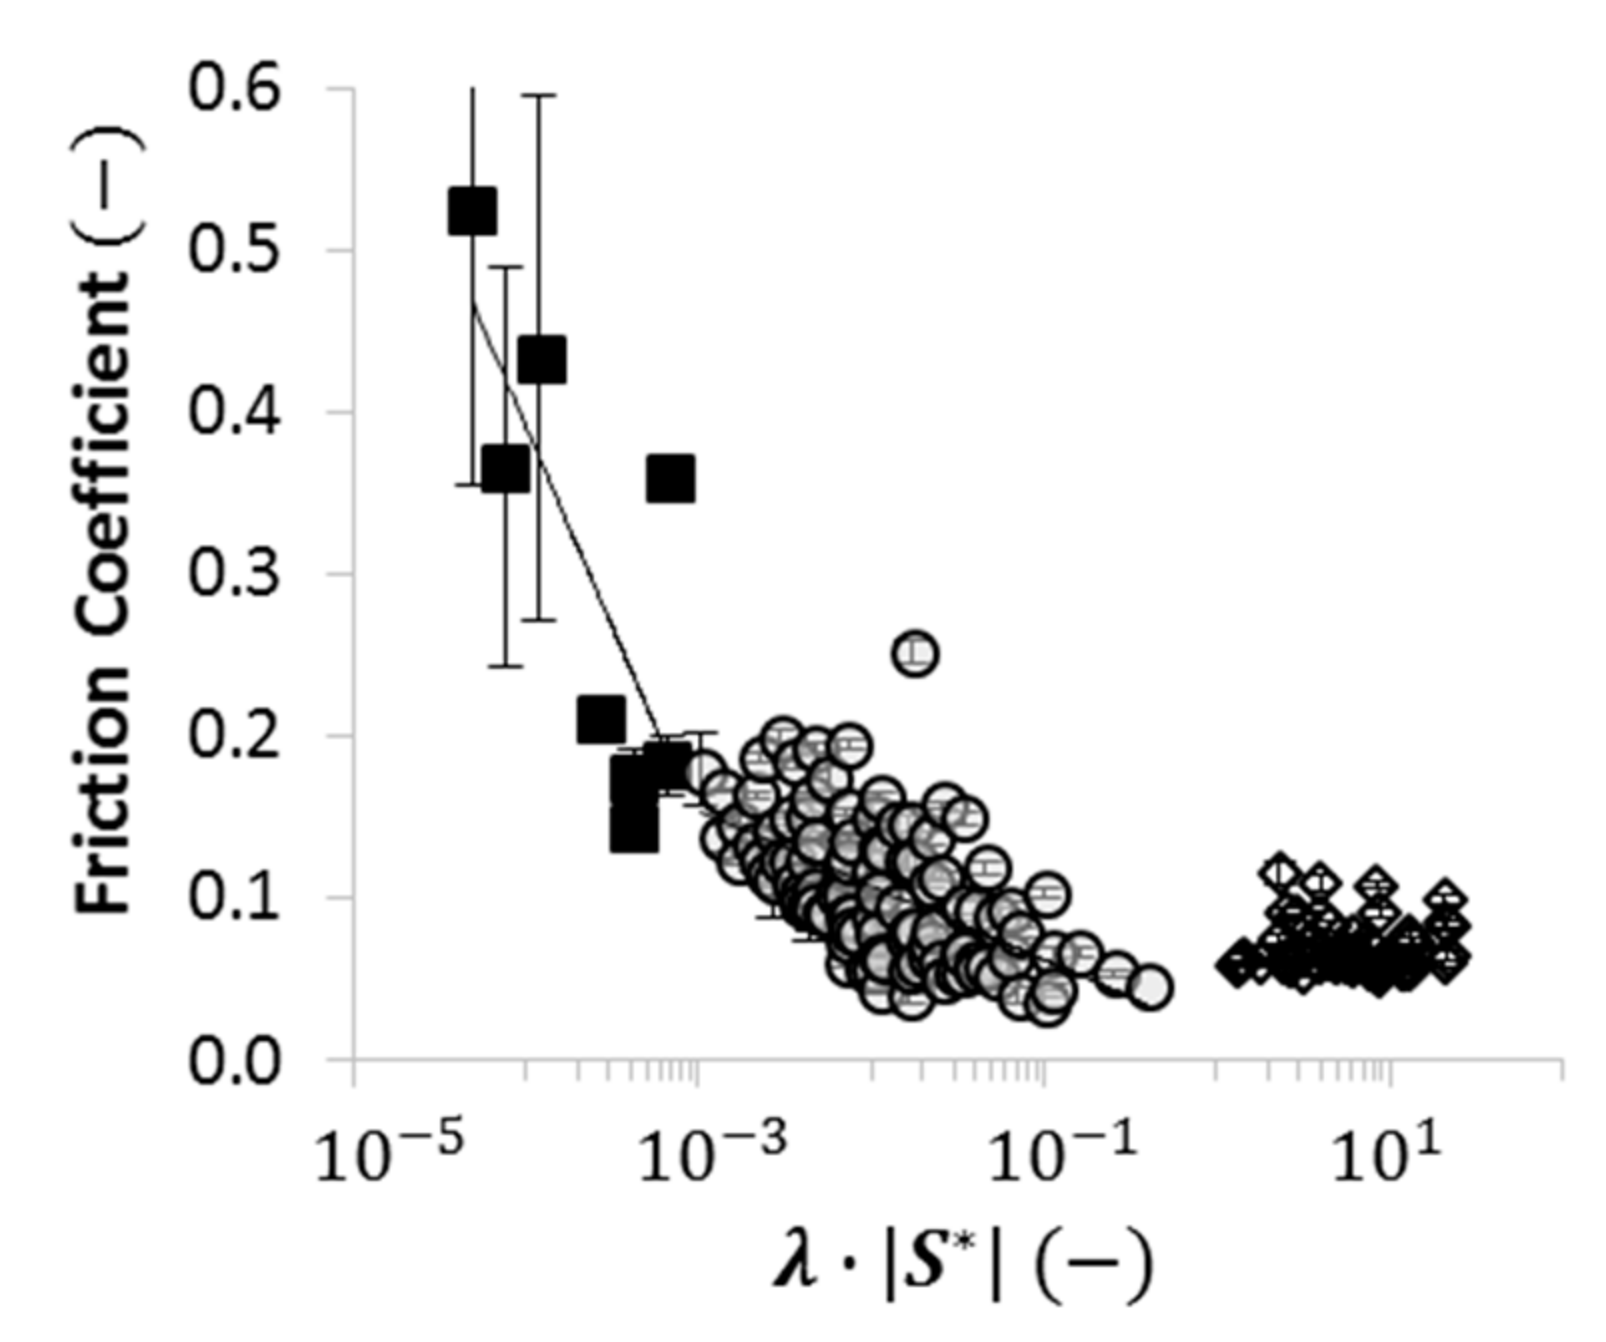
Figure 7.
Friction coefficient as a function of for (a) neat ILs and (b) MR fluids. Logarithmic fits are provided for cases from reference [7] where (white diamond), (black), and (gray).
Figure 7.
Friction coefficient as a function of for (a) neat ILs and (b) MR fluids. Logarithmic fits are provided for cases from reference [7] where (white diamond), (black), and (gray).


| Source | Surface | Lubricant | Temp. | θ (°) | S | SP | ||||||
|---|---|---|---|---|---|---|---|---|---|---|---|---|
| Polar | Disperse | Total | Polar | Disperse | Total | (°C) | (mN/m) | (mN/m) | ||||
| [10] | Steel | PAO4 | 4.8 | 24.2 | 29.0 | 12.1 | 31.4 | 43.5 | 11.1 | −0.02 | 12.34 | |
| [10] | Steel | PAO9 | 6.5 | 23.7 | 30.2 | 12.1 | 31.4 | 43.5 | 11.3 | −0.02 | 11.86 | |
| [10] | ta-C | PAO4 | 4.8 | 24.2 | 29.0 | 16.5 | 31.9 | 48.4 | 3.5 | 0.00 | 15.38 | |
| [10] | ta-C | PAO9 | 6.5 | 23.7 | 30.2 | 16.5 | 31.9 | 48.4 | 8.5 | −0.01 | 15.31 | |
| [10] | Si-DLC | PAO4 | 4.8 | 24.2 | 29.0 | 8.6 | 31.8 | 40.4 | 4.3 | 0.00 | 10.32 | |
| [10] | Si-DLC | PAO9 | 6.5 | 23.7 | 30.2 | 8.6 | 31.8 | 40.4 | 10.9 | −0.02 | 9.44 | |
| [10] | N-DLC | PAO4 | 4.8 | 24.2 | 29.0 | 7.8 | 32.5 | 40.2 | 6.8 | −0.01 | 10.24 | |
| [10] | N-DLC | PAO9 | 6.5 | 23.7 | 30.2 | 7.8 | 32.5 | 40.2 | 13.8 | −0.03 | 9.25 | |
| [10] | a-C:H | PAO4 | 4.8 | 24.2 | 29.0 | 4.3 | 31.8 | 36.1 | 7.6 | −0.01 | 6.55 | |
| [10] | a-C:H | PAO9 | 6.5 | 23.7 | 30.2 | 4.3 | 31.8 | 36.1 | 13.6 | −0.03 | 5.06 | |
| [10] | F-DLC | PAO4 | 4.8 | 24.2 | 29.0 | 1.2 | 16.8 | 18.0 | 53.2 | −0.40 | −12.96 | |
| [10] | F-DLC | PAO9 | 6.5 | 23.7 | 30.2 | 1.2 | 16.8 | 18.0 | 56.5 | −0.45 | −14.99 | |
| [7] | Steel | PAO | 0.0 | 27.0 | 27.0 | 2.2 | 39.6 | 41.8 | 10.8 | −0.02 | 13.20 | |
| [7] | Steel | [EMIM][NTf2] | 11.4 | 25.6 | 37.0 | 2.2 | 39.6 | 41.8 | 34.5 | −0.18 | −0.46 | |
| [7] | Steel | [EMIM][CF3SO3] | 17.8 | 23.5 | 41.3 | 2.2 | 39.6 | 41.8 | 35.3 | −0.18 | −9.10 | |
| [7] | Steel | [BMIM][SCN] | 39.2 | 7.8 | 47.0 | 2.2 | 39.6 | 41.8 | 46.4 | −0.31 | −40.15 | |
| [7] | Steel | [BMIM][NTF2] | 0.9 | 32.7 | 33.6 | 2.2 | 39.6 | 41.8 | 38.9 | −0.22 | 7.44 | |
| [7] | Steel | [BMIM][BF4] | 20.7 | 24.1 | 44.8 | 2.2 | 39.6 | 41.8 | 48.8 | −0.34 | −14.12 | |
| [7] | Steel | [BMIM][PF6] | 5.2 | 38.9 | 44.1 | 2.2 | 39.6 | 41.8 | 52.6 | −0.39 | −3.02 | |
| [7] | Steel | [BMIM][CH3COO] | 9.9 | 26.5 | 36.4 | 2.2 | 39.6 | 41.8 | 33.6 | −0.17 | 1.36 | |
| [7] | Steel | IL I04 | 6.0 | 22.3 | 28.3 | 2.2 | 39.6 | 41.8 | 6.4 | −0.01 | 10.21 | |
| [7] | POM | PAO | 0.0 | 27.0 | 27.0 | 4.5 | 35.4 | 39.9 | 12.4 | −0.02 | 13.20 | |
| [7] | POM | [EMIM][NTf2] | 11.4 | 25.6 | 37.0 | 4.5 | 35.4 | 39.9 | 38.2 | −0.21 | 0.72 | |
| [7] | POM | [EMIM][CF3SO3] | 17.8 | 23.5 | 41.3 | 4.5 | 35.4 | 39.9 | 42.2 | −0.26 | −6.97 | |
| [7] | POM | [BMIM][SCN] | 39.2 | 7.8 | 47.0 | 4.5 | 35.4 | 39.9 | 48.8 | −0.34 | −34.07 | |
| [7] | POM | [BMIM][NTF2] | 0.9 | 32.7 | 33.6 | 4.5 | 35.4 | 39.9 | 33.4 | −0.17 | 4.88 | |
| [7] | POM | [BMIM][BF4] | 20.7 | 24.1 | 44.8 | 4.5 | 35.4 | 39.9 | 50.6 | −0.37 | −11.88 | |
| [7] | POM | [BMIM][PF6] | 5.2 | 38.9 | 44.1 | 4.5 | 35.4 | 39.9 | 53.5 | −0.41 | −4.41 | |
| [7] | POM | [BMIM][CH3COO] | 9.9 | 26.5 | 36.4 | 4.5 | 35.4 | 39.9 | 49.9 | −0.36 | 1.78 | |
| [7] | POM | IL I04 | 6.0 | 22.3 | 28.3 | 4.5 | 35.4 | 39.9 | 7.7 | −0.01 | 9.89 | |
| [7] | PDMS | PAO | 0.0 | 27.0 | 27.0 | 0.1 | 18.8 | 18.9 | 34.5 | −0.18 | −9.10 | |
| [7] | PDMS | [EMIM][NTf2] | 11.4 | 25.6 | 37.0 | 0.1 | 18.8 | 18.9 | 83.7 | −0.89 | −27.99 | |
| [7] | PDMS | [EMIM][CF3SO3] | 17.8 | 23.5 | 41.3 | 0.1 | 18.8 | 18.9 | 86.1 | −0.93 | −38.02 | |
| [7] | PDMS | [BMIM][SCN] | 39.2 | 7.8 | 47.0 | 0.1 | 18.8 | 18.9 | 102.9 | −1.22 | −65.76 | |
| [7] | PDMS | [BMIM][NTF2] | 0.9 | 32.7 | 33.6 | 0.1 | 18.8 | 18.9 | 73.8 | −0.72 | −16.89 | |
| [7] | PDMS | [BMIM][BF4] | 20.7 | 24.1 | 44.8 | 0.1 | 18.8 | 18.9 | 92.3 | −1.04 | −44.10 | |
| [7] | PDMS | [BMIM][PF6] | 5.2 | 38.9 | 44.1 | 0.1 | 18.8 | 18.9 | 87.0 | −0.95 | −32.47 | |
| [7] | PDMS | [BMIM][CH3COO] | 9.9 | 26.5 | 36.4 | 0.1 | 18.8 | 18.9 | 88.1 | −0.97 | −26.28 | |
| [7] | PDMS | IL I04 | 6.0 | 22.3 | 28.3 | 0.1 | 18.8 | 18.9 | 51.7 | −0.38 | −14.12 | |
| [16] | Steel | [THTDA][NTf2] | 11.0 | 15.6 | 26.6 | 2.2 | 39.6 | 41.8 | 25 | 26.6 | −0.11 | 6.34 |
| [16] | Steel | [THTDA][NTf2] | 10.6 | 18.1 | 28.7 | 2.2 | 39.6 | 41.8 | 40 | 28.7 | −0.12 | 5.87 |
| [16] | Steel | [THTDA][NTf2] | 10.9 | 7.2 | 18.0 | 2.2 | 39.6 | 41.8 | 100 | 18.0 | −0.05 | 7.41 |
| [16] | Steel | [THTDP][NTf2] | 9.8 | 4.0 | 13.8 | 2.2 | 39.6 | 41.8 | 25 | 13.8 | −0.03 | 6.81 |
| [16] | Steel | [THTDP][NTf2] | 11.1 | 6.5 | 17.7 | 2.2 | 39.6 | 41.8 | 40 | 17.7 | −0.05 | 6.72 |
| [16] | Steel | [THTDP][NTf2] | 11.1 | 6.5 | 17.7 | 2.2 | 39.6 | 41.8 | 100 | 17.7 | −0.05 | 6.72 |
| [16] | Steel | [1TD3HI][NTf2] | 4.4 | 0.5 | 4.9 | 2.2 | 39.6 | 41.8 | 25 | 4.9 | 0.00 | 5.23 |
| [16] | Steel | [1TD3HI][NTf2] | 11.2 | 6.1 | 17.3 | 2.2 | 39.6 | 41.8 | 40 | 17.3 | −0.05 | 6.43 |
| [16] | Steel | [1TD3HI][NTf2] | 12.1 | 15.3 | 27.4 | 2.2 | 39.6 | 41.8 | 100 | 27.4 | −0.11 | 4.79 |
Table 3.
Experimental data for the characterization of friction of magnetorheological (MR) lubricants [6].
Table 3.
Experimental data for the characterization of friction of magnetorheological (MR) lubricants [6].
| Source | Surface | Lubricant | Type | Friction Coefficient at | ||||||
|---|---|---|---|---|---|---|---|---|---|---|
| 0.05 (m/s) | 0.10 (m/s) | 0.20 (m/s) | 0.05 (m/s) | 0.10 (m/s) | 0.20 (m/s) | |||||
| [7] | Steel | PAO | MR | 0.018 | 0.52 | 0.36 | 0.43 | 0.003 | 0.004 | 0.007 |
| [7] | Steel | [EMIM][NTf2] | MR | 0.176 | 0.17 | 0.17 | 0.15 | 0.008 | 0.012 | 0.019 |
| [7] | Steel | [EMIM][CF3SO3] | MR | 0.183 | 0.15 | 0.15 | 0.15 | 0.009 | 0.015 | 0.023 |
| [7] | Steel | [BMIM][SCN] | MR | 0.310 | 0.20 | 0.19 | 0.19 | 0.010 | 0.015 | 0.024 |
| [7] | Steel | [BMIM][NTF2] | MR | 0.222 | 0.19 | 0.18 | 0.18 | 0.010 | 0.016 | 0.026 |
| [7] | Steel | [BMIM][BF4] | MR | 0.341 | 0.14 | 0.14 | 0.13 | 0.014 | 0.022 | 0.034 |
| [7] | Steel | [BMIM][PF6] | MR | 0.393 | 0.15 | 0.15 | 0.16 | 0.027 | 0.042 | 0.066 |
| [7] | Steel | [BMIM][CH3COO] | MR | 0.167 | 0.16 | 0.16 | 0.16 | 0.027 | 0.043 | 0.067 |
| [7] | Steel | IL I04 | MR | 0.006 | 0.18 | 0.18 | 0.18 | 0.068 | 0.106 | 0.166 |
| [7] | POM | PAO | MR | 0.023 | 0.21 | 0.14 | 0.36 | 0.012 | 0.018 | 0.029 |
| [7] | POM | [EMIM][NTf2] | MR | 0.214 | 0.12 | 0.11 | 0.26 | 0.033 | 0.051 | 0.081 |
| [7] | POM | [EMIM][CF3SO3] | MR | 0.259 | 0.12 | 0.12 | 0.12 | 0.040 | 0.062 | 0.098 |
| [7] | POM | [BMIM][SCN] | MR | 0.341 | 0.14 | 0.14 | 0.15 | 0.041 | 0.064 | 0.101 |
| [7] | POM | [BMIM][NTF2] | MR | 0.165 | 0.12 | 0.13 | 0.13 | 0.044 | 0.069 | 0.108 |
| [7] | POM | [BMIM][BF4] | MR | 0.365 | 0.11 | 0.10 | 0.09 | 0.059 | 0.092 | 0.145 |
| [7] | POM | [BMIM][PF6] | MR | 0.406 | 0.12 | 0.08 | 0.07 | 0.113 | 0.177 | 0.277 |
| [7] | POM | [BMIM][CH3COO] | MR | 0.356 | 0.09 | 0.10 | 0.10 | 0.115 | 0.180 | 0.283 |
| [7] | POM | IL I04 | MR | 0.009 | 0.12 | 0.10 | 0.10 | 0.284 | 0.446 | 0.699 |
| [7] | PDMS | PAO | MR | 0.176 | 0.07 | 0.06 | 0.05 | 0.911 | 1.430 | 2.243 |
| [7] | PDMS | [EMIM][NTf2] | MR | 0.890 | 0.08 | 0.08 | 0.07 | 2.576 | 4.043 | 6.344 |
| [7] | PDMS | [EMIM][CF3SO3] | MR | 0.931 | 0.09 | 0.08 | 0.08 | 3.125 | 4.903 | 7.694 |
| [7] | PDMS | [BMIM][SCN] | MR | 1.223 | 0.07 | 0.06 | 0.06 | 3.213 | 5.041 | 7.911 |
| [7] | PDMS | [BMIM][NTF2] | MR | 0.721 | 0.09 | 0.09 | 0.08 | 3.448 | 5.410 | 8.489 |
| [7] | PDMS | [BMIM][BF4] | MR | 1.040 | 0.06 | 0.06 | 0.06 | 4.614 | 7.240 | 11.361 |
| [7] | PDMS | [BMIM][PF6] | MR | 0.947 | 0.11 | 0.08 | 0.09 | 8.841 | 13.873 | 21.768 |
| [7] | PDMS | [BMIM][CH3COO] | MR | 0.966 | 0.09 | 0.07 | 0.09 | 9.027 | 14.165 | 22.228 |
| [7] | PDMS | IL I04 | MR | 0.380 | 0.06 | 0.07 | 0.10 | 22.308 | 35.005 | 54.929 |
Table 4.
Experimental data for characterization of friction of neat ionic liquids (ILs) for given values [6].
Table 4.
Experimental data for characterization of friction of neat ionic liquids (ILs) for given values [6].
| Source | Surface | Lubricant | Type | Speed (−) | λ (−) | |S*| (−) | Friction Coefficient (−) |
|---|---|---|---|---|---|---|---|
| [7] | PDMS | [EMIM][NTf2] | IL | 7.900 | 0.176 | 0.060 | |
| [7] | POM | [EMIM][NTf2] | IL | 0.101 | 0.176 | 0.079 | |
| [7] | Steel | [EMIM][NTf2] | IL | 0.024 | 0.176 | 0.124 | |
| [7] | PDMS | [EMIM][CF3SO3] | IL | 7.900 | 0.183 | 0.062 | |
| [7] | POM | [EMIM][CF3SO3] | IL | 0.101 | 0.183 | 0.060 | |
| [7] | Steel | [EMIM][CF3SO3] | IL | 0.024 | 0.183 | 0.095 | |
| [7] | PDMS | [BMIM][SCN] | IL | 7.900 | 0.310 | 0.060 | |
| [7] | POM | [BMIM][SCN] | IL | 0.101 | 0.310 | 0.054 | |
| [7] | Steel | [BMIM][SCN] | IL | 0.024 | 0.310 | 0.090 | |
| [7] | PDMS | [BMIM][NTF2] | IL | 7.900 | 0.222 | 0.060 | |
| [7] | POM | [BMIM][NTF2] | IL | 0.101 | 0.222 | 0.080 | |
| [7] | Steel | [BMIM][NTF2] | IL | 0.024 | 0.222 | 0.092 | |
| [7] | PDMS | [BMIM][BF4] | IL | 7.900 | 0.341 | 0.059 | |
| [7] | POM | [BMIM][BF4] | IL | 0.101 | 0.341 | 0.067 | |
| [7] | Steel | [BMIM][BF4] | IL | 0.024 | 0.341 | 0.080 | |
| [7] | PDMS | [BMIM][PF6] | IL | 7.900 | 0.393 | 0.055 | |
| [7] | POM | [BMIM][PF6] | IL | 0.101 | 0.393 | 0.060 | |
| [7] | Steel | [BMIM][PF6] | IL | 0.024 | 0.393 | 0.057 | |
| [7] | PDMS | [BMIM][CH3COO] | IL | 7.900 | 0.167 | 0.059 | |
| [7] | POM | [BMIM][CH3COO] | IL | 0.101 | 0.167 | 0.056 | |
| [7] | Steel | [BMIM][CH3COO] | IL | 0.024 | 0.167 | 0.097 |
Table 5.
Experimental data for characterization of friction of neat ILs for given sliding speeds [6].
Table 5.
Experimental data for characterization of friction of neat ILs for given sliding speeds [6].
| Source | Surface | Lubricant | Type | Friction Coefficient at | ||||||
|---|---|---|---|---|---|---|---|---|---|---|
| 0.05 (m/s) | 0.10 (m/s) | 0.50 (m/s) | 0.05 (m/s) | 0.10 (m/s) | 0.20 (m/s) | |||||
| [7] | Steel | [EMIM][NTf2] | IL | 0.176 | 0.14 | 0.13 | 0.12 | 0.008 | 0.012 | 0.019 |
| [7] | Steel | [EMIM][CF3SO3] | IL | 0.183 | 0.12 | 0.11 | 0.10 | 0.009 | 0.015 | 0.023 |
| [7] | Steel | [BMIM][SCN] | IL | 0.310 | 0.12 | 0.10 | 0.09 | 0.010 | 0.015 | 0.024 |
| [7] | Steel | [BMIM][NTF2] | IL | 0.222 | 0.12 | 0.10 | 0.09 | 0.010 | 0.016 | 0.026 |
| [7] | Steel | [BMIM][BF4] | IL | 0.341 | 0.09 | 0.08 | 0.06 | 0.014 | 0.022 | 0.034 |
| [7] | Steel | [BMIM][PF6] | IL | 0.393 | 0.06 | 0.04 | 0.05 | 0.027 | 0.042 | 0.066 |
| [7] | Steel | [BMIM][CH3COO] | IL | 0.167 | 0.10 | 0.06 | 0.04 | 0.027 | 0.043 | 0.067 |
| [7] | POM | [EMIM][NTf2] | IL | 0.214 | 0.10 | 0.08 | 0.08 | 0.033 | 0.051 | 0.081 |
| [7] | POM | [EMIM][CF3SO3] | IL | 0.259 | 0.09 | 0.08 | 0.06 | 0.040 | 0.062 | 0.098 |
| [7] | POM | [BMIM][SCN] | IL | 0.341 | 0.10 | 0.07 | 0.05 | 0.041 | 0.064 | 0.101 |
| [7] | POM | [BMIM][NTF2] | IL | 0.165 | 0.08 | 0.07 | 0.08 | 0.044 | 0.069 | 0.108 |
| [7] | POM | [BMIM][BF4] | IL | 0.365 | 0.06 | 0.07 | 0.05 | 0.059 | 0.092 | 0.145 |
| [7] | POM | [BMIM][PF6] | IL | 0.406 | 0.06 | 0.04 | 0.05 | 0.113 | 0.177 | 0.277 |
| [7] | POM | [BMIM][CH3COO] | IL | 0.356 | 0.06 | 0.07 | 0.03 | 0.115 | 0.180 | 0.283 |
| [7] | PDMS | [EMIM][NTf2] | IL | 0.890 | 0.12 | 0.06 | 0.06 | 2.576 | 4.043 | 6.344 |
| [7] | PDMS | [EMIM][CF3SO3] | IL | 0.931 | 0.07 | 0.06 | 0.06 | 3.125 | 4.903 | 7.694 |
| [7] | PDMS | [BMIM][SCN] | IL | 1.223 | 0.11 | 0.06 | 0.06 | 3.213 | 5.041 | 7.911 |
| [7] | PDMS | [BMIM][NTF2] | IL | 0.721 | 0.06 | 0.06 | 0.06 | 3.448 | 5.410 | 8.489 |
| [7] | PDMS | [BMIM][BF4] | IL | 1.040 | 0.06 | 0.06 | 0.06 | 4.614 | 7.240 | 11.361 |
| [7] | PDMS | [BMIM][PF6] | IL | 0.947 | 0.05 | 0.06 | 0.06 | 8.841 | 13.873 | 21.768 |
| [7] | PDMS | [BMIM][CH3COO] | IL | 0.966 | 0.06 | 0.06 | 0.06 | 9.027 | 14.165 | 22.228 |
© 2018 by the authors. Licensee MDPI, Basel, Switzerland. This article is an open access article distributed under the terms and conditions of the Creative Commons Attribution (CC BY) license (http://creativecommons.org/licenses/by/4.0/).
Share and Cite
MDPI and ACS Style
Schertzer, M.J.; Iglesias, P. Meta-Analysis Comparing Wettability Parameters and the Effect of Wettability on Friction Coefficient in Lubrication. Lubricants 2018, 6, 70. https://doi.org/10.3390/lubricants6030070
AMA Style
Schertzer MJ, Iglesias P. Meta-Analysis Comparing Wettability Parameters and the Effect of Wettability on Friction Coefficient in Lubrication. Lubricants. 2018; 6(3):70. https://doi.org/10.3390/lubricants6030070
Chicago/Turabian StyleSchertzer, Michael J., and Patricia Iglesias. 2018. "Meta-Analysis Comparing Wettability Parameters and the Effect of Wettability on Friction Coefficient in Lubrication" Lubricants 6, no. 3: 70. https://doi.org/10.3390/lubricants6030070
Note that from the first issue of 2016, this journal uses article numbers instead of page numbers. See further details here.