1. Introduction
Reducing friction between moving parts is the most important function of a lubricant. Lubricants can be formulated with different components depending upon the needs of the target application. Some targeted properties can be improved through the use of additives and others can be improved through the use of base oils while the highest quality (top tier) lubricants often take advantage of both. Specifically, the selection of different base oil(s) can impact many properties of the end lubricant. For instance, the progression of API Groups I, II and III base oils increase in saturation and viscosity index (VI) while decreasing in the amount of sulfur. API Group IV is for Polyalphaolefins (PAOs) and represents one class of synthetic base oils. PAOs can range from low viscosity to high viscosity materials and are generally known based on their kinematic viscosity at 100 °C (i.e., PAO 2 is approximately 2 cSt at 100 °C and PAO 4 is approximately 4 cSt at 100 °C). There is no one-size-fits-all base oil for all applications. One question that exists and has existed for many years is what performance level or collection of properties does the lubricant application require? Specifically, for this paper, we are examining the difference between a high quality Group III mineral oil and PAOs in regards to friction in a passenger car engine oil. Furthermore, this reduction in friction will be evaluated relative to potential energy efficiency improvements.
This study is of course not the first examination of frictional differences of base oils. In 1999, Gunsel, Korcek and Smeeth [
1] observed that solvent-refined and hydro-treated mineral oils resulted in a higher friction than Group III and IV (PAO) oils. Examining the typical physical properties, such as those found on a typical data sheet, of the base oils might explain some of the lubrication properties but other properties such as friction might be more elusive. If we examine the basic physical properties of viscosity, viscosity index, flash point and Noack volatility we can observe some differences between oils of similar viscosity grade for API Groups I, II, III and PAO. Specifically, viscosity as a function of temperature shows that even if there is a similar viscosity grade, the low and high temperature behavior can be very different. The temperature/viscosity behavior becomes even more pronounced at low temperatures.
Figure 1 is provided as an example where the Brookfield viscosities of two different Group III base oils, a Group III+ oil and a PAO are shown. For the Group III and III + oils, there are inflection points in the curves indicating gelation between −5 and −15 °C. It is also recognized that the chemical components present in these oils can be very different and an outline of the differences in physical properties between PAOs and mineral oils can be found in the Polyalphaolefins chapter by Rudnick [
2]. Since the viscosity temperature properties are different from one API Group to another and the chemical structures of the materials are also different, this then raises the question of whether there is a relationship between the chemical structure and the frictional properties as well. This question was examined in 2017 by Zhang, Tan and Spikes [
3] with base oils and a limited set of additives. In that study, the effect of base oil structure on elastohydrodynamic (EHD) friction was evaluated using a mini traction machine (MTM2 from PCS Instruments). That paper also pointed to the relationship between fluids that have a low EHD friction and a low viscosity index (VI) based on thermodynamic terms [
3,
4]. One question remains on whether those frictional differences would remain or be expanded with fully formulated lubricants from these different base oils. This is especially intriguing given the considerations of the different chemical compositions of these base oils. Regarding the chemical structure, it was also shown that PAOs, which are based on 1-alkenes and hence have a high proportion of linear alkyl chains, generally show lower EHD friction than mineral oils [
3].
The impact of PAO relative to mineral oils in Heavy Duty Diesel Oils (HDDO) was similarly examined in 1998 by Benda, Plomer and Reboul [
5], where it was found that PAO-based low viscosity HDDOs provide fuel consumption and particulate emissions benefits. A 2004 study from Yang, Reddyhoff and Spikes [
6] examined the effect of lubricant properties on the ARKL (achsialrillenkugellager) EOTT (end of test temperature). This ARKL EOTT method provides a relatively inexpensive measure of transmission efficiency and thereby a measure of reduced energy consumption. The ARKL EOTT bench test reportedly gives better repeatability and is easier than performing a transmission test. For instance, a low ARKL EOTT is related to an improved efficiency in comparison to fluids with higher ends of test temperatures. For this paper, it is more interesting to point out that “PAO and polyol ester blends gave low ARKL EOTT and thus are energy conserving” [
6]. That paper continued to suggest that fluids having high amounts of bulky, inflexible molecules tend to have high EHD friction as well as high pressure-viscosity coefficients. Based upon all of this information, it appears that the link between chemical structure and energy conserving properties such as friction is quite interesting. Specifically, it relates macro bulk fluid properties (such as friction) to chemical properties (chemical structure, isomeric distribution etc.).
The structure of PAO has been a topic of interest for many years [
7,
8]. One of the most frequently posed questions in this author’s opinion regarding the structure of PAO is “what is the PAO structure?” Perhaps it is simply better to recognize that PAO is not a single structure or chemical compound but rather it is a diverse collection of many structures that are all highly branched isoparaffins. Another way of conceptualizing the makeup of PAO is by understanding what it is not. For example, PAOs do not contain, in this author’s experience, any aromatics nor cyclic components. In contrast, it is well accepted that mineral oils (including API Groups I through III) have various amounts of paraffinic, naphthenic, aromatic, polycyclic and heterocyclic components [
9]. So, the first step in understanding the differences between various physical property differences between PAOs and other fluids is recognizing that the chemical makeup is likewise different. This is not to say that there are no similarities, because there are many [
2]. The key question for each lubrication application that should be considered could be: are the property differences in the base oil important for the particular application of interest?
In light of these previous studies and the property differences just discussed, this article will examine friction as measured by the MTM2 instrument of PAO and mineral oil base oils and the formulated lubricants from these base oils. Understanding the frictional differences between PAO and Group III base oils is useful in ascertaining the benefit part of the cost/benefit equation. There are other performance benefits for PAOs such as:
However, the focus of this paper will be on frictional characteristics as it relates to energy efficiency.
4. Discussion
Three oils have been formulated with the same additives and additive treatment rates. The viscosities have targeted the same 100 °C kinematic viscosities by adjusting the amount of viscosity modifier to account for the differences in base oil viscosities. The 100 °C viscosity was chosen as the target parameter for the blends since we are evaluating the impact on passenger car engine oils and 100 °C is close to the designed operating temperature of these vehicles. The base oils that have been used are from 4 to 5 cSt at 100 °C, but are different in their makeup. Oil A is based on PAO 4, which is produced from a typical PAO process involving a Lewis acid catalyst for the oligomerization and isomerization of 1-decene. These materials are well known and have been used in lubricants for well over 30 years. PAOs have a high number of isomers but are all generally regarded as highly branched isoparaffins. Oil B is based on a 4 cSt North American Group III base oil that is generally available and represents a good quality oil selected from available commercial products. The base oil for Oil C is a 50:50 blend of the Group III base oil just described in Oil B and PAO 5. The PAO 5 is a 1-dodecene-based PAO and is produced in a similar fashion to the PAO 4 in Oil A but does represent a different feedstock. Specifically, the feedstock differences allow for a lower Noack volatility, which is observed in
Table 2 as well as a higher VI. The isomeric distribution for PAO 5 is believed to be very similar to that of the PAO 4 but the slight difference in the feedstock molecular weight (two carbons, i.e., C10 vs. C12) gives an increase in the 100 °C viscosity even though both represent the trimer fraction of the oligomers, C30 vs. C36 for 1-decene and 1-dodecene, respectively. Other differences that are notable between PAO 4 and 5 are the pour points, VI and the low temperature viscometrics.
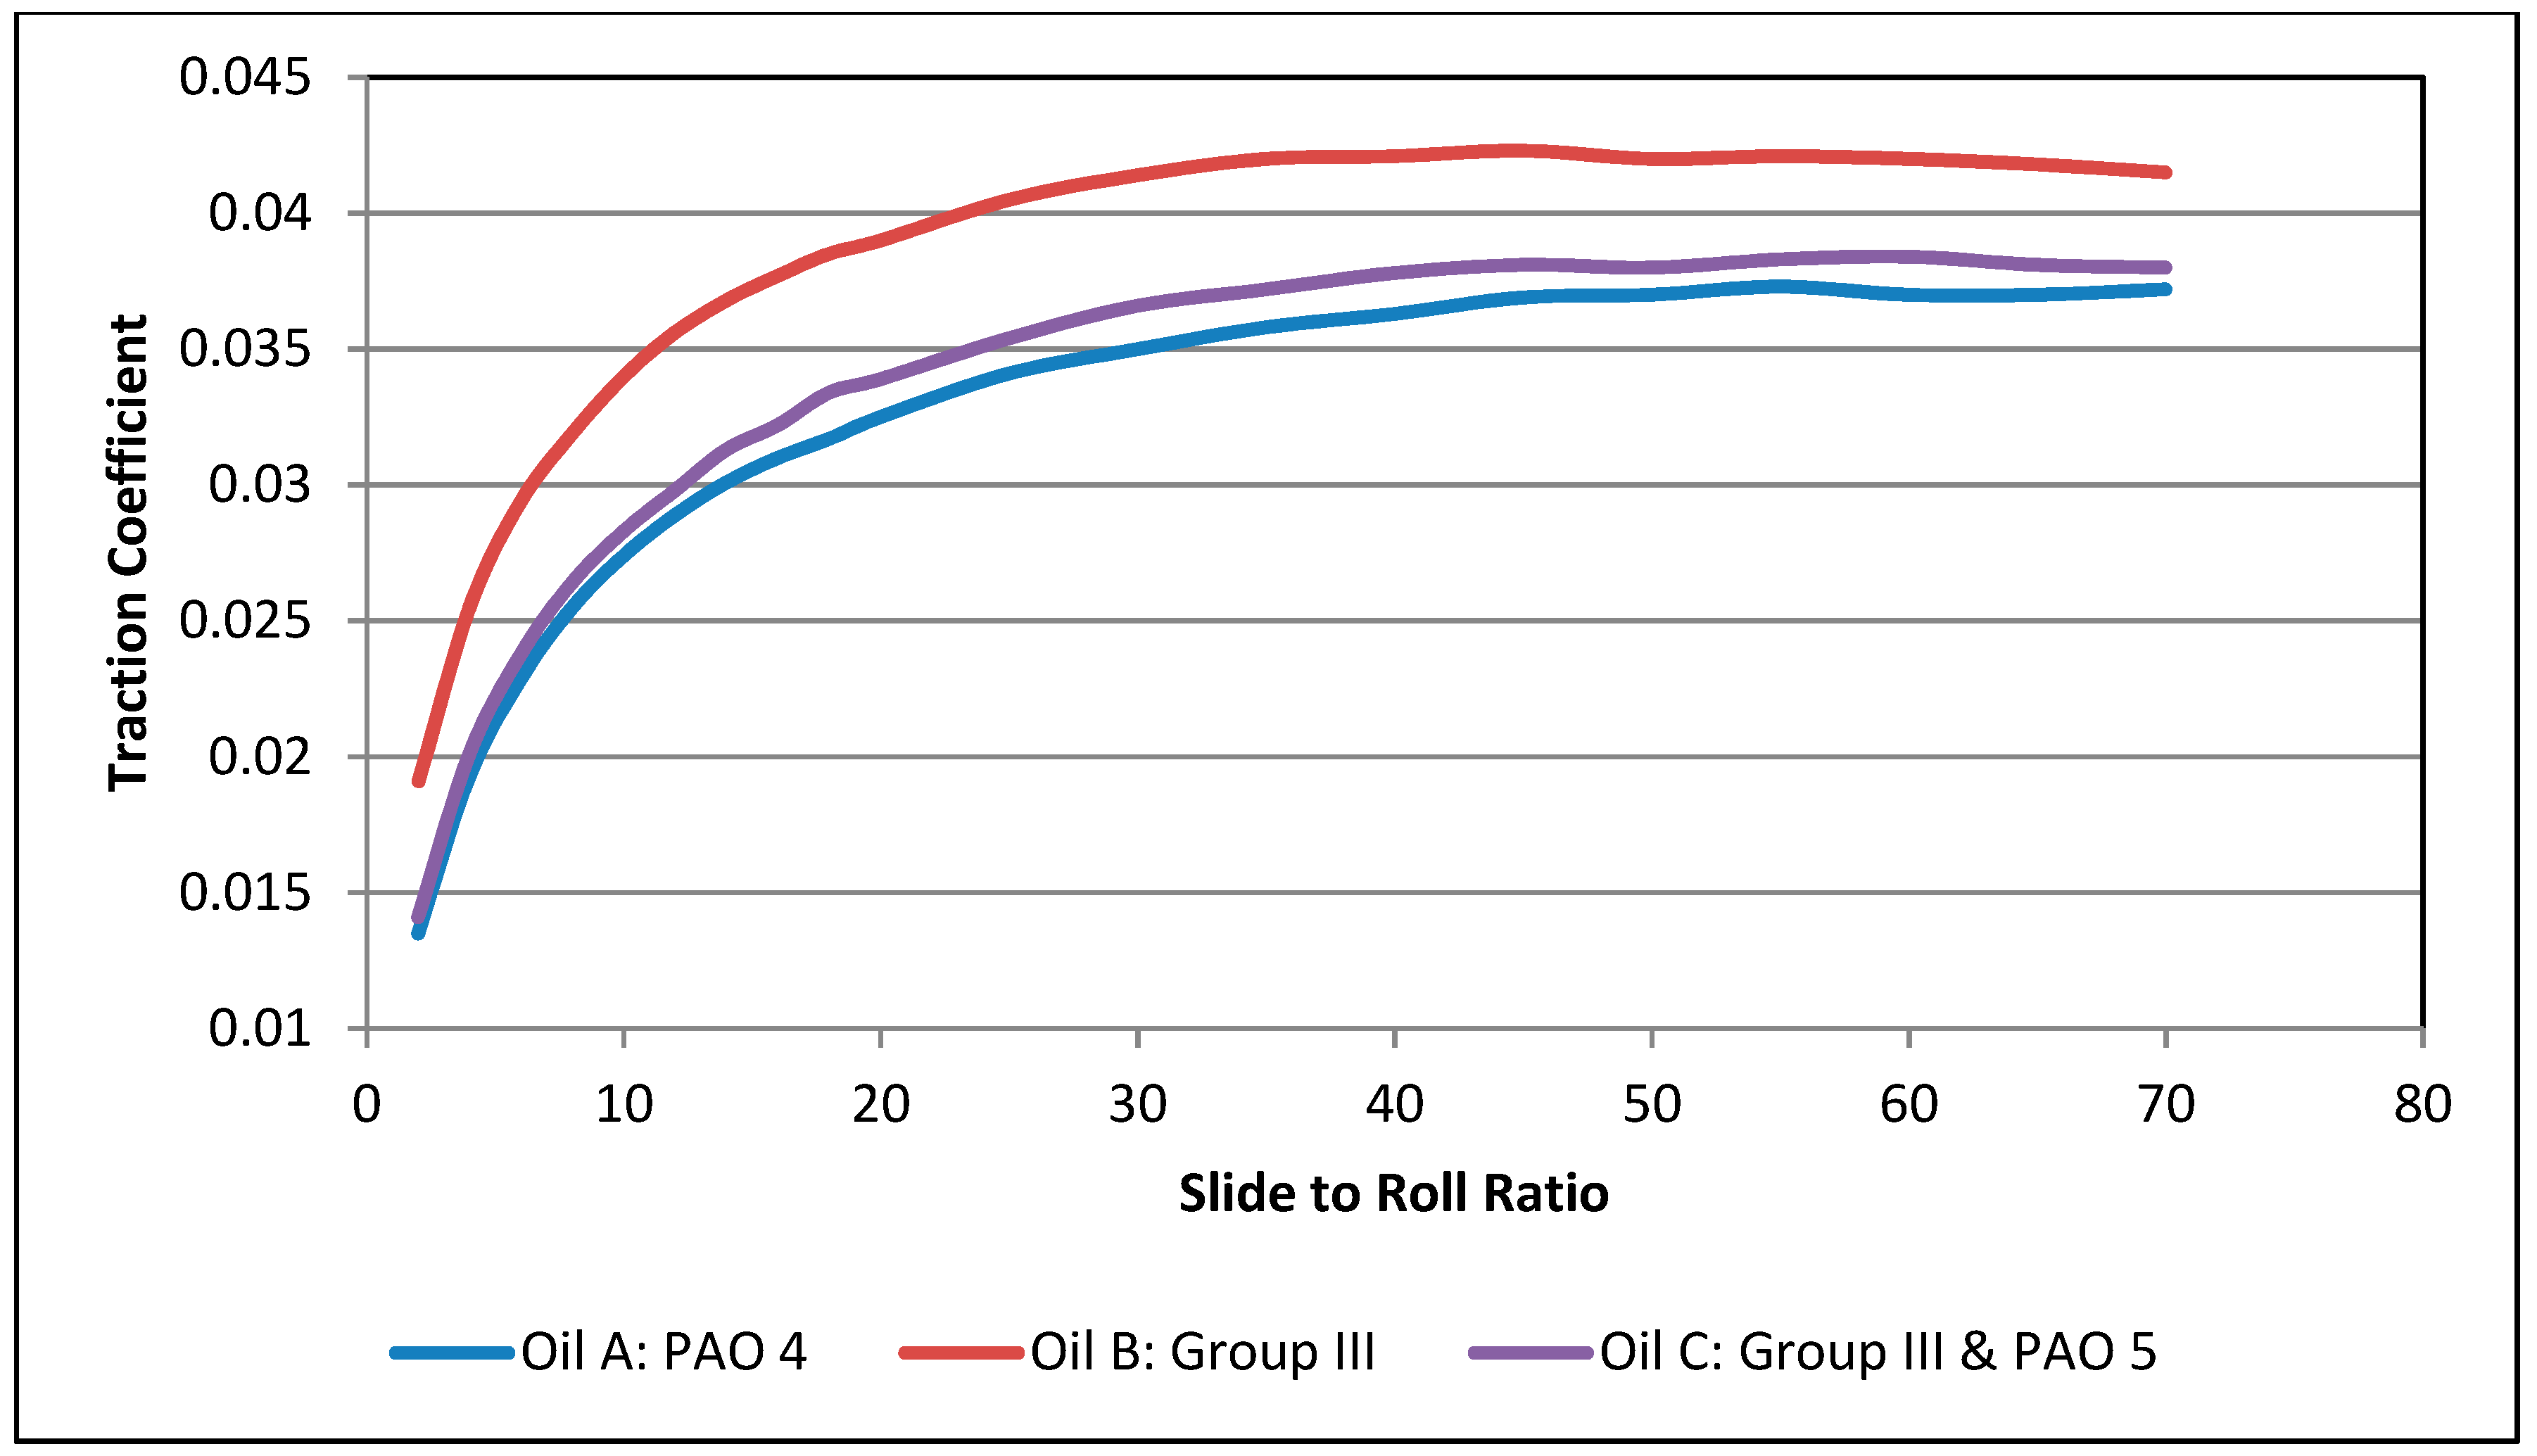
MTM traction and Stribeck results show that these oils have some frictional differences despite the similarities in the formulations. Since the main difference between the formulations are simply the base oils used, it is assumed that the difference in the frictional properties should also be due to the base oil differences. As mentioned earlier, there are previous studies that highlight frictional differences from Groups I–III and PAOs [
1,
6]. It is observed here that the traction and Stribeck curves are lowest for Oil A, which only has PAO 4 as the base oil. The highest friction or traction is also observed for Oil B, which has Group III as the base oil and the mixture of Group III and PAO 5 is in-between the two. Chemically, it is interesting to consider the reasons for this measurement while it is recognized that in one case for PAO, the chemistry is entirely made up of highly branched isoparaffins. In the case of Oil B, which contains only Group III as a base oil, we have several different types of compounds present in that base oil such as isoparaffins, naphthenic compounds, cycloaliphatic compounds and others. Even though there are many isomers present for the PAO case, they are all still considered branched isoparaffins whereas there are more than just isoparaffins in the Group III oil. Since the chemical makeup is different for these different base oils; it is also understandable that some of the end properties would likewise be different. We are observing here that there are measurable frictional differences when the additive chemistry is held constant. This is natural with the exception of the viscosity modifier, which must be adjusted to compensate for the differing viscosities otherwise larger differences would arise simply due to viscosity grade differences.
Now that we have the friction for these different oils over a range of SRR values we can look at the percentage differences, which in theory should correlate to improved energy efficiency. For instance, if we set the traction curve for Oil B as a baseline case then a reduction in the friction at the same SRR value would represent a potential improvement that could be achievable through the use of the new base oil combination. Furthermore, if we assume that a typical gear oil lubrication regime is represented at 50% SRR then the percent difference in the friction at that point would represent the potential improvement in going to the lower friction gear oil. Likewise, a near zero SRR could be indicative of a rolling element bearing and a very high SRR could provide an estimate for higher sliding conditions. For instance, we could assign various lubrication regimes to model certain lubrication regimes in an engine. This approach has been used previously [
10] and combining the previous models with this specific friction/traction data from this simple base oil study can help us to understand what level of improvement could be expected from the base oil changes.
Holmberg, Andersson and Erdemir [
10] published a review and summarized from references therein [
11,
12,
13,
14,
15,
16,
17,
18,
19], that for the average American car, the lubricant-related friction losses in the engine comprised approximately 11.5% of the total fuel energy. In that paper, it was suggested that the engine friction losses could be subdivided as:
45% of energy loss is due to the piston assembly
30% would be consumed in bearings, seals, etc. (hydrodynamic lubrication)
15% is consumed in the valve train (mixed lubrication)
10% is consumed by pumping and hydraulic viscous losses
Based upon this distribution of energy it should be possible to understand, by a simple approximation, the level of improvement that could be achievable due to the frictional differences in the base oils described in this paper for the areas covered by the MTM evaluation. Specifically, the bearings could be evaluated based upon the hydrodynamic regime and the valve train evaluated based upon the mixed lubrication regime. Here we are approximating the hydrodynamic regime in the 460 to 3200 mm/s rolling speed of the 100 °C Stribeck curves and the mixed regime in the 12 to 370 mm/s rolling speed. The hydrodynamic regime coefficients of friction averages are 0.02423, 0.02243 and 0.02068 for Oils B, C and A, respectively, and have been estimated from the elastohydrodynamic regime friction averages. The coefficients of friction in the mixed regimes are 0.06200, 0.06096 and 0.05884 for Oils B, C and A, respectively. If we assume an average fuel economy of 6.65/100 km (35.4 MPG) and typical driving distance of 13,000 km then that would be approximately 30,251 MJ of energy per passenger vehicle. According to Holmberg, Andersson and Erdemir [
10], the 11.5% friction-related losses in the engine that can be subdivided to the degree listed above, then simple math would imply 5.2% of the frictional energy would be lost to the piston assembly (11.5% of engine related losses multiplied by 45% loss to the piston assembly). Following this assumption, it would likewise yield 3.5% energy losses due to bearings, 1.7% in the valve train and 1.2% due to hydraulics. Combining the frictional differences measured in the MTM instrument in the bearings and valve train lubrication regimes (hydrodynamic and mixed) for Oils A, B, and C at 100 °C, and also using the Group III (Oil B) as the baseline, we can estimate the potential savings in energy expected from Oil A and C in comparison to Oil B.
Table 3 shows the percentage improvements for Oils A and C relative to the base case B, based upon those measured frictional differences.
Furthermore, this simple extrapolation of the frictional savings does not take into account other potential savings due to anything other than reduction in engine friction. For instance, and as pointed out by Holmberg and co-workers, there could be further reductions (possibly three-fold) in frictional losses (i.e., improvements in fuel economy) since a reduction in engine-related friction will also reduce both exhaust and cooling losses at the same ratio. In this paper, we have not accounted for such additional knock-on effects and have simply estimated the benefits due to frictional differences. In addition, it is clear that Gigapascal level rolling/sliding elastohydrodynamic friction results have been used to assess what potentially could happen if the same oils were used in a Megapascal level in a pure sliding versus roller element bearings. For simplification, and just as an example, the bearing assumptions have been assumed for rolling elements only.


