1. Introduction
In internal combustion engines (ICE), the friction losses of the base engine are divided into the sub-assemblies piston group, crankshaft journal bearings, valve train, timing drive and shaft seals. Looking at a passenger car powerd by an ICE, approximately 30% of fuel consumption is used to overcome friction losses [
1]. Subsequently, the reduction of the friction losses on these sub-assembly systems is currently and in future a significant aim during the base-engine development process [
2,
3,
4,
5].
From literature detailed friction loss investigations on single cylinder engines are available [
6,
7,
8]. Also a number of reasearchers have investigated the friction losses of passenger car engines both for gasoline [
9,
10,
11] and diesel engines [
12,
13,
14,
15]. Furthermore, individual comparisons between modern diesel and gasoline engine friction losses focusing on lubricant sensitivities [
16], a comparison of two gasoline engines for passenger car applications [
17] and a comparison of two diesel engines for passenger car applications [
18] are available in literature. Also detailed investigations dealing with ICE design aspects on friction losses are available [
19]. But a lack of literature is found which is focusing on ICE friction loss investigations and comparisons with identical engine displacement and power density. In addition comparisons on the engines sub-assembly level for different engine media supply temperatures over a wide range of the engine operation map (engine speed, engine load) are not known to the author.
In this study, three different engines are investigated in detail. Two gasoline engines (a conventional and a downsized gasoline engine with twice the specific power output) and a diesel engine (very similar specific power output than the conventional gasoline engine) have been analysed. While conventional gasoline engines achieve higher speeds with relatively low loads, downsizing engines are working in addition under high peak cylinder pressures (see
Figure 1).
Diesel engines are conceptually exposed to very high loads due to the high gas forces resulting from the self-ignition combustion design with indispensable high compression ratios. The aim of engine “downsizing” is to increase the engine efficiency by moving the engine operation to advantageous high-efficiency areas in the engine map. The operation range is shifted to higher mean pressures subsequently by reducing the volume displacement. Torque buffers have to be included which are essential for acceleration phases [
20]. For high performance downsizing engine concepts (realized at gasoline engine 2) the ICE power output and torque is put to the same or increased level than at bigger engines using a higher number of cylinders. Consequently, additional needs regarding the controllability of increased loads due to high gas forces arise for the power unit. This affects the layout and design (construction and materials) of the engine sub-assemblies. In comparison to conventional gasoline engines robust components are required for downsizing and diesel engine concepts to withstand these increased stresses. The different layouts are exemplary shown in
Figure 2 for the conrod/piston group assembly of the engines investigated in this work.
In addition to the increased loads resulting from the high gas forces, the diesel engine must withstand higher mass forces of the moving crank drive components due to the larger component masses. For the downsizing concept, not only increased peak cylinder pressures but also increased engine speeds are realized. These design parameters require low component masses to reduce the acting mass forces, but at the same time connecting rods and pistons must also be able to withstand the resulting higher loads (see
Figure 2).
Regarding the different engine layouts, specific interests and aims to investigate the mechanical efficiency of the three different engine concepts arise:
Determination of the friction losses on the base engine key sub-assemblies: Piston group, crankshaft journal bearings (main- and big end bearings) and valve train.
Sub-assembly-resolved comparison of the friction losses between the different engine concepts
Overview and discussion of the base engine friction losses
To conduct the friction loss analysis for all engines presented in this work, a combined approach using the advantages of both, experimental investigations and simulation capabilities, is applied. The combined methodology has been presented and described in detail in part 1 of this publication series “Investigations of the Friction Losses of Different Engine Concepts. Part 1: A Combined Approach for Applying Sub-assembly-Resolved Friction Loss Analysis on a Modern Passenger-Car Diesel Engine” [
21]. At this point it is noted, that for the understanding of the results presented in this work the content presented in [
21] is recommended.
2. The Engines Under Test
The friction investigations were carried out on three different in-line four-cylinder, four-stroke, turbo-charged, passenger car engines. The engines have been specifically chosen to enable comparisons not only between the different engine concepts but also with focus on their specific power output. The diesel engine and gasoline engine 1 are representing two engines with almost identical specific power output. In contrast, gasoline engine 2 represents a downsizing concept with doubled power density in comparison to the conventional engines. The technical details of the engines are listed in
Table 1.
It is important to note that all investigations conducted in this work are carried out using the same modern SAE 5W30 lubricant. This represents a fundamental boundary condition to exclude arising influences from different lubricant properties which may have significant effects on the engines sub-assemblies. As an example using different base oils and/or different additive packages may affect the beginning of mixed lubrication or change lubricant viscosity when high pressure and shear rates occure in the lubricated contacts [
22]. Therefore, one lubricant has been selected for the research tasks, which is suitable for all three engine concepts. The basic physical properties of the SAE 5W30 lubricant used in this work are listed in
Table 2.
Furthermore it is a mandatory boundary condition for the friction loss investigations, that the engines are proper run-in before the friction measurements are conducted. Therefore the engines are extensively run-in using a defined procedure to account for occurring run-in processes affecting the results [
23,
24,
25,
26].
Measurement Program
The measurement programs, which have been conducted at different engine media supply temperatures ranging from 70
C to 110
C are designed and coordinated regarding the comparability of engine speed, peak cylinder pressures and engine media supply temperatures/pressures. The coordination effort results in detailed and comparable friction maps for the investigated engines.
Figure 3 shows the executed engine operation points both in motored and load conditions.
The base engine measurement programs are covering pure motoring tests and load tests ranging from part load up to full load conditions. It covers 120, 144 and 46 different measurement points for the diesel engine, gasoline engine 1 and gasoline engine 2, respectively. The minimum engine speed was defined with n = 1000 rpm. The maximum engine speed was limited with n = 4000 rpm, n = 5000 rpm and n = 6000 rpm for the diesel engine, gasoline engine 1 and gasoline engine 2 respectively. Load tests have been conducted at comparable engine speeds between the aggregates working at peak cylinder pressures up to = 180 bar, = 70 bar and = 120 bar for the diesel engine, gasoline engine 1 and gasoline engine 2. It is important to note that equal cylinder pressure levels have been chosen between the different engines to allow friction loss comparisons at identical boundary conditions. It is mandatory to minimize influences of different thermal boundary conditions affecting e.g., lubricant viscosity and density, installation clearances of journal bearings and pistons when conducting friction comparisons.
3. Sub-Assembly Resolved Friction Losses of the Three Engine Concepts
The applied analysis approach [
21] connects results from engine friction measurements and from predictive journal bearing simulations. When applying the combined approach, following basic set of formulas is used to determine the individual proportions of the sub-assemblies:
The friction loss of the base engine, denoted as FMEP (friction mean effective pressure) is calculated by the subtraction of the IMEP (indicated mean effective pressure) and the BMEP (brake mean effective pressure) according to Equation (
1) when using the IMEP-method.
Equation (
2) relates the measured brake torque at the crankshaft (T) to the corresponding mean effective pressure (BMEP)
where
W refers to the work per cycle and
to the volume displacement of the investigated four-stroke engine. The IMEP calculation is done according to Equation (
3) by integrating the measured cylinder pressure (
over a working cycle divided by the volume displacement of the engine.
To receive the FMEP for the sub-assemblies valve train, journal bearings and piston group during the application of the developed friction analysis approach, the individual FMEP shares are calculated as follows:
In the following subsections the resulting FMEP results of the individual sub-assemblies are presented for all three engines for different engine media supply temperatures ranging from 70 C to 110 C.
3.1. Piston Group Friction Losses
The friction losses of the piston group for the three engines investigated are plotted in
Figure 4 for three different engine media supply temperatures. It is important to note that the sub-assembly piston group includes the friction losses of the pistons, piston rings (top-, second- and oil-rings), piston pins and conrod small end bearings.
Diesel engine:
A clear temperature trend is observed when analysing the piston group friction losses, even though the highest peak cylinder pressures are reached for this engine with = 180 bar. At the lowest engine media supply temperature the maximum FMEP levels are resulting with FMEP = 0.33 at an engine speed of n = 3500 rpm. When the temperature is increased, the FMEP levels are decreasing with the exception of high load operation at n = 1500 rpm. At this operation point the FMEP levels of the piston group are slightly increasing indicating mixed lubrication. The lowest FMEP level for the piston group of the diesel engine are resulting at the highest engine media supply temperature of 110 C and motored operation at n = 1000 rpm with FMEP = 0.13 bar.
Gasoline engine 1:
For gasoline engine 1 the FMEP results show a different behaviour in comparison to the diesel engine. At the lowest engine media supply temperature the maximum FMEP levels with FMEP = 0.35 bar are determined at two different operation points in the engine map. On one hand the maximum level results at the maximum engine speed n = 5000 rpm at motored operation. On the other hand the same FMEP level is found at the lowest engine speed of n = 1000 rpm at an peak cylinder pressure of = 40 bar. This result indicate that the piston group is running in the whole field of lubrication regimes ranging from boundary/mixed lubrication at the TDC/BDC and pure hydrodynamic lubrication during the up and down stroke of the piston. While at n = 1000 rpm a possible explanation of the high FMEP level can be increased mixed lubrication at low engine speeds and high loads. In contrast, the friction losses at an engine speed of n = 5000 rpm can be explained by increased hydrodynamic friction losses due to lubricant shearing at positions of high piston speeds during the piston stroke. Furthermore, a temperature trend is found for the piston group of gasoline engine 1. When increasing the engine media supply temperature, the FMEP levels are decreasing but remain almost constant for n = 1000 rpm and = 40 bar supporting the explanation of the high FMEP levels caused by mixed lubrication regimes. The lowest FMEP level is found at the lowest engine speed of n = 1000 rpm and motored operation with FMEP = 0.17 bar at an engine media supply temperature of 110 C.
Gasoline engine 2:
For gasoline engine 2 very interesting results are received when applying the analysis procedure of the combined approach. For motored and low load engine operation, the FMEP levels of the piston group are indicating a good friction performance. The lowest FMEP level is resulting at an engine speed of n = 2000 rpm and motored operation with FMEP = 0.13 bar at an engine media supply temperature of 90 C. It is interesting to note that for motored operation gasoline engine 2 shows the lowest FMEP levels of all three engines at 90 C (Diesel engine: FMEP = 0.14 bar; Gasoline engine 1: FMEP = 0.2 bar). With increasing peak cylinder pressures the FMEP levels are also strongly becoming larger. The highest FMEP level is resulting at a peak cylinder pressure of = 120 bar at an engine speed of n = 3000 rpm and an engine media supply temperature of 70 C with FMEP = 0.77 bar. Nevertheless, a clear temperature trend is observed from the results. When increasing the engine media supply temperature the FMEP levels of the piston group are decreasing over a wide range of the engine operation map for low load operation. For high load operation at an engine speed of n = 2000 rpm the FMEP levels are increasing when the lubricant viscosity is decreasing. This results are indicating beginning mixed lubrication regimes for the piston group of gasoline engine 2.
The piston group FMEP results are clearly showing, that friction investigations under load conditions are essential for a holistic analysis of the sub-system. It is interesting to note that the FMEP level of the piston group at motored engine operation is lowest for gasoline engine 2. The FMEP difference to the other engines under motoring engine operation reaches values of up to FMEP = 0.12 bar. But the situation under load operation is different. Here, gasoline engine 2 revealed increased FMEP levels for engine speeds higher n = 1500 rpm and peak cylinder pressures above = 70 bar either when comparing the results with the conventional gasoline and diesel concept. The diesel engine piston group shows a very good performance in terms of generated friction losses under high load operation.
The piston group friction losses are calculated by subsequent subtraction of individual friction losses from the results of the base engine friction measurements due to the applied procedure [
21]. It is therefore expected that the FMEP results of the piston group are showing the largest uncertainties of the sub-assembly system results.
3.2. Crankshaft Journal Bearing Friction Losses
The friction losses of the crankshaft main and big end bearings are calculated for the equal engine operation points of the base engine measurement campaigns presented in
Figure 3. Consequently, 310 different operation points have been calculated to obtain the crankshaft journal bearing friction losses of the diesel, gasoline engine 1 and gasoline engine 2. For the calculations measured journal bearing temperature data as well as the measured cylinder pressures at all cylinders are important input data for the simulations beside detailed geometry data (macro- and micro-geometry). The results are separated into results of the five crankshaft main bearings and four big end bearings. The subsequent FMEP-maps are plotted in
Figure 5 and
Figure 6.
The results in
Figure 5 show the determined FMEP of the five main bearings for all three investigated engines at different engine media supply temperatures. In general, the results show a FMEP increase when increasing engine speed and load.
Diesel engine:
For the diesel engine the FMEP-values of the main bearings are showing an increase over engine speed and engine load. In addition a clear temperature dependency and trend is found. The highest FMEP level with FMEP = 0.27 bar was found at the lowest engine media supply temperature of 70 C at the highest investigated engine speed of n = 3500 rpm and a peak cylinder pressure of = 120 bar. The lowest FMEP level on the other hand with FMEP = 0.06 bar was found at an engine speed of n = 1000 rpm in motored operation at 110 C. The FMEP levels are decreasing significantly over the whole engine operation map when increasing the engine media supply temperature.
Gasoline engine 1:
The main bearing friction losses of gasoline engine 1 showed an increase over engine speed and engine load as well as a clear trend when increasing the engine media supply temperature. The highest FMEP level with FMEP = 0.31 bar was found at the lowest engine media supply temperature of 70 C at an engine speed of n = 5000 rpm and a cylinder pressure of = 70 bar. The lowest FMEP level on the other hand with FMEP = 0.05 bar was found at an engine speed of n = 1000 rpm in motored operation at 110 C. It was found that the FMEP levels are decreasing significantly over the whole engine operation map when increasing the engine media supply temperature.
Gasoline engine 2:
For gasoline engine 2 the FMEP-values of the main bearings are showing a clear dependency on engine load, engine speed and engine media supply temperature. The highest FMEP level with FMEP = 0.31 bar was found at the lowest engine media supply temperature of 70 C at the highest investigated peak cylinder pressure of = 120 bar at an engine speed of n = 3000 rpm. The lowest FMEP level with FMEP = 0.07 bar was found at an engine speed of n = 1000 rpm in motored operation at 90 C. The FMEP levels are decreasing significantly over the whole engine operation map when increasing the engine media supply temperature.
In
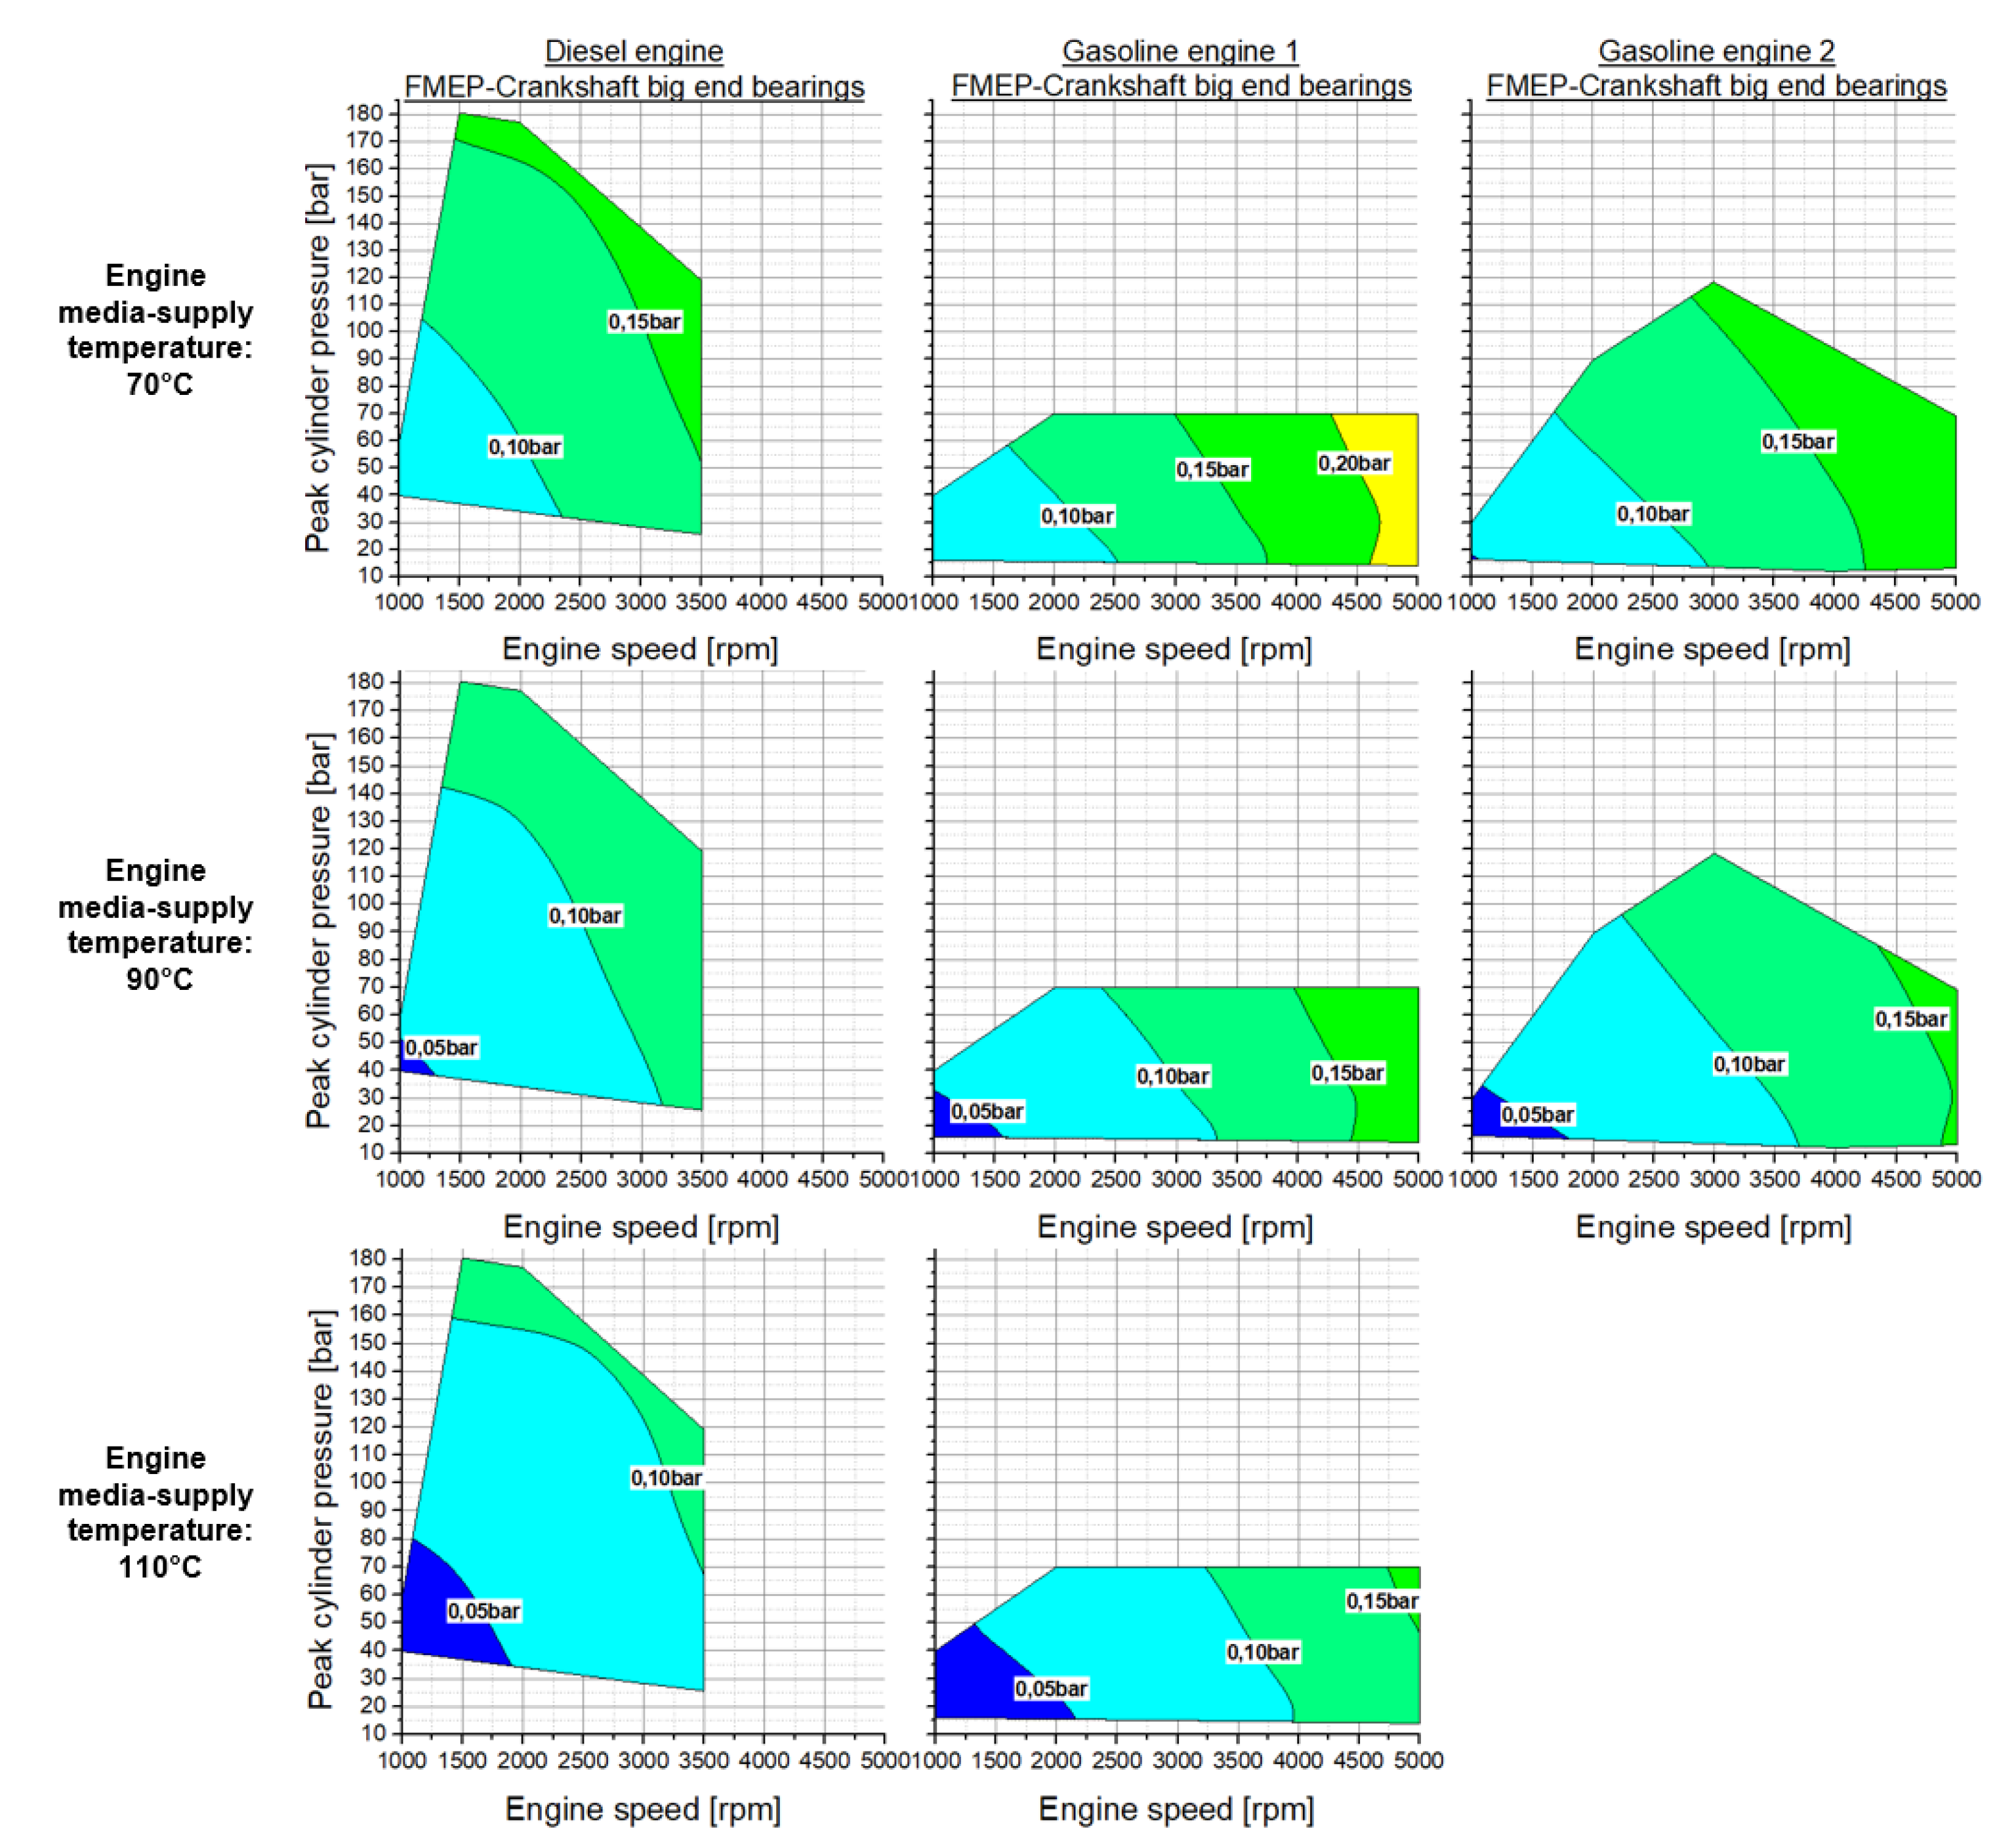
Figure 6 the summed big end bearing FMEP (four big end bearings) are presented at different engine media supply temperatures.
As expected, the FMEP results show a increase when increasing engine speed and load. Also a clear temperature trend was found when analysing the results at different engine media supply temperatures.
Diesel engine:
For the diesel engine the FMEP values of the four big end bearings are showing an increase over engine speed and engine load. In addition a clear temperature dependency and trend is found. The highest FMEP level with FMEP = 0.17 bar was found at the lowest engine media supply temperature of 70 C at the highest investigated engine speed of n = 3500 rpm and a peak cylinder pressure of = 120 bar. The lowest FMEP level on the other hand with FMEP = 0.03 bar was found at an engine speed of n = 1000 rpm in motored operation at 110 C. The FMEP levels are decreasing significantly over the whole engine operation map when increasing the engine media supply temperature.
Gasoline engine 1:
The big end bearing friction losses of gasoline engine 1 showed an increase over engine speed and engine load as well as a clear trend when increasing the engine media supply temperature resulting in reduced lubricant viscosity. The highest FMEP level with FMEP = 0.23 bar was found at the lowest engine media supply temperature of 70 C at an engine speed of n = 5000 rpm and a cylinder pressure of = 70 bar. The lowest FMEP level on the other hand with FMEP = 0.03 bar was found at an engine speed of n = 1000 rpm in motored operation at 110 C. It was found that the FMEP levels are decreasing significantly over the whole engine operation map when increasing the engine media supply temperature.
Gasoline engine 2:
For gasoline engine 2 the FMEP-values of the main bearings are showing a clear dependency on engine load, engine speed and engine media supply temperature. The highest FMEP level with FMEP = 0.20 bar was found at the lowest engine media supply temperature of 70 C at a peak cylinder pressure of = 70 bar at an engine speed of n = 5000 rpm. The lowest FMEP level with FMEP = 0.04 bar was found at an engine speed of n = 1000 rpm in motored operation at 90 C. The FMEP levels are decreasing significantly over the whole engine operation map when increasing the engine media supply temperature.
Summarizing the results of the crankshaft journal bearing friction losses, it was found that the friction losses are significantly decreasing when increasing the lubricant supply temperature. While the main bearing friction losses are influenced in a greater matter by the engine peak cylinder pressure, the big end bearings showed a increased dependency on engine speed, compared to the main bearings. In addition it can be stated, that the simulation results of the journal bearing friction losses are confirming predominantly hydrodynamic lubrication regimes at all three engines.
3.3. Valve Train Friction Losses
The valve train friction losses of the individual engines are investigated for the identical engine speeds for three different engine media supply temperatures ranging from 70
C to 110
C. It is important to note that the investigations of the valve train friction losses are carried out in motored operation and are assumed to be not sensitive to engine load. In previous research projects extensive investigations have been conducted using torque measurement systems applied at camshafts to measure the valve train drag torque under load operation at different thermal and load boundary conditions. Based on the results of this study which revealed insignificant influence of the engine load on the valve train friction losses, the friction losses in this work are soley obtained in motored operation. From literature it can be further found, that the same assumptions are used [
27] and that regarding the friction losses highly loaded engine concepts are mostly affecting the crank train system. The valve train loads are insignificantly affected by the high loaded engine operation, apart from thermal loads [
20].
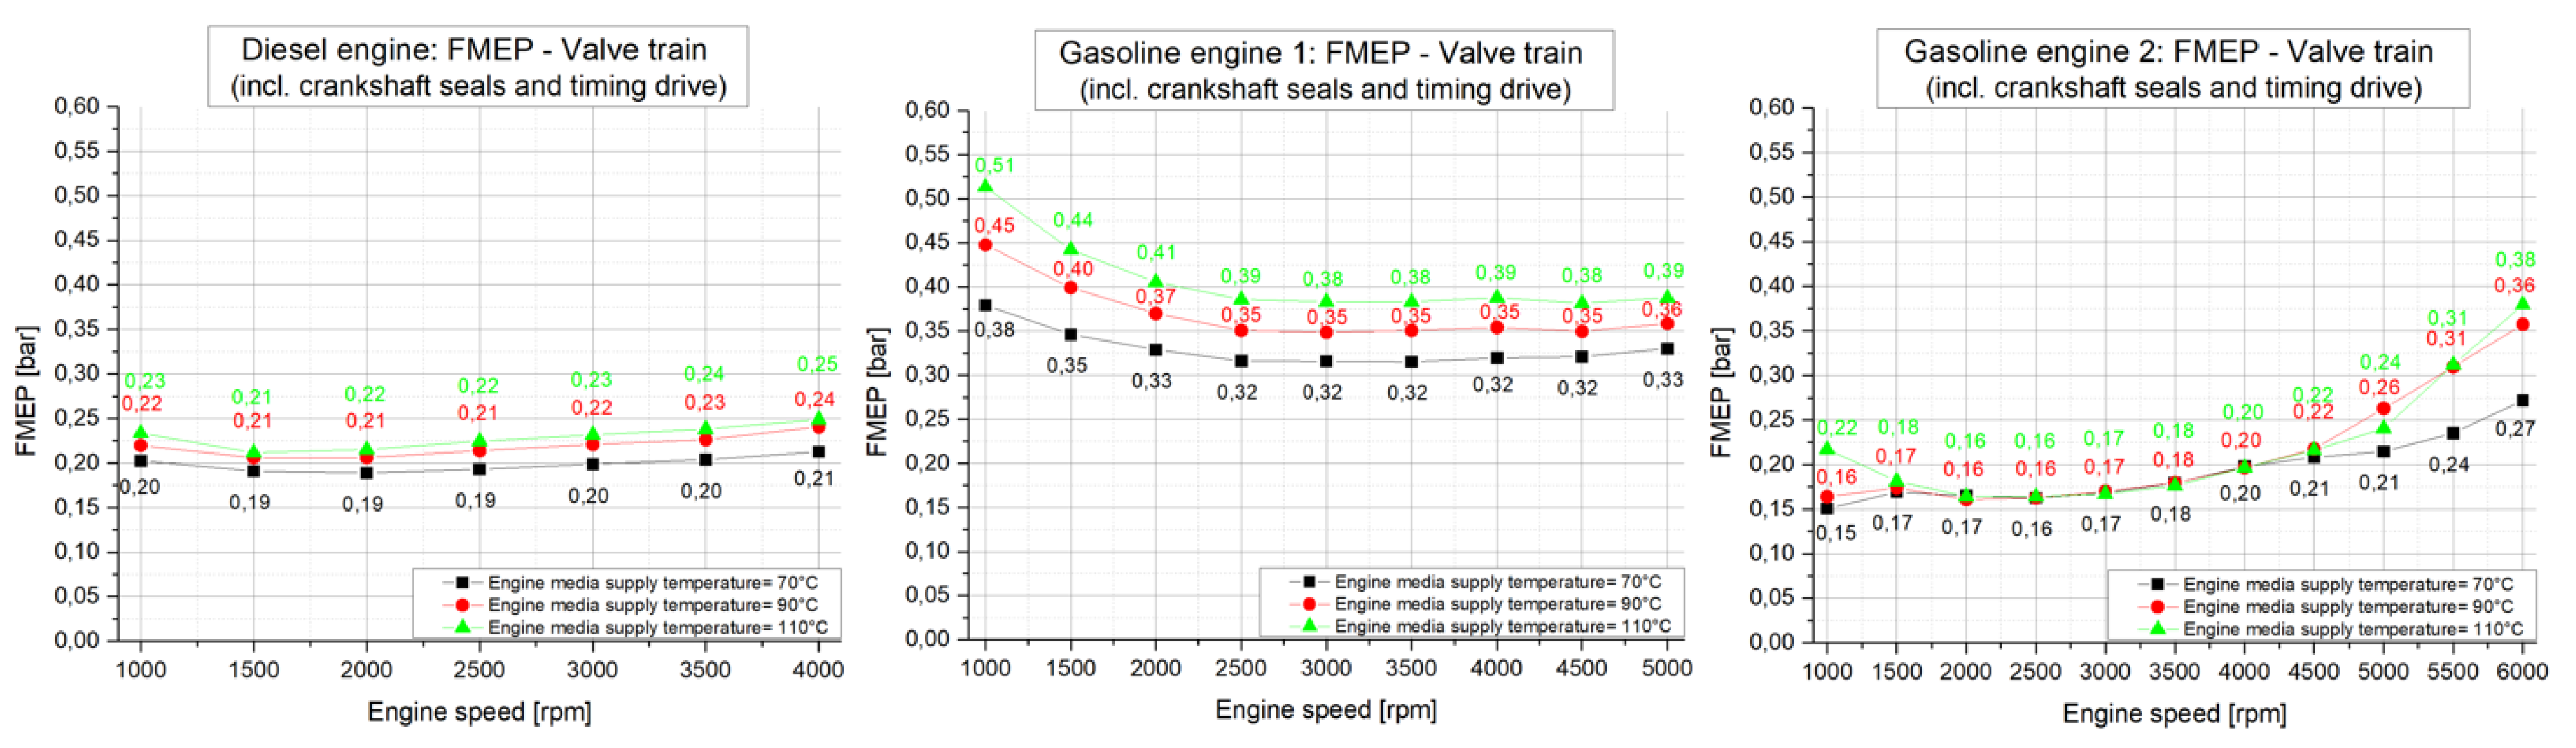
The resulting FMEP values for the individual engines are plotted in
Figure 7. It is important to note that the resulting FMEP of the individual valve train systems are including the timing drive and crankshaft seals friction losses.
Diesel engine: The results of the diesel engine valve train are almost constant over engine speed. Nevertheless, an interesting trend is observed. The highest FMEP level of FMEP = 0.25 bar is resulting at an engine speed of n = 4000 rpm at an engine media supply temperature of 110 C. On the other hand, the lowest FMEP level with FMEP = 0.19 bar is resulting at an engine speed of n = 2000 rpm at an engine media supply temperature of 70 C. The results show a slight temperature dependence with increased FMEP levels when increasing the engine media supply temperature indicating beginning mixed lubrication in the sub-assembly system.
Gasoline engine 1: At gasoline engine 1 the results of the valve train friction losses are significantly different in comparison to the other two engines. The reason for the different behaviour is the different valve train design type of gasoline engine 1 which is realised as flat-base tappet valve actuation system. In addition, the valve train assembly is equipped with 5 valves per cylinder in comparison to 4 valves per cylinder at the other two engines. The valve train friction losses at gasoline engine 1 show a significant temperature dependence in the range of FMEP = 0.13 bar at n = 1000 rpm and FMEP = 0.06 bar at n = 5000 rpm between a lubricant supply temperature of 70 C and 110 C. Especially at engine speeds below n= 2500 rpm the FMEP levels are increased for all engine media supply temperatures investigated.
The highest FMEP level is found at the lowest engine speed and the highest engine media supply temperature of 110 C with FMEP = 0.51 bar. This behaviour can be explained by the appearance of increased mixed lubrication in the lubricated contact between the camshaft and the flat tappet. The mixed lubrication regimes are further increased at high engine media supply temperatures due to further reduced lubricant viscosity at the lubricated contacts. In comparison to today’s modern roller-type cam follower actuation sytems, the FMEP of the flat-base tappet system is increased by more than factor 2.3 at 1000 rpm and high engine media supply temperatures. The lowest FMEP level with FMEP = 0.32 bar results at an engine media supply temperature of 70 C at engine speeds higher n = 2500 rpm as stable plateau. It is interesting to note that the valve train system of gasoline engine 1 shows this FMEP plateau behaviour also at the higher engine media supply temperatures at engine speeds higher n = 2500 rpm with FMEP = 0.35 bar at 90 C and FMEP = 0.38 bar at 110 C.
Gasoline engine 2: The resulting valve train FMEP levels of gasoline engine 2 show similar behaviour in comparison to the diesel engine up to an engine speed of n = 5000 rpm. Though the FMEP level is slightly decreased compared to the diesel engine with FMEP = 0.15 bar, FMEP = 0.16 bar and FMEP = 0.22 bar at n = 1000 rpm and engine media supply temperatures of 70 C, 90 C and 110 C respectively. It is interesting to note that for n = 1000 rpm the FMEP level of the valve train is increasing with increasing engine media supply temperature indicating mixed lubrication. For engine speeds above 1500 rpm and below 4500 rpm the FMEP level of the valve train is almost identical for the different engine media supply temperatures. Above n = 4500 rpm the FMEP is increasing for the higher engine media supply temperatures with values up to FMEP = 0.38 bar at an engine speed of n = 6000 rpm and an engine media supply temperature of 110 C.
4. Sub-Assembly Friction Loss Comparison between the Three Engine Concepts
The friction loss comparisons have been conducted under motored and load operation for all comparable engine speeds, according to the presented base engine measurement programs in
Figure 3. In the following the conducted comparisons between the individual engines on the sub-assembly level are presented and analysed.
4.1. Friction Loss Comparison Gasoline Engines
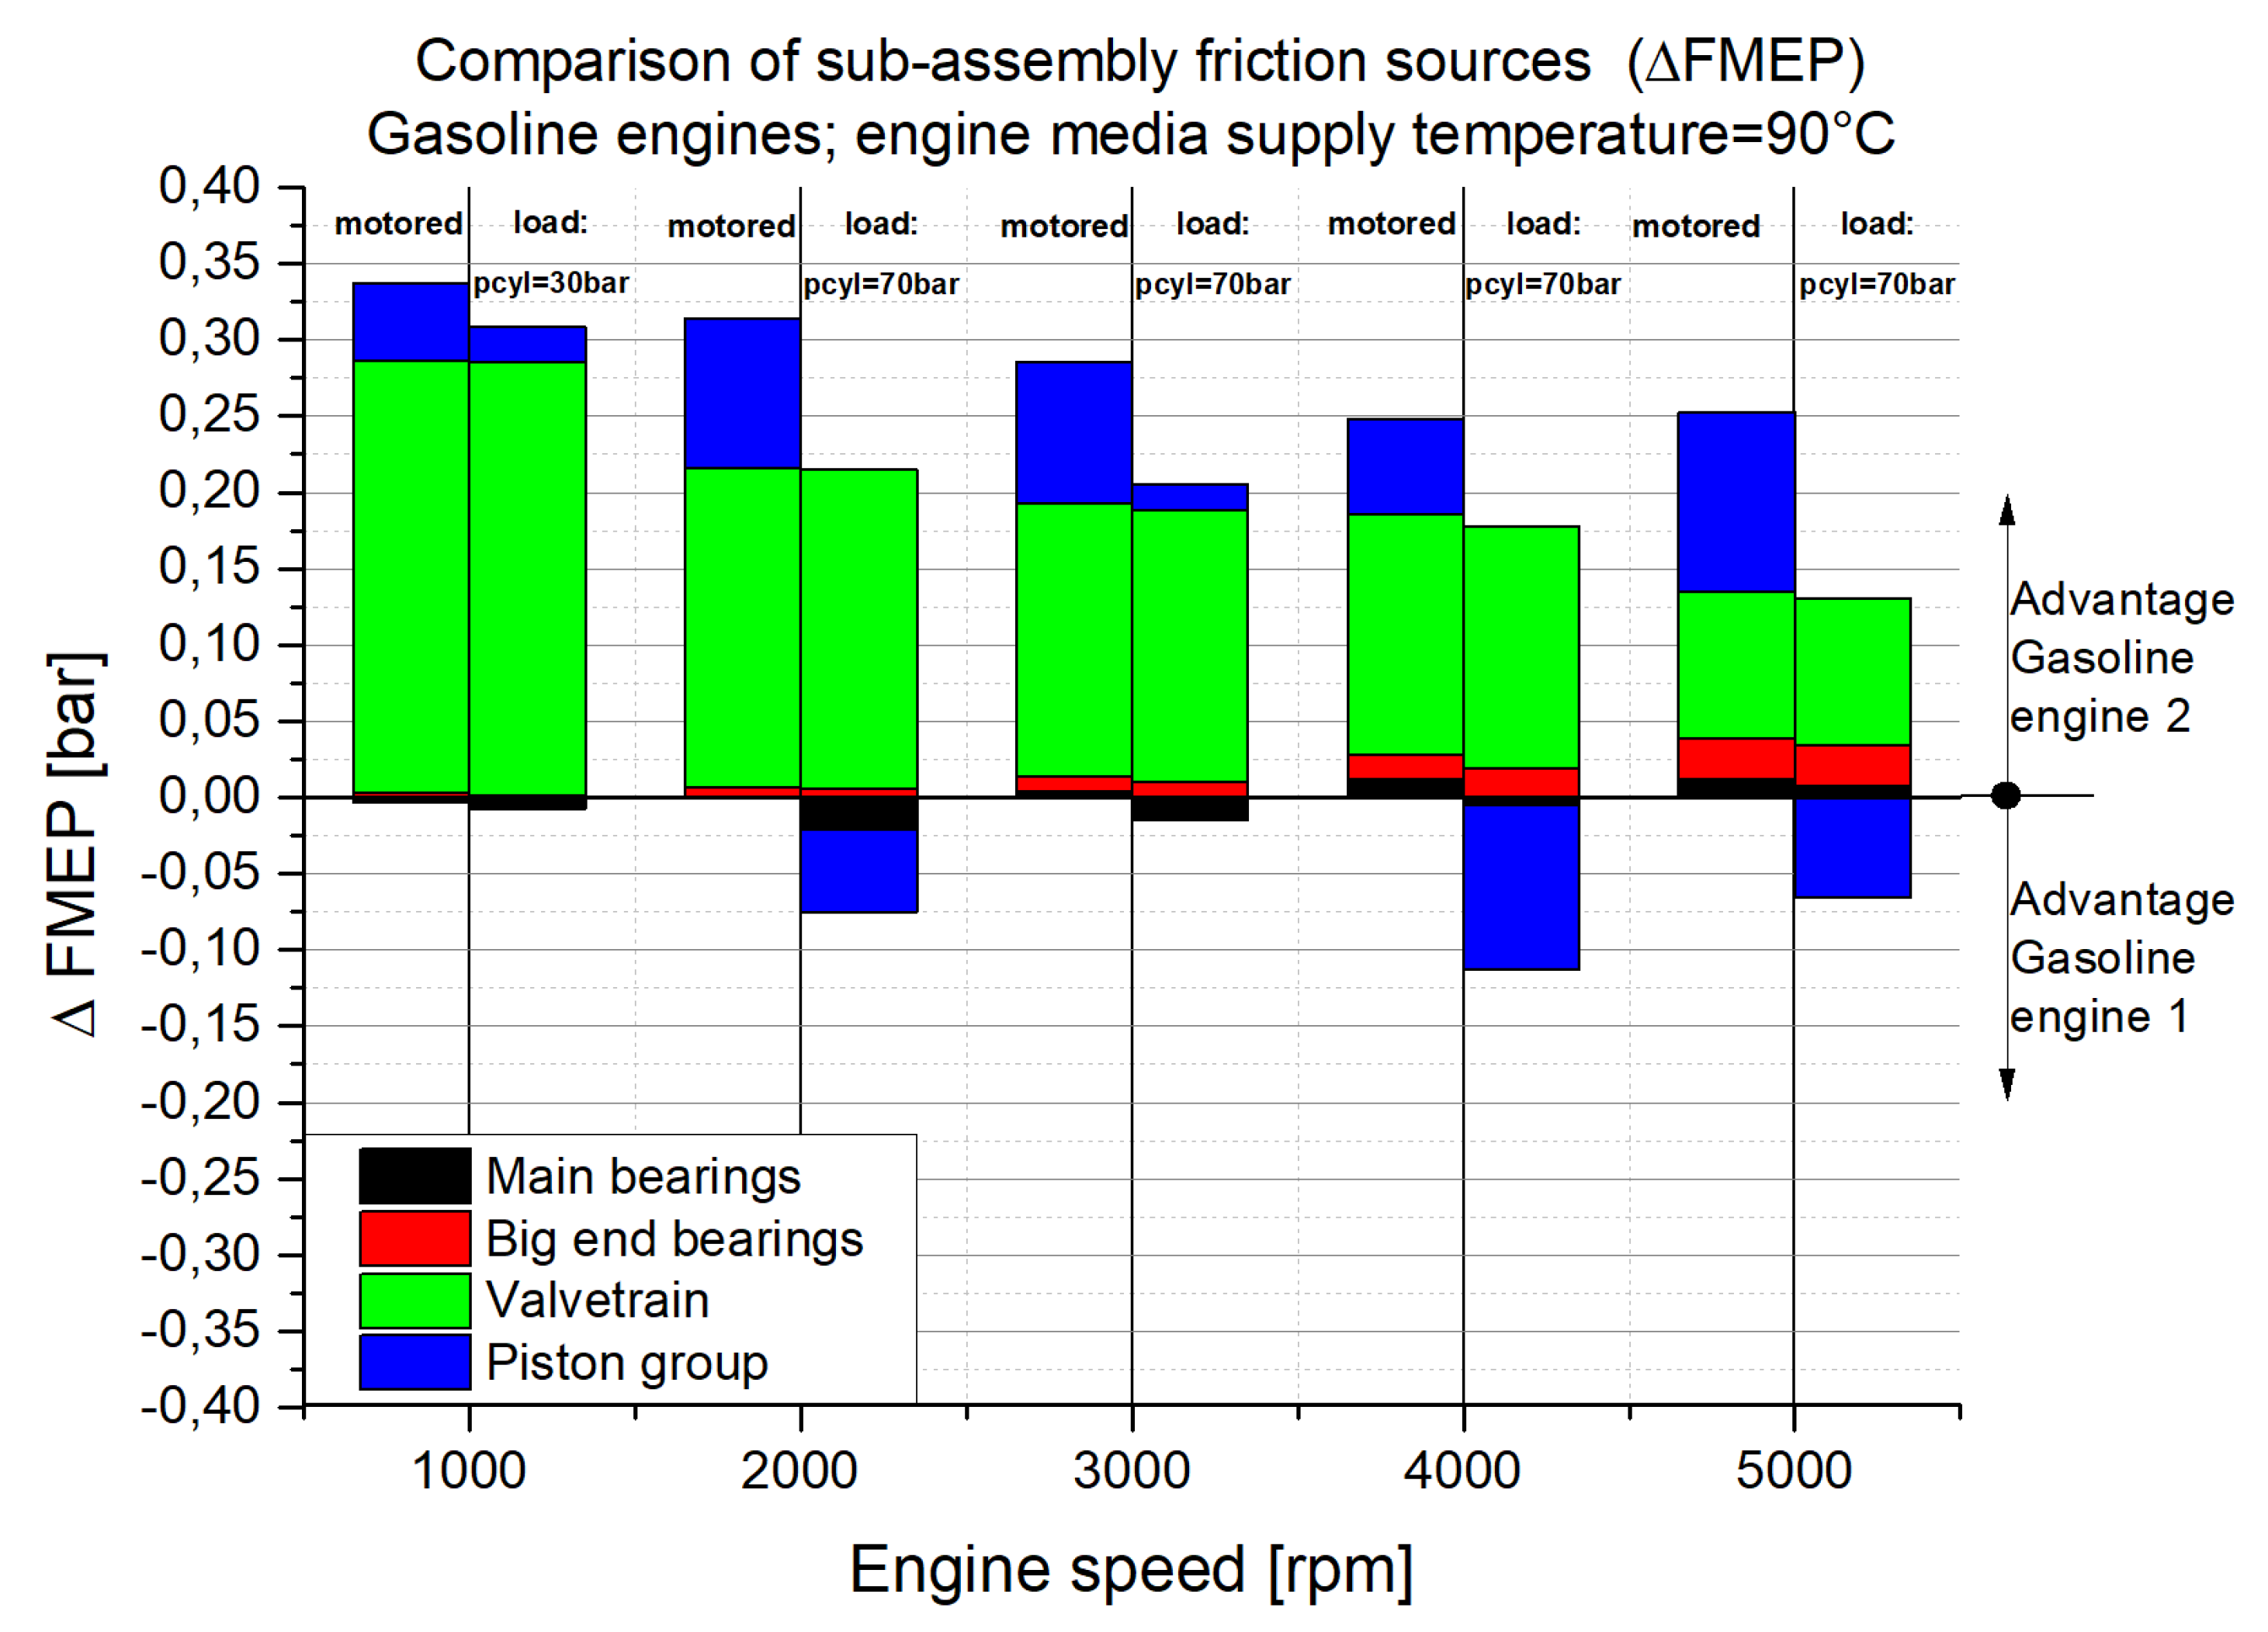
The comparison of the gasoline engines enables the comparison of a conventional engine concept and high-power downsizing engine concept. The results are presented in
Figure 8 for an engine media supply temperature of 90
C. The considered engine speeds are ranging from n = 1000 rpm up to n = 5000 rpm. The maximum peak cylinder pressure is limited by gasoline engine 1 with
= 70 bar which is applied for engine speeds of 2000 rpm and higher. For engine speeds below n = 2000 rpm the peak cylinder pressure is limited to
= 30 bar.
In
Figure 8 the engine operation points are applied for the individual engine speeds. At each engine speed, two different load points are indicated. The motored operation condition is shown on the left side, the load operation condition on the right side.
When analysing the gasoline engines, a major difference in the valve train friction losses is noticeable. Especially at low engine speeds, the FMEP difference is highest with FMEP = 0.28 bar. When the engine speed is increasing, the FMEP difference decreases to FMEP = 0.10 bar at an engine speed of n = 5000 rpm. The reason for the big difference is arising from the different valve train design. For gasoline engine 1 the valve actuation is designed as flat-based tappet, which especially at low engine speeds results in significant disadvantages compared to the roller type cam follower system used in gasoline engine 2. The friction comparison for the crankshaft journal bearings shows small differences for the investigated engine operation points. The main bearing friction losses are ranging below FMEP = 0.02 bar. The biggest difference in the FMEP levels for the big end bearings is FMEP = 0.03 bar at an engine speed of n = 5000 rpm. The friction loss comparison of the piston group clearly shows that detailed friction investigations under load conditions are essential for a holistic analysis of the friction behaviour of the engines. While the piston group of gasoline engine 2 shows advantages of up to FMEP = 0.12 bar under motoring engine operation, the situation under load conditions ( = 70 bar) is different. Under load operation up to a engine speed of n = 3000 rpm the FMEP differences for the piston groups are low with FMEPmax = 0.05 bar at n = 2000 rpm. For engine speeds of n = 4000 rpm and 5000 rpm and peak cylinder pressures of 70 bar the piston group of gasoline engine 1 shows advantages of FMEP = 0.11 bar and FMEP = 0.07 bar, respectively.
4.2. Friction Loss Comparison Gasoline Engine 1 and Diesel Engine
The comparison between gasoline engine 1 and the diesel engine which are designed as conventional concepts, enables on one hand the friction loss comparison between a gasoline and a diesel concept. On the second hand, the comparison between engine concepts with the same specific power output is realized.
Figure 9 shows the sub-assembly-resolved friction loss comparison between the two engines at different engine operation points. The investigated engine speeds are ranging from n = 1000 rpm to n = 3500 rpm. The maximum peak cylinder pressure is limited by gasoline engine 1 with
= 70 bar which is applied from engine speeds n = 2000 rpm onwards. At the lower engine speeds, the peak cylinder pressure was limited to
= 40 bar. It is interesting to note that for gasoline engine 1, a peak cylinder pressure of
= 40 bar already represents a high part load operation point. In contrast,
= 40 bar represents the resulting peak cylinder pressure at the motored operating point at an engine speed of n = 1500 rpm for the diesel engine.
When comparing the two engines, the largest friction loss difference arises at the valve train assembly. The diesel engine, equipped with a roller type cam follower system, shows significant advantages in comparison to the flat-tappet based valve actuation system of gasoline engine 1. The determined FMEP difference at an engine speed of n = 1500 rpm is FMEP = 0.19 bar but decreases when increasing engine speed. At n = 3500 rpm the FMEP difference results in FMEP = 0.12 bar. For the crankshaft main and big end journal bearings small differences are observed over the entire investigated engine speed and load range. The largest FMEP difference is assigned to the main bearings with FMEP = 0.02 bar. The piston group of the diesel engine shows advantages compared to gasoline engine 1 for engine speeds up to n = 3000 rpm. While the FMEP difference at low load is FMEP = 0.09 bar, the FMEP advantage for the diesel engine is slightly increased under high load operation ( = 70 bar) with FMEP = 0.12 bar. When analysing the friction losses of the piston group at an engine speed of n = 3500 rpm, gasoline engine 1 shows slight advantages (FMEP = 0.04 bar) compared to the diesel engine.
4.3. Friction Loss Comparison Gasoline Engine 2 and Diesel Engine
The friction loss comparison between gasoline engine 2 and the diesel engine enables primary the general comparison between a gasoline and a diesel concept. But especially it is possible to conduct comparisons between a gasoline engine with doubled specific power output compared to the diesel engine. Both engines are operated with significantly increased peak cylinder pressures (gasoline engine 2:
= 120 bar; diesel engine:
= 180 bar) compared to gasoline engine 1 (
= 70 bar). The following
Figure 10 shows the sub-assembly-resolved friction loss comparison at different engine operation points.
The friction comparison has been performed at engine speeds of n = 2000 rpm and n = 3000 rpm. The peak cylinder pressure was limited by gasoline engine 2 with
= 120 bar. At an engine speed of n = 2000 rpm the peak cylinder pressure was limited to
= 90 bar. The comparison of the valve train friction losses shows small differences between the two engines because of the similar design of the valve train actuation system which is configured as roller-type cam follower system at both engines. Anyway, gasoline engine 2 shows minor advantages with
FMEP = 0.05 bar for the engine speeds shown in
Figure 10. The crankshaft main bearings of the diesel engine shows slight advantages with a maximum difference of
FMEP = 0.05 bar over the engine operation points investigated. For the crankshaft big end bearings the FMEP differences are very small with
FMEP < 0.01 bar.
The major variation in the friction loss comparison results at the piston group sub-assembly system. At low load conditions ( = 50 bar), gasoline engine 2 shows advantages with FMEP = 0.04 bar at an engine speed of n = 2000 rpm and FMEP = 0.06 bar at n = 3000 rpm. With increasing engine load and subsequently increasing gas-force effects, the piston group of gasoline engine 2, shows significant disadvantages compared to the diesel engine. At an engine speed of n = 2000 rpm the friction loss comparison of the piston group at a peak cylinder pressure of = 70 bar shows a FMEP advantage for the diesel engine of FMEP = 0.17 bar, at = 90 bar of FMEP = 0.26 bar. It is interesting to note that at an engine speed of n = 3000 rpm and a peak cylinder pressure of = 70 bar, the piston group friction losses are almost identical. Nevertheless, if the peak cylinder pressure is increased to = 120 bar, significant disadvantages of the piston group of gasoline engine 2 have been analysed. At this high load engine operation point the piston group of the diesel engine shows advantages of FMEP = 0.5 bar. The results are proving a better suitability of the diesel engine for engine operation under the effect of high gas force action.
4.4. Summary
Summarizing the presented investigations, it can be said that the main FMEP differences between the three investigated engine concepts arise mainly from the piston group and valve train systems. While the diesel engine piston group shows a very good performance in terms of generated friction losses under high load operation the gasoline engine 2 shows increased FMEP levels. It can be found in the literature [
13], that the piston group of the diesel engine has been extensively friction loss optimized by increasing the piston clearance while lowering the piston pin offset. In addition shorter ring heights in combination with lower tangential forces of the piston rings and a friction reducing piston skirt coating is used to optimize the system. At low speed and low load operation the piston group friction losses of gasoline engine 2 is advantageous. Concerning the valve train friction losses, gasoline engine 2 shows the best performance. The main difference in the valve train friction losses between gasoline engine 1 and the other two engines arise from the different valve actuation design in addition with the increased number of five valves per cylinder.
5. Overview Base Engine Friction Losses and Discussion
It is further very interesting to observe the base engine total friction losses of the individual engine concepts. The base engine friction results are obtained at engine media supply temperatures ranging from 70
C to 110
C covering all engine operation points presented in
Figure 3. The FMEP-maps for the three engine concepts are presented in
Figure 11 and show large differences in the FMEP-levels of the base engines. Generally, the FMEP-levels of the engines decrease with increasing engine media supply temperature. The highest FMEP-levels subsequently result at the lowest investigated engine media supply temperature of 70
C with a maximum FMEP-level of FMEP = 0.96 bar for the diesel-engine, FMEP = 1.18 bar for the gasoline engine 1 and FMEP = 1.40 bar for the gasoline engine 2. It is interesting to note that the highest FMEP-levels result at different engine operation conditions. While for the diesel engine and gasoline engine 2 the highest FMEP-level results at high load conditions, gasoline engine 1 shows a different behaviour. For gasoline engine 1 the highest FMEP results at motored conditions at the highest investigated engine speed of n = 5000 rpm.
The holistic consideration of the friction losses solely by measurements at the base engine level, implies possible distortion in the interpretation of the results by the lack of details. This can be clearly explained, by analysing the FMEP-maps results of the three base engines investigated in this work.
Conventionally, the usage of a combined approach in the automotive industry development processes to analyze and determine the friction losses of the base engine sub-assemblies and their tribological performance is not known to the author. Despite far-reaching developments of simulation methods, appropriate rig and engine test programs are used (based mainly on empirical knowledge and extensive experience) to ensure the prescribed limits in terms of wear and fatigue [
28]. This is done because simulation models for predictive wear calculations without a number of iterations are not available at the moment in practice which can guaranty sufficient accuracy compared to measurements. For inital engine design and layout stages, helpful design tools have been developed for friction modelling based on analytical and empirical component models to support the engineers e.g., in [
9,
10,
29,
30].
Without detailed informations regarding the increased friction losses of the valve train at gasoline engine 1 due to its different design one may come to the result, that the whole base engine shows disadvantageous friction performance. But when disregarding the valve train friction losses, the other sub-assemblies namely piston group and crankshaft journal bearings are showing a good performance and partly better results in comparison to the other engine concepts.
With the knowledge of the sub-assembly-resolved friction loss investigations presented in this work, one is able to assign the arising potentials and risks to the individual sub-assembly systems. This enables prioritized and more specific development activities when using the capabilities of both, accurate friction measurements and predictive simulation methodologies.
6. Conclusions
The friction losses of three different in-line four-cylinder, four-stroke, turbo charged engine concepts for passenger car applications have been investigated. The engines put to test have been specifically chosen, to enable comparisons not only between the different engine concepts of diesel and gasoline engines but also with focus on their specific power output focusing on modern high-power downsizing engine concepts available in series production. For that purposes one diesel engine and one gasoline engine has been selected with almost similar power density, to conduct investigations regarding the base engine friction performance for diesel and gasoline engines. In addition a gasoline engine with doubled power density compared to the conventional engine concepts has been chosen for investigations on a gasoline concept working under high loaded engine operation. All investigations conducted in this work have been carried out using the same modern SAE 5W30 lubricant to exclude arising influences from different lubricant properties which may have significant effects on the engines sub-assemblies.
The friction losses have been determined using a recently developed combined analysis approach. By applying the combined approach it was possible to analyse and conduct comparisons on the base engine sub-assemblies crankshaft journal bearings (main and big end bearings), valve train (incl. timing drive and crankshaft seals) and piston group. The friction loss analysis and comparisons have been conducted not only for different engine operation points ranging from motored to high load operation but also at different thermal boundary conditions. This has been realized by supplying the engine media (cooling water and lubricant) from precisely controllable external supply units. The applied supply temperature levels have been ranging from 70 C up to 110 C.
The base engine measurement programs covered 120, 144 and 46 different measurement points for the diesel engine, gasoline engine 1 and gasoline engine 2 (high-power engine), respectively. For the calculation of the crankshaft journal bearing friction losses, simulation models of the three engine crank trains have been set up. The calculations have been carried out directly connected to the measurement programs of the base engines. By combination of measurement and journal bearing calculation results, the valve train friction losses for the individual engines have been obtained. Furthermore, the piston group friction losses have been calculated by subtraction of the valve train friction losses and crankshaft journal bearing friction losses from the base engine measurement results.
It was found that investigations under load conditions are necessary for a comprehensive analysis of the entire base engine friction losses. The high-power downsizing gasoline engine concept showed the best friction performance in motored and low load operation mainly driven by a good performance of the valve train and piston group system. In contrast, the diesel engine showed the best friction loss performance at highly loaded engine operation due to its friction optimized piston group system. The most significant result during the comparison of the piston group friction losses was investigated at high load operation. Here gasoline engine 2 revealed increased FMEP levels for engine speeds higher n = 1500 rpm and peak cylinder pressures above = 70 bar and FMEP differences of up to FMEP = 0.5 bar in comparison to the diesel engine could be determined. The crankshaft journal bearings showed only small differences when comparing the base engines. This can be explained by the comparable geometry of the bearings. One of the most significant result of the conducted work can be assigned to the design of the valve train system. In particular the valve actuation system, has significant influence on the engine friction performance. Here the progress in the development of valve train systems away from flat-tapped based valve actuation systems which is used in gasoline engine 1 to roller finger follower systems with increased mechanical efficiency used in the other two engines has been investigated. When disregarding the disadvantageous valve train friction losses at gasoline engine 1, the other sub-assemblies namely piston group and crankshaft journal bearings are showing a good performance and partly better results in comparison to the other engine concepts.
Future work could address the analysis of friction reduction potentials and possible risks due to mixed lubrication on the base engine sub-assembly level. Furthermore future work could address the development of detailed simulation models for the piston group and valve train system. This could enable advanced investigations of the tribological performance down to the component level of the base engines.


