Fretting Behavior of Thermoplastic Polyurethanes
by
 , , , and
Chao Wang
1 ,
,
Andreas Hausberger
1,*,
Michael Berer
1,
Gerald Pinter
2,
Florian Grün
3 and
Thomas Schwarz
4 1
Polymer Competence Center Leoben GmbH, 8700 Leoben, Austria
2
Materials Science and Testing of Polymers, Montanuniversität Leoben, 8700 Leoben, Austria
3
Mechanical Engineering, Montanuniversität Leoben, 8700 Leoben, Austria
4
SKF Sealing Solutions Austria GmbH, 8750 Judenburg, Austria
*
Author to whom correspondence should be addressed.
Lubricants 2019, 7(9), 73; https://doi.org/10.3390/lubricants7090073
Submission received: 12 July 2019
/
Revised: 13 August 2019
/
Accepted: 15 August 2019
/
Published: 23 August 2019
(This article belongs to the Special Issue Adhesion, Friction and Lubrication of Viscoelastic Materials)
Abstract
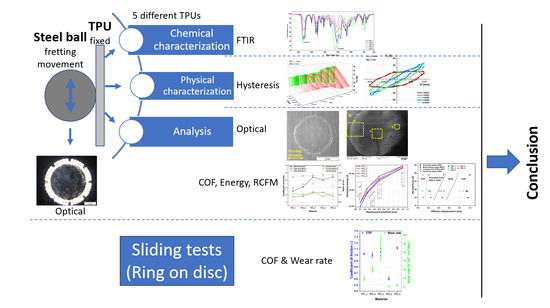
:Fretting tests were conducted with five different thermoplastic polyurethanes against a steel ball. Their fretting behaviors were investigated under various test parameters, such as normal load and displacement amplitude. In order to test the sliding performances, tribological tests were conducted using a ring-on-disc setup. The results show that their fretting behaviors can be related to the dynamic mechanical properties, which were characterized by dynamic mechanical analysis (DMA). The three fretting regimes were identified by means of hysteresis and wear scar analysis. In addition, investigations were carried out until the transition regimes occurred. Different wear processes were revealed for each of the three regimes. Differences were identified using dissipated energy. The profiles of wear scars and the counterparts were analyzed using a microscope. The coefficient of friction was calculated separately for the partial slip and gross slip regimes. In the mixed fretting regime, the coefficient of friction is almost at the same level among the five materials. In the partial slip regime, however, it can be distinguished. Temperature measurements were conducted on the counterparts during the tests. Overall, the material that showed the best tribological properties also performed the best in the fretting tests.
1. Introduction
Thermoplastic polyurethane elastomers (TPUs) are multiblock copolymers with hard and soft segments. Due to their unique structure, they have high tensile strength and the ability to be processed with thermoplastic methods. These unique properties make TPUs useful in a great variety of applications. TPUs can be applied as a substitution for vulcanized rubber, for example [1]. Due to their excellent mechanical properties, seals made of TPU can maintain an effective dynamic sealing geometry at high pressure for extended periods [2]. The physical and tribological properties of TPUs have been extensively investigated by several researchers. Anisimov investigated the influence of chemical structure on the mechanical and abrasive properties of TPUs [3]. It was found that the hard segment is the determining structure for their properties. The mechanical properties of TPUs have been investigated in various aspects. Qi researched the stress–strain behavior of TPUs and a constitutive model was introduced, which can reflect their nonlinear, time-dependent, and softening behaviors [4]. Sui [5] provided one clarification for the physical deformation mechanisms of TPUs using in situ observation of the morphological changes during deformation and the finite element method. Da Silva discovered the delamination wear on TPUs [6]. Hausberger [7] studied the adhesive and deformation contribution to the friction and wear behaviors of TPUs. Elleuch [8] studied the tribological property of TPUs in sliding contact with indentation and friction tests. Martinez [9] characterized the wear property of TPUs by means of sliding reciprocating tests using a long stroke tribometer. The effects of contact pressure and temperature alteration on tribological properties has been analyzed. Yahiaoui [10] found that the friction and wear of TPU–steel hybrids follow Coulomb and Archard’s laws at room temperature, respectively. The dominant wear mechanisms are abrasive and adhesive wear.
For seals in dynamic applications, fretting is one of the most common types of failures [11]. Numerous studies have been conducted on the fretting behaviors of metals. The fretting behavior, fatigue properties, and damage mechanisms of thermoplastic elastomer-to-metal were discussed in our previous work [12,13]. However, the impact of material properties on their fretting behaviors is still not understood well. Besides, excellent sliding performance is one of the key characteristics that dynamic seals should have. Unanswered questions remain regarding whether a material which has an outstanding sliding performance also shows excellent resistance to fretting, and how these factors associate with each other.
In this research, five different TPUs were investigated with respect to their fretting behaviors. The test method was reported in previous work [12]. The differences among the five materials are discussed regarding various aspects. This study aims to reveal the correlation between the material properties of TPUs and their fretting behaviors. In addition, the sliding performance of each TPU was correlated with their fretting behaviors.
2. Experimental Details
2.1. Test Material
The TPU specimens were produced by injection molding at SKF Sealing Solutions Austria GmbH (Judenburg, Austria). Before the test, they were cut into 36 × 22 mm plates with a thickness of 6.2 mm. The hardness was measured using the Shore-D method according to DIN ISO 7619-1 and the dynamic mechanical properties were analyzed by means of dynamic mechanical analysis (DMA) with the temperature scan method at 25 °C (EPLEXOR 100 N, NETZSCH GABO Instruments, Ahlden, Germany). The DMA tests were conducted with tension geometry. Concerning the thermal influence of the samples, thermal conductivity was measured with a guarded heat flow meter (DTC 300, TA Instruments, New Castle, DE, USA) at 25 °C. The properties of the materials used are shown in Table 1. As counterparts, commercial stainless-steel balls (diameter = 15 mm, EN 1.4301, HRC 25–39, polished, unhardened, HSI-Solutions GmbH, Vienna, Austria) were employed. An optical microscope (Stereo Microscope SZX 12, Olympus, Tokyo, Japan) was used to analyze the wear scars of the counterparts.
The Fourier transformed infrared spectroscope (FTIR) was applied to characterize the chemical structures of the five used TPUs. As shown in Figure 1, all materials are similar polyester-based TPUs.
2.2. Fretting Test Setup and Procedures
Fretting tests were performed on a MTS 858 (MTS Systems Corporation, Eden Prairie, MN, USA) with an in-house design setup, which had been introduced in previous work [12]. Due to the small amplitudes and narrow space in the vicinity of the contact area, the specimen temperature in the contact area was challenging to measure. For that reason, an indirect method was applied in which the temperature of the counterpart was measured using an infrared sensor with a temperature resolution of 0.1 K (CTlaser LT, Optris GmbH, Berlin, Germany).
The applied parameters are listed in Table 2. In order to cover the three fretting regimes, namely partial slip, mixed fretting, and gross slip [14], the displacement amplitude ranges from 0.1 to 1.0 mm. Due to the high compliance of polymers, the displacement amplitudes for polymers are usually larger than for metals, which are approximately 10–50 µm [15]. Three normal loads and two frequencies were applied to investigate the dependency of the fretting behavior of TPUs on normal load and frequency. The total number of cycles was set to 8 × 10⁵ cycles. Some cycles were chosen based on three-dimensional fretting hysteresis, in which the form changed substantially, so that the alteration process of wear scars could be investigated and correlated to fretting hysteresis.
All of the experiments were performed at 23 ± 2 °C with a relative humidity of 50 ± 10%. The wear scars were characterized by a scanning electron microscope (SEM) (Tescan VEGA-II, Brno, Czech Republic). Quantifications of the wear scars were conducted with a three-dimensional micro coordinate microscope (Alicona InfiniteFocus, Raaba, Austria).
2.3. Ring-on-Disc Tests
To compare the sliding performance with fretting behavior, tests were conducted using a component-like (ring-on-disc) setup on a precision rotary tribometer (TE-93, Phoenix Tribology Ltd., Kingsclere, UK). The setup and specimen geometry were introduced in [16]. All tests were conducted at 150 mm/s under a normal load of 1 MPa for 4 h. Each test was repeated four times. Ring-shaped counterparts of 34CrNiMo6 were used, with a roughness of 0.03 µm. After the tests, the surfaces of the specimen and counterparts were analyzed with a light microscope.
3. Results and Discussion
For the ring-on-disc tests, the coefficient of friction (COF) and wear rate were compared and discussed. The worn surfaces were analyzed and correlated with the COF and wear rate.
The fretting hysteresis and Ft-D curves are shown and compared with each other. With the help of the micrographics of wear scars, it is possible to understand the hysteresis change during the tests. Based on the geometry of the wear scars, the coefficients of friction are calculated for the partial slip and mixed fretting regimes. For the gross slip regime, a select calculation is used, which also takes the geometry of the wear scars and construction of the test system into consideration [12]. As reported in [17], the surface in the contact area changed continuously during the tests. The calculation of the COF is only based on the worn surface after the last cycle. Hence, the calculated COF can only represent the COF value at the last cycle.
3.1. Ring-on-Disc Tests
The results are shown in Figure 2. Compared with the other four materials, TPU_4 shows the best tribological performance. Both COF and wear rate values are significantly lower than for the other materials. Its COF is 0.61, around 40% lower than others, which is over 1. More importantly, nearly no wear debris was identified with TPU_4. Its wear rate is only 0.4 cm3/Nm, making it 110-times lower than that of TPU_3. From the DMA results in Table 1, we can see that its low storage modulus and low loss factor indicate that TPU_4 is the softest and most elastic material among the five TPUs. Hence, its deformation contribution of friction is larger than in the other materials. As can be seen in [7], deformation contribution is the dominant contribution of friction for TPUs. In spite of this, TPU_4 shows the lowest COF and best wear resistance. It is worth mentioning that the COF shown here is the average COF throughout all of the tests. The wear debris, surface alteration, and temperature affect the COF significantly.
The difference in wear rate can also be identified from the wear scars. As shown in Figure 3, adhesive wear is the dominant wear mechanism for TPUs_1, 2, and 3. However, no noticeable wear can be identified on TPU_4. For TPU_5, its high COF leads to a higher temperature (over 100 °C) at the interface, which is about 70 °C for TPU_4. As a consequence, TPU_5 experienced a larger deformation, especially in the microtexture area on the surface.
3.2. Fretting Tests
3.2.1. Fretting Hysteresis and Wear Scar Analysis
The hysteresis and Ft-D curves are discussed. TPU_1 was discussed in our previous work [12], but in order to compare it with the other TPUs, its results are also shown here.
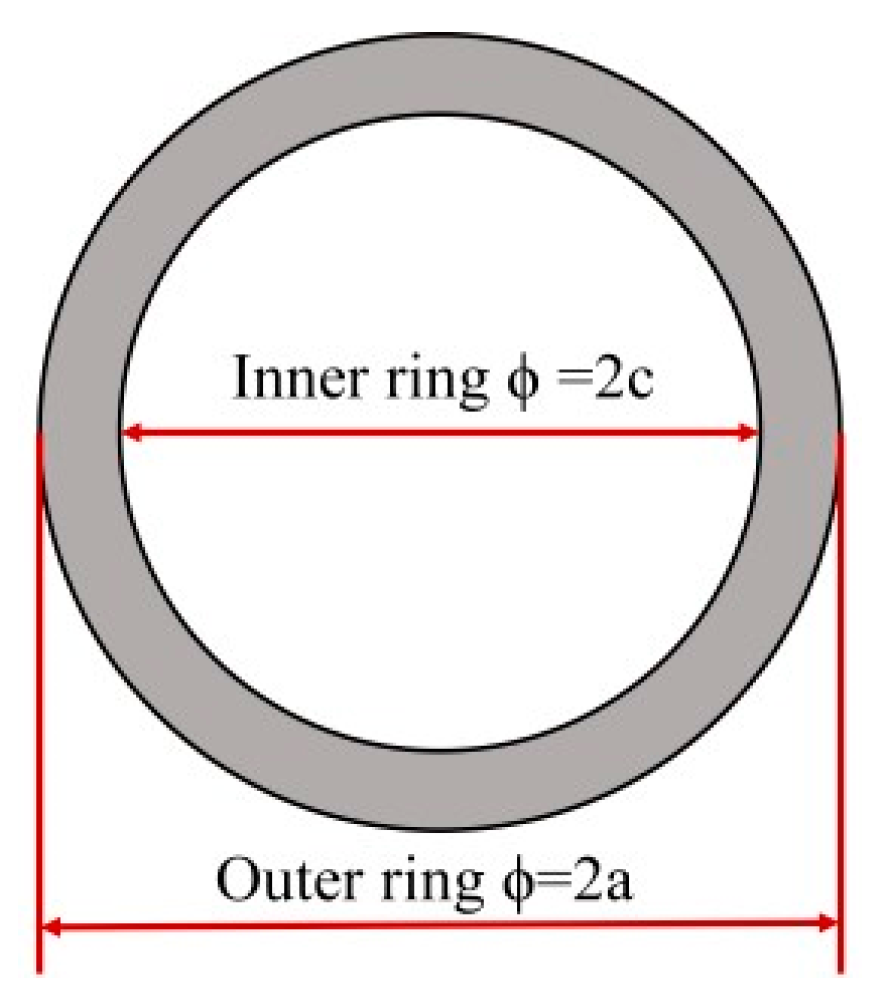
Each material was observed with a light microscope. Additionally, several samples representing the typical wear tracks were chosen to have a more accurate scar analysis using scanning electron microscopy (SEM). The diameters of the inner (2c) and outer rings (2a) were characterized with a three-dimensional, micro-coordinate microscope (Figure 4), and are shown here in the SEM micrographs. It should be noted that TPU_5 is transparent, so the marks we made on the back of the samples as distinctions can be seen in the micrographs.
Partial Slip Regime
Figure 5 shows the hysteresis and Ft-D curves of the five TPUs. In order to observe the change of the tangential force more clearly, the hystereses are projected on the cycle-tangential force plane (green) in Figure 5. In the partial slip regime after approximately 105 cycles, the hystereses of all five TPUs are very similar. For TPUs_2, 3, and 4, their hystereses are almost linear, whereas for TPU_1 and TPU_5, they were parallelogrammical in the first 103 cycles and then gradually changed to linear.
In the partial slip regime, ring-like wear scars were generated. As illustrated in Figure 6, all five TPUs show similar wear scars. The middle area is the stick region, while a micro slip occurs at the edge of the ring.
The damage scar of TPU_1 with 0.1 mm displacement amplitude was outlined in our previous work [12]. The damage began with the drop of small debris from the ring area. As the test ran further, debris was rolled into stripe-like particles. This can be attributed to the small amplitude, which is not large enough to separate the particles from the surface.
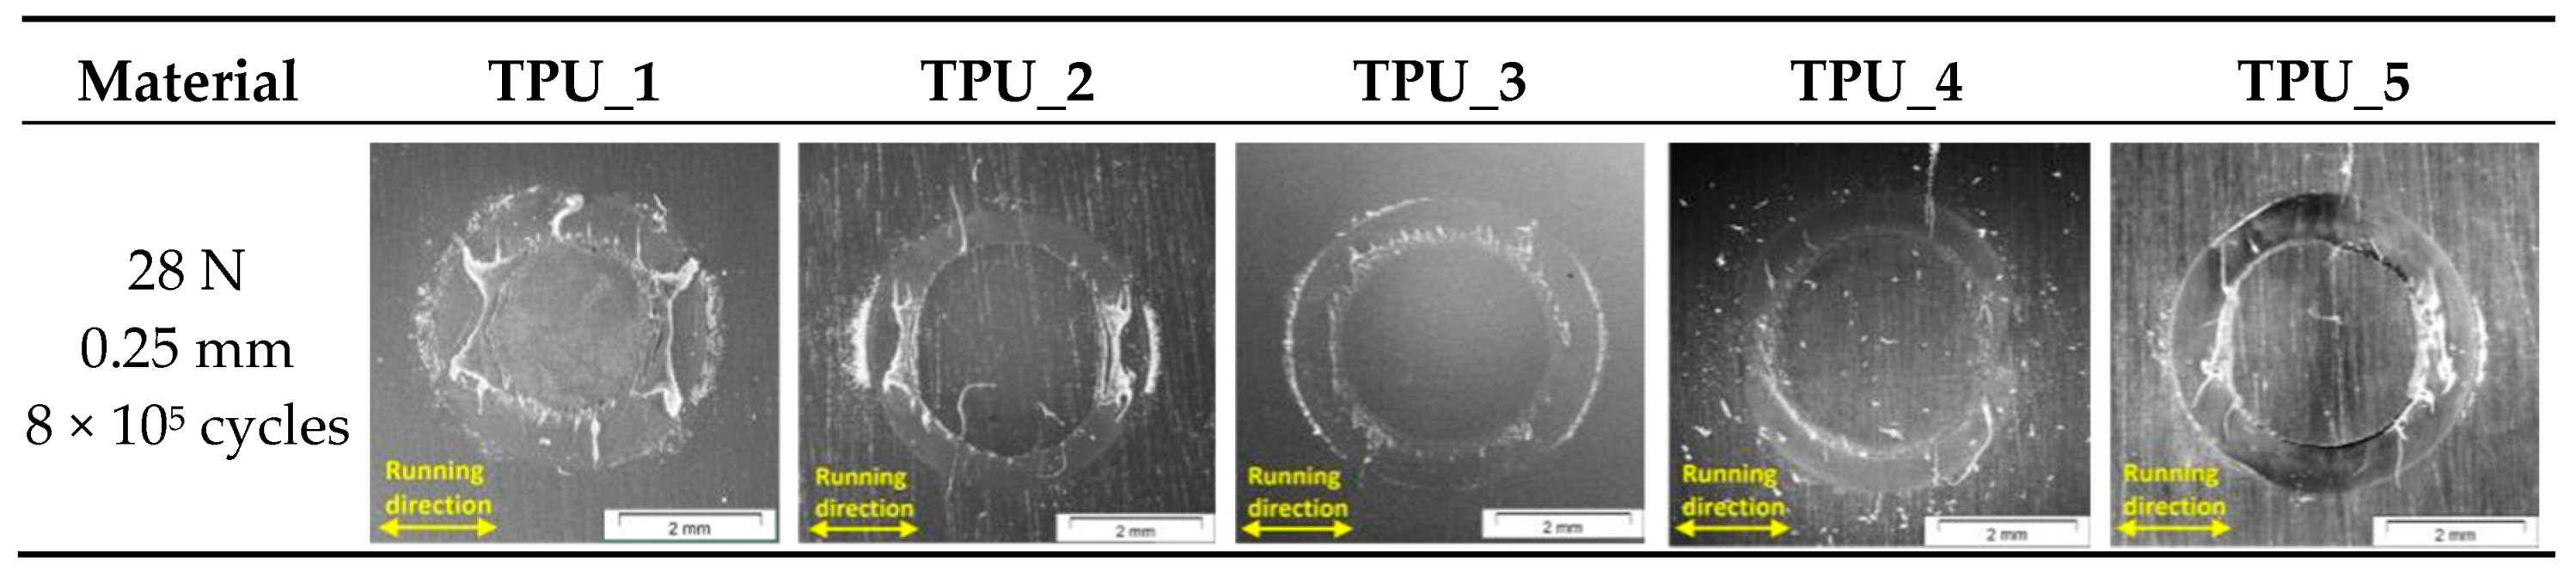
Comparing Figure 6 and Figure 7, it is evident that more debris was generated when the displacement amplitude increased from 0.1 to 0.25 mm. A butterfly-like scar can be identified on TPUs_1 and 2. The ring-like scar on TPUs_3, 4, and 5 with 0.25 mm displacement amplitude is larger than that with 0.1 mm. Small, stripe-like debris can also be observed in the top and bottom areas of the inner ring on TPU_1 and TPU_3, whereas on the other samples, these areas are much smoother.
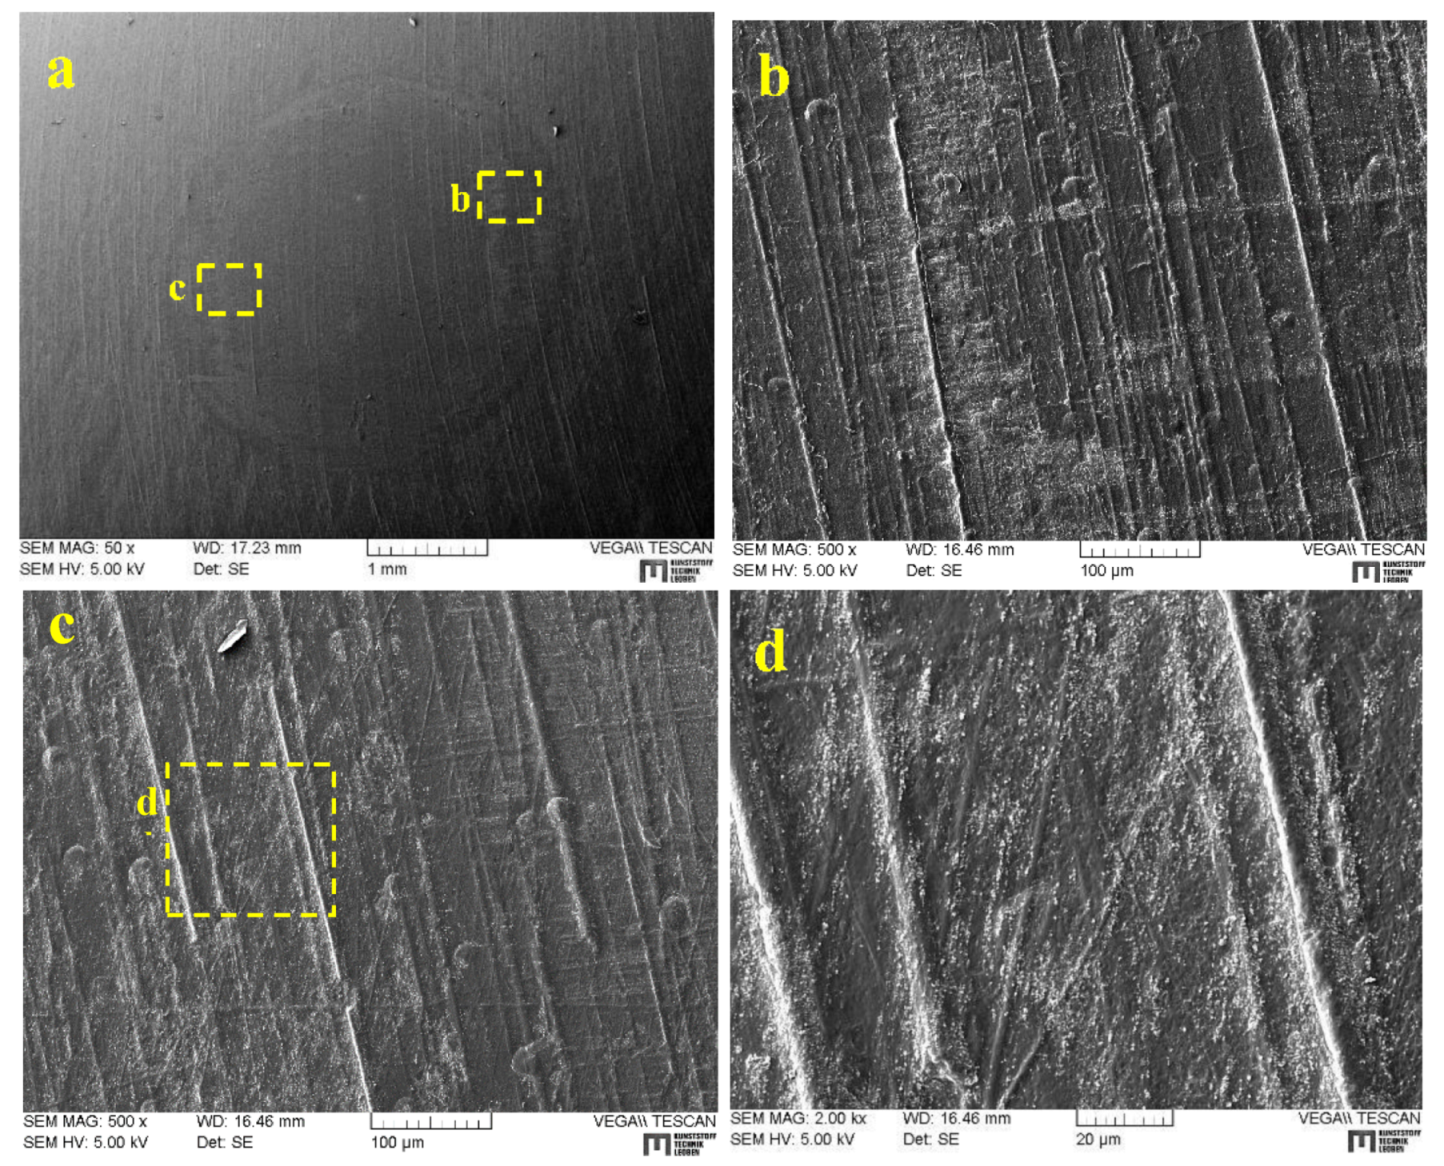
Figure 8 shows the wear scar of TPU_4 after 104 cycles. The test was conducted under 28 N normal load with 0.25 mm displacement amplitude. As shown in Figure 8a, small amounts of wear debris can be seen at the edge of the ring. Small wear particles were generated during the micro-slip. They can be identified in Figure 8c,d.
Mixed Fretting Regime
Compared to the hystereses in the partial slip regime, more alterations of the hystereses can be observed in the mixed fretting regime (Figure 9). Among the five TPUs, the hysteresis of TPU_1 changed differently, while the other TPUs behaved similarly in the mixed fretting regime. For TPU_1, the tangential force remained almost constant in the first 103 cycles when the samples were between −0.3 mm and +0.3 mm. As can be seen from the hysteresis, after approximately 103 cycles, its form began to change. The tangential force became larger with the increased displacement. It should be mentioned that the tangential force at the displacement (D) = ±0.5 mm reduced at first and then increased again when the cycle number increased from 104 to 106, whereas it increased continually at D = 0 mm. This phenomenon can be attributed to the wear generating process. As examined in [12], delamination wear and cracks can be found in the stick region after the test. After approximately 103 cycles, the damage began to appear on the edge of the ring. More wear debris was generated with increasing cycles because of the partial slip between the sample and the counterpart. Hence, the stick region became smaller and the tangential force at the maximum displacement decreased slightly. Due to the repeated shear stress, delamination and cracks can occur in the stick region. As a consequence, the tangential force can be altered.
TPU_2 and TPU_3 show similar hystereses. From 102 to 103 cycles, the hysteresis narrows, which means the tangential force reduces at D = 0 mm and increases at D = ±0.5 mm. For TPU_4 this change occurred later, after 103 cycles. However, for TPU_5 the maximum tangential force becomes slightly smaller with the increasing number of cycles. From the 2 × 10⁵ cycle, it begins to increase. It is also noticeable that the tangential force does not change linearly, but rather with an inflection point at approximately D = +0.15 mm for the movement from D = +0.5 to −0.5 mm, and vice versa. Due to the repeated shear stress, the left and right sides of the stick region can be folded (Figure 9). This can lead to an inflection in the tangential force.
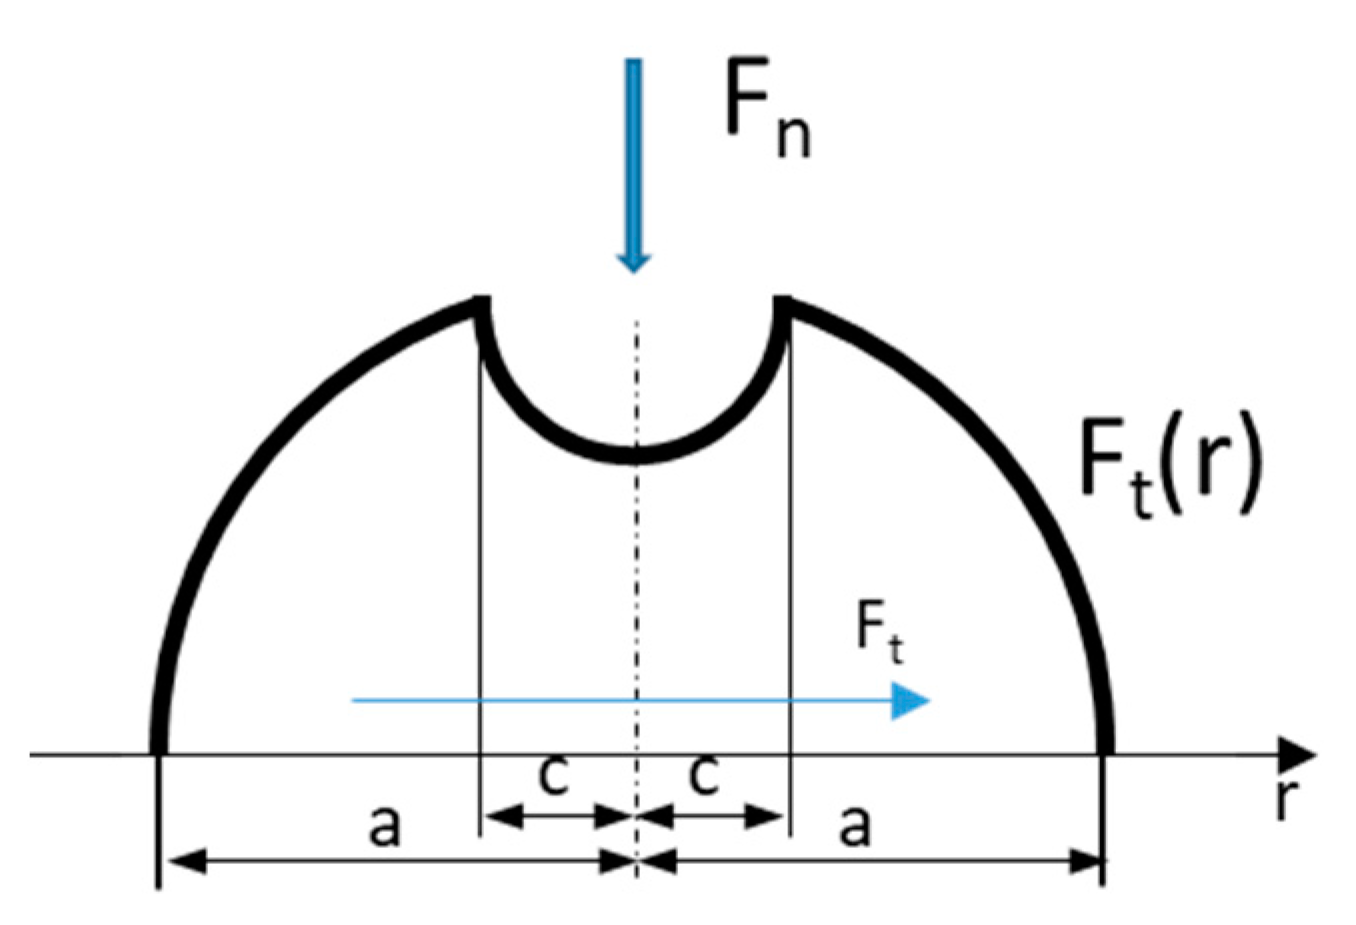
The mixed fretting regime, as its name suggests, is the transition field between the partial slip and gross slip regimes. As seen in Figure 9, the stick regions are much smaller than those in the partial slip regimes. Due to its larger amplitude, the stick region becomes smaller with increasing cycle numbers. Butterfly-like wear scars can be identified distinctly on TPU_3. On both sides of the stick regions, folds can be observed on TPUs_2, 3, 4, and 5. As explained in [12], repeated normal and shear stresses induce cracks and delamination wear on TPU_1. Figure 10 shows the profiles of the wear scars. TPUs_1 and 5 have the smallest stick regions and the deepest scars in the slip regions. In the stick regions of TPU_2 and TPU_5, slight surface alteration can be observed on the edges. Especially on TPU_5, the deformation of the surface decreases from the edge to the middle (Figure 11). This can be explained by the shear stress distribution. For this circular contact under a steady normal force and an oscillating tangential load, the maximum shear stress is located at the edge of the stick region (Figure 12) [18].
The hysteresis of TPU_1 shows a distinct transitional phase by approximately 5 × 10³ cycles (Figure 9). The wear scar after 5 × 10³ cycles is shown in Figure 13. Rolled stripe-like debris can be observed around the stick region (Figure 13a). Similar but much smaller debris can also be found in the partial slip regions. Additionally, micro pitting is identified at the edge of the outer ring. Due to surface fatigue, micro pitting can occur after the incubation period in fretting tests [19,20]. At the edge of the inner ring, the rolled debris was pressed into the surface and flattened due to plastic deformation. The contact was changed to three-body contact, which can lead to debris formation, and hence an alteration in the hysteresis form. Due to the debris between the contact surfaces, the tangential force was reduced slightly. The alteration in the hysteresis form is in good agreement with the previous studies [21]. However, a similar steady phase after the alteration cannot be identified, similar to in Godet’s experiments with steel alloys [21]. After a short steady phase, the tangential force began to increase because the surface morphology changed with the increasing number of cycles. Though the hardness of the debris is similar to the substrate, it can also affect the contact situation. The real contact area decreases, which leads to higher local contact stress and contact temperatures [22,23]. For polymers, all of these changes can affect the contact states, and thus accelerate the wear process. The profiles of wear scars show the depth of each scars (Figure 14).
Compared to TPU_1, no apparent debris can be observed on TPU_4 after 5 × 10³ cycles (Figure 15). However, delamination wear, which is attributed to cyclic shear and normal stresses [24,25], can be found in particular in the region where the maximum shear stress occurred, according to the hystereses in Figure 9.
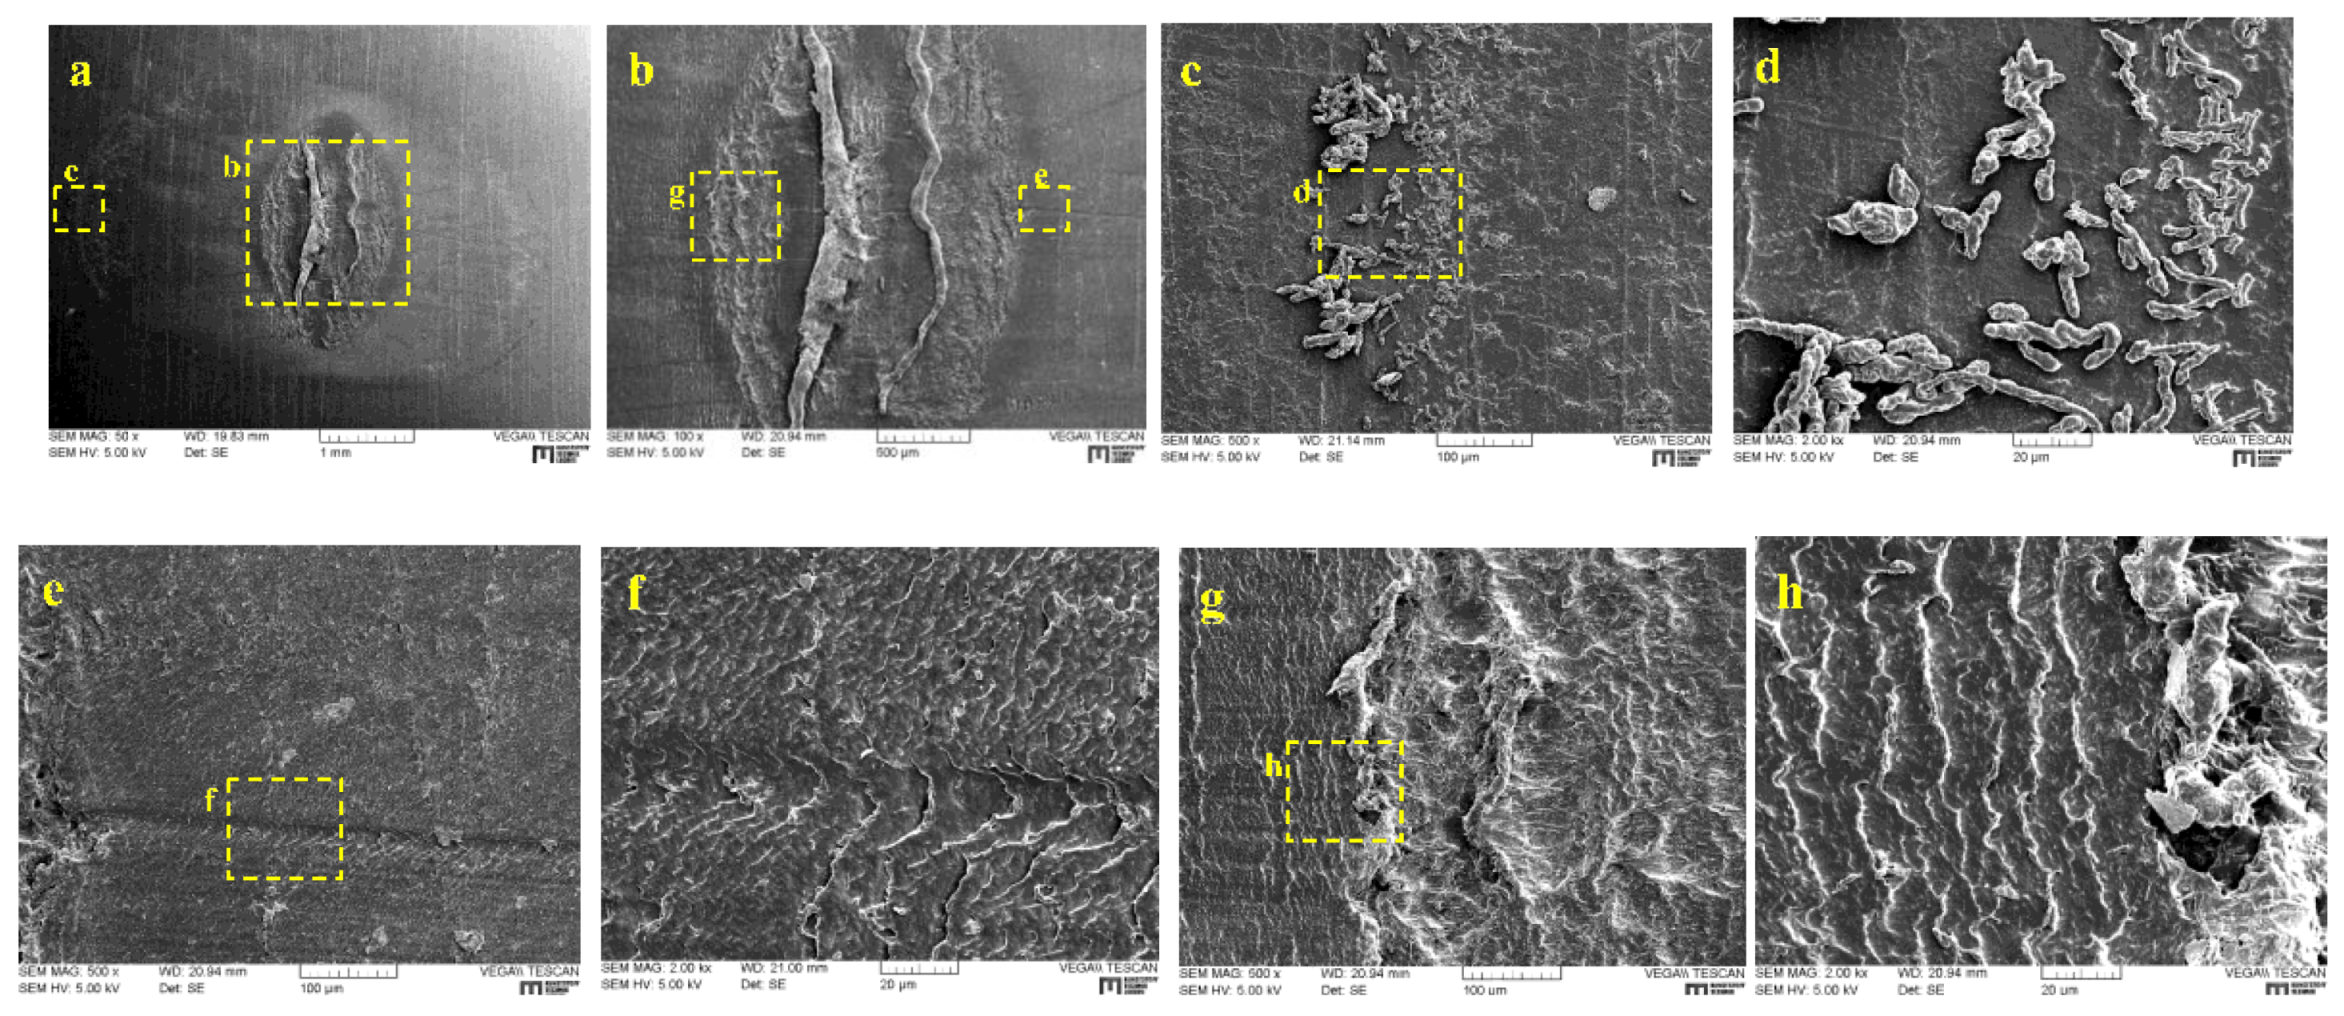
According to the hystereses, the transitional phase occurred slightly later. Its wear scar after 5 × 10⁴ cycles is shown in Figure 16. Various kinds of wear debris can be identified on the surface. On the whole, its debris is considerably larger than that of other materials. Larger block-like debris can be found on both sides, while stripe-like debris can be seen in the top and bottom regions. The stripe-like debris was rolled together due to the repeated movement, which was also observed using the in situ method [26]. Small stripe-like debris can be found in the middle area (Figure 16b,c), which was partially pressed into the surface (Figure 16d). Due to the larger block-like debris, the tangential force changed continuously. At the edge of the ring, layer-like debris can be found, which can be attributed to repeated stresses. Meanwhile, debris particles were observed at the edge of the outer ring, where according to the microstructures of the substrate, no contact occurs (Figure 16g,h). Therefore, the wear particles could be generated in the early phase and were removed at that point.
Gross Slip Regime
For the behaviors in the gross slip regime, each material shows its differences (Figure 17). For TPU_1, in the first 103 cycles, its tangential force remained almost constant with a slight increase during the movements, but still at a very low level of approximately 30 N, which is much smaller than other materials. The beginning behavior depends very much on the TPU surface. All surfaces were cleaned before the tests, even though their surfaces were slightly different. After 103 cycles its form began to change. When the sample moved from the furthest point (D = ±1.0 mm) to the central position (D = 0 mm), the tangential force reduced at first and then increased. After reaching the middle point, the tangential force remained almost constant until the furthest point. After approximately 2 × 10⁵ cycles, the hysteresis form changed again. This was caused by severe wear, which altered the geometry of the sample.
TPU_2’s tangential force increased gradually with the number of cycles and stayed in a similar form. From approximately 105 cycles, server wear was generated on both sides of the contact area (Figure 18). This explains the hysteresis form in the 8 × 10⁵ cycle. In the middle area, the surface is much smoother than other regions, so the tangential force changed when the sample moved in the central area.
For TPU_3, its tangential force increases slowly with the number of cycles until 105 cycles. Similar hysteresis to TPU_1 can be observed after 105 cycles. However, its maximum tangential force is slightly smaller than that of TPU_1.
The hysteresis of TPU_4 can be described with three parallelograms, the first of which describes the first 103 cycles. The second one shows the hysteresis from 105 cycles. Between 103 and 105, the hysteresis is illustrated with the third parallelogram, which can be treated as a transition phase. Both its height and width are between the first two parallelograms.
For TPU_5, its hysteresis looks very similar to the first 105 cycles. However, the maximum tangential force was not constant. It increased for the first 100 cycles and then decreased. From 5 × 10³ cycles, it increased again. After 4 × 10⁵ cycles, the tangential force grew faster after passing over the middle point.
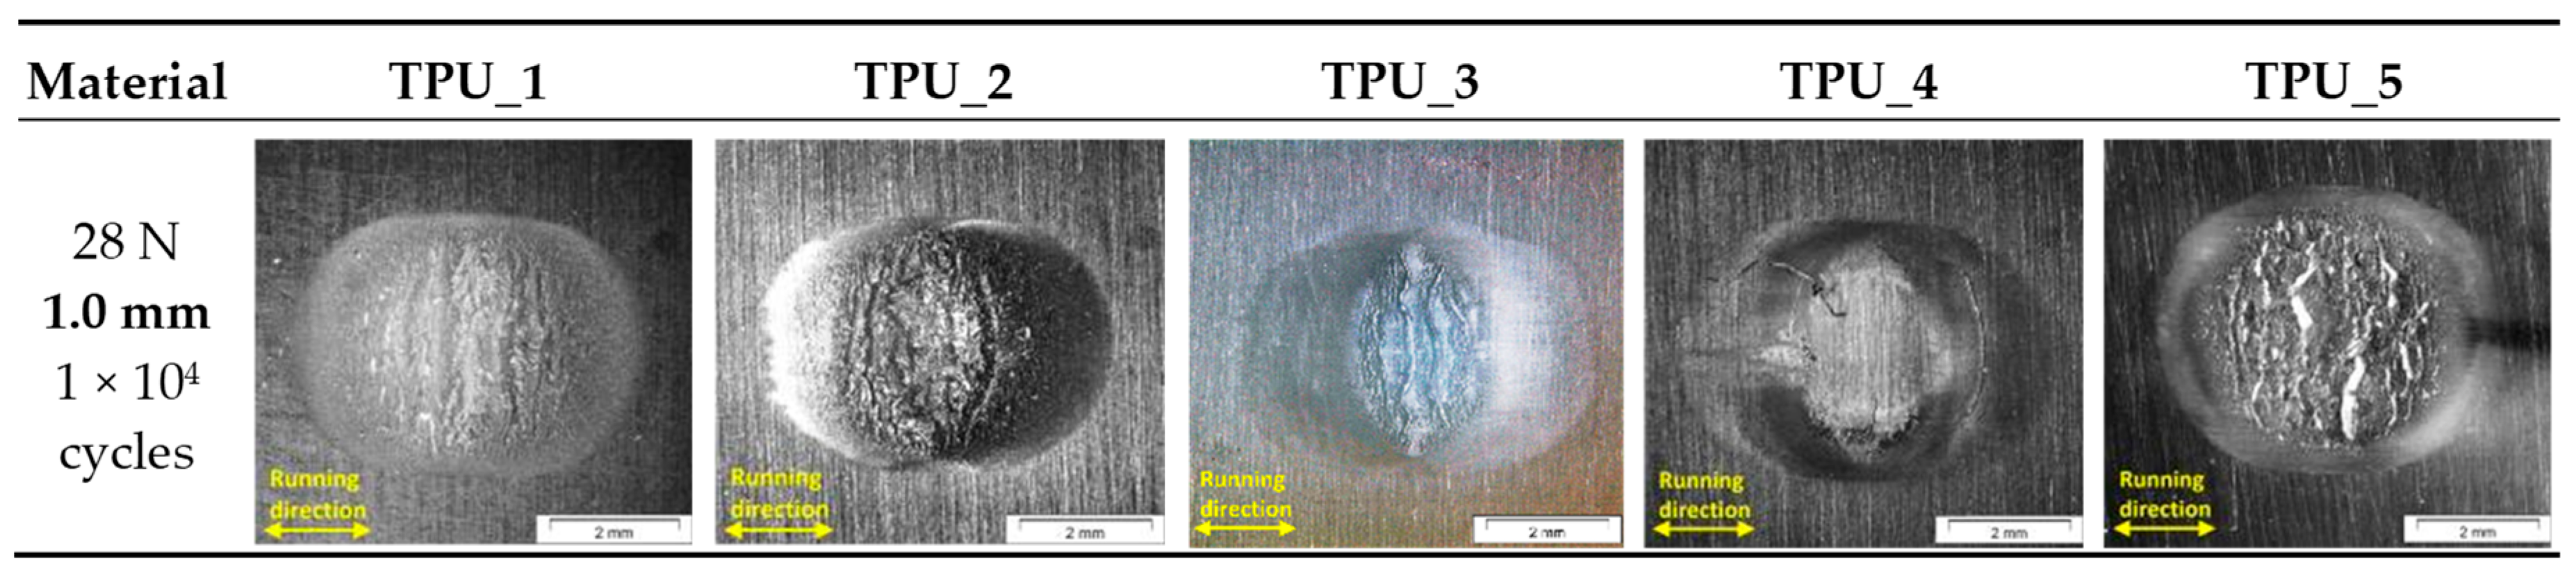
In the gross slip regime, the counterpart slips over the contact area. As can be observed in Figure 18, the wear scars of TPU_1, 4, and 5 show a definite similarity, and materials were removed because of the slip movements. However, severe wear can be seen on both sides of the scars in TPUs_2 and 3. This phenomenon can also be identified in the hysteresis. The evidence points to the substantial likelihood that these two materials behaved differently under cyclic normal and shear stresses, in particular at a relatively high temperature, which is related to fatigue mechanisms. Additionally, this can also be initiated by third body wear; the liberated debris stays in the contact zone and acts as a third body, which can lead to an acceleration of the wear process.
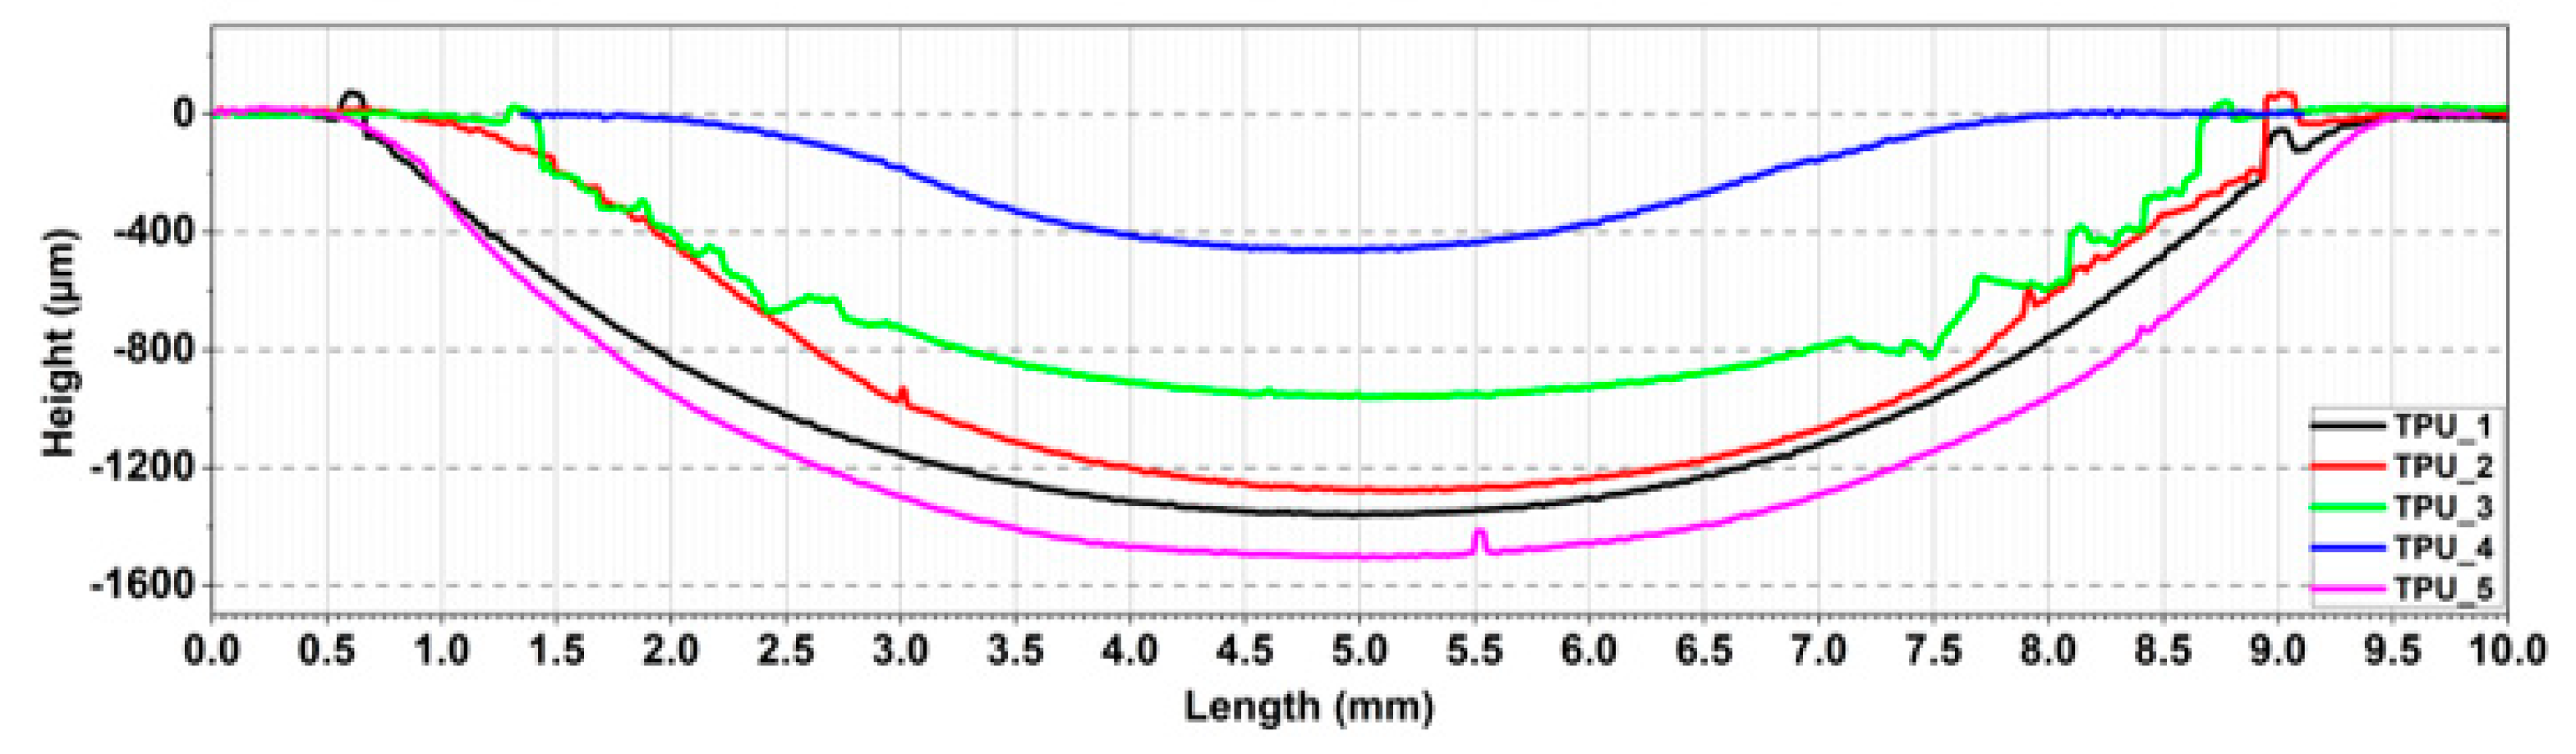
In comparison to the mixed fretting regime, wear scars in the gross slip regime are considerably broader and deeper. Among the five materials, the most severe wear was identified in TPU_5, which corresponds to the mixed fretting regime. For TPU_5, rolled debris on the bottom of the wear scar facilitated the slip movement of the counterpart, which resulted in a reduction of tangential force in the middle area (Figure 17). TPU_4 shows the best wear resistance, which is consistent with the results in tribological tests. The scar depth of TPU_4 is about 500 µm, which is only one-third of the depth in TPU_5 and half of that in TPU_3 (Figure 19).
On both sides of the contact area, severe wear can be found on TPUs_2 and 3 after 8 × 10⁵ cycles. Larger cracks can be observed in Figure 20d. At the end of the test, its tangential force increased to over 300N on both sides (Figure 17). Flake-like sections can be identified in Figure 20b,d. On the one hand, the glass transition temperature increases with increasing frequency. Thus, the material becomes slightly more brittle under 10 Hz than in a static situation. On the other hand, due to the large amplitude, debris can be easily torn away from the surface. Small wave-like debris was found in the middle area, which was generated as a result of repeated shear stress (Figure 20e,f). This kind of debris was also found in TPU_1 [12]. Moreover, the smooth wave surface was observed in the topside region (Figure 20h), which looks different to Figure 20b. This can be ascribed to the contact state. In Figure 20a, due to the spherical counterpart, the normal and shear stresses in region g are considerably smaller than those in region b. Hence, cracks in region g are smaller. Small wave-like debris was rolled together into larger debris (Figure 20g) when the ball slid over the region. After this process, the surface, which was full of small wave-like debris, looked smooth. Microcracks are generated with further movement.
Compared with TPU_2, the wear on TPU_4 is not as severe. The tangential force of its last cycle, approximately 120N, is significantly smaller than that of the other materials. On the one hand, it is the softest material in both static and dynamic states (Table 1). On the other hand, no severe wear, such as was seen for TPU_2, can be found for TPU_4 (Figure 19). As shown in Figure 21a, wave-like debris can be found on both sides, whereas the middle region is relatively smooth but with a lot of stripe-like debris. As evident in Figure 21c,g, several grooves are visible, which can be attributed to third-body abrasive wear. Particles can also be found in Figure 21g. Generally, the abrasive material must be harder than the surface [27]. These particles can be wear particles from the counterpart or external contamination. Both matter types are harder than the substrate. The particles might be tiny at the beginning, however they can be wrapped up in TPU debris. Compared to the other materials, except for TPU_5, the height of the wave-like debris is much smaller, so the sides are smoother. In addition, due to its lower hardness, the waves seem to be flattened when the counterpart slides over them. Both of these phenomena facilitate the moment of the counterpart.
Consequently, the tangential force of TPU_4 remains almost constant or even reduces with the counterpart’s movement from the middle to the side (Figure 17). The wear debris at the edge of the contact area and in the middle of the area is shown in Figure 21d,f, respectively. They look different from TPU_1 [12] and TPU_2. As shown in Figure 21d, owing to surface fatigue, the wear debris seems to be either delaminated from the surface or pressed into the surface. The debris clearly appears to be looser. The wear scars of the middle region can be affected by the interfacial debris, making the rolled wear debris look less neat than TPUs_1 and 2.
The wear scars of TPU_4 seem to be smoother than those of TPU_5. As shown in Figure 22b, a slight trough can be found on the surface. Images with high magnification for the trough are shown in Figure 22c,d. By using the method from our previous work [12], the friction force and normal force were calculated and are shown in Figure 23 with tangential force. As can be observed, the friction force is slightly smaller than the tangential force. The normal force is 28 N at D = 0 mm and increases with displacement. The maximal normal force reaches approximately 46 N at approximately D = 0.8–0.9 mm. In the reverse direction, the normal force decreases to 28 N. The trough could be the result of the coaction of small debris with large stripe-like debris under high normal load.
As shown in Figure 17 and discussed previously, the 104 cycle is the approximate transition field for all five TPUs in hysteresis. In order to investigate the alteration process of the wear scars and correlate the hysteresis with the wear scars, tests were conducted until 104 cycles. Figure 24 shows the micrographs of the wear scars. In TPUs_1, 2, and 5, similar wear scars can be observed on the surface after 104 cycles. Large cracks were nucleated and propagated perpendicular to the sliding direction, while on TPU_3 the cracks are focused in the middle area and both sides are relatively smooth. For TPU_4, its wear scars after 104 cycles look similar to those seen after 8 × 10⁵ cycles in the mixed fretting regime. The middle area seems to be stuck on the counterpart. This can be ascribed to its distinctly lower storage modulus under 10 Hz load compared with the other materials. For this reason, TPU_4 can deform even under 1.0 mm displacement amplitude, so that no slip can occur between the middle area of the sample and the counterpart. Stripe-like wear debris can be seen on the surface, which was rolled because of the slip movements on both sides.
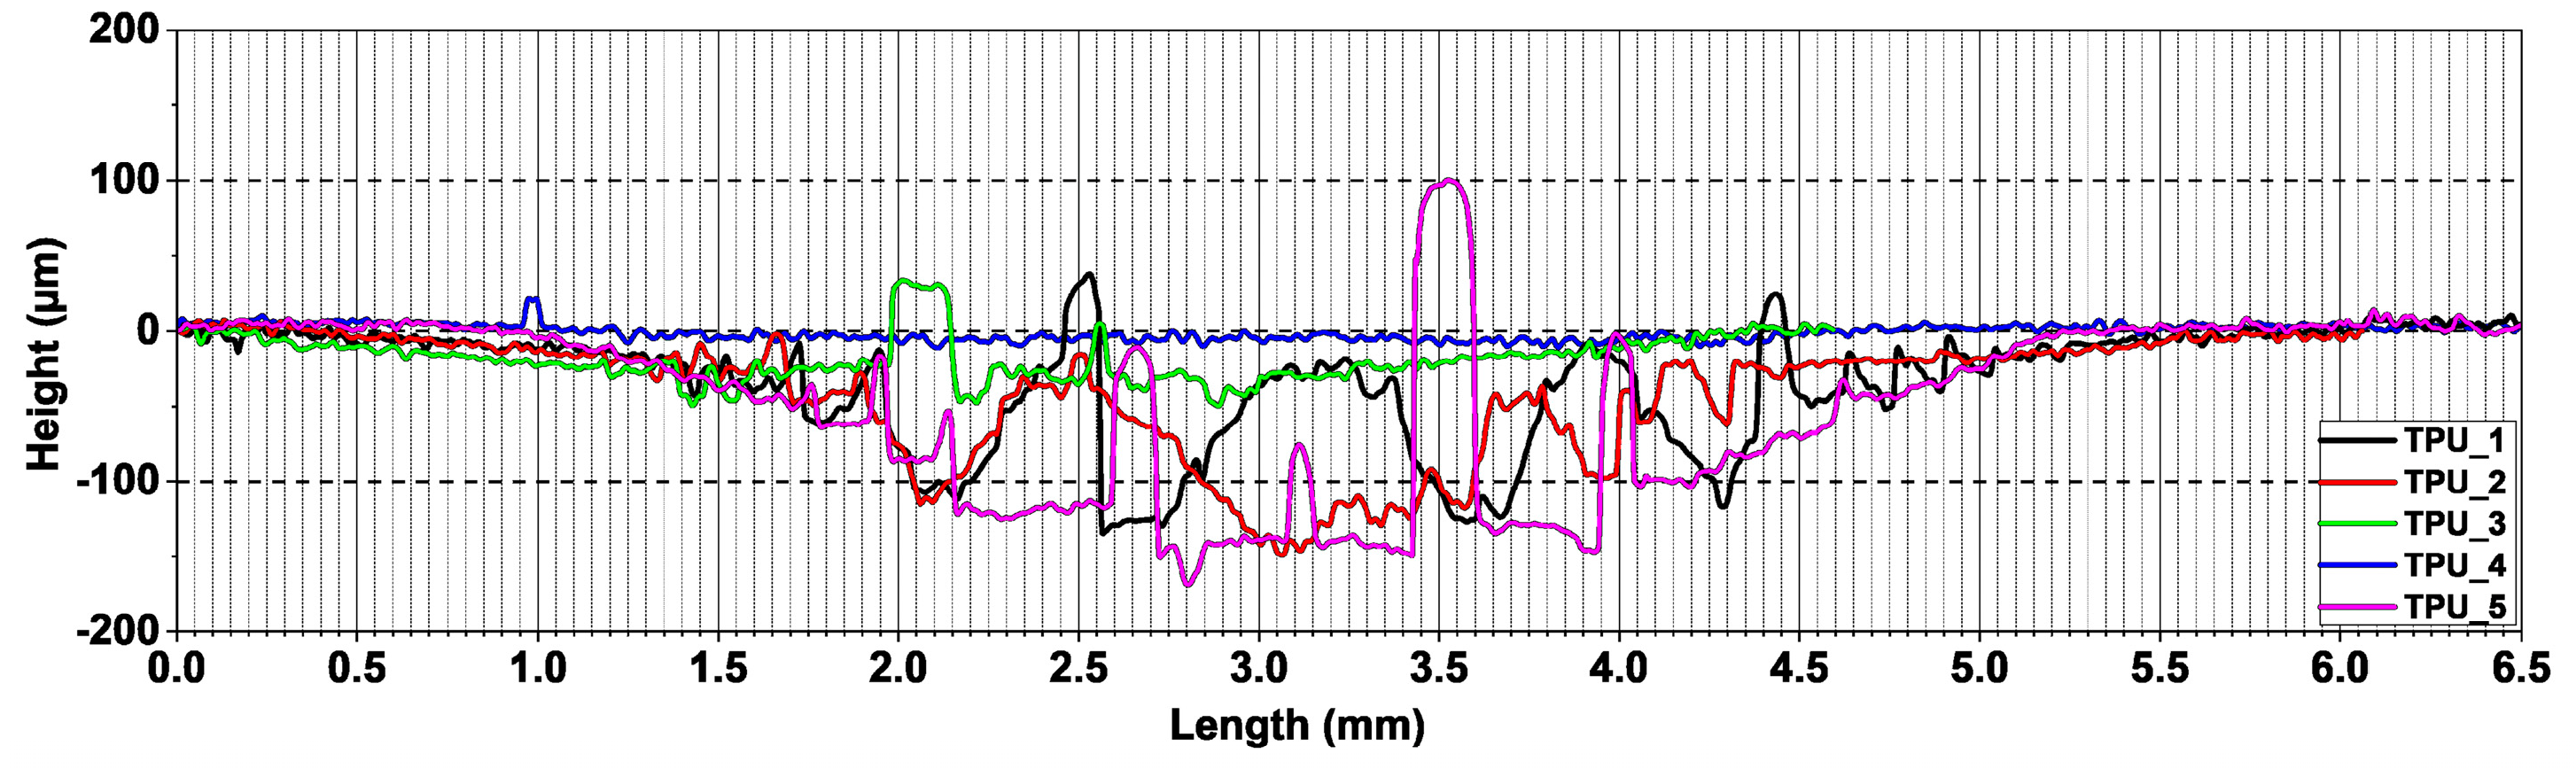
Figure 25 shows the profiles of the wear scars after 104 cycles. Almost no change can be identified for TPU_4. However, severe wear can be observed in other materials to varying degrees. This reveals the formation process of the wear scars.
After 104 cycles, severe wear can be observed in the middle part of the contact area in TPU_3 (Figure 26a). Sizeable stripe-like debris was generated on both sides, which is perpendicular to the sliding direction. However, small debris can be found at the edge of the sliding area (Figure 26c,d). This debris was not rolled together as large debris and was partially removed to the edge and partially pressed on the surface (Figure 26d). In addition, abrasive wear can also be identified (Figure 26e). Meanwhile, flake-like debris is visible (Figure 26f), which can be attributed to surface fatigue. At the edge of the middle scar, the embryonic form of the sizeable stripe-like debris can be observed (Figure 26g). As shown in Figure 26h, because of the cracks, the debris was separated from the substrate and began to connect to form large pieces of debris. With further cycles, more debris would be rolled together.
3.2.2. Counterpart
Besides the wear scars, the counterpart surfaces were also analyzed with a microscope. In Figure 27, the micrographics of counterparts are shown. The micrographics were taken with a ring illuminator. Two extreme examples, TPU_4 and TPU_5, were chosen. They represent the best and worst fretting behavior, respectively. In the partial slip regime (PSR), due to the large stick region and the cyclic shear stress, the materials adhered to the counterpart. This phenomenon can also be identified in the mixed fretting regime. However, the amount is less and size is smaller than in the partial slip regime. In the gross slip regime, slight abrasive wear scars can be observed on the counterpart. For TPU_5, visible wear marks are found on the counterpart. It is evident that the wear debris, which is on the bottom of the wear scar (Figure 19 and Figure 22), worked as a third body [21] in the interface. Under normal and shear stresses, it can be attached to the counterpart.
3.2.3. Dissipated Energy
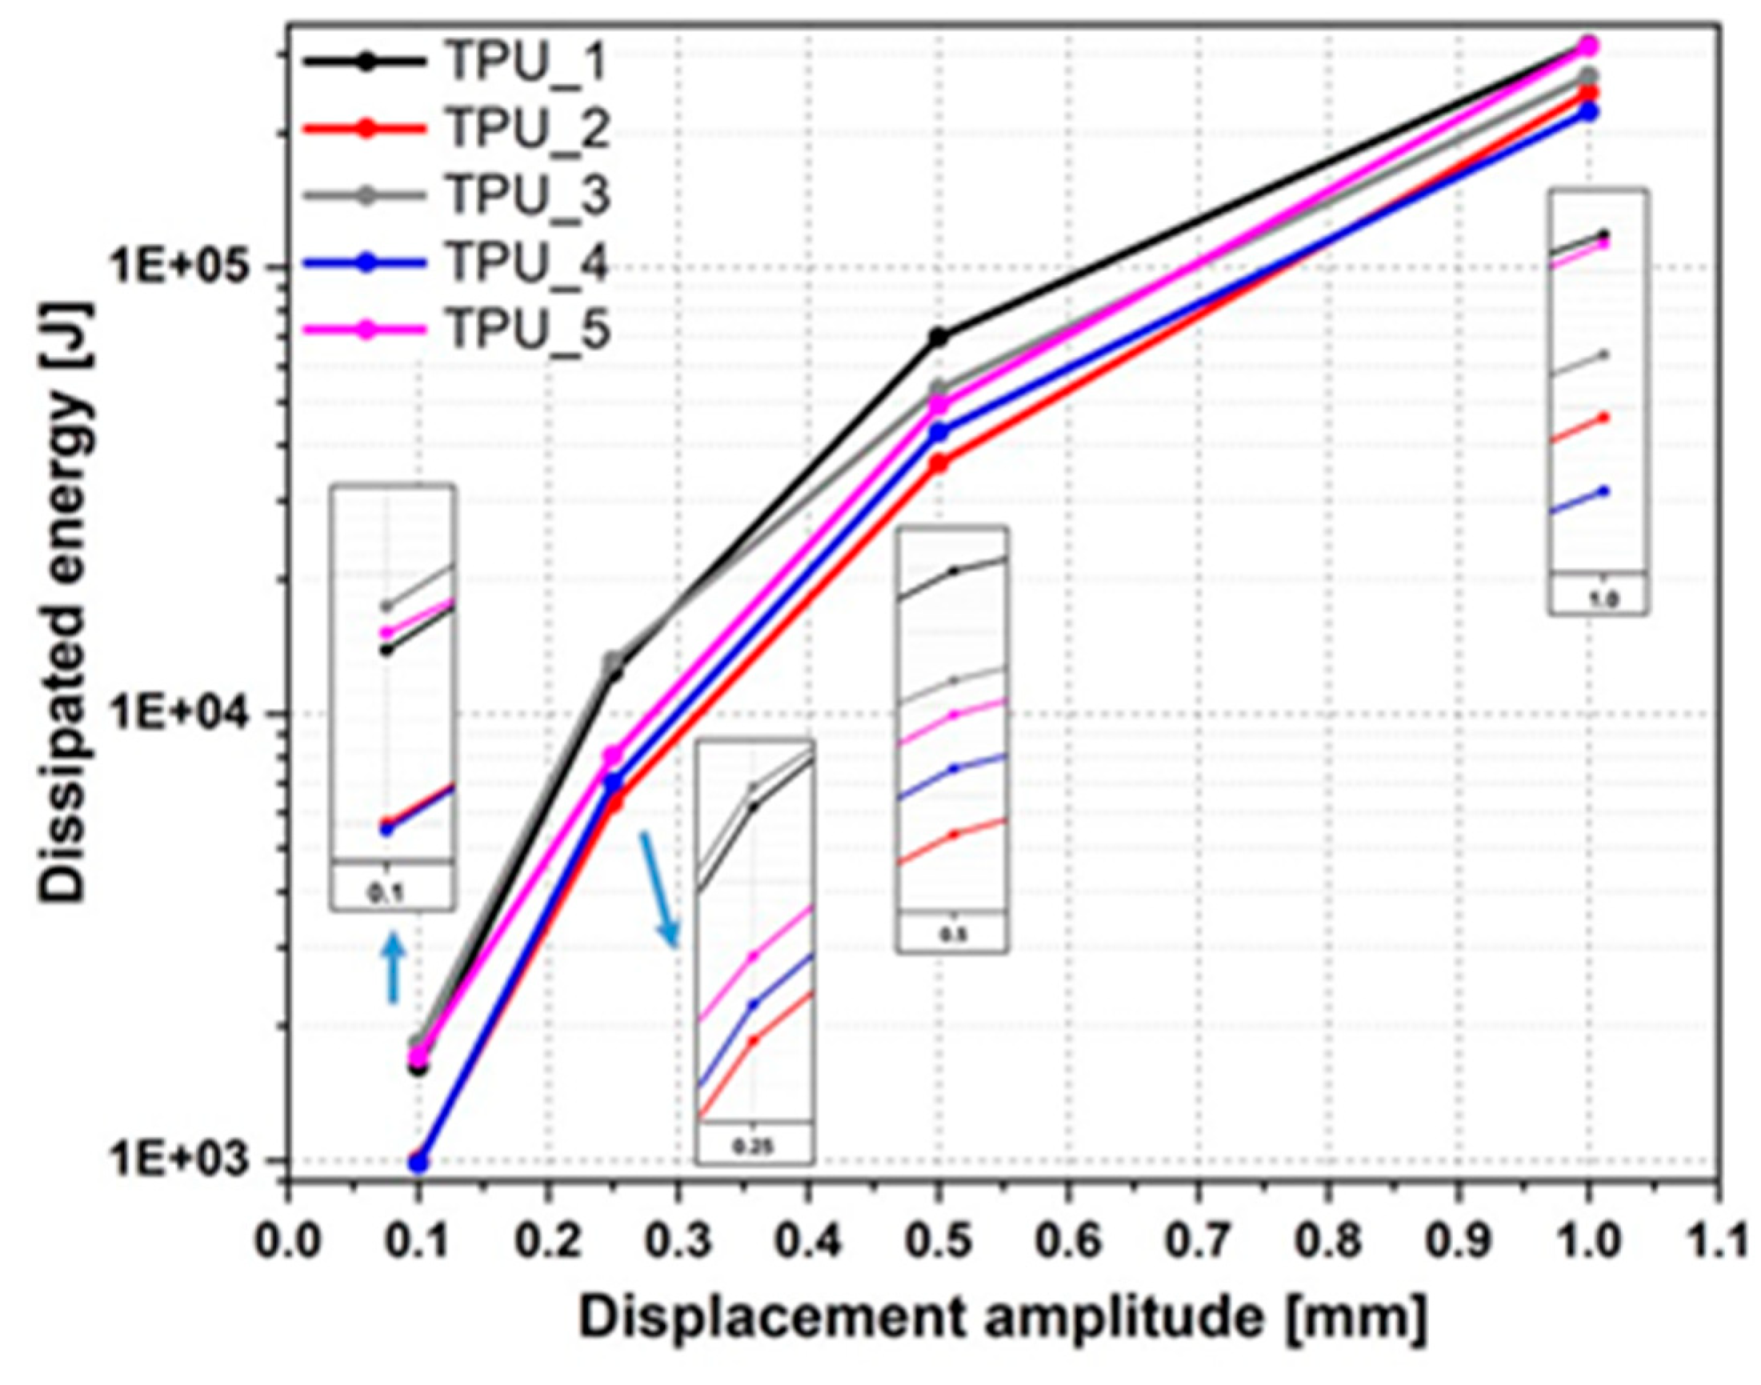
Dissipated energy is an integration of the tangential force with the displacement for a full test. It is also the energy converted from kinetic energy to heat because of friction. As can be observed in Figure 28 with all four displacement amplitudes, TPU_1, 3, and 5 have dissipated more energy than TPU_2 and 4.
Several factors can affect the dissipated energy. One crucial factor is the mechanical properties of the material under dynamic stresses, which can be determined by dynamic mechanical analysis tests. The other factor is the time during a fretting test when the contact surface begins to be worn. Once the contact surface is worn, the tangential force can be changed significantly. The thermal effect would also be considered as a significant influence factor for the dissipated energy. As we know, polymers are materials whose mechanical properties change dramatically with temperature. During the fretting test, the temperature of the contact area changes with dissipated energy. This can result in an alteration of the mechanical properties of the TPU. Hence, the tangential force changes, conversely affecting the dissipated energy.
3.2.4. Temperature Development
The temperature was measured with infrared sensors. However, due to the narrow and small structure, there is not enough room to measure the in situ temperature in the contact area. As we know, steel is an excellent thermal conductor (λ ≈ 80 W/(m·K)), which is around 400-times more effective than TPU (Table 1). For this reason, the temperature of the counterpart was measured. Generally, the temperature increases at the beginning of the test and after a while it becomes balanced. The rise in temperature can be roughly correlated to the dissipated energy. Nevertheless, the heat can also be taken away by debris, convection, and thermal radiation in the air. In the partial slip regime, the increase is smaller than 1 °C. In the mixed fretting and gross regimes, it is approximately 5 and 11 °C, respectively.
3.2.5. Coefficient of Friction
Partial Slip and Mixed Fretting Regimes
In the partial slip regime, the coefficient of friction (COF) cannot be calculated by using Coulomb’s law, which is generally applied to calculate the COF for static and kinetic friction. However, under partial slip conditions, micro-slips occurred at the edge of the ring (radius = a) with a stick region in the middle (radius = c). In addition, in Coulomb’s law, the dependence of the contact area is not considered. Based on the work of Cattaneo and Mindlin, Johnson introduced a method to calculate the COF of partial slip for contacts between spheres [24]. The stick region can be calculated through tangential force.
where a is the radius of the outer ring, c is the radius of the inner ring; Ft is the tangential force; and Fn is the normal load.
From Equation (1) we can get Equation (2):
In Figure 29, the coefficients of friction, which were calculated by using Equation (2) and the ratio of c/a for the tests in the partial slip and mixed fretting regimes, were illustrated. It should be emphasized that the coefficient of friction and the ratio of c/a, which have been discussed in this research, are merely for the final state of the tests. For this reason, there is no direct correlation between the coefficient of friction and dissipated energy.
When D = 0.1 mm, significant differences can be identified, as seen in Figure 29. For TPU_1, the COF is approximately 2.5, whereas for TPUs_3, 4, and 5 it is substantially higher than 4. As discussed in [12], debris was found in the middle region of the TPU_1 sample after the test, which was conducted with a normal 28 N load and 0.1 mm displacement amplitude. The debris was not generated in the stick region, but rather from the top area. It was accumulated outside the ring and fell onto the counterpart over time. This can affect the generation of wear debris in the slip region, which influences the calculation of COF. However, when the displacement amplitude increases to 0.25 mm or 0.5 mm, the frictional behaviors are approximate; their COFs are around 2. The ratio of c/a at D = 0.1 mm is approximately 0.9 among all five TPUs, whereas more substantial differences can be found when the displacement amplitude increases to 0.25 mm or 0.5 mm. As can be seen in Figure 7 and 10 some samples do not show the typical ring-like scars after tests, but rather show butterfly-like scars. This phenomenon affects the c-value, which acts upon the ratio of c/a and the coefficient of friction directly.
Gross Slip Regime
The coefficient of friction in the gross slip regime was calculated based on the analysis of the force, wear scars, and acceleration of the samples, which were considered in previous work [12]. The COF displacement is shown in Figure 30. For the five TPUs, their COF can be classified into two categories. For TPUs_1, 4, and 5, their COF is approximately 3, and there is no obvious turning point on the curves. However, for TPU_2 and 3, distinct turning points can be observed, and their curves look similar to a parallelogram, which is composed of polylines. This can be traced back to the wear scar. As shown in Figure 18 and 24, severe wear can be found on both sides of the scars. Due to these phenomena, their COF changed significantly with the movement.
3.2.6. Running Condition Fretting Map (RCFM)
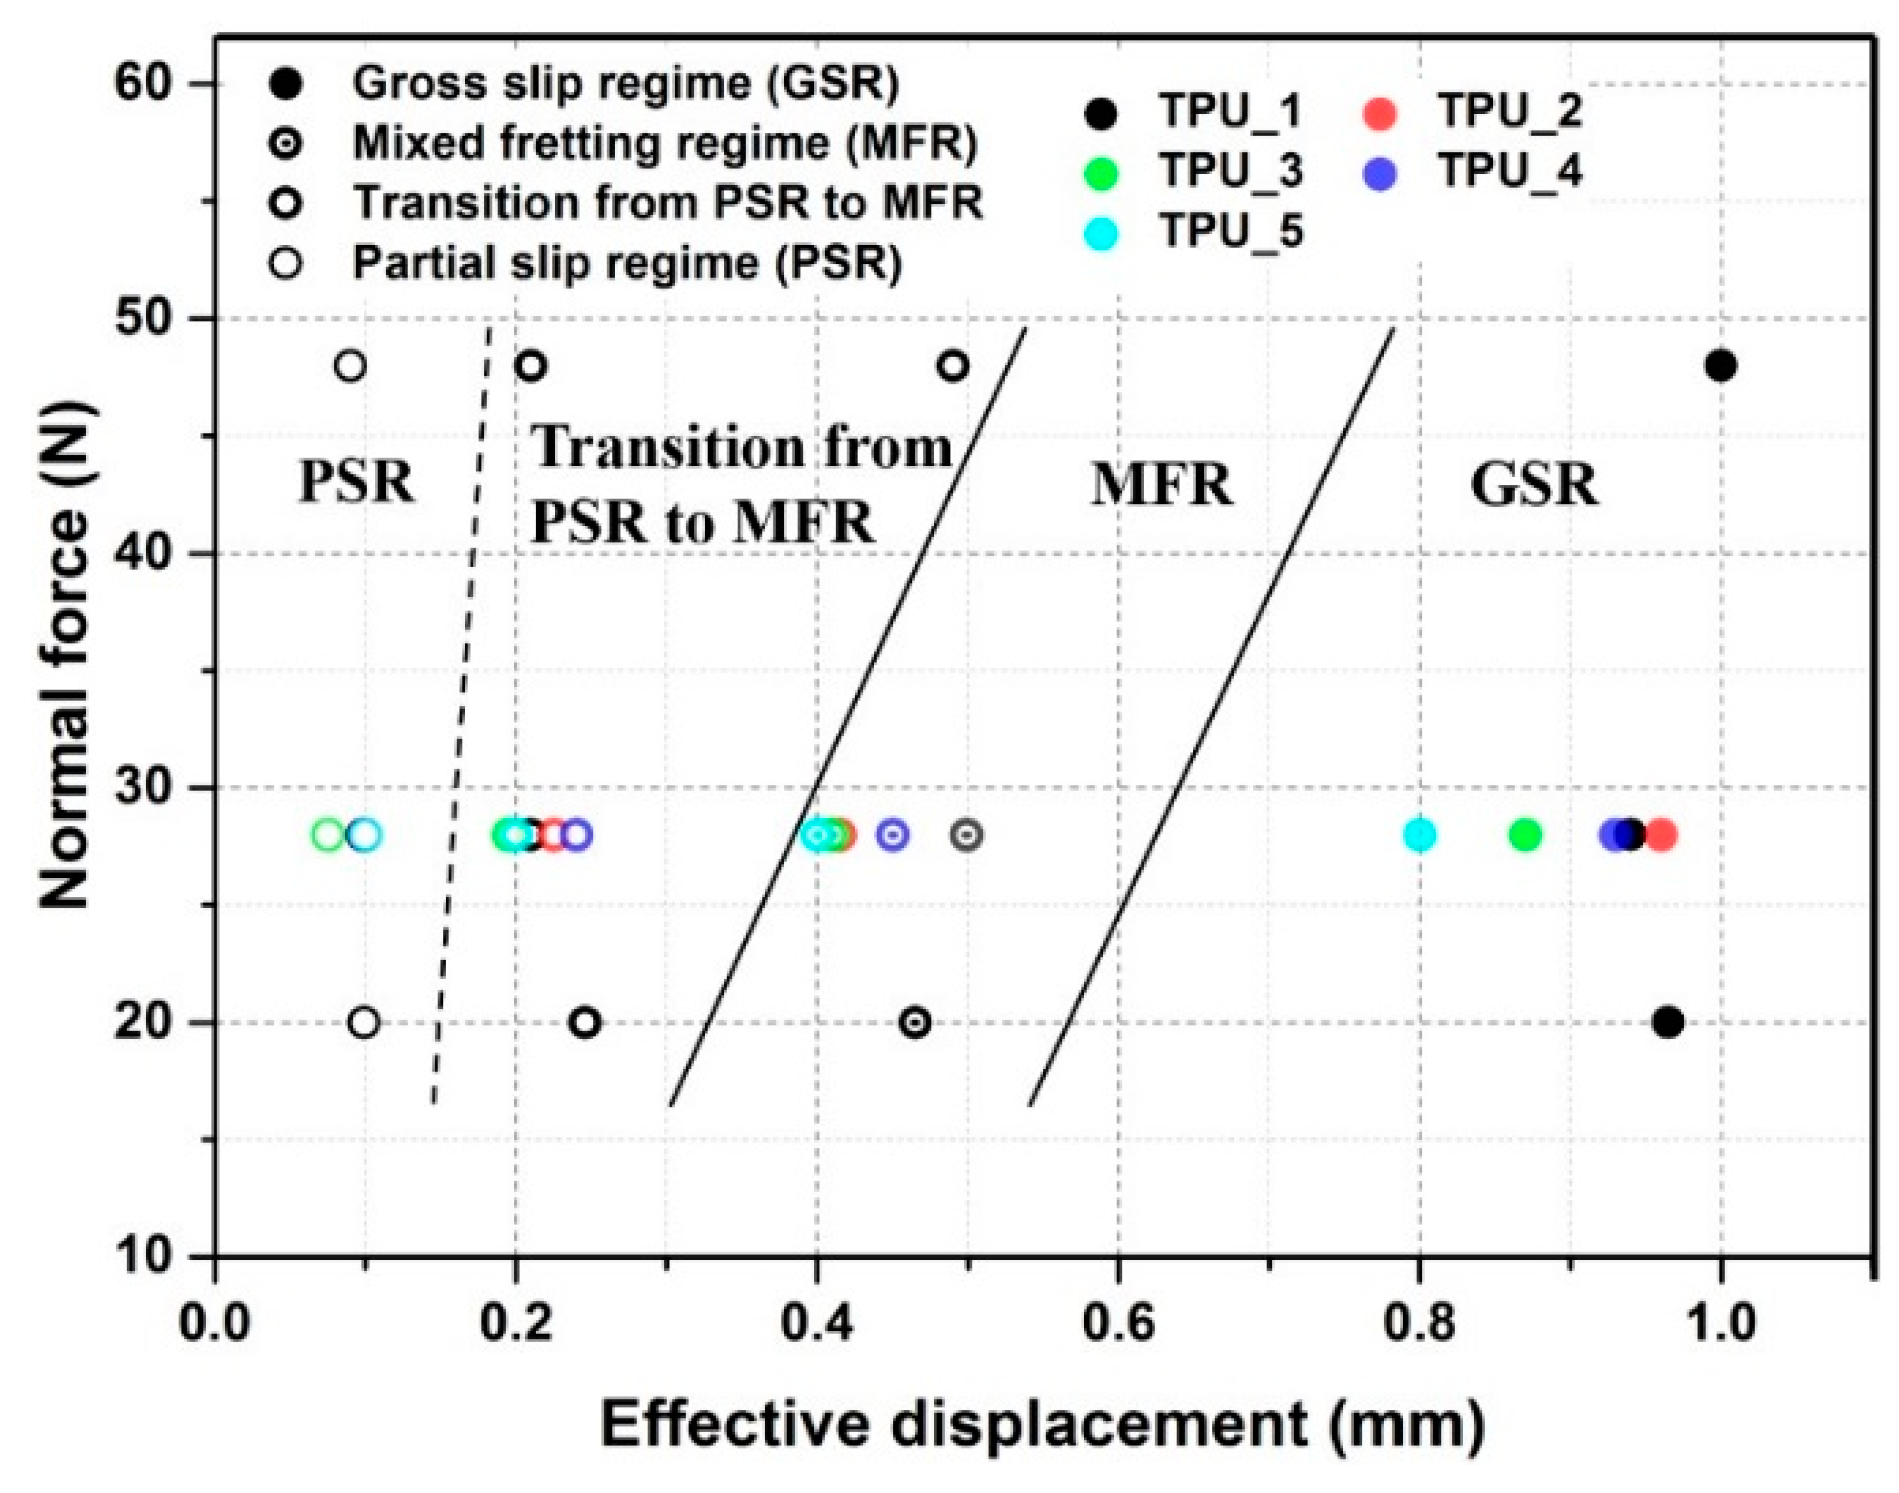
Based on the hysteresis and wear scar analysis, a running condition fretting map could be obtained. This represents the transition from one zone to the other [28,29]. However, a clear boundary between MFR and GSR can only be achieved with a large number of experiments. In Figure 31 the normal force is plotted versus effective displacement, which should indicate a more accurate running condition fretting map. Due to different effective displacements, the location of points has a slight deviation. Overall, the three regimes of the five TPUs show no significant differences and can be described adequately with one RCFM.
4. Conclusions
Our prior study defined the method of investigation for the fretting behavior of polymeric materials [12]. It is notable that the fretting behavior of TPUs was related to the dynamic mechanical properties, which is different from metals. In this study, we have identified the differences in fretting behaviors among the five TPUs.
(1) Fretting tests were conducted for the five TPUs. In order to compare the fretting behavior and sliding performance, tribological tests were performed. The three fretting regimes were identified by using hysteresis and wear scar analysis.
(2) Based on the wear scar analysis, the wear processes were revealed for the three different regimes. However, this can depend on material properties and test parameters. In the partial slip regime, the scars seem to be quite similar, while with larger amplitude, the scars vary considerably among materials. In the mixed fretting regime, cracks and delamination could be identified, and in the gross slip regime, severe wear was observed.
(3) The dissipated energy also shows differences. Generally, TPUs_1, 3, and 5 have higher energy dissipation than the other two materials. This is induced by the differences in material properties and the moment at which the transition occurs.
(4) The coefficient of friction was calculated separately for the partial slip and gross slip regimes. They are correlated to the wear scar well. In the mixed fretting regime (D = 0.25 mm and 0.5 mm), the coefficient of friction is almost at the same level for the five materials. In the partial slip regime, however, it can be distinguished. The material properties and the contact conditions are responsible for this phenomenon.
(5) Due to the different test methods and wear mechanisms, the COF values in fretting and ring-on-disc tests are not comparable. However, TPU_4 shows the best tribological properties and the best fretting behavior.
In the future, attention should be paid to the in situ temperature in the contact area, which can have a significant effect on the material properties, especially for polymeric materials.
Author Contributions
Conceptualization, A.H. and T.S.; methodology, A.H. and C.W.; validation, C.W.; formal analysis, C.W. and M.B.; investigation, C.W.; resources, T.S.; writing—original draft preparation, C.W.; writing—review and editing, A.H., G.P., F.G. and T.S.; visualization, X.X.; supervision, G.P. and F.G.; project administration, A.H.; funding acquisition, T.S.
Funding
This work was funded by both the federal government and the state governments of Styria, Lower Austria, and Upper Austria.
Acknowledgments
The present research was carried out at the Polymer Competence Center Leoben GmbH within the framework of the Competence Center Program COMET by the Federal Ministry of Transport, Innovation, and Technology and the Federal Ministry of Economics, Family, and Youth, with the participation of the Chair of Mechanical Engineering and the Chair of Materials Science and Testing of Polymers, Montanuniversität Leoben, SKF Sealing Solutions, Austria GmbH.
Conflicts of Interest
The authors declare no conflict of interest.
References
- Holden, G.; Kricheldorf, H.R.; Quirk, R.P. Thermoplastic Elastomers, 3rd ed.; Hanser: Munich, Germany, 2004; p. 36. ISBN 978-3-446-22375-2. [Google Scholar]
- Flitney, R. Seals and Sealing Handbook, 6th ed.; Butterworth-Heinemann an Imprint of Elsevier: Amsterdam, The Netherlands, 2014; p. 397. ISBN 978-0-08-099416-1. [Google Scholar]
- Anisimov, V.N.; Semenets, A.A.; Letunovskii, M.P.; Strakhov, V.V. Effect of Rigid Blocks on the Mechanical Characteristics and Abrasive Resistance of Polyurethanes. Mater. Sci. 2002, 38, 95–98. [Google Scholar] [CrossRef]
- Qi, H.J.; Boyce, M.C. Stress–strain behavior of thermoplastic polyurethanes. Mech. Mater. 2005, 37, 817–839. [Google Scholar] [CrossRef]
- Sui, T.; Baimpas, N.; Dolbnya, I.P.; Prisacariu, C.; Korsunsky, A.M. Multiple-length-scale deformation analysis in a thermoplastic polyurethane. Nat. Commun. 2015, 6, 6583. [Google Scholar] [CrossRef] [PubMed] [Green Version]
- da Silva, R.C.L.; da Silva, C.H.; Medeiros, J.T.N. Is there delamination wear in polyurethane? Wear 2007, 263, 974–983. [Google Scholar] [CrossRef]
- Hausberger, A.; Major, Z.; Theiler, G.; Gradt, T. Observation of the adhesive- and deformation- contribution to the friction and wear behaviour of thermoplastic polyurethanes. Wear 2018, 14–22. [Google Scholar] [CrossRef]
- Elleuch, R.; Elleuch, K.; Salah, B.; Zahouani, H. Tribological behavior of thermoplastic polyurethane elastomers. Mater. Des. 2007, 28, 824–830. [Google Scholar] [CrossRef]
- Martínez, F.J.; Canales, M.; Alcalá, N.; Jiménez, M.A.; Yahiaoui, M.; Ural, A.G.; Paris, J.-Y.; Delbé, K.; Denape, J. Analysis of Wear Mechanism in TPU-Steel Contact Pair by Means of Long Stroke Tribometer Tests. In Proceedings of the LUBMAT ’12, Bilbao, Spain, 6–8 June 2012. [Google Scholar]
- Yahiaoui, M.; Denape, J.; Paris, J.-Y.; Ural, A.G.; Alcalá, N.; Martínez, F.J. Wear dynamics of a TPU/steel contact under reciprocal sliding. Wear 2014, 315, 103–114. [Google Scholar] [CrossRef] [Green Version]
- Sealing Sense; Fluid Sealing Association; Pumps & Systems: Wayne, PA, USA, 2004.
- Wang, C.; Hausberger, A.; Berer, M.; Pinter, G.; Grün, F.; Schwarz, T. An investigation of fretting behavior of thermoplastic polyurethane for mechanical seal application. Polym. Test. 2018, 72, 271–284. [Google Scholar] [CrossRef]
- Wang, C.; Stiller, T.; Hausberger, A.; Pinter, G.; Grün, F.; Schwarz, T. Correlation of Tribological Behavior and Fatigue Properties of Filled and Unfilled TPUs. Lubricants 2019, 7, 60. [Google Scholar] [CrossRef]
- Vingsbo, O.; Söderberg, S. On fretting maps. Wear 1988, 126, 131–147. [Google Scholar] [CrossRef]
- Dahmani, N.; Vincent, L.; Vannes, B.; Berthier, Y.; Godet, M. Velocity accommodation in polymer fretting. Wear 1992, 158, 15–28. [Google Scholar] [CrossRef]
- Hausberger, A.; Godor, I.; Grün, F.; Pinter, G.; Schwarz, T. Optimierung tribologischer Testmethoden für die Dichtungstechnik. In Proceedings of the ÖTG-Symposium, Leoben, Austria, 26 November 2014. [Google Scholar]
- Chai, Y.S.; Argatov, I.I. Fretting wear accumulation in partial-slip circular Hertzian contact. Mech. Res. Commun. 2019, 96, 45–48. [Google Scholar] [CrossRef]
- Johnson, K.L. Contact Mechanics; Cambridge University Press: Cambridge, UK, 1987; ISBN 9780521347969. [Google Scholar]
- Bill, R.C. Fretting Wear and Fretting Fatigue—How Are They Related? J. Lub. Tech. 1983, 105, 230. [Google Scholar] [CrossRef]
- Errichello, R.L. Morphology of Micropitting. Gear Technol. 2012, 4, 74–81. [Google Scholar]
- Godet, M. Third-bodies in tribology. Wear 1990, 136, 29–45. [Google Scholar] [CrossRef]
- Wu, H.-W.; Chen, Y.-Y. Effect of two-body and three-body microcontacts under dry friction on contact characteristics. Proc. Inst. Mech. Eng. 2017, 232, 706–719. [Google Scholar] [CrossRef]
- Wu, H.-W.; Chen, Y.-Y.; Horng, J.-H. Contact temperature under three-body dry friction conditions. Wear 2015, 330–331, 85–92. [Google Scholar] [CrossRef]
- Suh, N.P. An overview of the delamination theory of wear. Wear 1977, 44, 1–16. [Google Scholar] [CrossRef]
- Suh, N.P. The delamination theory of wear. Wear 1973, 25, 111–124. [Google Scholar] [CrossRef]
- Grün, F.; Sailer, W.; Gódor, I. Visualization of the processes taking place in the contact zone with in-situ tribometry. Tribol. Int. 2012, 48, 44–53. [Google Scholar] [CrossRef]
- Rabinowicz, E. Friction and Wear of Materials, 2nd ed.; Wiley: New York, NY, USA, 1995; ISBN 9780471830849. [Google Scholar]
- Zhou, Z.R.; Fayeulle, S.; Vincent, L. Cracking behaviour of various aluminium alloys during fretting wear. Wear 1992, 155, 317–330. [Google Scholar] [CrossRef]
- Vincent, L.; Berthier, Y.; Godet, M. Testing Methods in Fretting Fatigue: A Critical Appraisal. In Standardization of Fretting Fatigue Test Methods and Equipment; Attia, H.M., Ed.; ASTM International: Philadelphia, PA, USA, 1992; pp. 33–48. ISBN 0-8031-1448-6. [Google Scholar]
Figure 1.
Absorption spectrum of the studied TPUs by FTIR: transmittance vs. wave number.

Figure 2.
Results from tribological tests.

Figure 3.
Micrographs of wear scars after tribological tests.

Figure 4.
Inner and outer rings of the wear scar.

Figure 5.
Hysteresis and Ft-D curves of the five TPUs in the partial slip regime.

Figure 6.
Micrographs of wear scars of the five TPUs (D = 0.1 mm, Fn = 28 N).

Figure 7.
Micrographs of wear scars of the five TPUs (D = 0.25 mm, Fn = 28 N).

Figure 8.
(a) SEM micrograph of wear scars determined for the following parameters: TPU_4, Fn = 28 N, D = 0.25 mm, f = 10 Hz, N = 104. Related areas are marked and shown with larger magnifications (b–d).
Figure 8.
(a) SEM micrograph of wear scars determined for the following parameters: TPU_4, Fn = 28 N, D = 0.25 mm, f = 10 Hz, N = 104. Related areas are marked and shown with larger magnifications (b–d).

Figure 9.
Hystereses and Ft-D curves of the five TPUs in the mixed fretting regime.

Figure 10.
Micrographs of wear scars of the five TPUs (D = 0.5 mm, Fn = 28 N).

Figure 11.
Magnification of the stick region of TPU_5.

Figure 12.
Shear stress distribution under a steady normal force and an oscillating tangential load of amplitude Ft [18].
Figure 12.
Shear stress distribution under a steady normal force and an oscillating tangential load of amplitude Ft [18].

Figure 13.
(a) SEM micrograph of wear scars determined for the following parameters: Fn = 28N, D = 0.5 mm, f = 10 Hz, N = 5 × 10³. Related areas are marked and shown with larger magnifications (b–d).
Figure 13.
(a) SEM micrograph of wear scars determined for the following parameters: Fn = 28N, D = 0.5 mm, f = 10 Hz, N = 5 × 10³. Related areas are marked and shown with larger magnifications (b–d).

Figure 14.
Profiles of wear scars of the five TPUs (D = 0.5 mm, Fn = 28 N, 8 × 10⁵ cycles).

Figure 15.
(a) SEM micrograph of wear scars determined for the following parameters: TPU_4, Fn = 28N, D = 0.5 mm, f = 10 Hz, N = 5 × 10³. Related areas are marked and shown with larger magnifications (b–d).
Figure 15.
(a) SEM micrograph of wear scars determined for the following parameters: TPU_4, Fn = 28N, D = 0.5 mm, f = 10 Hz, N = 5 × 10³. Related areas are marked and shown with larger magnifications (b–d).

Figure 16.
(a) SEM micrograph of wear scars determined for the following parameters: TPU_5, Fn = 28 N, D = 0.5 mm, f = 10 Hz, N = 5 × 10⁴. Related areas are marked and shown with larger magnifications (b–h).
Figure 16.
(a) SEM micrograph of wear scars determined for the following parameters: TPU_5, Fn = 28 N, D = 0.5 mm, f = 10 Hz, N = 5 × 10⁴. Related areas are marked and shown with larger magnifications (b–h).

Figure 17.
Hysteresis and Ft-D curves of the five TPUs in the gross slip regime.

Figure 18.
Micrographs of wear scars of the five TPUs (D = 1.0 mm, Fn = 28 N).

Figure 19.
Profiles of wear scars of the five TPUs (D = 1.0 mm, Fn = 28 N, 8 × 10⁵ cycles).

Figure 20.
(a) SEM micrograph of wear scars determined for the following parameters: TPU_2, Fn = 28 N, D = 1.0 mm, f = 10 Hz, N = 8 × 10⁵. Related areas are marked and shown with larger magnifications (b–h).
Figure 20.
(a) SEM micrograph of wear scars determined for the following parameters: TPU_2, Fn = 28 N, D = 1.0 mm, f = 10 Hz, N = 8 × 10⁵. Related areas are marked and shown with larger magnifications (b–h).

Figure 21.
(a) SEM micrograph of wear scars determined for the following parameters: TPU_4, Fn = 28N, D = 1.0mm, f = 10 Hz, N = 8 × 10⁵. Related areas are marked and shown with larger magnifications (b–h).
Figure 21.
(a) SEM micrograph of wear scars determined for the following parameters: TPU_4, Fn = 28N, D = 1.0mm, f = 10 Hz, N = 8 × 10⁵. Related areas are marked and shown with larger magnifications (b–h).

Figure 22.
(a) SEM micrograph of wear scars determined for the following parameters: TPU_5, Fn = 28 N, D = 1.0 mm, f = 10 Hz, N = 8 × 10⁵. Related areas are marked and shown with larger magnifications (b–j).
Figure 22.
(a) SEM micrograph of wear scars determined for the following parameters: TPU_5, Fn = 28 N, D = 1.0 mm, f = 10 Hz, N = 8 × 10⁵. Related areas are marked and shown with larger magnifications (b–j).

Figure 23.
Tangential force, normal force, and friction at the 8 × 10⁵ cycle of TPU_5 (28 N, 1.0 mm, 10 Hz).
Figure 23.
Tangential force, normal force, and friction at the 8 × 10⁵ cycle of TPU_5 (28 N, 1.0 mm, 10 Hz).

Figure 24.
Micrographs of wear scars of the five TPUs (D = 1.0 mm, Fn = 28 N, 104 cycles).

Figure 25.
Profiles of wear scars of the five TPUs (D = 1.0 mm, Fn = 28 N, 104 cycles).

Figure 26.
(a) SEM micrograph of wear scars determined for the following parameters: TPU_3, Fn = 28 N, D = 1.0 mm, f = 10 Hz, N = 104. Related areas are marked and shown with larger magnifications (b–h).
Figure 26.
(a) SEM micrograph of wear scars determined for the following parameters: TPU_3, Fn = 28 N, D = 1.0 mm, f = 10 Hz, N = 104. Related areas are marked and shown with larger magnifications (b–h).

Figure 27.
Micrographics of counterparts of TPU_4 and 5.

Figure 28.
Dissipated energy during the fretting tests with four different displacement amplitudes.

Figure 29.
Comparison of coefficient of friction and c/a in partial slip and mixed fretting regimes (Fn = 28 N, N = 105).
Figure 29.
Comparison of coefficient of friction and c/a in partial slip and mixed fretting regimes (Fn = 28 N, N = 105).

Figure 30.
Comparison of the COF in the gross slip regime ((Fn = 28 N, N = 105).

Figure 31.
Running condition fretting map of TPUs.


Table 1.
Material properties of the five thermoplastic polyurethane elastomers (TPUs).
| Material | Density (g/cm3) | Hardness | Thermal Conductivity (W/(m·K)) | Dynamic Mechanical Analysis (10 Hz) | ||
|---|---|---|---|---|---|---|
| Shore-D | E′ a (MPa) | E″ b (MPa) | Tan δ | |||
| TPU_1 | 1.192 | 47 | 0.199 | 93.8 | 12.3 | 0.131 |
| TPU_2 | 1.182 | 41 | 0.194 | 51.7 | 5.6 | 0.108 |
| TPU_3 | 1.193 | 44 | 0.206 | 64.4 | 10.5 | 0.163 |
| TPU_4 | 1.176 | 40 | 0.194 | 48.0 | 4.0 | 0.083 |
| TPU_5 | 1.135 | 40 | 0.198 | 56.3 | 7.0 | 0.124 |
a storage modulus; b loss modulus.
Table 2.
Test parameters for fretting.
| Displacement Amplitude (mm) | Normal Load (N) | Frequency (Hz) | Number of Cycles |
|---|---|---|---|
| 0.1, 0.25, 0.5, 1.0 | 20, 28, 48 | 10 | 8 × 10⁵ |
© 2019 by the authors. Licensee MDPI, Basel, Switzerland. This article is an open access article distributed under the terms and conditions of the Creative Commons Attribution (CC BY) license (http://creativecommons.org/licenses/by/4.0/).
Share and Cite
MDPI and ACS Style
Wang, C.; Hausberger, A.; Berer, M.; Pinter, G.; Grün, F.; Schwarz, T. Fretting Behavior of Thermoplastic Polyurethanes. Lubricants 2019, 7, 73. https://doi.org/10.3390/lubricants7090073
AMA Style
Wang C, Hausberger A, Berer M, Pinter G, Grün F, Schwarz T. Fretting Behavior of Thermoplastic Polyurethanes. Lubricants. 2019; 7(9):73. https://doi.org/10.3390/lubricants7090073
Chicago/Turabian StyleWang, Chao, Andreas Hausberger, Michael Berer, Gerald Pinter, Florian Grün, and Thomas Schwarz. 2019. "Fretting Behavior of Thermoplastic Polyurethanes" Lubricants 7, no. 9: 73. https://doi.org/10.3390/lubricants7090073
Note that from the first issue of 2016, this journal uses article numbers instead of page numbers. See further details here.