Early Detection and Identification of Fatigue Damage in Thrust Ball Bearings by an Acoustic Emission Technique


Department of Mechanical Engineering, Saitama Institute of Technology, 1690 Fusaiji, Fukaya, Saitama 369-0293, Japan
Lubricants 2020, 8(3), 37; https://doi.org/10.3390/lubricants8030037
Submission received: 20 February 2020
/
Revised: 19 March 2020
/
Accepted: 23 March 2020
/
Published: 24 March 2020
(This article belongs to the Special Issue Acoustic Emission Techniques in Wear Monitoring)
Abstract
:As rolling bearings are widely used in various machines, there is a strong need to detect any problems as early as possible. Although vibration analysis is commonly used in the diagnosis of rolling bearings, it is possible that the failure of such bearings might be detected earlier by an acoustic emission (AE) technique. Methods for detecting potential fatigue damage in a thrust ball bearing by AE signal analysis and by vibration analysis were compared. For the AE signal analysis, the maximum amplitude and the frequency spectrum were used to detect and identify fatigue damage in the bearing. Features of AE signals detected when a defect was artificially formed on the raceway surface of a bearing by using a Vickers hardness tester were also examined. The AE technique detected initial cracks due to fatigue damage earlier than the vibration technique. Additionally, AE signals were always detected during bearing fatigue tests, but the AE signals detected during the running-in process, crack initiation, crack propagation, and flaking all contained different frequency components. Furthermore, the correlation map between the frequency spectra of AE signals and deformation and fracture phenomena (friction and wear modes) was updated by adding the new findings of this study.
1. Introduction
Thrust ball bearings are used worldwide in automobiles, aircraft, machine tools, and home appliances. In service, fatigue accumulates inside the materials of these bearings, causing minute internal cracks to form. These cracks propagate until they eventually reach the surface and expand, causing damage in whichever part of the material in the surface of the bearing peels off. A bearing that shows such peeling damage has reached its end of lifetime and requires replacement by a new one. Therefore, the lifetime of a rolling bearing is defined as the time until rolling fatigue results in flaking of the contact surface between the inner or outer ring and the rolling elements. However, bearings incorporated in actual machines can be damaged as a result of inadequate lubrication before flaking occurs, and might become unusable as a result. In addition, intrusion of foreign matter might cause damage to the rolling contact surface, resulting in disruption of the oil film and causing large local stresses and partial plastic deformation of the raceway surface. In general, the surface of machine elements is mechanically affected by machining, unlike the deeper parts of the material. Consequently, the surface of the material is susceptible to chemical influences in the environment such as air, lubricants, and moisture. In such cases, initial cracks originating from surface damage might form at an early stage [1]. Therefore, early detection of fatigue damage is vital if normal operation of a machine is to be maintained.
A technique based on vibration has conventionally been used to detect and diagnose damage to bearings [2]. However, this technique does not provide enough information to permit damage prediction, because it can only detect problems at a terminal stage such as when flaking or peel expansion occurs, as shown in Figure 1. On the other hand, an acoustic emission (AE) technique, which can directly evaluate friction and wear, is considered to be very effective in diagnosing the lifetimes of bearings. The AE technique is a diagnostic technique for detecting potential wear that involves analysis of elastic stress waves that occur when strain energy stored in a material is released as the material is deformed or fractured. Unlike the vibration technique, the AE technique can detect plastic deformations of surfaces and crack initiation during their incubation periods. The AE technique is therefore suitable for predicting the fatigue of bearings and for evaluating the mode of damage. Several studies have been conducted on the diagnosis of abnormalities in rolling bearings and in bearing steels by using the AE technique [3,4,5,6,7,8,9]. However, most of these were based on a comparison between the operating time of the rolling bearing and changes in AE signals. As a result, it is difficult to clearly understand the cause of the abnormalities that occurred in the rolling bearings during the fatigue process.
In this study, the AE technique was used to evaluate the sliding state of thrust ball bearings typical of those used in many mechanical systems. In addition, a fatigue test was performed on a thrust ball bearing with the aim of comparing predictions of flaking of the bearing from the results of both AE and vibration measurements. By comparing the changes in both sets of measurements, the effectiveness of the AE technique for diagnosing bearing abnormalities was examined. Furthermore, to examine the features of the frequency spectrum of the AE signals during the fatigue process for bearings, the AE signals detected when a defect was artificially induced on the raceway surface of the bearing with a Vickers hardness tester were analyzed. The characteristics of the frequency spectrum of the AE signal waveform detected during the bearing fatigue test and the indentation experiment are reported. By clarifying the relationship between the cause of the abnormalities that occurred in the rolling bearings during the fatigue process and the AE signals, the AE technique can be applied not only to detect the fatigue damage, but also to evaluate the effect of lubricants to the fatigue process in more detail.
2. Experiments
2.1. Bearing Fatigue Test
Figure 2 is a photograph of the bearing fatigue tester that was used in the bearing fatigue test. Figure 3 is a schematic representation of the bearing fatigue tester and the measuring system. A small wideband-type AE sensor (AE-900M-WB: NF Corp., Yokohama, Japan) was used in this study. The AE sensor was installed onto the holder near the bearing-installation section, so that elastic waves generated by rolling friction could be detected with high sensitivity. The AE amplification factor was set to 70 dB by a preamplifier (AE-912: NF Corp., Yokohama, Japan) and a main amplifier, and the background noise was eliminated by using a 20 kHz high-pass filter with a discriminator (AE9922: NF Corp.). A vibration sensor (GH-313A: Keyence Corp., Osaka, Japan) with a minimum detected acceleration of 0.98 m/s2 was installed near the AE sensor. Changes in amplitude of the AE signal were evaluated by using the envelope detection waveform from which the amplitude of the background noise component was subtracted. To examine changes in the frequency spectrum of the AE signal waveforms during the fatigue process in the rolling bearing, the AE signal waveforms were recorded by using a high-speed waveform digitizer and subjected to a fast Fourier transform.
In this study, a thrust ball bearing 51205 (number of rolling elements: five, outer diameter: 47 mm, inner diameter: 25 mm, height: 15 mm) was used. A load of 9800 N was applied, and the spindle speed was set to 800 rpm. The tests were conducted in a bath of turbine oil of viscosity grade 46, the specifications of which are listed in Table 1. The oil temperature was about 40 °C. Viscosity grade 46 was chosen on the basis of the oil temperature, the rotation speed, and nature of the bearing used in the tests. When vibration increased as a result of peeling and damage caused by a large flaw in the bearing, the bearing fatigue tester was stopped and the test was ended.
2.2. Indentation Test
In the indentation test, a Vickers hardness tester was used to analyze the AE signal measured when an indentation was artificially created on the bearing raceway. The AE sensor was installed behind the bearing raceway. The AE measuring system had the same configuration as that shown in Figure 3. The AE amplification factor was set to 90 dB, and noise was eliminated by using a 20 kHz high-pass filter. Here, the indenter indentation load was 9.8 N or 98 N, and the holding time was 30 s. The lubricating oil present between the indenter and the bearing raceway surface was the same as that used during the fatigue test.
3. Results and Discussion
3.1. Changes near the Start of the Bearing Fatigue Test
Flaking of the thrust ball bearing shaft washer occurred approximately 306 h after the start of the bearing fatigue test. Immediately thereafter, the test was interrupted, and the shaft washer was replaced with a new one. The test was then restarted, and 383 h after the test began, that is, about 80 h after the shaft washer had been replaced, flaking of the housing washer was confirmed. The bearing fatigue test was ended when flaking on both the shaft washer and the housing washer was confirmed.
As the experiment required a long time, of the order of 400 h, only the experimental results identified as noteworthy are described below. Figure 4 shows the changes in amplitude of the AE signal (envelope detection waveform) and the vibration signal during the period from 6 to 10 h after the start of the bearing fatigue test. During this initial stage, there were no significant changes in the amplitude of either the AE signal or the vibration signal. Therefore, the lubrication conditions were ideal and no damage occurred. Figure 5 shows a typical AE signal waveform detected during this time period, together with the results of a frequency analysis. In the frequency analysis, a primary frequency peak appeared below 0.1 MHz. Since such a periodic wave of low frequency without distortion, as shown in Figure 5a, can be observed when a material surface is hit by hammering, it can be said that pure rolling contact and friction occurred between the surfaces. Throughout the experiments, as shown in Figure 5b, only the frequency peak below 0.1 MHz was observed during the initial stages of the tests, corresponding to the normal operating state.
Next, Figure 6 and Figure 7 show the results recorded around 50 h after the start of the bearing fatigue test. Although no significant changes were observed in the vibration measurements, the amplitude of the AE signal showed a slight increase when compared with its initial value. This is considered to be the result of a decrease in the viscosity and thickness of the oil film as its temperature increased, and the consequent change in the contact state. This trend was observed several times during the test. Both amplitudes of the AE signal and vibration signal were slightly larger than those in Figure 4. It especially seems from Figure 6a that small burst-type AE signals were frequently detected. Additionally, the AE signal waveform in Figure 7a was distorted compared with that in Figure 5a. In the frequency analysis results shown in Figure 7, a primary peak appeared at a frequency below 0.1 MHz, similar to that seen in the experimental results shown in Figure 5b. Moreover, small peaks were also observed at frequencies between 0.15 and 0.35 MHz.
Figure 8 shows micrographs of the raceway surface of the thrust ball bearing before the test and after 50 h of testing. A track deformed by rolling friction with the balls could be observed on the bearing raceway surface after 50 h of testing. Therefore, the large peak below a frequency of 0.1 MHz is considered to be due to a pure rolling contact without damage (i.e., contact and plastic flow of surface asperities during the running-in process of the bearing raceway surface). The small peaks observed at frequencies between 0.15 and 0.35 MHz were considered to be due to the formation of microscopic defects beneath the bearing raceway surface.
3.2. Changes When Flaking Occurred in the Shaft Washer
Figure 9 shows the changes in amplitudes of the AE signal and vibrations at about 150 h after the start of the bearing fatigue test. The fluctuation in the amplitude of the AE signals appeared to be smaller than that in the initial stages; this was caused by progression of plastic deformation on the bearing raceway surface, as shown in Figure 4, because the fluctuation in the amplitude of the AE signals was related to the surface roughness [10]. Large burst-type AE signals were detected infrequently after about 152 h. However, no marked change in vibration occurred at this point. Figure 10 shows a typical AE signal waveform obtained after 152 h, together with its frequency spectrum. From the results of this frequency analysis, it was confirmed that large peaks appear not only at frequencies below 0.1 MHz, but also at about 0.3 MHz. It is likely that this peak at a frequency of around 0.3 MHz was caused by crack initiation on the bearing raceway surface.
Figure 11 shows changes in the amplitudes of the AE signal and vibrations about 300 h after the start of the bearing fatigue test. Although large burst-type AE signals were frequently detected after about 299 h, the vibration signal still did not change markedly. Figure 12 shows a typical AE signal waveform obtained after 300 h, together with its frequency spectrum. The results of this frequency analysis confirmed that large peaks appeared at frequencies of about 0.15 to 0.4 MHz, which were not present at the beginning of the test. Furthermore, the magnitudes of the peaks at about 0.15 to 0.4 MHz were larger than those in Figure 10.
Approximately 306 h after the start of the test, upon detection of a large vibration, the machine’s stopping device was activated and operation was stopped. Removal of the shaft washer and examination of the raceway surface confirmed the presence of flaking on the surface of the bearing raceway. Figure 13 shows the changes in amplitudes of the AE signal and vibration signal at about this time. Large burst-type AE signals with an amplitude of more than 1.5 V were detected between 303 and 304 h and immediately before the stop, but a vibration signal was detected only immediately before the stop. Figure 14 shows a typical AE signal waveform corresponding to a large burst-type AE signal at around 303 h, together with its frequency spectrum. This frequency analysis confirmed that peaks appeared not only at a frequency of around 0.1 MHz, but also at about 0.15 to 0.4 MHz. Moreover, in a study on the detection of rolling fatigue of the coating film of a rolling bearing by using the AE technique, the presence of a frequency component at around 0.35 MHz caused by fracture and peeling of the surface coating has been previously confirmed [11].
Figure 15 shows micrographs of the bearing raceway surface before (at about 300 h) and after (at about 306 h) the appearance of flaking on the shaft washer of the thrust ball bearing. The micrograph of the raceway surface presented in Figure 15a showed no significant change compared with the previous raceway surface, indicating that a satin-finished surface was formed over the entire friction track. On the other hand, in Figure 15b, flaking can be observed to have occurred at the center of the raceway surface.
Figure 16 shows the change in the frequencies of the AE signal waveforms at various times until flaking occurred in the shaft washer. A frequency peak at around 0.1 MHz, generated due to pure rolling contact, is apparent from the initial stages. The magnitude of frequency peaks at about 0.15 to 0.4 MHz gradually became large as the fatigue damage progressed. A shift in the primary frequency to around 0.3 MHz occurred from 300 h. It is considered that a low frequency AE signal is effective for the evaluation of the running-in process and a high frequency AE signal is effective for the early detection of fatigue damage.
3.3. Changes When Flaking Occurred in the Housing Washer
When the shaft washer was confirmed to show flaking, it was replaced and the test was continued. About 80 h later, vibration gradually started to increase until large-amplitude vibrations were detected and the stopping device of the bearing fatigue tester was activated, ending the test. When the housing washer was removed and examined, flaking of the raceway surface was confirmed to have occurred.
Figure 17 shows the changes in amplitudes of the AE signal and the vibration signal immediately before the bearing fatigue tester stopped. Large burst-type AE signals were detected shortly after 380 h, but the amplitude of the vibration greatly increased at 383 h, immediately before stopping. Figure 18 shows a typical AE signal waveform obtained just before the test stopped at 383 h, together with its frequency spectrum. This frequency analysis confirmed that large peaks appeared at around 0.2 MHz.
Figure 19 shows micrographs of the housing washer of the thrust ball bearing. Flaking and consequent peeling off the surface layer can be observed at the center of the friction track. Therefore, the peaks in the frequency region of about 0.15 to 0.4 MHz were considered to be due to the occurrence of flaking.
Figure 20 shows the change in the frequencies of the AE signal waveforms at various times until flaking occurred in the housing washer. As for when flaking occurred in the housing washer, the change in the frequencies was basically the same as that in the shaft washer, as shown in Figure 16. However, the magnitude of frequency peaked at about 0.3 MHz. A shift in the primary frequency, not to 0.3 MHz but to around 0.2 MHz, occurred from 370 h, although a large frequency peak at about 0.3 MHz also existed. Comparing the surface observations after flaking in Figure 15 and Figure 19, the difference in the high frequency peak may be related to the mode of crack initiation and its size. As discussed above, with the bearing damage, high frequency peaks started to appear in the AE spectra. Since various secondary AE events are generated during crack propagation [12], the frequency spectrum may be complicated. Nevertheless, it is considered to be related to the nucleation of small defects whose size is proportional to the frequency because the AE spectra are accurate against deformation and fracture phenomena. In order to yield any findings about the frequency spectra, further experiments and consideration will be needed to interpret the numerical data obtained from this study.
3.4. Confirmation of the Acoustic Emission (AE) Frequency by an Indentation Test
Figure 21 shows the frequency spectrum of the AE signal waveforms obtained from indentation tests performed at two different applied loads. As shown in Figure 21a, when a low load was applied, a primary peak appeared at a frequency below 0.1 MHz; however, as shown in Figure 21b, when a high load was applied, in addition to the peak at a frequency below 0.1 MHz, another peak appeared at around 0.2 MHz. In both cases, the peak at about 0.1 MHz was considered to be related to plastic flow due to contact and friction between the indenter and the bearing race surface. This is similar to the feature in the AE frequency observed in the initial stages (normal state) of the bearing-fatigue test, as described in Section 3.1. This is because the collision (contact) and plastic flow of surface asperities also occur in the running-in process. A peak with a similar frequency has been confirmed to occur during sliding friction without wear [13,14]. In addition, microcracks might form at the corners of the indentation under a high applied load, so the peaks in the 0.2 to 0.3 MHz frequency region can be attributed to the generation and propagation of cracks in bearings. Similar features have been observed in other fatigue tests [15].
3.5. Early Detection and Identification of Fatigue Damage by Using the AE Technique
For the purposes of this study, it was considered that the fatigue process during the lifetime of a bearing can be divided roughly into three stages: running-in of the bearing raceway surface, initiation and propagation of cracks in the surface, and the occurrence of flaking. In the AE technique, each of these three stages can be identified from changes in the amplitude and frequency spectrum of the AE signals, whereas in the vibration technique, no significant change occurred until just before the end of the lifetime of the bearing as a result of flaking. The AE technique is therefore a much more effective method for the early detection of failure compared with conventional diagnostic techniques such as vibration analysis.
As proposed in a previous study [16], the correlation map between the frequency spectra of AE signals and deformation and fracture phenomena (friction and wear modes) provides a very powerful tool for identifying and evaluating complex tribological phenomena. Consequently, the correlation map was updated to include the results of the present study, as shown in Figure 22. Here, the amplitude of the AE signal shown on the vertical axis is not an absolute value because many factors such as the AE measuring system and measurement conditions affect the sensitivity of detection. However, the trends in the frequency spectrum of the AE signal waveform are markedly dependent on the deformation and fracture phenomena rather than on the experimental conditions, because the velocity and scale of the phenomena chiefly decide the shape of the AE waveform (i.e., the feature of the frequency spectrum) [17,18]. Although the position of a peak in the frequency spectrum of the AE signals was slightly shifted, similar trends in the frequency spectrum to those observed in this study have been confirmed in an experimental study using a deep-groove ball bearing [19].
It follows from the above that fatigue damage in rolling bearings can be evaluated and identified from the AE signal component that corresponds to each deformation and fracture phenomenon. With regard to the early detection of fatigue damage by using the AE technique, it is possible to detect the occurrence of fatigue damage in a bearing raceway surface from measurements of the AE signal component between 0.15 to 0.4 MHz. Additionally, it might be possible to evaluate the running-in process of a bearing raceway surface by measuring the AE signal component below 0.1 MHz. Moreover, since the oil film thickness and the reaction film formation by additives can be identified using the AE technique [20,21], the lubrication performance of lubricants for the fatigue damage could be evaluated from the frequency component of the AE signals, its magnitude, and the detection time.
4. Conclusions
In this study, the early detection of the fatigue damage of thrust ball bearings by using the AE technique was examined through the frequency analysis of AE signal waveforms recorded during a fatigue test and an indentation test. The results obtained are as follows.
- (1)
- Both the amplitude and the frequency spectrum of the AE signal waveform changed in response to damage at the surface of the bearing raceway during the bearing fatigue test.
- (2)
- In the frequency spectrum of the AE signal waveforms recorded during the initial stages of the bearing fatigue test, a primary peak appeared at a frequency of 0.1 MHz or less; this was caused by collisions (contact) and plastic flow of surface asperities in the running-in process of the bearing raceway surface.
- (3)
- A burst-type AE signal was detected when a crack formed inside the bearing sometime after the start of the bearing fatigue test. The frequency component of this AE signal showed peaks between 0.15 and 0.4 MHz.
- (4)
- A sudden rise in the AE signal amplitude was observed when a crack propagated or expanded inside the bearing, but the vibration technique did not capture these changes. The AE technique is therefore a powerful tool for the early detection and identification of fatigue processes.
- (5)
- In the indentation test, in which surface damage was artificially induced on the bearing raceway surface, it was confirmed that on applying a low load, a frequency peak associated with plastic flow appeared below 0.1 MHz and that on applying a high load, a frequency peak associated with crack initiation appeared at around 0.2 MHz.
Funding
This research received no external funding.
Acknowledgments
The author is deeply indebted to Tatsuo Ohmori, an assistant professor of Chiba University, for his helpful advice and cooperation in the bearing fatigue tests. In addition, the author thanks Yoshifumi Tonami, a student of Chiba University when the experiments were performed, for his assistance.
Conflicts of Interest
The authors declare no conflict of interest.
References
- Furumura, K.; Shirota, S.; Hirakawa, K. The Sub-Surface-Initiated and the Surface-Initiated Rolling Fatigue Life of Bearing Steels. In Proceedings of the JSLE-ASLE International Conference on Lubrication, Tokyo, Japan, 9–11 June 1975; pp. 475–483. [Google Scholar]
- Moubray, J. Reliability-Centered Maintenance, 2nd ed.; Butterworth Heinemann: Oxford, UK, 1997; pp. 11–14. [Google Scholar]
- Yoshioka, T.; Mano, H. Relationship between Acoustic Emission Source Position and Spalling Position in Radial Rolling Bearings. Tribol. Ser. 1998, 34, 413–422. [Google Scholar] [CrossRef]
- Mano, H.; Yoshioka, T.; Korenaga, A.; Yamamoto, T. Relationship between Growth of Rolling Contact Fatigue Cracks and Load Distribution. Tribol. Trans. 2000, 43, 367–376. [Google Scholar] [CrossRef]
- Manes, L.; De Monicault, J.-M.; Gras, R. Monitoring Damage by Acoustic Emission in Bearing Steels in Cryogenic Environment. Tribol. Int. 2001, 34, 247–253. [Google Scholar] [CrossRef]
- Sun, J.; Wood, R.J.K.; Wang, L.; Care, I.; Powrie, H.E.G. Wear Monitoring of Bearing Steel Using Electrostatic and Acoustic Emission Techniques. Wear 2005, 259, 1482–1489. [Google Scholar] [CrossRef]
- Li, X.; Zhang, W.; Ding, Q. Understanding and Improving Deep Learning-Based Rolling Bearing Fault Diagnosis with Attention Mechanism. Signal Process. 2019, 161, 136–154. [Google Scholar] [CrossRef]
- Martin-del-Campo, S.; Schnabel, S.; Sandin, F.; Marklund, P. Detection of Particle Contaminants in Rolling Element Bearings with Unsupervised Acoustic Emission Feature Learning. Tribol Int. 2019, 132, 30–38. [Google Scholar] [CrossRef]
- Jantara, V.L., Jr.; Papaelias, M.; Dong, H. Damage Monitoring of Surface Treated Steel under Severe Rolling Contact Loading Conditions. Tribol. Int. 2020, 146, 106257. [Google Scholar] [CrossRef]
- Hase, A.; Wada, M.; Mishina, H. The Relationship between Acoustic Emissions and Wear Particles for Repeated Dry Rubbing. Wear 2008, 265, 831–839. [Google Scholar] [CrossRef]
- Zhang, Z.-Q.; Li, G.-L.; Wang, H.-D.; Xu, B.-S.; Piao, Z.-Y.; Zhu, L.-N. Investigation of Rolling Contact Fatigue Damage Process of the Coating by Acoustics Emission and Vibration Signals. Tribol. Int. 2012, 47, 25–31. [Google Scholar] [CrossRef]
- Scruby, C.B. An Introduction to Acoustic Emission. J. Phys. E Sci. Instrum. 1987, 20, 946–953. [Google Scholar] [CrossRef]
- Hase, A.; Wada, M.; Mishina, H. Scanning Electron Microscope Observation Study for Identification of Wear Mechanism Using Acoustic Emission Technique. Tribol. Int. 2014, 72, 51–57. [Google Scholar] [CrossRef]
- Ferrer, C.; Salas, F.; Pascual, M.; Orozco, J. Discrete Acoustic Emission Waves during Stick-Slip Friction between Steel Samples. Tribol. Int. 2010, 43, 1–6. [Google Scholar] [CrossRef]
- Chang, H.; Han, E.H.; Wang, J.Q.; Ke, W. Acoustic Emission Study of Fatigue Crack Closure of Physical Short and Long Cracks for Aluminum Alloy LY12CZ. Int. J. Fatigue 2009, 31, 403–407. [Google Scholar] [CrossRef]
- Hase, A.; Mishina, H.; Wada, M. Correlation between Features of Acoustic Emission Signals and Mechanical Wear Mechanisms. Wear 2012, 292–293, 144–150. [Google Scholar] [CrossRef]
- Hase, A.; Mishina, H.; Wada, M. Fundamental Study on Early Detection of Seizure in Journal Bearing by Using Acoustic Emission Technique. Wear 2016, 346–347, 132–139. [Google Scholar] [CrossRef]
- Hase, A.; Mishina, H. Identification of Micro Tribological Phenomena on Metal Surfaces by SPM-AE In Situ Measurement. In Proceedings of the 44th Leeds–Lyon Symposium on Tribology, Lyon, France, 4–6 September 2017; p. 21. [Google Scholar]
- Hase, A. In Situ Measurement of Wear Process Using Acoustic Emission Technique. In Proceedings of the International Tribology Conference Sendai 2019, Sendai, Japan, 17–21 September 2019. 17-A-11. [Google Scholar]
- Boness, R.J.; McBride, S.L. Adhesive and Abrasive Wear Studies Using Acoustic Emission Techniques. Wear 1991, 149, 41–53. [Google Scholar] [CrossRef]
- Goto, R.; Morita, M.; Konishi, T.; Onodera, K.; Sato, T.; Hase, A. Chemical Reaction Analysis of Phosphorus Type Additives with AE Measurement. In Proceedings of the JAST Tribology Conference, Tokyo, Japan, 20–22 May 2019. D5. [Google Scholar]
Figure 1.
Differences in the detection range between the acoustic emission (AE) technique and the vibration technique.
Figure 1.
Differences in the detection range between the acoustic emission (AE) technique and the vibration technique.

Figure 2.
Appearance of the experimental setup for the bearing fatigue test.

Figure 3.
Schematic representations of the experimental setup and the measurement system for the bearing fatigue test.
Figure 3.
Schematic representations of the experimental setup and the measurement system for the bearing fatigue test.

Figure 4.
Changes in the AE signal and the vibrational acceleration up to 10 h from the start of the rolling fatigue test: (a) AE envelope signal; (b) amplitude of vibration.
Figure 4.
Changes in the AE signal and the vibrational acceleration up to 10 h from the start of the rolling fatigue test: (a) AE envelope signal; (b) amplitude of vibration.

Figure 5.
Typical AE signal waveform detected at about 8 h and its frequency spectrum: (a) AE signal waveform; (b) frequency spectrum.
Figure 5.
Typical AE signal waveform detected at about 8 h and its frequency spectrum: (a) AE signal waveform; (b) frequency spectrum.

Figure 6.
Changes in the AE signal and the vibrational acceleration at about 50 h from the start of the rolling fatigue test: (a) AE envelope signal; (b) amplitude of vibration.
Figure 6.
Changes in the AE signal and the vibrational acceleration at about 50 h from the start of the rolling fatigue test: (a) AE envelope signal; (b) amplitude of vibration.

Figure 7.
Typical AE signal waveform detected at about 50 h and its frequency spectrum: (a) AE signal waveform; (b) frequency spectrum.
Figure 7.
Typical AE signal waveform detected at about 50 h and its frequency spectrum: (a) AE signal waveform; (b) frequency spectrum.
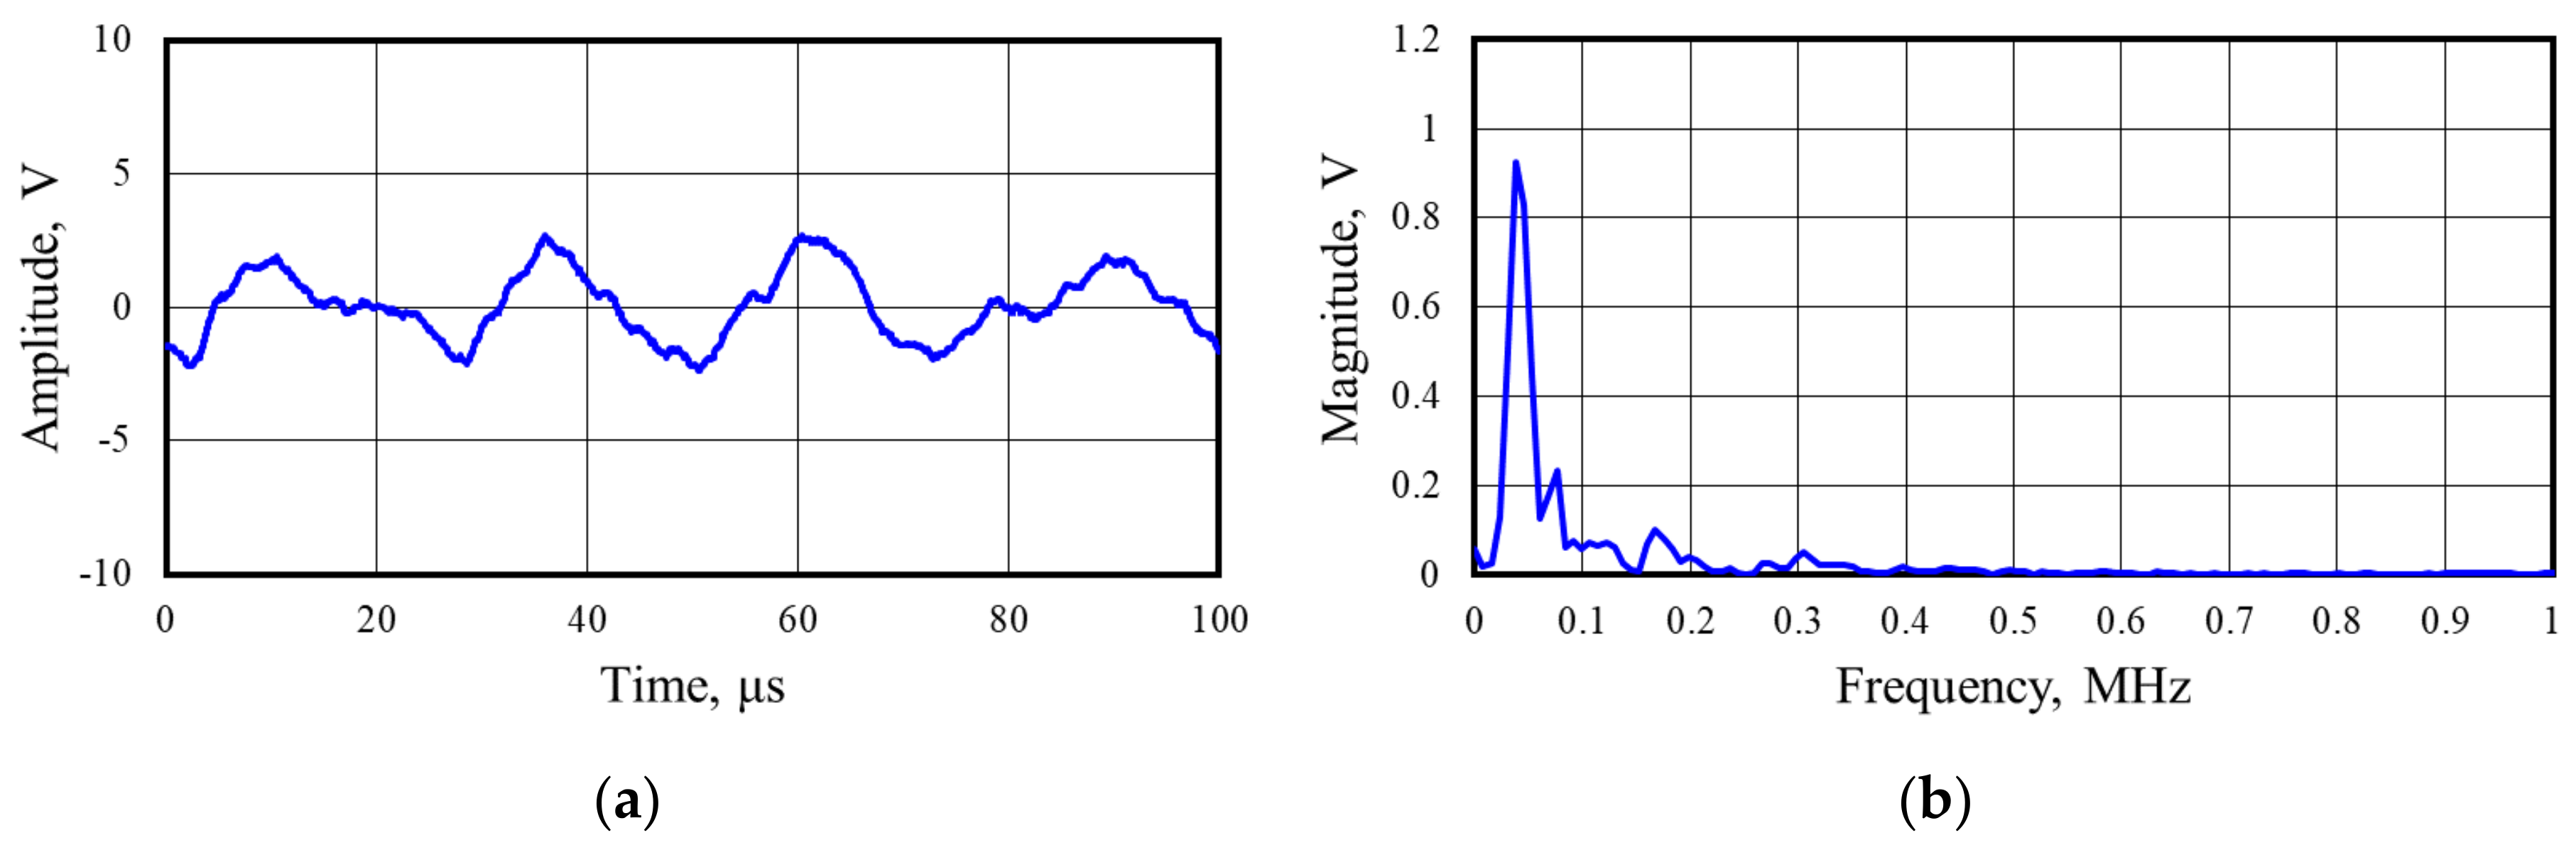
Figure 8.
Micrographs of the raceway surface of the bearing (shaft washer): (a) before the test; (b) after 50 h.
Figure 8.
Micrographs of the raceway surface of the bearing (shaft washer): (a) before the test; (b) after 50 h.
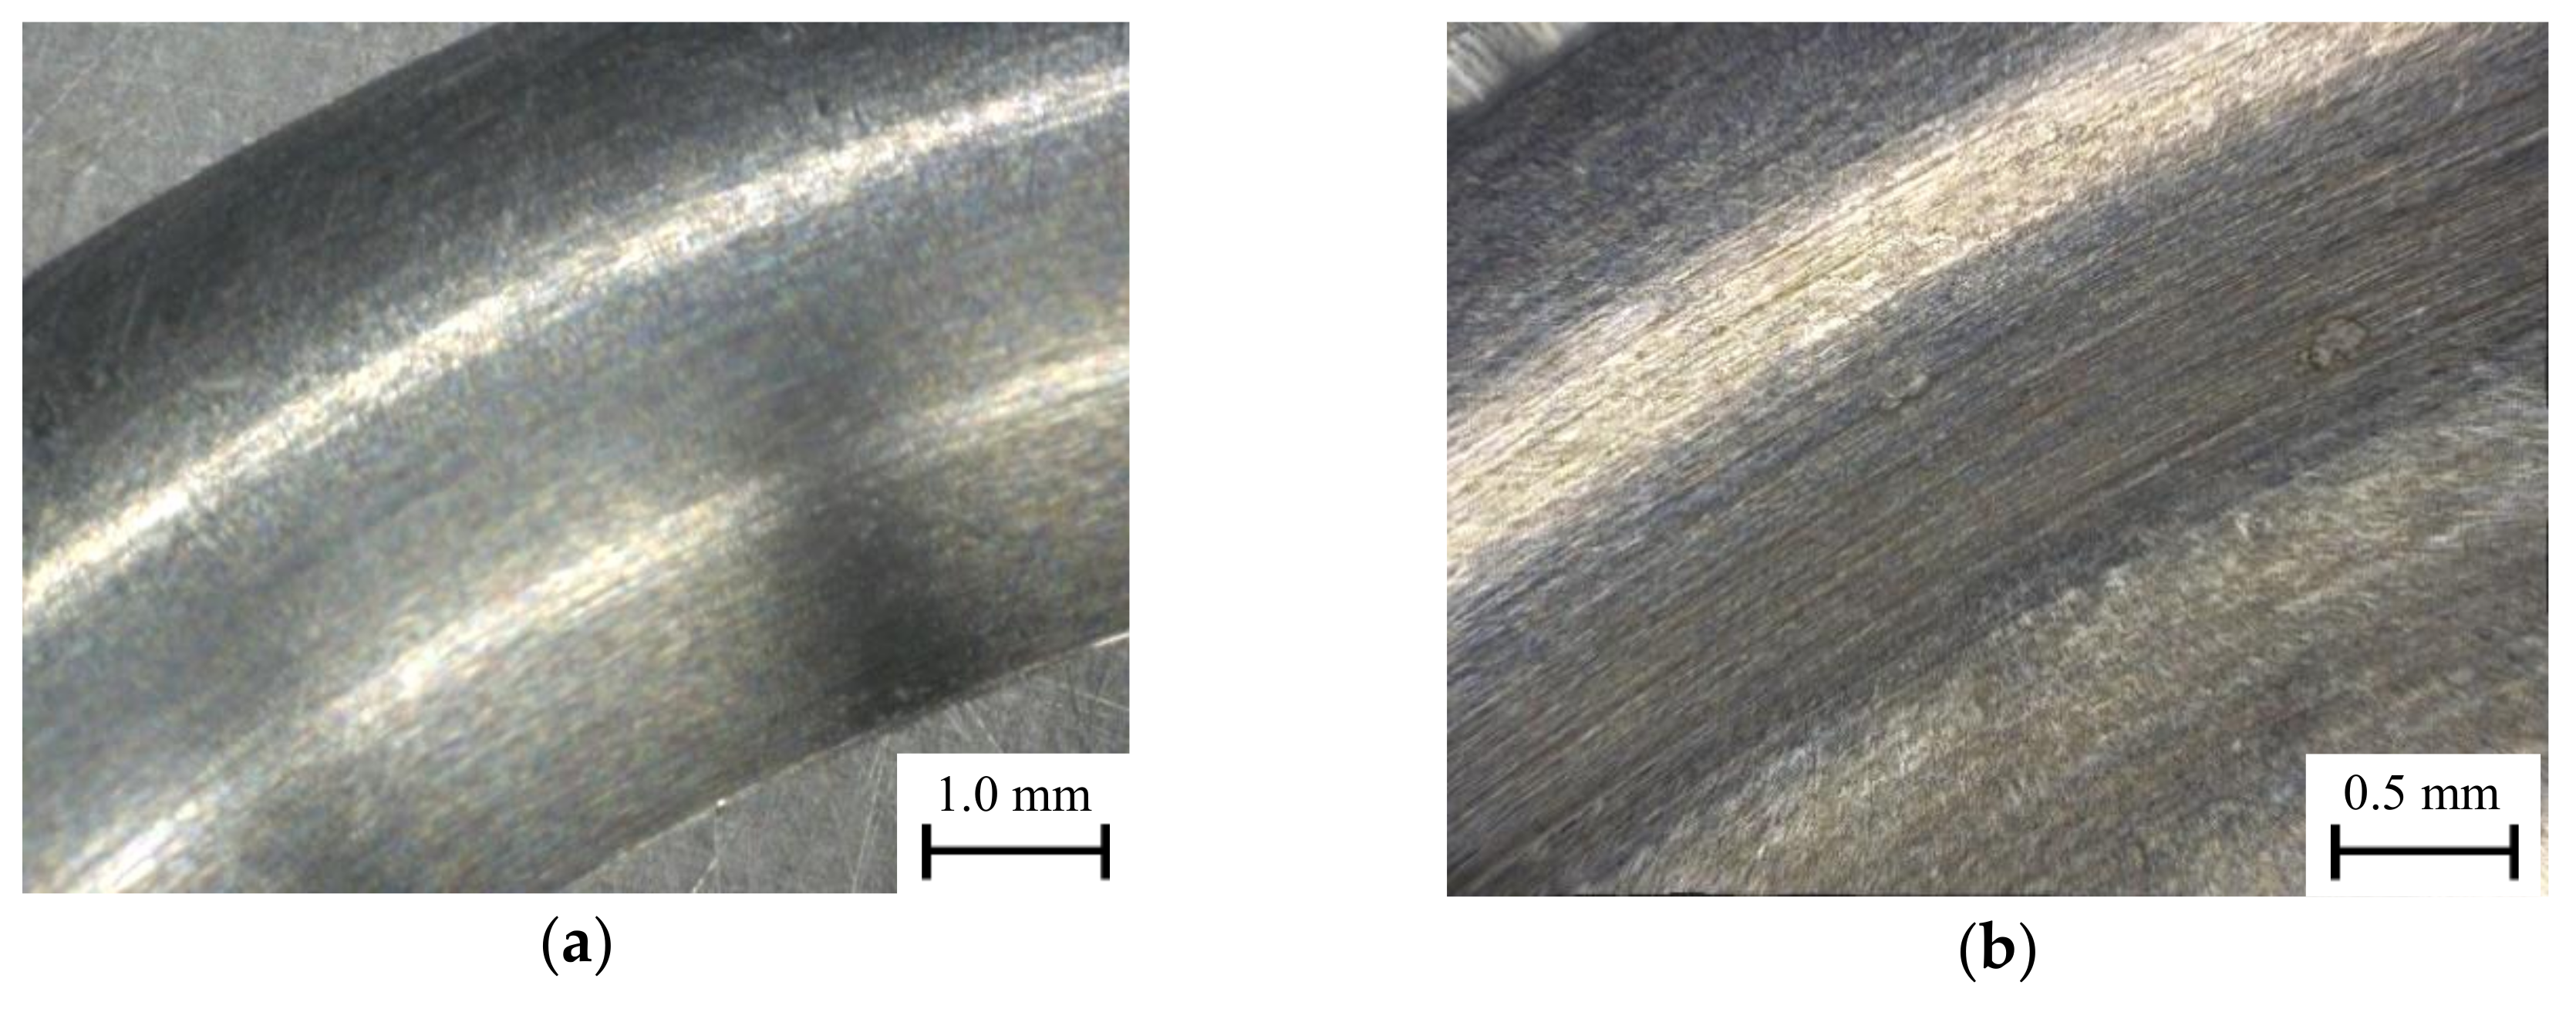
Figure 9.
Changes in the AE signal and the vibrational acceleration about 150 h after the start of the rolling fatigue test: (a) AE envelope signal; (b) amplitude of vibration.
Figure 9.
Changes in the AE signal and the vibrational acceleration about 150 h after the start of the rolling fatigue test: (a) AE envelope signal; (b) amplitude of vibration.

Figure 10.
Typical AE signal waveform detected at around 152 h and its frequency spectrum: (a) AE signal waveform; (b) frequency spectrum.
Figure 10.
Typical AE signal waveform detected at around 152 h and its frequency spectrum: (a) AE signal waveform; (b) frequency spectrum.

Figure 11.
Changes in the AE signal and the vibrational acceleration about 300 h after the start of the rolling fatigue test: (a) AE envelope signal; (b) amplitude of vibration.
Figure 11.
Changes in the AE signal and the vibrational acceleration about 300 h after the start of the rolling fatigue test: (a) AE envelope signal; (b) amplitude of vibration.

Figure 12.
Typical AE signal waveform detected at around 300 h and its frequency spectrum: (a) AE signal waveform; (b) frequency spectrum.
Figure 12.
Typical AE signal waveform detected at around 300 h and its frequency spectrum: (a) AE signal waveform; (b) frequency spectrum.
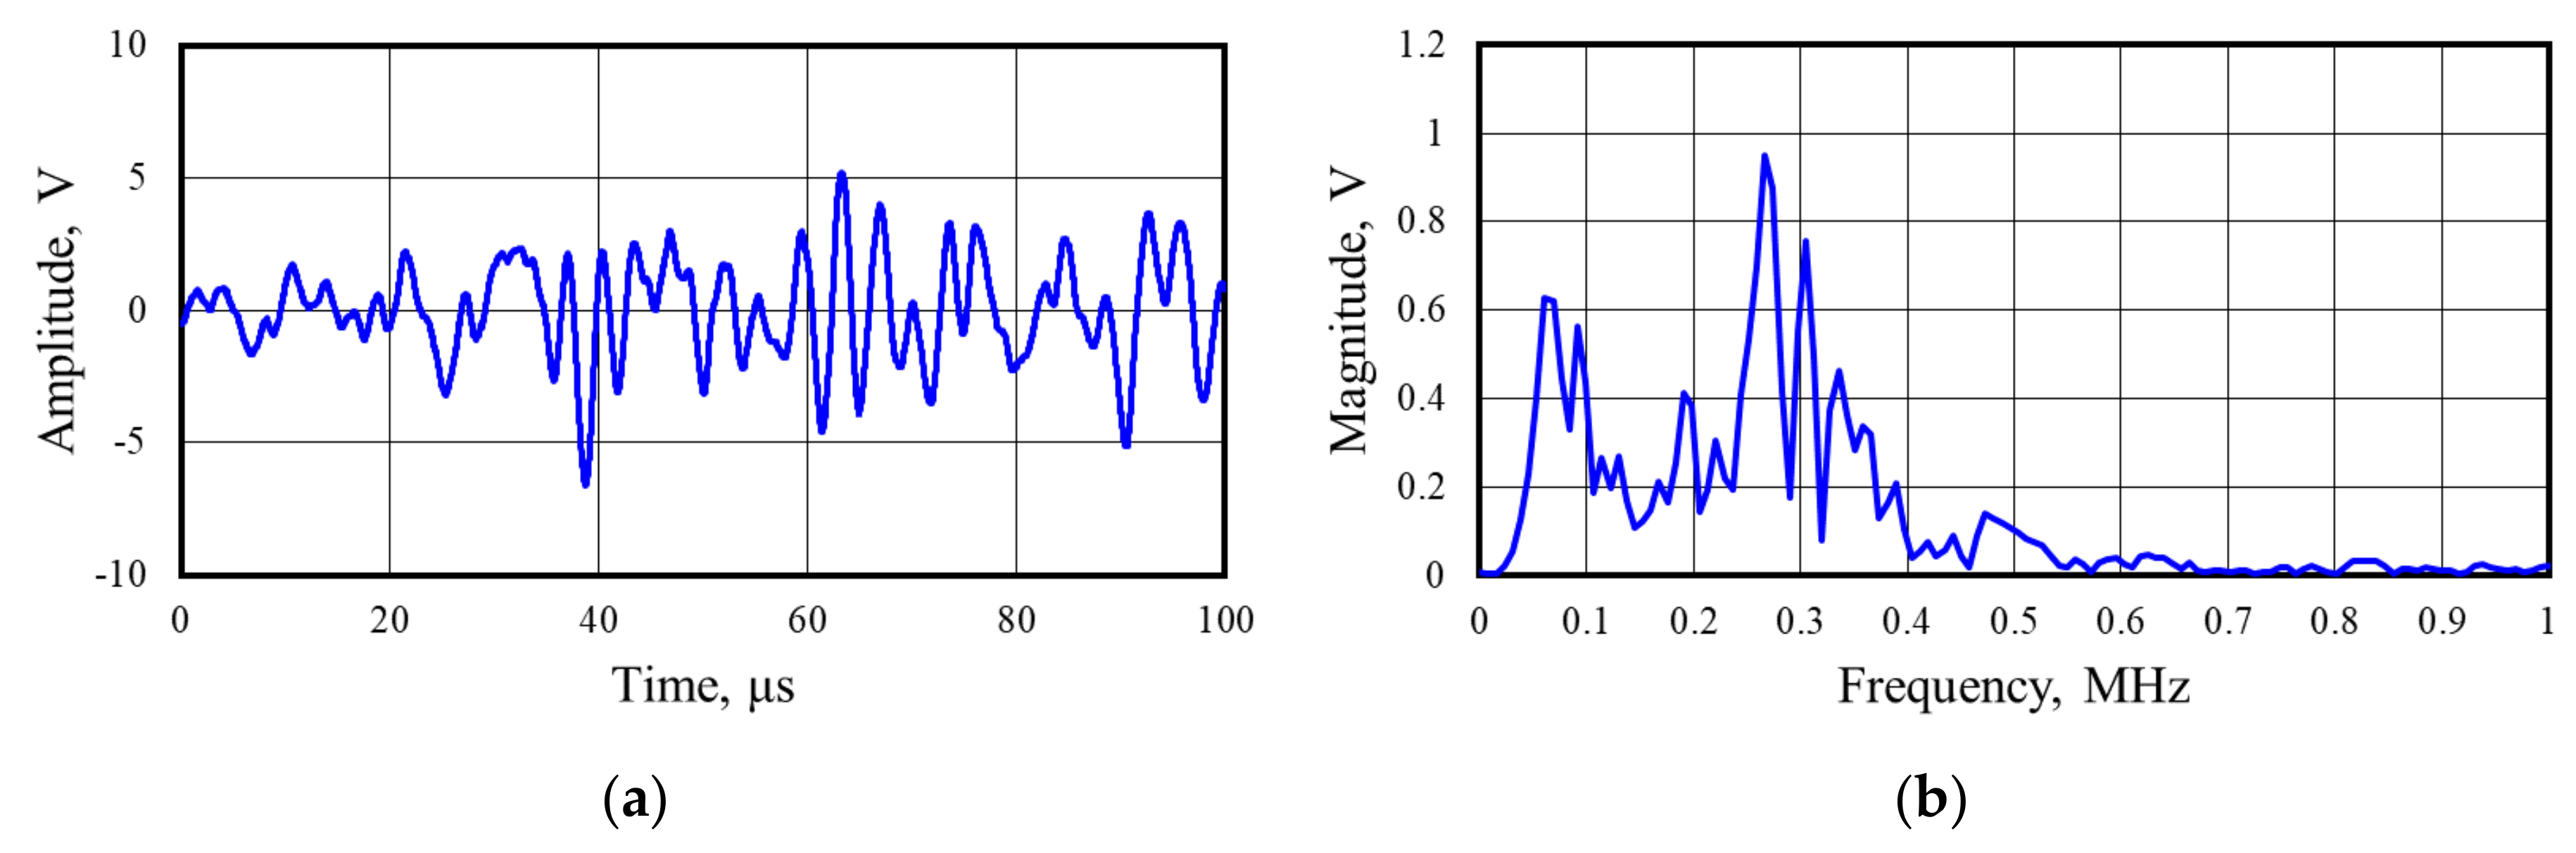
Figure 13.
Changes in the AE signal and the vibrational acceleration about 306 h after the start of the rolling fatigue test: (a) AE envelope signal; (b) amplitude of vibration.
Figure 13.
Changes in the AE signal and the vibrational acceleration about 306 h after the start of the rolling fatigue test: (a) AE envelope signal; (b) amplitude of vibration.

Figure 14.
Typical AE signal waveform detected at around 306 h and its frequency spectrum: (a) AE signal waveform; (b) frequency spectrum.
Figure 14.
Typical AE signal waveform detected at around 306 h and its frequency spectrum: (a) AE signal waveform; (b) frequency spectrum.

Figure 15.
Micrographs of the raceway surface of the bearing (shaft washer): (a) after 300 h; (b) after 306 h.
Figure 15.
Micrographs of the raceway surface of the bearing (shaft washer): (a) after 300 h; (b) after 306 h.

Figure 16.
Change in the frequencies of the AE signal waveforms at various times until flaking occurred in the shaft washer.
Figure 16.
Change in the frequencies of the AE signal waveforms at various times until flaking occurred in the shaft washer.

Figure 17.
Changes in the AE signal and the vibrational acceleration about 383 h later from the start of the rolling fatigue test: (a) AE envelope signal; (b) amplitude of vibration.
Figure 17.
Changes in the AE signal and the vibrational acceleration about 383 h later from the start of the rolling fatigue test: (a) AE envelope signal; (b) amplitude of vibration.

Figure 18.
Typical AE signal waveform detected at around 383 h and its frequency spectrum: (a) AE signal waveform; (b) frequency spectrum.
Figure 18.
Typical AE signal waveform detected at around 383 h and its frequency spectrum: (a) AE signal waveform; (b) frequency spectrum.

Figure 19.
Micrograph of the raceway surface of the bearing (housing washer) after the test.

Figure 20.
Change in the frequencies of the AE signal waveforms at various times until flaking occurred in the housing washer.
Figure 20.
Change in the frequencies of the AE signal waveforms at various times until flaking occurred in the housing washer.
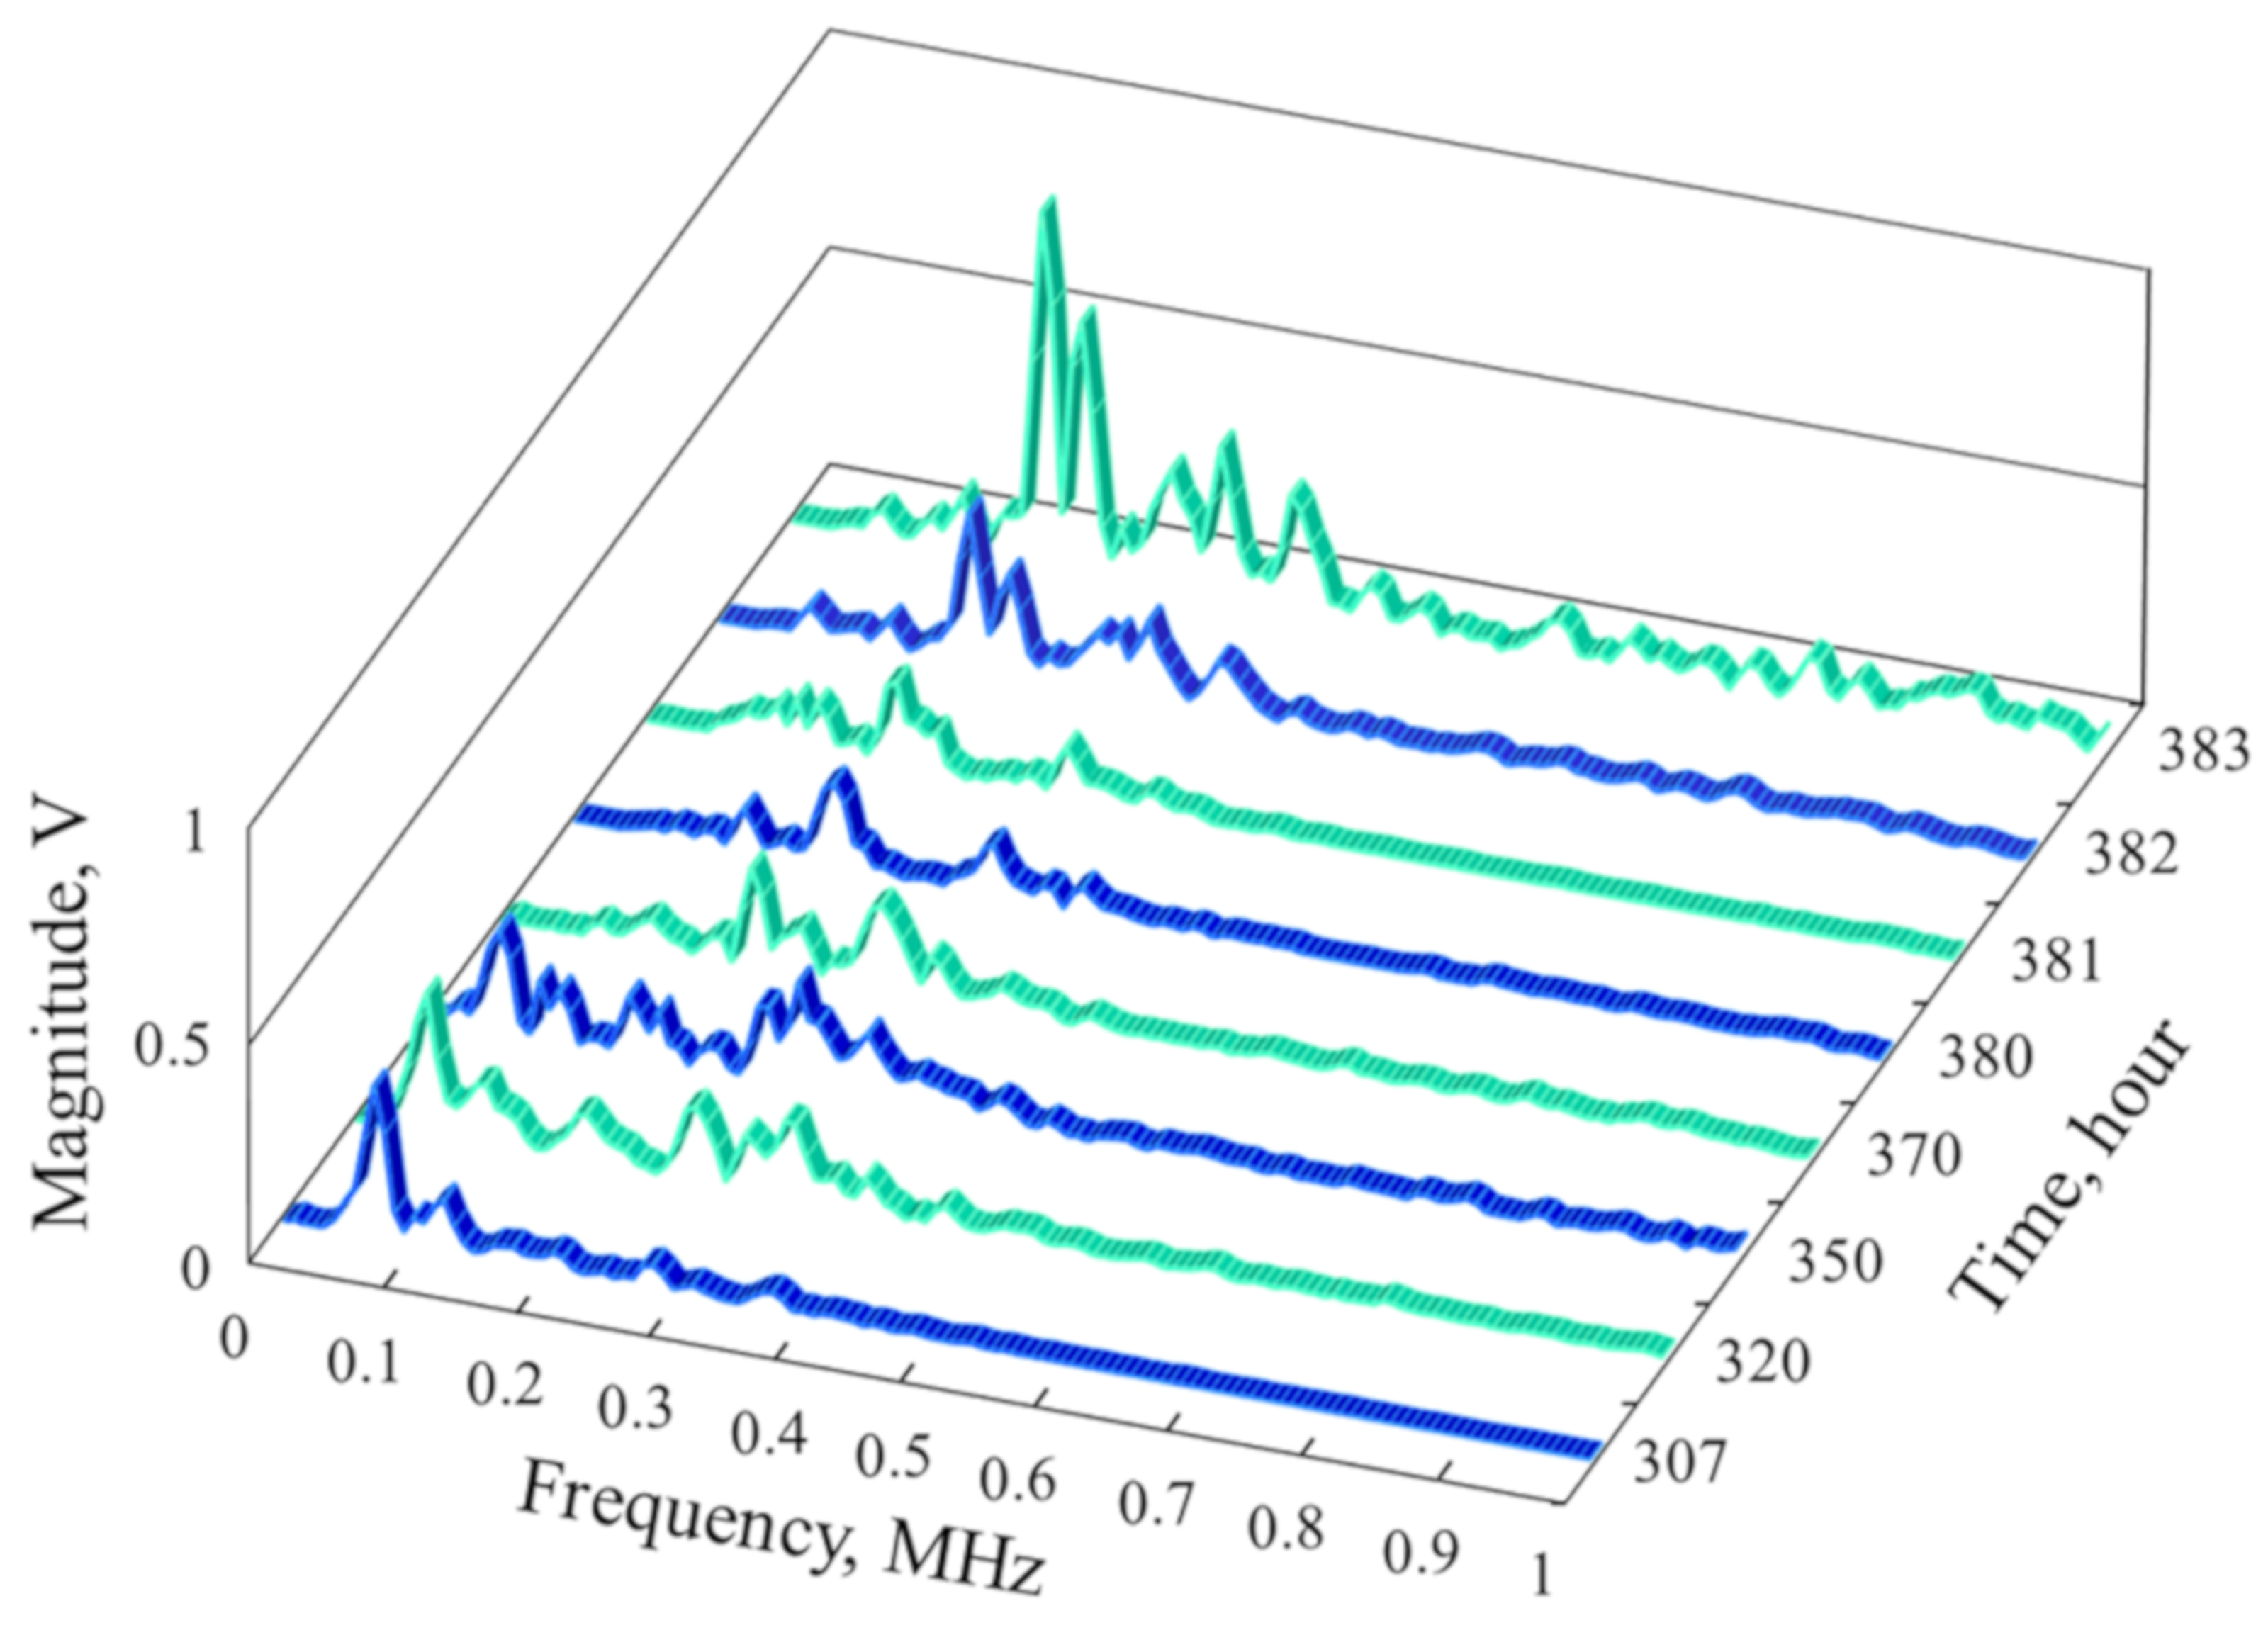
Figure 21.
Frequency spectrum of the AE signal waveform detected in the indentation test: (a) at 9.8 N; (b) at 98 N.
Figure 21.
Frequency spectrum of the AE signal waveform detected in the indentation test: (a) at 9.8 N; (b) at 98 N.

Figure 22.
Correlation map between the frequency spectra of AE signals and deformation and fracture phenomena (friction and wear modes).
Figure 22.
Correlation map between the frequency spectra of AE signals and deformation and fracture phenomena (friction and wear modes).


Table 1.
Specifications of the lubricating oil used in this study.
| ISO Viscosity Grade | Density at 15 °C | Kinetic Viscosity at 40 °C | Kinetic Viscosity at 100 °C | Pour Point |
|---|---|---|---|---|
| ISO VG46 | 0.874 g/cm3 | 46.4 mm2/s | 6.8 mm2/s | –12.5 °C |
© 2020 by the author. Licensee MDPI, Basel, Switzerland. This article is an open access article distributed under the terms and conditions of the Creative Commons Attribution (CC BY) license (http://creativecommons.org/licenses/by/4.0/).
Share and Cite
MDPI and ACS Style
Hase, A. Early Detection and Identification of Fatigue Damage in Thrust Ball Bearings by an Acoustic Emission Technique. Lubricants 2020, 8, 37. https://doi.org/10.3390/lubricants8030037
AMA Style
Hase A. Early Detection and Identification of Fatigue Damage in Thrust Ball Bearings by an Acoustic Emission Technique. Lubricants. 2020; 8(3):37. https://doi.org/10.3390/lubricants8030037
Chicago/Turabian StyleHase, Alan. 2020. "Early Detection and Identification of Fatigue Damage in Thrust Ball Bearings by an Acoustic Emission Technique" Lubricants 8, no. 3: 37. https://doi.org/10.3390/lubricants8030037
Note that from the first issue of 2016, this journal uses article numbers instead of page numbers. See further details here.