Adaptations to “Thermal Time” Constraints in Papilio: Latitudinal and Local Size Clines Differ in Response to Regional Climate Change

Abstract
:
1. Introduction

2. Experimental Section
2.1. Developmental Thresholds for Larval Growth


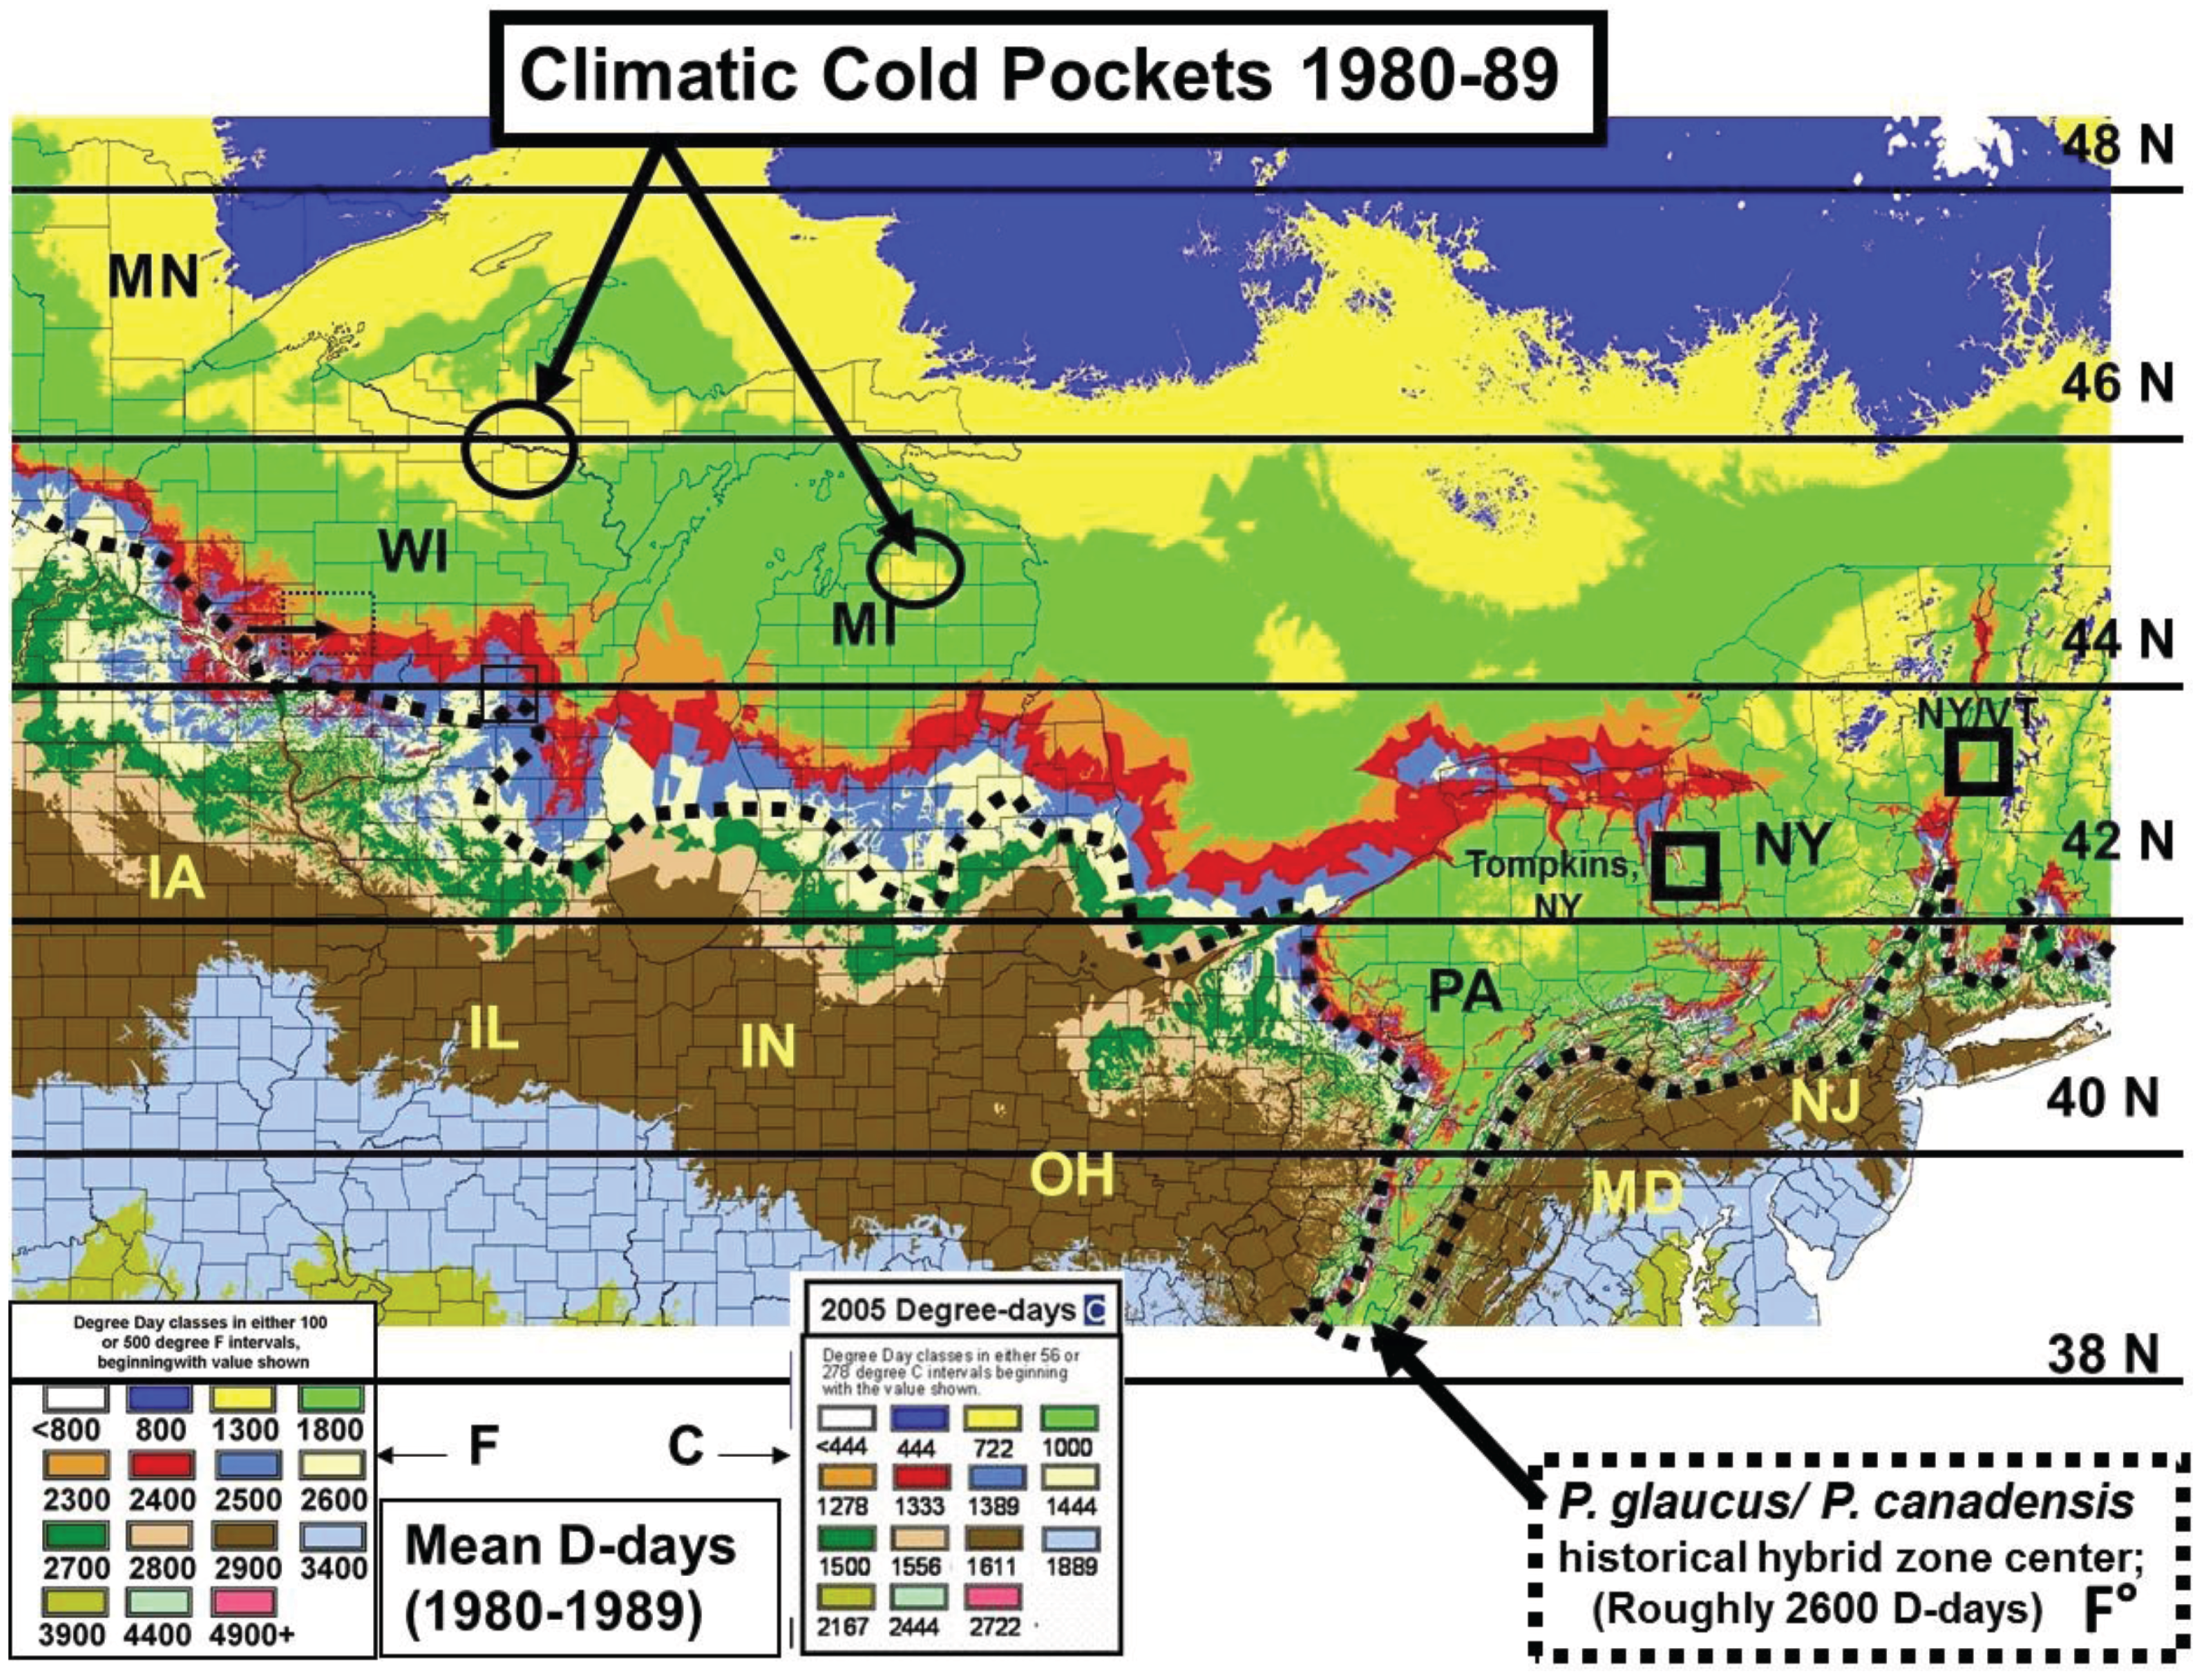
2.2. Calculation of Local Growing Degree-Days and Seasonal “Thermal Landscape” Mapping
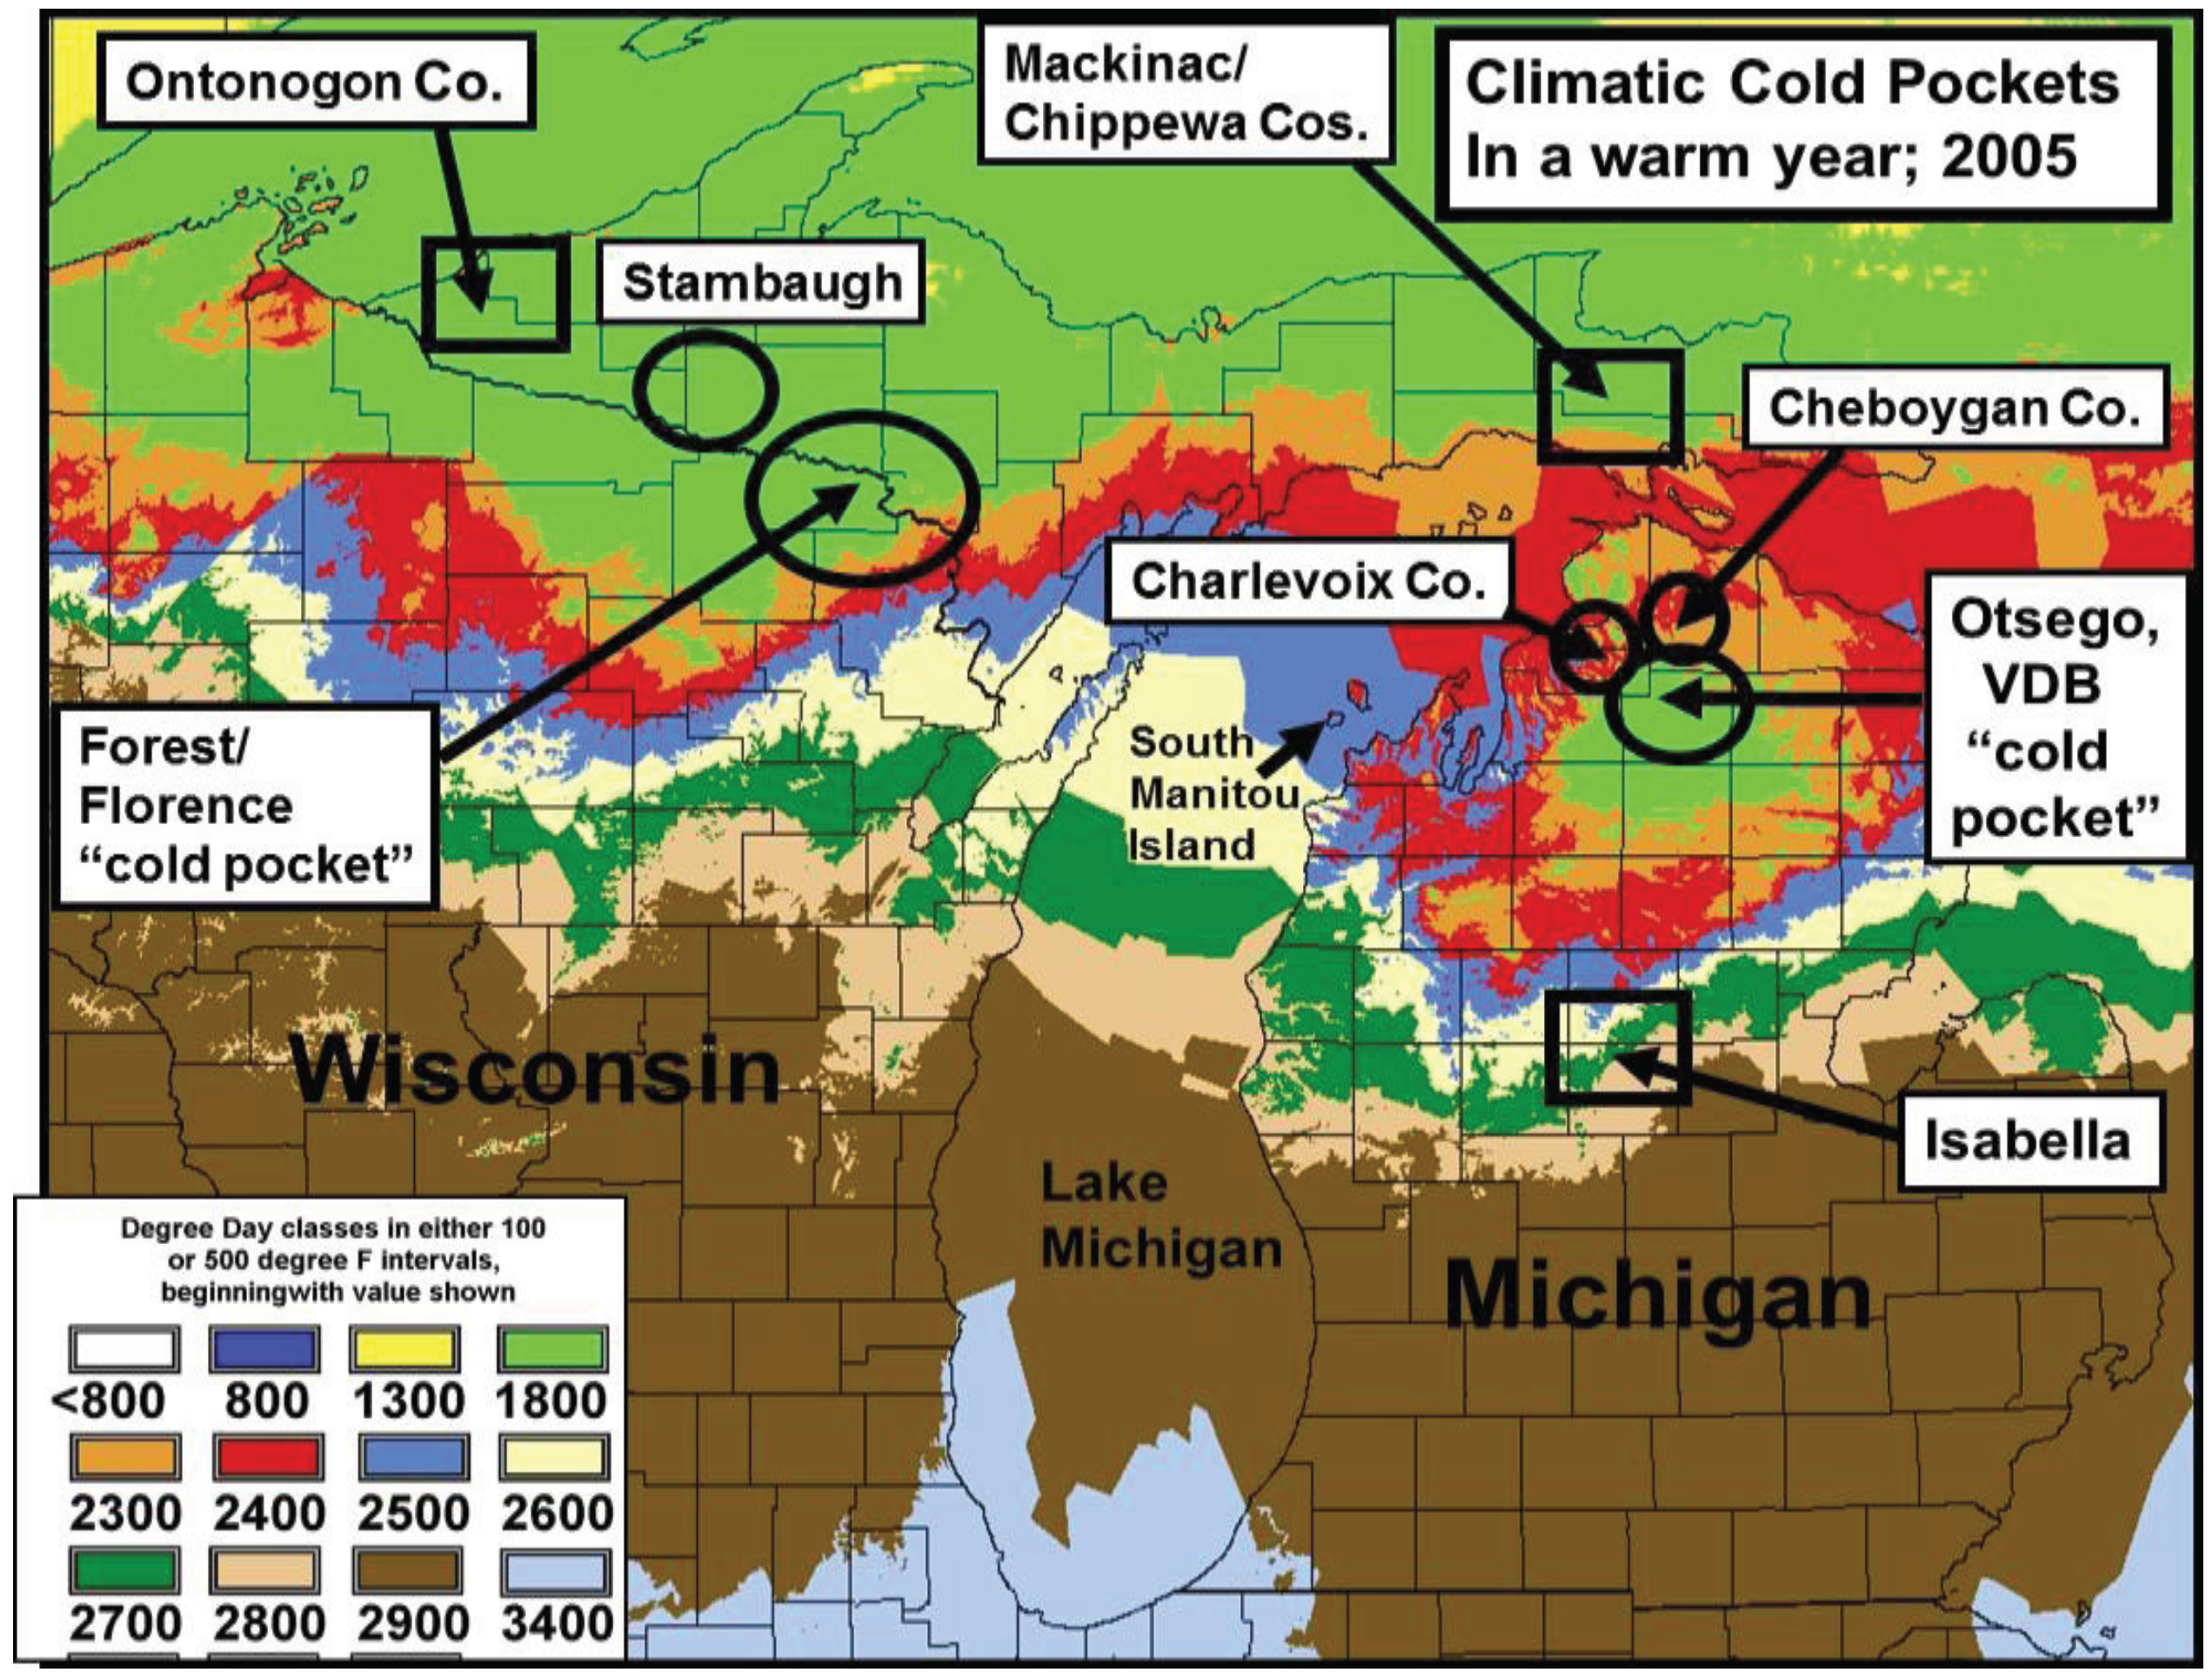
2.3. Cold Pocket Sampling sites in Northern Michigan and Wisconsin

2.4. Insects

3. Results
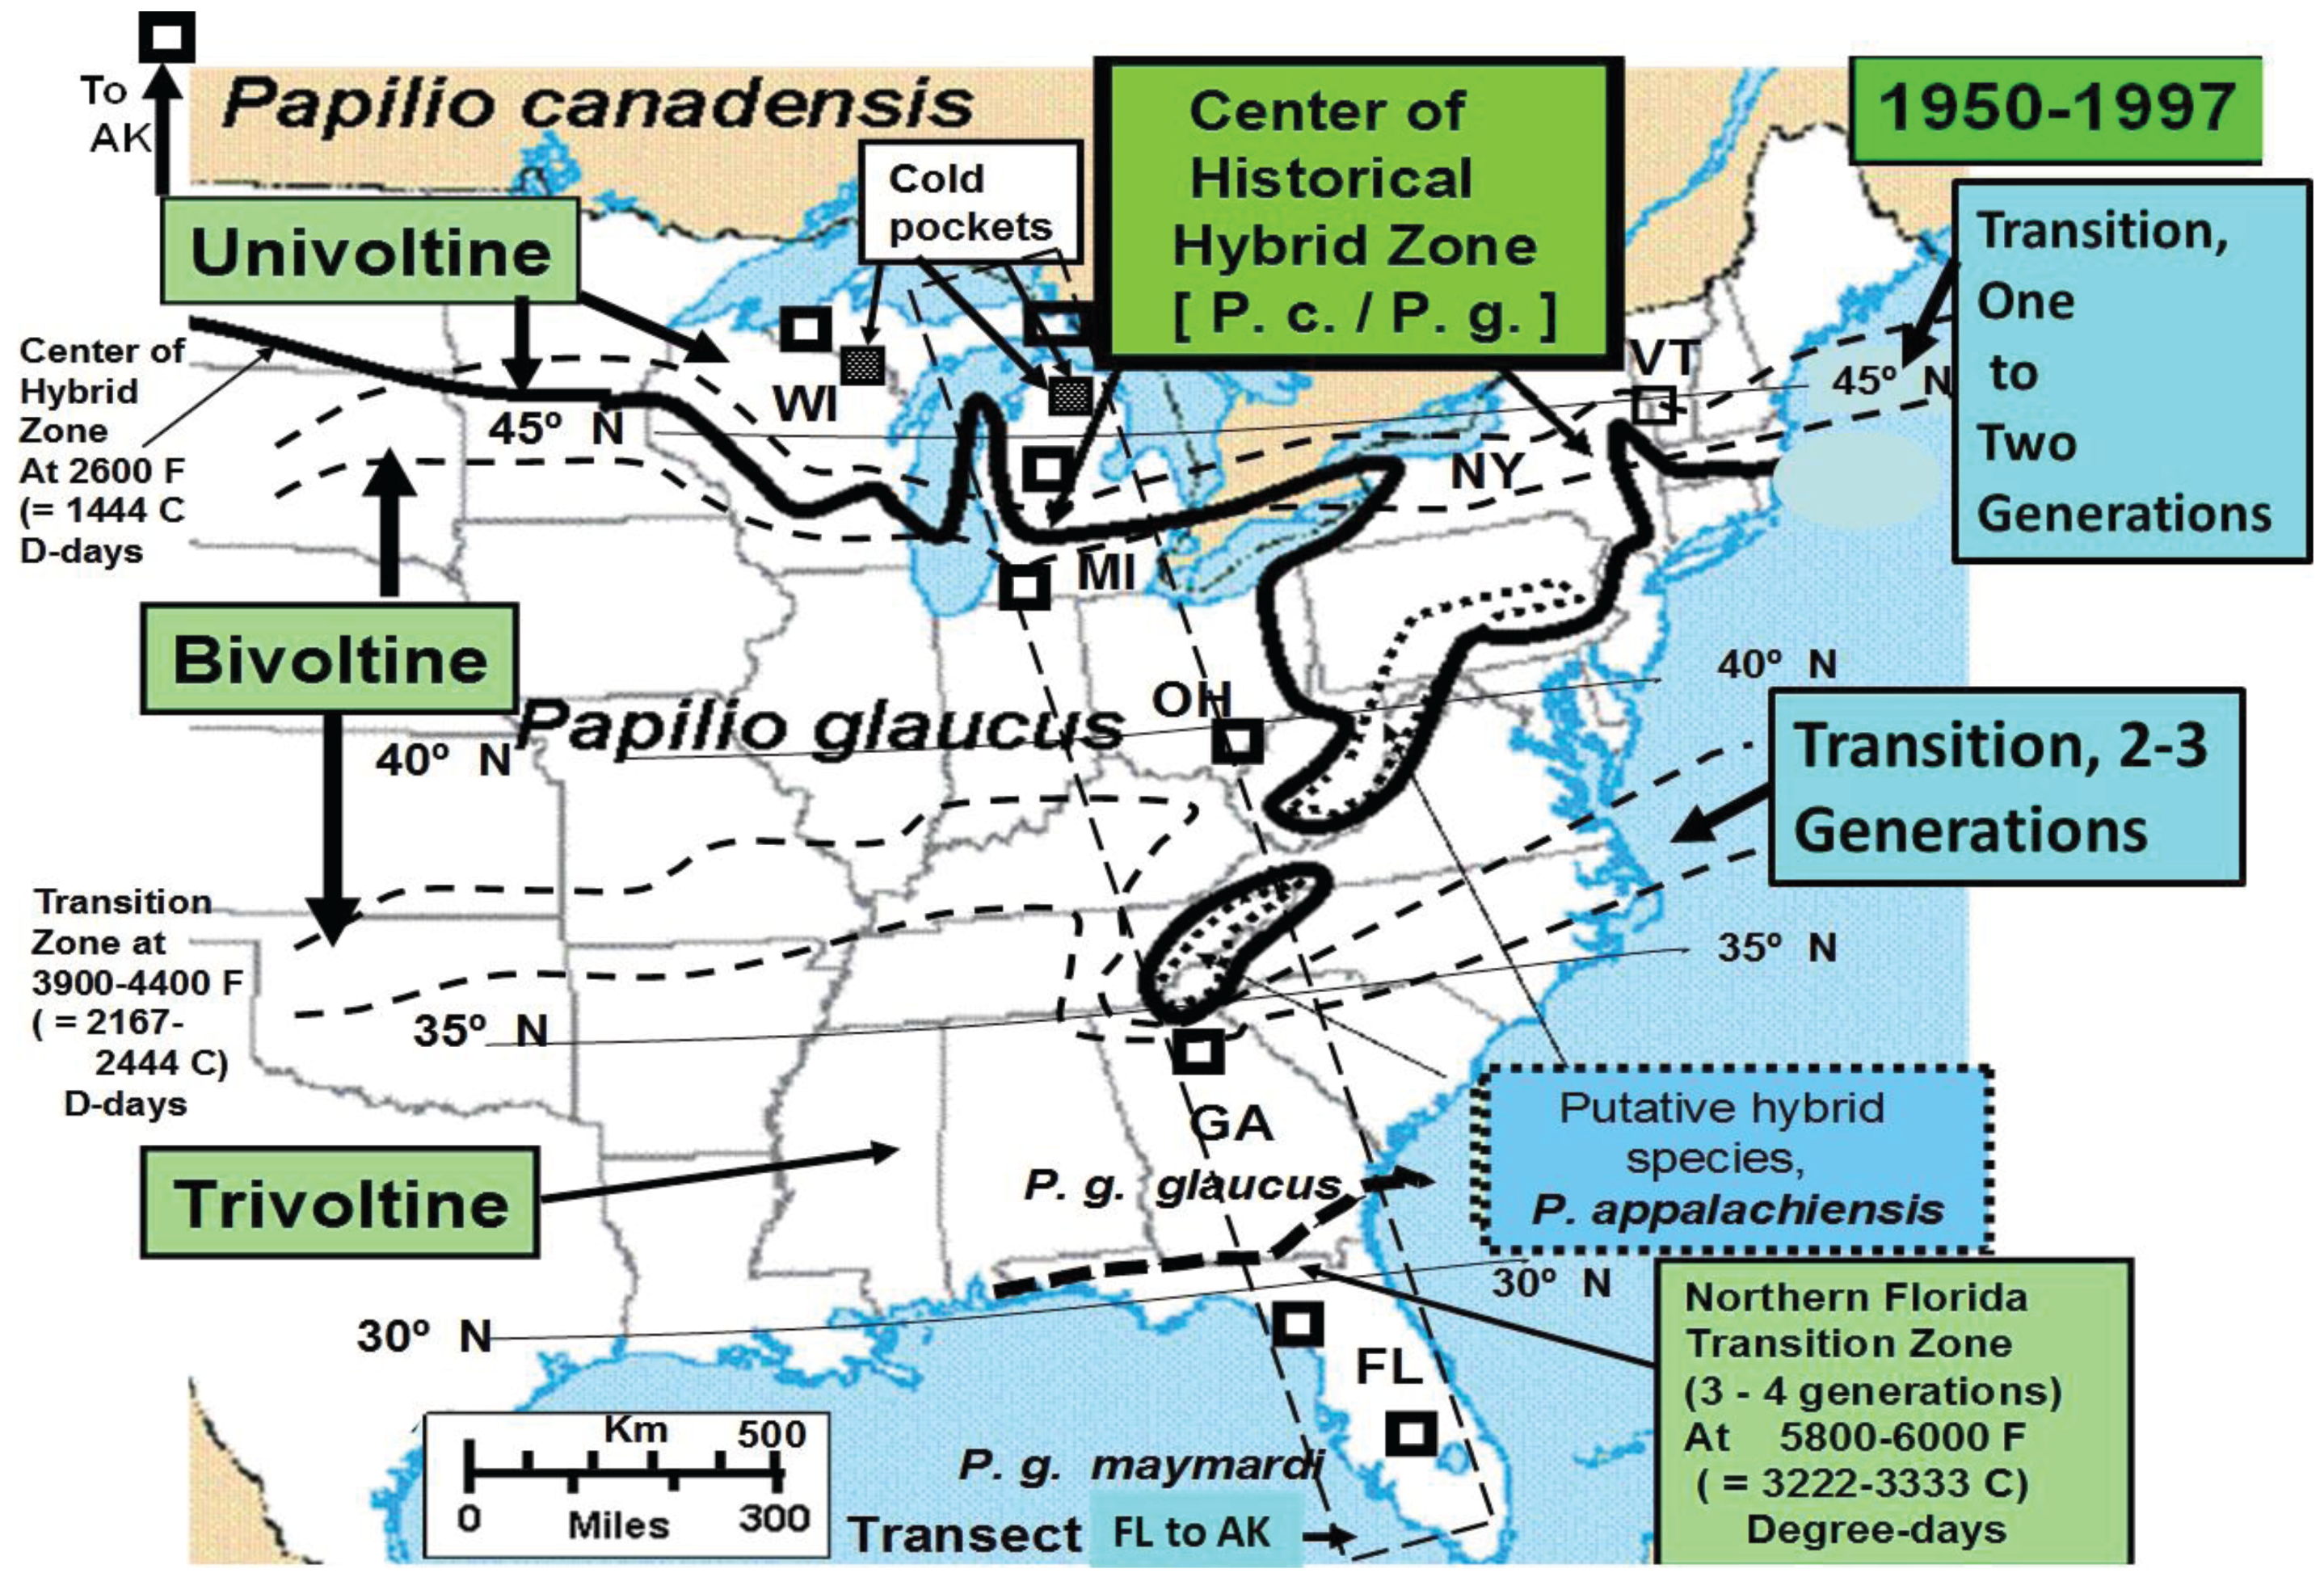
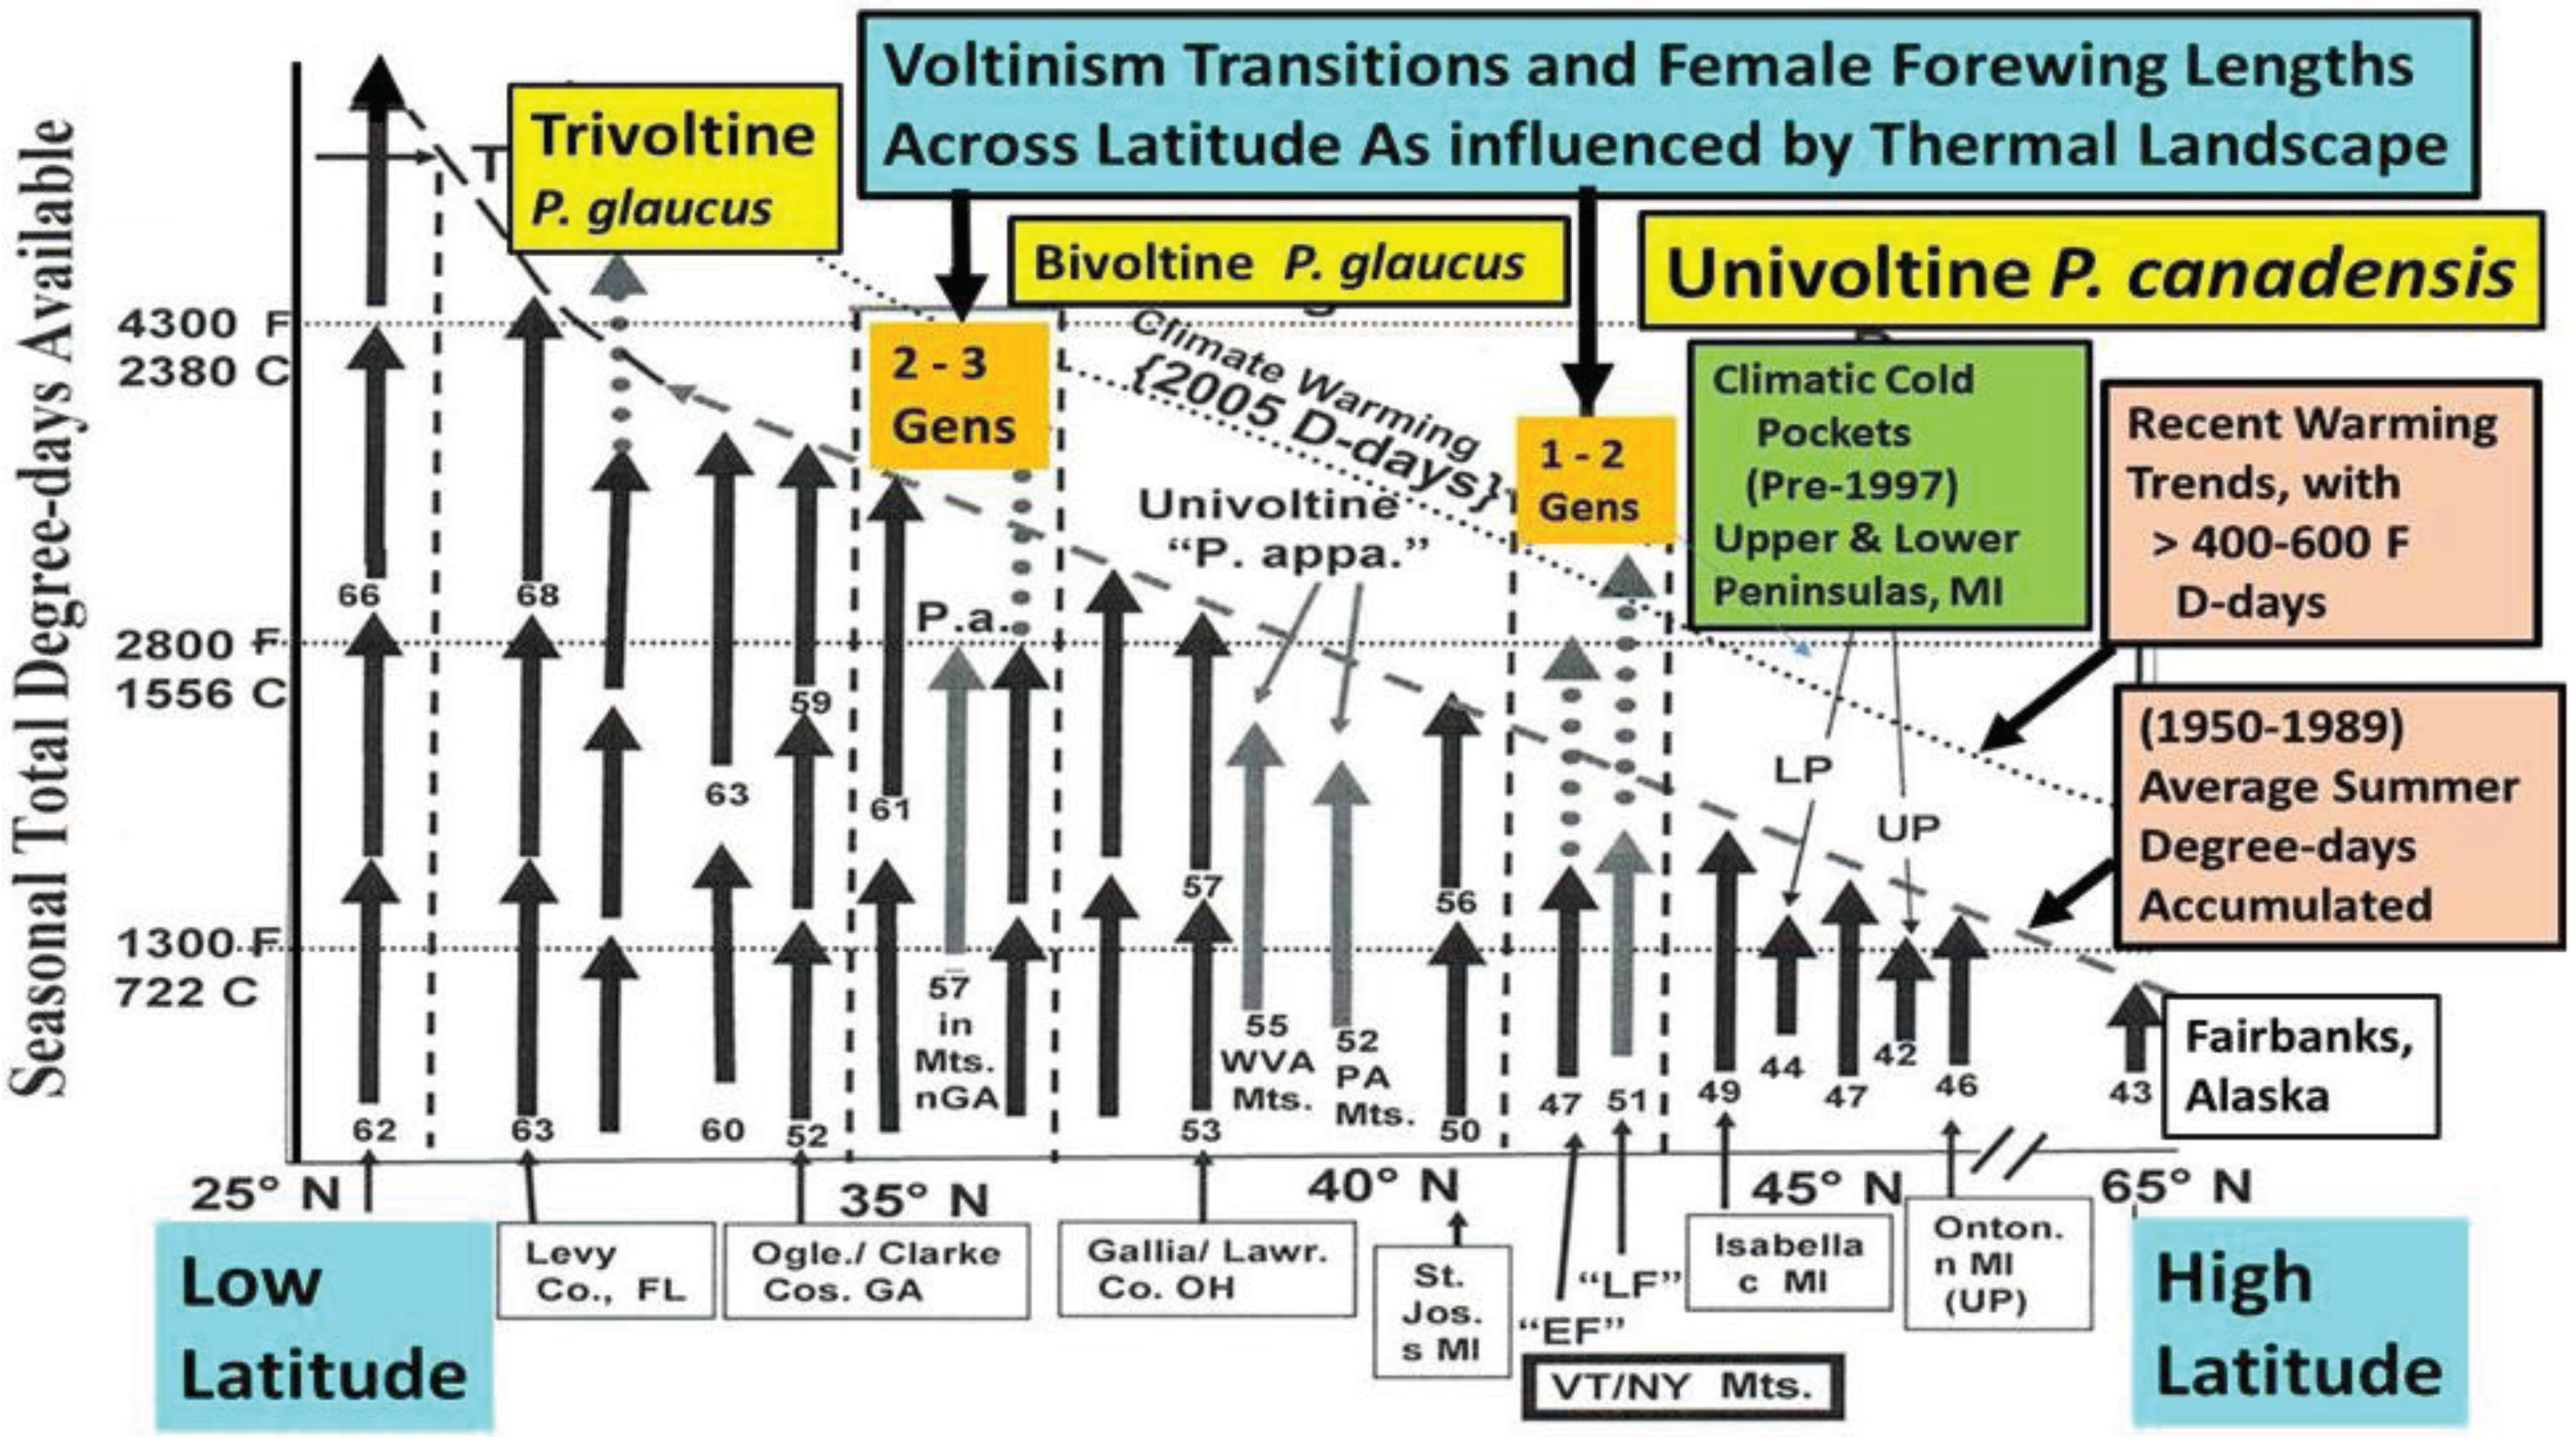
3.1. The Historical Thermal Landscape of Eastern North America and a “Voltinism/Size/D-day” Model


| Spring Flight | Late Summer | ||||||||
|---|---|---|---|---|---|---|---|---|---|
| County, State (1984–2013) | Degrees N latitude | Mean Forewing Length mm) | Yrs (n) | Total Females (n) | R² Spring Flight | R² Summer Flight | Mean Forewing length (mm) | Yrs (n) | Total Females (n) |
| P. glaucus Highlands, southern FL | 27° 28' | 62.3 | 10 | 337 | 0.10 n.s. | 66.0 | 2 | 14 | |
| Levy, north FL | 29° 12' | 62.9 | 18 | 530 | 0.06 n.s. | 68.5 | 2 | 13 | |
| Clarke Co. north GA | 33° 56' | 52.1 | 3 | 184 | NA | 0.07 n.s. | 58.5 | 17 | 492 |
| Southeast OH | 38° 40' | 51.7 | 2 | 14 | NA | 0.05 n.s. | 56.3 | 8 | 387 |
| St. Joseph, MI (Pg) | 41° 52' | 50.3 | 2 | 6 | NA | 0.15 n.s. | 54.6 | 6 | 47 |
| P. canadensis Isabella, central MI | 43° 48' | 49.5 | 18 | 241 | 0.05 n.s. | Univoltine | |||
| Mackinac, MI (UP) | 46° 10' | 46.9 | 12 | 96 | 0.06 n.s. | Univoltine | |||
| Ontonogon, MI (UP) | 46° 30' | 46.7 | 10 | 127 | 0.0003 n.s. | Univoltine | |||
| Fairbanks, AK | 64° 55' | 43.6 | 9 | 163 | 0.05 n.s. | Univoltine | |||
| Battenkill River, VT “EF”(Pc) | 43° 6' | 48.3 ± 1.1 | 10 | 378 | 0.007 n.s. | Univoltine early(May–June) | Hybrid Zone (VT) | ||
| Battenkill River “LF” Hybrids | 43° 6' | 50.9 ± 1.5 | 8 | 190 | 0.021 n.s. | Univoltine Late (July) | Hybrid Zone (VT) | ||
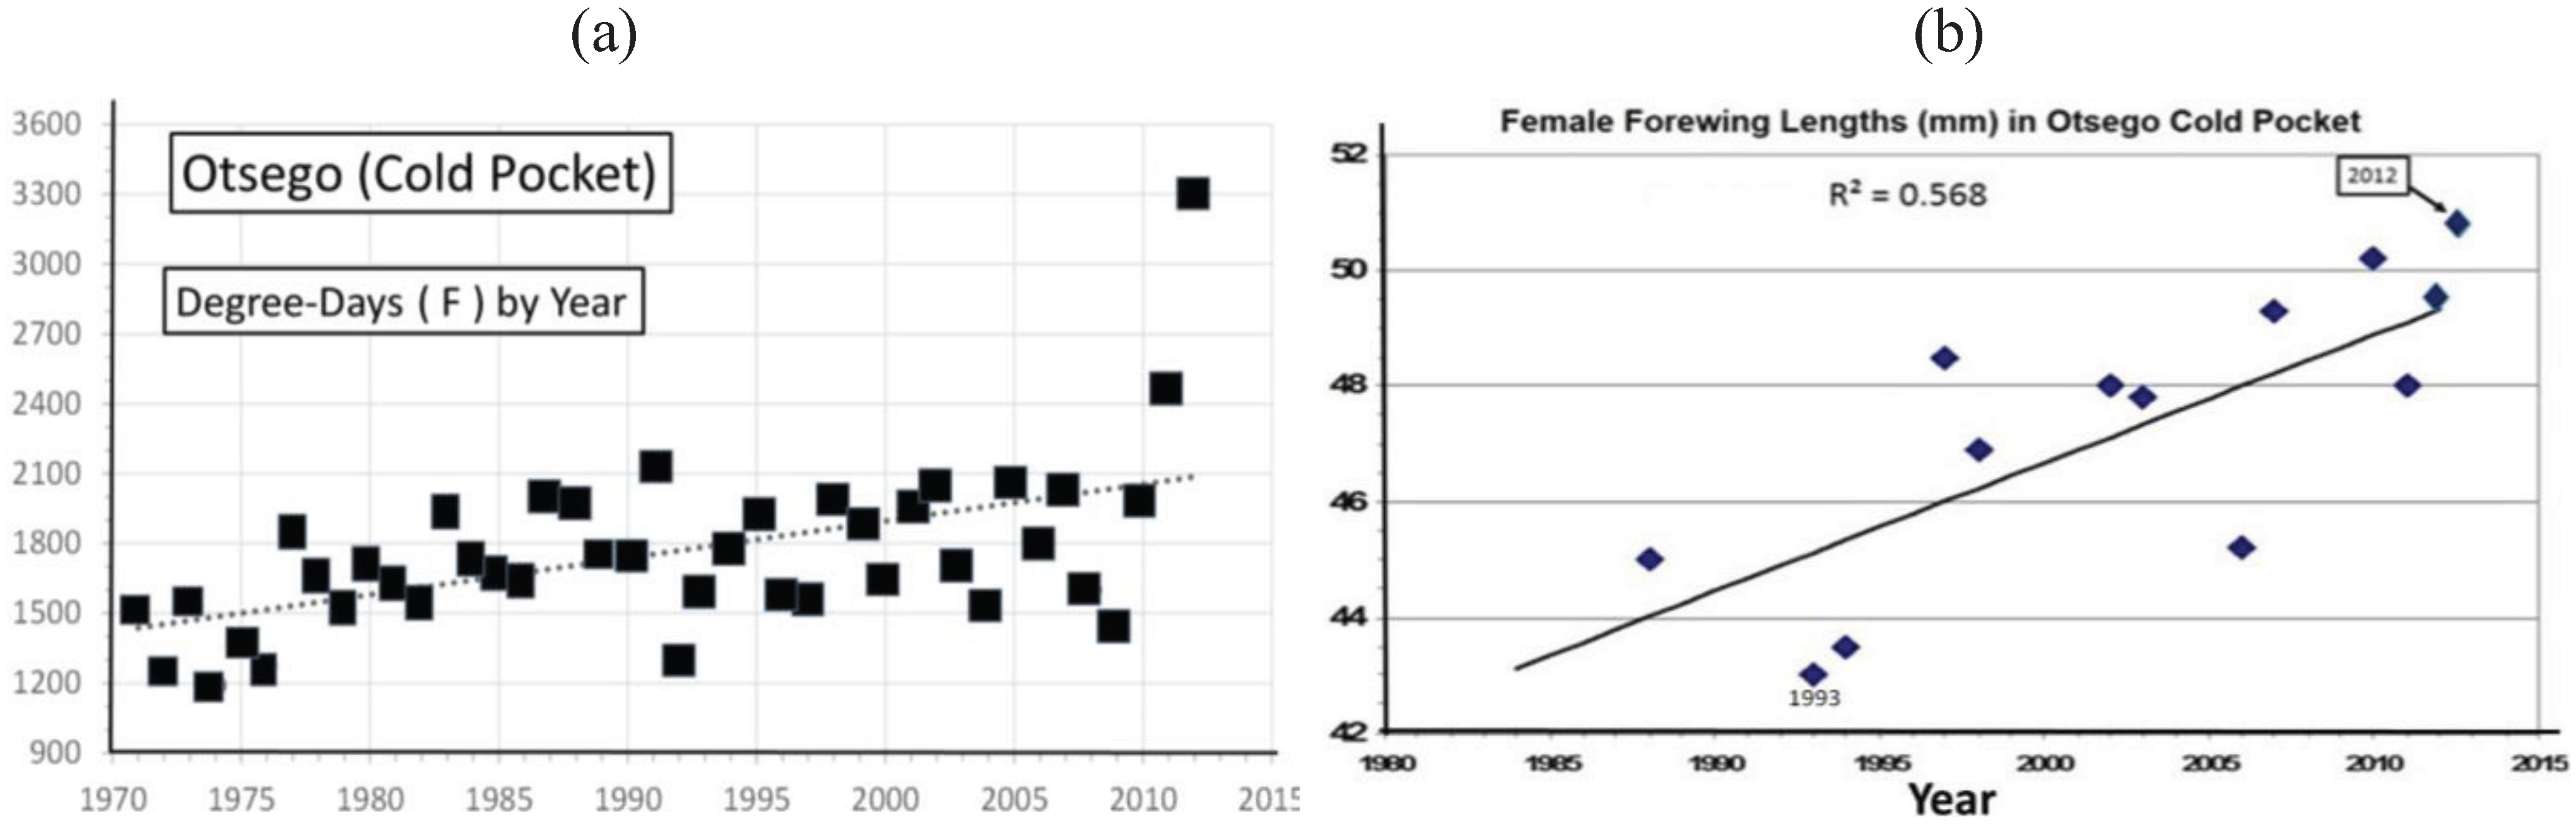
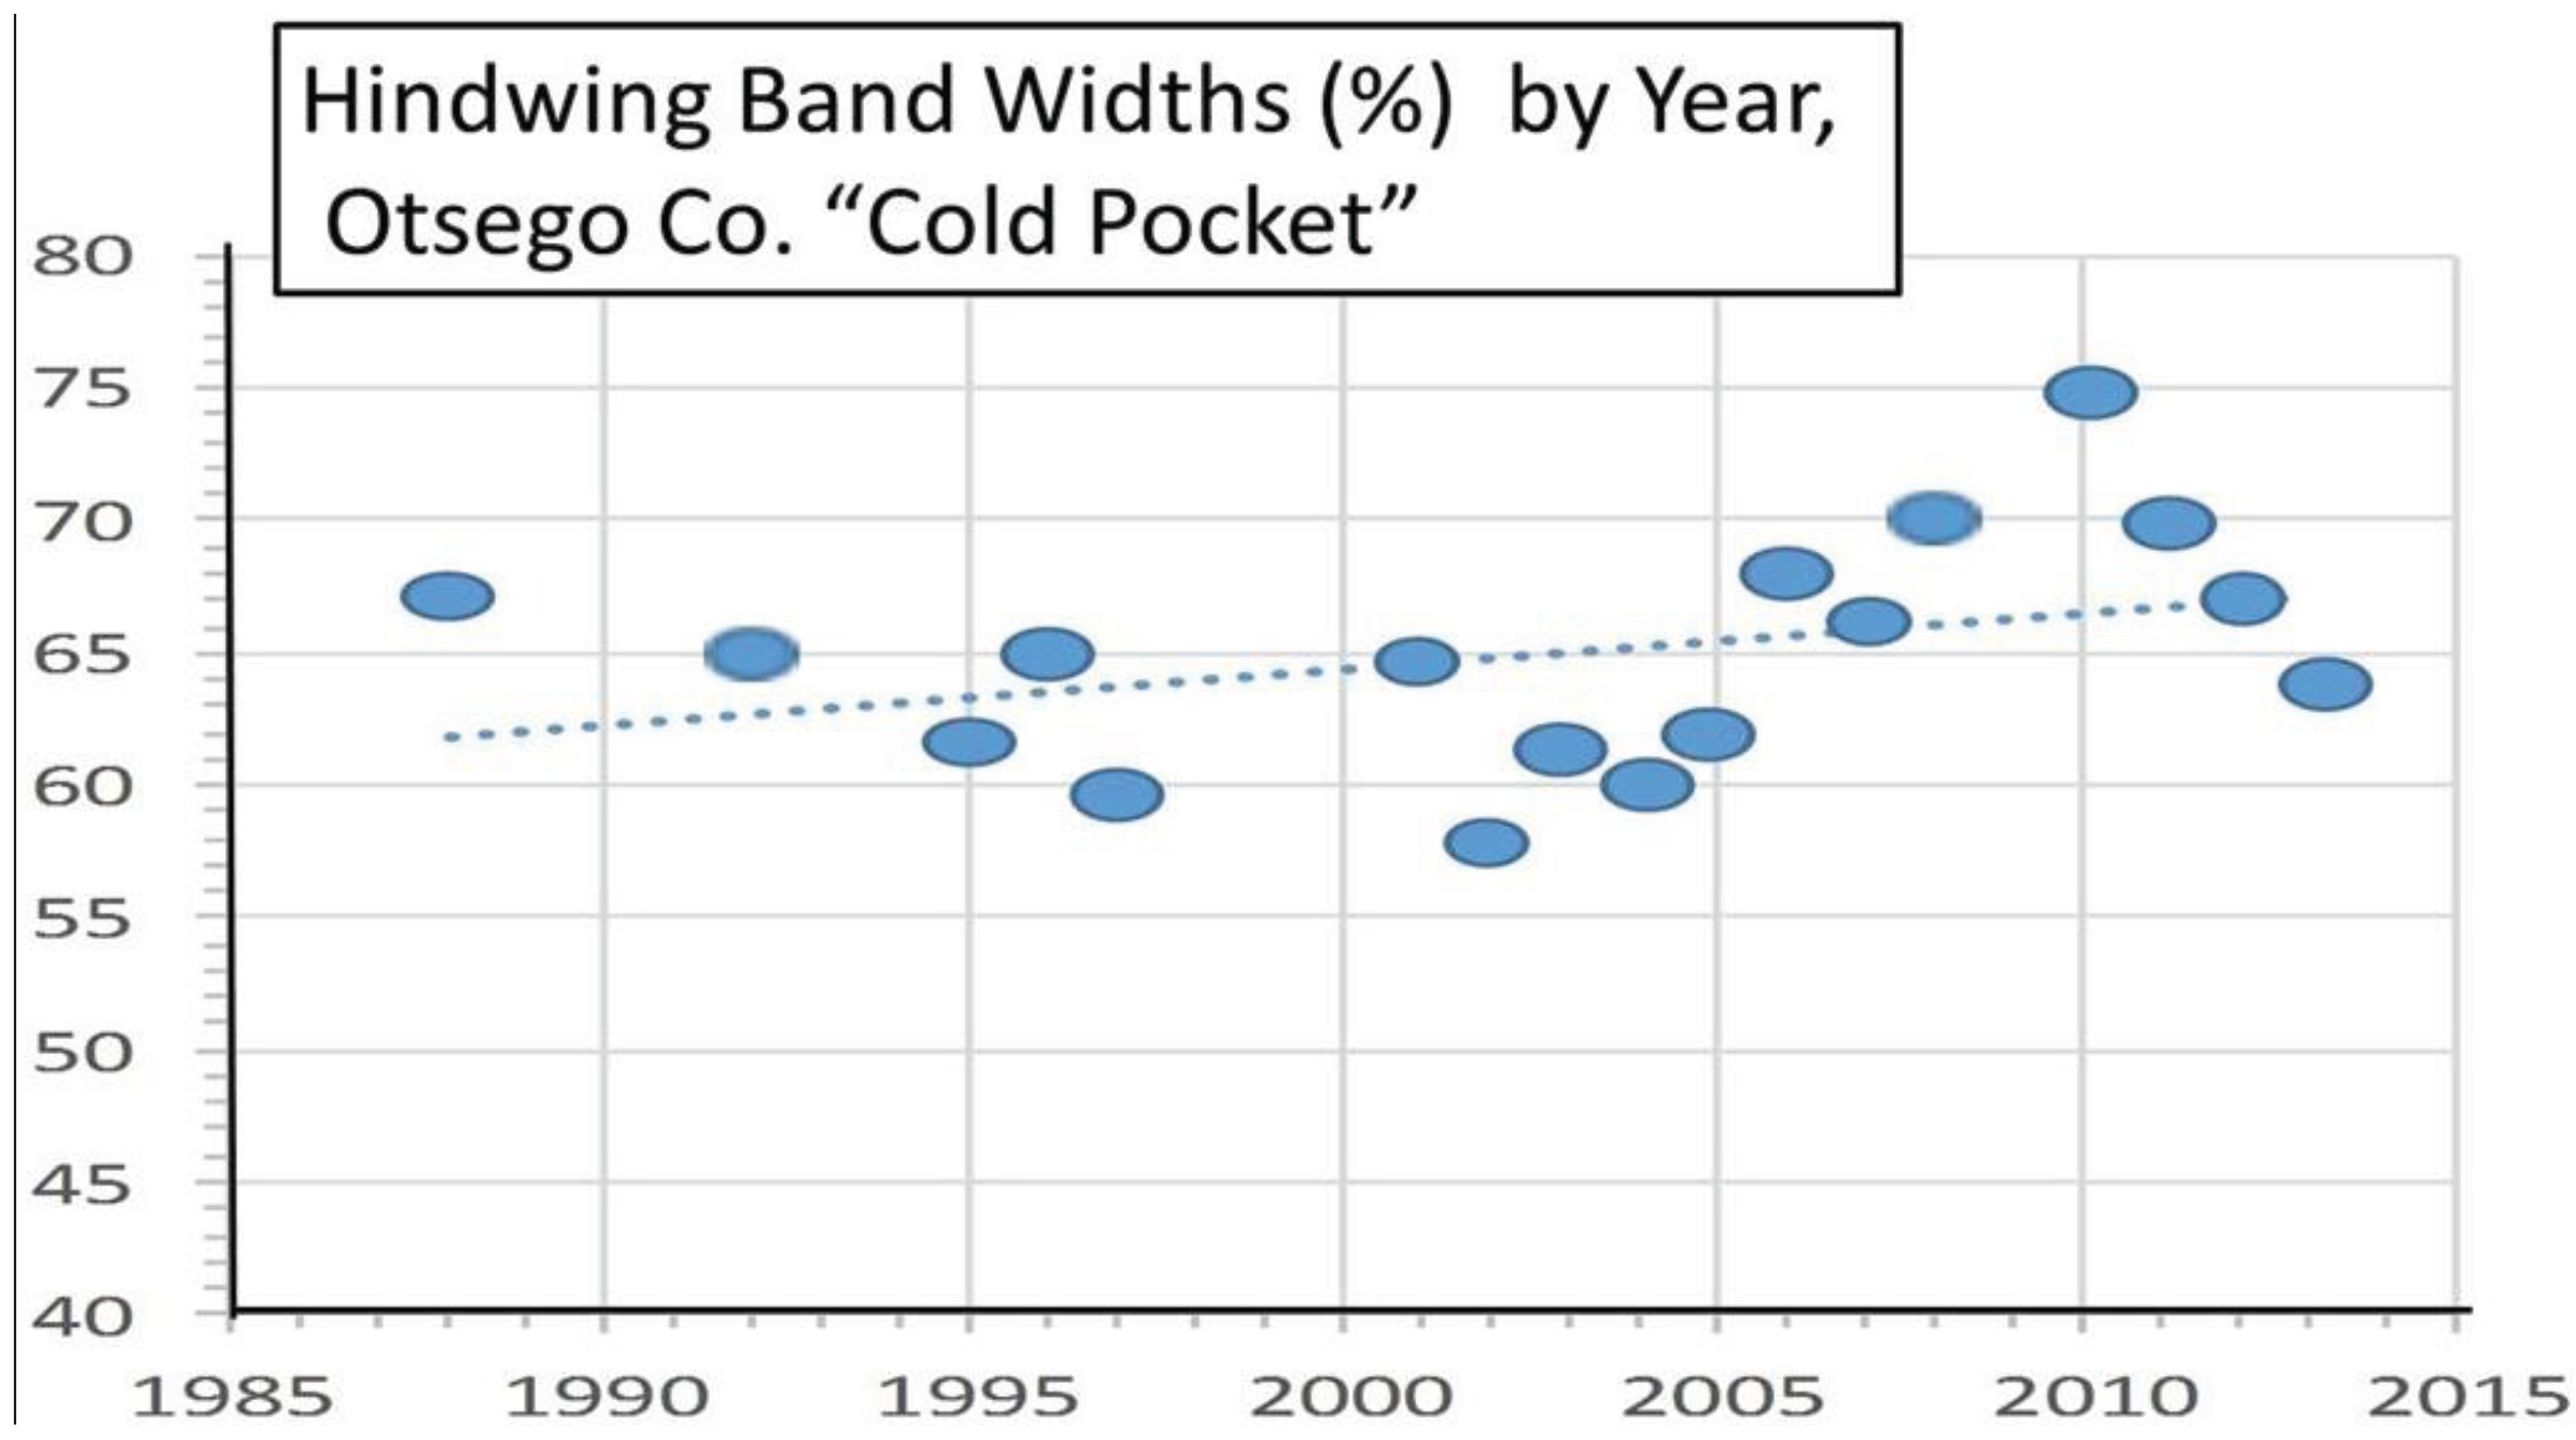
| Cold pocket, Otsego, MI | 45° 8' | 49.5 ± 0.9 | 13 | 125 | 0.57*** | Univoltine | Figure 8 | ||
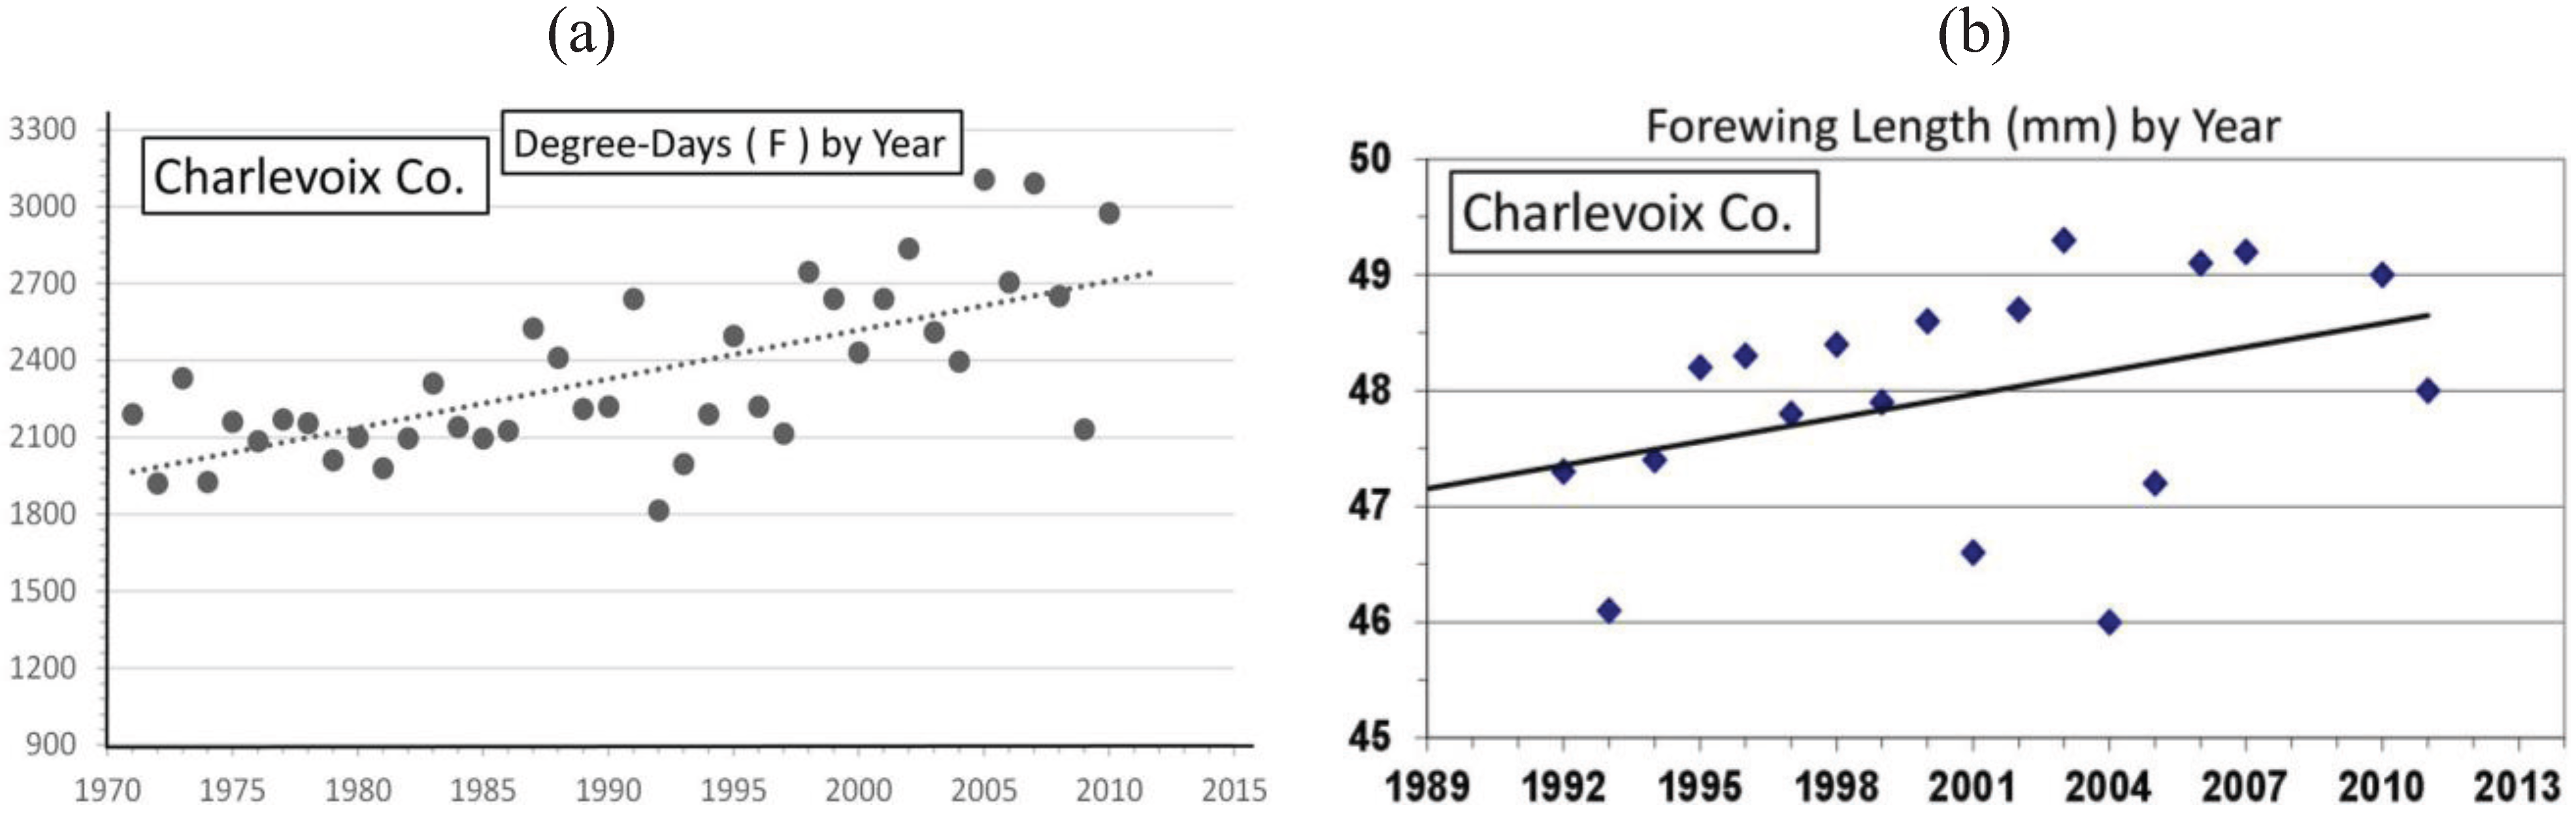
| Charlevoix Co. near “CP” | 45° 11' | 48.0 ± 1.0 | 18 | 309 | 0.46 *** | Univoltine | Figure 9 | ||
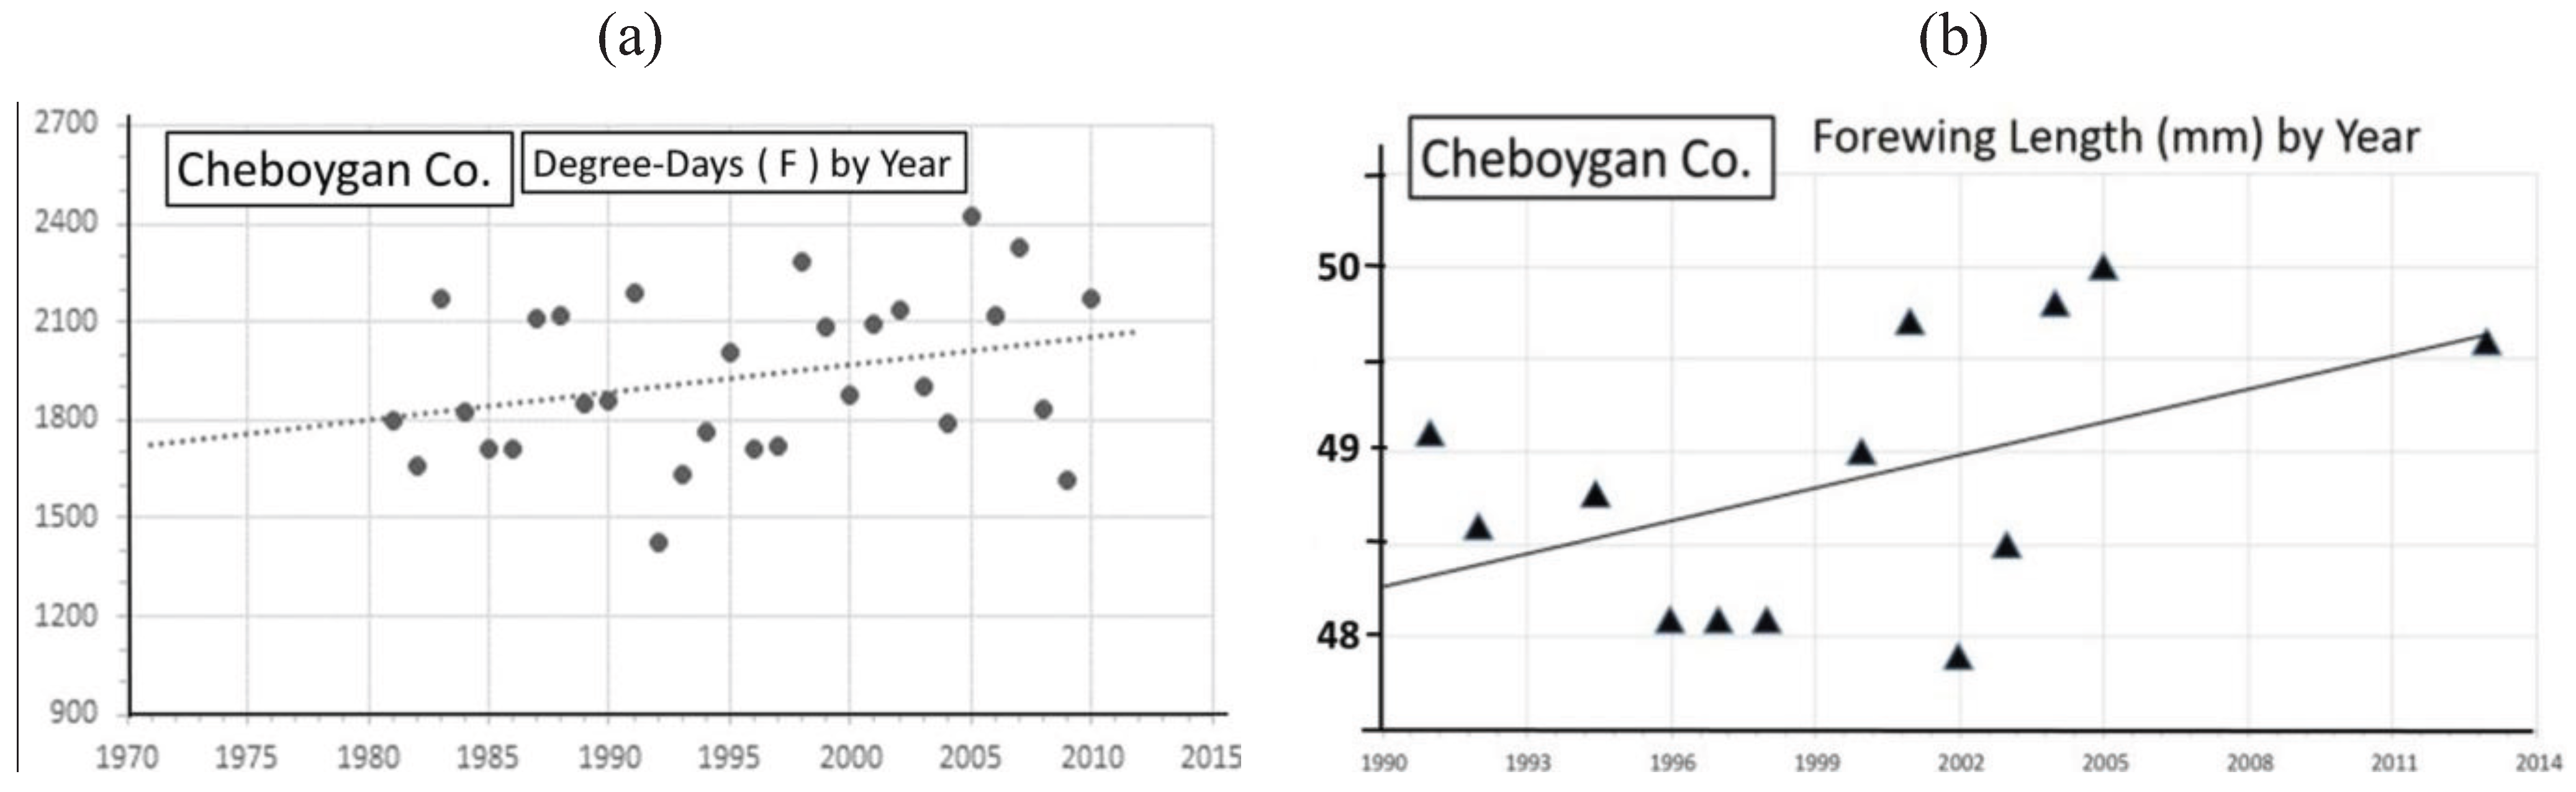
| Cheboygan Co. near “CP” | 45° 22' | 48.9 ± 0.8 | 13 | 145 | 0.23 ** | Univoltine | Figure 10 | ||
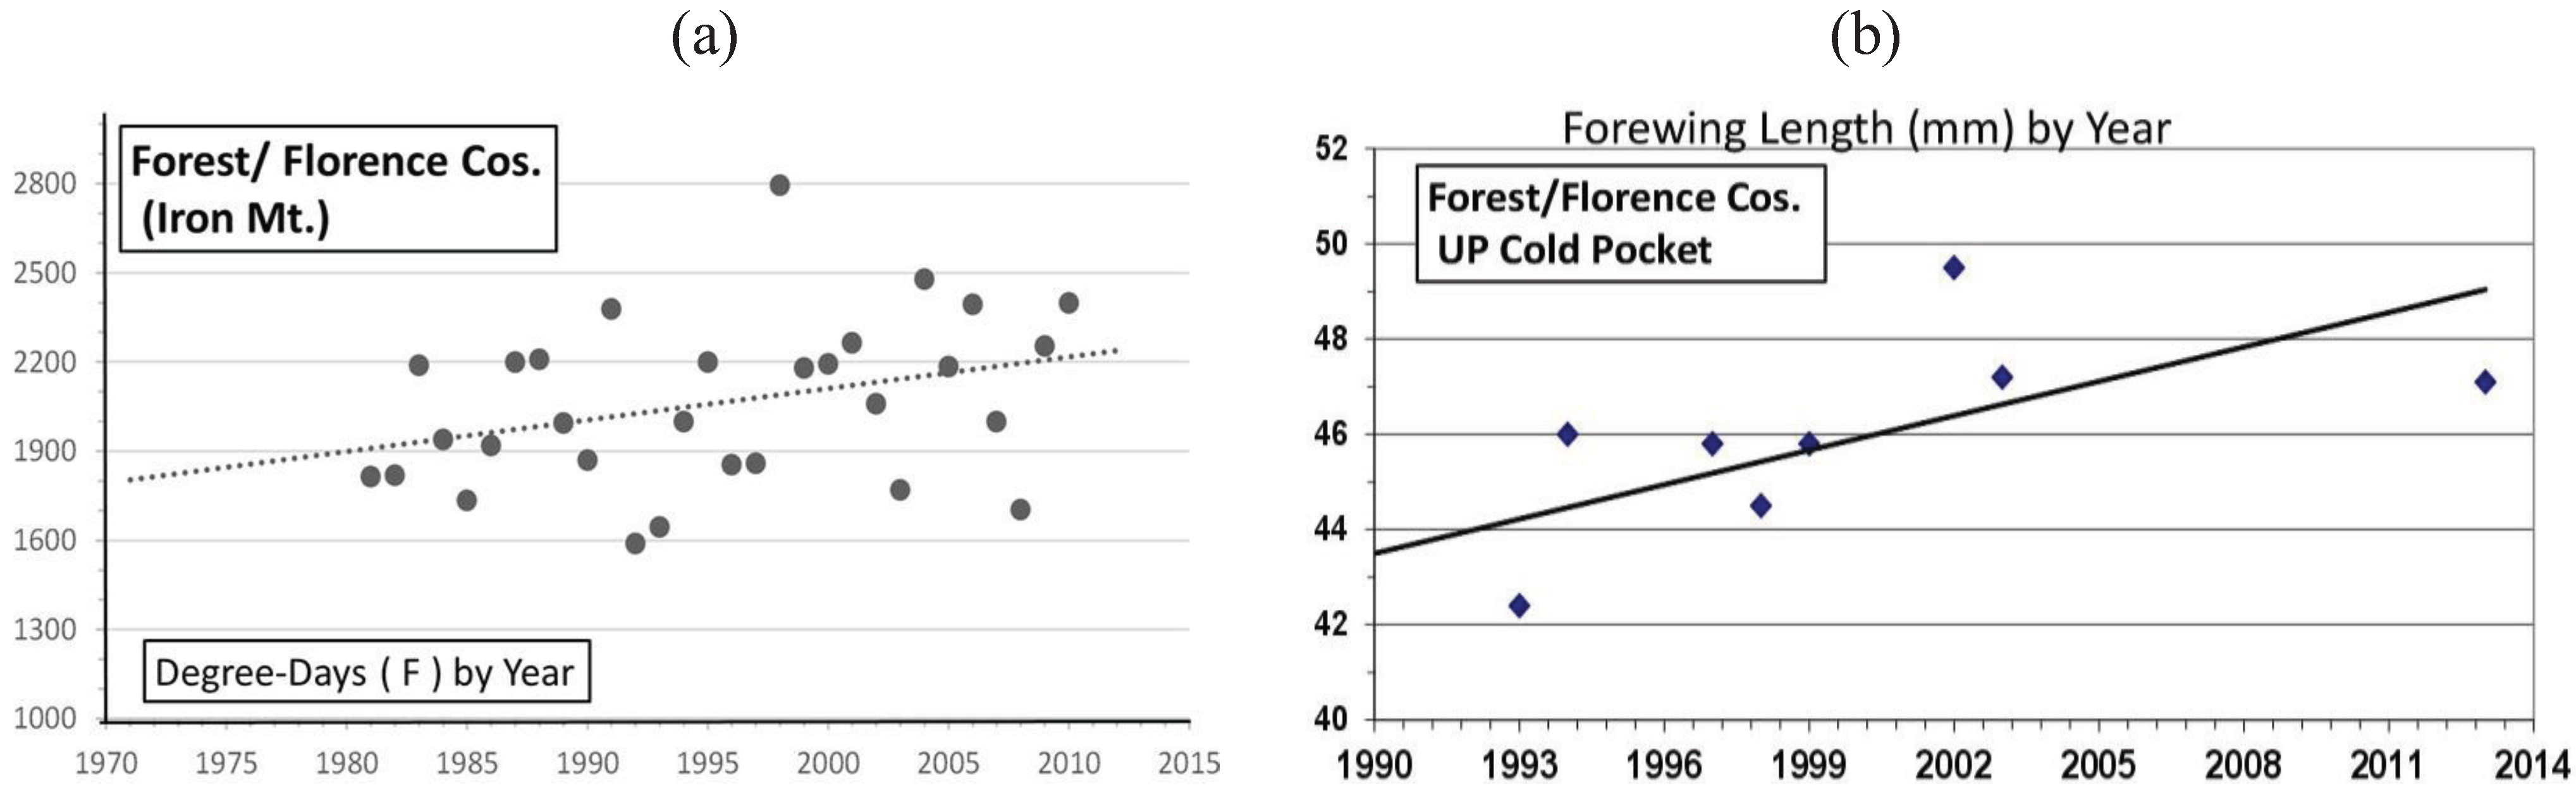
| Cold Pocket Florence & Forest, WI | 45° 56' | 45.6 ± 2.4 | 8 | 34 | 0.50 *** | Univoltine | Figure 11 |
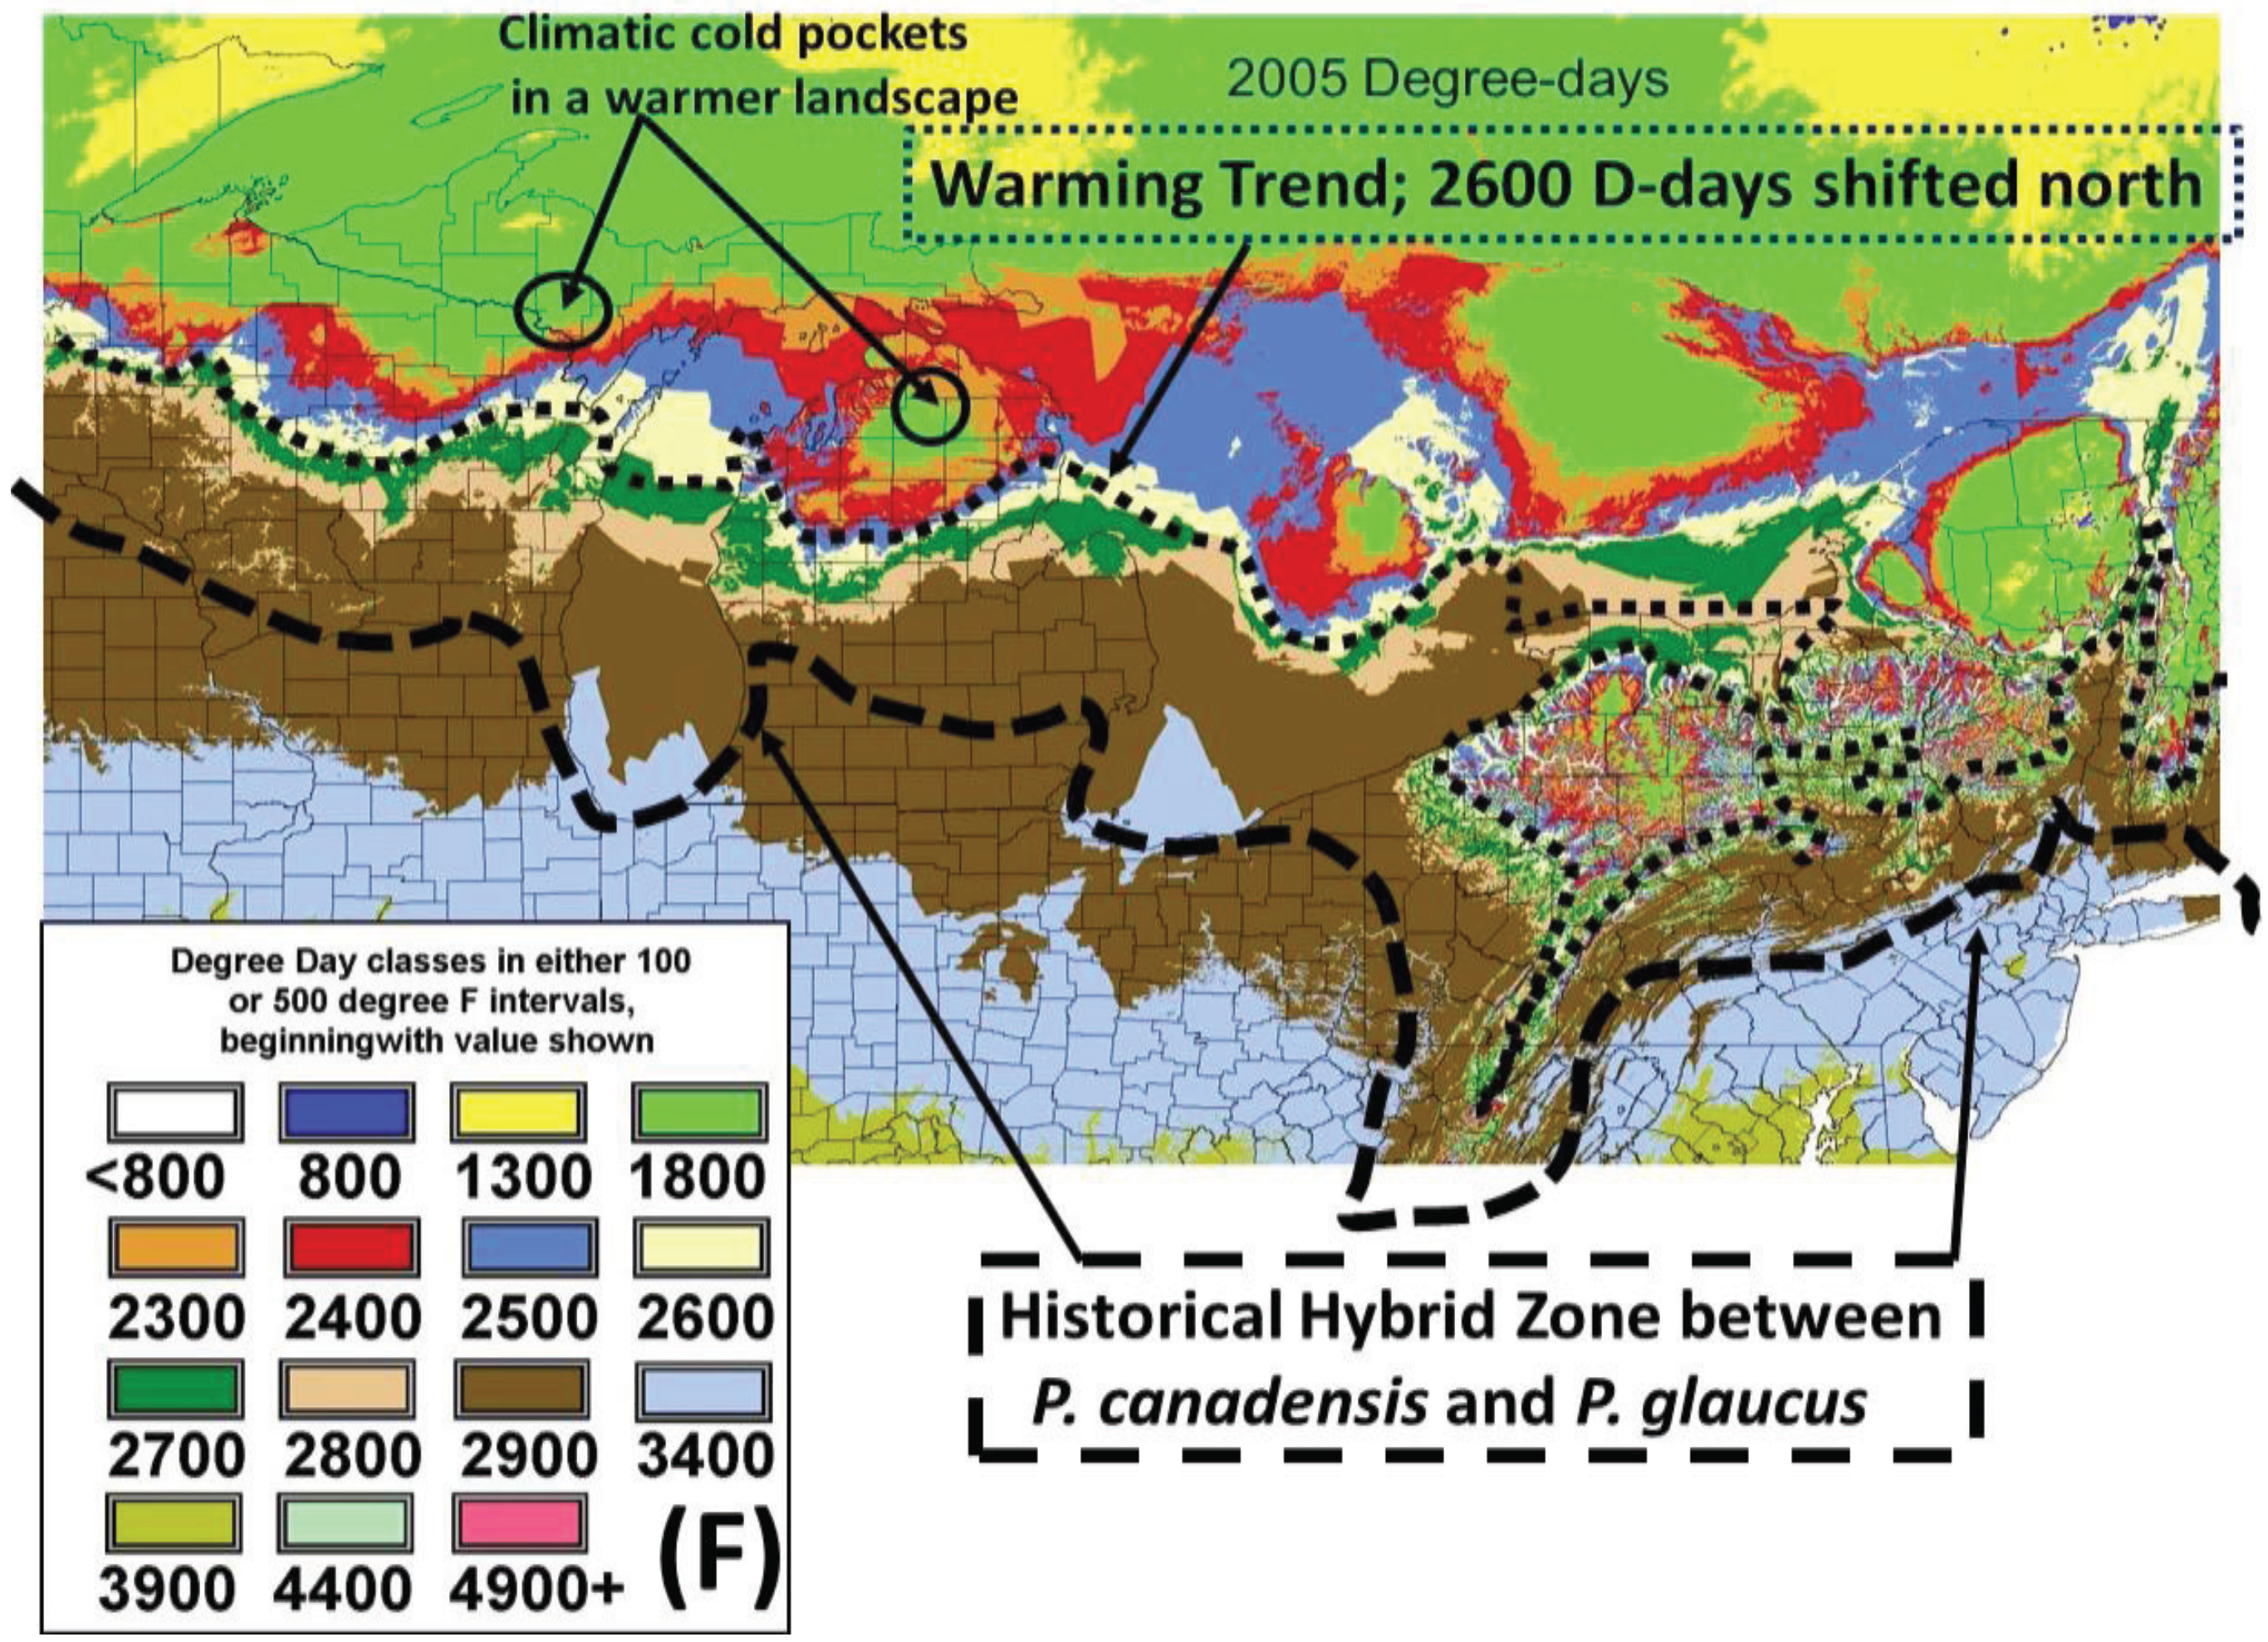
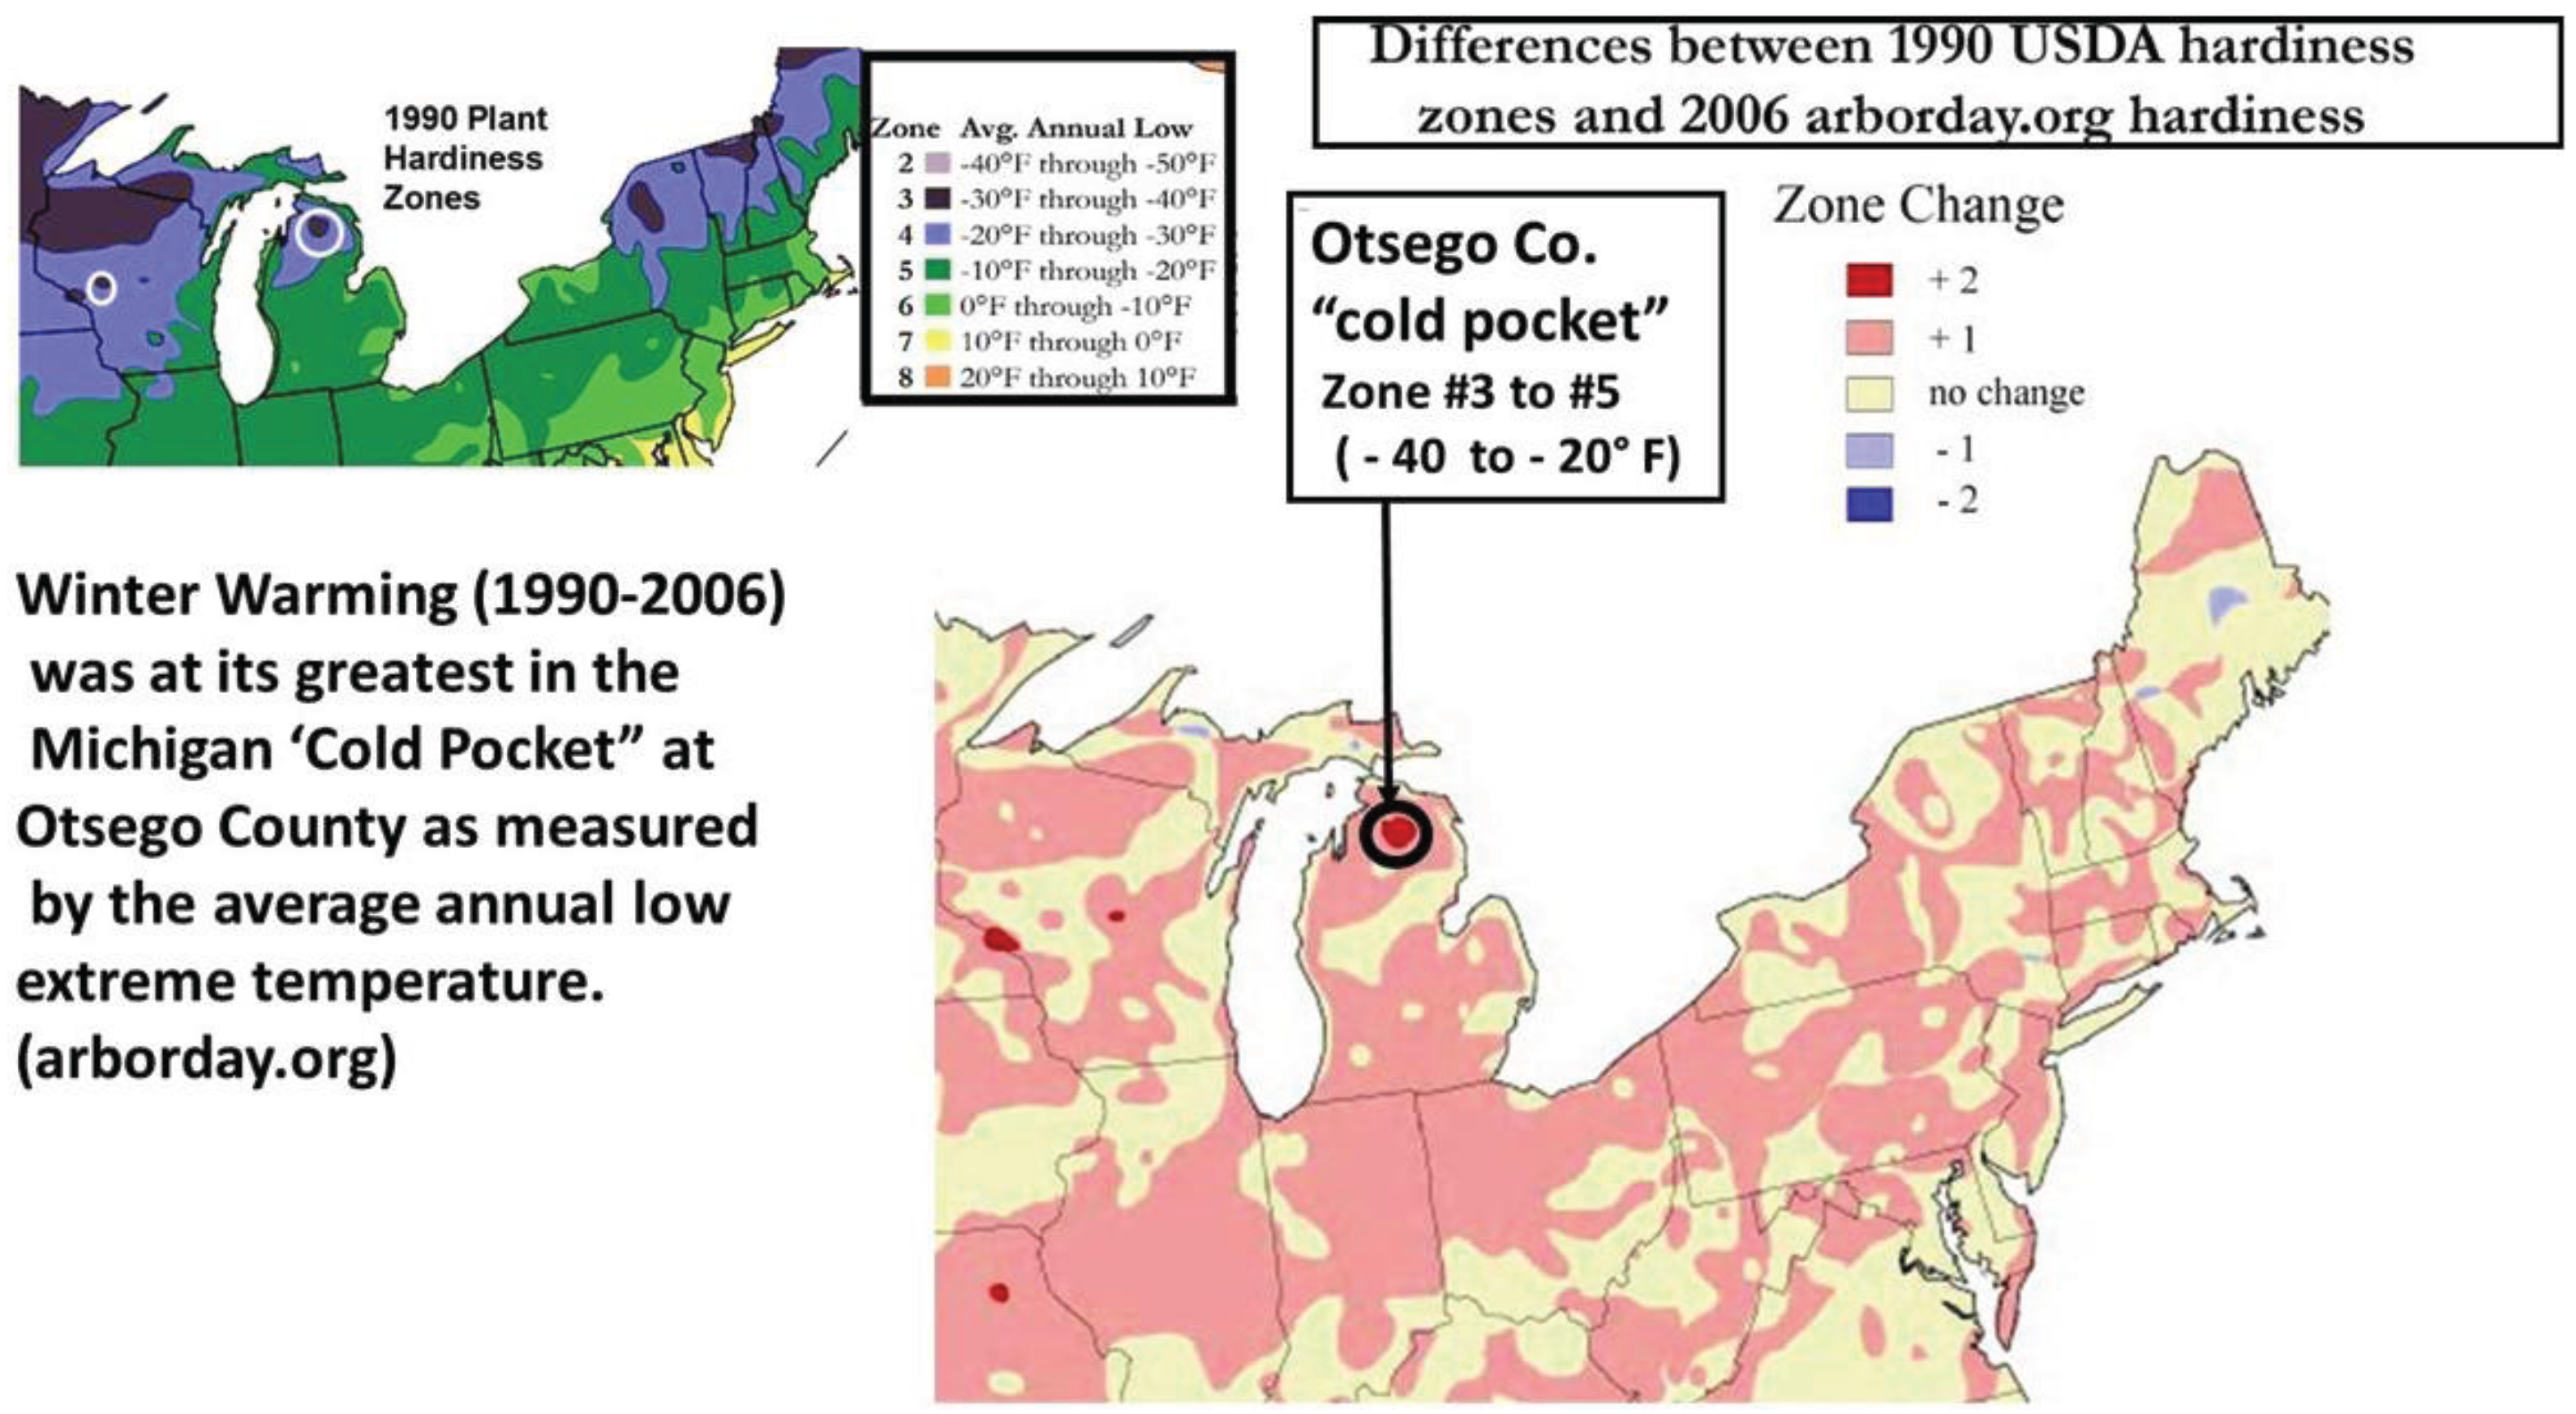
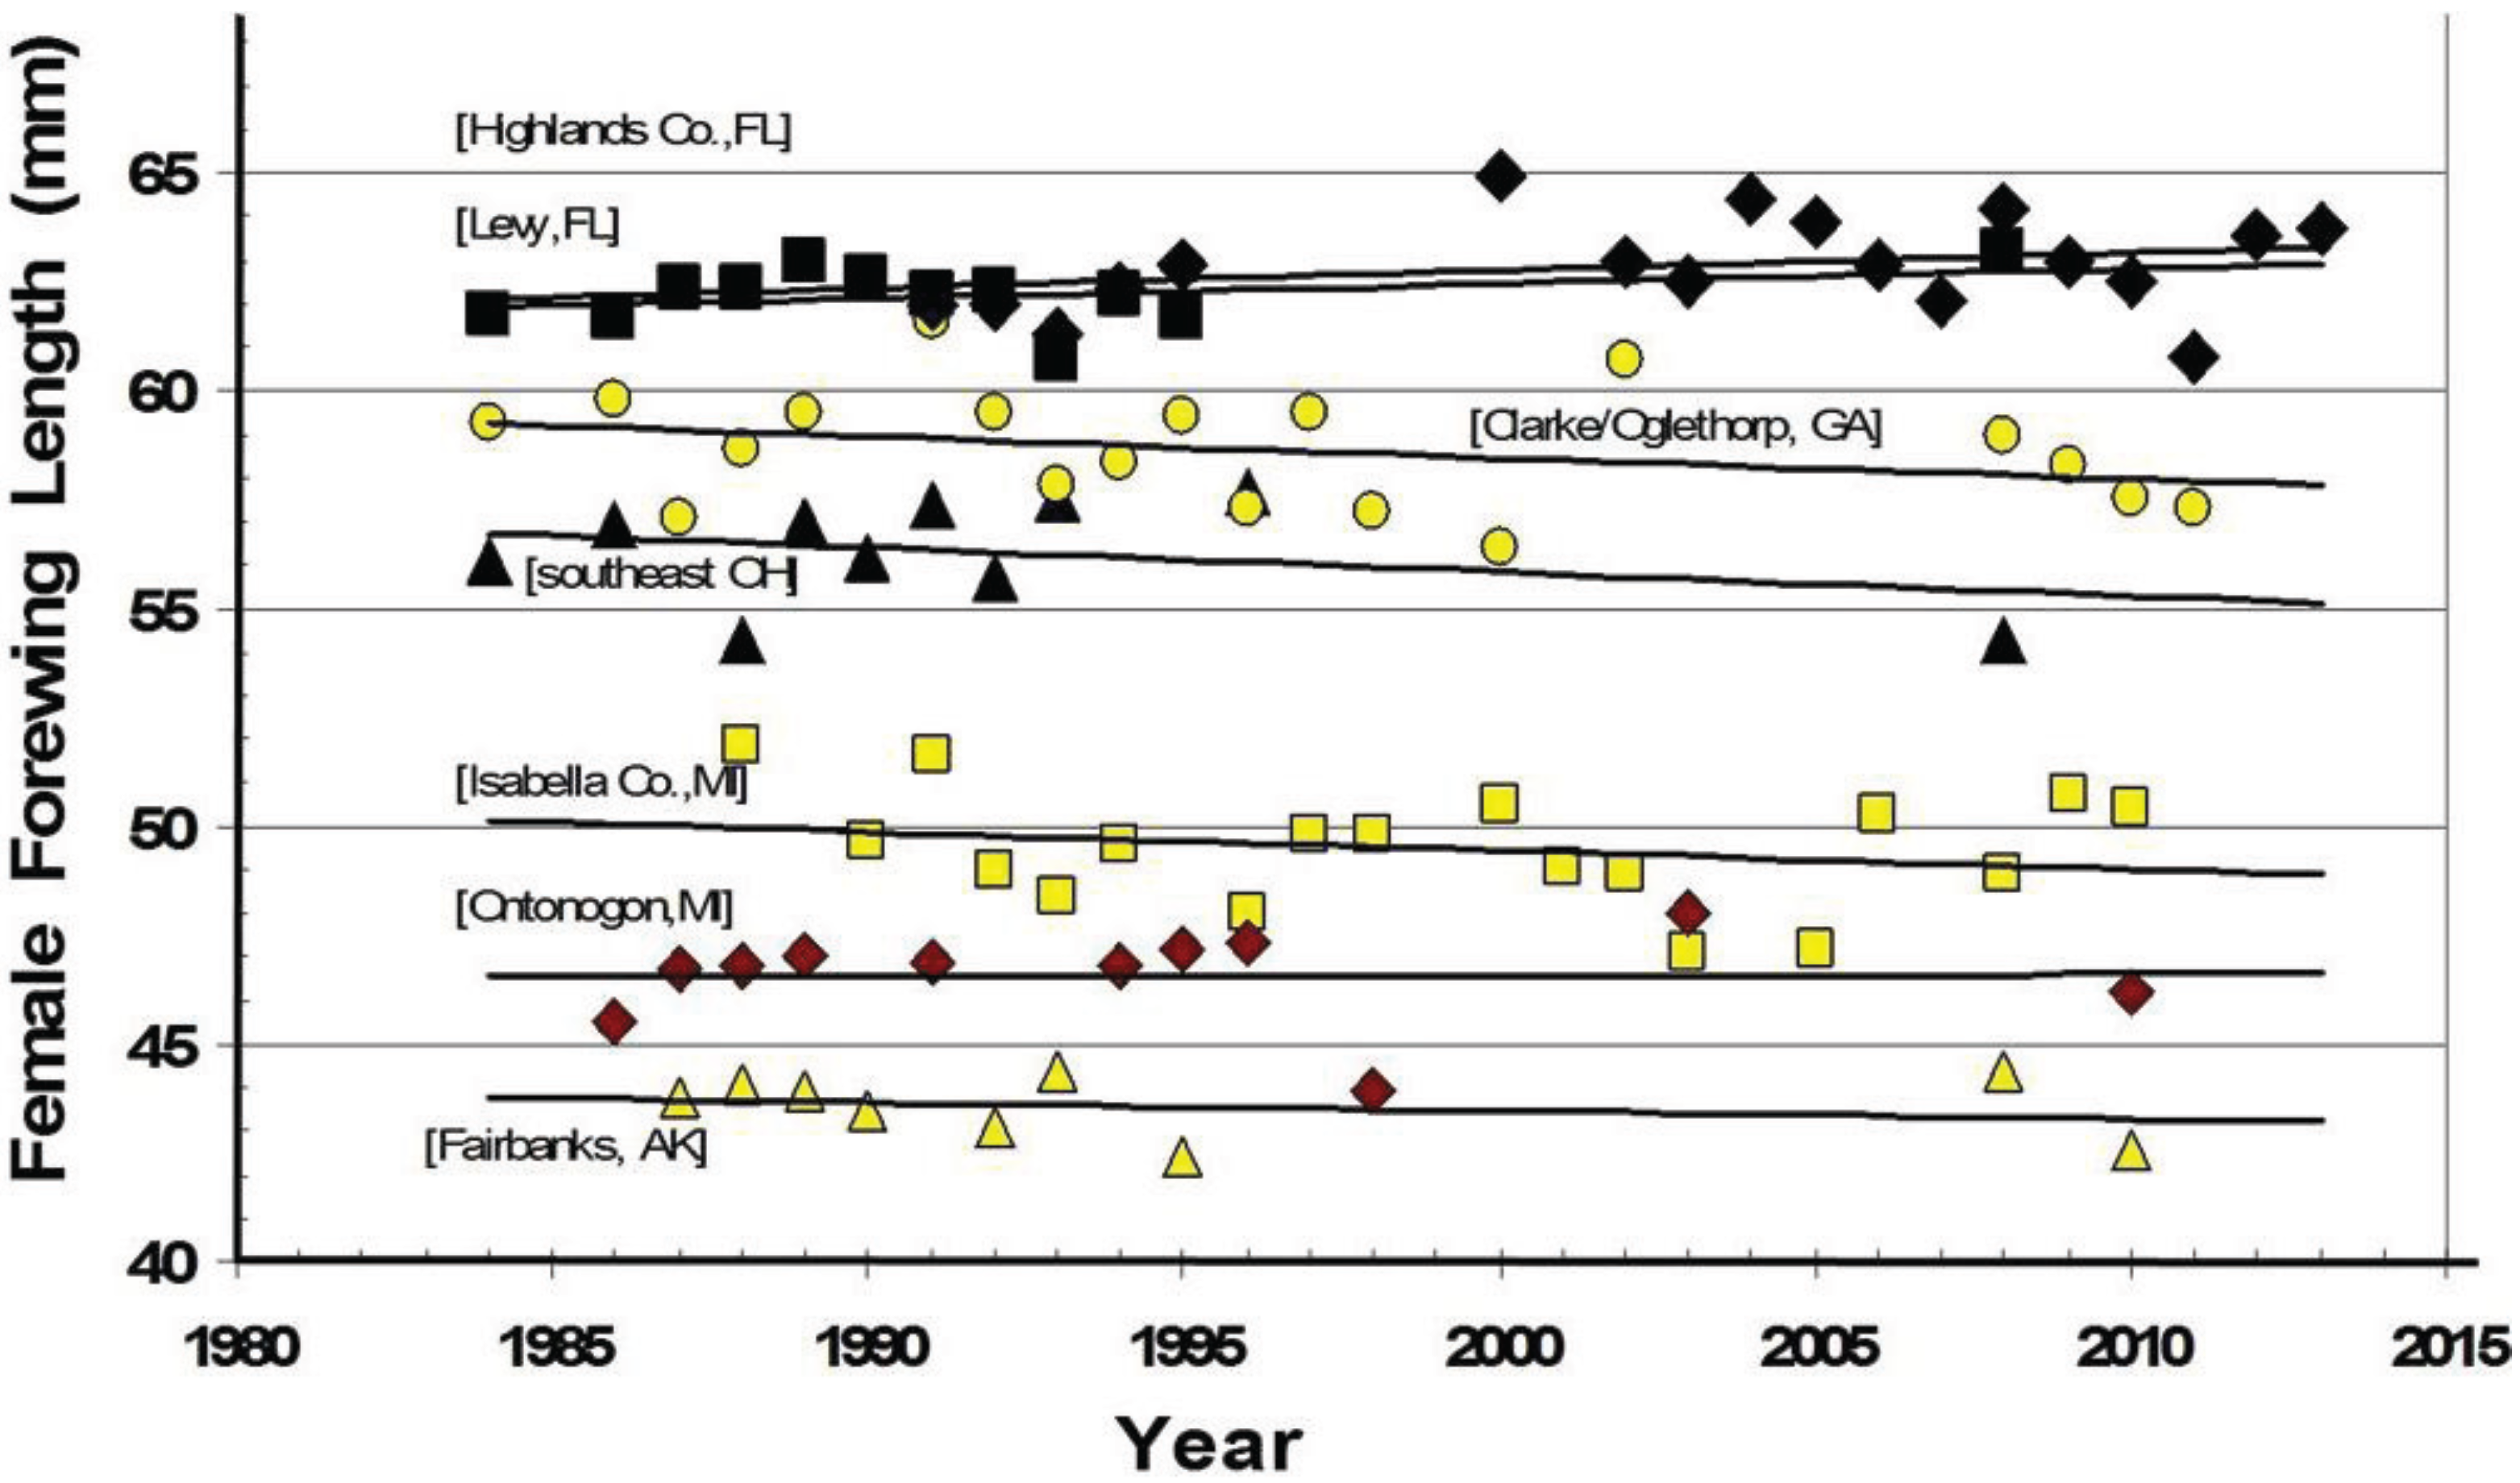
3.2. In Contrast, Females in “Cold Pocket” Populations do Show Increased Size with Recent Warming


4. Discussion

4.1. All Life Stages are Important When Considering Adaptations to Thermal Constraints
4.2. Growth Rates and Voltinism
4.3. Locally Rapid Responses to Climate Change in “Cold Pockets”

5. Conclusions
Acknowledgments
Authors’ contribution
Conflicts of Interest
References
- Scriber, J.M. Impacts of climate warming on hybrid zone movement; geographically diffuse and biologically porous “species borders”. Insect Sci. 2011, 18, 121–159. [Google Scholar] [CrossRef]
- Lehnert, M.S.; Scriber, J.M.; Gerard, P.D.; Emmel, T.C. The “converse of Bergmann’s Rule” in tiger swallowtail butterflies; Boundaries of species and subspecies wing traits are independent of thermal and host-plant induction. Am. Entomol. 2012, 58, 156–165. [Google Scholar]
- Ayres, M.P.; Scriber, J.M. Local adaptations to regional climates in Papilio canadensis (Lepidoptera: Papilionidae). Ecol. Monogr. 1994, 64, 465–482. [Google Scholar] [CrossRef]
- Scriber, J.M.; Lederhouse, R.C. The thermal environment as a resource dictating geographic patterns of feeding specialization of insect herbivores. In Effects of Resource Distribution on Animal-Plant Interactions; Hunter, M.R., Ohgushi, T., Price, P.W., Eds.; Academic Press: New York, NY, USA, 1992; pp. 429–466. [Google Scholar]
- Scriber, J.M. A new cold pocket hypothesis to explain local host preference shifts in Papilio canadensis. Entomol. Exp. Appl. 1996, 80, 315–319. [Google Scholar]
- Scriber, J.M. Latitudinal and local geographic mosaics in host plant preferences as shaped by thermal units and voltinism in Papilio spp. (Lepidoptera). Eur. J. Entomol. 2002, 99, 225–239. [Google Scholar] [CrossRef]
- Grossmueller, D.W.; Lederhouse, R.C. Oviposition site selection: An aid to rapid growth and development in the tiger swallowtail butterfly, Papilio glaucus. Oecologia 1985, 66, 68–73. [Google Scholar] [CrossRef]
- Lederhouse, R.C.; Ayres, M.P.; Scriber, J.M. Physiological and behavioral adaptations to variable thermal environments in North American swallowtail butterflies. In Swallowtail Butterflies: Their Ecology and Evolutionary Biology; Scriber, J.M., Tsubaki, Y., Lederhouse, R.C., Eds.; Scientific Publishers: Gainesville, FL, USA, 1995; pp. 71–82. [Google Scholar]
- Scriber, J.M.; Ording, G.J.; Mercader, R.J. Hybrid introgression and parapatric speciation in a hybrid zone. In Specialization, Speciation, and Radiation: the Evolutionary Biology of Herbivorous Insects; Tilmon, K.J., Ed.; University of California Press: Berkeley, CA, USA, 2008; pp. 69–87. [Google Scholar]
- Scriber, J.M.; Maher, E.; Aardema, M.L. Differential effects of short term winter thermal stress on diapausing tiger swallowtail butterflies (Papilio spp.). Insect Sci. 2012, 19, 277–285. [Google Scholar] [CrossRef]
- Feder, J.L.; Roethele, J.B.; Wlazlo, B.; Berlocher, S.H. Selective maintenance of allozyme differences among sympatric host races of the apple maggot fly. Proc. Natl. Acad. Sci. USA 1997, 94, 11417–11421. [Google Scholar] [CrossRef]
- Masaki, S. Ecophysiological consequences of variability of diapause intensity. Eur. J. Entomol. 2002, 99, 143–154. [Google Scholar] [CrossRef]
- Hagen, R.H.; Lederhouse, R.C.; Bossart, J.L.; Scriber, J.M. Papilio canadensis and P. glaucus (Papilionidae) are distinct species. J. Lepid. Soc. 1991, 45, 245–258. [Google Scholar]
- Rockey, S.J.; Hainze, J.H; Scriber, J.M. A latitudinal and obligatory diapause response in three subspecies of the eastern tiger swallowtail Papilio glaucus (Lepidoptera: Papilionidae). Am. Midl. Nat. 1987, 118, 162–168. [Google Scholar] [CrossRef]
- Scriber, J.M.; Deering, M.D.; Francke, L.; Wehling, W.; Lederhouse, R.C. Notes on the butterfly population dynamics of three Papilio species in south central Florida (Highlands County). Holarctic Lepid. 1998, 5, 53–62. [Google Scholar]
- Lehnert, M.; Scriber, J.M. Salicaceae detoxification abilities in Florida Swallowtail butterflies (Papilio glaucus maynardi Gauthier): Novel ability or Pleistocene holdover? Insect Sci. 2012, 19, 337–345. [Google Scholar] [CrossRef]
- Scriber, J.M. Climatic legacies and sex chromosomes: Latitudinal patterns of voltinism, diapause, size and host-plant selection in 2 species of swallowtail butterflies at their hybrid zone. In Insect Life-Cycle Polymorphism: Theory, Evolution and Ecological Consequences for Seasonality and Diapause Control; Danks, H.V., Ed.; Kluwer Academic Publishers: Dordrecht, The Netherlands, 1994; pp. 133–171. [Google Scholar]
- Nylin, S.; Gotthard, K. Plasticity in life history traits. Annu. Rev. Entomol. 1998, 43, 63–83. [Google Scholar] [CrossRef]
- Blanckenhorn, W.U.; Demont, M. Bergmann and converse Bergmann latitudinal clines in arthropods: Two ends of a continuum. Integr. Comp. Biol. 2004, 44, 413–424. [Google Scholar] [CrossRef]
- Diamond, S.E.; Kingsolver, J.G. Environmental dependence of thermal reaction norms: Host plant quality can reverse the temperature-size rule. Am. Nat. 2010, 175, 1–10. [Google Scholar] [CrossRef]
- Williams, C.M.; Marshall, K.E.; MacMillan, H.A.; Dzurisin, J.D.K.; Hellmann, J.J.; Sinclair, B.J. Thermal variability increases the impact of Autumnal warming and drives metabolic depression in an overwintering butterfly. PLoS One 2012, 3, e34470. [Google Scholar]
- Scriber, J.M.; Slansky, F. The nutritional ecology of immature insects. Annu. Rev. Entomol. 1981, 26, 183–211. [Google Scholar] [CrossRef]
- Slansky, F.; Scriber, J.M. Food consumption and utilization. In Comprehensive Insect Physiology, Biochemistry, and Pharmacology; Kerkut, G.A., Gilbert, L.I., Eds.; Permagon Press: Oxford, UK, 1985; pp. 87–163. [Google Scholar]
- Mattson, W.J.; Scriber, J.M. Nutritional ecology of insect folivores of woody plants: Water, nitrogen, fiber, and mineral considerations. In Nutritional Ecology of Insects, Mites, and Spiders; Slansky, F., Jr., Rodriques, J.G., Eds.; Wiley: New York, NY, USA, 1987; pp. 105–146. [Google Scholar]
- Portner, H.O.; Bennett, A.F.; Bozinovic, F.; Clarke, A.; Lardies, M.A.; Lenski, R.E.; Lucassen, M.; Pelster, B.; Schiemer, F.; Stillman, J.H. Trade-offs in thermal adaptation: The need for a molecular to ecological integration. Phys. Biochem. Zool. 2006, 79, 295–313. [Google Scholar] [CrossRef]
- Remington, C.L. Suture zones of hybrid interaction between recently joined biotas. In Evolutionary Biology; Dobzhanski, T., Hecht, M.K., Steere, W.C., Eds.; Plenum Press: New York, NY, USA, 1968; pp. 321–348. [Google Scholar]
- Ording, G.J.; Mercader, R.J.; Aardema, M.L.; Scriber, J.M. Allochronic isolation and incipient hybrid speciation in tiger swallowtail butterflies. Oecologia 2010, 162, 523–531. [Google Scholar] [CrossRef]
- Kunte, K.; Shea, C.; Aardema, M.L.; Scriber, J.M.; Junger, T.E.; Gilbert, L.E.; Kronforst, M.R. Sex chromosome mosaicism and hybrid speciation among tiger swallowtail butterflies. PLoS Genet. 2011, 7, e1002274. [Google Scholar]
- Scriber, J.M.; Ording, G.L. Ecologial speciation without host plant specialization: Possible origins of a recently described cryptic Papilio species (Lepidoptera: Papilionidae). Ent. Exp. Appl. 2005, 115, 247–263. [Google Scholar] [CrossRef]
- Pavulaan, H.; Wright, D.M. Pterourus appalachiensis (Papilionidae: Papilioninae), a new swallowtailbutterfly from the Appalachian region of the United States. Taxonomic Rept. 2002, 4, 1–20. [Google Scholar]
- Balint, M.; Domisch, S.; Engelhardt, C.H.M.; Haase, P.; Lehrian, S.; Sauer, J.; Thessinger, K.; Pauls, S.U.; Nowak, C. Cryptic biodiversity loss linked to global climate change. Nat. Clim. Chang. 2011, 1, 313–318. [Google Scholar] [CrossRef]
- Pauls, S.U.; Nowak, C.; Balint, M.; Pfenninger, M. The impact of global climate change on genetic diversity within populations and species. Mol. Ecol. 2013, 22, 925–946. [Google Scholar] [CrossRef]
- Bedford, F.E.; Whittaker, R.J.; Kerr, J.T. Systemic range shift lags among a pollinator species assemblage following rapid climate change. Botany 2012, 90, 587–597. [Google Scholar] [CrossRef]
- Taylor, F. Ecology and evolution of physiological time in insects. Am. Nat. 1981, 117, 1–23. [Google Scholar]
- Spangler, S.M.; Calvin, D.D.; Russo, J.; Schlegel, J. Predicting risk of European corn borer infestation in sweet corn based on harvest date. Hort. Technol. 2009, 19, 173–180. [Google Scholar]
- Scriber, J.M.; Lederhouse, R.C. Temperature as a factor in the development and feeding ecology of tiger swallowtail caterpillars, Papilio glaucus. Oikos 1983, 40, 95–102. [Google Scholar] [CrossRef]
- Beck, S.D.; Apple, J.W. Effects of temperature and photoperiod on voltinism of geographical population s of the European corn borer, Pyrausta nubilalis. J. Econ. Entom. 1961, 54, 550–558. [Google Scholar]
- Eckenrode, C.J.; Robbins, P.S.; Andaloro, J.T. Variations in flight patterns of the European corn borer (Lepidoptera: Pyralidae) in New York. Environ. Entom. 1983, 12, 393–396. [Google Scholar]
- Calvin, D.D.; Higgins, R.A.; Knapp, M.C.; Poston, F.L.; Welch, S.M.; Showers, W.B.; Witkowski, J.F.; Mason, C.E.; Chiang, H.C.; Keaster, A.J. Similarities in developmental rates of geographically separate European corn -borer (Lepidoptera, Pyralidae) populations. Environ. Entom. 1991, 20, 441–449. [Google Scholar]
- Eichenlaub, V.L.; Harman, J.R; Nurnberger, F.V.; Stolle, H.J. The Climatic Atlas of Michigan. Notre Dame; Notre Dame Press: Notre Dame, IN, USA, 1990; p. 165. [Google Scholar]
- Hagen, R.H.; Lederhouse, R.C. Polymodal emergence of the tiger swallowtail, Papilio glaucus (Lepidoptera: Papilionidae): Source of a false second generation in central New York State. Ecol. Entom. 1985, 10, 19–28. [Google Scholar] [CrossRef]
- Scriber, J.M.; Hainze, J. Geographic variation in host utilization and the development of insect outbreaks. In Insect Outbreaks: Ecological and Evolutionary Processes; Barbosa, P., Schultz, J.C., Eds.; Academic Press: New York, NY, USA, 1987; pp. 433–468. [Google Scholar]
- Showers, W.B. Geographic variation of the diapause response in the European corn borer. In Insect Life History Patterns: Habitat and Geographic Variation; Denno, R.F., Dingle, H., Eds.; Springer Verlag: New York, NY, USA, 1981; pp. 97–111. [Google Scholar]
- Hellmann, J.J.; Weiss, S.B.; McLaughlin, J.F.; Boggs, C.L.; Ehrlich, P.R.; Launer, A.E.; Murphy, D.D. Do hypotheses from short-term studies hold in the long-term? An empirical test. Ecol. Entomol. 2003, 28, 74–84. [Google Scholar] [CrossRef]
- Matter, S.F.; Doyle, A.; Illerbrun, K.; Wheeler, J.; Rolands, J. An assessment of direct and indirect effects of climate change for populations of the Rocky Mountain Apollo butterfly (Parnassius smintheus Doubleday). Insect Sci. 2011, 18, 385–392. [Google Scholar] [CrossRef]
- Singer, M.C.; Parmesan, C. Phenological asychrony between herbivorous insects and their hosts: Signal of climate change or pre-existing adaptive strategy? Phil. Trans. Royal Soc. B 2010, 365, 3161–3176. [Google Scholar] [CrossRef]
- Forister, M.L.; Jahner, J.P.; Casner, K.L.; Wilson, J.S.; Shapiro, A.M. The race is not to the swift: Long-term data reveal pervasive declines in California’s low-elevation butterfly fauna. Ecology 2011, 92, 2222–2235. [Google Scholar] [CrossRef]
- Parmesan, C.; Gaines, S.; Gonzalez, L.; Kaufman, D.M.; Kingslover, J.; Peterson, A.T.; Sagarin, R. Empirical perspectives on species borders: From traditional biogeography to global change. Oikos 2005, 108, 58–75. [Google Scholar] [CrossRef]
- Magurran, A.E.; Baillie, S.R.; Buckland, S.T.; Dick, J.M.; Elston, D.A.; Scott, E.M.; Somerville, P.J.; Watt, A.O. Long-term data sets in biodiversity research and monitoring: Assessing change in ecological communities through time. Trends Ecol. Evol. 2010, 25, 574–582. [Google Scholar] [CrossRef]
- Jahner, J.P.; Shapiro, A.M.; Forister, M.L. Drivers of hybridization in a 66-generation record of Colias butterflies. Evolution 2010, 66, 818–830. [Google Scholar]
- Hoffmann, A.A.; Sgro, C.M. Climate change and evolutionary adaptation. Nature 2011, 470, 479–485. [Google Scholar] [CrossRef]
- Luebke, H.J.; Scriber, J.M.; Yandell, B.S. Use of multivariate discriminant analysis of male wing morphometrics to delineate a hybrid zone for Papilio glaucus glaucus and P. g. canadensis in Wisconsin. Am. Midi. Nat. 1988, 119, 366–379. [Google Scholar] [CrossRef]
- Scriber, J.M. Interaction of introgression from Papilio glaucus canadensis and diapause in producing “spring form” Eastern tiger swallowtail butterflies, P. glaucus. Great Lakes Entomol. 1990, 23, 127–138. [Google Scholar]
- Scriber, J.M. Evolution of insect-plant relationships: Chemical constraints, coadaptation, and concordance of insect/plant traits. Entomol. Exp. Appl. 2002, 104, 217–235. [Google Scholar]
- Chown, S.L.; Gaston, K.J. Body size variation in insects: A macroecological perspective. Biol. Rev. 2010, 85, 139–169. [Google Scholar] [CrossRef]
- Watt, C.; Mitchell, S.; Salewski, V. Bergmanns’s rule: A concept cluster? Oikos 2010, 119, 89–100. [Google Scholar] [CrossRef]
- Masaki, S. Seasonal and latitudinal adaptations in the life cycles of crickets. In Evolution of Insect Migration and Diapause; Dingle, H., Ed.; Springer: Heidelberg, Germany, 1978; pp. 72–100. [Google Scholar]
- Nylin, S.; Svard, L. Latitudinal patterns in the size of European butterflies. Holarctic Ecol. 1991, 14, 192–202. [Google Scholar]
- Chown, S.L.; Klok, C.J. Altitudinal body size clines: Latitudinal effects associated with changing seasonality. Ecography 2003, 26, 445–455. [Google Scholar] [CrossRef]
- Sinclair, B.J.; Williams, C.M.; Terblanche, J.S. Variation in thermal performance among insect populations. Physiol. Biochem. Zool. 2011, 85, 594–606. [Google Scholar]
- Van Asch, M.; Salis, L.; Holleman, L.J.M.; van Lith, B.; Visser, M. Evolutionary response of the egg hatching date of a herbivorous insect under climate change. Nat. Clim. Chang. 2013, 3, 244–248. [Google Scholar]
- Kukal, O. Biotic and abiotic constraints on foraging of arctic caterpillars. In Caterpillars: Their Ecological and Evolutionary Constraints on Foraging; Stamp, N., Casey, T., Eds.; Chapman & Hall: New York, NY, USA, 1993; pp. 509–522. [Google Scholar]
- Radchuk, V.; Turlure, C.; Schtickzlle, N. Each life stage matters: The importance of assessing the response to climate change over the complete life cycle in butterflies. J. Anim. Ecol. 2013, 82, 275–285. [Google Scholar] [CrossRef]
- Hahn, D.A.; Denlinger, D.L. Meeting the energetic demands of insect diapause: Nutrient storage and utilization. J. Insect Physiol. 2007, 53, 760–773. [Google Scholar] [CrossRef]
- Hahn, D.A.; Denlinger, D.L. Energetics of insect diapause. Annu. Rev. Entomol. 2011, 56, 103–121. [Google Scholar] [CrossRef]
- Bale, J.S.; Hayward, S.A.L. Insect overwintering in a changing climate. J. Exp. Biol. 2010, 213, 980–994. [Google Scholar] [CrossRef]
- Ragland, G.J.; Egan, S.P.; Feder, J.L.; Berlocher, S.H.; Hahn, D.A. Developmental trajectories of gene expression reveal candidates for diapause termination: A key life-history transition in the apple maggot fly, Rhagoletis pomonella. J. Expert Biol. 2011, 214, 3948–3959. [Google Scholar] [CrossRef]
- Mercader, R.J.; Scriber, J.M. Asymmetrical thermal constraints on the parapatric species boundaries of two widespread generalist butterflies. Ecol. Entom. 2008, 33, 537–545. [Google Scholar] [CrossRef]
- Williams, C.M.; Hellmann, J.J.; Sinclair, B.J. Lepidopteran species differ in susceptibility to winter warming. Clim. Res. 2012, 53, 119–130. [Google Scholar] [CrossRef]
- Kukal, O.; Ayres, M.P.; Scriber, J.M. Cold tolerance of pupae in relation to the distribution of tiger swallowtails. Can. J. Zool. 1991, 69, 3028–3037. [Google Scholar]
- Schwartz, M.D.; Ahas, R.; Aasa, A. Onset of spring starting earlier across the Northern Hemisphere. Glob. Change Biol. 2006, 12, 343–351. [Google Scholar] [CrossRef]
- Makowski, K.; Wild, M.; Ohmura, A. Diurnal temperature range over Europe between 1950 and 2005. Atmos. Chem. Phys. 2008, 8, 6483–6498. [Google Scholar] [CrossRef]
- Folguera, G.; Bastias, D.A.; Bozinovic, F. Impact of experimental thermal amplitude on ectotherm performance: Adaptation to climate change variability? Comp. Biochem. Physiol. 2009, 154, 389–393. [Google Scholar] [CrossRef]
- Crozier, L.G. Winter warming facilitates range expansion: cold tolerance of the butterfly Atalopedes campestris. Oecologia 2003, 135, 648–656. [Google Scholar]
- Crozier, L.G. Warmer winters drive butterfly range expansion by increasing survivorship. Ecology 2004, 85, 231–241. [Google Scholar] [CrossRef]
- Tesar, D.; Scriber, J.M. Growth season constraints in climatic cold pockets: Tolerance of subfreezing temperatures and compensatory growth by tiger swallowtail butterfly larvae (Lepidoptera: Papilionidae). Holarctic Lepidopt 2005, 7, 39–44. [Google Scholar]
- Gu, L.; Hanson, P.J.; Pool, W.M.; Kaiser, D.P.; Yang, B.; Nemani, R.; Pallardy, S.G.; Meyers, T. The 2007 Eastern USA Spring freeze: Increased cold damage in a warming world. Bioscience 2008, 58, 253–262. [Google Scholar] [CrossRef]
- Scriber, J.M.; Sonke, B. Effects of diurnal temperature range on adult size and emergence time from diapausing pupae in Papilio glaucus and P. canadensis (Papilionidae). Insect Sci. 2011, 18, 435–442. [Google Scholar] [CrossRef]
- Ziter, C.; Robinson, E.A.; Newman, J.A. Climate change and voltinism in California insect pest species: Sensitivity to location, scenario and climate model choice. Glob. Change Biol. 2012, 18, 2771–2780. [Google Scholar] [CrossRef]
- Raffa, K.F.; Aukema, B.H.; Bentz, B.J.; Carroll, A.L.; Hicke, J.A.; Turner, M.G.; Romme, W.H. Cross-scale drivers of natural disturbances prone to anthropogenic amplification: The dynamics of bark beetle eruptions. Bioscience 2008, 58, 501–517. [Google Scholar] [CrossRef]
- Lafferty, K.D. The ecology of climate change and infectious diseases. Ecology 2009, 90, 888–900. [Google Scholar] [CrossRef]
- Kingsolver, J.G. The well-temperatured biologist. Am. Nat. 2009, 174, 755–768. [Google Scholar] [CrossRef]
- Slansky, F. Relationship of larval food-plants and voltinism patterns in temperate butterflies. Psyche 1974, 81, 243–253. [Google Scholar] [CrossRef]
- Ragland, G.J.; Kingsolver, J.G. Evolution of thermotolerance in seasonal environments: The effects of annual temperature variation and life-history timing in Wyeomyia smithii. Evolution 2008, 62, 1345–1357. [Google Scholar] [CrossRef]
- Scott, J.A. The Butterflies of North America. A Natural History and Field Guide; Stanford University Press: Stanford, CA, USA, 1986. [Google Scholar]
- Yamamura, K.; Kiritani, K. A simple method to estimate the potential increase in numbers of generations under global warming in the temperate zones. Appl. Entomol. Zool. 1998, 33, 289–298. [Google Scholar]
- Musolin, D.L. Insects in a warmer world: Ecological, physiological and life-history response of truebugs (Heteroptera) to climate change. Glob. Change Biol. 2007, 13, 1565–1585. [Google Scholar] [CrossRef]
- Corbet, P.S.; Suhling, F.; Soendgerath, O. Voltinism in Odonata: A review. Intern. J. Odonatol. 2006, 9, 1–44. [Google Scholar] [CrossRef]
- Steinbauer, M.J.; Kriticos, D.J.; Lukacs, Z.; Clarke, A.R. Modelling a forest lepidopteran: Phenological plasticity determines voltinism which influences population dynamics. Forest Ecol. Manag. 2004, 198, 117–131. [Google Scholar] [CrossRef] [Green Version]
- Braune, E.; Richter, O.; Sondgerath, D.; Suhling, F. Voltinism flexibility in a riverine dragonfly along thermal gradients. Glob. Change Biol. 2008, 14, 470–482. [Google Scholar] [CrossRef]
- Tobin, P.C.; Nagarkatti, S.; Loeb, G.; Saunders, M.C. Historical and projected interactions between climate change and insect voltinism in a multivoltine species. Glob. Clim. Chang. 2008, 14, 951–957. [Google Scholar]
- Jonsson, A.M.; Appelberg, G.; Harding, S.; Barring, L. Spatio-temporal impact of climate change on the activity and voltinism of the spruce bark beetle, Ips typographus. Glob. Change Biol. 2009, 15, 486–499. [Google Scholar] [CrossRef]
- Valimaki, P.; Kivela, S.M.; Jaaskelainen, L.; Kaitela, A.; Kaitala, V.; Oksanen, J. Divergent timing of egg-laying may maintain life history polymorphism in potentially multivoltine insects in seasonal environments. J. Evol. Biol. 2008, 21, 1711–1723. [Google Scholar] [CrossRef]
- Altermatt, F. Climatic warming increases voltinism in European butterflies and moths. Proc. R. Soc. Lon. 2010, 277, 1281–1287. [Google Scholar]
- Poyry, J.; Leinonen, R.; Soderman, G.; Nieminen, M.; Heikkinen, R.K.; Carter, T.R. Climateinduced increase of moth multivoltinism in boreal regions. Glob. Ecol. Biogeog. 2011, 20, 289–298. [Google Scholar] [CrossRef]
- Johansson, F. Latitudinal shifts in body size of Enallagama cyathigerum (Odonata). J. Biogeog. 2003, 30, 29–34. [Google Scholar] [CrossRef]
- Logan, J.A.; Regniere, J.; Powell, J.A. Assessing the impacts of global warming on forest pest dynamics. Front. Ecol. Environ. 2003, 1, 130–137. [Google Scholar] [CrossRef]
- Hansen, E.M.; Bentz, B.J. Comparison of reproductive capacity among univoltine, semivoltine, and re-emerged parent spruce beetles (Coleoptera: Scolytidae). Can. Entom. 2003, 135, 697–712. [Google Scholar] [CrossRef]
- Berg, E.E.; Henry, J.D.; Fastie, C.L.; DeVoider, A.D.; Matsuoka, S.M. Spruce beetle outbreaks on the Kenai Peninsula, Alaska, and Kluane National Park and Reserve, Yukon Territory: Relationship to summer temperatures and regional differences in disturbance regimes. Forest Ecol. Manag. 2006, 227, 219–232. [Google Scholar] [CrossRef]
- Arendt, J.D. Adaptive intrinsic growth rates: An integration across taxa. Rev. Biol 1997, 72, 149–173. [Google Scholar]
- Dmitriew, C.M. The evolution of growth trajectories: What limits growth rates? Biol. Rev. 2011, 86, 97–116. [Google Scholar] [CrossRef]
- Tammaru, T.; Nylin, S.; Ruohomaki, K.; Gotthard, K. Compensatory responses in lepidopteran larvae: A test of growth rate maximization. Oikos 2004, 107, 352–362. [Google Scholar]
- Reavey, D. Why body size matters to caterpillars. In Caterpillars: Ecological and Evolutionary Constraints on Foraging; Stamp, N.E., Casey, T.M., Eds.; Chapman and Hall: New York, NY, USA, 1993; pp. 248–279. [Google Scholar]
- Stoks, R.; de Block, M. Rapid growth reduces cold resistance: Evidence from latitudinal variation in growth rate, cold resistance, and stress proteins. PLoS One 2011, 6, e16935. [Google Scholar] [CrossRef] [Green Version]
- Schwarzenbach, G.A.; Ward, P.I. Phenoloxidase activity and pathogen resistance in yellow dungflies, Scathophaga sterocoraria. J. Evol. Biol. 2007, 20, 2192–2199. [Google Scholar] [CrossRef]
- Schulte, P.M.; Glemet, H.C.; Fiebig, A.A.; Powers, D.A. Adaptive variation in lactate dehydrogenase-B gene expression: Role of a stress-responsive regulatory element. Proc. Natl. Acad. Sci. USA 2000, 97, 6597–6602. [Google Scholar] [CrossRef]
- Dahlhoff, E.P.; Rank, N.E. Functional and physiological consequences of genetic variation at phosphoglucose isomerase: Heat shock protein expression is related to enzyme genotype in a montane beetle. Proc. Natl. Acad. Sci. USA 2000, 97, 10056–10061. [Google Scholar] [CrossRef]
- Hoffmann, A.A. A genetic perspective on insect climate specialists. Aust. J. Entomol. 2010, 49, 93–103. [Google Scholar] [CrossRef]
- Scriber, J.M. Integrating ancient patterns and current dynamics of insect-plant interactions: Taxonomic and geographic variation in herbivore specialization. Insect Sci. 2010, 17, 471–507. [Google Scholar] [CrossRef]
- Hill, J.K.; Griffiths, H.M.; Thomas, C.D. Climate change and evolutionary adaptations at species’ ranges. Annu. Rev. Entomol. 2011, 56, 143–159. [Google Scholar] [CrossRef]
- Dopman, E.B.; Perez, L.; Bogdanowicz, S.M.; Harrison, R.G. Consequences of reproductive barriers for genealogical discordance in the European corn borer. Proc. Natl. Acad. Sci. USA 2005, 102, 14706–14711. [Google Scholar] [CrossRef]
- Dopman, E.B.; Robbins, P.S.; Seaman, A. Components of reproductive isolation between North American pheromone strains of the European corn borer. Evolution 2010, 64, 881–902. [Google Scholar] [CrossRef]
- Redman, A.; Scriber, J.M. Competition between gypsy moth, Lymantria dispar, and the northern tiger swallowtail, Papilio canadensis: Interactions mediated by host plant chemistry, pathogens, and parasitoids. Oecologia 2000, 125, 218–228. [Google Scholar] [CrossRef]
- Murphy, S.M. Enemy-free space maintains swallowtail butterfly host shift. Proc. Natl. Acad. Sci. USA 2004, 101, 18048–18052. [Google Scholar] [CrossRef]
- Scriber, J.M.; Gage, S. The swallowtail butterflies: Their ecology and evolutionary biology. In Pollution and Global climate Change: Plant Ecotones, Butterfly Hybrid Zones, and Biodiversity; Scriber, J.M., Tsubaki, Y., Lederhouse, R.H., Eds.; Scientific Publishers, Inc.: Gainesville, FL, USA, 1995; pp. 319–344. [Google Scholar]
- Scriber, J.M. Absence of behavioral induction in oviposition preference of Papilio glaucus (Lepidoptera: Papilionidae). Great Lakes Entomol. 1993, 26, 81–95. [Google Scholar]
- Mercader, R.J.; Scriber, J.M. Diversification of host use in two polyphagous butterflies: Differences in oviposition specificity or host rank hierarchy? Entom. Exp. Appl. 2007, 125, 89–101. [Google Scholar] [CrossRef]
- Mercader, R.J.; Scriber, J.M. Divergence in the ovipositional behavior of the Papilio glaucus group. Insect Sci. 2008, 15, 361–367. [Google Scholar] [CrossRef]
- Mercader, R.J.; Aardema, M.L.; Scriber, J.M. Hybridization leads to host-use divergence in a polyphagous butterfly sibling species pair. Oecologia 2009, 158, 651–662. [Google Scholar] [CrossRef]
- Stamp, N.E. A temperate region view of the interaction of temperature, food quality, and predators on caterpillar foraging. In Caterpillars: Ecological and Evolutionary Constraints on Foraging; Stamp, N.E., Casey, T.M., Eds.; Chapman and Hall: New York, NY, USA, 1993; pp. 478–508. [Google Scholar]
- Both, C.; van Asch, M.; Bijlsma, R.G.; van den Burg, A.B.; Visser, M.E. Climate change and unequal phonological changes across four trophic levels: Constraints and adaptations. J. Anim. Ecol. 2009, 78, 73–83. [Google Scholar] [CrossRef]
- Thomson, L.J.; MacFadgen, S.; Hoffmann, A.A. Predicting the effects of climate change on natural enemies of agricultural pests. Biol. Control 2010, 52, 296–306. [Google Scholar] [CrossRef]
- Sunday, J.M.; Bates, A.E.; Dulvy, N.K. Global analysis of thermal tolerance and latitude in ectotherms. Proc. Biol. Sci. 2011, 278, 1823–1827. [Google Scholar] [CrossRef]
- Norberg, J.; Urban, M.C.; Klausmeier, C.A.; Loeuille, N. Eco-evolutionary responses of biodiversity to climate change. Nat. Clim. Chang. 2012, 2, 747–751. [Google Scholar] [CrossRef]
- Winkler, I.S.; Mitter, C.; Scheffer, S.J. Repeated climate-linked host shifts have promoted diversification in a temperate clade of leaf-mining flies. Proc. Natl. Acad. Sci. USA 2009, 106, 18103–18108. [Google Scholar] [CrossRef]
- Forister, M.L.; Dyer, L.A.; Singer, M.S.; Stireman, J.O.; Lill, J.T. Revisiting the evolution of ecological specialization, with emphasis on insect-plant interactions. Ecology 2012, 93, 981–991. [Google Scholar] [CrossRef]
- Berggren, A.; Bjorkman, C.; Bylund, H.; Ayres, M.P. The distribution and abundance of animal populations in a climate of uncertainty. Oikos 2009, 118, 1121–1126. [Google Scholar] [CrossRef]
- Juroszek, P.; von Tiedmann, A. Plant pathogens, insect pests and weeds in a changing global climate: A review of approaches, challenges, research gaps, key studies and concepts. J. Agric. Sci. 2013, 151, 163–185. [Google Scholar] [CrossRef]
- Wagner, K.D.; Krauss, J.; Steffan-Dewenter, I. Butterfly diversity and historical land coverage along an altitudinal gradient. J. Insect Cons. 2013. [Google Scholar] [CrossRef]
- Pelini, S.L.; Keppel, J.A.; Kelly, A.E.; Hellmann, J.J. Adaptation to host plants may prevent rapid insect responses to climate change. Glob. Change Biol. 2010, 16, 2923–2929. [Google Scholar]
- Aardema, M.L.; Scriber, J.M.; Hellmann, J.J. Considering local adaptation in issues of Lepidopteran conservation—A review and recommendations. Am. Midl. Nuturalist 2011, 165, 294–303. [Google Scholar] [CrossRef]
- Balanya, J.; Oller, J.M.; Huey, R.B.; Gilchrist, G.W.; Serra, L. Global genetic change tracks global climate warming in Drosophila subobscura. Science 2006, 313, 1773–1775. [Google Scholar] [CrossRef]
- Culumber, Z.W.; Shepard, D.B.; Coleman, S.W.; Rosenthal, G.G.; Tobler, M. Physiological adaptation along environmental gradients and replicated hybrid zone structure in swordtails (Teleostei: Xiphorus). J. Evol. Biol. 2012, 25, 1800–1814. [Google Scholar] [CrossRef]
- Hellmann, J.J.; Pelini, S.J.; Prior, K.M.; Dzurisin, J.D.K. The response of two butterfly species to climatic variation at the edge of their range and the implications for poleward range shifts. Oecologia 2008, 157, 583–592. [Google Scholar] [CrossRef]
- Robinson, E.A.; Ryan, G.D.; Newman, J.A. A meta-analytical review of the effects of elevated CO2 on plant-arthropod interactions highlights the importance of interacting environmental and biological variables. New Phytol. 2012, 194, 321–336. [Google Scholar] [CrossRef]
- Stump, A.O.; Crim, A.; Sperling, F.A.H.; Scriber, J.M. Gene flow between Great Lakes region populations of the Canadian tiger swallowtail butterfly, Papilio canadensis, near the hybrid zone with P. glaucus (Lepidoptera: Papilionidae). Great Lakes Entomol 2003, 36, 41–53. [Google Scholar]
- Deering, M.D.; Scriber, J.M. Field bioassays show heterospecific mating preference asymmetry between hybridizing North American Papilio butterfly species (Lepidoptera: Papilionidae). J. Ethol. 2002, 20, 25–33. [Google Scholar] [CrossRef]
- Donovan, J.; Scriber, J.M. Detection and verification of a natural primary hybridization event between two tiger swallowtail butterfly species in northern Michigan. J. Lepidopt. Soc. 2003, 57, 25–35. [Google Scholar]
- Lederhouse, R.C.; Scriber, J.M. The ecological significance of a post-mating decline in egg viability in the tiger swallowtail, Papilio glaucus L. (Papilionidae). J. Lepid. Soc. 1987, 41, 83–93. [Google Scholar]
- Lederhouse, R.L.; Ayres, M.P.; Scriber, J.M. Evaluation of spermatophore counts in studying mating systems of Lepidoptera. J. Lepid. Soc. 1989, 43, 93–101. [Google Scholar]
- Stump, A.; Scriber, J.M. Sperm precedence in experimental interspecific multiple matings of hybridizing North American tiger swallowtail butterflies (Lepidoptera: Papilionidae)? J. Lepidopt.Soc. 2006, 60, 65–78. [Google Scholar]
- Rockey, S.J.; Hainze, J.H.; Scriber, J.M. Evidence of a sex linked diapause response in Papilio glaucus subspecies and their hybrids. Physiol. Entomol. 1987, 12, 181–184. [Google Scholar] [CrossRef]
- Hagen, R.H.; Scriber, J.M. Sex linked diapause, color, and allozyme loci in Papilio glaucus: Linkage analysis and significance in a hybrid zone. Heredity 1989, 80, 179–185. [Google Scholar]
- Keller, I.; Seehausen, O. Thermal adaptation and ecological speciation. Molec. Ecol. 2012, 21, 782–799. [Google Scholar] [CrossRef]
- Nosil, P.; Feder, J.L. Genomic divergence during speciation: Causes and consequences. Phil. Trans.R. Soc. 2012, 367, 332–342. [Google Scholar] [CrossRef]
- Nice, C.C.; Gompert, Z.; Fordyce, J.A.; Forister, M.L.; Lucas, L.K. Hybrid speciation and independent evolution in lineages of alpine butterflies. Evolution 2013, 67, 1055–1068. [Google Scholar] [CrossRef]
- Glover, T.J.; Robbins, P.S.; Eckenrode, C.J.; Roelofs, W.L. Genetic control of voltinism characteristics in European corn borer races assessed with a marker gene. Arch. Insect Biochem. Physiol. 1992, 20, 107–117. [Google Scholar] [CrossRef]
- Franks, S.J.; Hoffmann, A.A. Genetics of climate change adaptation. Annu. Rev. Genetics 2012, 46, 185–208. [Google Scholar] [CrossRef]
- Dittrich-Reed, D.R.; Fitzpatrick, B.M. Transgressive hybrids as hopeful monsters. Evol. Biol. 2012. [Google Scholar] [CrossRef]
- Scriber, J.M.; Keefover, K.; Nelson, S. Hot summer temperatures may stop movement of Papilio canadensis butterflies and genetic introgression south of the hybrid zone in the North American Great Lakes region. Ecography 2002, 25, 184–192. [Google Scholar] [CrossRef]
- Putnam, A.S.; Scriber, J.M.; Andolfatto, P. Discordant divergence times among Z-chromosome regions between two ecologically distinct swallowtail butterfly species. Evolution 2007, 61, 912–927. [Google Scholar] [CrossRef]
- Mullen, S.P.; Dopman, E.B.; Harrison, R.G. Hybrid zone origins, species boundaries, and the evolution of wing-pattern diversity in a polytypic species complex of North American Admiral butterflies (Nymphalidae: Limenitis). Evolution 2008, 62, 1400–1417. [Google Scholar] [CrossRef]
- Gompert, Z.; Lucas, L.K.; Nice, C.C.; Fordyce, J.A.; Forister, M.L.; Buerkle, C.A. Genomic regions with a history of divergent selection affect fitness of hybrids between two butterfly species. Evolution 2012, 66, 2167–2181. [Google Scholar] [CrossRef]
- Wadsworth, C.B.; Woods, W.A; Hahn, D.H.; Dopman, E.B. One phase of the dormancy pathway is critical for the evolution of insect seasonality. J. Evol. Biol. 2013, 26, 2359–2368. [Google Scholar] [CrossRef]
- Zhang, Z.; Kunte, K.; Kronforst, M.R. Genome-wide characterization of adaptation and speciation in tiger swallowtail butterflies using de novo transcriptome assemblies. Genome Biol. Evol. 2013, 5, 1233–1245. [Google Scholar] [CrossRef]
- Scriber, J.M. Review: Climate-driven reshuffling of species and genes; potential conservation roles for species translocations and recombinant hybrid genotypes. Insects 2014, 5, 1–61. [Google Scholar] [CrossRef]
- Scriber, J.M.; Hagen, R.H.; Lederhouse, R.C. Genetics of mimicry in the tiger swallowtail butterflies, Papilio glaucus and P. canadensis. (Lepidoptera: Papilionidae). Evolution 1996, 50, 222–236. [Google Scholar] [CrossRef]
© 2014 by the authors; licensee MDPI, Basel, Switzerland. This article is an open access article distributed under the terms and conditions of the Creative Commons Attribution license (http://creativecommons.org/licenses/by/3.0/).
Share and Cite
Scriber, J.M.; Elliot, B.; Maher, E.; McGuire, M.; Niblack, M. Adaptations to “Thermal Time” Constraints in Papilio: Latitudinal and Local Size Clines Differ in Response to Regional Climate Change. Insects 2014, 5, 199-226. https://doi.org/10.3390/insects5010199
Scriber JM, Elliot B, Maher E, McGuire M, Niblack M. Adaptations to “Thermal Time” Constraints in Papilio: Latitudinal and Local Size Clines Differ in Response to Regional Climate Change. Insects. 2014; 5(1):199-226. https://doi.org/10.3390/insects5010199
Chicago/Turabian StyleScriber, J. Mark, Ben Elliot, Emily Maher, Molly McGuire, and Marjie Niblack. 2014. "Adaptations to “Thermal Time” Constraints in Papilio: Latitudinal and Local Size Clines Differ in Response to Regional Climate Change" Insects 5, no. 1: 199-226. https://doi.org/10.3390/insects5010199