
Detection and Selection of Behavioral Patterns Using Theme: A Concrete Example in Grassroots Soccer

 , and
, and
Abstract
:1. Introduction
2. Method
2.1. Participants
2.2. Observation Instrument
2.3. Recording and Coding
2.4. Data Reliability
2.5. Data Analysis
3. Results
4. Discussion
Acknowledgements
Author Contributions
Conflicts of Interest
References
- Stein, M.; Janetzko, H.; Seebacher, D.; Jäger, A.; Nagel, M.; Hölsch, J.; Kosub, S.; Schreck, T.; Keim, D.A.; Grossniklaus, M. How to Make Sense of Team Sport Data: From Acquisition to Data Modeling and Research Aspects. Data 2017, 2, 2. [Google Scholar] [CrossRef]
- Rein, R.; Memmert, D. Big data and tactical analysis in elite soccer: Future challenges and opportunities for sports science. SpringerPlus 2016, 5, 1410. [Google Scholar] [CrossRef] [PubMed]
- Garganta, J. Trends of tactical performance analysis in team sports: Bridging the gap between research, training and competition. Rev. Portuguesa Cienc. Desporto 2009, 9, 81–89. [Google Scholar] [CrossRef]
- Hernández-Mendo, A.; Blanco-Villaseñor, A.; Camerino, O.; Lopes, A.; Anguera, M.T.; Jonsson, G.; Castellano, J. Programas informáticos de registro, control de calidad del dato, y análisis de datos. Rev. Psicol. Deporte 2014, 23, 111–121. [Google Scholar]
- Bradley, P.S.; Carling, C.; Archer, D.; Roberts, J.; Dodds, A.; Di Mascio, M.; Krustrup, P. The effect of playing formation on high-intensity running and technical profiles in English FA Premier League soccer matches. J. Sports Sci. 2011, 29, 821–830. [Google Scholar] [CrossRef] [PubMed]
- Ortega, J.I.; Evangelio, C.; Clemente, F.M.; Martins, F.M.L.; González-Víllora, S. Analysis of Physiological, Technical, and Tactical Analysis during a Friendly Football Match of Elite U19. Sports 2016, 4, 35. [Google Scholar] [CrossRef]
- Lames, M.; McGarry, T. On the search for reliable performance indicators in game sports. Int. J. Perform. Anal. Sport 2007, 7, 62–79. [Google Scholar]
- Liu, H.; Gomez, M.A.; Lago, C.; Sampaio, J. Match statistics related to winning in the group stage of 2014 Brazil FIFA World Cup. J. Sports Sci. 2015, 33, 1205–1213. [Google Scholar] [CrossRef] [PubMed]
- Lago, C. The influence of match location, quality of opposition, and match status on possession strategies in professional association football. J. Sports Sci. 2009, 27, 1463–1469. [Google Scholar] [CrossRef] [PubMed]
- Pratas, J.; Volossovitch, A.; Ferreira, A.P. The effect of situational variables on teams’ performance in offensive sequences ending in a shot on goal. A case study. Open Sports Sci. J. 2012, 5, 193–199. [Google Scholar] [CrossRef]
- Hughes, M.; Bartlett, R. The use of performance indicators in performance analysis. J. Sports Sci. 2002, 20, 739–754. [Google Scholar] [CrossRef] [PubMed]
- Winter, C.; Pfeiffer, M. Tactical metrics that discriminate winning, drawing and losing teams in UEFA Euro 2012. J. Sports Sci. 2016, 34, 486–492. [Google Scholar] [CrossRef] [PubMed]
- Barreira, D.; Anguera, M.T.; Garganta, J.; Prudente, J.; Castellano, J. Evolución del ataque en el fútbol de élite entre 1982 y 2010. Rev. Psicol. Deporte 2014, 23, 139–146. [Google Scholar]
- Anguera, M.T. Observational Typology. Qual. Quant. Eur. Am. J. Methodol. 1979, 13, 449–484. [Google Scholar]
- Anguera, M.T.; Hernández-Mendo, A. Metodología observacional y psicología del deporte: Estado de la cuestión. Rev. Psicol. Deporte 2014, 23, 103–109. [Google Scholar]
- Bakeman, R.; Quera, V. Sequential Analysis and Observational Methods for the Behavioral Sciences; Cambridge University Press: Cambridge, UK, 2011. [Google Scholar]
- Jonsson, G.K.; Bjarkadottir, S.H.; Gislason, B.; Borrie, A.; Magnusson, M.S. Detection of real-time patterns in sports: interactions in football. Éth. Appl. 2003, 3, 37–46. [Google Scholar]
- Castellano, J.; Hernández-Mendo, A.; Morales-Sánchez, V.; Anguera, M.T. Optimising a probabilistic model of the development of play in soccer. Qual. Quant. 2007, 41, 93–104. [Google Scholar] [CrossRef]
- Sarmento, H.; Anguera, M.T.; Pereira, A.; Marques, A.; Campaniço, J.; Leitão, J. Patterns of play in the counterattack of elite football teams-A mixed method approach. Int. J. Perform. Anal. Sport 2014, 14, 411–427. [Google Scholar]
- Magnusson, M.S. Hidden real-time patterns in intra- and inter-individual behavior. Eur. J. Psychol. Assess. 1996, 12, 112–123. [Google Scholar] [CrossRef]
- Magnusson, M.S. Discovering hidden time patterns in behavior: T-patterns and their detection. Behav. Res. Method. Instrum. Comput. 2000, 32, 93–110. [Google Scholar] [CrossRef]
- Magnusson, M.S. Time and self-similar structure in behavior and interactions: from sequences to symmetry and fractals. In Discovering Hidden Temporal Patterns in Behavior and Interaction; Magnusson, M.S., Burgoon, J.K., Casarrubea, M., Eds.; Springer: New York, NY, USA, 2016; pp. 3–35. [Google Scholar]
- Aragón, S.; Lapresa, D.; Arana, J.; Anguera, M.T.; Garzón, B. Tactical behaviour of winning athletes in major championship 1500-m and 5000-m track finals. Eur. J. Sport Sci. 2016, 16, 279–286. [Google Scholar] [CrossRef] [PubMed]
- Fernández, J.; Camerino, O.; Anguera, M.T.; Jonsson, G.K. Identifying and analyzing the construction and effectiveness of offensive plays in basketball by using sistematic observation. Behav. Res. Method. 2009, 41, 719–730. [Google Scholar] [CrossRef] [PubMed]
- Lapresa, D.; Anguera, M.T.; Alsasua, R.; Arana, J.; Garzón, B. Comparative analysis of T-patterns using real time data and simulated data by assignment of conventional durations: the construction of efficacy in children's basketball. Int. J. Perform. Anal. Sport 2013, 13, 321–339. [Google Scholar]
- Bloomfield, J.; Jonsson, G.K.; Polman, R.; Houlahan, K.; O’Donoghue, P. Temporal pattern analysis and its applicability in soccer. In The Hidden Structure of Social Interaction. From Genomics to Culture Patterns; Anolli, L., Duncan, S., Magnusson, M., Riva, G., Eds.; IOS Press: Amsterdam, The Netherlands, 2005; pp. 51–70. [Google Scholar]
- Jonsson, G.K.; Anguera, M.T.; Blanco, A.; Losada, J.L.; Hernández-Mendo, A.; Ardá, T.; Camerino, O.; Castellano, J. Hidden patterns of play interaction in soccer using SOF-CODER. Behav. Res. Method. Instrum. Comput. 2006, 38, 372–381. [Google Scholar] [CrossRef]
- Sarmento, H.; Barbosa, A.; Anguera, M.T.; Campaniço, J.; Leitão, J. Regular patterns of play in the counterattack of the FC Barcelona and Manchester United football teams. In Performance Analysis of Sport IX; Peters, D., O ́Donoghue, P., Eds.; Routledge: London, UK, 2013; pp. 59–66. [Google Scholar]
- Anguera, M.T.; Magnusson, M.S.; Jonsson, G.K. Instrumentos no estandar: planteamiento, desarrollo y posibilidades. Avances Medición 2007, 5, 63–82. [Google Scholar]
- Lapresa, D.; Arana, J.; Anguera, M.T.; Garzón, B. Comparative analysis of the sequentiality using SDIS-GSEQ and THEME: A concrete example in soccer. J. Sports Sci. 2013, 31, 1687–1695. [Google Scholar] [CrossRef] [PubMed]
- Anguera, M.T. Preface. In Discovering Hidden Temporal Patterns in Behavior and Interaction; Magnusson, M.S., Burgoon, J.K., Casarrubea, M., Eds.; Springer: New York, NY, USA, 2016; pp. vii–ix. [Google Scholar]
- Castellano, J.; Puente, A.; Echeazarra, I.; Usabiaga, O.; Casamichana, D. Number of Players and Relative Pitch Area per Player: Comparing Their Influence on Heart Rate and Physical Demands in Under-12 and Under-13 Football Players. PLoS ONE 2016, 11, e0127505. [Google Scholar] [CrossRef] [PubMed]
- Castelão, D.; Garganta, J.; Santos, R.; Teoldo, I. Comparison of tactical behaviour and performance of youth soccer players in 3v3 and 5v5 small-sided games. Int. J. Perform. Anal. Sport 2014, 14, 801–813. [Google Scholar]
- Amatria, M.; Lapresa, D.; Arana, J.; Anguera, M.T.; Garzón, B. Optimization of Game Formats in U-10 Soccer Using Logistic Regression Analysis. J. Hum. Kinet. 2016, 54, 163–171. [Google Scholar] [CrossRef] [PubMed]
- Anguera, M.T.; Blanco-Villaseñor, A.; Hernández-Mendo, A.; Losada, J. Diseños observacionales: Ajuste y aplicación en psicología del deporte. Cuadernos Psicol. Deporte 2011, 11, 63–76. [Google Scholar]
- Borrie, A.; Jonsson, G.K.; Magnusson, M.S. Temporal pattern analysis and its applicability in sport: An explanation and exemplar data. J. Sports Sci. 2002, 20, 845–852. [Google Scholar] [CrossRef] [PubMed]
- Anguera, M.T.; Arnau, J.; Ato, M.; Martínez, R.; Pascual, J.; Vallejo, G. Métodos de Investigación en Psicología; Síntesis: Madrid, España, 1995. [Google Scholar]
- Aşçı, A. Heart Rate Responses during Small Sided Games and Official Match-Play in Soccer. Sports 2016, 4, 31. [Google Scholar] [CrossRef]
- Köklü, Y.; Alemdaroğlu, U. Comparıson of the Heart Rate and Blood Lactate Responses of Different Small Sided Games in Young Soccer Players. Sports 2016, 4, 48. [Google Scholar] [CrossRef]
- Anguera, M.T.; Blanco-Villaseñor, A.; Losada, J.L.; Ardá, T.; Camerino, O.; Castellano, J.; Hernández-Mendo, A.; Jonsson, G. SOF-4: Instrumento de registro y codificación en el fútbol. In II Buenos Aires: Congreso Internacional de Actualización en Psicología del Deporte; Asociación Metropolitana de Psicología del Deporte (AMPD): Buenos Aires, Argentina, 2004. [Google Scholar]
- Arana, J.; Lapresa, D.; Anguera, M.T.; Garzón, B. Adapting football to the child: An application of the logistic regression model in observational methodology. Qual. Quant. 2013, 47, 3473–3480. [Google Scholar] [CrossRef]
- Lapresa, D.; Arana, J.; Carazo, J. Pautas Para la Adecuación de Contenidos al Desarrollo Psicomotor de Prebenjamines y Benjamines; University of La Rioja and Royal Spanish Football Federation: Logroño, Spain, 2005. [Google Scholar]
- Gabin, B.; Camerino, O.; Anguera, M.T.; Castañer, M. Lince: Multiplatform sport analysis software. Procedia Soc. Behav. Sci. 2012, 46, 4692–4694. [Google Scholar] [CrossRef]
- Arana, J.; Lapresa, D.; Anguera, M.T.; Garzón, B. Ad hoc procedure for optimising agreement between observational records. An. Psicol. 2016, 32, 589–595. [Google Scholar] [CrossRef]
- Quera, V.; Bakeman, R.; Gnisci, A. Observer agreement for event sequences: Methods and software for sequence alignment and reliability estimates. Behav. Res. Method. 2007, 39, 39–49. [Google Scholar] [CrossRef]
- Bakeman, R.; Quera, V. Analyzing Interaction: Sequential Analysis with SDIS and GSEQ; Cambridge University Press: Cambridge, UK, 1995. [Google Scholar]
- Landis, J.R.; Koch, G.G. The measurement of observer agreement for categorical data. Biometrics 1977, 33, 159–174. [Google Scholar] [CrossRef] [PubMed]
- PatternVision Ltd.; Noldus Information Technology BV. Theme, powerful tool for detection and analysis of hidden patterns in behaviour. In Reference Manual, version 5.0.; Noldus Information Technology BV: Wageningen, The Netherlands, 2004. [Google Scholar]
- Machado, J.C.; Barreira, D.; Garganta, J. Eficácia ofensiva e variabilidade de padrões de jogo em futebol. Rev. Bras. Educação Física Esporte 2013, 4, 667–677. [Google Scholar] [CrossRef]
- Lapresa, D.; Camerino, O.; Cabedo, J.; Anguera, M.T.; Jonsson, G.K.; Arana, J. Degradación de T-patterns en estudios observacionales: Un estudio sobre la eficacia en el ataque de fútbol sala. Cuadernos Psicol. Deporte 2015, 15, 71–82. [Google Scholar] [CrossRef]
- Lapresa, D.; Álvarez, L.; Arana, J.; Garzón, B.; Caballero, V. Observational analysis of the offensive sequences that ended in a shot by the winning team of the 2010 UEFA Futsal Championship. J. Sport Sci. 2013, 31, 1731–1739. [Google Scholar] [CrossRef] [PubMed]
- Anguera, M.T.; Hernández-Mendo, A. Técnicas de análisis en estudios observacionales en ciencias del deporte. Cuadernos Psicol. Deporte 2015, 15, 13–30. [Google Scholar] [CrossRef]
- Ardá, A.; Casal, C. Metodología de la Enseñanza del Fútbol; Paidotribo: Barcelona, Spain, 2003. [Google Scholar]
- Stratton, G.; Reilly, T.; Williams, A.M.; Richardson, D. Youth Soccer: From Science to Performance; Routledge: London, UK, 2004. [Google Scholar]
- Perea, A.E. Análisis de las acciones colectivas en el fútbol de rendimiento. Ph.D. Thesis, University of Basque Country, Vitoria, Spain, 2008. [Google Scholar]
- Castellano, J. Observación y análisis de la acción de juego en el fútbol. Ph.D. Thesis, University of Basque Country, Vitoria, Spain, 2000. [Google Scholar]
- Armatas, V.; Yiannakos, A. Analysis and evaluation of goals scored in 2006 World Cup. J. Sport Health Res. 2010, 2, 119–128. [Google Scholar]
- Lapresa, D.; Arana, J.; Garzón, B. El fútbol 9 como alternativa al fútbol 11, a partir del estudio de la utilización del espacio de juego. Rev. Apunts Educación Física y Deportes 2006, 86, 34–44. [Google Scholar]
- Wein, H. Fútbol a la Medida del niño; CEDIF: Madrid, Spain, 1995. [Google Scholar]
- González-Víllora, S.; García-López, L.M.; Contreras-Jordán, O. Evolución de la toma de decisiones y la habilidad técnica en fútbol. Rev. Int. Med. Cienc. Actividad Física Deporte 2015, 15, 467–487. [Google Scholar]
- Fajen, B.R.; Riley, M.A.; Turvey, M.T. Information, affordances, and the control of action in sport. Int. J. Sport Psychol. 2009, 40, 79–107. [Google Scholar]
- Castellano, J.; Casamichana, D.; Lago, C. The use of match statistics that discriminate between successful and unsuccessful soccer teams. J. Hum. Kinet. 2012, 31, 137–147. [Google Scholar] [CrossRef] [PubMed]
- Castellano, J.; Etxeazarra, I. Adapting the competition model in youth football: A comparison between 5-a-side and 7-a-side football with U10-players. In Science and Football VII; Nunome, H., Drust, B., Dawson, B., Eds.; Routledge: London, UK, 2013; pp. 311–316. [Google Scholar]
- Lapresa, D.; Arana, J.; Ugarte, J.; Garzón, B. Análisis comparativo de la acción ofensiva en F-7 y F-8, en la categoría alevín. Rev Retos. Nuevas tendencias en Educación Física, Deporte y Recreación 2009, 16, 97–103. [Google Scholar]
- Acar, M.F.; Yapicioglu, B.; Arikan, N.; Yalcin, N.; Ates, N.; Ergun, M. Analysis of goals scored in the 2006 World Cup. In Science and Football VI; Reilly, T., Korkusuz, A.F., Eds.; Routledge: London, UK, 2009; pp. 235–242. [Google Scholar]
- Portell, M.; Señé, A.M.; Anguera, M.T. Intervention for reducing musculoskeletal risk among workers: Design of feedback with Theme. In Eight meeting of MASI - Methodology for the Analysis of Social Interaction; University of Iceland: Reykjavík, Iceland, 2014. [Google Scholar]
- Capranica, L.; Tessitore, A.; Guidetti, L.; Figura, F. Heart rate and match analysis in pre-pubescent soccer players. J. Sport Sci. 2001, 19, 379–384. [Google Scholar] [CrossRef] [PubMed]
- Lapresa, D.; Álvarez, I.; Anguera, M.T.; Arana, J.; Garzón, B. Comparative analysis of the use of space in 7-a-side and 8-a-side soccer: how to determine the minimum sample size in observational methodology. J. Motricidade 2015, 11, 92–103. [Google Scholar] [CrossRef]
- Memmert, D. Testing of tactical performance in youth elite soccer. J. Sport Sci. Med. 2010, 9, 199–205. [Google Scholar]
- Travassos, B.; Davids, K.; Araújo, D.; Esteves, P.T. Performance analysis in team sports: Advances from an Ecological Dynamics approach. Int. J. Perform. Anal. Sport 2013, 13, 83–95. [Google Scholar]
 = single touch (C1),
  = attempt to control the ball with 2 or more touches resulting in loss of ball (C12),
  = Occasional interception with continuation of play,
  = Shot,
  = Goal,
  = Recovery of ball,
  = Loss of ball. (a) F7, (b) F8.
= single touch (C1), = attempt to control the ball with 2 or more touches resulting in loss of ball (C12), = Occasional interception with continuation of play, = Shot, = Goal, = Recovery of ball, = Loss of ball. (a) F7, (b) F8.
= Loss of ball. (a) F7, (b) F8.
= single touch (C1), = attempt to control the ball with 2 or more touches resulting in loss of ball (C12), = Occasional interception with continuation of play, = Shot, = Goal, = Recovery of ball, = Loss of ball. (a) F7, (b) F8.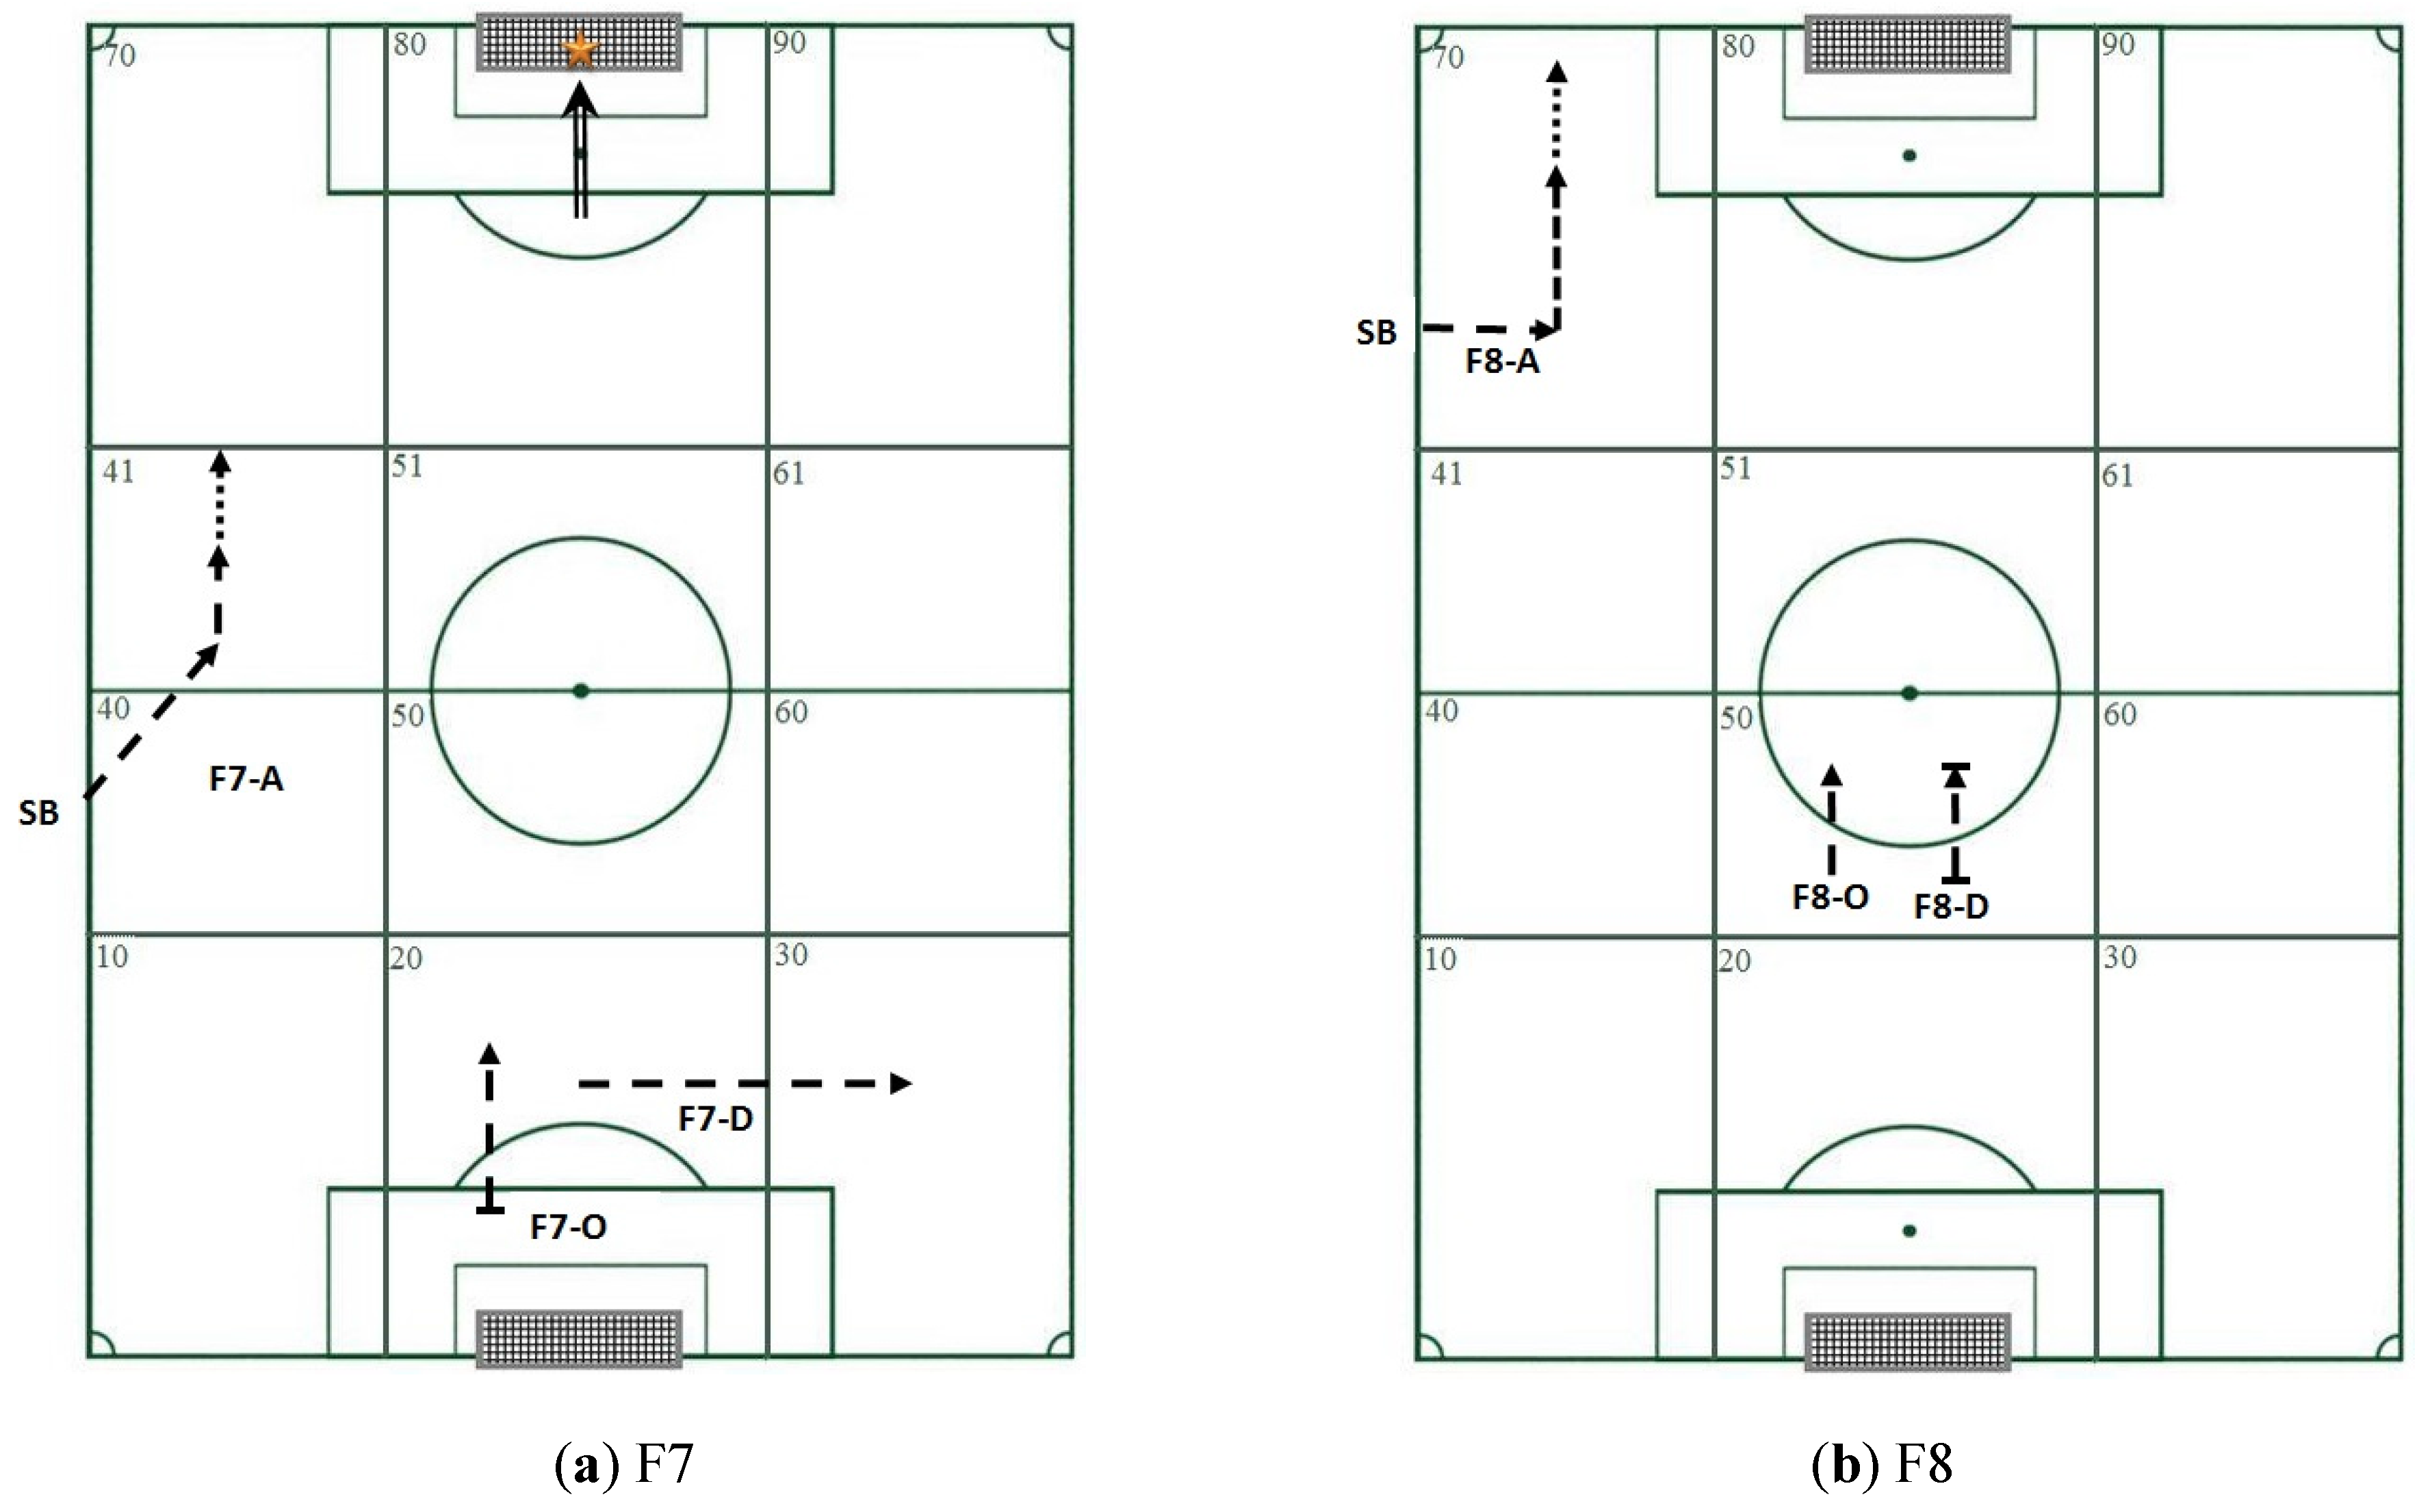
 = single touch (C1),
  = control of the ball followed by a pass or a shot at the goal (C2),
  = control of ball, followed by dribbling and a pass or shot (C3),
  = control of ball, followed by dribbling and passing of one or more opponents, and a pass or shot (C4),
  = Occasional interception with continuation of play,
  = Recovery of ball,
  = Loss of ball. (a) F7, (b) F8.
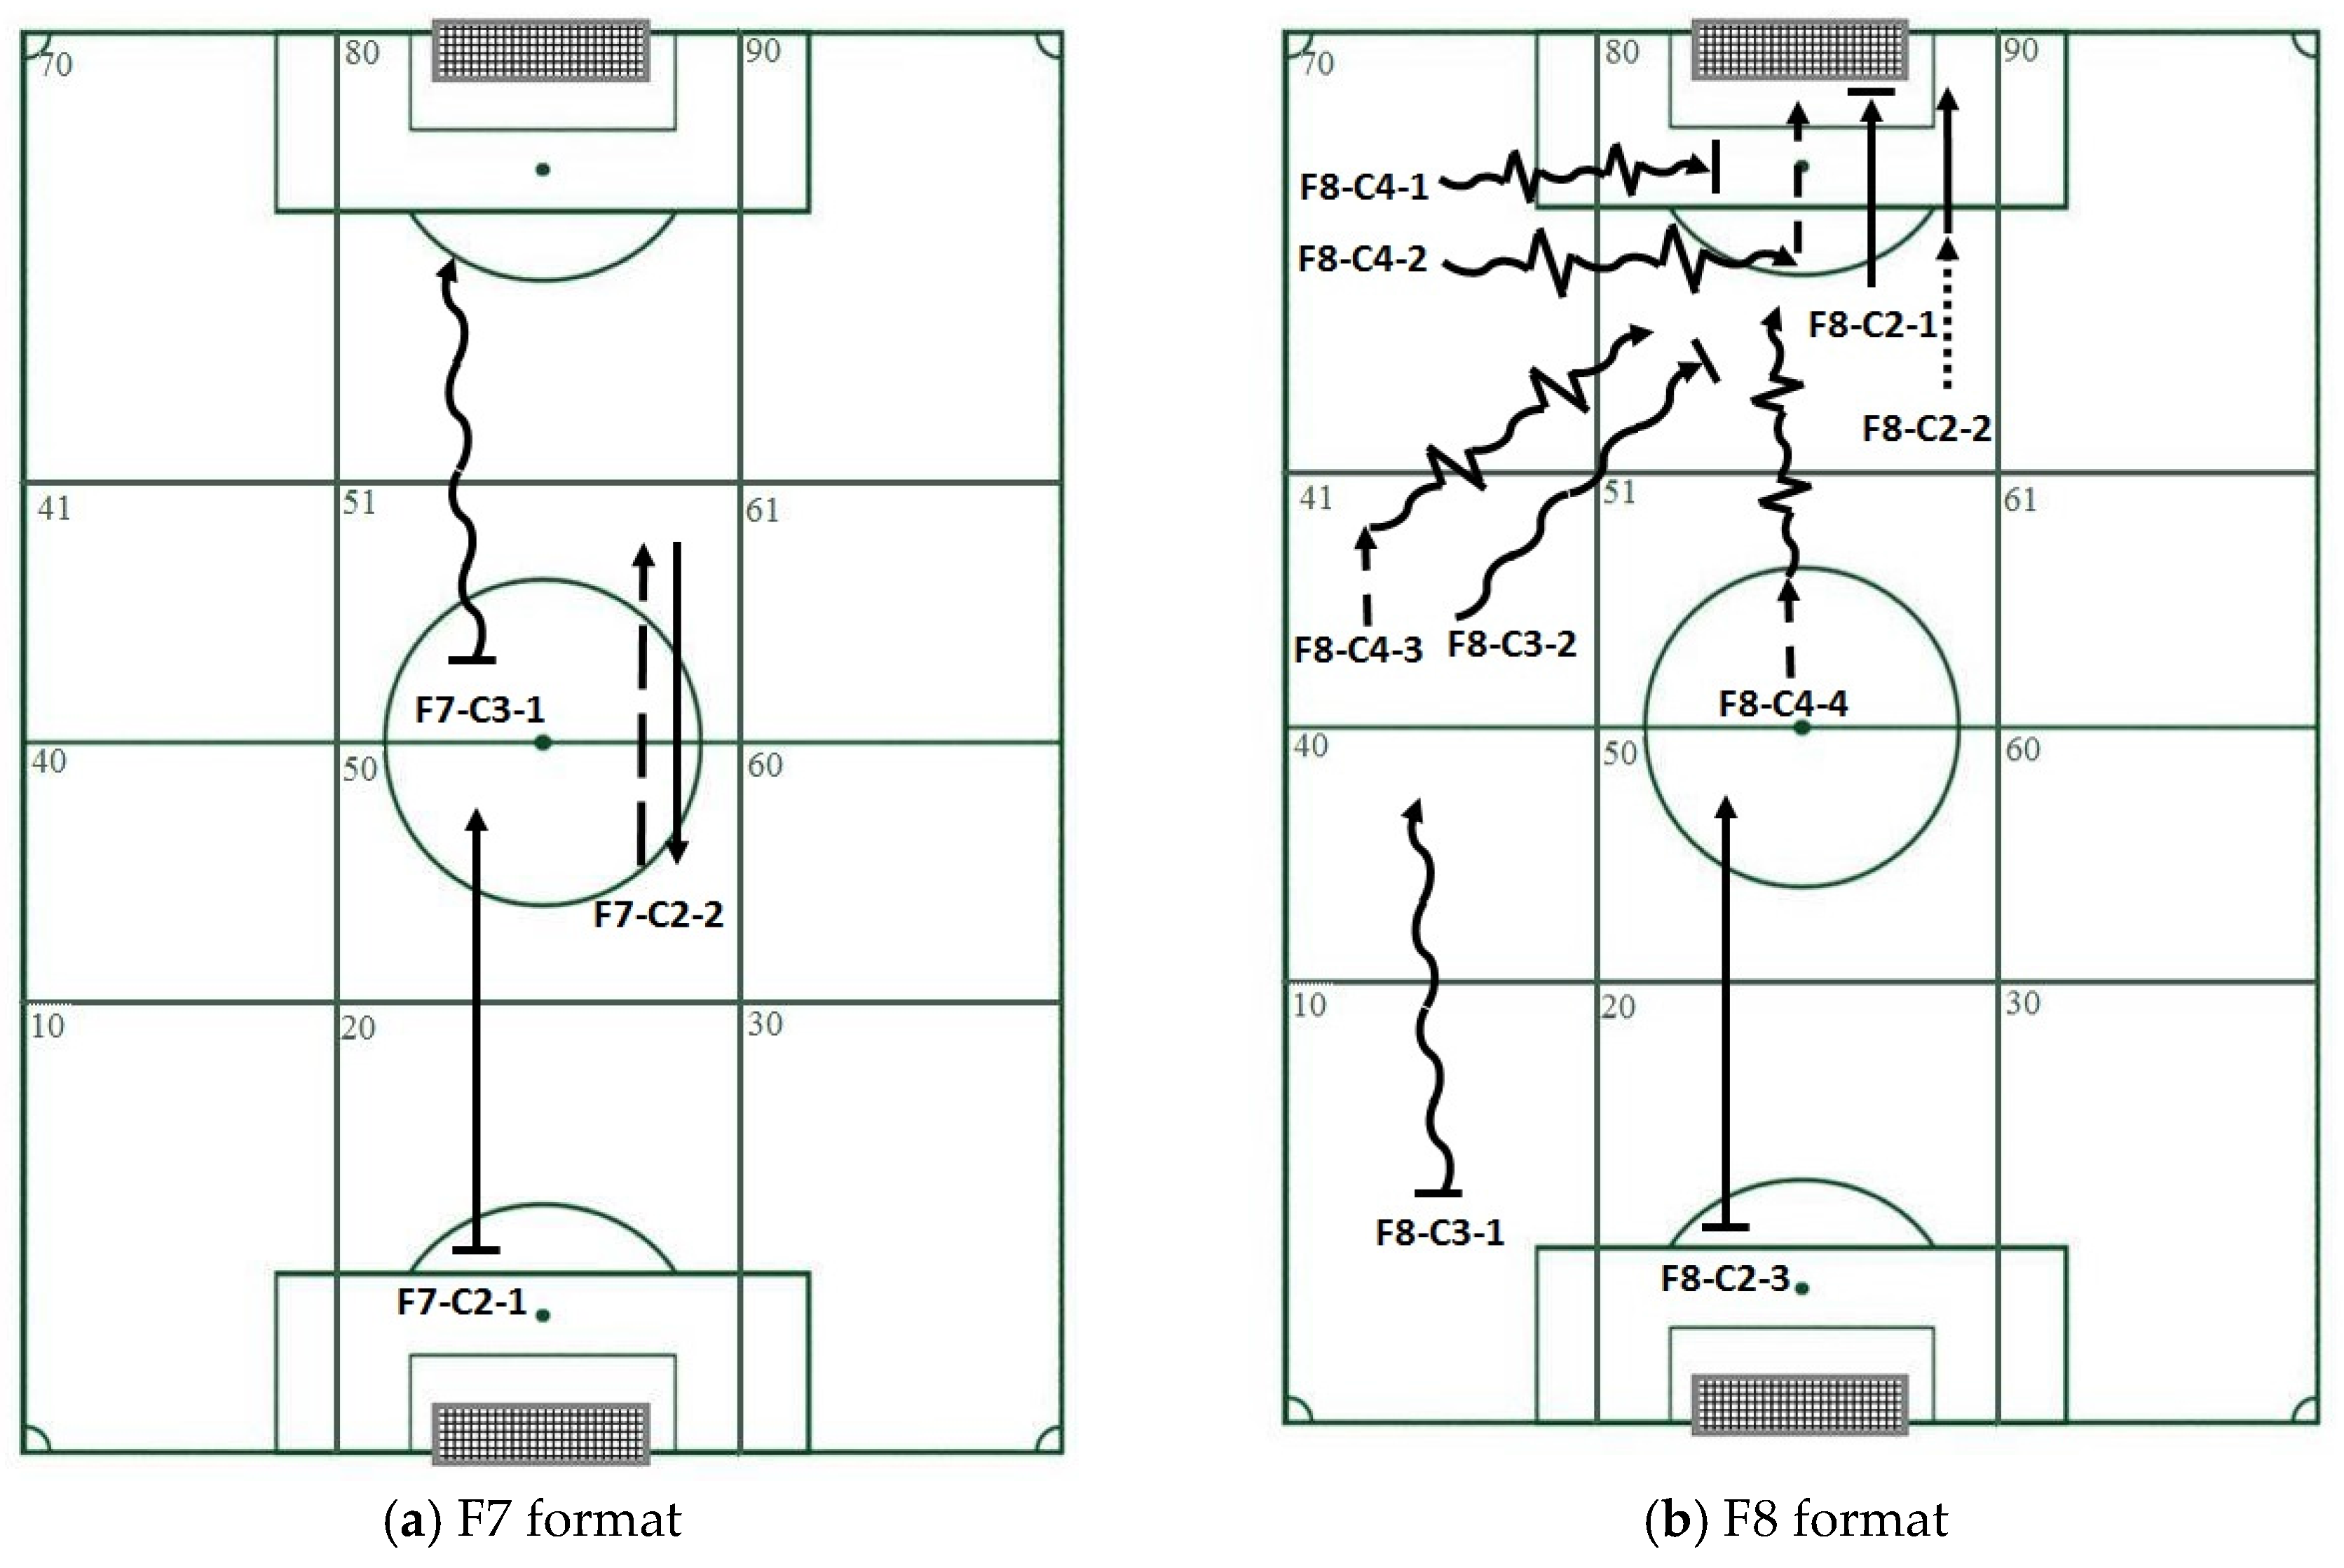
= single touch (C1), = control of the ball followed by a pass or a shot at the goal (C2), = control of ball, followed by dribbling and a pass or shot (C3), = control of ball, followed by dribbling and passing of one or more opponents, and a pass or shot (C4), = Occasional interception with continuation of play, = Recovery of ball, = Loss of ball. (a) F7, (b) F8.
= Loss of ball. (a) F7, (b) F8.
= single touch (C1), = control of the ball followed by a pass or a shot at the goal (C2), = control of ball, followed by dribbling and a pass or shot (C3), = control of ball, followed by dribbling and passing of one or more opponents, and a pass or shot (C4), = Occasional interception with continuation of play, = Recovery of ball, = Loss of ball. (a) F7, (b) F8.
 = single touch (C1),
  = control of the ball followed by a pass or a shot at the goal (C2),
  = control of ball, followed by dribbling and a pass or shot (C3),
  = Occasional interception with continuation of play,
  = Shot and
  = Goal. (a) F7, (b) F8.
= single touch (C1), = control of the ball followed by a pass or a shot at the goal (C2), = control of ball, followed by dribbling and a pass or shot (C3), = Occasional interception with continuation of play, = Shot and = Goal. (a) F7, (b) F8.
= Goal. (a) F7, (b) F8.
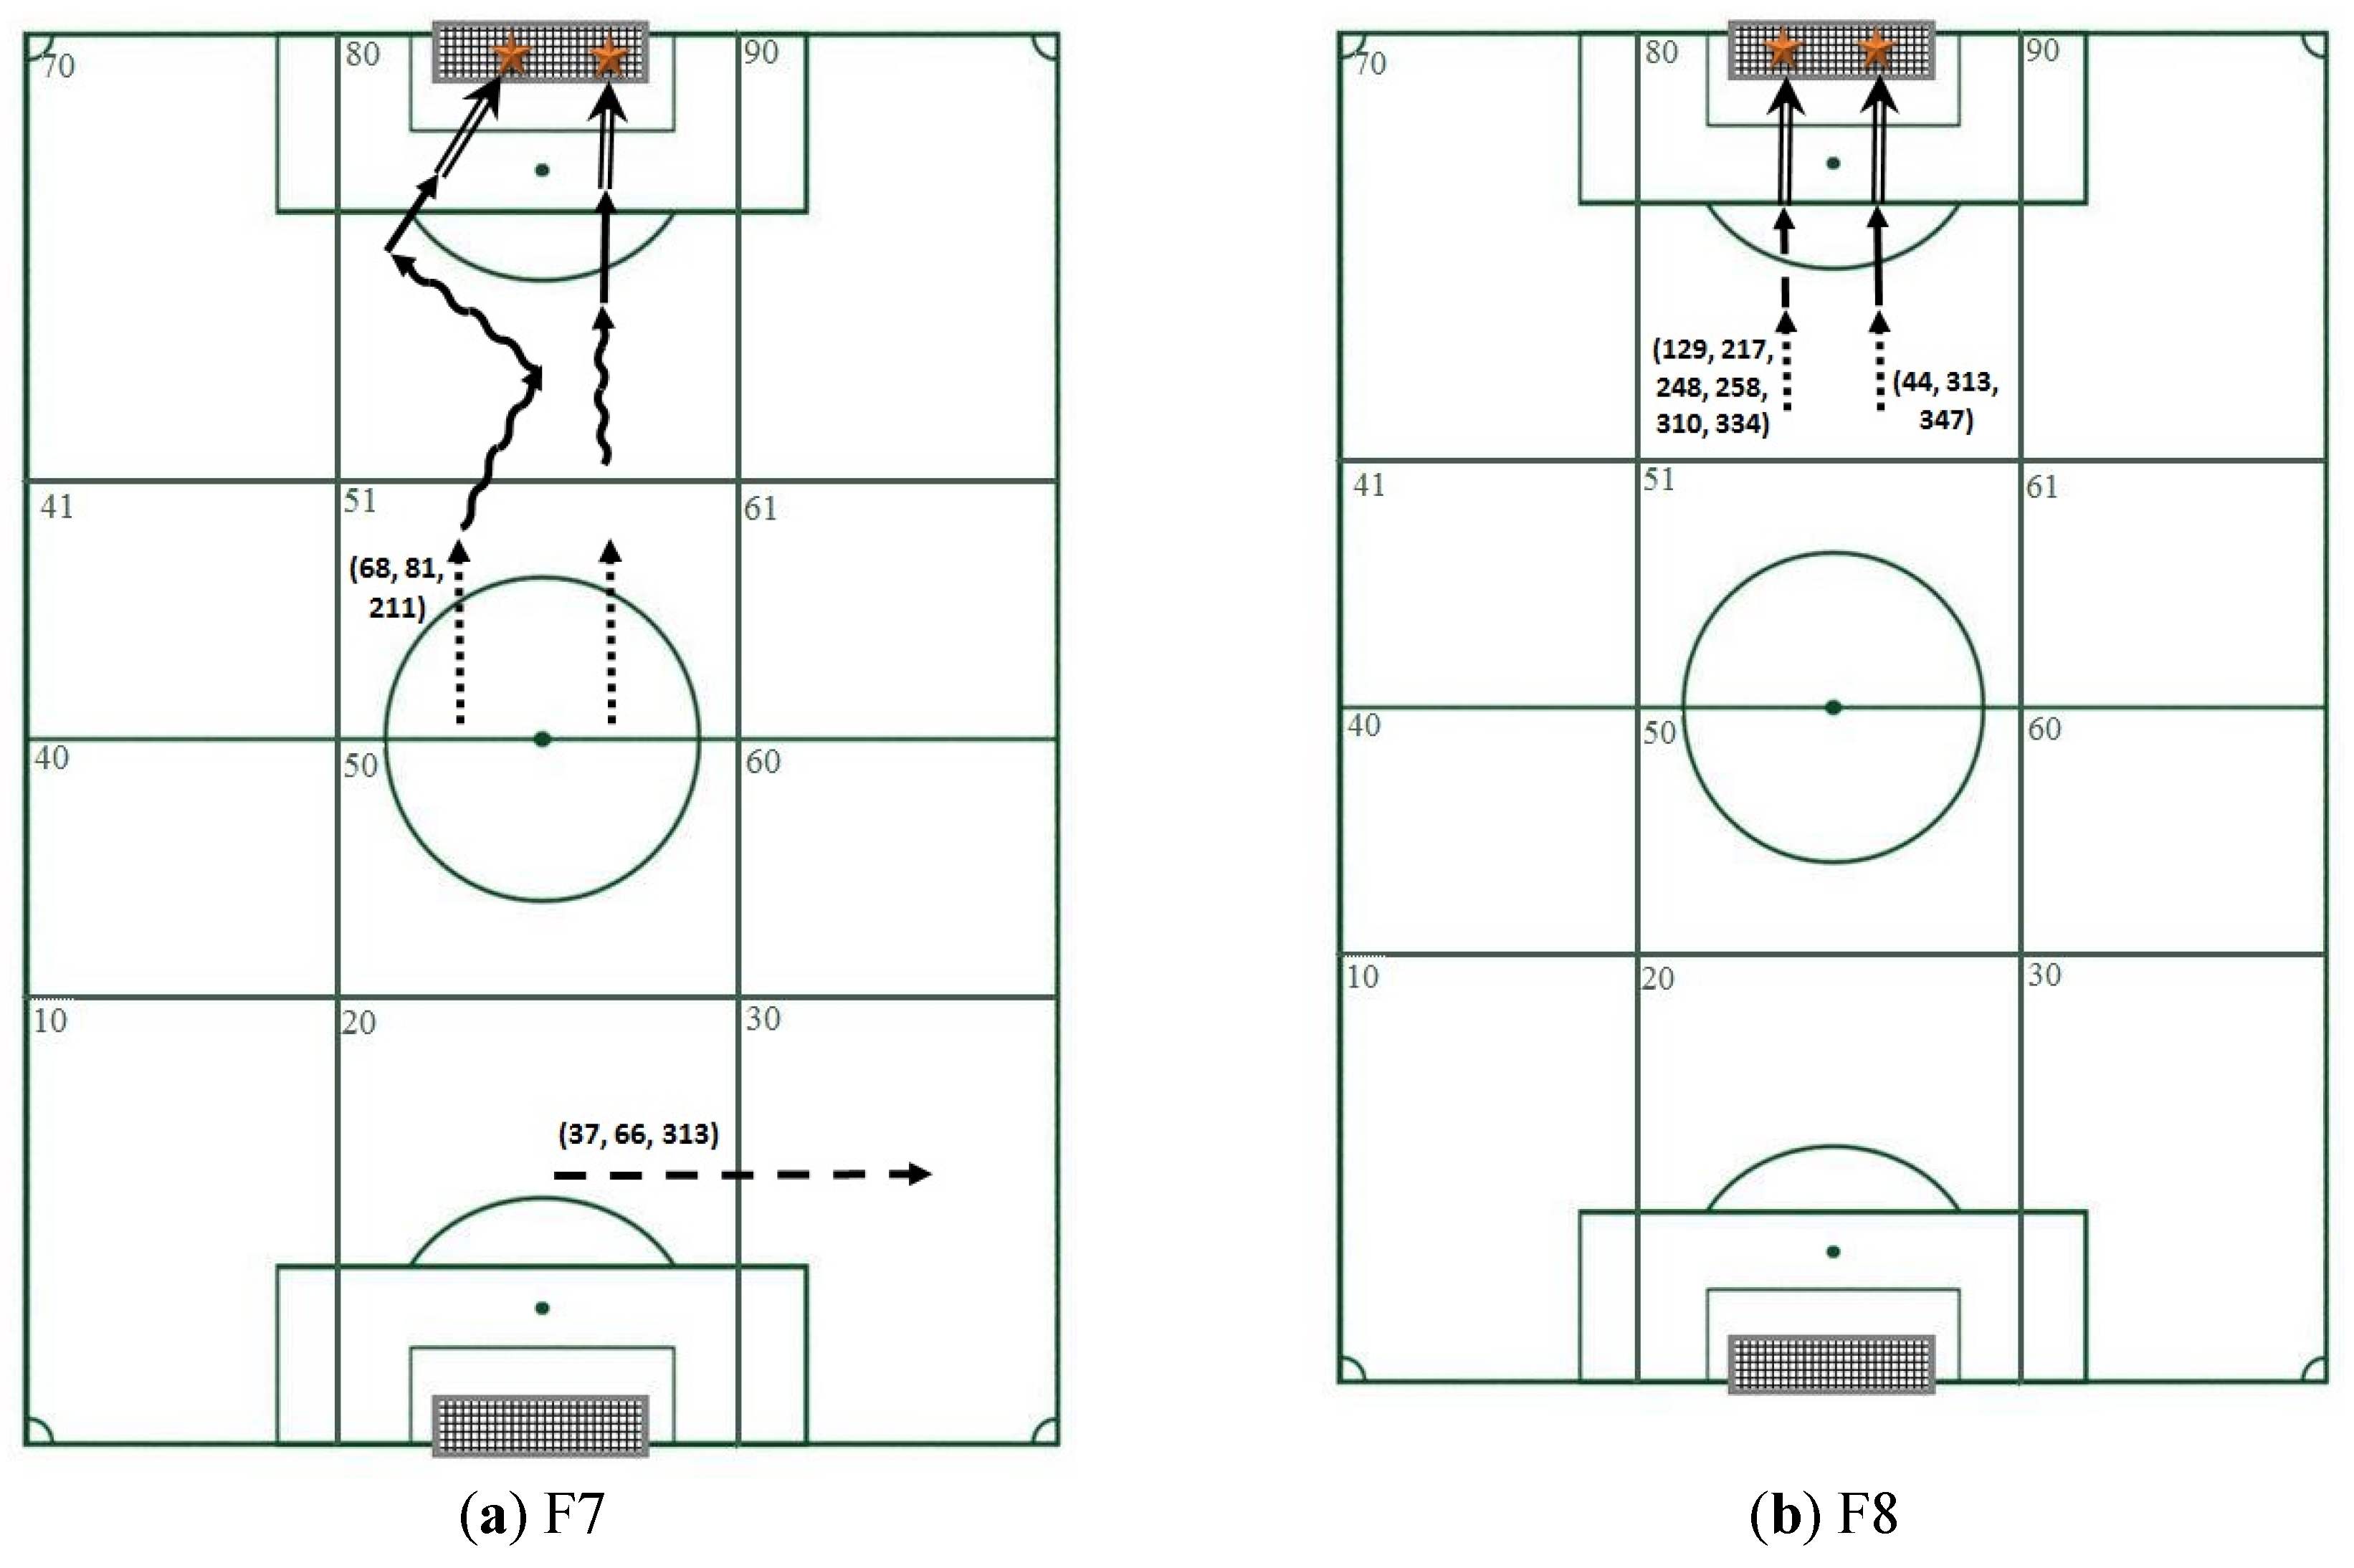
= single touch (C1), = control of the ball followed by a pass or a shot at the goal (C2), = control of ball, followed by dribbling and a pass or shot (C3), = Occasional interception with continuation of play, = Shot and = Goal. (a) F7, (b) F8.

| No. | Dimensions | Categories (Codes) |
|---|---|---|
| 1 | Ball possession | PO) Possession of ball by team being observed; PC) Possession of ball by opposing team; Inob) Unobservable |
| 2 | Action initiation zone | ZS10, ZS20, ZS30–safety sector; ZS40, ZS50, ZS60–creation sector; ZS70, ZS80, ZS90–definition sector (see Figure 1, Figure 2 and Figure 3) |
| 3 | Action conclusion zone | ZE10, ZE20, ZE30–safety sector; ZE40, ZE50, ZE60–creation section; ZE70, ZE80, ZE90–definition sector. |
| 4 | Contact with ball | C1) single touch and regulatory throw-in/kick-in; C12) attempt to control the ball with 2 or more touches resulting in loss of ball; C2) control of ball (including picking up of ball by goalkeeper) followed by a pass or shot -regardless of whether the ball reaches a team member or is recovered by an opponent; C23) control of ball, followed by dribbling, and loss of ball; C24) control of ball, followed by dribbling, attempt to go around one or more opponents, and loss of ball; C3) control of ball, followed by dribbling and a pass or shot–regardless of whether the ball reaches a team member or is recovered by an opponent; C4) control of ball, followed by dribbling and passing of one or more opponents, and a pass or shot–regardless of whether the ball reaches a team member or is recovered by an opponent; C5) Header. |
| 5 | Interruptions | FDFT) free kick for team being observed; FDFJ) offside for team being observed; FFSB) throw-in for team being observed; FFSE) corner kick for team being observed; FFSP) goal kick for team being observed; CDFT) free kick against team being observed; CDFJ) offside against team being observed; CFFB) throw-in against team being observed; CFFF) corner kick or goal kick against team being observed; GF) goal scored by team being observed; GC) goal conceded by team being observed; SN) neutral kick. |
| 6 | Interceptions | P) loss of ball; R) recovery of ball; IOC) Occasional interception with continuation of play. |
| 7 | Shot | TG) shot resulting in goal; TI) shot intercepted by opponent other than the goalkeeper; TM) shot between the posts not resulting in a goal; TF) shot wide of the posts; TP) shot saved or cleared by the goalkeeper. |
| Setting | Identifier | String-Like Pattern | Occurrences/Length/Duration (in Frames) | Mean Internal Interval (in Frames) |
|---|---|---|---|---|
| Length | F7-A | ((zi40,zf40,ffsb zi40,zf41,c1) | 4/4/311 | 1.25/54.00/21.50 |
| (zi41,zf41,c1 zi41,zf41,ioc)) | ||||
| F8-A | ((zi70,zf70,ffsb zi70,zf70,c1) | 3/4/350 | 4.00/76.67/35.00 | |
| (zi70,zf70,c12 zi70,zf70,ioc)) | ||||
| Frequency | F7-O | (zi20,zf20,r zi20,zf20,c1) | 14/2/116 | 7.29 |
| F8-O | (zi50,zf50,r zi50,zf50,c1) | 15/2/883 | 57.87 | |
| Duration | F7-D | (zi20,zf30,c1 (zi80,zf80,tg zi80,zf80,gf)) | 3/3/1389 | 441.00/21.00 |
| F8-D | (zi50,zf50,r (zi50,zf50,c1 zi50,zf50,p)) | 7/3/938 | 70.86/62.14 |
| Search Option | Game Format-Identifier | String-Like Pattern | Occurrences/Length/Duration (in Frames) | Mean Internal Interval (in Frames) |
|---|---|---|---|---|
| C2 | F7-C2-1 | (zi20,zf20,r zi20,zf50,c2) | 11/2/391 | 34.55 |
| C2 | F7-C2-2 | (zi50,zf51,c1 zi51,zf50,c2) | 10/2/131 | 12.10 |
| C2 | F8-C2-1 | (zi80,zf80,c2 zi80,zf80,p) | 7/2/392 | 55.00 |
| C2 | F8-C2-2 | (zi80,zf80,ioc zi80,zf80,c2) | 7/2/311 | 43.43 |
| C2 | F8-C2-3 | (zi20,zf20,r zi20,zf50,c2) | 7/2/68 | 8.71 |
| C3 | F7-C3-1 | (zi51,zf51,r zi51,zf80,c3) | 6/2/199 | 32.17 |
| C3 | F8-C3-1 | (zi10,zf10,r zi10,zf40,c3) | 4/2/561 | 1.50 |
| C3 | F8-C3-2 | (zi41,zf80,c3 zi80,zf80,p) | 4/2/561 | 139.25 |
| C4 | F7 | None detected | ||
| C4 | F8-C4-1 | (zi70,zf80,c4 zi80,zf80,p) | 3/2/370 | 122.33 |
| C4 | F8-C4-2 | (zi70,zf80,c4 zi80,zf80,c1) | 3/2/340 | 112.33 |
| C4 | F8-C4-3 | (zi41,zf41,c1 zi41,zf80,c4) | 3/2/86 | 27.67 |
| C4 | F8-C4-4 | (zi51,zf51,c1 zi51,zf80,c4) | 3/2/148 | 48.33 |
| Depth | F7-D | (zi20,zf30,c1 (zi80,zf80,tg zi80,zf80,gf)) | 3/3/1389 | 441.00 / 21.00 |
| F8 | None detected |
| Format | String-Like Pattern | Occurr/Length/Dur | Order in Sequences of Actions | Mean II |
|---|---|---|---|---|
| F7 | (zi51,zf80,c3 (zi80,zf80,tg zi80,zf80,gf)) | 3/3/490 | 68, 81, 211 | 136.33/26.00 |
| F7 | (zi80,zf80,c3 zi80,zf80,gf) | 3/2/303 | 37, 105, 211 | 100 |
| F7 | (zi80,zf80,c2 (zi80,zf80,tg zi80,zf80,gf)) | 3/3/224 | 68, 207, 313 | 54.67/19.00 |
| F7 | (zi20,zf30,c1 (zi80,zf80,tg zi80,zf80,gf)) | 3/3/1389 | 37, 66, 313 | 441.00/21.00 |
| F7 | (zi51,zf51,ioc ( zi80,zf80,tg zi80,zf80,gf)) | 3/3/610 | 68, 81, 313 | 177.00/25.33 |
| F8 | (zi80,zf80,c1 ( zi80,zf80,tg zi80,zf80,gf)) | 6/3/140 | 129, 217, 248, 258, 310, 334 | 1.17/21.17 |
| F8 | (zi80,zf80,ioc ( zi80,zf80,tg zi80,zf80,gf)) | 3/3/162 | 129, 313, 334 | 34.33/18.67 |
| F8 | (zi80,zf80,c2 ( zi80,zf80,tg zi80,zf80,gf)) | 3/3/114 | 44, 313, 347 | 21.67/15.33 |
| Quantitative Search Options | Qualitative Search Options |
|---|---|
| Frequency | Ball contacts |
| Length | Combination of contacts |
| Level | Combination of contacts according to pitch area |
| Actors | Sequences of play that end in a goal |
| Actor switches | Sequences of play that include a shot |
| First occurrence time | Sequences of play that start in zone 20 and end in zone 80 |
| Total duration | Sequences of play that start in the safety sector and end in the definition sector |
| Mean p in pattern (mean statistical significance value for the critical intervals in a pattern) | Sequences of play involving the two side corridors |
| Median p in pattern | Sequences of play involving the two lateral corridors before reaching zone 80 |
| Maximum p in pattern | Sequences of play that include strategic situations: corners , penalties, free kicks |
| Different event-types | Combination of contacts and tactical situations (combination of above) |
| Different items | etc. |
© 2017 by the authors. Licensee MDPI, Basel, Switzerland. This article is an open access article distributed under the terms and conditions of the Creative Commons Attribution (CC BY) license ( http://creativecommons.org/licenses/by/4.0/).
Share and Cite
Amatria, M.; Lapresa, D.; Arana, J.; Anguera, M.T.; Jonsson, G.K. Detection and Selection of Behavioral Patterns Using Theme: A Concrete Example in Grassroots Soccer. Sports 2017, 5, 20. https://doi.org/10.3390/sports5010020
Amatria M, Lapresa D, Arana J, Anguera MT, Jonsson GK. Detection and Selection of Behavioral Patterns Using Theme: A Concrete Example in Grassroots Soccer. Sports. 2017; 5(1):20. https://doi.org/10.3390/sports5010020
Chicago/Turabian StyleAmatria, Mario, Daniel Lapresa, Javier Arana, M. Teresa Anguera, and Gudberg K. Jonsson. 2017. "Detection and Selection of Behavioral Patterns Using Theme: A Concrete Example in Grassroots Soccer" Sports 5, no. 1: 20. https://doi.org/10.3390/sports5010020