Inter- and Intra-Individual Differences in EMG and MMG during Maximal, Bilateral, Dynamic Leg Extensions


 ,
,
Abstract
:1. Introduction
2. Materials and Methods
2.1. Subjects
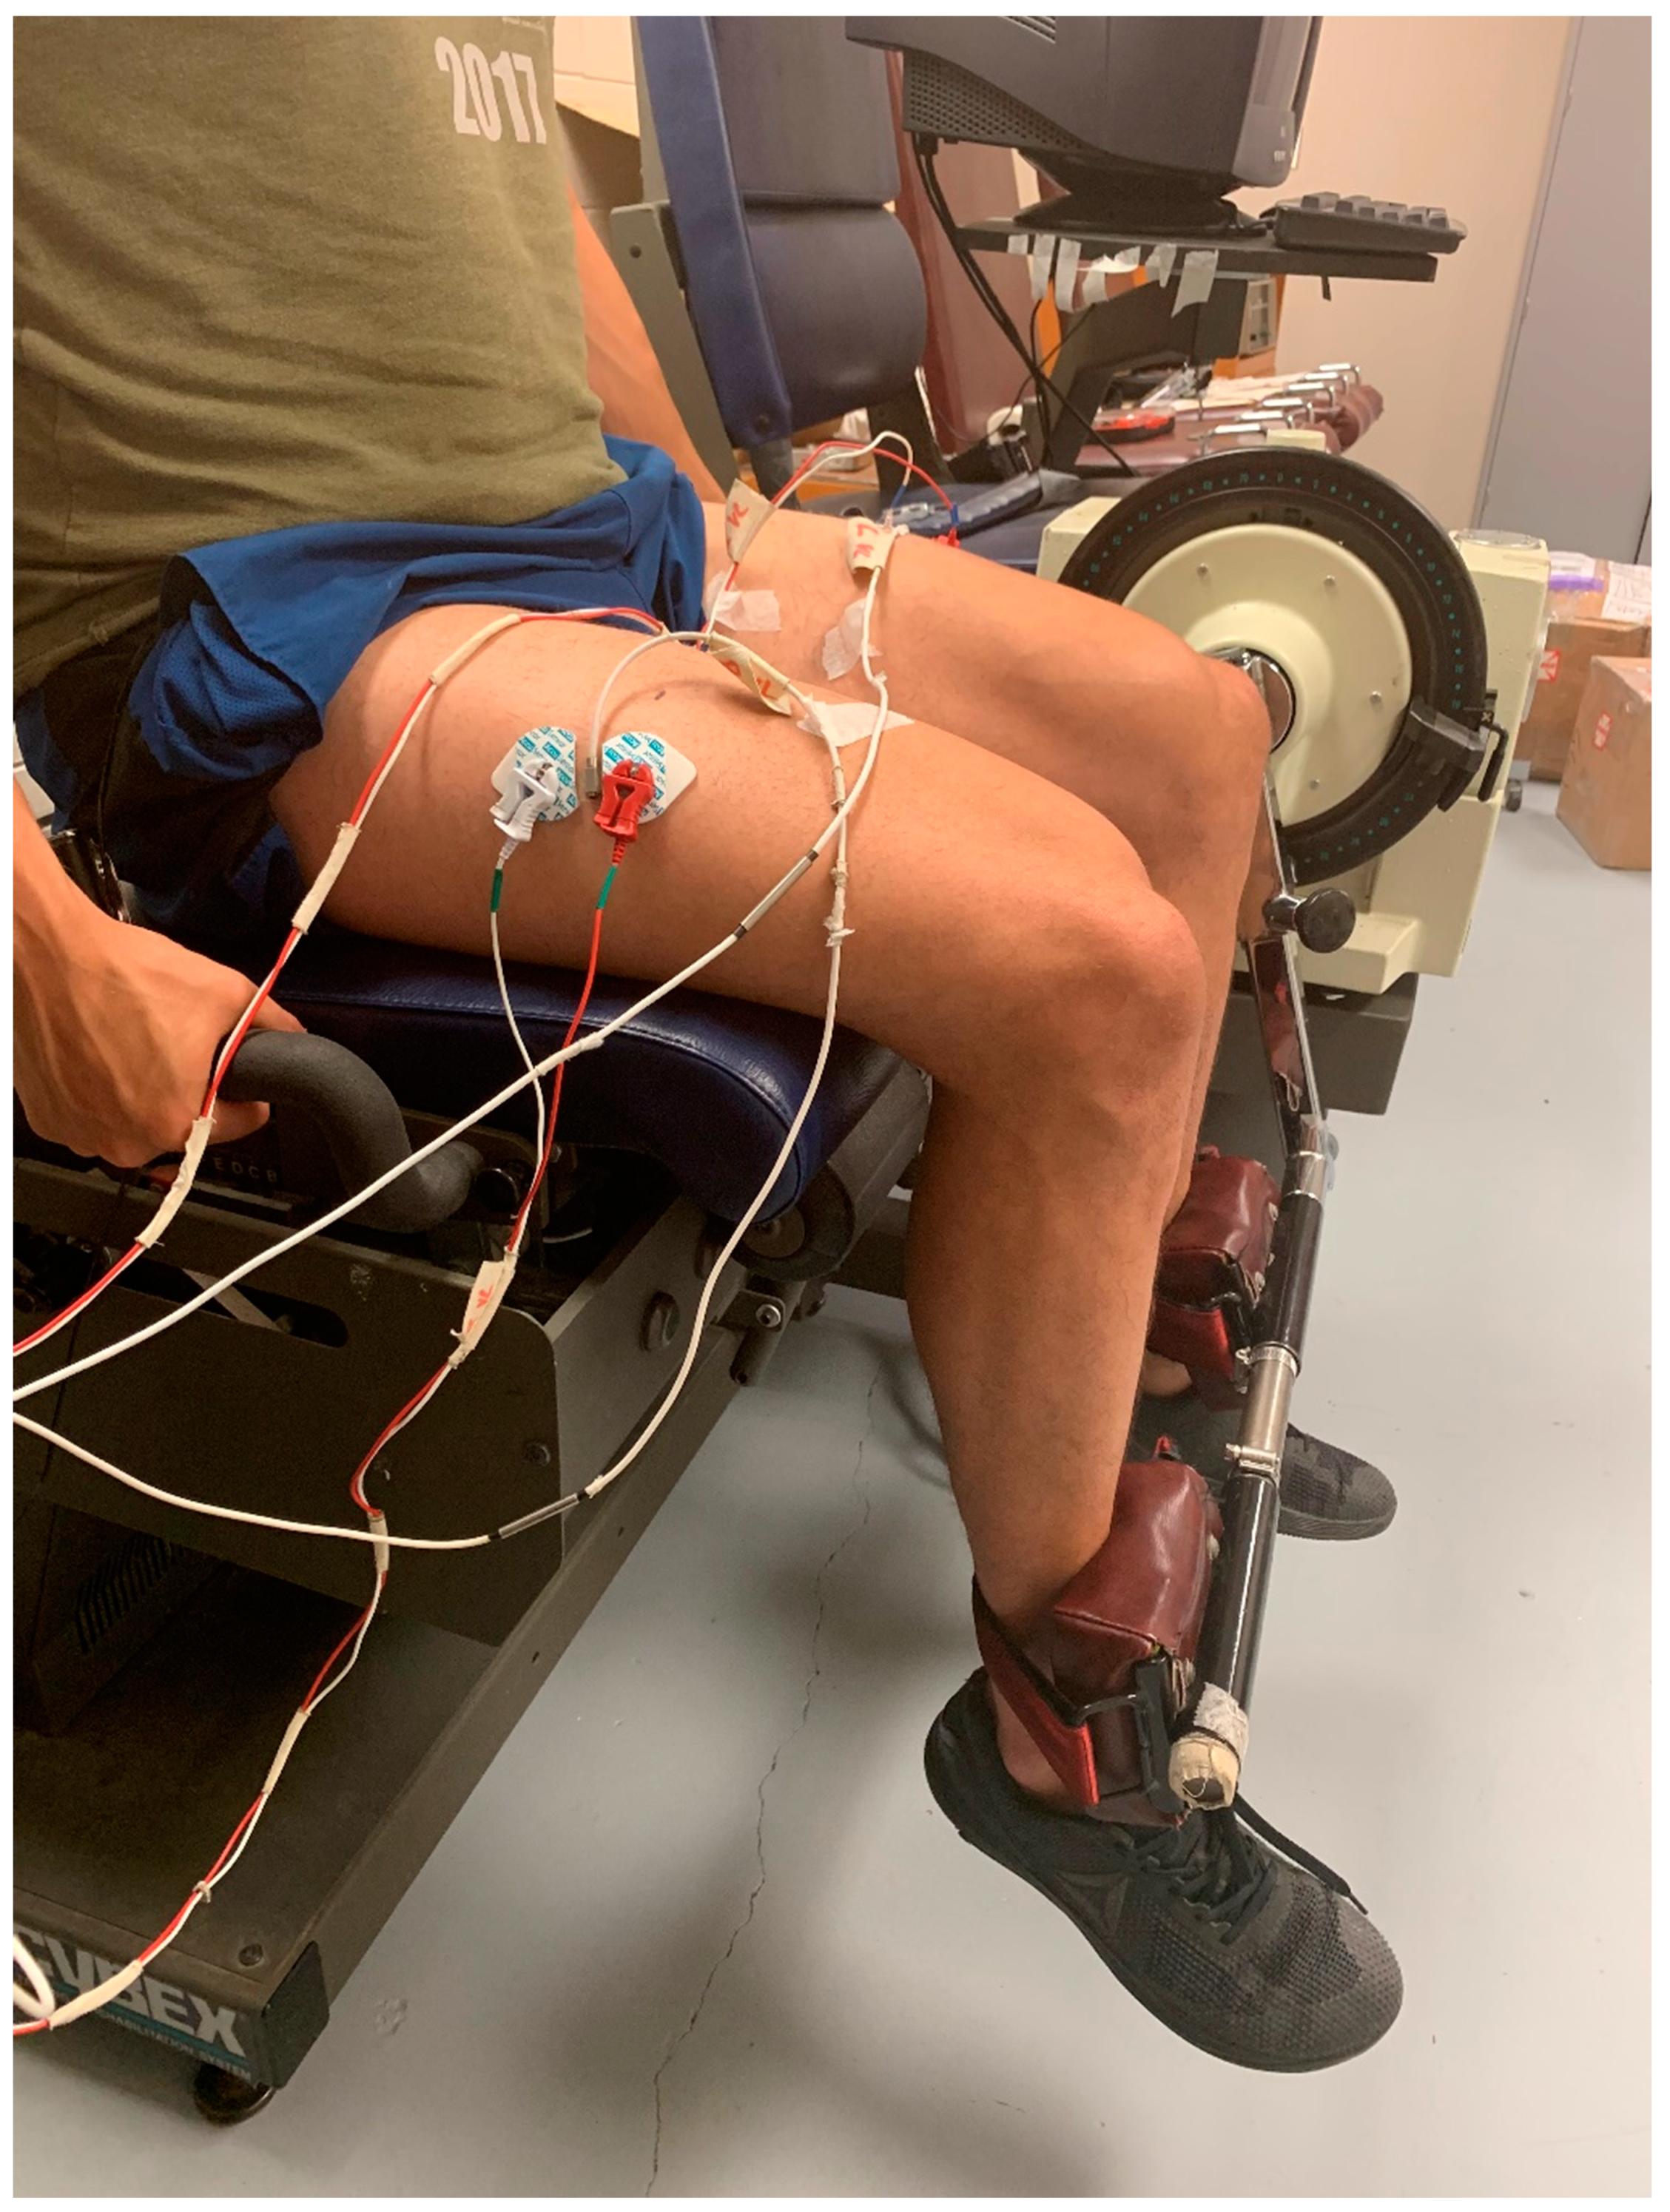
2.2. Protocol
2.3. Electromyographic, Mechanomyographic, and Force Signal Acquisition
2.4. Statistical Analysis
3. Results
3.1. Torque Response
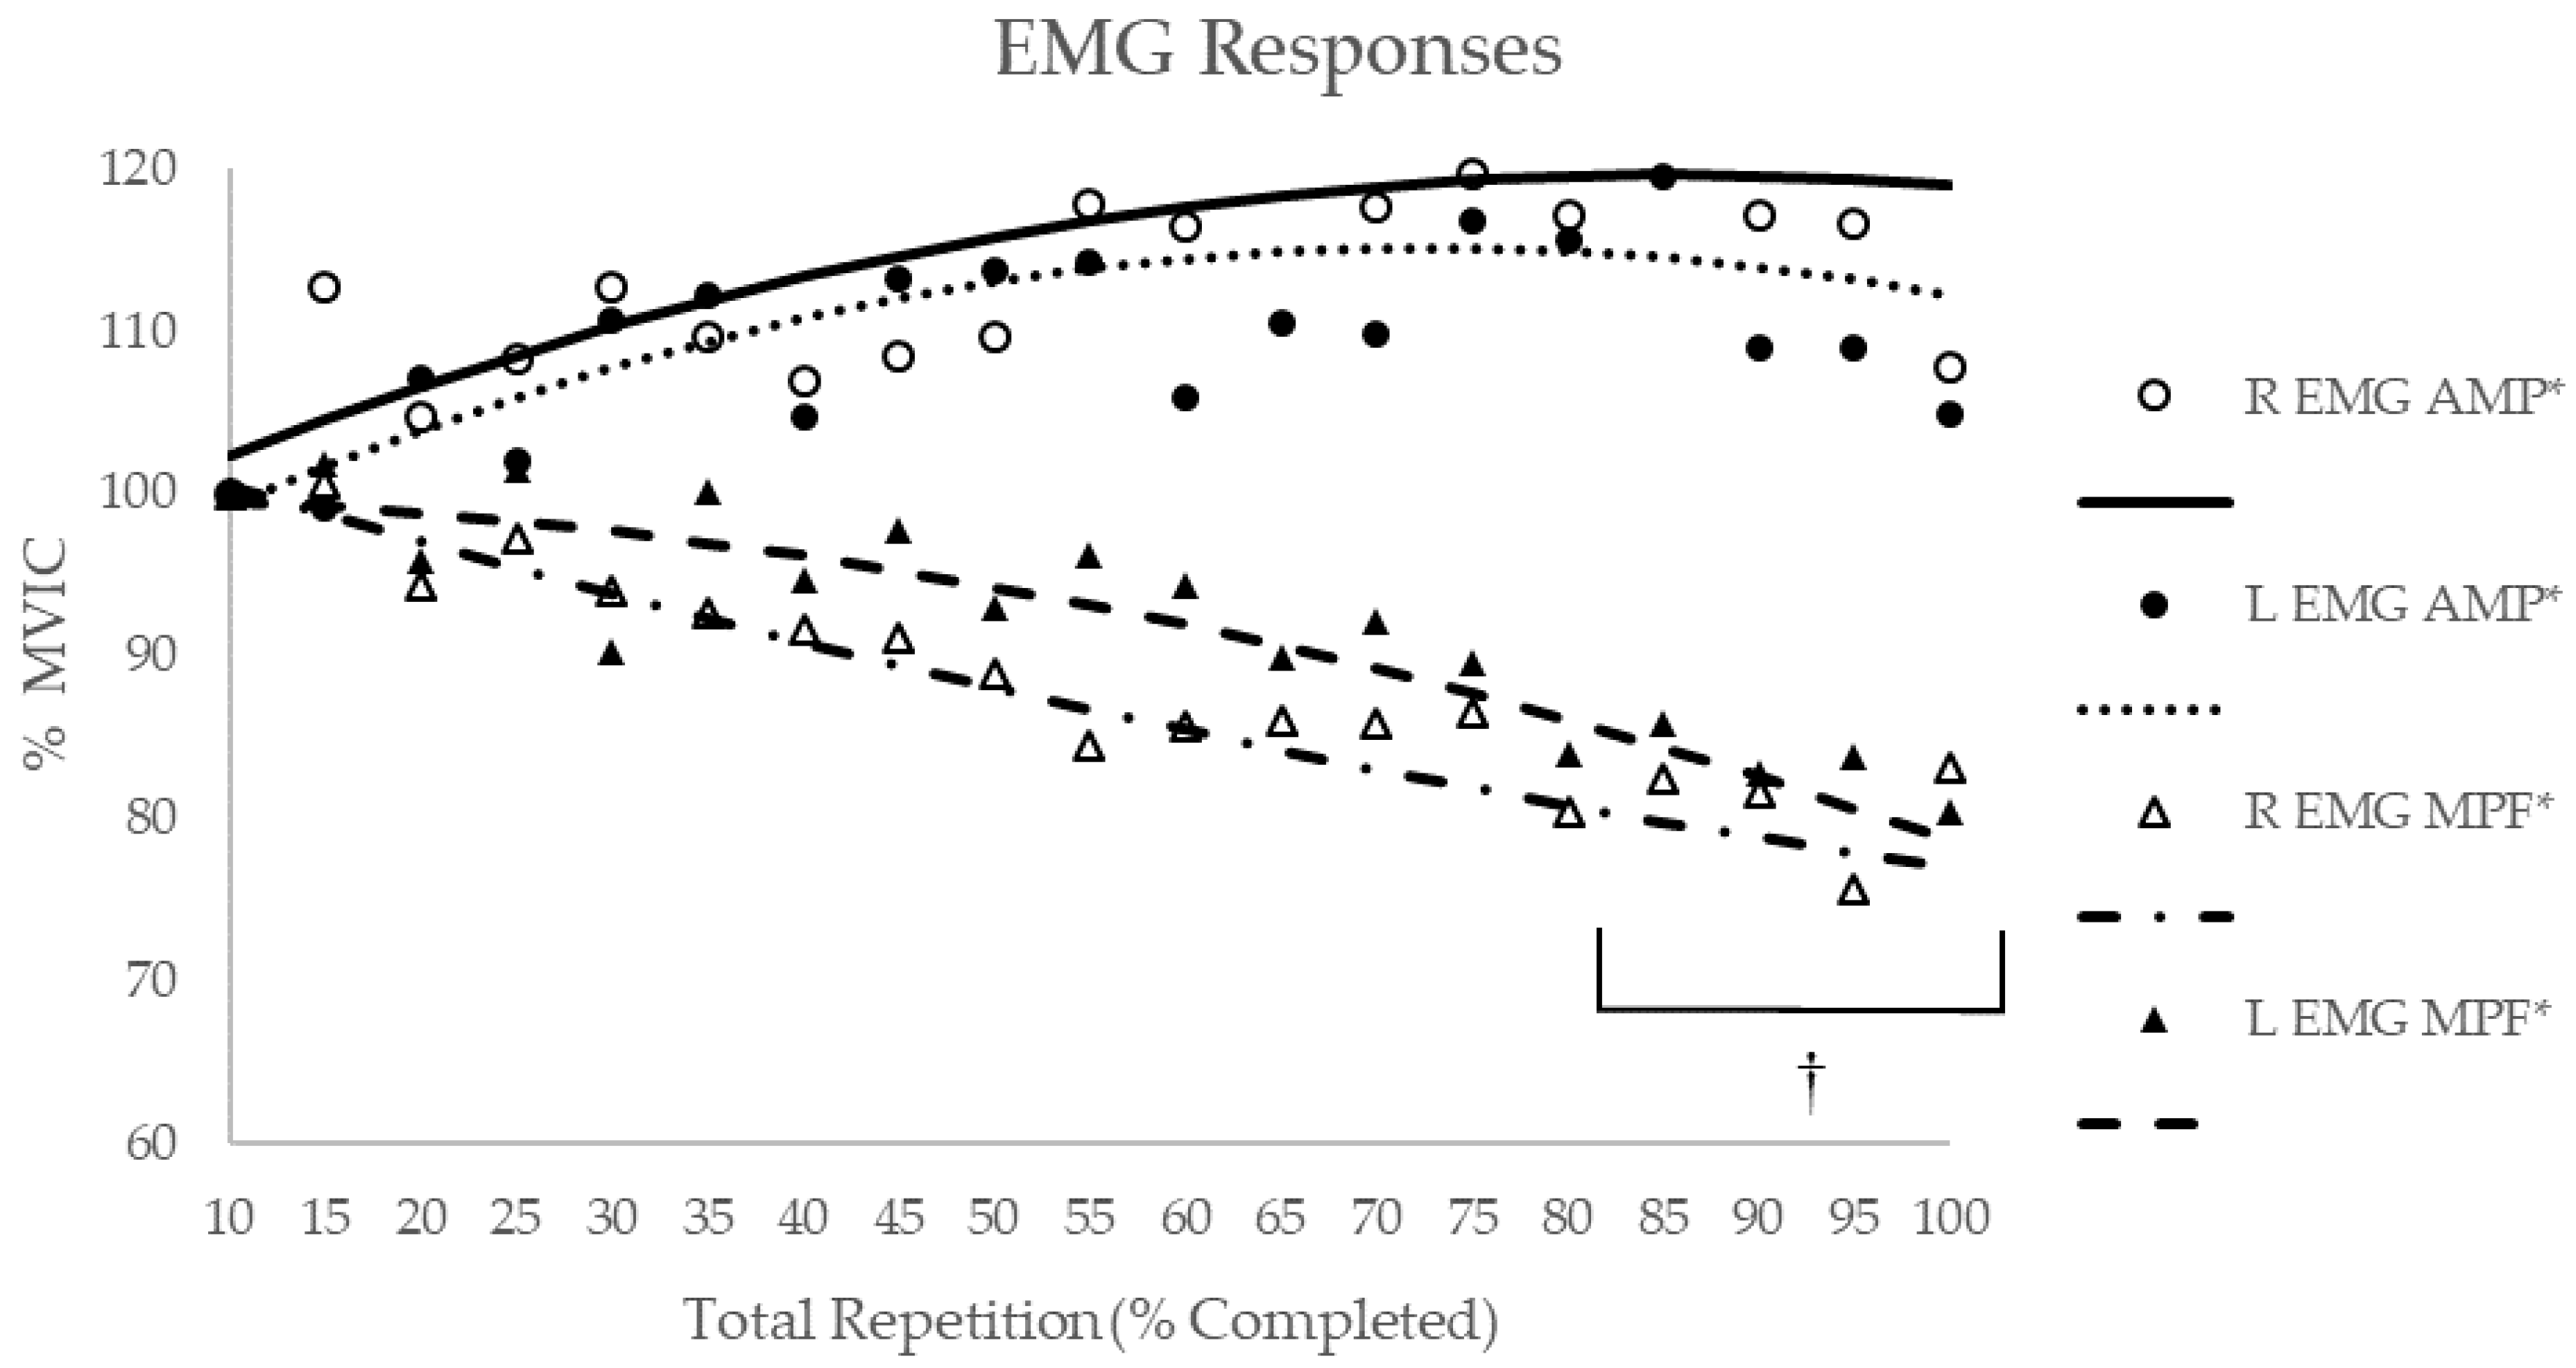
3.2. EMG Response
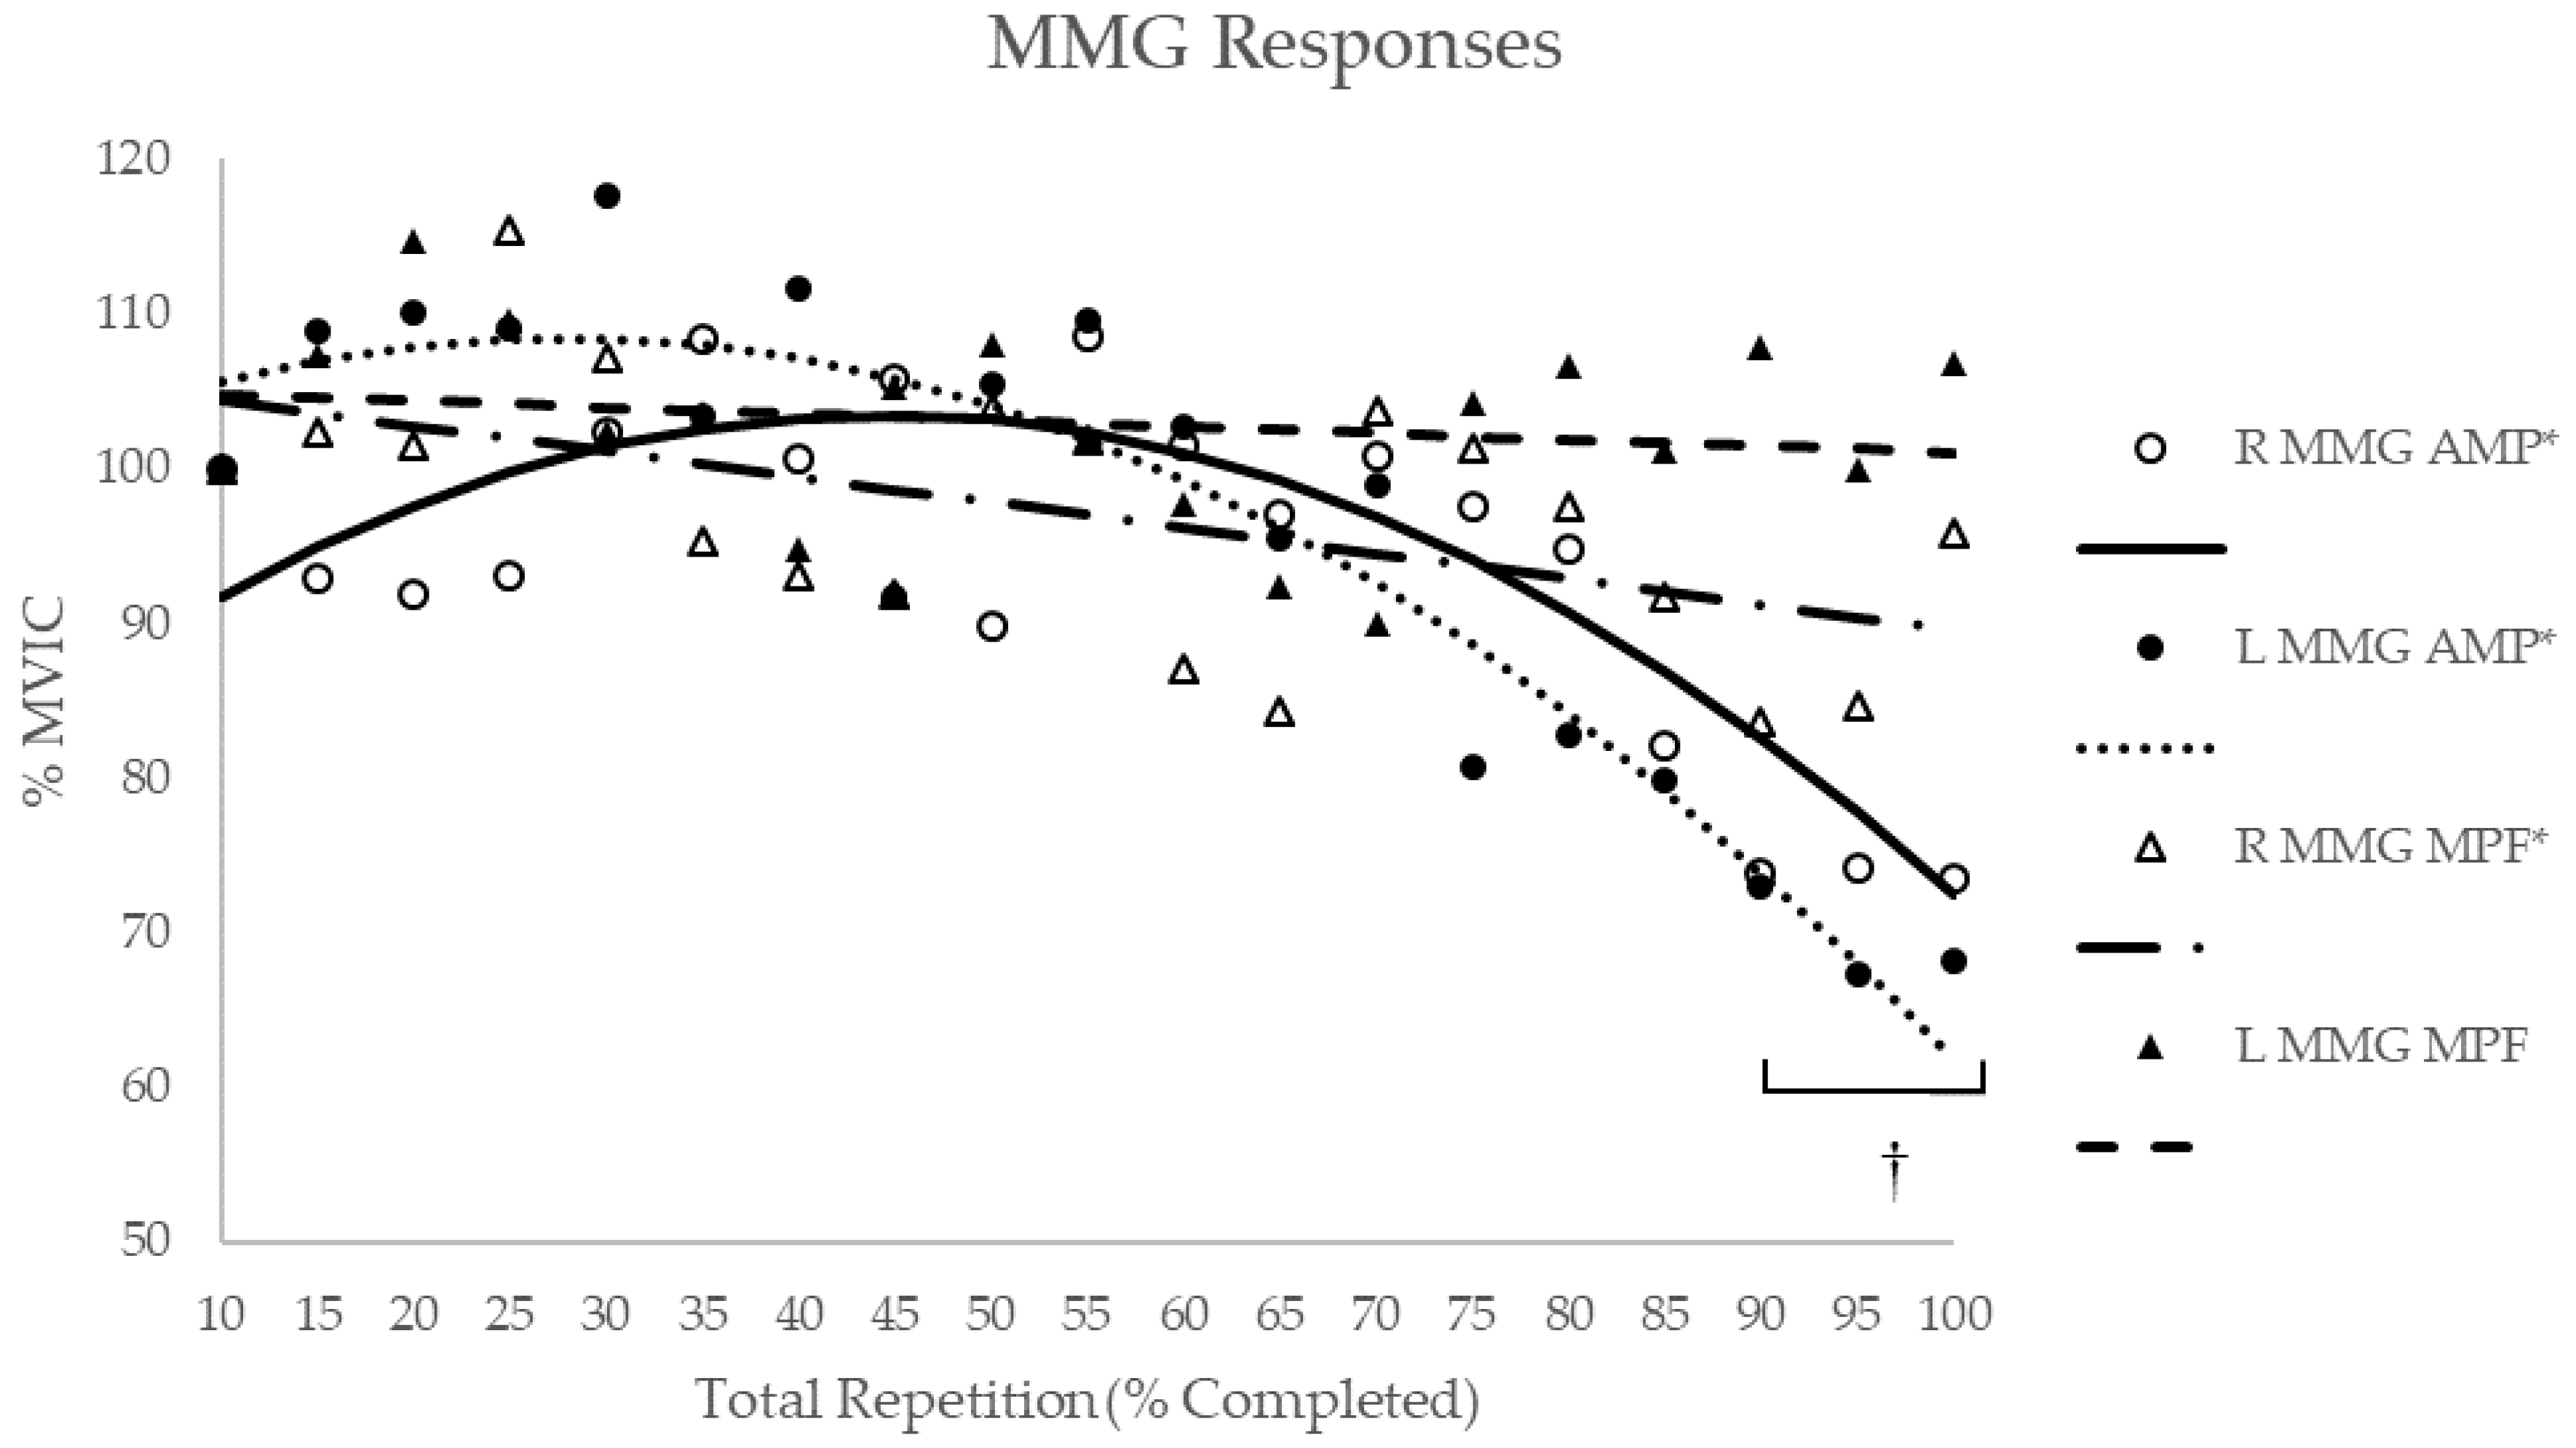
3.3. MMG Response
4. Discussion
5. Conclusions
Author Contributions
Funding
Conflicts of Interest
References
- Sperandeo, M.; Trovato, F.M.; Melillo, N.; Dimitri, L.; Musumeci, G.; Guglielmi, G. The role of ultrasound-guided fine needle aspiration biopsy in musculoskeletal diseases. Eur. J. Radiol. 2017, 90, 234–244. [Google Scholar] [CrossRef] [PubMed]
- Orizio, C. Muscle sound: Bases for the introduction of a mechanomyographic signal in muscle studies. Crit. Rev. Biomed. Eng. 1993, 21, 201–243. [Google Scholar] [PubMed]
- De Luca, C.J. The Use of Surface Electromyography in Biomechanics. J. Appl. Biomech. 1997, 13, 135–163. [Google Scholar] [CrossRef]
- Hamada, T.; Sale, D.G.; MacDougall, J.D.; Tarnopolsky, M.A. Postactivation potentiation, fiber type, and twitch contraction time in human knee extensor muscles. J. Appl. Physiol. 2000, 88, 2131–2137. [Google Scholar] [CrossRef] [PubMed]
- Barry, D.T.; Gordon, K.E.; Hinton, G.G. Acoustic and surface EMG diagnosis of pediatric muscle disease. Muscle Nerve 1990, 13, 286–290. [Google Scholar] [CrossRef] [PubMed] [Green Version]
- Marchetti, M.; Salleo, A.; Figura, F.; Del Gaudio, V. Electromyographic and phonomyographic patterns in muscle atrophy in man. In Biomechanics IV: Proceedings of the Fourth International Seminar on Biomechanics; Nelson, R.C., Morehouse, C.A., Eds.; University Park, Pennsylvania; Macmillan Education: London, UK, 1974; pp. 388–393. [Google Scholar] [CrossRef]
- Tian, S.-L.; Liu, Y.; Li, L.; Fu, W.-J.; Peng, C.-H. Mechanomyography is more sensitive than EMG in detecting age-related sarcopenia. J. Biomech. 2010, 43, 551–556. [Google Scholar] [CrossRef] [PubMed]
- Esposito, F.; Malgrati, D.; Veicsteinas, A.; Orizio, C. Time and frequency domain analysis of electromyogram and sound myogram in the elderly. Eur. J. Appl. Physiol. 1996, 73, 503–510. [Google Scholar] [CrossRef]
- Musumeci, G.; Castrogiovanni, P.; Coleman, R.; Szychlinska, M.A.; Salvatorelli, L.; Parenti, R.; Magro, G.; Imbesi, R. Somitogenesis: From somite to skeletal muscle. Acta Histochem. 2015, 117, 313–328. [Google Scholar] [CrossRef] [PubMed]
- Marchetti, M.; Felici, F.; Bernardi, M.; Minasi, P.; Di Filippo, L. Can evoked phonomyography be used to recognize fast and slow muscle in man? Int. J. Sports Med. 1992, 13, 65–68. [Google Scholar] [CrossRef] [PubMed]
- Akataki, K.; Mita, K.; Itoh, K.; Suzuki, N.; Watakabe, M. Acoustic and electrical activities during voluntary isometric contraction of biceps brachii muscles in patients with spastic cerebral palsy. Muscle Nerve 1996, 19, 1252–1257. [Google Scholar] [CrossRef]
- Orizio, C.; Esposito, F.; Paganotti, I.; Marino, L.; Rossi, B.; Veicsteinas, A. Electrically-elicited surface mechanomyogram in myotonic dystrophy. Ital. J. Neurol. Sci. 1997, 18, 185–190. [Google Scholar] [CrossRef] [PubMed]
- Marusiak, J.; Jaskólska, A.; Kisiel-Sajewicz, K.; Yue, G.H.; Jaskólski, A. EMG and MMG activities of agonist and antagonist muscles in Parkinson’s disease patients during absolute submaximal load holding. J. Electromyogr. Kinesiol. 2009, 19, 903–914. [Google Scholar] [CrossRef] [PubMed]
- De la Rosa, R.; Alonso, A.; Carrera, A.; Durán, R.; Fernández, P. Man-machine interface system for neuromuscular training and evaluation based on EMG and MMG signals. Sensors 2010, 10, 11100–11125. [Google Scholar] [CrossRef] [PubMed]
- Silva, J.; Heim, W.; Chau, T. MMG-based classification of muscle activity for prosthesis control. Conf. Proc. Annu. Int. Conf. IEEE Eng. Med. Biol. Soc. 2004, 2, 968–971. [Google Scholar]
- De Luca, C.J. Myoelectrical manifestations of localized muscular fatigue in humans. Crit. Rev. Biomed. Eng. 1984, 11, 251–279. [Google Scholar] [PubMed]
- Beck, T.W.; Housh, T.J.; Johnson, G.O.; Cramer, J.T.; Weir, J.P.; Coburn, J.W.; Malek, M.H. Does the frequency content of the surface mechanomyographic signal reflect motor unit firing rates? A brief review. J. Electromyogr. Kinesiol. 2007, 17, 1–13. [Google Scholar] [CrossRef] [PubMed]
- Smith, C.; Housh, T.; Herda, T.; Zuniga, J.; Camic, C.; Bergstrom, H.; Smith, D.; Weir, J.; Hill, E.; Cochrane, K.; et al. Time Course of Changes in Neuromuscular Parameters During Sustained Isometric Muscle Actions. J. Strength Cond. Res. 2016, 30, 2697–2702. [Google Scholar] [CrossRef]
- Camic, C.L.; Housh, T.J.; Zuniga, J.M.; Russell Hendrix, C.; Bergstrom, H.C.; Traylor, D.A.; Schmidt, R.J.; Johnson, G.O. Electromyographic and mechanomyographic responses across repeated maximal isometric and concentric muscle actions of the leg extensors. J. Electromyogr. Kinesiol. 2013, 23, 342–348. [Google Scholar] [CrossRef]
- Ebersole, K.T.; O’Connor, K.M.; Wier, A.P. Mechanomyographic and electromyographic responses to repeated concentric muscle actions of the quadriceps femoris. J. Electromyogr. Kinesiol. 2006, 16, 149–157. [Google Scholar] [CrossRef]
- Perry-Rana, S.R.; Housh, T.J.; Johnson, G.O.; Bull, A.J.; Berning, J.M.; Cramer, J.T. MMG and EMG responses during fatiguing isokinetic muscle contractions at different velocities. Muscle Nerve 2002, 26, 367–373. [Google Scholar] [CrossRef]
- Cochrane-Snyman, K.C.; Housh, T.J.; Smith, C.M.; Hill, E.C.; Jenkins, N.D.M.; Schmidt, R.J.; Johnson, G.O. Inter-individual variability in the patterns of responses for electromyography and mechanomyography during cycle ergometry using an RPE-clamp model. Eur. J. Appl. Physiol. 2016, 116, 1639–1649. [Google Scholar] [CrossRef] [PubMed]
- Beck, T.W.; Housh, T.J.; Johnson, G.O.; Weir, J.P.; Cramer, J.T.; Coburn, J.W.; Malek, M.H. Mechanomyographic and electromyographic amplitude and frequency responses during fatiguing isokinetic muscle actions of the biceps brachii. Electromyogr. Clin. Neurophysiol. 2004, 44, 431–441. [Google Scholar] [PubMed]
- Ryan, E.D.; Cramer, J.T.; Housh, T.J.; Beck, T.W.; Herda, T.J.; Hartman, M.J.; Stout, J.R. Inter-individual variability among the mechanomyographic and electromyographic amplitude and mean power frequency responses during isometric ramp muscle actions. Electromyogr. Clin. Neurophysiol. 2007, 47, 161–173. [Google Scholar] [PubMed]
- Ryan, E.D.; Beck, T.W.; Herda, T.J.; Hartman, M.J.; Stout, J.R.; Housh, T.J.; Cramer, J.T. Mechanomyographic amplitude and mean power frequency responses during isometric ramp vs. step muscle actions. J. Neurosci. Methods 2008, 168, 293–305. [Google Scholar] [CrossRef] [PubMed]
- Beck, T.W.; Housh, T.J.; Cramer, J.T.; Malek, M.H.; Mielke, M.; Hendrix, R. The effects of the innervation zone and interelectrode distance on the patterns of responses for electromyographic amplitude and mean power frequency versus isometric torque for the vastus lateralis muscle. Electromyogr. Clin. Neurophysiol. 2008, 48, 13–25. [Google Scholar] [PubMed]
- Beck, T.W.; Housh, T.J.; Cramer, J.T.; Malek, M.H.; Mielke, M.; Hendrix, R.; Weir, J.P. A comparison of monopolar and bipolar recording techniques for examining the patterns of responses for electromyographic amplitude and mean power frequency versus isometric torque for the vastus lateralis muscle. J. Neurosci. Methods 2007, 166, 159–167. [Google Scholar] [CrossRef]
- Beck, T.W.; Housh, T.J.; Cramer, J.T.; Malek, M.H.; Mielke, M.; Hendrix, R.; Weir, J.P. Electrode shift and normalization reduce the innervation zone’s influence on EMG. Med. Sci. Sports Exerc. 2008, 40, 1314–1322. [Google Scholar] [CrossRef]
- Beck, T.W.; Housh, T.J.; Cramer, J.T.; Weir, J.P. The effect of the estimated innervation zone on EMG amplitude and center frequency. Med. Sci. Sports Exerc. 2007, 39, 1282–1290. [Google Scholar] [CrossRef]
- Beck, T.W.; Housh, T.J.; Cramer, J.T.; Weir, J.P. The effects of electrode placement and innervation zone location on the electromyographic amplitude and mean power frequency versus isometric torque relationships for the vastus lateralis muscle. J. Electromyogr. Kinesiol. Off. J. Int. Soc. Electrophysiol. Kinesiol. 2008, 18, 317–328. [Google Scholar] [CrossRef]
- Camic, C.; Housh, T.; Zuniga, J.M.; Hendrix, R.; Mielke, M.; Johnson, G.; Schmidt, R. The influence of electrode orientation on the electromyographic amplitude and mean power frequency versus isometric torque relationships for the vastus lateralis. J. Exerc. Physiol. Online 2010, 13, 10–20. [Google Scholar]
- Herda, T.J.; Housh, T.J.; Weir, J.P.; Ryan, E.D.; Costa, P.B.; Defreitas, J.M.; Walter, A.A.; Stout, R.J.; Beck, T.W.; Cramer, J.T. The consistency of ordinary least-squares and generalized least-squares polynomial regression on characterizing the mechanomyographic amplitude versus torque relationship. Physiol. Meas. 2009, 30, 115–128. [Google Scholar] [CrossRef]
- Beck, T.W.; Housh, T.J.; Mielke, M.; Cramer, J.T.; Weir, J.P.; Malek, M.H.; Johnson, G.O. The influence of electrode placement over the innervation zone on electromyographic amplitude and mean power frequency versus isokinetic torque relationships. J. Neurosci. Methods 2007, 162, 72–83. [Google Scholar] [CrossRef]
- Camic, C.L.; Housh, T.J.; Zuniga, J.M.; Bergstrom, H.C.; Schmidt, R.J.; Johnson, G.O. Mechanomyographic and electromyographic responses during fatiguing eccentric muscle actions of the leg extensors. J. Appl. Biomech. 2014, 30, 255–261. [Google Scholar] [CrossRef]
- Malek, M.H.; Coburn, J.W.; Weir, J.P.; Beck, T.W.; Housh, T.J. The effects of innervation zone on electromyographic amplitude and mean power frequency during incremental cycle ergometry. J. Neurosci. Methods 2006, 55, 126–133. [Google Scholar] [CrossRef]
- Malek, M.H.; Housh, T.J.; Coburn, J.W.; Weir, J.P.; Schmidt, R.J.; Beck, T.W. The effects of interelectrode distance on electromyographic amplitude and mean power frequency during incremental cycle ergometry. J. Neurosci. Methods 2006, 151, 139–147. [Google Scholar] [CrossRef]
- Zuniga, J.M.; Housh, T.J.; Camic, C.L.; Hendrix, C.R.; Mielke, M.; Schmidt, R.J.; Johnson, G.O. The effects of accelerometer placement on mechanomyographic amplitude and mean power frequency during cycle ergometry. J. Electromyogr. Kinesiol. Off. J. Int. Soc. Electrophysiol. Kinesiol. 2010, 20, 719–725. [Google Scholar] [CrossRef]
- Zuniga, J.M.; Housh, T.J.; Hendrix, C.R.; Camic, C.L.; Mielke, M.; Schmidt, R.J.; Johnson, G.O. The effects of electrode orientation on electromyographic amplitude and mean power frequency during cycle ergometry. J. Neurosci. Methods 2009, 184, 256–262. [Google Scholar] [CrossRef]
- Farina, D.; Merletti, R.; Enoka, R.M. The extraction of neural strategies from the surface EMG. J. Appl. Physiol. 2004, 96, 1486–1495. [Google Scholar] [CrossRef] [Green Version]
- Bishop, C.; Turner, A.; Read, P. Effects of inter-limb asymmetries on physical and sports performance: A systematic review. J. Sports Sci. 2018, 36, 1135–1144. [Google Scholar] [CrossRef]
- Yen, S.-C.; Olsavsky, L.C.; Cloonan, C.M.; Llanos, A.R.; Dwyer, K.J.; Nabian, M.; Farjadian, A.B. An examination of lower limb asymmetry in ankle isometric force control. Hum. Mov. Sci. 2018, 57, 40–49. [Google Scholar] [CrossRef]
- Matkowski, B.; Place, N.; Martin, A.; Lepers, R. Neuromuscular fatigue differs following unilateral vs bilateral sustained submaximal contractions. Scand. J. Med. Sci. Sports 2011, 21, 268–276. [Google Scholar] [CrossRef]
- American College of Sports Medicine; Riebe, D.; Ehrman, J.K.; Liguori, G.; Magal, M. ACSM’s Guidelines for Exercise Testing and Prescription; American College of Sports Medicine: Michigan, IL, USA, 2018. [Google Scholar]
- Hermens, H.J.; Freriks, B.; Disselhorst-Klug, C.; Rau, G. Development of recommendations for SEMG sensors and sensor placement procedures. J. Electromyogr. Kinesiol. Off. J. Int. Soc. Electrophysiol. Kinesiol. 2000, 10, 361–374. [Google Scholar] [CrossRef]
- Abe, T.; Kumagai, K.; Brechue, W.F. Fascicle length of leg muscles is greater in sprinters than distance runners. Med. Sci. Sports Exerc. 2000, 32, 1125–1129. [Google Scholar] [CrossRef] [Green Version]
- Brown, L.E.; Whitehurst, M.; Gilbert, R.; Buchalter, D.N. The effect of velocity and gender on load range during knee extension and flexion exercise on an isokinetic device. J. Orthop. Sports Phys. Ther. 1995, 21, 107–112. [Google Scholar] [CrossRef]
- Brown, L.E. Isokinetics in Human Performance; Human Kinetics: Davie, FL, USA, 2000. [Google Scholar]
- Keppel, G.; Wickens, T. Design and Analysis, 4th ed.; Pearson Prentice Hall: Upper Saddle River, NJ, USA, 2004. [Google Scholar]
- Matkowski, B.; Martin, A.; Lepers, R. Comparison of maximal unilateral versus bilateral voluntary contraction force. Eur. J. Appl. Physiol. 2011, 111, 1571–1578. [Google Scholar] [CrossRef]
- Oda, S.; Moritani, T. Cross-correlation of bilateral differences in fatigue during sustained maximal voluntary contraction. Eur. J. Appl. Physiol. 1995, 70, 305–310. [Google Scholar] [CrossRef]
- Post, M.; van Duinen, H.; Steens, A.; Renken, R.; Kuipers, B.; Maurits, N.; Zijdewind, I. Reduced cortical activity during maximal bilateral contractions of the index finger. NeuroImage 2007, 35, 16–27. [Google Scholar] [CrossRef]
- Conway, B.A.; Halliday, D.M.; Farmer, S.F.; Shahani, U.; Maas, P.; Weir, A.I.; Rosenberg, J.R. Synchronization between motor cortex and spinal motoneuronal pool during the performance of a maintained motor task in man. J. Physiol. 1995, 489, 917–924. [Google Scholar] [CrossRef]
- Chang, Y.-J.; Chou, C.-C.; Chan, H.-L.; Hsu, M.-J.; Yeh, M.-Y.; Fang, C.-Y.; Chuang, Y.-F.; Wei, S.-H.; Lien, H.-Y. Increases of quadriceps inter-muscular cross-correlation and coherence during exhausting stepping exercise. Sensors 2012, 12, 16353–16367. [Google Scholar] [CrossRef]
- Maudrich, T.; Kenville, R.; Lepsien, J.; Villringer, A.; Ragert, P. Structural neural correlates of physiological mirror activity during isometric contractions of non-dominant hand muscles. Sci. Rep. 2018, 8, 9178. [Google Scholar] [CrossRef]
- Boonstra, T.W.; Daffertshofer, A.; van As, E.; van der Vlugt, S.; Beek, P.J. Bilateral motor unit synchronization is functionally organized. Exp. Brain Res. 2007, 178, 79–88. [Google Scholar] [CrossRef]
- Boonstra, T.W.; Daffertshofer, A.; van Ditshuizen, J.C.; van den Heuvel, M.R.C.; Hofman, C.; Willigenburg, N.W.; Beek, P.J. Fatigue-related changes in motor-unit synchronization of quadriceps muscles within and across legs. J. Electromyogr. Kinesiol. 2008, 18, 717–731. [Google Scholar] [CrossRef]
- De Luca, C.J.; Erim, Z. Common drive of motor units in regulation of muscle force. Trends Neurosci. 1994, 17, 299–305. [Google Scholar] [CrossRef]
- De Luca, C.J.; Erim, Z. Common drive in motor units of a synergistic muscle pair. J. Neurophysiol. 2002, 87, 2200–2204. [Google Scholar] [CrossRef]
- Basmajian, J.V.; De Luca, C.J. Muscles Alive: Their Functions Revealed by Electromyography, 5th ed.; Williams and Wilkins: Baltimore, MD, USA, 1985. [Google Scholar]
- Arendt-Nielsen, L.; Mills, K.R. The relationship between mean power frequency of the EMG spectrum and muscle fibre conduction velocity. Electroencephalogr. Clin. Neurophysiol. 1985, 60, 130–134. [Google Scholar] [CrossRef]
- Fortune, E.; Lowery, M.M. Effect of extracellular potassium accumulation on muscle fiber conduction velocity: A simulation study. Ann. Biomed. Eng. 2009, 37, 2105–2117. [Google Scholar] [CrossRef]
- Sjogaard, G.; Saltin, B. Extra- and intracellular water spaces in muscles of man at rest and with dynamic exercise. Am. J. Physiol. Regul. Integr. Comp. Physiol. 1982, 243, R271–R280. [Google Scholar] [CrossRef]
- Jensen, Z.R.; Jørgensen, K.; Sjøgaard, G. The effect of prolonged isometric contractions on muscle fluid balance. Eur. J. Appl. Physiol. 1994, 69, 439–444. [Google Scholar] [CrossRef]
- Orizio, C.; Gobbo, M.; Diemont, B.; Esposito, F.; Veicsteinas, A. The surface mechanomyogram as a tool to describe the influence of fatigue on biceps brachii motor unit activation strategy. Historical basis and novel evidence. Eur. J. Appl. Physiol. 2003, 90, 326–336. [Google Scholar] [CrossRef]
- Earp, J.E.; Newton, R.U.; Cormie, P.; Blazevich, A.J. Knee angle-specific EMG normalization: The use of polynomial based EMG-angle relationships. J. Electromyogr. Kinesiol. Off. J. Int. Soc. Electrophysiol. Kinesiol. 2013, 23, 238–244. [Google Scholar] [CrossRef]
- Farina, D. Interpretation of the surface electromyogram in dynamic contractions. Exerc. Sport Sci. Rev. 2006, 34, 121–127. [Google Scholar] [CrossRef]


| Subjects | R EMG AMP | L EMG AMP | R EMG MPF | L EMG MPF | ||||||||
|---|---|---|---|---|---|---|---|---|---|---|---|---|
| Model | Correlation | p-Value | Model | Correlation | p-Value | Model | Correlation | p-Value | Model | Correlation | p-Value | |
| 1 | – | – | – | – | – | – | Quadratic | −0.733 | 0.002 | Quadratic | −0.563 | 0.047 |
| 2 | Quadratic | 0.685 | 0.006 | Quadratic | 0.831 | <0.001 | Quadratic | −0.733 | 0.002 | Quadratic | −0.721 | 0.003 |
| 3 | – | – | – | – | – | – | – | – | – | Quadratic | 0.579 | 0.039 |
| 4 | – | – | – | – | – | – | – | – | – | – | – | – |
| 5 | – | – | – | Quadratic | 0.590 | 0.033 | Quadratic | −0.949 | <0.001 | Quadratic | −0.749 | 0.001 |
| 6 | – | – | – | – | – | – | Quadratic | 0.870 | <0.001 | Quadratic | −0.585 | 0.035 |
| 7 | Quadratic | 0.749 | 0.001 | – | – | – | Quadratic | −0.805 | <0.001 | Linear | −0.525 | 0.021 |
| 8 | – | – | – | – | – | – | – | – | – | Quadratic | −0.619 | 0.021 |
| 9 | – | – | – | Quadratic | 0.562 | 0.048 | Quadratic | −0.700 | 0.005 | Quadratic | −0.739 | 0.002 |
| 10 | – | – | – | – | – | – | – | – | – | Quadratic | −0.685 | 0.006 |
| 11 | – | – | – | – | – | – | Quadratic | −0.715 | 0.003 | Quadratic | −0.633 | 0.017 |
| 12 | Linear | 0.549 | 0.015 | – | – | – | Quadratic | −0.778 | 0.001 | Quadratic | −0.718 | 0.003 |
| 13 | – | – | – | – | – | – | Quadratic | −0.767 | 0.001 | – | – | – |
| Composite | Quadratic | 0.749 | 0.001 | Quadratic | 0.793 | 0.002 | Quadratic | −0.953 | <0.001 | Quadratic | −0.913 | <0.001 |
| Subjects | R MMG AMP | L MMG AMP | R MMG MPF | L MMG MPF | ||||||||
|---|---|---|---|---|---|---|---|---|---|---|---|---|
| Model | Correlation | p-Value | Model | Correlation | p-Value | Model | Correlation | p-Value | model | Correlation | p-Value | |
| 1 | – | – | – | Linear | −0.498 | 0.030 | Quadratic | −0.603 | 0.020 | – | – | – |
| 2 | – | – | – | – | – | – | – | – | – | Quadratic | −0.658 | 0.011 |
| 3 | – | – | – | – | – | – | – | – | – | – | – | – |
| 4 | Quadratic | −0.769 | 0.001 | Quadratic | −0.679 | 0.001 | – | – | – | – | – | – |
| 5 | – | – | – | – | – | – | Linear | −0.506 | 0.027 | – | – | – |
| 6 | Quadratic | −0.804 | <0.001 | Quadratic | −0.759 | 0.001 | Linear | 0.480 | 0.037 | Quadratic | 0.779 | 0.001 |
| 7 | – | – | – | Quadratic | −0.569 | 0.044 | – | – | – | – | – | – |
| 8 | – | – | – | Quadratic | −0.867 | <0.001 | – | – | – | – | – | – |
| 9 | – | – | – | Quadratic | −0.651 | 0.012 | – | – | – | – | – | – |
| 10 | Quadratic | 0.615 | 0.022 | Quadratic | 0.637 | 0.015 | Quadratic | −0.792 | <0.001 | – | – | – |
| 11 | – | – | – | Linear | −0.469 | 0.043 | – | – | – | – | – | – |
| 12 | Quadratic | 0.789 | <0.001 | – | – | – | Quadratic | −0.890 | <0.001 | – | – | – |
| 13 | Quadratic | −0.564 | 0.047 | – | – | – | – | – | – | – | – | – |
| Composite | Quadratic | −0.864 | <0.001 | Quadratic | −0.933 | <0.001 | Linear | −0.547 | 0.015 | – | – | – |
© 2019 by the authors. Licensee MDPI, Basel, Switzerland. This article is an open access article distributed under the terms and conditions of the Creative Commons Attribution (CC BY) license (http://creativecommons.org/licenses/by/4.0/).
Share and Cite
Anders, J.P.V.; Smith, C.M.; Keller, J.L.; Hill, E.C.; Housh, T.J.; Schmidt, R.J.; Johnson, G.O. Inter- and Intra-Individual Differences in EMG and MMG during Maximal, Bilateral, Dynamic Leg Extensions. Sports 2019, 7, 175. https://doi.org/10.3390/sports7070175
Anders JPV, Smith CM, Keller JL, Hill EC, Housh TJ, Schmidt RJ, Johnson GO. Inter- and Intra-Individual Differences in EMG and MMG during Maximal, Bilateral, Dynamic Leg Extensions. Sports. 2019; 7(7):175. https://doi.org/10.3390/sports7070175
Chicago/Turabian StyleAnders, John Paul V., Cory M. Smith, Joshua L. Keller, Ethan C. Hill, Terry J. Housh, Richard J. Schmidt, and Glen O. Johnson. 2019. "Inter- and Intra-Individual Differences in EMG and MMG during Maximal, Bilateral, Dynamic Leg Extensions" Sports 7, no. 7: 175. https://doi.org/10.3390/sports7070175