The Effect of ProHydrolase® on the Amino Acid and Intramuscular Anabolic Signaling Response to Resistance Exercise in Trained Males

 , , , , , and
Abstract
:1. Introduction
2. Materials and Methods
2.1. Study Participants
2.2. Study Protocol
2.3. Anthropometric and Body Composition Assessment
2.4. Maximal Strength Testing
2.5. Experimental Trials
2.6. Supplementation Protocol
2.7. Blood Collection, Handling, and Storage
2.8. Muscle Biopsy Procedure
2.9. Plasma Insulin Analysis
2.10. Plasma Amino Acid Analysis
2.10.1. Materials
2.10.2. Sample Preparation
2.10.3. LC/MS Data Acquisition and Processing
2.10.4. Quality Control of LC/MS Data
2.11. Intramuscular Signaling Analysis
2.12. Dietary Logs
2.13. Statistical Analysis
3. Results
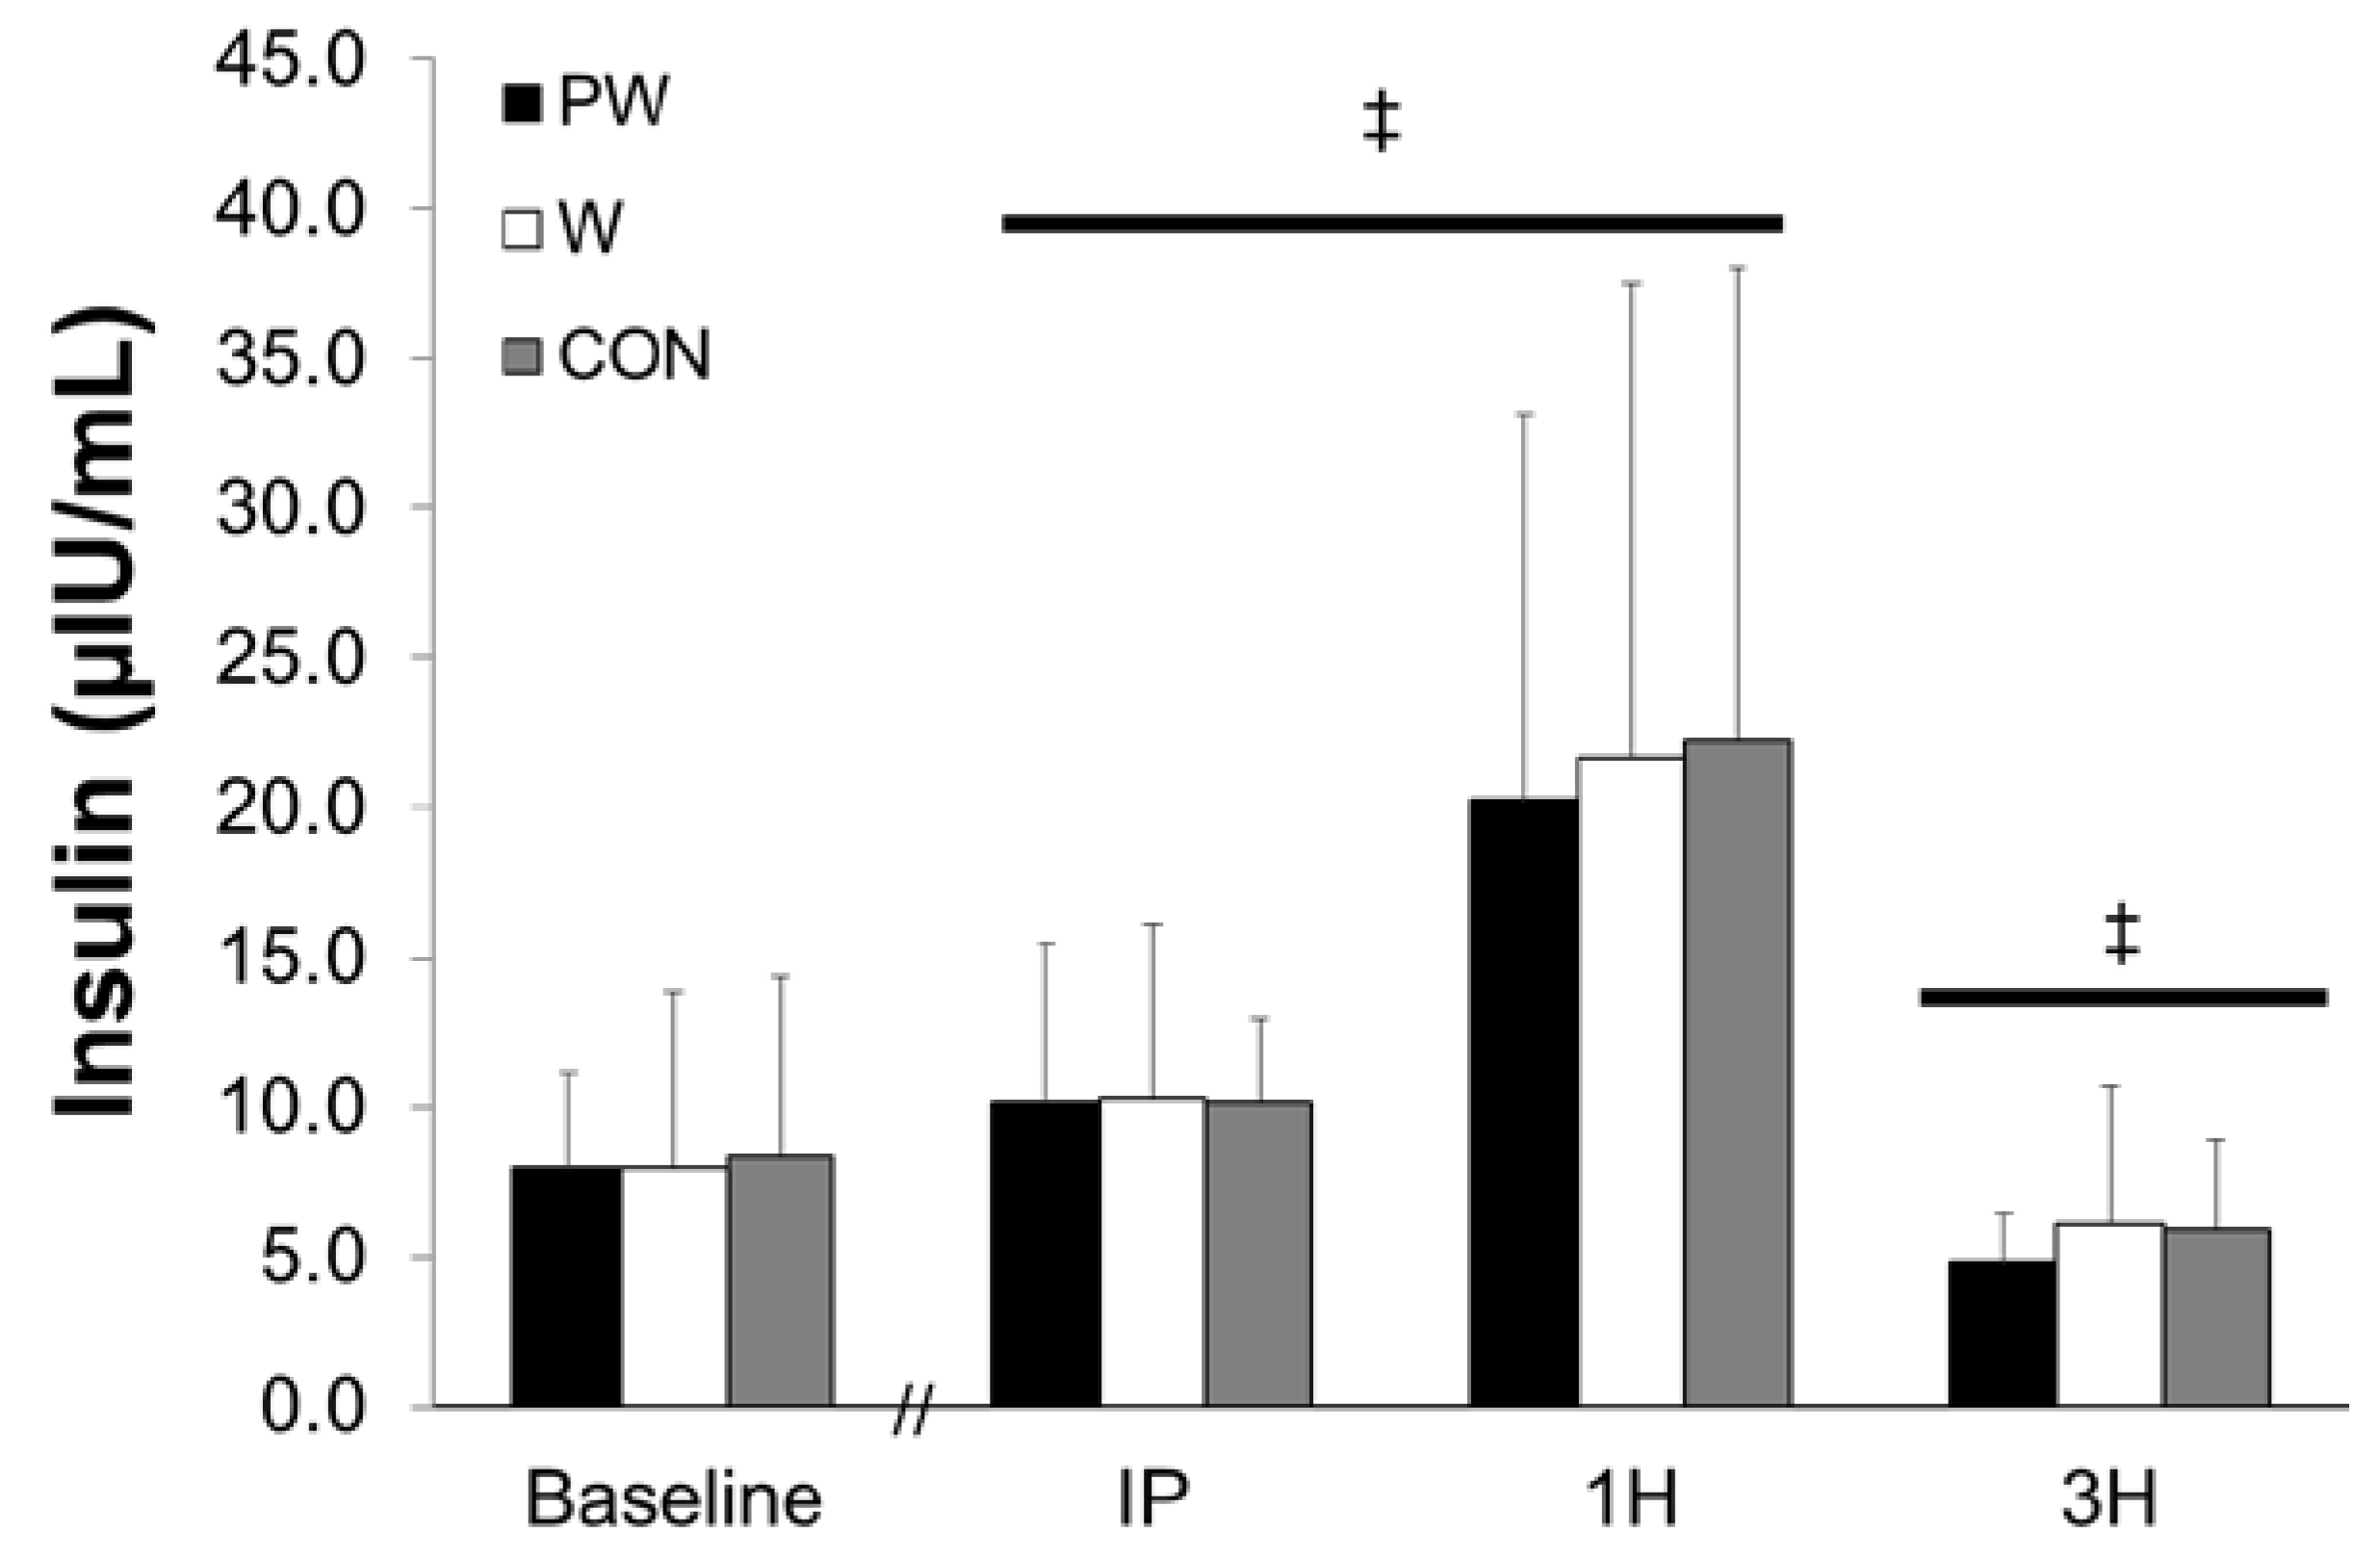
3.1. Plasma Insulin
3.2. Plasma Amino Acids
3.3. Anabolic Signaling
4. Discussion
5. Conclusions
Supplementary Materials
Author Contributions
Funding
Conflicts of Interest
Appendix A

| Time, min | % A | % B | % C | % D |
|---|---|---|---|---|
| 0 | 11 | 85 | 2 | 2 |
| 6.0 | 11 | 85 | 2 | 2 |
| 6.1 | 16 | 80 | 2 | 2 |
| 10.0 | 26 | 70 | 2 | 2 |
| 12.0 | 36 | 60 | 2 | 2 |
| 12.1 | 11 | 85 | 2 | 2 |
| 18.0 | 11 | 85 | 2 | 2 |
| Amino Acid | Mass AA, g/mol | MRM Transition | Retention Time, min | Cone Voltage, V | Collision Energy, eV |
|---|---|---|---|---|---|
| Ala | 89.1 | 90.1 > 44.0 | 6.50 | 15 | 9 |
| Arg | 174.2 | 175.1 > 70.1 | 11.06 | 25 | 20 |
| 175.1 > 116.0 | 11.06 | 25 | 19 | ||
| Asn | 132.1 | 133.0 > 74.0 | 9.05 | 20 | 15 |
| 133.0 > 88.0 | 9.05 | 20 | 10 | ||
| Asp | 133.1 | 134.0 > 74.0 | 10.57 | 20 | 14 |
| 134.0 > 88.0 | 10.57 | 20 | 14 | ||
| Gln | 146.2 | 147.0 > 84.0 | 8.80 | 15 | 15 |
| 147.0 > 102.0 | 8.82 | 15 | 19 | ||
| Glu | 147.1 | 148.0 > 84.0 | 9.64 | 18 | 16 |
| 148.0 > 102.0 | 9.63 | 18 | 15 | ||
| Gly | 75.1 | 76.0 > 30.0 | 8.00 | 20 | 7 |
| 76.0 > 48.0 | 8.02 | 20 | 7 | ||
| Ile | 131.2 | 132.0 > 69.0 | 2.99 | 15 | 15 |
| 132.0 > 86.0 | 2.97 | 15 | 15 | ||
| Leu | 131.2 | 132.0 > 30.0 | 2.69 | 15 | 15 |
| 132.0 > 86.0 | 2.70 | 15 | 15 | ||
| Lys | 146.2 | 147.0 > 84.0 | 11.42 | 20 | 15 |
| 147.0 > 130.0 | 11.42 | 20 | 13 | ||
| Met | 149.2 | 150.0 > 104.0 | 3.38 | 16 | 10 |
| 150.0 > 133.0 | 3.36 | 16 | 10 | ||
| Phe | 165.2 | 166.0 > 120.0 | 2.62 | 20 | 15 |
| 166.0 > 103.0 | 2.62 | 20 | 20 | ||
| Pro | 115.1 | 116.0 > 70.1 | 4.04 | 15 | 15 |
| 116.0 > 43.1 | 4.02 | 15 | 15 | ||
| Ser | 105.1 | 106.0 > 60.0 | 8.83 | 20 | 9 |
| 106.0 > 42.0 | 8.85 | 20 | 15 | ||
| Thr | 119.1 | 120.0 > 74.0 | 7.55 | 15 | 11 |
| 120.0 > 56.0 | 7.51 | 15 | 11 | ||
| Trp | 204.2 | 205.0 > 146.0 | 2.66 | 15 | 18 |
| 205.0 > 188.0 | 2.68 | 15 | 18 | ||
| Tyr | 181.2 | 182.0 > 136.0 | 4.24 | 20 | 15 |
| 182.0 > 165.0 | 4.23 | 20 | 19 | ||
| Val | 117.1 | 118.0 > 72.0 | 3.90 | 18 | 10 |
| 118.0 > 55.0 | 3.90 | 18 | 10 |
| Amino Acid | IS-AA MRM Transition | Cone Voltage, V | Collision Energy, eV |
|---|---|---|---|
| Ala | 94.1 > 47.1 | 15 | 8 |
| Arg | 185.1 > 75.1 | 25 | 20 |
| Asn | 139.0 > 77.0 | 20 | 15 |
| Asp | 139.0 > 77.0 | 20 | 14 |
| Gln | 154.0 > 89.0 | 15 | 15 |
| Glu | 154.1 > 107.1 | 18 | 16 |
| Gly | 79.1 > 32.1 | 20 | 7 |
| Ile | 139.0 > 92.0 | 15 | 15 |
| Leu | 139.0 > 92.0 | 15 | 15 |
| Lys | 155.2 > 137.1 | 15 | 14 |
| Met | 156.2 > 109.2 | 16 | 10 |
| Phe | 176.2 > 128.1 | 20 | 15 |
| Pro | 122.1 > 75.1 | 15 | 15 |
| Ser | 110.1 > 63.1 | 20 | 9 |
| Thr | 125.1 > 78.1 | 15 | 11 |
| Trp | 218.0 > 155.0 | 15 | 18 |
| Tyr | 192.2 > 145.2 | 20 | 15 |
| Val | 124.1 > 77.1 | 18 | 10 |
References
- Morton, R.W.; Murphy, K.T.; McKellar, S.R.; Schoenfeld, B.J.; Henselmans, M.; Helms, E.; Aragon, A.A.; Devries, M.C.; Banfield, L.; Krieger, J.W.; et al. A systematic review, meta-analysis and meta-regression of the effect of protein supplementation on resistance training-induced gains in muscle mass and strength in healthy adults. Br. J. Sports Med. 2018, 52, 376–384. [Google Scholar] [CrossRef]
- Bodine, S.C.; Stitt, T.N.; Gonzalez, M.; Kline, W.O.; Stover, G.L.; Bauerlein, R.; Zlotchenko, E.; Scrimgeour, A.; Lawrence, J.C.; Glass, D.J. Akt/mTOR pathway is a crucial regulator of skeletal muscle hypertrophy and can prevent muscle atrophy in vivo. Nat. Cell Biol. 2001, 3, 1014. [Google Scholar] [CrossRef]
- Goodman, C.A.; Frey, J.W.; Mabrey, D.M.; Jacobs, B.L.; Lincoln, H.C.; You, J.S.; Hornberger, T.A. The role of skeletal muscle mTOR in the regulation of mechanical load-induced growth. J. Physiol. 2011, 589, 5485–5501. [Google Scholar] [CrossRef]
- Burd, N.A.; West, D.W.; Staples, A.W.; Atherton, P.J.; Baker, J.M.; Moore, D.R.; Holwerda, A.M.; Parise, G.; Rennie, M.J.; Baker, S.K. Low-load high volume resistance exercise stimulates muscle protein synthesis more than high-load low volume resistance exercise in young men. PLoS ONE 2010, 5, e12033. [Google Scholar] [CrossRef] [PubMed] [Green Version]
- Mitchell, C.J.; Churchward-Venne, T.A.; Bellamy, L.; Parise, G.; Baker, S.K.; Phillips, S.M. Muscular and systemic correlates of resistance training-induced muscle hypertrophy. PLoS ONE 2013, 8, e78636. [Google Scholar] [CrossRef] [PubMed] [Green Version]
- Baar, K.; Esser, K. Phosphorylation of p70S6kcorrelates with increased skeletal muscle mass following resistance exercise. Am. J. Physiol. Cell Physiol. 1999, 276, C120–C127. [Google Scholar] [CrossRef] [PubMed]
- Terzis, G.; Georgiadis, G.; Stratakos, G.; Vogiatzis, I.; Kavouras, S.; Manta, P.; Mascher, H.; Blomstrand, E. Resistance exercise-induced increase in muscle mass correlates with p70S6 kinase phosphorylation in human subjects. Eur. J. Appl. Physiol. 2008, 102, 145–152. [Google Scholar] [CrossRef]
- Kramer, H.F.; Goodyear, L.J. Exercise, MAPK, and NF-κB signaling in skeletal muscle. J. Appl. Physiol. 2007, 103, 388–395. [Google Scholar] [CrossRef]
- Nicoll, J.X.; Fry, A.C.; Galpin, A.J.; Sterczala, A.J.; Thomason, D.B.; Moore, C.A.; Weiss, L.W.; Chiu, L.Z. Changes in resting mitogen-activated protein kinases following resistance exercise overreaching and overtraining. Eur. J. Appl. Physiol. 2016, 116, 2401–2413. [Google Scholar] [CrossRef]
- Gonzalez, A.M.; Hoffman, J.R.; Townsend, J.R.; Jajtner, A.R.; Boone, C.H.; Beyer, K.S.; Baker, K.M.; Wells, A.J.; Mangine, G.T.; Robinson, E.H.T.; et al. Intramuscular MAPK signaling following high volume and high intensity resistance exercise protocols in trained men. Eur. J. Appl. Physiol. 2016, 116, 1663–1670. [Google Scholar] [CrossRef]
- Cargnello, M.; Roux, P.P. Activation and function of the MAPKs and their substrates, the MAPK-activated protein kinases. Microbiol. Mol. Biol. Rev. 2011, 75, 50–83. [Google Scholar] [CrossRef] [PubMed] [Green Version]
- Boppart, M.D.; Aronson, D.; Gibson, L.; Roubenoff, R.; Abad, L.W.; Bean, J.; Goodyear, L.J.; Fielding, R.A. Eccentric exercise markedly increases c-Jun NH2-terminal kinase activity in human skeletal muscle. J. Appl. Physiol. 1999, 87, 1668–1673. [Google Scholar] [CrossRef] [PubMed]
- Kudrna, R.A.; Fry, A.C.; Nicoll, J.X.; Gallagher, P.M.; Prewitt, M.R. Effect of Three Different Maximal Concentric Velocity Squat Protocols on MAPK Phosphorylation and Endocrine Responses. J. Strength Cond. Res. 2019, 33, 1692–1702. [Google Scholar] [CrossRef] [PubMed]
- Galpin, A.J.; Fry, A.C.; Chiu, L.Z.; Thomason, D.B.; Schilling, B.K. High-power resistance exercise induces MAPK phosphorylation in weightlifting trained men. Appl. Physiol. Nutr. Metab. 2011, 37, 80–87. [Google Scholar] [CrossRef]
- Mitchell, W.K.; Phillips, B.E.; Williams, J.P.; Rankin, D.; Lund, J.N.; Smith, K.; Atherton, P.J. A Dose-rather than delivery profile–dependent mechanism regulates the “muscle-full” effect in response to oral essential amino acid intake in young men. J. Nutr. 2014, 145, 207–214. [Google Scholar] [CrossRef] [Green Version]
- Areta, J.L.; Burke, L.M.; Ross, M.L.; Camera, D.M.; West, D.W.; Broad, E.M.; Jeacocke, N.A.; Moore, D.R.; Stellingwerff, T.; Phillips, S.M.; et al. Timing and distribution of protein ingestion during prolonged recovery from resistance exercise alters myofibrillar protein synthesis. J. Physiol. 2013, 591, 2319–2331. [Google Scholar] [CrossRef]
- Macnaughton, L.S.; Wardle, S.L.; Witard, O.C.; McGlory, C.; Hamilton, D.L.; Jeromson, S.; Lawrence, C.E.; Wallis, G.A.; Tipton, K.D. The response of muscle protein synthesis following whole-body resistance exercise is greater following 40 g than 20 g of ingested whey protein. Physiol. Rep. 2016, 4. [Google Scholar] [CrossRef]
- Phillips, S.M.; Tipton, K.D.; Aarsland, A.; Wolf, S.E.; Wolfe, R.R. Mixed muscle protein synthesis and breakdown after resistance exercise in humans. Am. J. Physiol. Endocrinol. Metab. 1997, 273, E99–E107. [Google Scholar] [CrossRef]
- Biolo, G.; Maggi, S.P.; Williams, B.D.; Tipton, K.D.; Wolfe, R.R. Increased rates of muscle protein turnover and amino acid transport after resistance exercise in humans. Am. J. Physiol. Endocrinol. Metab. 1995, 268, E514–E520. [Google Scholar] [CrossRef] [Green Version]
- Phillips, S.M.; Hartman, J.W.; Wilkinson, S.B. Dietary protein to support anabolism with resistance exercise in young men. J. Am. Coll. Nutr. 2005, 24, 134S–139S. [Google Scholar] [CrossRef]
- Tang, J.E.; Moore, D.R.; Kujbida, G.W.; Tarnopolsky, M.A.; Phillips, S.M. Ingestion of whey hydrolysate, casein, or soy protein isolate: Effects on mixed muscle protein synthesis at rest and following resistance exercise in young men. J. Appl. Physiol. 2009, 107, 987–992. [Google Scholar] [CrossRef] [PubMed]
- Phillips, S.M. A brief review of higher dietary protein diets in weight loss: A focus on athletes. Sports Med. 2014, 44 (Suppl. 2), S149–S153. [Google Scholar] [CrossRef] [PubMed] [Green Version]
- Traylor, D.A.; Gorissen, S.H.M.; Hopper, H.; Prior, T.; McGlory, C.; Phillips, S.M. Aminoacidemia following ingestion of native whey protein, micellar casein, and a whey-casein blend in young men. Appl. Physiol. Nutr. Metab. 2019, 44, 103–106. [Google Scholar] [CrossRef] [PubMed] [Green Version]
- Reidy, P.T.; Walker, D.K.; Dickinson, J.M.; Gundermann, D.M.; Drummond, M.J.; Timmerman, K.L.; Fry, C.S.; Borack, M.S.; Cope, M.B.; Mukherjea, R.; et al. Protein blend ingestion following resistance exercise promotes human muscle protein synthesis. J. Nutr. 2013, 143, 410–416. [Google Scholar] [CrossRef] [PubMed]
- Reitelseder, S.; Agergaard, J.; Doessing, S.; Helmark, I.C.; Lund, P.; Kristensen, N.B.; Frystyk, J.; Flyvbjerg, A.; Schjerling, P.; van Hall, G. Whey and casein labeled with L-[1-13C] leucine and muscle protein synthesis: Effect of resistance exercise and protein ingestion. Am. J. Physiol. Endocrinol. Metab. 2010, 300, E231–E242. [Google Scholar] [CrossRef] [Green Version]
- West, D.W.; Burd, N.A.; Coffey, V.G.; Baker, S.K.; Burke, L.M.; Hawley, J.A.; Moore, D.R.; Stellingwerff, T.; Phillips, S.M. Rapid aminoacidemia enhances myofibrillar protein synthesis and anabolic intramuscular signaling responses after resistance exercise. Am. J. Clin. Nutr. 2011, 94, 795–803. [Google Scholar] [CrossRef] [Green Version]
- Koopman, R.; Crombach, N.; Gijsen, A.P.; Walrand, S.; Fauquant, J.; Kies, A.K.; Lemosquet, S.; Saris, W.H.; Boirie, Y.; van Loon, L.J. Ingestion of a protein hydrolysate is accompanied by an accelerated in vivo digestion and absorption rate when compared with its intact protein. Am. J. Clin. Nutr. 2009, 90, 106–115. [Google Scholar] [CrossRef] [Green Version]
- Power, O.; Hallihan, A.; Jakeman, P. Human insulinotropic response to oral ingestion of native and hydrolysed whey protein. Amino Acids 2009, 37, 333–339. [Google Scholar] [CrossRef]
- Farup, J.; Rahbek, S.K.; Storm, A.C.; Klitgaard, S.; Jorgensen, H.; Bibby, B.M.; Serena, A.; Vissing, K. Effect of degree of hydrolysis of whey protein on in vivo plasma amino acid appearance in humans. SpringerPlus 2016, 5, 382. [Google Scholar] [CrossRef] [Green Version]
- Farnfield, M.M.; Trenerry, C.; Carey, K.A.; Cameron-Smith, D. Plasma amino acid response after ingestion of different whey protein fractions. Int. J. Food Sci. Nutr. 2009, 60, 476–486. [Google Scholar] [CrossRef]
- Oben, J.; Kothari, S.C.; Anderson, M.L. An open label study to determine the effects of an oral proteolytic enzyme system on whey protein concentrate metabolism in healthy males. J. Int. Soc. Sports Nutr. 2008, 5, 10. [Google Scholar] [CrossRef] [PubMed] [Green Version]
- Sindayikengera, S.; Xia, W.-S. Nutritional evaluation of caseins and whey proteins and their hydrolysates from Protamex. J. Zhejiang Univ. Sci. B 2006, 7, 90–98. [Google Scholar] [CrossRef] [PubMed] [Green Version]
- Mahmood, T.; Mirza, M.; Nawaz, H.; Shahid, M.; Athar, M.; Hussain, M. Effect of supplementing exogenous protease in low protein poultry by-product meal based diets on growth performance and nutrient digestibility in broilers. Anim. Feed Sci. Technol. 2017, 228, 23–31. [Google Scholar] [CrossRef]
- Zuo, J.; Ling, B.; Long, L.; Li, T.; Lahaye, L.; Yang, C.; Feng, D. Effect of dietary supplementation with protease on growth performance, nutrient digestibility, intestinal morphology, digestive enzymes and gene expression of weaned piglets. Anim. Nutr. 2015, 1, 276–282. [Google Scholar] [CrossRef]
- Buford, T.W.; Cooke, M.B.; Redd, L.L.; Hudson, G.M.; Shelmadine, B.D.; Willoughby, D.S. Protease supplementation improves muscle function after eccentric exercise. Med. Sci. Sports Exerc. 2009, 41, 1908–1914. [Google Scholar] [CrossRef] [Green Version]
- Miller, P.C.; Bailey, S.P.; Barnes, M.E.; Derr, S.J.; Hall, E.E. The effects of protease supplementation on skeletal muscle function and DOMS following downhill running. J. Sports Sci. 2004, 22, 365–372. [Google Scholar] [CrossRef]
- Chan, A.H.; D’Souza, R.F.; Beals, J.W.; Zeng, N.; Prodhan, U.; Fanning, A.C.; Poppitt, S.D.; Li, Z.; Burd, N.A.; Cameron-Smith, D.; et al. The Degree of Aminoacidemia after Dairy Protein Ingestion Does Not Modulate the Postexercise Anabolic Response in Young Men: A Randomized Controlled Trial. J. Nutr. 2019, 149, 1511–1522. [Google Scholar] [CrossRef]
- Townsend, J.R.; Stout, J.R.; Jajtner, A.R.; Church, D.D.; Beyer, K.S.; Oliveira, L.P.; La Monica, M.B.; Riffe, J.J.; Muddle, T.W.; Baker, K.M. Resistance exercise increases intramuscular NF-κb signaling in untrained males. Eur. J. Appl. Physiol. 2016, 116, 2103–2111. [Google Scholar] [CrossRef]
- Judelson, D.A.; Maresh, C.M.; Yamamoto, L.M.; Farrell, M.J.; Armstrong, L.E.; Kraemer, W.J.; Volek, J.S.; Spiering, B.A.; Casa, D.J.; Anderson, J.M. Effect of hydration state on resistance exercise-induced endocrine markers of anabolism, catabolism, and metabolism. J. Appl. Physiol. 2008, 105, 816–824. [Google Scholar] [CrossRef]
- Townsend, J.R.; Hoffman, J.R.; Fragala, M.S.; Oliveira, L.P.; Jajtner, A.R.; Fukuda, D.H.; Stout, J.R. A microbiopsy method for immunohistological and morphological analysis: A pilot study. Med. Sci. Sports Exerc. 2016, 48, 331–335. [Google Scholar] [CrossRef] [Green Version]
- Prinsen, H.C.; Schiebergen-Bronkhorst, B.; Roeleveld, M.; Jans, J.; de Sain-van der Velden, M.; Visser, G.; van Hasselt, P.; Verhoeven-Duif, N. Rapid quantification of underivatized amino acids in plasma by hydrophilic interaction liquid chromatography (HILIC) coupled with tandem mass-spectrometry. J. Inherit. Metab. Dis. 2016, 39, 651–660. [Google Scholar] [CrossRef] [PubMed] [Green Version]
- MacLean, B.; Tomazela, D.M.; Shulman, N.; Chambers, M.; Finney, G.L.; Frewen, B.; Kern, R.; Tabb, D.L.; Liebler, D.C.; MacCoss, M.J. Skyline: An open source document editor for creating and analyzing targeted proteomics experiments. Bioinform. Biol. Insights 2010, 26, 966–968. [Google Scholar] [CrossRef] [PubMed] [Green Version]
- Gu, H.; Liu, G.; Wang, J.; Aubry, A.-F.O.; Arnold, M.E. Selecting the correct weighting factors for linear and quadratic calibration curves with least-squares regression algorithm in bioanalytical LC-MS/MS assays and impacts of using incorrect weighting factors on curve stability, data quality, and assay performance. Anal. Chem. 2014, 86, 8959–8966. [Google Scholar] [PubMed]
- Viswanathan, C.; Bansal, S.; Booth, B.; DeStefano, A.J.; Rose, M.J.; Sailstad, J.; Shah, V.P.; Skelly, J.P.; Swann, P.G.; Weiner, R. Quantitative bioanalytical methods validation and implementation: Best practices for chromatographic and ligand binding assays. Pharm. Res. 2007, 24, 1962–1973. [Google Scholar] [CrossRef]
- McGlory, C.; Nunes, E.A.; Oikawa, S.Y.; Tsakiridis, E.; Phillips, S.M. Assessing the mechanistic target of rapamycin complex-1 pathway in response to resistance exercise and feeding in human skeletal muscle by multiplex assay. Appl. Physiol. Nutr. Metab. 2018, 43, 945–949. [Google Scholar] [CrossRef]
- Green, S.; Salkind, N.; Akey, T. Methods for controlling type I error across multiple hypothesis tests. Using SPSS for Windows: Anal. Underst. Data 2000, 26, 395–396. [Google Scholar]
- Moore, D.R.; Robinson, M.J.; Fry, J.L.; Tang, J.E.; Glover, E.I.; Wilkinson, S.B.; Prior, T.; Tarnopolsky, M.A.; Phillips, S.M. Ingested protein dose response of muscle and albumin protein synthesis after resistance exercise in young men. Am. J. Clin. Nutr. 2009, 89, 161–168. [Google Scholar] [CrossRef]
- Burd, N.A.; West, D.W.; Moore, D.R.; Atherton, P.J.; Staples, A.W.; Prior, T.; Tang, J.E.; Rennie, M.J.; Baker, S.K.; Phillips, S.M. Enhanced amino acid sensitivity of myofibrillar protein synthesis persists for up to 24 h after resistance exercise in young men. J. Nutr. 2011, 141, 568–573. [Google Scholar] [CrossRef] [Green Version]
- Trommelen, J.; Betz, M.W.; van Loon, L.J.C. The Muscle Protein Synthetic Response to Meal Ingestion Following Resistance-Type Exercise. Sports Med. 2019, 49, 185–197. [Google Scholar] [CrossRef] [Green Version]
- Moriarty, K.; Hegarty, J.; Fairclough, P.; Kelly, M.; Clark, M.; Dawson, A. Relative nutritional value of whole protein, hydrolysed protein and free amino acids in man. Gut 1985, 26, 694–699. [Google Scholar] [CrossRef] [Green Version]
- Nakayama, K.; Sanbongi, C.; Ikegami, S. Effects of whey protein hydrolysate ingestion on postprandial aminoacidemia compared with a free amino acid mixture in young men. Nutrients 2018, 10, 507. [Google Scholar] [CrossRef] [Green Version]
- Moberg, M.; Apro, W.; Ohlsson, I.; Ponten, M.; Villanueva, A.; Ekblom, B.; Blomstrand, E. Absence of leucine in an essential amino acid supplement reduces activation of mTORC1 signalling following resistance exercise in young females. Appl. Physiol. Nutr. Metab. 2014, 39, 183–194. [Google Scholar] [CrossRef] [Green Version]
- Apro, W.; Moberg, M.; Hamilton, D.L.; Ekblom, B.; Rooyackers, O.; Holmberg, H.C.; Blomstrand, E. Leucine does not affect mechanistic target of rapamycin complex 1 assembly but is required for maximal ribosomal protein s6 kinase 1 activity in human skeletal muscle following resistance exercise. FASEB J. 2015, 29, 4358–4373. [Google Scholar] [CrossRef]
- Gonzalez, A.M.; Hoffman, J.R.; Townsend, J.R.; Jajtner, A.R.; Boone, C.H.; Beyer, K.S.; Baker, K.M.; Wells, A.J.; Mangine, G.T.; Robinson, E.H.T.; et al. Intramuscular anabolic signaling and endocrine response following high volume and high intensity resistance exercise protocols in trained men. Physiol. Rep. 2015, 3, e12466. [Google Scholar] [CrossRef] [Green Version]
- Gonzalez, A.M.; Hoffman, J.R.; Jajtner, A.R.; Townsend, J.R.; Boone, C.H.; Beyer, K.S.; Baker, K.M.; Wells, A.J.; Church, D.D.; Mangine, G.T.; et al. Protein supplementation does not alter intramuscular anabolic signaling or endocrine response after resistance exercise in trained men. Nutr. Res. 2015, 35, 990–1000. [Google Scholar] [CrossRef]
- Tang, J.E.; Perco, J.G.; Moore, D.R.; Wilkinson, S.B.; Phillips, S.M. Resistance training alters the response of fed state mixed muscle protein synthesis in young men. Am. J. Physiol. Regul. Integr. Comp. Physiol. 2008, 294, R172–R178. [Google Scholar] [CrossRef] [Green Version]
- Coffey, V.G.; Zhong, Z.; Shield, A.; Canny, B.J.; Chibalin, A.V.; Zierath, J.R.; Hawley, J.A. Early signaling responses to divergent exercise stimuli in skeletal muscle from well-trained humans. FASEB J. 2006, 20, 190–192. [Google Scholar] [CrossRef] [Green Version]
- Moore, D.R.; Churchward-Venne, T.A.; Witard, O.; Breen, L.; Burd, N.A.; Tipton, K.D.; Phillips, S.M. Protein ingestion to stimulate myofibrillar protein synthesis requires greater relative protein intakes in healthy older versus younger men. J. Gerontol. A Biol. Sci. Med. Sci. 2015, 70, 57–62. [Google Scholar] [CrossRef] [Green Version]
- Phillips, S.M. The impact of protein quality on the promotion of resistance exercise-induced changes in muscle mass. Nutr. Metab. 2016, 13, 64. [Google Scholar] [CrossRef] [Green Version]
- Moore, D.; Atherton, P.; Rennie, M.; Tarnopolsky, M.; Phillips, S. Resistance exercise enhances mTOR and MAPK signalling in human muscle over that seen at rest after bolus protein ingestion. Acta Physiol. 2011, 201, 365–372. [Google Scholar] [CrossRef]
- Holm, L.; Van Hall, G.; Rose, A.J.; Miller, B.F.; Doessing, S.; Richter, E.A.; Kjaer, M. Contraction intensity and feeding affect collagen and myofibrillar protein synthesis rates differently in human skeletal muscle. Am. J. Physiol. Endocrinol. 2009, 298, E257–E269. [Google Scholar] [CrossRef] [Green Version]
- Beck, T.W.; Housh, T.J.; Johnson, G.O.; Schmidt, R.J. Effects of a protease supplement on eccentric exercise-induced markers of delayed-onset muscle soreness and muscle damage. J. Strength Cond. Res. 2007, 21, 661. [Google Scholar]
- Shing, C.M.; Chong, S.; Driller, M.W.; Fell, J.W. Acute protease supplementation effects on muscle damage and recovery across consecutive days of cycle racing. Eur. J. Sport Sci. 2016, 16, 206–212. [Google Scholar] [CrossRef]
- Li, Y.-P.; Chen, Y.; John, J.; Moylan, J.; Jin, B.; Mann, D.L.; Reid, M.B. TNF-α acts via p38 MAPK to stimulate expression of the ubiquitin ligase atrogin1/MAFbx in skeletal muscle. FASEB J. 2005, 19, 362–370. [Google Scholar] [CrossRef] [Green Version]
- Møller, A.B.; Vendelbo, M.H.; Rahbek, S.K.; Clasen, B.F.; Schjerling, P.; Vissing, K.; Jessen, N. Resistance exercise, but not endurance exercise, induces IKKβ phosphorylation in human skeletal muscle of training-accustomed individuals. Pflügers Arch. Eur. J. Physiol. 2013, 465, 1785–1795. [Google Scholar] [CrossRef]
- Hulmi, J.; Walker, S.; Ahtiainen, J.; Nyman, K.; Kraemer, W.; Häkkinen, K. Molecular signaling in muscle is affected by the specificity of resistance exercise protocol. Scand. J. Med. Sci. Sports 2012, 22, 240–248. [Google Scholar] [CrossRef]


| Variable | Values |
|---|---|
| n | 10 |
| Age (years) | 24.4 ± 4.1 |
| Height (m) | 1.79 ± 0.86 |
| Weight (kg) | 92.6 ± 10.4 |
| Non-bone fat-free mass (FFM) (kg) | 69.6 ± 6.8 |
| Body fat (%) | 20.9 ± 3.1 |
| Leg press 1RM (kg) | 424.5 ± 71.7 |
© 2020 by the authors. Licensee MDPI, Basel, Switzerland. This article is an open access article distributed under the terms and conditions of the Creative Commons Attribution (CC BY) license (http://creativecommons.org/licenses/by/4.0/).
Share and Cite
Townsend, J.R.; Morimune, J.E.; Jones, M.D.; Beuning, C.N.; Haase, A.A.; Boot, C.M.; Heffington, S.H.; Littlefield, L.A.; Henry, R.N.; Marshall, A.C.; et al. The Effect of ProHydrolase® on the Amino Acid and Intramuscular Anabolic Signaling Response to Resistance Exercise in Trained Males. Sports 2020, 8, 13. https://doi.org/10.3390/sports8020013
Townsend JR, Morimune JE, Jones MD, Beuning CN, Haase AA, Boot CM, Heffington SH, Littlefield LA, Henry RN, Marshall AC, et al. The Effect of ProHydrolase® on the Amino Acid and Intramuscular Anabolic Signaling Response to Resistance Exercise in Trained Males. Sports. 2020; 8(2):13. https://doi.org/10.3390/sports8020013
Chicago/Turabian StyleTownsend, Jeremy R., Jaclyn E. Morimune, Megan D. Jones, Cheryle N. Beuning, Allison A. Haase, Claudia M. Boot, Stephen H. Heffington, Laurel A. Littlefield, Ruth N. Henry, Autumn C. Marshall, and et al. 2020. "The Effect of ProHydrolase® on the Amino Acid and Intramuscular Anabolic Signaling Response to Resistance Exercise in Trained Males" Sports 8, no. 2: 13. https://doi.org/10.3390/sports8020013