The Remains of the Socialist Legacy: The Influence of Socialist Socialization on Attitudes toward Income Inequality


1
Institute of Sociology, Freie Universität Berlin, 14195 Berlin, Germany
2
Laboratory for Comparative Social Research, Higher School of Economics, 101000 Moscow, Russia
Societies 2018, 8(3), 62; https://doi.org/10.3390/soc8030062
Submission received: 15 June 2018
/
Revised: 20 July 2018
/
Accepted: 31 July 2018
/
Published: 2 August 2018
(This article belongs to the Special Issue Attitudes about Inequalities)
Abstract
:Despite convergence processes between Western and post-socialist societies in the past three decades, there are still considerable cross-country differences in individuals’ attitudes toward income inequality. To explain these differences, studies have primarily focused on the role of macro level differences and have only theoretically acknowledged how the role of diverging socialization experiences could also be responsible. To date, little is known about the importance of socialization for attitudes toward income inequality. This article assesses whether the differences between Western and post-socialist countries are influenced by socialization effects. Applying an adapted age-period-cohort analysis on the dataset of the International Social Survey Program’s (ISSP) “Social Inequality” module in survey years 1992, 1999, and 2009, the paper shows that socialization has a substantial effect on attitudes and a socialist socialization clearly differentiates individuals from post-socialist countries from Westerners. Results underline that experiences gained in formative years are crucial for attitudes. A further finding is that both perception and preferences toward income inequality are influenced by socialization.
1. Introduction
Since the Berlin Wall came down, European post-socialist1 countries have achieved political and economic integration with Western Europe. Among other events, the accession of post-socialist countries to the European Union marked an important milestone in this integration process. However, social sciences continue to report a social gap between Western European and post-socialist countries regarding value dispositions [1,2,3], attitudes cf. [4,5,6], and general well-being indicators cf. [7,8]. In light of these findings the question arises: will post-socialist countries ever see eye to eye with Western European countries in societal trends? That is, does the socialist legacy still play an active role in post-socialist societies?
Socialist legacy is especially relevant in the context of European integration. While some of the post-socialist countries (Estonia, Latvia, Lithuania, Slovakia, Slovenia) have fulfilled the fiscal requirements to gain entrance into the Eurozone, other post-socialist countries are still waiting for their entrance. This indicates that economic integration is slowly being realized. However, successful integration is relevant not only from an economic perspective, but also from a social one: for successful European social integration, member states should share the same underpinnings of liberal value and norms [9]. Furthermore, understanding the role of the socialist legacy can provide useful information for scholars looking into the consequences of inequalities and corruption in post-socialist countries [10,11].
The current paper sets out to investigate how the social distance between post-socialist countries and Western European societies is contingent on the remains of the socialist legacy with a special focus on attitudes toward income inequality. The paper is in line with previous discussions on the differences between post-socialist and Western countries cf. [10,12,13]. In general, there are two different lines of argument in the research field. The culturalist argument emphasizes that the socialist ideology’s lingering effect is largely responsible for the gap between the countries, but largely refers only to the institutionalist approach. In contrast, the structuralist argument applies modernization theory and stresses that structural variations are responsible for country differences and that the socialist legacy has no significant influence. Empirically, these studies compare the macro level (country) characteristics between post-socialist and Western societies cf. [14]. If structural differences are observed between the countries (e.g., economic performance of country, level of income inequality, level of unemployment rate), then it is an indication for the structuralist argument. However, if there is no effect of structural differences then one attributes the differences to unobserved cultural effects, i.e., the lingering socialist ideology. This is the so-called unexplained variance method applied to identify cultural effects. Overall, existing findings are inconclusive. Both the current social structure (partially an aftermath of the socialist state) and the socialist egalitarian ideology play a role in creating differences [14,15,16]. Furthermore, they have also not offered clear estimations whether a convergence will take place at all and whether the gap will ever cease to exist.
The current study aims to deepen our understanding of the reasons behind the gap between these societies by shifting the focus of previous research questions and by applying a different analytical approach. First, it focuses on the role of the socialist legacy and poses a research question directed at the mechanism behind socialist legacy, the socialist socialization. The paper investigates: to what degree are socialist legacy and socialist socialization responsible for the differences between post-socialist and Western societies? In contrast, previous research questions focused on convergence and enquired about the generic differences between societies. Even in the culturalist argument, the role of the socialist legacy (and socialization) is only implicitly present. Second, this paper will examine how socialist socialization of an individual influences attitudes toward income inequality. So far, researchers have rarely stepped away from country level analyses when examining attitudes toward income inequality for exception see: [17] and have not searched for signs of the socialist legacy within the social strata in form of socialization.
The main argument of the paper is that the prominence of a socialist legacy can be captured by looking at the effects of socialization. Here, socialization is defined as the experience that individuals acquire during their lifetime and are integrated into their cognitive structures [18]. Both social values and economic circumstances in socialist societies in Europe were vastly different than in capitalist societies, so too were the corresponding socialization processes [19]. This stark contrast is the key to the current study. In socialist regimes the ethos of equality dominated society. Closely related is that the level of income inequality was relatively low, and the wages strongly controlled by the state apparatus. In contrast, capitalist societies foster individualist values and a free market that is associated with higher levels of income inequality. The paper presumes that, in Western European societies, capitalism has largely prevailed since World War II, while the post-socialist societies of East Europe have experienced both types of regimes. Empirically, this paper uses the three waves of the “Social Inequality” module in the cross-sectional survey International Social Survey Project (ISSP) fielded between 1992 and 2009 to look at the effect of socialization.
Much of what the paper discusses is related to the field of empirical distributive justice research. The phrases “acceptance of income inequality” and “attitudes toward income inequality” refer to three interrelated concepts: justice evaluations, preferences, and perceptions.2 Perceptions are the subjective observations of individuals, preferences emphasize the circumstances individuals wish for or prefer to have, and justice evaluations are the discrepancy between preferences and perceptions for details see [21]. Evaluations “justice” evaluations by [22] are considered an outstanding measure for the legitimacy of economic inequality [16,23,24]. Preferences about income inequality give more insight on the value structures behind individuals dispositions [15], and perceptions reflect how well individuals have adapted to a given socio-economic status [25,26].
In the following sections, the paper presents theoretical arguments that support the notion that socialization and experience are relevant factors predicting attitudes toward income inequality. Next, a brief methodological overview will explain the age-period-cohort analysis and describe the data. A presentation and discussion of the empirical results will follow this methodological overview. In the final section, the paper draws some general conclusions about the effect of the socialist legacy on attitudes toward income inequality.
2. Explaining Post-Socialist and Western Differences
Scholars have long identified that individuals in (post-)socialist countries have notably different views on income inequality than their Western counterparts [15,27]. A series of follow-up studies have also underlined these unique views [12,13,23,28], testing whether structural or cultural differences between post-socialist and Western countries are responsible. The structural differences cover, among other things, a weaker post-socialist economy, steeper rise in social inequalities in post-socialist societies, while cultural differences are understood as the historical and cultural heritage of socialism (i.e., an egalitarian ideology, the controlled nature of the economy, and minimized inequalities). Again, the structuralist approach considers those structural differences the main reason behind the unique values of post-socialist countries, while the culturalist approach makes a case for the cultural differences to be the drivers. For a more detailed overview of the discussion see Janmaat’s paper [20].
Both approaches are grounded in strong theoretical foundations. Based on Durkheimian traditions and the claims of modernization theory, the structuralist approach emphasizes the importance of social and economic structures. The argument is the following: attitudes in post-socialist countries will start converging to attitudes in Western countries once the social and economic structure of these countries start resembling the structures in Western countries [29]. Thus, a convergence is also expected in attitudes as the time goes by, and such evidence is supported by findings from some scholars for example [28]. In contrast, building on Weberian traditions and institutionalist theory, culturalist theorists suggest that national culture and historic traditions determine attitudes [30]. Here, the leading argument is that the ideological background of socialism is still an integral part of the culture in post-socialist countries, and so the attitudes in post-socialist countries are different for this reason [12]. The two approaches address the question of change (and its speed) differently. In the structuralist approach, the dynamics of changes in the societal structure are a key part of the theory. Such an approach emphasizes that if there is a certain change in the economic structure, then attitudes will reflect this change. This assumes relatively quick changes. In contrast, the culturalist approach assumes only slow social changes by stating that commonly shared values change very slowly, over generations. Thus, little to no change in attitudes would suggest that the culture of society shapes attitudes to a larger extent.
Overall, the evidence remains inconclusive whether the cultural or structural (or both) are influential for attitudes toward income inequality. In general, many scholars find evidence that cultural factors have an important role in influencing justice attitudes. Hadler [12] concludes that dominant ideologies have a stronger influence on attitudes than structural features. Gijsberts [13] comes to a similar conclusion. She emphasizes the differences in social structure and concludes that “ideological differences between state-socialist and market societies may well have induced differences in the socialization of values” [13]. On the other hand, others find strong indication of structural effects being influential. For example, Kluegel and colleagues [16] point out that there are significant differences within post-socialist countries due to national differences in economic growth. Others [14,31] also make similar conclusions when comparing East and West Germany.
There are numerous reasons for why previous research found inconclusive results. First, cultural and structural processes are hard to separate from each other as these processes can be codependent on each other. In particular, modernization theory [32] stresses that each stage of structural development is also a stepping stone for cultural development and vice versa. Second, change plays an important role in both approaches and compels researchers to capture it empirically as a temporal factor. However, this aspect has not been incorporated into research designs forcefully and consistently enough. They have only been examined ad hoc in studies where the largest change in time is not more than 10 years.3 Third, operationalization issues may also be behind the inconclusive findings. Structuralists use well developed and testable indicators. In contrast, more restricted tools are available for culturalists. Culture in itself is challenging to define and analyze. Wegener [33] points out that as much as culture matters for justice research, the definition of culture is not obvious. It is hard to determine where the borders of the concept are, and so scholars resort to indirect strategies to measure the effect of culture. For example, the unexplained variance from a model with structural indicators as predictors suggests unobservable cultural influence [34]. In addition, finally, studies primarily have merely focused on the macro level perspective of cultural explanations, attempting to identify reasons for individual level attitudes solely with macrosociological phenomena.
Given the difficulty of capturing cultural and structural effects on the macro level, the current paper offers a different approach to explain the difference the post-socialist and Western divide. It shifts its focus to the mechanisms of socialization and investigates to what degree the socialist-past is responsible. The assumption is that experience (or lack thereof) with socialist economy influences people’s opinion of income inequality. This influence can be operationalized by considering two different phenomena. Structurally, most socialist regimes kept income inequality to a relatively low level by suppressing the salaries on the managerial level and kept blue collar wages artificially high [35]. However, culturally, the regimes typically communicated egalitarian ideology [30]. If socialization is a key factor for attitudes, it underlines how the structuralist approach cannot be the sole argument for the differences between post-socialist countries and Western societies. Additionally, our expectation regarding convergence between these societies need to be then also adjusted and the far-reaching effect of socialist socialization needs to be considered.
In other words, the current paper aims to understand whether and to what extent the legacy of socialism still lingers in post-socialist societies. The paper uses the experience of individuals in socialist systems to help determine the differences between post-socialist and Western countries regarding what people think about income inequality. By focusing on socialization, I explore whether growing up in a socialist environment makes individuals in post-socialist and capitalistic countries significantly differ from one another. Surprisingly, none of the previously referenced studies have looked at the effect of socialization directly, therefore the contribution of this paper is valuable.
3. Socialization as a Relevant Factor
Since Ryder’s work [36], we have known that the social setting in which individuals grow up shapes their values and attitudes. Socialization, which can be defined as the act of learning about the social environment, is a key factor in understanding individuals’ beliefs. Several authors within empirical distributive justice research, the research field specifically focusing on attitudes toward income inequality, have touched upon this process of socialization. Homans [37] emphasizes the core mechanism of socialization when explaining justice sentiments. He describes how experience is the basis for individuals to judge the distribution of rewards. Adams [38] also reports how experience and socialization can affect expectations regarding the distributive process. Socialization can be further connected with two prominent theories of empirical justice research: belief in a just world and system justification theory. Belief in a just world theory states that after developing a notion of a just world, all perceptions are adjusted to fit the developed notion [39,40]. Therefore, individuals rely on the notion that the world in which they live is ultimately just, to cope with and to organize the world around them. This often means that experiences which contradict this doctrine of ultimate justice do not sway individuals in their views. Rather, individuals internalize these experiences in a way that conforms to their just world notion. System justification theory also addresses the question of how individuals justify and accept the world around them. Individuals typically support the status quo of a system, even if they are disadvantaged by it, and this notion is deeply rooted and difficult to alter [41].
Studies focusing on how children develop justice beliefs provide further clues about the relevance of socialization. Building on the findings of Piaget [42] and Kohlberg [43], Lerner [44] concludes that small children already have some kind of conception of what is fair and what is not cf. [45]. Individuals also then adapt this concept of justice to their adulthood. Other findings in system justification theory indicate that once children have learned what the status quo is, they will endorse it thenceforth [46].
In practice, little research has investigated the role of socialization—in this case socialist socialization—for attitudes toward inequality. For example, Saar [47] counters the so-called de-ideologization tendency discussed by Verwiebe and Wegener [23], and suggests that cohort membership can be responsible for a shift in attitudes. Such cohort differences were also observed by Alesina and Fuchs-Schündeln [48] in Germany, while a recent study has only found weak generational effects on the perception of wage fairness in East German territories, the Czech Republic, and Hungary [17]. The relevance of socialist socialization is discussed in related fields. Similarly to the majority of sociologist, political scientists in recent years have emphasized how socialization affects political attitudes in a study encompassing a larger set of countries [49].
The above-mentioned theories heavily rely on the mechanism of learning and gaining experience, thus this paper equates the mechanism of experiencing socialism conceptually with socialist socialization. Additionally, the duration of socialization can be either bounded (i.e., the effectiveness of experiencing is weak after a certain point in time), or infinite (i.e., experience is continuously relevant).
If socialization is seen as a bounded process, this mean it ends after the formative years. Thus, the most crucial influence for attitudes is what individuals experienced during these early years. Abramson and Inglehart [50], for example, argue that socialization has little effect after the formative years and subsequent experiences have little or no effect on attitudes. Therefore, socialism may only have an effect on individuals if they experienced it in their formative years, because one’s personality structure crystallizes by the time one reaches adulthood [51]. This would suggest those individuals, who did not grow up in socialism would be less affected by the socialist regime than those who had their formative years under socialism. Bringing together this argument with the assumption that the pre-1989 environment in post-socialist countries is vastly different than Western societies, we can expect that:
Hypothesis 1.
Individuals in post-socialist countries who were exposed to a socialist regime in their formative years will differ from their Western counterparts regarding attitudes toward income inequality more than those individuals in post-socialist countries who were not exposed to a socialist regime in their formative years.
In contrast, the notion of lifelong learning suggests infinite duration of socialization and that individuals keep learning throughout their lives. Therefore, socialization cannot be restricted solely to formative years. This is demonstrated among others by Mishler and Rose [52] who stress a lifelong learning model, wherein experiences and learning later in life shape attitudes as well. Experience with the free market for those born before the 1989 transition can therefore be considered an additional factor (next to the socialist experience during the formative years) which can influence attitudes of individuals. Thus, once again assuming that the pre-1989 circumstances in post-socialist societies diverge from those in Western societies, we can expect:
Hypothesis 2.
The longer individuals in post-socialist countries were exposed to a socialist regime the more they will differ from their Western counterparts regarding attitudes toward income inequality.
Lastly, it is plausible to consider the interplay of socialist experience gained in the formative years and the total experience throughout the lifetime. If formative years have primacy over all the experience one collects during their lifetime, then we can expect that individuals with a socialist socialization all through their socialist upbringing will have a similar distance from Westerners irrespective of how much other (i.e., post-socialist) experiences they have collected since the transition. In contrast, if the primacy of lifelong learning holds true, then individuals with similar exposure rates will have similar distance to Westerners irrespective of the nature of their formative years. There is a growing number of studies in various research fields emphasizing the importance of childhood experience [53,54] and their effect on values, attitudes, and behavior. In a most recent paper, Mijs [55] points out how beliefs formed in adolescence and in the first years of being a young adult tend to be durable. Accordingly, a third hypothesis is formulated, which relates to the formative years primacy thesis.
Hypothesis 3.
Individuals from post-socialist countries who were exposed to a socialist regime in their formative years combined with the most exposure rate in their lifetime will differ the most from their Western counterparts regarding attitudes toward income inequality.
The hypotheses do not touch on the issue of how different governing eras existed within socialist societies, where the intensity of the socialist regime varied over time in strength in these countries. Because of these eras, the political atmosphere and economic development of these countries varied over time. However, the cultural logic of these societies remained relatively the same during the approximately 40 years of their existence. Furthermore, there is also some empirical indication that socialist cohorts constitute a unified group in regard to their attitudes toward income inequality [17]. Thus, the paper does not differentiate between different eras and identifies only the general fact of experiencing a socialist regime.
It is worth considering how the aforementioned hypotheses operate for the different theoretical concepts dealt with in the paper. In the case of justice evaluations, several authors [14,31,56] show that people in post-socialist countries consider income inequality more unfair than Westerners, which was primarily explained by the fact that respondents in post-socialist countries have not yet gotten used to their reality of larger income inequality. This means that individuals who did not spend their formative years in socialism will be more likely have similar view to Westerners, as will individuals with the lower exposure rate.
Additionally, preferences have received attention in past studies. Directly after the post-socialist transition, Kelley and Evans [15] discussed how the level of preferences in post-socialist countries lags behind their Western counterparts, a tendency that seemed to have changed by the beginning of the 21st century. Namely, Kelley and Zagorski [28] argue that this is because individuals tend to adapt their preferences to what they perceive and higher preferred levels of inequality are a natural part of convergence. Within the structuralist approach, this means that individuals in post-socialist countries generally prefer larger inequality than Westerners. However, socialization theory offers an alternative explanation. Namely, that there is a cohort replacement taking place and individuals who were socialized under socialism (and therefore socialized to prefer lower inequality) are simply an increasingly smaller portion of the population. Thus, if we expect socialization to play a role, we can expect individuals who spent their formative years in socialism to prefer less inequality than their Western counterparts and those without socialist formative years to prefer higher inequality. Secondly, the more experience individuals have with socialism, the more likely they will have preferences to lower inequality than Westerners.4
Finally, the relevance of socialist socialization for perceptions is especially intriguing. The structuralist approach and reflection thesis [12] stress that the perception of income inequality is largely reflected in so-called objective income inequality. However, some findings contradict the reflection thesis and suggest that socio-economic factors do in fact play a role in perceptions [25], and one’s position on the social ladder does indeed influence perceptions. From these findings and the fact that Western and post-socialist societies have vastly different macrostructural circumstances follow two considerations for perceptions. First, the distance of post-socialist individuals to Westerners will mirror this objective income inequality. We can expect that post-socialists in general will exhibit higher perceived levels of inequality than their Westerner counterparts. Second, post-socialist individuals with different socialization backgrounds might differ in their perceptions of income inequality. This second argument reflects how generations and cohorts can be seen as a unique position in the social structure [57], because of the transition and the various opportunities members of the different cohorts had after the transition see for example [58].
This latter observation makes room for socialization to be a relevant explanatory mechanism for perceptions. Namely, socialization equips individuals with different lenses to perceive the world, so we can expect individuals with different levels of socialist socialization to differ in how different their perception of income inequality is from Westerners. Either a subdued or volatile reaction can be expected to exert itself on perceptions. A subdued reaction would mean that individuals underestimate the level of inequality because their pre-1989 conceptions of income inequality persist even after the increase, as there is a lag effect present. Hence, individuals with a socialist formative socialization and with more exposure to socialism will be less likely to perceive higher inequality than Westerners. However, in the case of perception, I suggest that underestimation of income inequality is less likely. Instead, the shock of the rising social inequalities produced a more volatile reaction and an overestimated perception of the level of income inequality. This would mean that individuals having experienced low levels of inequality for an extensive time and have learned to expect low inequality. This experience will lead them to find the increase in income inequality to be dramatic and will have the tendency to exaggerate its degree. Lastly, individuals who spent their formative years in socialism will perceive larger levels of inequality than Westerners compared to those who have no formative socialist socialization. Conversely, individuals with more exposure to socialism perceive higher inequality than Westerners.
4. Data and Analysis
4.1. Data
To conduct the analysis necessary to test the previously formulated hypotheses, the dataset needed to meet the following three criteria: the database (1) should include post-socialist and capitalist countries to measure the distance between the two types of societies; (2) should have sufficient enough indicators that help assess attitudes toward income inequality; (3) have comparable survey designs over a larger number of years, so socialization could be thoroughly analyzed. Only one dataset matched these criteria: the “Social Inequality” module of the International Social Survey Project [59].5
Still, the ISSP has some limitations. On the one hand, the participation of countries has not been continuous over time, so only a limited set of countries participated in at least three waves6 in the “Social Inequality” modules. Therefore, the selection of countries was driven by data availability. Additionally, while data from survey year 1987 was available, I excluded this wave. In 1987 respondents from (post-)socialist countries were still living in a distinctly different economic environment from Western countries and we only know retrospectively that this would soon change. A comparison of the two regimes would be misleading, especially considering that the research interest of the paper is to understand whether post-socialists will accept new, capitalist circumstances —not about how well they accepted socialist circumstances. On top of this, I excluded all individuals, who were before socialism was introduced in their countries. These individuals were socialized prior to socialism, or were subjected to a heterogeneous socialization where socialism did not play the only role. After listwise deletion my dataset contains 15,620 cases. Table A1 gives a detailed overview of the number of cases available for each county by each wave.
4.2. Dependent Variables
As already discussed, the paper is interested in three concepts (justice evaluation, preference, perception), which are quantified as three dependent variables. All dependent variables are constructed based on the battery of items in the ISSP, which focus on the perceptions and preferences of respondents toward various occupations (V22 to V31). This operationalization heavily builds on the work by Andersen and Yaish [61] and is therefore comparable (see Appendix A for technical operationalization). In short, the preferred Gini captures the level of income inequality respondents prefer by their answers to the set of questions about how much a person with a certain occupation should earn, higher values meaning a preference for higher inequality. The perceived Gini captures the level of income inequality respondents perceived by their answers to the set of questions about how much a person with a certain occupation actually earns, higher values meaning a perception of higher inequality. In addition, the justice evaluation of the Gini captures the discrepancy between the latter two measures in a so-called Jasso-index [22]. A value of 0 signifies there is no discrepancy, and the higher the value the more inequality is perceived than what is preferred, while a negative value shows that higher inequality are preferred than perceived. Empirically, however, the values of the Jasso-index are overwhelmingly positive.
4.3. Independent Variables
Post-socialist country dummy. Respondents from Western countries are coded 0, while respondents from a post-socialist country are coded 1. The effect of this dummy variable is in the center of the analysis since it shows the distance between the two types of societies and indicates the level of convergence.
Socialization was measured by three separate indicators, which correspond with the two sets of hypotheses: (1) whether individuals with and without socialist socialization in their formative years differ from Westerners, (2) whether the rate of exposure contributes to individuals being different from Westerners, (3) whether formative years and exposure rate combined contribute to respondents from post-socialist countries being different to Westerners. This last indicator pinpoints the effect of formative years and lifelong learning model more clearly.
- Exposure during formative years. The first socialization variable (form) expresses whether respondents spent their formative years (up to age 16) in the socialist era. Those who did were coded with 1, everyone else with 0.
- Exposure rate. The second socialization variable operationalizes “exposure rate to socialism” and quantifies the years a person has spent in the socialist era and is standardized by the age of the individual (Equation (1)). In Equation (1), startsoc and endsoc are the dates when the socialist era started and ended in respective country and are constants in the equation. This exposure rate is then broken down into 5 categories (No exposure, exposure between 1% and 25% of life, exposure between 26% and 50% of life, exposure between 51–75% of life, exposure between 76% and 100% of life).
- Exposure during formative years integrated with exposure rate. The final socialization indicator is the combination of the two previous indicators. This operationalization enables us to pinpoint the effect of formative years and lifelong learning model. Table A3 gives an overview of the combinations and the number of cases.
4.4. Additional Control Variables
To conduct an age-period-cohort (APC) analysis, age and survey years must be included in the analyses simultaneously, so the age effects and the period effects are controlled for.
Age. Age at time of the survey. This is measured as continuous variable.
Survey year. The given wave of the ISSP Module. This is measured as a dummy variable, where each survey wave has a dummy variable. The year 1992 is the reference category.
Control variables measuring socio-economic status (level of education, employment status, and decile of personal income7) are included since in previous studies it was proven to have an effect on justice attitudes [10,12], as well as the gender of the respondent. Moreover, GDP [62] and disposable Gini [63] were included in separate models to control for structural effects as robustness checks (See also Section 5.3). Table 1 gives an overview of control variables in the main models.8
4.5. Research Design and Analysis
The aim of the paper is to understand whether one’s socialization affects how similar or different his/her attitude is to the attitudes of Westerners. To test this connection empirically the dummy for post-socialist countries needs to interact with an indicator capturing socialization. However, as all Westerners will have a constant value (0) for any socialization indicators, traditional models of interaction effects cf. [64] are unfit for the analyses. Instead of exploring the magnitude of the interaction effect, respondents from Western countries are compared to individuals from post-socialist countries broken down into subpopulations based on their level of socialization. All models in this paper are linear regressions,9 which are carried out with all individuals from all countries, pooled for all survey years. In each comparison the unstandardized coefficients for the dummy for post-socialist countries in the OLS regression is compared while controlling all relevant socio-demographic factors (see description of control variables). Bootstrapping10 is applied for all models presented in the analyses to ensure robust standard errors and therefore reliability. The data handling was conducted in SPSS [66]. All analyses and graph production was performed with R version 3.5.0 [67].
Age-Period-Cohort Analysis
One of the methodological challenges of the current paper is to ensure that the effect of socialization is separated from period and age effects. The previously described analysis is a modified version of APC analysis11 cf. [68], because the “exposure to socialism” can be considered a linear combination of a birth cohort (Equation (2)):
where startsoc and endsoc are the dates when the socialist era started and ended in respective country and are constants in the equation. By including several survey years and then controlling for these years period effects are controlled for, and age effects are controlled by having age as one of the control variables in the model. Usually, APC regression models struggle with issues of non-identification, as the three mentioned effects are the linear combination of one another, and as continuous variables cannot be inserted in the analysis all at once because of this. However, the delineation of the cohort (by breaking down thee socialization indicator into groups), and the delineation of thee period (by having dummy variables) resolves these issues. Additionally, as the research design breaks down the respondents by their socialization (i.e., the cohort effects), the issues related to stochastic multicollinearity is also remedied.
5. Results
5.1. Justice Evaluation of Income Inequality
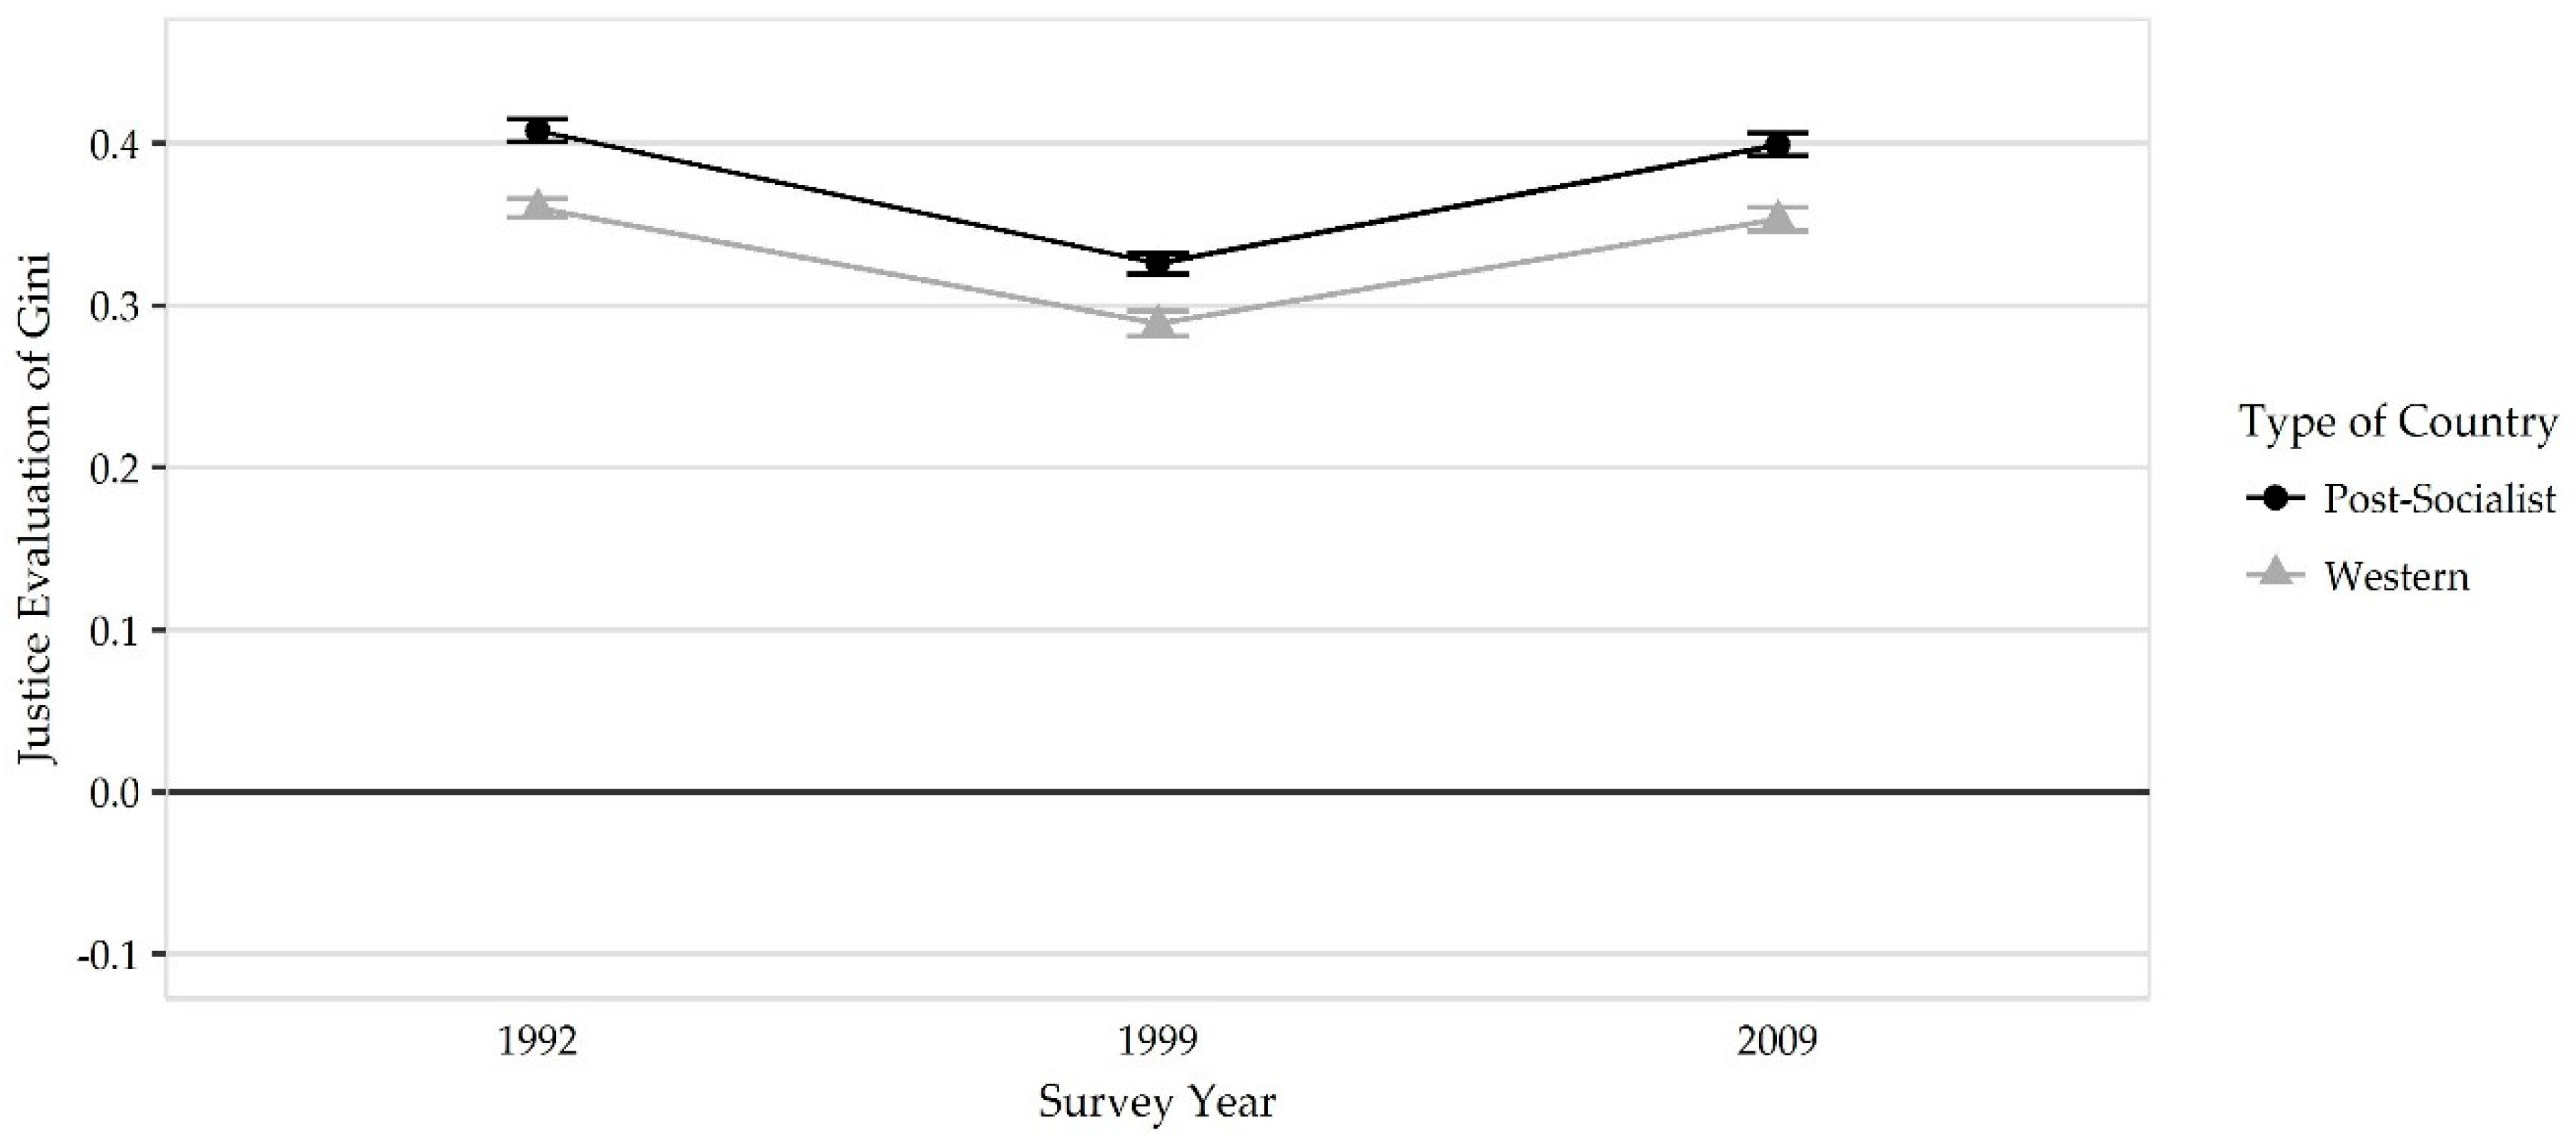
Figure 1 shows the first descriptive results: differences between post-socialist and Western countries regarding justice evaluations. The values are well above 0. This means that both types of societies evaluate inequality too high in their countries. Additionally, the justice evaluations in the two types of societies move relatively parallel throughout the years. However, individuals in post-socialist countries consider income inequality to be more unfair than Western respondents in general. On the other hand, there is a slight convergence in the justice evaluations. After the turn of the 21st century Western and post-socialist countries became more similar in their justice evaluations by 2009. Additionally, both types of societies experienced a sharp decline in the level of unfairness in the 1990s, whereas there is again an increase by 2009, but not to the level of 1992. In both the case of Westerners and post-socialist countries the average level of justice evaluations decreased step-by-step over the years. All the described differences between post-socialist Europe and Western Europe and between the years are significant.
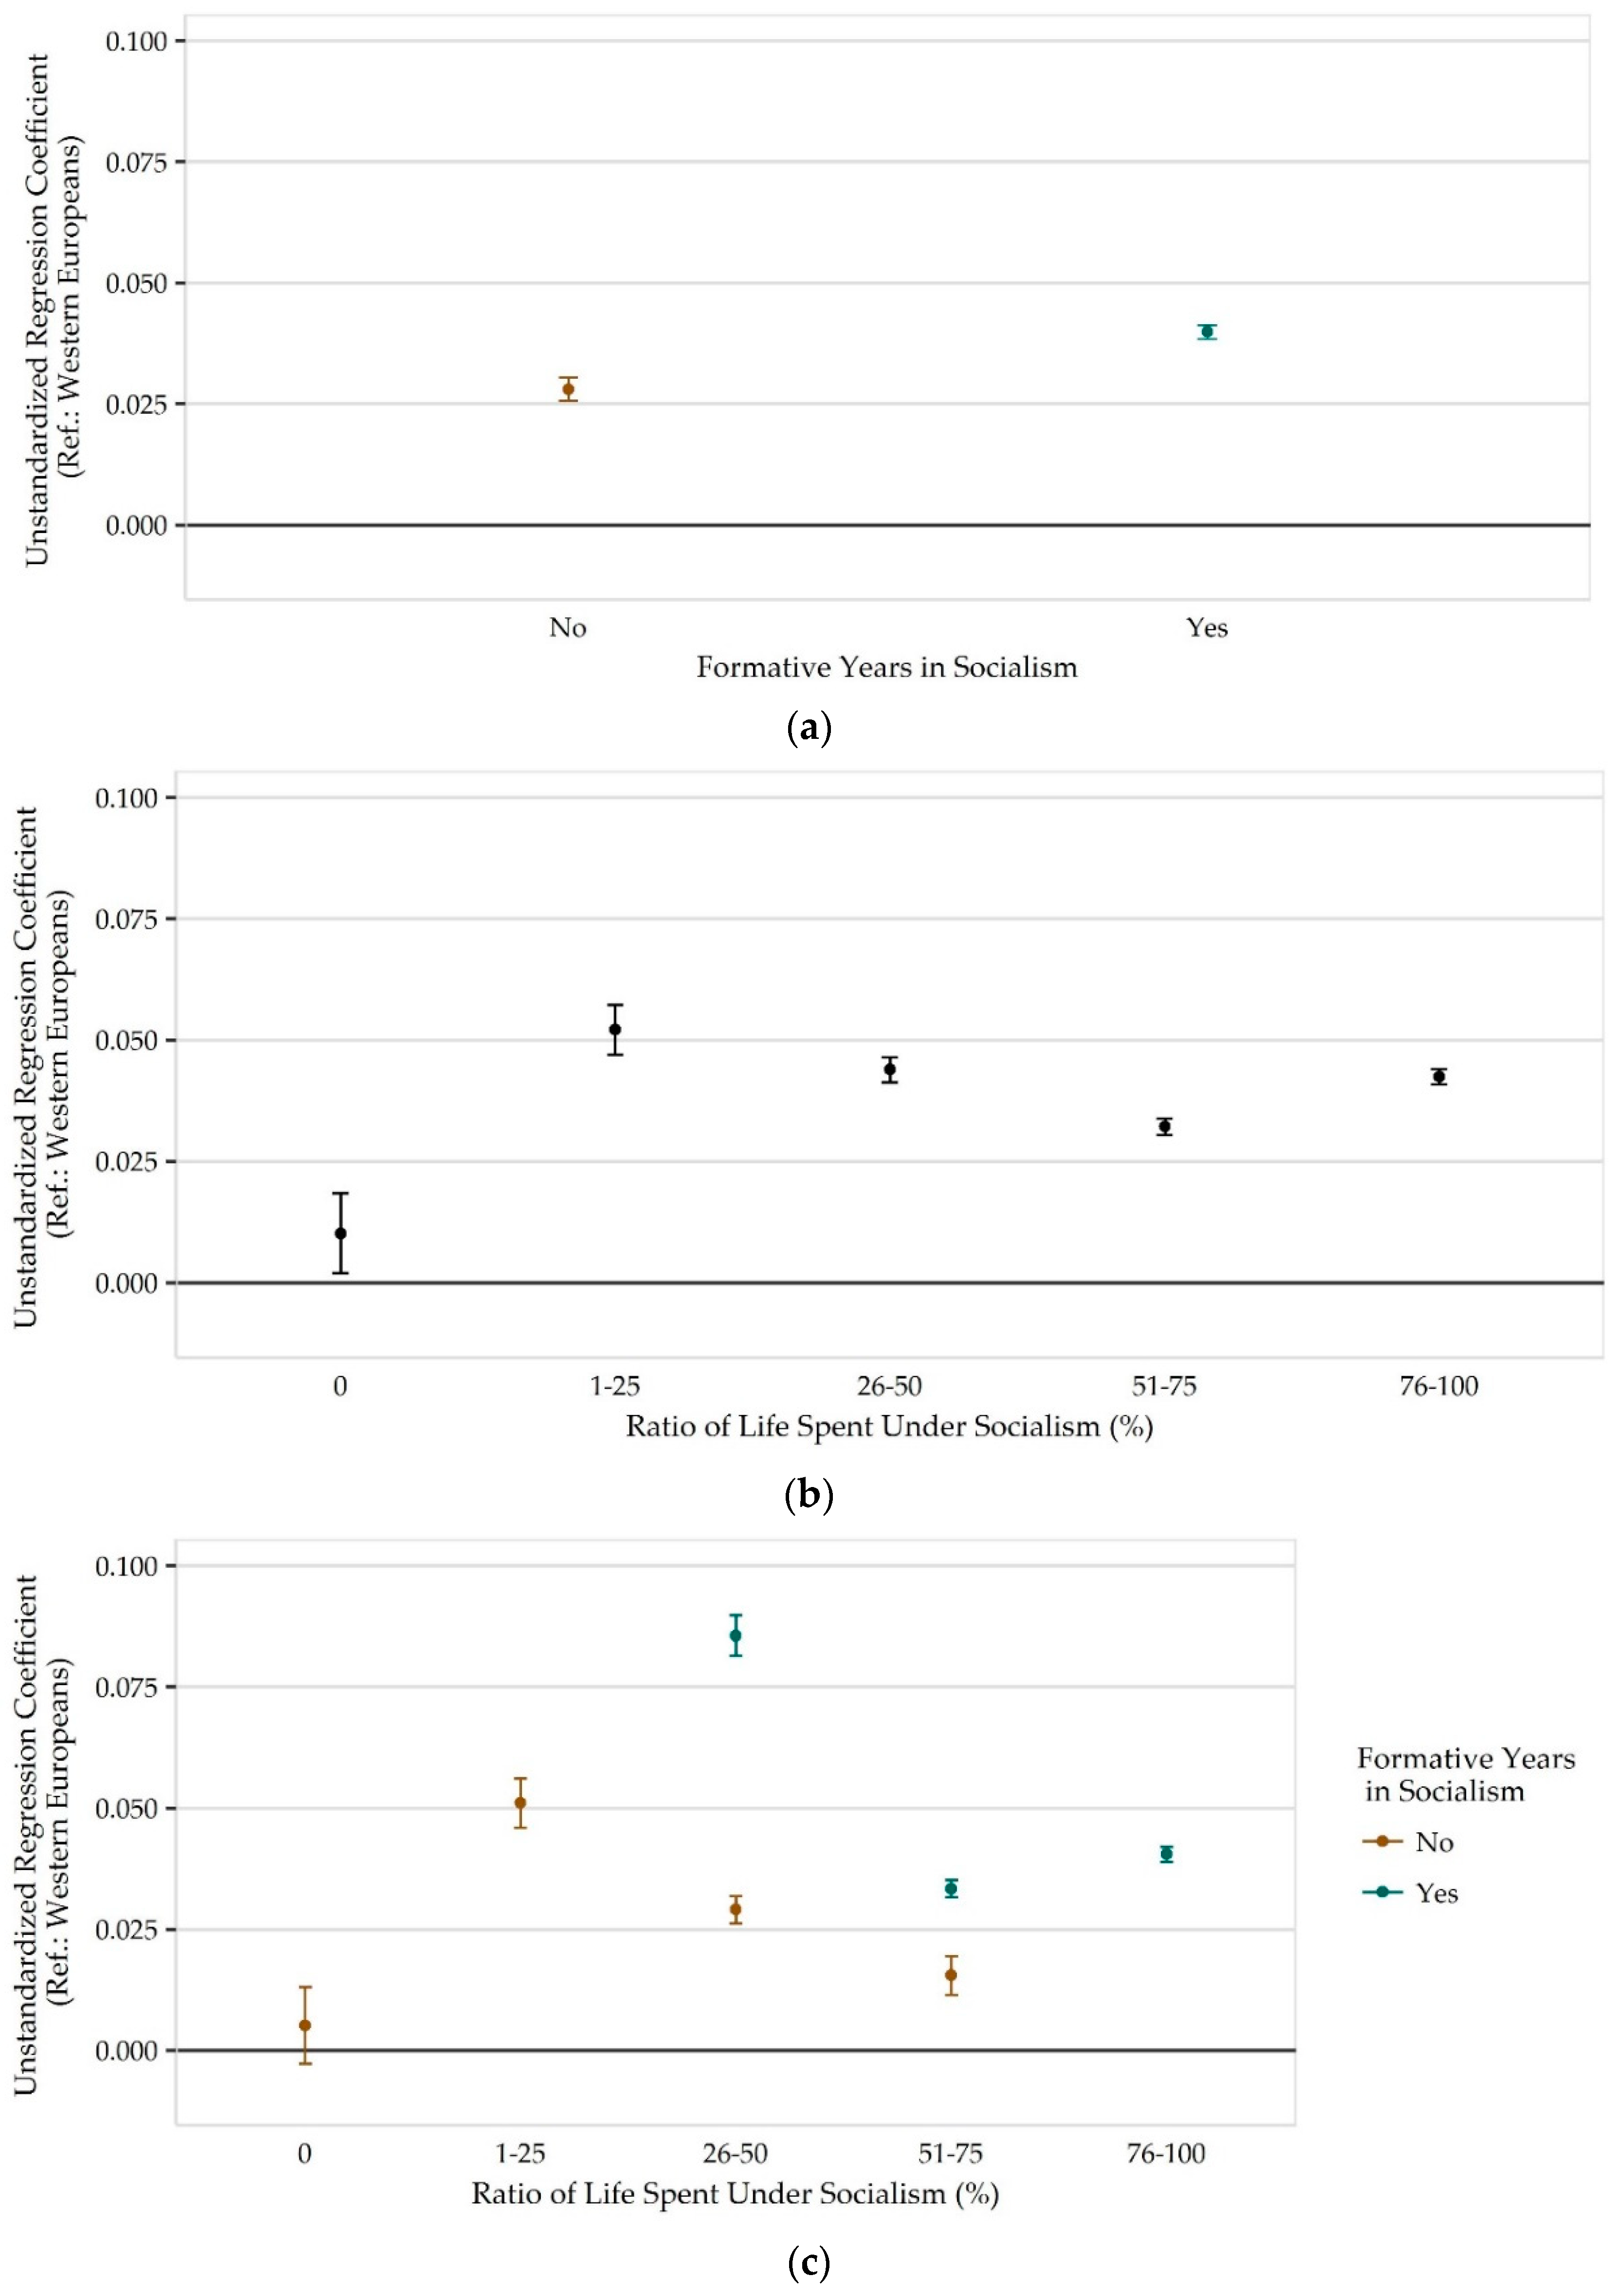
To understand to what extent socialization has an effect, I investigate how post-socialist subpopulations differentiated based on socialization diverge from their Western counterparts. That is, I look at how the post-socialist country predictor varies when post-socialist subgroups divided by socialization are compared to Westerners. All results presented are from bootstrapped OLS regressions. Figure 2 depicts three graphs with the same structure. They depict the marginal effects of the independent variable, which captures the distance post-socialist and Western respondents. The graphs depict the value of the unstandardized regression coefficient from bootstrapped OLS regressions (with 95% confidence interval) for the post-socialist country dummy when respective post-socialist subpopulation is compared to Westerners. If the coefficient for a subpopulation is not significantly different from 0 then the given group is not significantly different from Westerners. The first three graphs depict the three socialization indicators. As a reminder: the last indicator facilitates a better understanding of how the effect of formative years and the effect of socialist exposure interact.
In Figure 2, the first graph shows how splitting the sample based on formative years has a significant effect. Those who have not spent their formative years in a socialist economic system see inequality as significantly fairer (b = 0.028, p < 0.001) than those who have (b = 0.040, p < 0.001). More importantly, the graphs show that those lacking socialist formative years are closer in their views to Westerners than those respondents who spent their formative years in socialism. This result supports the first hypothesis about the relevance of the formative years. The second graph in Figure 2 shows a clear division in attitudes based on the extent of the socialist experience. Here the graph shows a very clear trend: those who have no experience with socialization are not only significantly different from all other post-socialists, but they only marginally reject inequality in their country more as Westerners in their respective countries (b = 0.010, p = 0.0141). In all other groups where respondents had exposure to socialism, respondents significantly consider income inequality to be more unfair than Westerners, whereas the tendency is primary negative linear: the more exposure means less distance from Westerners, except in cases where over 76% of one’s life was spent in socialism. Respondents who spent 25% or less of their life in socialism view income inequality more unfair than Westerners and have the most negative views on inequality compared to all other subgroups (b = 0.052, p < 0.001). The negative linear trend continues for respondents who spent about 26% to 50% of their lives under socialism, as they have more positive views on inequality than the previous group and are considerably closer to Western views (b = 0.044, p < 0.001). Respondents who spent 51% to 75% of their lives in a socialist regime are significantly different from all post-socialist respondents and they reject income inequality to an even lower degree, and therefore are the second closest group in their view from Westerners (b = 0.032, p < 0.001). Finally, respondents who spent more than 75% of their lives in a socialist regime break this linear trend are still significantly different from Westerners, and reject prevailing income inequality to a relatively high degree (b = 0.042, p < 0.001).
While these trends are counterintuitive, the last graph gives a better understanding of how the two socialization indicators jointly effect attitudes toward income inequality. First, the negative linear trend observed in the previous graph is more pronounced now for respondents who have not spent their formative years in socialism. Similar to the second graph, there is a break between respondents with no experience with socialism than all other post-socialist groups with not formative years in socialism because this first group is not significantly different from Westerners in their justice evaluations (b = 0.005, p = 0.204). All other groups follow the previously described negative linear trend, whereas the slope itself is more pronounced. In contrast, a U-shaped trend has developed for respondents who have spent all their formative years in socialism along the exposure rate. The values for these respondents are notably further away from Western views, even respondents who spent their formative years in socialism, but were exposed to about 51% to 75% of their lives and have the lowest justice evaluations are significantly different from Westerners (b = 0.034, p < 0.001). Overall, the findings indicate (rather for individuals with not all formative years spent in socialism): the more exposure someone has to a socialist regime in their life, the less likely they will be significantly different (i.e., they will reject inequality to a stronger degree) from Westerners. When comparing attitudes between individuals with and without formative years in socialism within a certain exposure rate, there is differentiation between them in both categories and the direction of the effect is clear. For both respondents who lived 26% to 50% and for respondents who lived 51% to 75% of their lives in socialist regime the effect of formative years is positive and reflects the effects observed in the first graph of Figure 2. Thus, individuals with no formative years in a socialist regime and have had no exposure will be more accepting of income inequality and no different from Westerners.
Overall, based on the presented evidence: socialization has a clear role in shaping attitudes toward the income inequality if other individual and country level effects are controlled for. Both the role of formative years and exposure rate is relevant, but we also see a clear interplay of the two effects. The role of formative years can be easily interpreted as follows: having lived all formative years under socialism makes individuals reject inequality to a larger degree. The effects of exposure rate, however exhibit more complex trends. In fact, formative years play a substantial role in how exposure rate effects justice evaluations. The exposure rate has a negative linear effect only when there is a lack of formative years present for individuals, while for individuals with a strong foundation of formative years in socialism, the effect is mixed.
5.2. Preferred and Perceived Income Inequality
In the following, I look at whether preferences and perceptions toward inequality reflect the trends for justice evaluations. Are preferences determined already by formative socialization? Has socialization bestowed individuals with different glasses, which also influence how individuals perceive social reality? To delve a bit deeper, I investigate these questions in the same manner as I did justice evaluations. First, trends in Western and post-socialist countries are compared. In addition, then, the effects of socialization (measured by formative years and exposure rate) are analyzed by regression analysis. Preferences and perceptions are discussed one after the other.
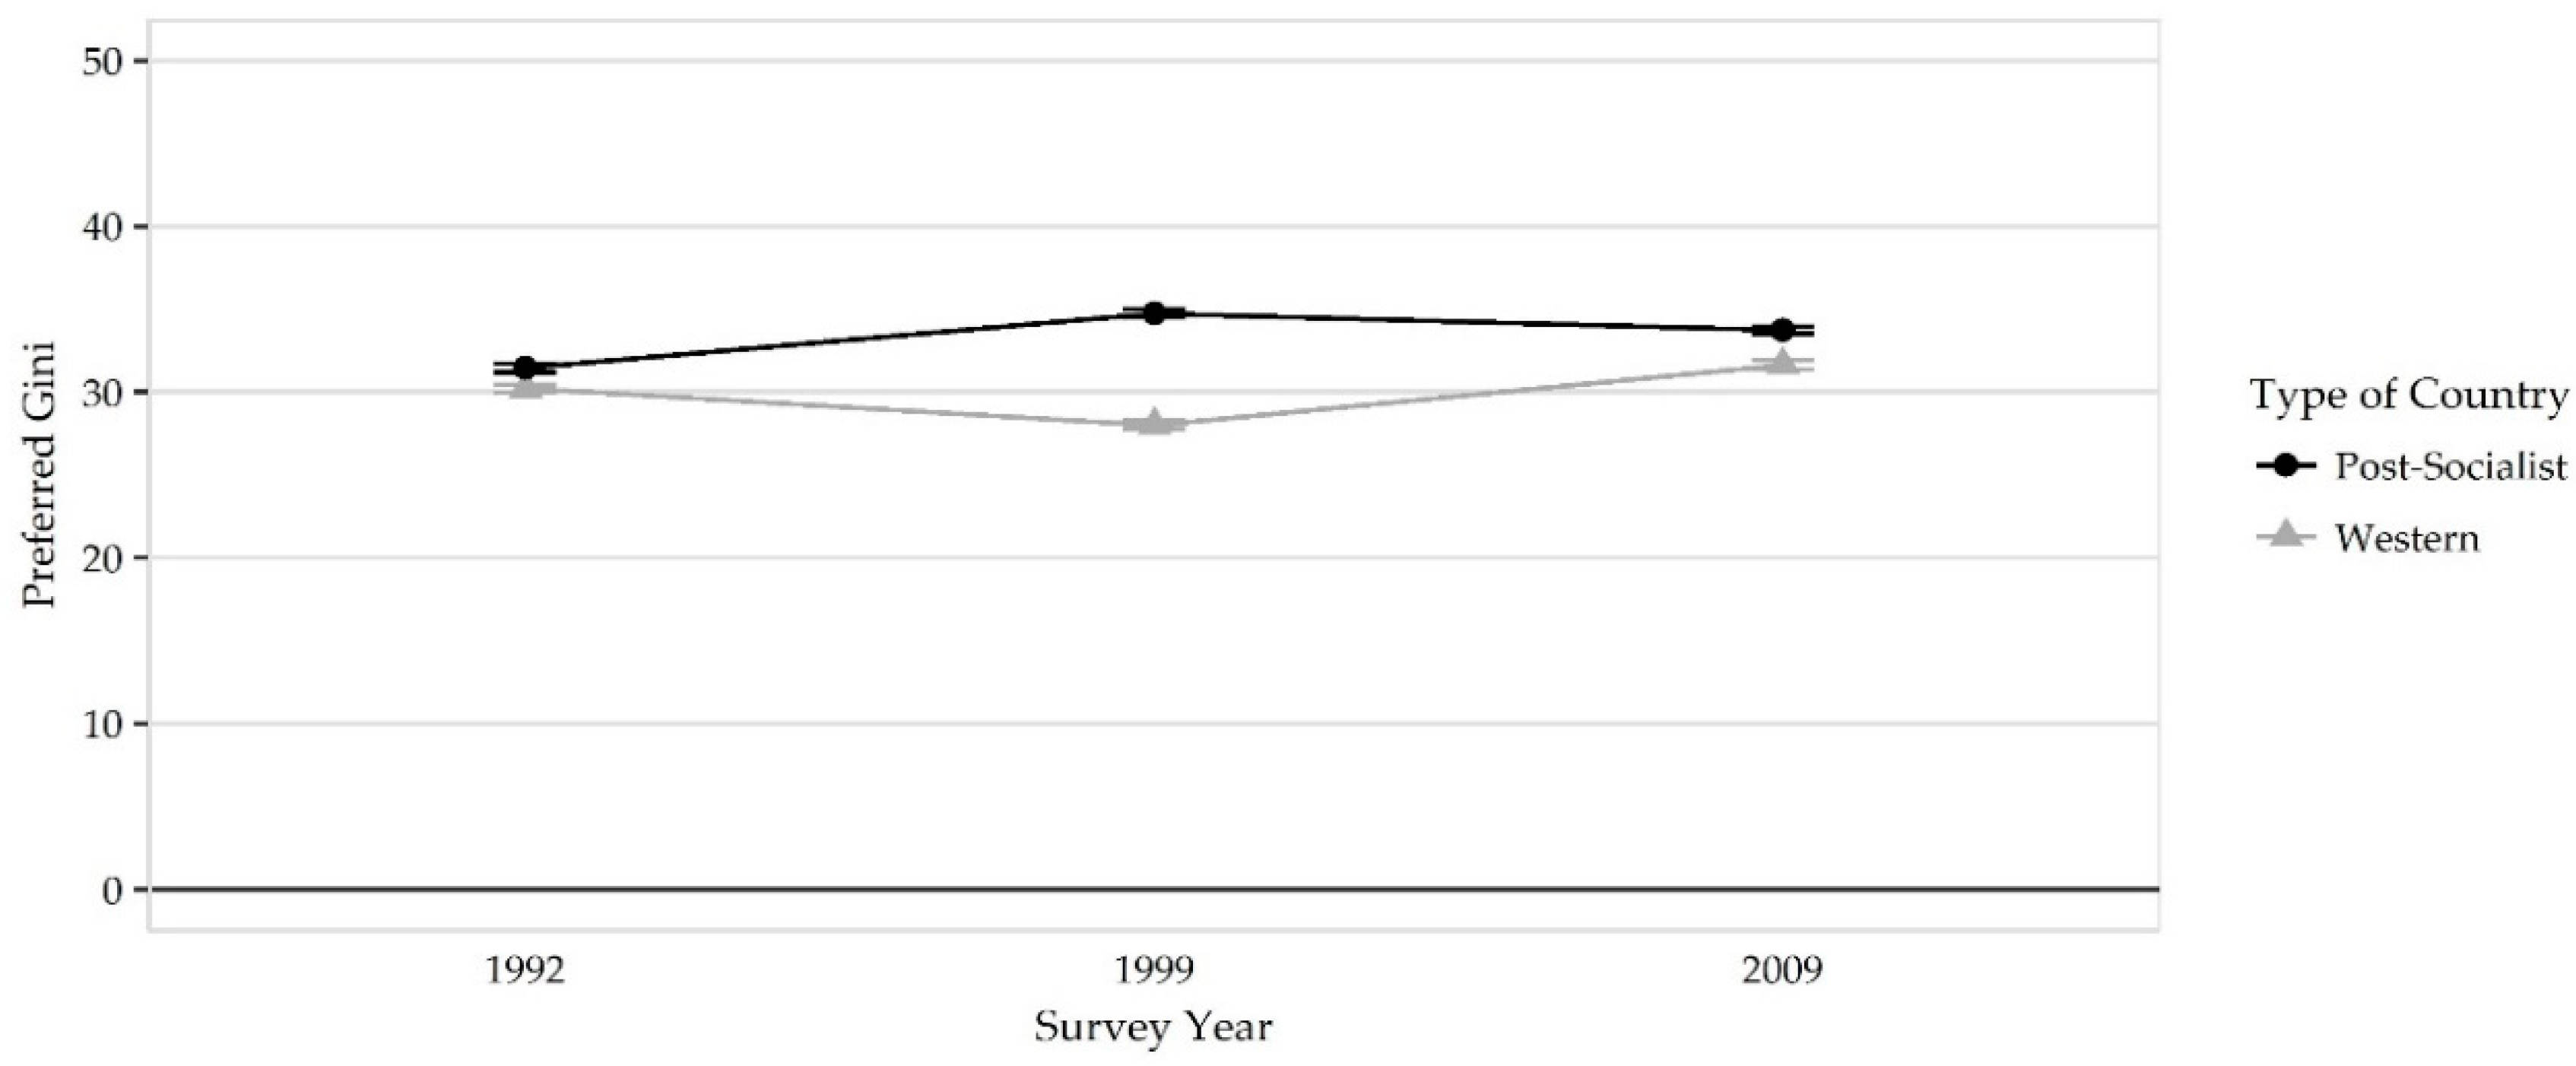
First, I focus on comparing the preferences of post-socialists and Westerners. In post-socialist countries the value of the preferred Gini increased throughout the 1990s, but then proved to be relatively stable in the 2000s. Interestingly, in comparison, Western Europeans had a slightly lower preference toward income inequality, which increased by 2009. Additionally, the trends in both countries were relatively balanced through the survey years. Overall, Figure 3 shows how post-socialist countries have preference for higher income inequality than Westerners.
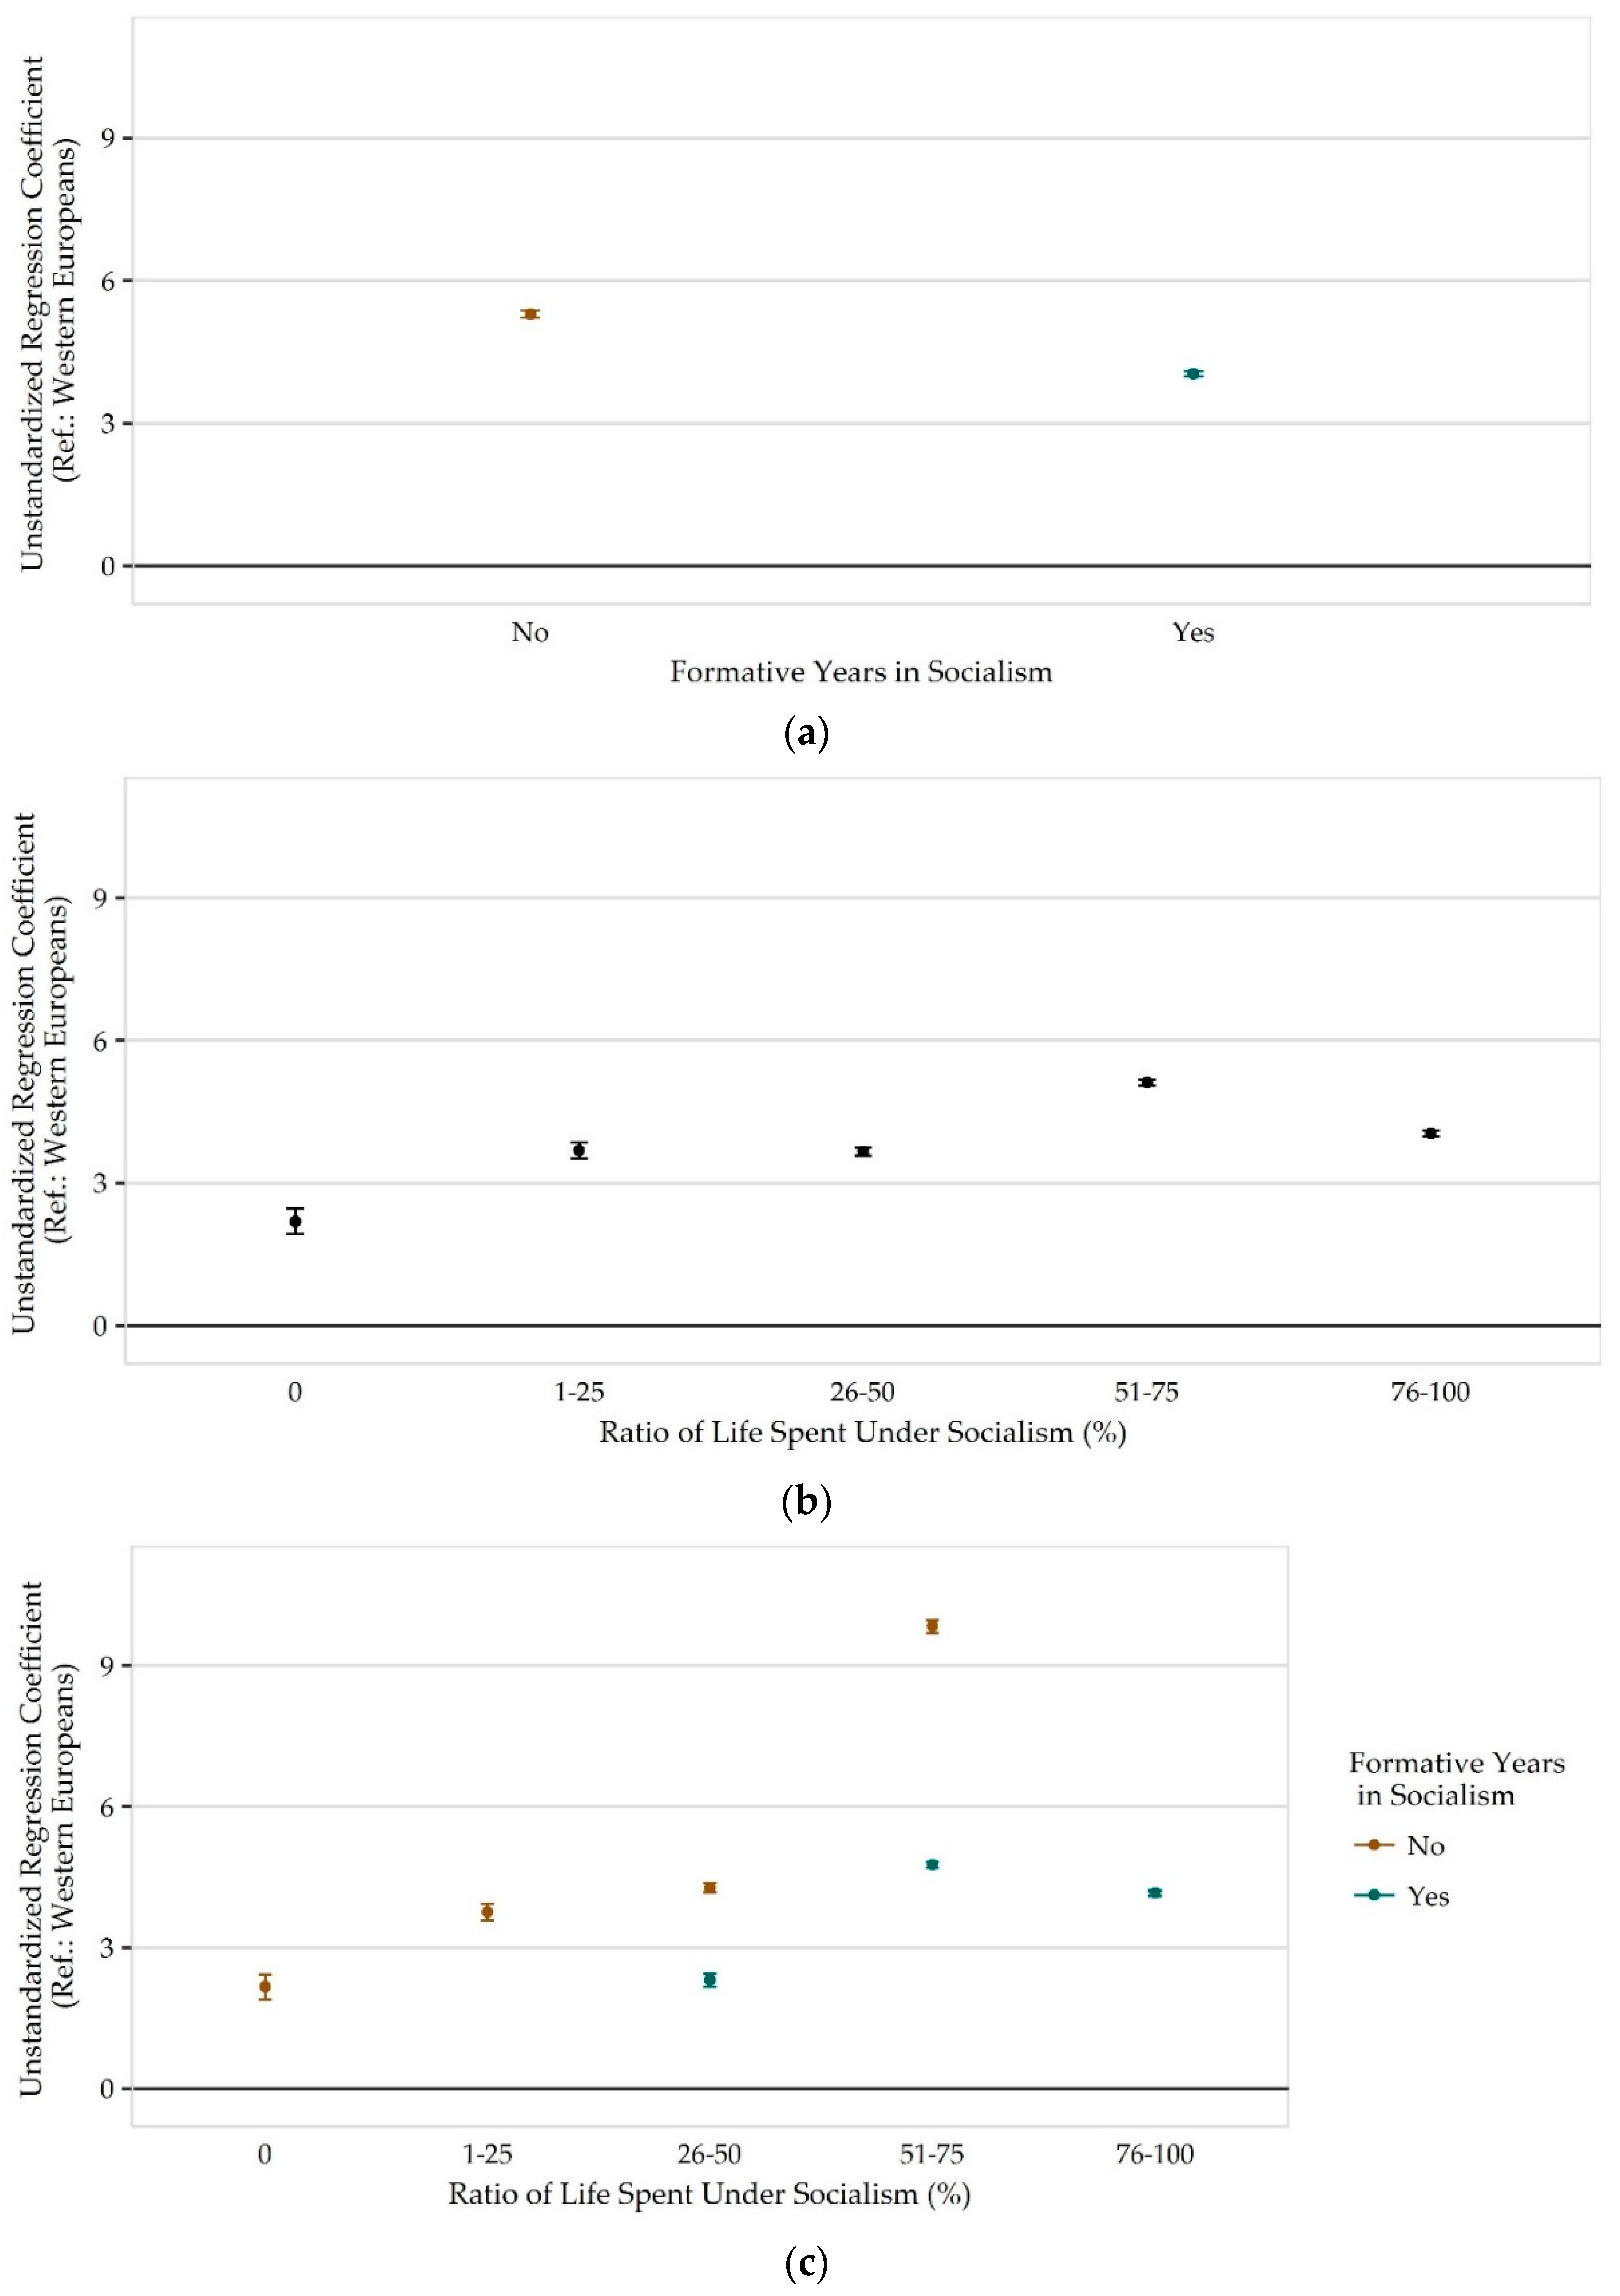
The graphs in Figure 4 depict the marginal effect of the post-socialist dummy on subgroups broken down by the three socialization indicators. In general, individuals from post-socialist countries prefer higher income inequality—independent of the extent of their socialist socialization. The first graph shows that individuals with no formative years in socialism will likely prefer higher levels of income inequality than Westerners (b = 5.292, p < 0.001), even more so than respondents who spent their formative years in socialism (b = 4.031, p < 0.001). The different subgroups based on exposure rate do not differentiate from each other so distinctly. On the one hand, those with no exposure to socialism exhibit the lowest preferences (and therefore also being the closest subgroup to Westerners) (b = 2.185, p < 0.001). Additionally, individuals who spent 51% and 75% of their lives in socialism are the most different from Westerners (b = 5.109, p > 0.001) and significantly higher than any other subgroup. On the other hand, all other groups exhibit similar preferences to one another (i.e., do not differ from one another significantly) and display also similar distance from Westerners (scoring around 3.5 points higher in the preferred Gini levels than Westerners). Moving on to the final graph in Figure 4, the division of the post-socialist population by both formative years and exposure rate appears to be fruitful. Much clearer trends can be observed for all groups. First, for individuals who did not spend their formative years in socialism, the more exposure seems to propel them farther away from Westerners. On the other hand, the extent of exposure only plays a marginal role for those who spent their formative years in socialism, and to a far less degree than the former group. Additionally, when comparing the marginal effect within subgroups of socialist exposure: the subgroup with no formative experience in socialism is more different from Westerners.
These results suggest that both formative years and exposure rate play a role in shaping preferences toward income inequality. More precisely, formative years have a clear and strong effect on their own, while exposure rate comes into play when interacted with formative years. If there is a lack of experience in formative years, the exposure rate is an exceptionally strong factor to influence preferences. In contrast, the experience in formative years seems to cement preferences, the overall degree of exposure has a much lesser role.
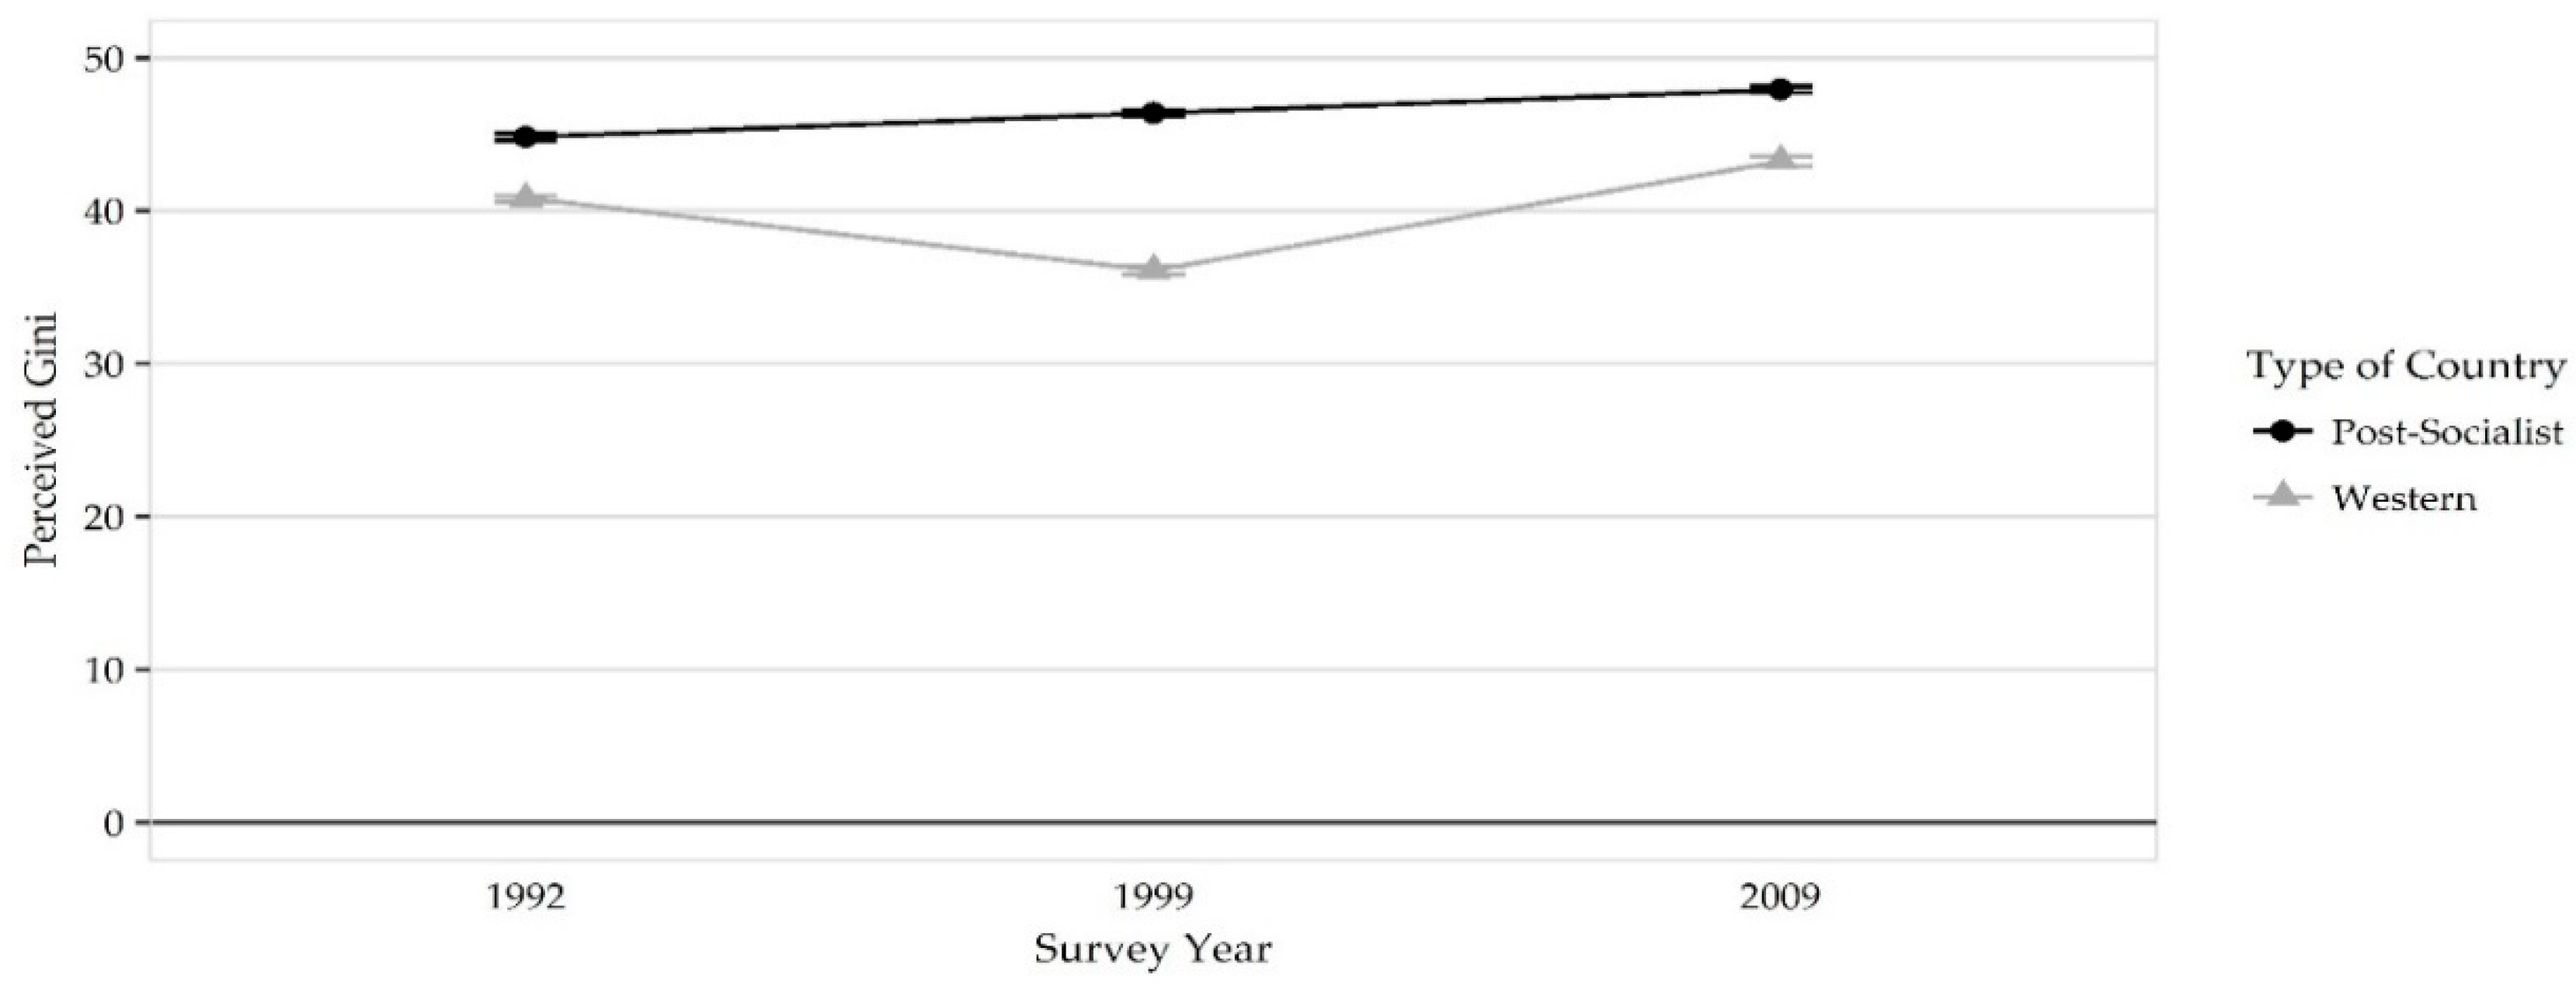
Lastly, I will focus on the perception of income inequality and look whether socialization provides respondents with different ways to view inequality in their respective countries. Figure 5 shows that respondents in post-socialist countries perceived a higher level of inequality than Westerners, which matches the tendencies that actually took place in post-socialist countries [69]. However, it also seems that there is a convergence between the two society types. Individuals in Western countries exhibit a gradual decline in perception of income inequality, and then again an increase, while in post-socialist countries the perception increases slowly throughout the 1990s and 2009.
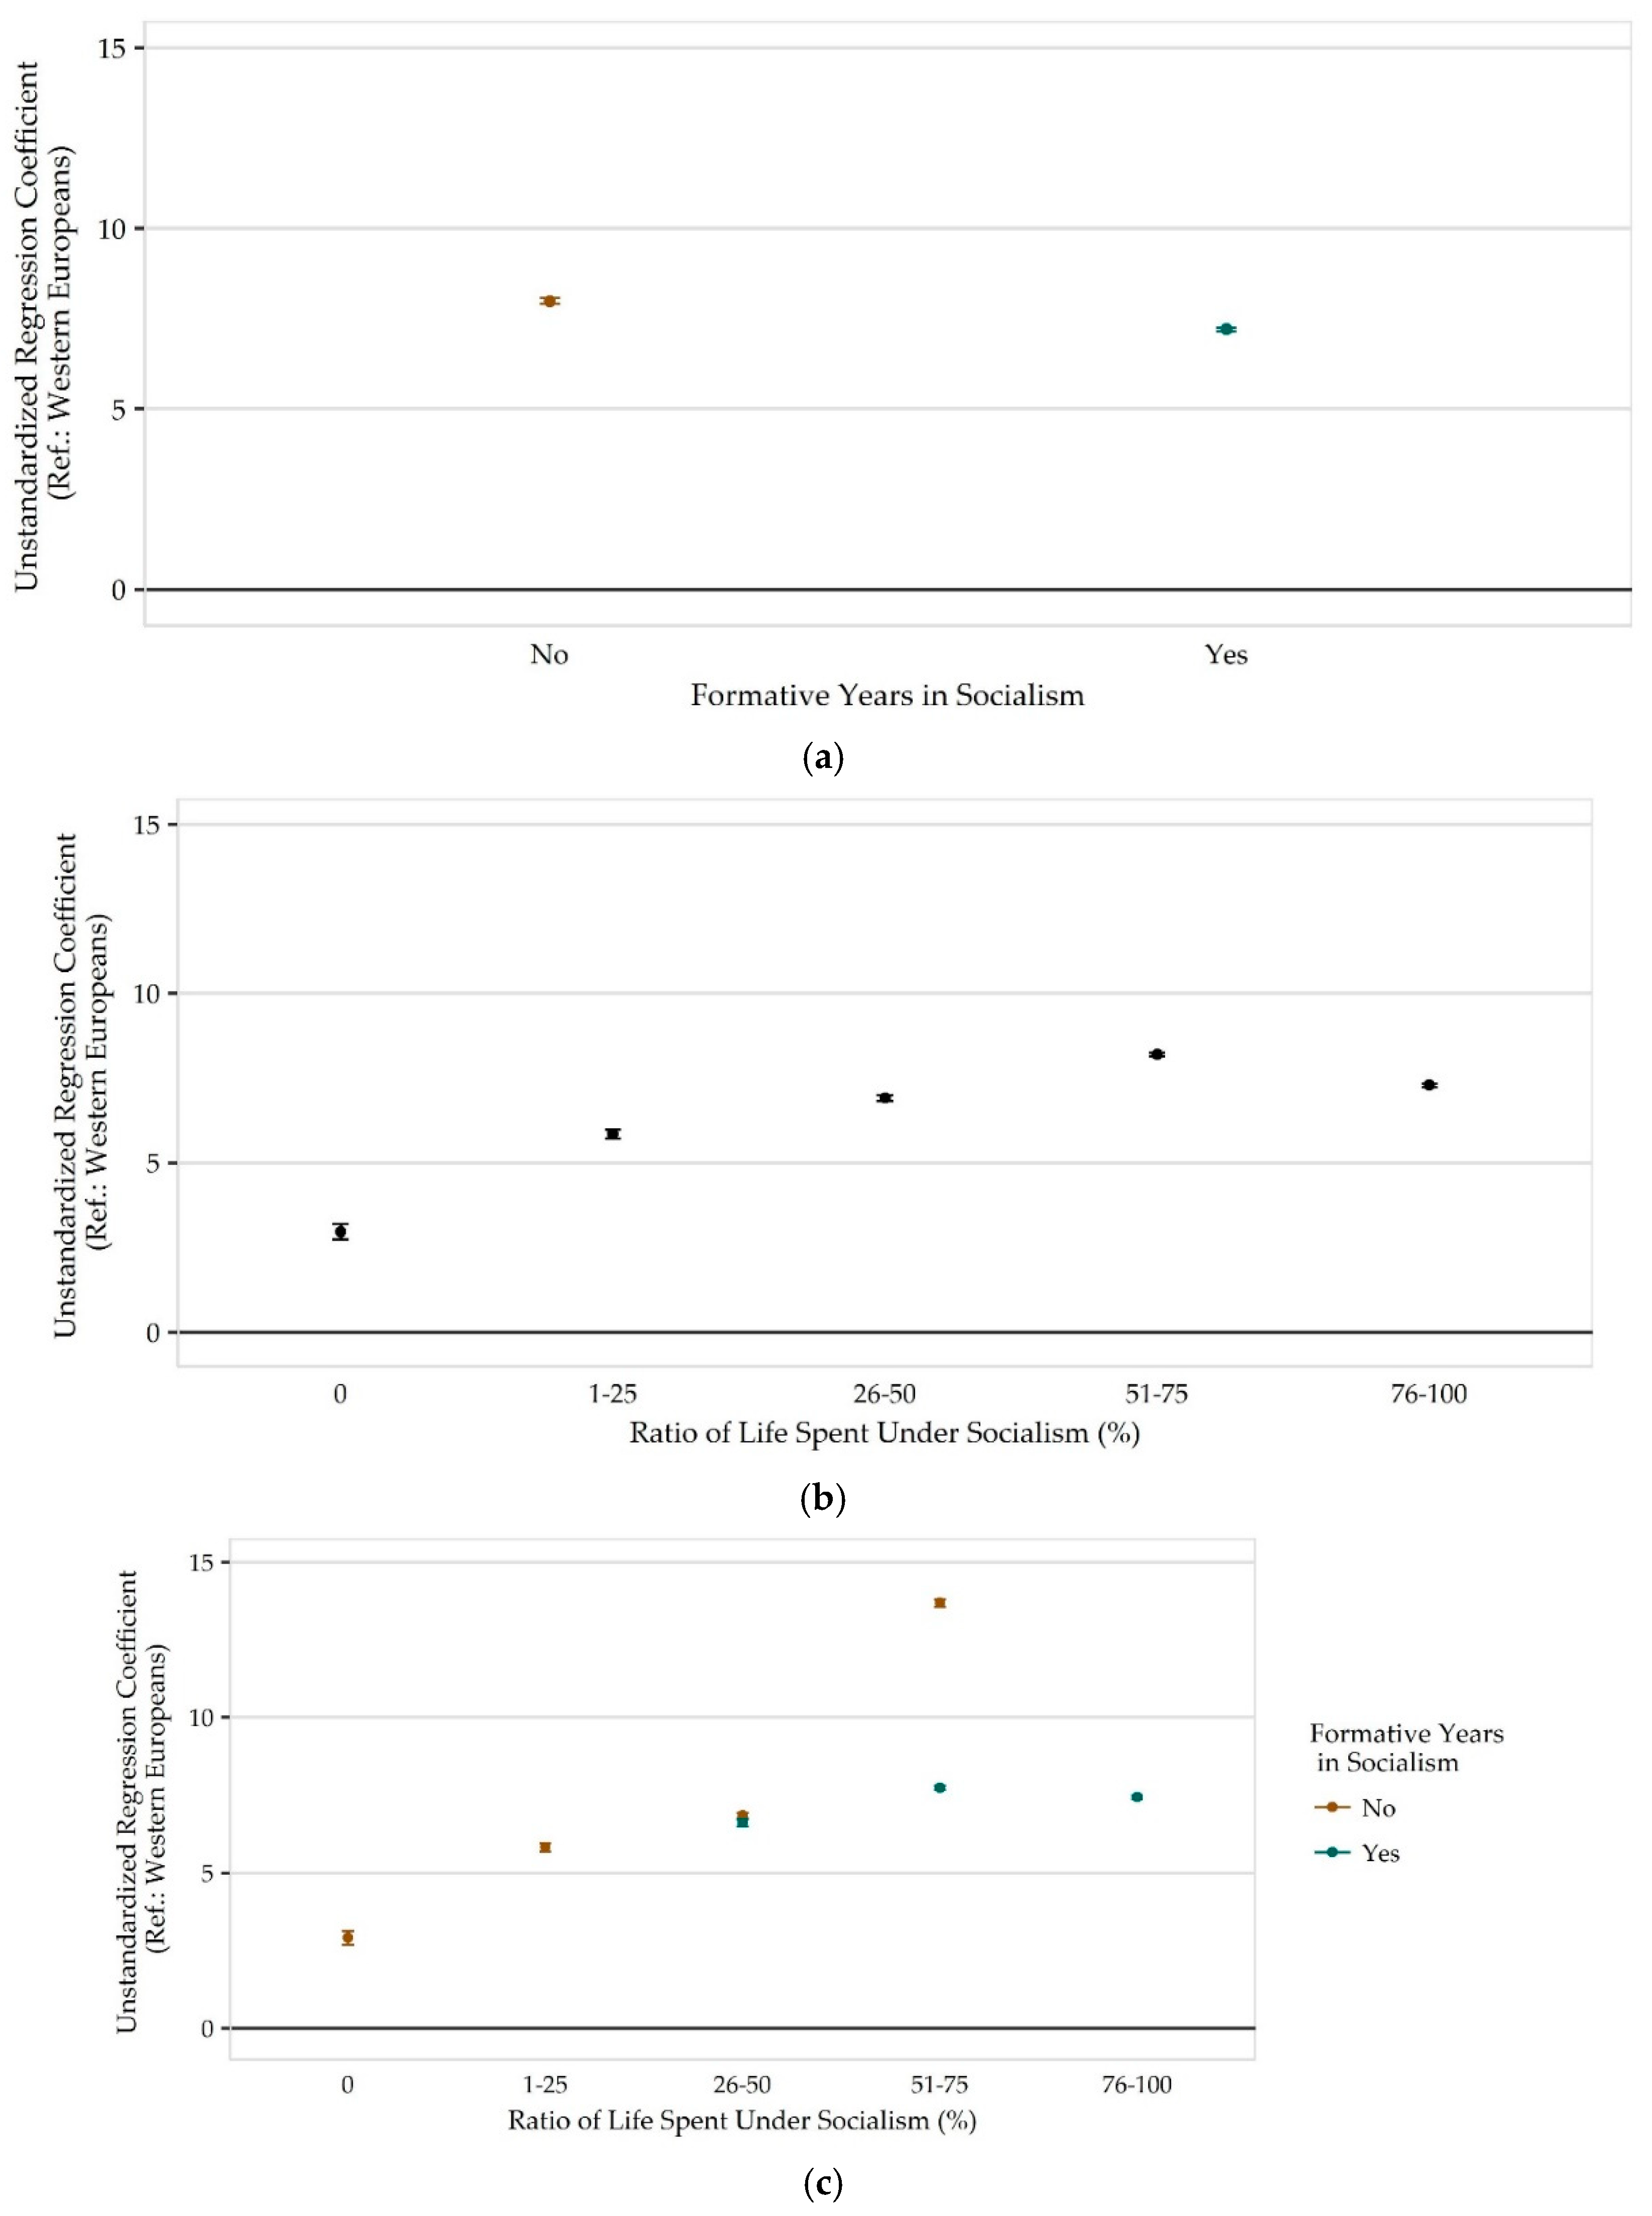
Figure 6 displays the unstandardized coefficients for predicting perceived levels of Gini split by the socialization indicators: formative years, exposure rate, as well as the joint indicator. As could be expected, considering the income inequality levels in the two types of societies, individuals living in post-socialist countries perceive higher levels of inequality than Westerners (i.e., the post-socialist dummy is always positive and significantly different from 0), even when controlled for numerous individual factors. Thus, in case of perceptions it is meaningful to only focus on the difference between the socialization subgroups. The first graph in Figure 6 shows how individuals, who had no socialist experience while growing up will perceive a significantly higher level of inequality, than those who spent all their formative years in socialism (b = 7.200, p < 0.001). In case of exposure rate, a linear trend can be observed in the tendencies, with individuals with no exposure (b = 2.958, p < 0.001) proving to be the closest to Westerners (though still significantly different) but still marginally higher than the general post-socialist effect.
The third graph provides us with more details about how exposure and formative years influence the perception of income inequality. Socialization does seem to exert influence on perceptions. In detail this means that the linear tendency described previously for the effect of exposure rate is even more accentuated when the sample is broken down based on formative years. For individuals who did not spend all their formative years in a socialist regime a linear (even exponential) tendency has emerged: the more experience with socialism the higher inequality they perceive inequality (to be compared to the other subgroups, but as well as to Westerners). In this group, the leap in the level of perception is very distinctive for individuals who were exposed 51% to 75% of their lives to socialism (b = 13.680, p < 0.001). In contrast, in groups where respondents spent all their formative years in a socialist regime the differences between the groups is even more, but the tendency can be considered linear, as there is a significant difference between the marginal effects across the subgroups. When looking at the difference with and without formative years in socialism within a group with the same exposure rate: those with no formative years perceive inequality to be at a higher level than those without, but only in the category where respondents experienced 51% to 75% exposure rate.
To sum up, it seems that perceptions are also strongly influenced by socialization. Additionally, the direction of the effects is also mixed by the anticipated hypotheses. Individuals who have not spent the formative years in socialism will clearly perceive more inequality than those who have, and they will be also more different from Westerners. The second hypothesis is confirmed: there is a linear relation between perceptions and exposure rate.
5.3. Robustness Checks Related to Structural Factors
Additionally, to the main models previously discussed, the role of structural factors was also tested. This was done to ensure that structural effects, such as Gini and GDP do not cancel out the effect of socialization completely and the results regarding socialization effects is robust. Ideally, this should have been done by adding the structural factors to the initial models where the three components of the APC analysis and the post-socialist country dummy are already included. However, this was empirically impossible due various reasons: the limited number of countries, the autocorrelation between structural factors in different time points, and the multicollinearity between the post-socialist country dummy and structural factors. Instead, as a second-best option, I substituted year (i.e., the year dummies) with a structural variable (GDP or Gini) in the models. The results showed that socialization has a distinct role in determining how similar post-socialist individuals are to Westerners even when controlling for the structural factors. However, these empirical models reflect how similar post-socialist individuals are they are at the same level of Westerners irrespective whether they share the same zeitgeist. Thus, these models are not able to cancel out period effects.12
6. Discussion
The paper sought to understand whether individuals from post-socialist countries are significantly different from Westerners in their attitudes toward income inequality when socialization effects are accounted for. In doing so, I tried to assess how much of the socialist legacy is still present. Put another way: are current day differences between post-socialist and Western countries due to the socialist history? and whether we can expect higher level convergence if the aspect of socialist socialization is not active anymore. I addressed these questions by studying whether the difference between post-socialist countries and Western countries regarding attitudes toward income inequality is moderated by socialization effects. I operationalized socialization effects in three different ways: (1) as spending all of one’s formative years in a socialist regime, (2) as exposure rate to socialism measured by relative amount of life experience gained under socialism compared to all years. Lastly, (3) I looked at how these two effects interact with one another and whether they have a joint effect. The results yield notable results: socialization affect all three concepts studied (i.e., justice evaluations, preferences, and perceptions toward income inequality).
Throughout the analysis, there is indication that the convergence between post-socialist and Western societies is contingent on socialization and that socialization is a relevant factor in determining attitudes toward income inequality. If individuals have no experience with socialism, they will more likely be similar to Westerners – suggesting a high probability of convergence in the future.
Additionally, findings diverge across the three concepts in focus and therefore encourage us to rethink the mechanisms behind them. In case of justice evaluations there is a certain level of convergence indicating that individuals learn to accept inequality if they are exposed to them. Thus, post-socialist individuals free of a socialist socialization will likely legitimate their surroundings similarly to their Western counterparts. In case of preferences there is an indication of the adaptation thesis, since all post-socialist groups prefer higher inequality than Westerners; however, there is also an interaction with socialization. Lastly, with regards to perceptions of inequality the results are inconclusive. To a certain degree, there is a shock effect, since spending one’s formative years in socialization means comparatively perception of higher inequality. On the other hand, there is indication that individuals with no formative socialist socialization perceive income inequality more harshly and dramatically. This suggest that formative years are essential at grounding one’s perception. The high level of perception of income inequality for the group with no formative years but still a large percent (51–75%) of their life still in a socialist regime suggests such mechanism.
One of the key findings regarding the role of socialization is that the experience of individuals in their formative years is relevant for attitudes, but is complemented by a certain level of lifelong learning. The results indicate that a solid and coherent foundation of experience can be extremely decisive on attitudes. This is especially noticeable for perceptions. The perception of individuals who spent their formative years in socialism is very similar, while the perception for the other group who lack a consistent system experience during their formative years is very distinct from one another. There are comparable trends for preferences, albeit the uniformity is less prominent. This observation leads to an interesting theoretical implication. Perception might be more stable concept and contingent on experience in formative years, while preferences are more prone to be influenced by other, here unobserved factors. In fact, perceptions potentially anchor preferences since they seem to be coming from a more stable source. This also has an impact for the interpretation of justice evaluations. These findings indicate that both perceptions and preferences can be stabilized when the formative socialization is stable. This stability could mean that both concepts do not change over time. Older cohorts with socialist formative years have a hard time legitimizing and accepting inequality because their perceptions are exaggerated, while their preferences are partially still under the spell of egalitarian verses. In contrast, individuals who have weaker value foundations in their formative years (since they experienced both kinds of regimes to some degree, both regime types leave a mark on them) might have weaker and more volatile perceptions and preferences that are less stable, but this also enables them to shift their preferences and perceptions more easily. This helps them more easily to cope with a certain situation and adjust their “belief in the just world”. This would also explain the negative trend observed for justice evaluations.
There are several limitations of the study. First, both the operationalization of the formative years and even more so for the exposure years can be considered arbitrary. Defining 16 years of age as the end of formative years is arguable. However, given the results and the fact that formative years minimized the extremities in attitudes toward income inequality, the decision can be contended. Another limitation is the solution to break down continuous variable of exposure rate. It was out of necessity due to the number of cases, as well as an attempt to delineate the cohort effect. A more nuanced break in the variable might give us more details about the irregularities observed in the trends. The brute quantification of socialization could have been exchanged for a generational approach. A generational approach seems especially meaningful when we consider the results for the perception of income inequality. Here both groups with and without formative years in socialism but similar exposure rates had similar levels of perception (Figure 6c). These individuals could potentially represent a certain generation born between 1968 and 1983—a time of normalization in many of the studied countries [17]. However, for such an analysis a detailed review of the historical events of each country would have been necessary and was not feasible for the scope of the paper. Additionally, the quality and reliability of studies on generations vary across countries and in the end it would not give a solution to the exposure rate question. Instead, it would have rephrased the whole research question at hand and led it away from the question whether we can expect convergence. Another limitation of the study is that the selection of countries (especially for Western countries) is very limited and therefore hard to generalize completely about the post-socialist and Western divide. Lastly, there are some anomalies present in the paper that currently cannot be theoretically explained. For justice evaluations the effect of exposure rate is different for the two groups linear and U-shaped—with no clear reason. Replication studies, looking eventually more closely at only post-socialist countries could offer answers.
Overall, the paper provides several contributions to the field of attitudinal research. First, socialization does interact with the differences between Western and post-socialist countries. Second, the results show that there is a convergence between post-socialist and Western societies, and that individuals with less exposure to socialism seem to reflect Western trends to a larger degree. Third, socialization is an important factor and these findings should encourage scholars to account for the effect of socialization empirically and not only theoretically, especially now that more multi-wave datasets are available. Lastly, the results indicate that the environment individuals grow up in should not be underestimated, as socialization and experience prove to be far-reaching, and might even influence how flexible individuals are, and how easily they are able to adapt to the institutional environment.
Funding
The study has been partially funded by the Russian Academic Excellence Project ‘5-100’.
Acknowledgments
I would like to thank the participants at the workshops and conferences of the Laboratory of Comparative Social Research at the Higher School of Economics in 2012 and 2013, and I am especially indebted to Ronald Inglehart, Tatiana Karabchuk, Eduard Ponarin, and Christian Welzel for their comments that greatly improved the manuscript. I would also like to thank the participants of the Graduate Colloquium at the Insitute for Sociology (Sören Carlson, Daniel Drewski, Anna Delius, Marta Kozłowska, Uwe Ruß, Julia Tuppat, Tim Sawert) for their useful comments, as well as Pál Susánszky. Additionally, I would like to thank Feodor Poukhovski-Sheremetyev for his proof reading, as Kilian Weil for his support in the manuscript formatting.
Conflicts of Interest
The author declares no conflict of interest.
Appendix A
The dependent variables stems from the item block provided in the add-on cumulative dataset of the ISSP [59]. The items measured the perceived and preferred amounts earned by a certain profession by the respondent. The items are formulated in the following way:
- Perception: “We would like to know what you think people in these jobs actually earn. Please write in how much you think they usually earn each <YEAR/MONTH/FORTNIGHT/WEEK>, <BEFORE/AFTER> taxes.” (V8 to V22)
- Preference: “Next, what do you think people in these jobs ought to be paid. How much do you think they should earn each <YEAR/MONTH/FORTNIGHT/WEEK>, <BEFORE/AFTER> taxes, regardless of what they actually get?” (V23 to V37)
From these items, the perceived and the preferred personal Gini are calculated for each individual, which is much alike to the Gini used in social stratification research. Based on the earnings respondents mark for each individual, a personal assessment of inequalities can be calculated.
In both forms of measurements, attitudes toward some given occupation are considered. Thus, respondents give their preferences to what they would like, for example, a bricklayer to earn or a doctor and what do they think, how much does someone with given occupation earn. The ISSP items are especially rich regarding what kind of occupations are included in the questionnaire; however, not in all years are all occupations asked or some are missing. Therefore, such a generalized solution was needed, when the occupations could be interchangeable. Based on the paper of Andersen and Yaish [61], I computed the Gini-coefficient for each individual, based on the following formula:
where xj, xk the value given by respondent for the occupation, n is the number of occupations considered and μ is the grand average of all occupations. Corresponding with the meaning of the Gini-coefficient, the higher value a respondent has, the larger inequality will the individual prefer.
The justice evaluation of the Gini is then calculated, based on the discrepancy between the perceived and preferred personal Gini. Justice evaluations were introduced by Jasso [22] and this measure has been a frequent application in papers. The mathematical annotation of the Jasso-index [22] is the following:
where A stands for the actual, in other words, perceived reward for an i individual from a point of view a respondent X and C stands for the just reward or preferred reward for an i individual from a point of view of respondent X. A positive justice evaluation would mean that there is over-reward and a negative would mean that there is under-reward. The value of justice evaluations can theoretically vary between −∞ and +∞. These two measures represent two aspects of attitudes toward inequality and therefore both will be looked at in the analysis.
From the previous formula, also the justice evaluation of the Gini can be calculated, by substituting the Gini for perceived and preferred values into the justice evaluation formula.
Appendix B

Table A1.
Overview of Countries and Sample Size by Survey Year.
| Country | Year | N |
|---|---|---|
| Germany (West) | 1992 | 1447 |
| Germany (West) | 2000 | 410 |
| Germany (West) | 2010 | 641 |
| Great Britain | 1992 | 812 |
| Great Britain | 1999 | 571 |
| Great Britain | 2009 | 722 |
| Norway | 1992 | 1187 |
| Norway | 1999 | 970 |
| Norway | 2009 | 1221 |
| Bulgaria | 1993 | 449 |
| Bulgaria | 1999 | 374 |
| Bulgaria | 2008 | 203 |
| Czech Republic | 1992 | 281 |
| Czech Republic | 1999 | 630 |
| Czech Republic | 2008 | 589 |
| Germany (East) | 1992 | 394 |
| Germany (East) | 2000 | 159 |
| Germany (East) | 2010 | 234 |
| Hungary | 1992 | 423 |
| Hungary | 1998 | 331 |
| Hungary | 2009 | 481 |
| Poland | 1992 | 685 |
| Poland | 1999 | 462 |
| Poland | 2010 | 602 |
| Slovakia | 1992 | 168 |
| Slovakia | 1999 | 541 |
| Slovakia | 2008 | 633 |
Appendix C. Background Details on Post-Socialist Sample
Table A2.
Post-socialist Countries and the Duration of Their Socialist Era.
| Country | Start of Socialism | End of Socialism |
|---|---|---|
| Bulgaria | 1946 | 1990 |
| Czech Republic | 1948 | 1989 |
| Germany (East) | 1949 | 1990 |
| Hungary | 1948 | 1989 |
| Poland | 1947 | 1989 |
Table A3.
Overview of Birth cohorts by Socialization for Post-socialist Countries.
| Exposure Rate | No Formative Years in Socialism | Formative Years in Socialism | ||
|---|---|---|---|---|
| Year of Birth | N | Year of Birth | N | |
| No exposure | 1989–1992 | 84 | - | - |
| 1–25% exposure | 1982–1989 | 273 | - | - |
| 26–50% exposure | 1974–1983 | 662 | 1968–1974 | 307 |
| 51–75% | 1974–1980 | 307 | 1946–1974 | 2566 |
| 76–100% | 1974–1975 | 47 a | 1946–1974 | 3393 |
a Is not considered when splitting the socialization variables by both formative years and exposure due to the number of cases.
Appendix D. Technical Background
Table A4.
Bootstrapped OLS regression models to explain the evaluation of Gini by formative years (corresponding with Figure 2a).
Table A4.
Bootstrapped OLS regression models to explain the evaluation of Gini by formative years (corresponding with Figure 2a).
| DV: Evaluation of Gini | Model 1 (Formative Years in Socialism: No) | Model 2 (Formative Years in Socialism: Yes) |
|---|---|---|
| Intercept | 0.436 *** | 0.475 *** |
| Post-Socialist (Ref.: West) | 0.028 *** | 0.04 *** |
| Gender | −0.041 *** | −0.029 *** |
| Education (in Years) | 0.001 *** | −0.002 *** |
| Employed | 0.029 *** | 0.024 *** |
| Income (Ref.: 1st Decile) | ||
| 2nd Income Decile | 0.006 ** | −0.006 ** |
| 3rd Income Decile | 0.056 *** | 0.036 *** |
| 4th Income Decile | −0.015 *** | −0.021 *** |
| 5th Income Decile | −0.002 | −0.009 *** |
| 6th Income Decile | −0.008 *** | −0.012 *** |
| 7th Income Decile | 0.008 *** | −0.021 *** |
| 8th Income Decile | −0.038 *** | −0.044 *** |
| 9th Income Decile | −0.072 *** | −0.078 *** |
| 10th Income Decile | −0.161 *** | −0.13 *** |
| No Independent Income | −0.033 *** | −0.033 *** |
| Age | −0.001 *** | −0.001 *** |
| Survey Wave (Ref.: 1992) | ||
| 1999 | −0.073 *** | −0.066 *** |
| 2009 | 0.007 *** | 0.014 *** |
| R-square | 0.061 *** | 0.053 *** |
Notes: ISSP, own calculations. Result of bootstrapped OLS regressions from 1000 bootstrap samples each with 1000 cases. Bootstrapped coefficients displayed. Significance levels: ** p < 0.01, *** p < 0.001.
Table A5.
Bootstrapped OLS regression models to explain the evaluation of Gini by exposure rate (corresponding with Figure 2b).
Table A5.
Bootstrapped OLS regression models to explain the evaluation of Gini by exposure rate (corresponding with Figure 2b).
| DV: Evaluation of Gini | Model 1 (No Exposure) | Model 2 (1–25% Exposure) | Model 3 (26–50% Exposure) | Model 4 (51–75% Exposure) | Model 5 (76–100% Exposure) |
|---|---|---|---|---|---|
| Intercept | 0.407 *** | 0.418 *** | 0.425 *** | 0.442 *** | 0.448 *** |
| Post-Socialist (Ref.: West) | 0.01 * | 0.052 *** | 0.044 *** | 0.032 *** | 0.042 *** |
| Gender | −0.037 *** | −0.039 *** | −0.031 *** | −0.033 *** | −0.033 *** |
| Education (in Years) | 0.003 *** | 0.002 *** | 0.001 *** | 0 *** | −0.001 *** |
| Employed | 0.033 *** | 0.031 *** | 0.032 *** | 0.024 *** | 0.029 *** |
| Income (Ref.: 1st Decile) | |||||
| 2nd Income Decile | −0.012 *** | −0.009 *** | −0.007 *** | 0.002 | −0.007 *** |
| 3rd Income Decile | 0.049 *** | 0.045 *** | 0.044 *** | 0.043 *** | 0.042 *** |
| 4th Income Decile | −0.021 *** | −0.021 *** | −0.022 *** | −0.013 *** | −0.02 *** |
| 5th Income Decile | −0.011 *** | −0.006 *** | −0.006 ** | −0.006 ** | −0.009 *** |
| 6th Income Decile | −0.012 *** | −0.007 ** | −0.011 *** | −0.009 *** | −0.006 ** |
| 7th Income Decile | −0.015 *** | −0.004 * | −0.012 *** | −0.022 *** | −0.006 ** |
| 8th Income Decile | −0.048 *** | −0.047 *** | −0.05 *** | −0.041 *** | −0.044 *** |
| 9th Income Decile | −0.088 *** | −0.086 *** | −0.093 *** | −0.08 *** | −0.066 *** |
| 10th Income Decile | −0.178 *** | −0.17 *** | −0.179 *** | −0.149 *** | −0.134 *** |
| No Independent Income | −0.041 *** | −0.039 *** | −0.04 *** | −0.034 *** | −0.028 *** |
| Age | −0.001 *** | −0.001 *** | −0.001 *** | −0.001 *** | −0.001 *** |
| Survey Wave (Ref.: 1992) | |||||
| 1999 | −0.07 *** | −0.068 *** | −0.073 *** | −0.071 *** | −0.063 *** |
| 2009 | 0 *** | 0.003 *** | 0.007 *** | 0.008 *** | 0.009 *** |
| R-square | 0.06 *** | 0.061 *** | 0.062 *** | 0.053 *** | 0.054 *** |
Notes: ISSP, own calculations. Result of bootstrapped OLS regressions from 1000 bootstrap samples each with 1000 cases. Bootstrapped coefficients displayed. Significance levels: * p < 0.05, ** p < 0.01, *** p < 0.001.
Table A6.
Bootstrapped OLS regression models to explain the evaluation of Gini by exposure rate and formative years (corresponding with Figure 2c).
Table A6.
Bootstrapped OLS regression models to explain the evaluation of Gini by exposure rate and formative years (corresponding with Figure 2c).
| DV: Evaluation of Gini | Model 1 (No Formative Years and No Exposure) | Model 2 (No Formative Years and 1–25% Exposure) | Model 3 (No Formative Years and 26–50% Exposure) | Model 4 (No Formative Years and 51–75% Exposure) | Model 5 1 (No Formative Years and 76–100% Exposure) |
|---|---|---|---|---|---|
| Intercept | 0.407 *** | 0.416 *** | 0.421 *** | 0.412 *** | 0.407 *** |
| Post-Socialist (Ref.: West) | 0.005 | 0.051 *** | 0.029 *** | 0.015 *** | 0.11 *** |
| Gender | −0.036 *** | −0.038 *** | −0.034 *** | −0.037 *** | −0.037 *** |
| Education (in Years) | 0.003 *** | 0.002 *** | 0.002 *** | 0.003 *** | 0.003 *** |
| Employed | 0.033 *** | 0.03 *** | 0.033 *** | 0.029 *** | 0.033 *** |
| Income (Ref.: 1st Decile) | |||||
| 2nd Income Decile | −0.01 *** | −0.001 | −0.005 * | −0.005 ** | −0.005 * |
| 3rd Income Decile | 0.05 *** | 0.055 *** | 0.046 *** | 0.052 *** | 0.052 *** |
| 4th Income Decile | −0.021 *** | −0.015 *** | −0.024 *** | −0.01 *** | −0.017 *** |
| 5th Income Decile | −0.008 *** | 0 | −0.009 *** | −0.002 | −0.006 *** |
| 6th Income Decile | −0.01 *** | −0.004 | −0.01 *** | −0.012 *** | −0.006 ** |
| 7th Income Decile | −0.013 *** | 0.005 ** | −0.01 *** | −0.011 *** | −0.008 *** |
| 8th Income Decile | −0.045 *** | −0.041 *** | −0.051 *** | −0.04 *** | −0.043 *** |
| 9th Income Decile | −0.084 *** | −0.078 *** | −0.086 *** | −0.074 *** | −0.08 *** |
| 10th Income Decile | −0.175 *** | −0.162 *** | −0.18 *** | −0.166 *** | −0.171 *** |
| No Independent Income | −0.041 *** | −0.032 *** | −0.042 *** | −0.034 *** | −0.035 *** |
| Age | −0.001 *** | −0.001 *** | −0.001 *** | −0.001 *** | −0.001 *** |
| Survey Wave (Ref.: 1992) | |||||
| 1999 | −0.068 *** | −0.068 *** | −0.073 *** | −0.068 *** | −0.069 *** |
| 2009 | 0.001 *** | 0.003 *** | 0.005 *** | 0.002 *** | 0 *** |
| R-square | 0.059 *** | 0.06 *** | 0.061 *** | 0.057 *** | 0.06 *** |
| DV: Preferred Gini | Model 6 (Formative Years and 26–50% Exposure) | Model 7 (Formative Years and 51–75% Exposure) | Model 8 (Formative Years and 76–100% Exposure) | ||
| Intercept | 0.415 *** | 0.439 *** | 0.452 *** | ||
| Post-Socialist (Ref.: West) | 0.086 *** | 0.033 *** | 0.04 *** | ||
| Gender | −0.032 *** | −0.032 *** | −0.033 *** | ||
| Education (in Years) | 0.003 *** | 0.001 *** | −0.001 *** | ||
| Employed | 0.031 *** | 0.024 *** | 0.029 *** | ||
| Income (Ref.: 1st Decile) | |||||
| 2nd Income Decile | −0.009 *** | −0.001 | −0.011 *** | ||
| 3rd Income Decile | 0.05 *** | 0.046 *** | 0.041 *** | ||
| 4th Income Decile | −0.02 *** | −0.016 *** | −0.023 *** | ||
| 5th Income Decile | −0.004 * | −0.008 *** | −0.01 *** | ||
| 6th Income Decile | −0.011 *** | −0.009 *** | −0.008 *** | ||
| 7th Income Decile | −0.017 *** | −0.022 *** | −0.01 *** | ||
| 8th Income Decile | −0.048 *** | −0.045 *** | −0.048 *** | ||
| 9th Income Decile | −0.091 *** | −0.087 *** | −0.072 *** | ||
| 10th Income Decile | −0.174 *** | −0.153 *** | −0.139 *** | ||
| No Independent Income | −0.035 *** | −0.04 *** | −0.036 *** | ||
| Age | −0.001 *** | −0.001 *** | −0.001 *** | ||
| Survey Wave (Ref.: 1992) | |||||
| 1999 | −0.068 *** | −0.069 *** | −0.064 *** | ||
| 2009 | 0.003 *** | 0.01 *** | 0.009 *** | ||
| R-square | 0.061 *** | 0.054 *** | 0.055 *** | ||
1 Excluded from figure. Notes: ISSP, own calculations. Result of bootstrapped OLS regressions from 1000 bootstrap samples each with 1000 cases. Bootstrapped coefficients displayed. Significance levels: * p < 0.05, ** p < 0.01, *** p < 0.001.
Table A7.
Bootstrapped OLS regression models to explain the preferred Gini by formative years (corresponding with Figure 4a).
Table A7.
Bootstrapped OLS regression models to explain the preferred Gini by formative years (corresponding with Figure 4a).
| DV: Preferred Gini | Model 1 (Formative Years in Socialism: No) | Model 2 (Formative Years in Socialism: Yes) |
|---|---|---|
| Intercept | 25.272 *** | 21.611 *** |
| Post-Socialist (Ref.: West) | 5.292 *** | 4.031 *** |
| Gender | 2.07 *** | 1.751 *** |
| Education (in Years) | −0.355 *** | −0.074 *** |
| Employed | −0.181 *** | −0.187 *** |
| Income (Ref.: 1st Decile) | ||
| 2nd Income Decile | 0.389 *** | 0.506 *** |
| 3rd Income Decile | −0.965 *** | −0.445 *** |
| 4th Income Decile | 0.762 *** | 1.05 *** |
| 5th Income Decile | −0.484 *** | −0.3 *** |
| 6th Income Decile | 2.428 *** | 1.287 *** |
| 7th Income Decile | −0.547 *** | 0.738 *** |
| 8th Income Decile | 1.084 *** | 1.507 *** |
| 9th Income Decile | 3.158 *** | 2.695 *** |
| 10th Income Decile | 6.494 *** | 4.841 *** |
| No Independent Income | 4.837 *** | 4.708 *** |
| Age | 0.147 *** | 0.151 *** |
| Survey Wave (Ref.: 1992) | ||
| 1999 | −1.447 *** | −0.093 ** |
| 2009 | 0.717 *** | 0.508 *** |
| R-square | 0.119 *** | 0.094 *** |
Notes: ISSP, own calculations. Result of bootstrapped OLS regressions from 1000 bootstrap samples each with 1000 cases. Bootstrapped coefficients displayed. Significance levels: * p < 0.05, ** p < 0.01, *** p < 0.001.
Table A8.
Bootstrapped OLS regression models to explain the preferred Gini by exposure rate (corresponding with Figure 4b).
Table A8.
Bootstrapped OLS regression models to explain the preferred Gini by exposure rate (corresponding with Figure 4b).
| DV: Preferred Gini | Model 1 (No Exposure) | Model 2 (1–25% Exposure) | Model 3 (26–50% Exposure) | Model 4 (51–75% Exposure) | Model 5 (76–100% Exposure) |
|---|---|---|---|---|---|
| Intercept | 26.479 *** | 26.319 *** | 26.167 *** | 24.967 *** | 22.122 *** |
| Post-Socialist (Ref.: West) | 2.185 *** | 3.681 *** | 3.651 *** | 5.109 *** | 4.037 *** |
| Gender | 2.095 *** | 2.062 *** | 1.914 *** | 2.051 *** | 1.787 *** |
| Education (in Years) | −0.473 *** | −0.457 *** | −0.407 *** | −0.255 *** | −0.194 *** |
| Employed | −0.31 *** | −0.36 *** | −0.662 *** | −0.198 *** | −0.034 |
| Income (Ref.: 1st Decile) | |||||
| 2nd Income Decile | 0.934 *** | 0.918 *** | 0.919 *** | 0.276 *** | 0.714 *** |
| 3rd Income Decile | −0.599 *** | −0.697 *** | −0.58 *** | −0.733 *** | −0.431 *** |
| 4th Income Decile | 1.562 *** | 1.439 *** | 1.38 *** | 1.138 *** | 1.053 *** |
| 5th Income Decile | 0.085 | 0.06 | −0.263 *** | −0.52 *** | −0.009 |
| 6th Income Decile | 2.573 *** | 2.913 *** | 2.752 *** | 1.984 *** | 1.472 *** |
| 7th Income Decile | 0.318 *** | 0.074 | 0.313 *** | 0.504 *** | 0.269 *** |
| 8th Income Decile | 1.582 *** | 1.813 *** | 1.731 *** | 1.006 *** | 1.657 *** |
| 9th Income Decile | 3.929 *** | 3.923 *** | 4.191 *** | 3.034 *** | 2.641 *** |
| 10th Income Decile | 7.553 *** | 7.509 *** | 7.348 *** | 5.748 *** | 5.552 *** |
| No Independent Income | 6.09 *** | 5.857 *** | 5.7 *** | 5.386 *** | 5.025 *** |
| Age | 0.137 *** | 0.14 *** | 0.136 *** | 0.127 *** | 0.165 *** |
| Survey Wave (Ref.: 1992) | |||||
| 1999 | −2.291 *** | −2.298 *** | −2.045 *** | −0.991 *** | −1.037 *** |
| 2009 | 1.401 *** | 1.363 *** | 1.056 *** | 0.012 *** | 1.322 *** |
| R-square | 0.135 *** | 0.133 *** | 0.129 *** | 0.115 *** | 0.102 *** |
Notes: ISSP, own calculations. Result of bootstrapped OLS regressions from 1000 bootstrap samples each with 1000 cases. Bootstrapped coefficients displayed. Significance levels: * p < 0.05, ** p < 0.01, *** p < 0.001.
Table A9.
Bootstrapped OLS regression models to explain the preferred Gini by exposure rate and formative years (corresponding with Figure 4c).
Table A9.
Bootstrapped OLS regression models to explain the preferred Gini by exposure rate and formative years (corresponding with Figure 4c).
| DV: Preferred Gini | Model 1 (No Formative Years and No Exposure) | Model 2 (No Formative Years and 1–25% Exposure) | Model 3 (No Formative Years and 26–50% Exposure) | Model 4 (No Formative Years and 51–75% Exposure) | Model 5 1 (No Formative Years and 76–100% Exposure) |
|---|---|---|---|---|---|
| Intercept | 26.588 *** | 26.264 *** | 26.3 *** | 25.94 *** | 26.512 *** |
| Post-Socialist (Ref.: West) | 2.159 *** | 3.753 *** | 4.267 *** | 9.839 *** | −3.323 *** |
| Gender | 2.183 *** | 2.021 *** | 2.022 *** | 2.144 *** | 2.073 *** |
| Education (in Years) | −0.476 *** | −0.455 *** | −0.419 *** | −0.447 *** | −0.484 *** |
| Employed | −0.412 *** | −0.273 *** | −0.515 *** | −0.08 * | −0.302 *** |
| Income (Ref.: 1st Decile) | |||||
| 2nd Income Decile | 0.883 *** | 0.816 *** | 0.595 *** | 0.98 *** | 1.046 *** |
| 3rd Income Decile | −0.625 *** | −0.731 *** | −0.749 *** | −0.702 *** | −0.505 *** |
| 4th Income Decile | 1.396 *** | 1.486 *** | 1.036 *** | 1.195 *** | 1.537 *** |
| 5th Income Decile | 0.056 | −0.04 | −0.298 *** | −0.12 | 0.143 * |
| 6th Income Decile | 2.688 *** | 2.712 *** | 2.434 *** | 2.775 *** | 2.597 *** |
| 7th Income Decile | 0.18 ** | −0.078 | −0.128 * | 0.159 * | 0.27 *** |
| 8th Income Decile | 1.626 *** | 1.483 *** | 1.317 *** | 1.371 *** | 1.69 *** |
| 9th Income Decile | 3.926 *** | 3.932 *** | 3.653 *** | 3.489 *** | 3.963 *** |
| 10th Income Decile | 7.501 *** | 7.399 *** | 7.277 *** | 7.277 *** | 7.642 *** |
| No Independent Income | 6.092 *** | 5.842 *** | 5.778 *** | 5.964 *** | 6.204 *** |
| Age | 0.136 *** | 0.141 *** | 0.137 *** | 0.143 *** | 0.138 *** |
| Survey Wave (Ref.: 1992) | |||||
| 1999 | −2.289 *** | −2.279 *** | −2.007 *** | −2.319 *** | −2.253 *** |
| 2009 | 1.424 *** | 1.345 *** | 1.111 *** | 1.288 *** | 1.409 *** |
| R-square | 0.137 *** | 0.134 *** | 0.133 *** | 0.136 *** | 0.137 *** |
| DV: Preferred Gini | Model 6 (Formative Years and 26–50% Exposure) | Model 7 (Formative Years and 51–75% Exposure) | Model 8 (Formative Years and 76–100% Exposure) | ||
| Intercept | 26.291 *** | 25.033 *** | 22.318 *** | ||
| Post−Socialist (Ref.: West) | 2.295 *** | 4.759 *** | 4.153 *** | ||
| Gender | 1.894 *** | 2.033 *** | 1.776 *** | ||
| Education (in Years) | −0.461 *** | −0.279 *** | −0.207 *** | ||
| Employed | −0.423 *** | −0.306 *** | −0.119 ** | ||
| Income (Ref.: 1st Decile) | |||||
| 2nd Income Decile | 1.116 *** | 0.22 ** | 0.839 *** | ||
| 3rd Income Decile | −0.388 *** | −0.773 *** | −0.343 *** | ||
| 4th Income Decile | 1.575 *** | 1.251 *** | 1.035 *** | ||
| 5th Income Decile | 0.023 | −0.433 *** | 0.133 * | ||
| 6th Income Decile | 2.78 *** | 1.903 *** | 1.549 *** | ||
| 7th Income Decile | 0.549 *** | 0.472 *** | 0.425 *** | ||
| 8th Income Decile | 1.955 *** | 1.195 *** | 1.759 *** | ||
| 9th Income Decile | 4.431 *** | 3.2 *** | 2.855 *** | ||
| 10th Income Decile | 7.67 *** | 5.984 *** | 5.684 *** | ||
| No Independent Income | 6.065 *** | 5.464 *** | 5.219 *** | ||
| Age | 0.139 *** | 0.132 *** | 0.162 *** | ||
| Survey Wave (Ref.: 1992) | |||||
| 1999 | −2.281 *** | −1.104 *** | −1.002 *** | ||
| 2009 | 1.361 *** | 0.157 *** | 1.345 *** | ||
| R-square | 0.134 *** | 0.12 *** | 0.104 *** | ||
1 Excluded from figure. Notes: ISSP, own calculations. Result of bootstrapped OLS regressions from 1000 bootstrap samples each with 1000 cases. Bootstrapped coefficients displayed. Significance levels: * p < 0.05, ** p < 0.01, *** p < 0.001.
Table A10.
Bootstrapped OLS regression models to explain the perceived Gini by formative years (corresponding with Figure 6a).
Table A10.
Bootstrapped OLS regression models to explain the perceived Gini by formative years (corresponding with Figure 6a).
| DV: Perceived Gini | Model 1 (Formative Years in Socialism: No) | Model 2 (Formative Years in Socialism: Yes) |
|---|---|---|
| Intercept | 36.517 *** | 33.169 *** |
| Post-Socialist (Ref.: West) | 7.981 *** | 7.2 *** |
| Gender | 1.578 *** | 1.401 *** |
| Education (in Years) | −0.443 *** | −0.199 *** |
| Employed | 1.069 *** | 0.976 *** |
| Income (Ref.: 1st Decile) | ||
| 2nd Income Decile | 0.936 *** | 1.027 *** |
| 3rd Income Decile | 0.357 *** | 0.721 *** |
| 4th Income Decile | 0.759 *** | 0.925 *** |
| 5th Income Decile | −0.637 *** | −0.407 *** |
| 6th Income Decile | 2.881 *** | 1.566 *** |
| 7th Income Decile | −0.625 *** | 0.349 *** |
| 8th Income Decile | 0.229 *** | 0.636 *** |
| 9th Income Decile | 1.906 *** | 1.186 *** |
| 10th Income Decile | 2.967 *** | 1.927 *** |
| No Independent Income | 5.38 *** | 5.322 *** |
| Age | 0.148 *** | 0.152 *** |
| Survey Wave (Ref.: 1992) | ||
| 1999 | −3.873 *** | −2.095 *** |
| 2009 | 1.985 *** | 1.837 *** |
| R-square | 0.147 *** | 0.141 *** |
Notes: ISSP, own calculations. Result of bootstrapped OLS regressions from 1000 bootstrap samples each with 1000 cases. Bootstrapped coefficients displayed. Significance levels: * p < 0.05, ** p < 0.01, *** p < 0.001.
Table A11.
Bootstrapped OLS regression models to explain the perceived Gini by exposure rate (corresponding with Figure 6b).
Table A11.
Bootstrapped OLS regression models to explain the perceived Gini by exposure rate (corresponding with Figure 6b).
| DV: Perceived Gini | Model 1 (No Exposure) | Model 2 (1–25% Exposure) | Model 3 (26–50% Exposure) | Model 4 (51–75% Exposure) | Model 5 (76–100% Exposure) |
|---|---|---|---|---|---|
| Intercept | 36.891 *** | 36.786 *** | 37.171 *** | 36.617 *** | 32.873 *** |
| Post-Socialist (Ref.: West) | 2.958 *** | 5.84 *** | 6.906 *** | 8.189 *** | 7.286 *** |
| Gender | 1.715 *** | 1.532 *** | 1.592 *** | 1.645 *** | 1.356 *** |
| Education (in Years) | −0.508 *** | −0.501 *** | −0.478 *** | −0.335 *** | −0.297 *** |
| Employed | 1.035 *** | 1.074 *** | 0.656 *** | 0.912 *** | 1.401 *** |
| Income (Ref.: 1st Decile) | |||||
| 2nd Income Decile | 1.436 *** | 1.463 *** | 1.297 *** | 0.724 *** | 1.27 *** |
| 3rd Income Decile | 0.813 *** | 0.772 *** | 0.835 *** | 0.449 *** | 0.846 *** |
| 4th Income Decile | 1.531 *** | 1.499 *** | 1.355 *** | 1.185 *** | 0.8 *** |
| 5th Income Decile | −0.051 | 0.046 | −0.486 *** | −0.817 *** | −0.108 |
| 6th Income Decile | 3.247 *** | 3.456 *** | 3.18 *** | 2.046 *** | 1.931 *** |
| 7th Income Decile | −0.023 | −0.027 | −0.223 *** | −0.24 *** | 0.38 *** |
| 8th Income Decile | 0.859 *** | 0.882 *** | 0.761 *** | 0.124 | 0.732 *** |
| 9th Income Decile | 2.758 *** | 2.805 *** | 2.673 *** | 1.312 *** | 1.54 *** |
| 10th Income Decile | 3.893 *** | 3.994 *** | 3.378 *** | 2.31 *** | 2.644 *** |
| No Independent Income | 6.941 *** | 6.839 *** | 6.41 *** | 5.85 *** | 5.753 *** |
| Age | 0.141 *** | 0.143 *** | 0.139 *** | 0.122 *** | 0.173 *** |
| Survey Wave (Ref.: 1992) | |||||
| 1999 | −4.803 *** | −4.874 *** | −4.614 *** | −3.192 *** | −3.007 *** |
| 2009 | 2.598 *** | 2.51 *** | 2.299 *** | 1.143 *** | 2.715 *** |
| R-square | 0.150 | 0.151 | 0.162 | 0.157 *** | 0.133 *** |
Notes: ISSP, own calculations. Result of bootstrapped OLS regressions from 1000 bootstrap samples each with 1000 cases. Bootstrapped coefficients displayed. Significance levels: * p < 0.05, ** p < 0.01, *** p < 0.001.
Table A12.
Bootstrapped OLS regression models to explain the perceived Gini by exposure rate and formative years (corresponding with Figure 6c).
Table A12.
Bootstrapped OLS regression models to explain the perceived Gini by exposure rate and formative years (corresponding with Figure 6c).
| DV: Perceived Gini | Model 1 (No Formative Years and No Exposure) | Model 2 (No Formative Years and 1–25% Exposure) | Model 3 (No Formative Years and 26–50% Exposure) | Model 4 (No Formative Years and 51–75% Exposure) | Model 5 1 (No Formative Years and 76–100% Exposure) |
|---|---|---|---|---|---|
| Intercept | 36.996 *** | 36.928 *** | 37.296 *** | 36.712 *** | 37.068 *** |
| Post-Socialist (Ref.: West) | 2.907 *** | 5.831 *** | 6.843 *** | 13.68 *** | −0.923 *** |
| Gender | 1.69 *** | 1.598 *** | 1.629 *** | 1.718 *** | 1.7 *** |
| Education (in Years) | −0.52 *** | −0.516 *** | −0.489 *** | −0.499 *** | −0.515 *** |
| Employed | 1.042 *** | 1.031 *** | 0.785 *** | 1.199 *** | 1.048 *** |
| Income (Ref.: 1st Decile) | |||||
| 2nd Income Decile | 1.277 *** | 1.551 *** | 1.269 *** | 1.408 *** | 1.217 *** |
| 3rd Income Decile | 0.806 *** | 0.888 *** | 0.647 *** | 0.825 *** | 0.71 *** |
| 4th Income Decile | 1.553 *** | 1.579 *** | 1.177 *** | 1.448 *** | 1.396 *** |
| 5th Income Decile | −0.018 | 0.122 * | −0.459 *** | −0.177 ** | −0.119 |
| 6th Income Decile | 3.136 *** | 3.618 *** | 3.172 *** | 3.092 *** | 3.131 *** |
| 7th Income Decile | −0.019 | 0.095 | −0.218 *** | −0.034 | −0.089 |
| 8th Income Decile | 0.679 *** | 0.985 *** | 0.509 *** | 0.556 *** | 0.734 *** |
| 9th Income Decile | 2.744 *** | 2.819 *** | 2.441 *** | 2.543 *** | 2.659 *** |
| 10th Income Decile | 3.964 *** | 4.06 *** | 3.555 *** | 3.79 *** | 3.863 *** |
| No Independent Income | 6.944 *** | 6.949 *** | 6.475 *** | 6.835 *** | 6.956 *** |
| Age | 0.142 *** | 0.142 *** | 0.137 *** | 0.143 *** | 0.14 *** |
| Survey Wave (Ref.: 1992) | |||||
| 1999 | −4.793 *** | −4.891 *** | −4.569 *** | −4.837 *** | −4.819 *** |
| 2009 | 2.594 *** | 2.515 *** | 2.382 *** | 2.559 *** | 2.524 *** |
| R-square | 0.151 *** | 0.152 *** | 0.154 *** | 0.153 *** | 0.149 *** |
| DV: Perceived Gini | Model 7 (Formative Years and 26–50% Exposure) | Model 8 (Formative Years and 51–75% Exposure) | Model 9 (Formative Years and 76–100% Exposure) | ||
| Intercept | 37.015 *** | 36.417 *** | 32.978 *** | ||
| Post−Socialist (Ref.: West) | 6.611 *** | 7.734 *** | 7.433 *** | ||
| Gender | 1.601 *** | 1.626 *** | 1.331 *** | ||
| Education (in Years) | −0.508 *** | −0.346 *** | −0.3 *** | ||
| Employed | 0.906 *** | 0.856 *** | 1.32 *** | ||
| Income (Ref.: 1st Decile) | |||||
| 2nd Income Decile | 1.45 *** | 0.795 *** | 1.426 *** | ||
| 3rd Income Decile | 0.892 *** | 0.461 *** | 0.911 *** | ||
| 4th Income Decile | 1.588 *** | 1.379 *** | 0.914 *** | ||
| 5th Income Decile | −0.155 * | −0.767 *** | −0.022 | ||
| 6th Income Decile | 3.22 *** | 2.198 *** | 1.985 *** | ||
| 7th Income Decile | 0.104 | −0.121 | 0.562 *** | ||
| 8th Income Decile | 0.923 *** | 0.235 *** | 0.912 *** | ||
| 9th Income Decile | 3.115 *** | 1.564 *** | 1.717 *** | ||
| 10th Income Decile | 3.774 *** | 2.547 *** | 2.775 *** | ||
| No Independent Income | 6.884 *** | 6.078 *** | 6.038 *** | ||
| Age | 0.141 *** | 0.127 *** | 0.169 *** | ||
| Survey Wave (Ref.: 1992) | |||||
| 1999 | −4.836 *** | −3.398 *** | −3.071 *** | ||
| 2009 | 2.552 *** | 1.31 *** | 2.811 *** | ||
| R-square | 0.159 *** | 0.161 *** | 0.136 *** | ||
1 Excluded from figure. Notes: ISSP, own calculations. Result of bootstrapped OLS regressions from 1000 bootstrap samples each with 1000 cases. Bootstrapped coefficients displayed. Significance levels: * p < 0.05, ** p < 0.01, *** p < 0.001.
References
- Schwartz, S.H.; Bardi, A.; Bianchi, G. Value Adaptation to the Imposition and Collapse of Communist Regimes in East-Central Europe. In Political Psychology: Cultural and Crosscultural Foundations; Renshon, S.A., Duckitt, J., Eds.; Palgrave Macmillan: Basingstoke, UK, 2000; pp. 217–237. [Google Scholar]
- Kulin, J.; Meuleman, B. Human Values and Welfare State Supp.ort in Europe: An East-West Divide? Eur. Sociol. Rev. 2015, 31, 418–432. [Google Scholar] [CrossRef]
- Inglehart, R.F. East European Value Systems in Global Perspective. In Democracy and Political Culture in Eastern Europe; Klingemann, H.-D., Fuchs, D., Zielonka, J., Eds.; Routledge: London, UK; New York, NY, USA, 2008; pp. 67–84. [Google Scholar]
- Dallinger, U. Public Aupp.ort for Redistribution: What Explains Cross-national Differences? J. Eur. Soc. Policy 2010, 20, 333–349. [Google Scholar] [CrossRef]
- Furrer, O.; Egri, C.P.; Ralston, D.A.; Danis, W.M.; Reynaud, E.; Naoumova, I.; Molteni, M.; Starkus, A.; Darder, F.L.; Dabic, M.; et al. Attitudes toward Corporate Responsibilities in Western Europe and in Central and East Europe. Manag. Int. Rev. 2010, 50, 379–398. [Google Scholar] [CrossRef] [Green Version]
- Minkenberg, M. From Pariah to Policy-Maker? The Radical Right in Europe, West and East: Between Margin and Mainstream. J. Contemp. Eur. Stud. 2013, 21, 5–24. [Google Scholar] [CrossRef]
- Deaton, A. Income, Health, and Well-being around the World: Evidence from the Gallup World Poll. J. Econ. Perspect. 2008, 22, 53–72. [Google Scholar] [CrossRef] [PubMed]
- Eiroá Orosa, F.J. Psychosocial Wellbeing in the Central and Eastern European Transition: An Overview and Systematic Bibliographic Review. Int. J. Psychol. 2013, 48, 481–491. [Google Scholar] [CrossRef] [PubMed]
- Dratwa, J. How Values Come to Matter at the European Commission. Politique Européenne 2014, 45, 86–121. [Google Scholar] [CrossRef]
- Arts, W.; Gijsberts, M. After the Velvet Revolutions: Altered Life-Chances, Fragile Legitimacy, and Split-Consciousness in Post-Communist Eastern Europe. Soc. Justice Res. 1998, 11, 143–171. [Google Scholar] [CrossRef]
- Jha, C.; Panda, B. Individualism and Corruption: A Cross-Country Analysis. Econ. Pap. 2017, 36, 60–74. [Google Scholar] [CrossRef] [Green Version]
- Hadler, M. Why Do People Accept Different Ratios? A Multi-level Comparison of Thirty Countries. Acta Sociol. 2005, 48, 131–154. [Google Scholar] [CrossRef]
- Gijsberts, M. The Legitimation of Income Inequalities in State-Socialist and Market Societies. Acta Sociol. 2002, 45, 269–285. [Google Scholar] [CrossRef]
- Wegener, B.; Liebig, S. Is the “Inner Wall” Here to Stay? Justice Ideologies in Unified Germany. Soc. Justice Res. 2000, 13, 177–197. [Google Scholar] [CrossRef]
- Kelley, J.; Evans, M.D.R. The Legitimation of Inequality: Occupational Earnings in Nine Nations. Am. J. Sociol. 1993, 99, 75–125. [Google Scholar] [CrossRef]
- Kluegel, J.R.; Mason, D.; Wegener, B. The Legitimation of Capitalism in the Postcommunist Transition: Public Opinion about Market Justice. Eur. Sociol. Rev. 1999, 15, 251–283. [Google Scholar] [CrossRef]
- Ignácz, Z.S. Wage Distribution Fairness in Post-Socialist Countries: Situation and Socialization; Routledge: London, UK; New York, NY, USA, 2018. [Google Scholar]
- Maccoby, E.E. Historical Overview of Socialization: Research and Theory. In Handbook of Socialization: Theory and Research; Grusec, J.E., Hastings, P.D., Eds.; Guilford Press: New York, NY, USA, 2007; pp. 13–41. [Google Scholar]
- Kornai, J. From Socialism to Capitalism; Eight Essays; Central European University Press: Budapest, Hungary; New York, NY, USA, 2008. [Google Scholar]
- Janmaat, J.G. Subjective Inequality: A Review of International Comparative Studies on People’s Views about Inequality. Eur. J. Sociol. 2013, 54, 357–389. [Google Scholar] [CrossRef]
- Jasso, G.; Wegener, B. Methods for Empirical Justice Analysis: Part 1. Framework, Models, and Quantities. Soc. Justice Res. 1997, 10, 393–430. [Google Scholar] [CrossRef]
- Jasso, G. On the Justice of Earnings: A New Specification of the Justice Evaluation Function. Am. J. Sociol. 1978, 83, 1398–1419. [Google Scholar] [CrossRef]
- Verwiebe, R.; Wegener, B. Social Inequality and the Perceived Income Justice Gap. Soc. Justice Res. 2000, 13, 123–149. [Google Scholar] [CrossRef]
- Castillo, J.C. The Legitimacy of Economic Inequality. An Empirical App.roach to the Case of Chile; Dissertation.com: Boca Raton, FL, USA, 2011. [Google Scholar]
- Wegener, B. The Illusion of Distributive Justice. Eur. Sociol. Rev. 1987, 3, 1–13. [Google Scholar] [CrossRef]
- Evans, M.; Kelley, J.; Kolosi, T. Images of Class: Public Perceptions in Hungary and Australia. Am. Sociol. Rev. 1992, 461–482. [Google Scholar] [CrossRef]
- Wegener, B.; Liebig, S. Hierarchical and Social Closure Conceptions of Distributive Social Justice: A Comparison of East and West Germany. In Social Justice and Political Change: Public Opinion in Capitalist and Post-communist States; Kluegel, J.R., Mason, D.S., Wegener, B., Eds.; De Gruyter: New York, NY, USA, 1995; pp. 263–284. [Google Scholar]
- Kelley, J.; Zagorski, K. Economic Change and the Legitimation of Inequality: The Transition from Socialism to the Free Market in Central-East Europe. Res. Soc. Strat. Mobil. 2006, 22, 319–364. [Google Scholar] [CrossRef]
- Arts, W.A.; Halman, L. European Values at the Turn of the Millennium: An Introduction. In European Values at the Turn of the Millennium; Arts, W.A., Halman, L., Eds.; Brill: Boston, MA, USA, 2004; pp. 1–24. [Google Scholar]
- Offe, C. Inequality and the Labor Market: Theories, Opinions, Models, and Practices of Unequal Distribution and How They Can Be justified. Z. Arbeitsmarkt Forsch. 2010, 43, 39–52. [Google Scholar] [CrossRef]
- Wegener, B.; Steinman, S. Justice Psychophysics in the Real World: Comparing Income Justice and Income Satisfaction in East and West Germany. In Social Justice and Political Change: Public Opinion in Capitalist and Post-communist States; Kluegel, J.R., Mason, D.S., Wegener, B., Eds.; De Gruyter: New York, NY, USA, 1995; pp. 151–175. [Google Scholar]
- Inglehart, R.F. Modernization and Postmodernization. Cultural, Economic, and Political Change in 43 Societies; Princeton University Press: Princeton, NJ, USA, 1997. [Google Scholar]
- Wegener, B. Political Culture and Post-Communist Transition: A Social Justice Approach: Introduction. Soc. Justice Res. 2000, 13, 75–82. [Google Scholar] [CrossRef]
- Wegener, B. Belohnungs-und Prinzipiengerechtigkeit. Die zwei Welten der empirischen Gerechtigkeitsforschung [Reward Justice and Order Related Justice. The Two Worlds of Empirical Justice Research]; ISJP Working Papers No. 56; Humboldt University of Berlin, Institute of Social Sciences: Berlin, Germany, 1998. [Google Scholar]
- Offe, C. Varieties of Transition. The East European and East German Experience; Polity: Cambridge, UK, 1996. [Google Scholar]
- Ryder, N.B. The Cohort as a Concept of Social Change. Am. Sociol. Rev. 1965, 30, 843–861. [Google Scholar] [CrossRef] [PubMed]
- Homans, G.C. Social Behavior. Its Elementary Forms; Harcourt, Brace and World, Inc.: New York, NY, USA, 1961. [Google Scholar]
- Adams, J.S. Inequity in Social Change. In Advances in Experimental Social Psychology; Berkowitz, L., Ed.; Academic Press: New York, NY, USA, 1965; pp. 267–299. [Google Scholar]
- Lerner, M.J. The Belief in a Just World. A Fundamental Delusion; Plenum Press: New York, NY, USA, 1980. [Google Scholar]
- Lerner, M.J.; Lerner, S.C. The Justice Motive in Social Behavior. Adapting to Times of Scarcity; Lerner, M.J., Lerner, S.C., Eds.; Plenum Press: New York, NY, USA, 1981. [Google Scholar]
- Jost, J.T.; Banaji, M.R.; Nosek, B.A. A Decade of System Justification Theory: Accumulated Evidence of Conscious and Unconscious Bolstering of the Status Quo. Political Psychol. 2004, 25, 881–919. [Google Scholar] [CrossRef] [Green Version]
- Piaget, J. The Moral Judgment of the Child; Routeledge and Kegan Paul: London, UK, 1932. [Google Scholar]
- Kohlberg, L. The Development of Children’s Orientations toward a Moral Order. Vita Humana 1963, 6, 11–33. [Google Scholar] [CrossRef] [PubMed]
- Lerner, M.J. The Justice Motive: “Equity” and “Parity” among Children. J. Personal. Soc. Psychol. 1974, 29, 539–550. [Google Scholar] [CrossRef]
- Betz, T.; Kayser, L.B. Children and Society: Children’s Knowledge about Inequalities, Meritocracy, and the Interdependency of Academic Achievement, Poverty, and Wealth. Am. Behav. Sci. 2017, 61, 186–203. [Google Scholar] [CrossRef]
- Olson, K.R.; Dweck, C.S.; Spelke, E.; Banaji, M. Children’s Response to Group-Based Inequalities: Perpetuation and Rectification. Soc. Cogn. 2011, 29, 270–287. [Google Scholar] [CrossRef] [PubMed] [Green Version]
- Saar, E. Different Cohorts and Evaluation of Income Differences in Estonia. Int. Sociol. 2008, 23, 417–445. [Google Scholar] [CrossRef]
- Alesina, A.; Fuchs-Schündeln, N. Good-Bye Lenin (or Not?): The Effect of Communism on People’s Preferences. Am. Econ. Rev. 2007, 97, 1507–1528. [Google Scholar] [CrossRef] [Green Version]
- Pop-Eleches, G.; Tucker, J. Communist Socialization and Post-Communist Economic and Political Attitudes. Elect. Stud. 2014, 33, 77–89. [Google Scholar] [CrossRef]
- Abramson, P.R.; Inglehart, R.F. Generational Replacement and Value Change in Eight West European Societies. Br. J. Political Sci. 1992, 22, 183–228. [Google Scholar] [CrossRef]
- Inglehart, R.F. Changing Values among Western Publics from 1970 to 2006. West Eur. Politics 2008, 31, 130–146. [Google Scholar] [CrossRef]
- Mishler, W.; Rose, R. Generation, Age, and Time: The Dynamics of Political Learning during Russia’s Transformation. Am. J. Political Sci. 2007, 51, 822–834. [Google Scholar] [CrossRef]
- De Neve, J.-E. Personality, Childhood Experience, and Political Ideology. Political Psychol. 2015, 36, 55–73. [Google Scholar] [CrossRef]
- Döring, A.K.; Schwartz, S.H.; Cieciuch, J.; Groenen, P.J.F.; Glatzel, V.; Harasimczuk, J.; Janowicz, N.; Nyagolova, M.; Scheefer, E.R.; Allritz, M.; et al. Cross-Cultural Evidence of Value Structures and Priorities in Childhood. Br. J. Psychol. 2015, 106, 675–699. [Google Scholar] [CrossRef] [PubMed]
- Mijs, J.J.B. Inequality Is a Problem of Inference. How People Solve the Social Puzzle of Unequal Outcomes. SocArXiv 2018. Available online: https://osf.io/preprints/socarxiv/brzu7/ (accessed on 26 June 2018). [CrossRef]
- Mühleck, K.; Reffi, R.; Wegener, B. Stability and Selectivity in the Measurement of Reward and Order Related Justice Beliefs; ISJP Working Paper No. 100; Humboldt University of Berlin, Institute of Social Sciences: Berlin, Germany, 2004. [Google Scholar]
- Kohli, M. Ungleichheit, Konflikt und Integration: Anmerkungen zur Bedeutung des Generationskonzepts in der Soziologie [Inequality, Conflict and Integration. Comments on the Importance of the Generation Concept in Sociology]. In Generationen: Multidisziplinäre Perspektiven; Martin Kohli zum 65. Geburtstag [Generations. Multidisciplinary Persperctives; to Martin Kohli’s 65th Birthday], 1st ed.; Künemund, H., Szydlik, M., Eds.; VS Verlag für Sozialwissenschaften: Wiesbaden, Germany, 2009; pp. 229–236. [Google Scholar]
- Diewald, M.; Solga, H.; Goedicke, A. Old Assets, New Liabilities? How Did Individual Characteristics Contribute to Labor Market Success or Failure After 1989. In After the Fall of the Wall: Life Courses in the Transformation of East Germany; Diewald, M., Goedicke, A., Mayer, K.U., Eds.; Stanford University Press: Redwood City, CA, USA, 2006; pp. 65–88. [Google Scholar]
- ISSP Research Group. International Social Survey Programme: Social Inequality I-IV-ISSP 1987-1992-1999-2009; GESIS Data Archiv: Cologne, Germany, 2014. [Google Scholar]
- Haller, M.; Jowell, R.; Smith, T.W. The International Social Survey Programme, 1984–2009. Charting the Globe; Haller, M., Jowell, R., Smith, T.W., Eds.; Routledge: New York, NY, USA, 2009. [Google Scholar]
- Andersen, R.; Yaish, M. Public Opinion on Income Inequality in 20 Democracies. The Enduring Impact of Social Class and Economic Inequality; GINI Discussion Paper No. 48. 2012. Available online: http://gini-research.org/system/uploads/377/original/DP_48_-_Andersen_Yaish.pdf?1345039244 (accessed on 7 July 2017).
- World Bank. World Development Indicators: Washington DC. 2016. Available online: http://data.worldbank.org/data-catalog/world-development-indicators (accessed on 24 November 2016).
- Solt, F. The Standardized World Income Inequality Database. Soc. Sci. Q. 2016, 97, 1267–1281. [Google Scholar] [CrossRef]
- Brambor, T.; Clark, W.R.; Golder, M. Understanding Interaction Models: Improving Empirical Analyses. Political Anal. 2005, 14, 63–82. [Google Scholar] [CrossRef]
- Maas, C.J.M.; Hox, J.J. Sufficient Sample Sizes for Multilevel Modeling. Methodol. Eur. J. Res. Methods Behav. Soc. Sci. 2005, 1, 86–92. [Google Scholar] [CrossRef]
- IBM Corp. IBM SPSS Statistics for Windows; IBM Corp.: Armonk, NY, USA, 2011. [Google Scholar]
- R Core Team. R: A Language and Environment for Statistical Computing; R Foundation for Statistical Computing: Vienna, Austria, 2018. [Google Scholar]
- Glenn, N.D. Cohort Analysis, 2nd ed.; Sage Publications: Thousand Oaks, CA, USA, 2005. [Google Scholar]
- Seifert, W.; Rose, R. Lebensbedingungen und Politische Einstellungen im Transformationsprozess. Ostdeutschland und Osteuropa in Vergleich [Living Conditions and Political Attitudes in the Transformation Process. East Germany and Eastern Europe in Comparison]; Wissenschaftszentrum Berlin für Sozialforschung, Arbeitsgruppe Sozialberichterstattung: Berlin, Germany, 1996; pp. 94–104. [Google Scholar]
| 1 | In the current paper, post-socialist countries refer to the set of European countries, which underwent a political-economic transition in 1989. In contrast, Western countries had no socialist mono-party system prevailing in the second half of the 20th century. |
| 2 | Janmaat [20] refers to the same concepts, but with different terms (i.e., perceptions, beliefs, judgements). |
| 3 | For example, Verwiebe and Wegener [23] point out that directly after the transition, cultural aspects were more influential than structural ones in as post-socialist countries and as these countries gained distance from the transition, structural aspects become more relevant. Such a conclusion also aligns well with the findings of Kelley and Evans [15] and Kelley and Zagorski [28]. With data predominantly from around the transition, Kelley and Evans conclude that post-socialist countries are more egalitarian in their preferences for inequality and suggest that socialist legacy can account for such a tendency. After conducting analysis on a newer wave of data from 1999, Kelley and Zagorski note that post-socialist countries are a subject to preferences of higher inequality than in the West. They propose that the drastic change in regard to attitudes toward inequality is the result of the drastic shift in inequality themselves and they predict the convergence attitudes in the future. |
| 4 | Alternatively, if the adaptation theory previously plays a key role, post-socialists in general will prefer larger inequality than Westerners, but with varying degree depending on the degree of socialist socialism. |
| 5 | The International Social Survey Project (ISSP) is a cross-national initiative first implemented in 1984 [60]. Each year the focus is on one of several modules developed in the identical surveys across countries and the modules are rotated over the years. This study uses the “Social Inequality” module to infer whether socialization in a socialist regime influences how post-socialist countries differ from Western countries in attitudes toward income inequality. |
| 6 | In order to conduct an APC analysis, at least three waves are needed. |
| 7 | In previous research [10,12,15] income has played a significant role for all three concepts. Since personal income was available, I treated individuals without an own income as a separate category, and therefore the level of measurement is nominal. National deciles also allow direct comparisons for countries. |
| 8 | By making the post-socialist dummy a key indicator (coupled with the “survey year” needed to conduct an APC analysis) it is not possible to control for country fixed effects. |
| 9 | While the datastructure is ideal, the number of countries is insufficient for HLM models [65], and therefore this approach is abandoned |
| 10 | 1000 bootstraps samples, with 1000 cases per sample. |
| 11 | APC analysis is unique way of trying to assess whether the pattern observed in the dependent variable are the result of a period, age or cohort effect. At first glance, estimating cohort, age and period effects seem like an easy task. However, the actual estimation of these effects can be difficult, if the survey design chosen is not panel data, since different individuals are asked over the several time points. The most troublesome is when only one-time surveys are available and cohort, age and period effects completely overlap. Then someone belonging to a given birth cohort (or several) might give a certain answer, not only because they have similar values, way of life, or were socialized in similar context (cohort effect), but also because they are all the same age at the time of the survey (age effect) or that the current social structure and “era” effects their answers (period effect). Thus, the requirement for age-cohort-period analysis is to have data collected at two or more time points. However, in order to get clear and distinct tendencies, three or more time points are required. Given the limit of the current paper, the method of APC analysis cannot be discussed further. See Glenn [68] for an overview of possible approaches. |
| 12 | So, a such results are not relevant for the current research question, the analysis is available on request (in comparable format to the tables in Appendix D). |
Figure 1.
Overview of Differences in Justice Evaluations of Income Inequality between Post-socialist and Western Countries. Notes: ISSP, own calculations. Means with 95% confidence interval.
Figure 1.
Overview of Differences in Justice Evaluations of Income Inequality between Post-socialist and Western Countries. Notes: ISSP, own calculations. Means with 95% confidence interval.

Figure 2.
Value of (unstandardized) regression coefficients of “Post-socialist” country dummy for explaining justice evaluation of subjective Gini: (a) Respondents divided by their formative year; (b) Respondents divided by their exposure rate; (c) Respondents divided by their formative years and their exposure rate. Notes: ISSP, own calculations. Marginal effects with 95% confidence interval from bootstrapped OLS regressions. For corresponding models and analysis see Table A4, Table A5 and Table A6 in Appendix D.

Figure 3.
Overview of Differences in Preferences of Income Inequality between Post-socialist and Western Countries. Notes: ISSP, own calculations. Means with 95% confidence interval.
Figure 3.
Overview of Differences in Preferences of Income Inequality between Post-socialist and Western Countries. Notes: ISSP, own calculations. Means with 95% confidence interval.

Figure 4.
Value of (unstandardized) regression coefficients of “Post-socialist” country dummy for explaining preferred subjective Gini: (a) Respondents divided by their formative year; (b) Respondents divided by their exposure rate; (c) Respondents divided by their formative years and their exposure rate. Notes: ISSP, own calculations. Marginal effects with 95% confidence interval from bootstrapped OLS regressions. For corresponding models and analysis see Table A7, Table A8 and Table A9 in Appendix D.

Figure 5.
Overview of Differences in Perception of Income Inequality between Post-socialist and Western Countries. Notes: ISSP, own calculations. Means with 95% confidence interval.
Figure 5.
Overview of Differences in Perception of Income Inequality between Post-socialist and Western Countries. Notes: ISSP, own calculations. Means with 95% confidence interval.

Figure 6.
Value of (unstandardized) regression coefficients of “Post-socialist” country dummy for explaining perceived subjective Gini: (a) Respondents divided by their formative year; (b) Respondents divided by their exposure rate; (c) Respondents divided by their formative years and their exposure rate. Notes: ISSP, own calculations. Marginal effects with 95% confidence interval from bootstrapped OLS regressions. For corresponding models and analysis see Table A10, Table A11 and Table A12 in Appendix D.

Table 1.
Descriptive Table of Control Variables.
| Variable | Mean | SD | Min | Max |
|---|---|---|---|---|
| Female | 0.48 | --- | 0 | 1 |
| Years of Education | 12.06 | 3.05 | 0 | 40 |
| Employed | 0.65 | --- | 0 | 1 |
| Income—1st Decile (Ref.) | 0.07 | --- | 0 | 1 |
| Income—2nd Decile | 0.06 | --- | 0 | 1 |
| Income—3rd Decile | 0.07 | --- | 0 | 1 |
| Income—4th Decile | 0.05 | --- | 0 | 1 |
| Income—5th Decile | 0.09 | --- | 0 | 1 |
| Income—6th Decile | 0.07 | --- | 0 | 1 |
| Income—7th Decile | 0.12 | --- | 0 | 1 |
| Income—8th Decile | 0.10 | --- | 0 | 1 |
| Income—9th Decile | 0.11 | --- | 0 | 1 |
| Income—10th Decile | 0.11 | --- | 0 | 1 |
| Income—No Independent Income | 0.14 | --- | 0 | 1 |
| Age | 41.09 | 14.46 | 16 | 94 |
| ISSP 1992 | 0.37 | --- | 0 | 1 |
| ISSP 1999 | 0.28 | --- | 0 | 1 |
| ISSP 2009 | 0.34 | --- | 0 | 1 |
© 2018 by the author. Licensee MDPI, Basel, Switzerland. This article is an open access article distributed under the terms and conditions of the Creative Commons Attribution (CC BY) license (http://creativecommons.org/licenses/by/4.0/).
Share and Cite
MDPI and ACS Style
Ignácz, Z.S. The Remains of the Socialist Legacy: The Influence of Socialist Socialization on Attitudes toward Income Inequality. Societies 2018, 8, 62. https://doi.org/10.3390/soc8030062
AMA Style
Ignácz ZS. The Remains of the Socialist Legacy: The Influence of Socialist Socialization on Attitudes toward Income Inequality. Societies. 2018; 8(3):62. https://doi.org/10.3390/soc8030062
Chicago/Turabian StyleIgnácz, Zsófia S. 2018. "The Remains of the Socialist Legacy: The Influence of Socialist Socialization on Attitudes toward Income Inequality" Societies 8, no. 3: 62. https://doi.org/10.3390/soc8030062
Note that from the first issue of 2016, this journal uses article numbers instead of page numbers. See further details here.