Corrosion Behaviour of Mg98.5Nd1Zn0.5 (at. %) Alloy in Phosphate Buffered Saline Solution


1
Department of Diffraction, Institut Max von Laue-Paul Langevin, Avenue des Martyrs 71, 38000 Grenoble, France
2
Departamento de Física Metalúrgica, Centro Nacional de Investigaciones Metalúrgicas CENIM-CSIC, Av. Gregorio del Amo 8, 28040 Madrid, Spain
3
International Center for Numerical Methods in Engineering, CIMNE, UPC, 08034 Barcelona, Spain
*
Author to whom correspondence should be addressed.
Metals 2020, 10(1), 148; https://doi.org/10.3390/met10010148
Submission received: 11 December 2019
/
Revised: 27 December 2019
/
Accepted: 16 January 2020
/
Published: 19 January 2020
(This article belongs to the Special Issue Effect of Rare Earth Additions on the Microstructure, Mechanical Properties and Corrosion of Magnesium Alloys)
Abstract
:The corrosion behaviour of Mg98.5-Nd1-Zn0.5 (at. %) alloy was studied in phosphate buffered saline (PBS) solution to evaluate its degradation performance as a potential candidate for biomedical applications. The alloy, produced by casting and hot extrusion, consists of a fine-grained magnesium matrix with an average grain size of 3.8 μm embedding a high volume fraction of (Mg, Zn)12Nd precipitates. Hydrogen release tests revealed a stable low corrosion rate of 0.6 mm/year after 24 h of immersion. Electrochemical testing data proved good correlation with the data from hydrogen evolution, with the corrosion rate stabilizing below 1 mm/year.
1. Introduction
Magnesium and its alloys have potential applications as biomaterials due to their biocompatibility and degradation behaviour [1,2,3]. Furthermore, Mg and its alloys have a Young’s Modulus closer to that of cortical human bone than to that of other metallic biomaterials like stainless steel or titanium alloys. This restrained mismatch could be of assistance in overcoming the problematic aspects with respect to implant encapsulation. This might cause problems such as skeletal thickening and chronic inflammation, which could lead to premature loosening of implants. Major interest in magnesium alloys arises from their potential use as temporal implants turning unnecessary future surgeon operations. Thus, economic costs and pain for patients could be mitigated if temporal implants made from magnesium alloys could dissolve within the body at a controlled rate, which would allow bone regeneration and avoiding all drawbacks related to excessive hydrogen accumulation around the implanted region. A useful strategy for satisfying such requirements implies optimizing the composition and microstructure of the alloy. Magnesium alloys with yttrium and rare earth additions have attracted interest in recent years because of their enhanced mechanical/creep properties and weak texture (interesting for processing) [4,5,6]. The dominant corrosion mechanism in these alloys is microgalvanic corrosion through the coupling of the more noble second phases with the Mg matrix [7,8,9,10], which is suggested to be lowered when alloying elements are present in solid solution in the matrix. Compared with other alloying elements, neodymium has proved to be beneficial from the point of view of mechanical properties and corrosion response [11,12,13,14,15,16,17,18]. Magnesium alloys containing rare earth elements (RE), where neodymium or cerium constitute the main RE component have shown excellent results in in vivo applications [19,20,21,22,23,24]. Furthermore, the presence of zinc in solid solution in magnesium alloys has been demonstrated to improve corrosion behaviour by increasing their corrosion potential, which results in a decrease in the corrosion rate of binary Mg-Zn alloys when zinc content is about 4–6 wt. % [25,26,27,28]. In any case, the impurity level in magnesium alloys must be lowered below a critical value in order to attain acceptable corrosion behaviour [1,2,3]. Tolerances for iron, nickel and copper impurities in pure magnesium have been established to be 170, 5 and 1000 ppm, respectively [29]. Based on the preceding results, it is reasonable to assume the viability of alloys based on the Mg-Nd-Zn system as suitable materials for their use in biomedical applications. In the present work, the use of the extruded Mg98.5Nd1Zn0.5 (at. %) alloy, Mg94Nd5Zn1 in mass percentage, is proposed because a good combination of mechanical properties and corrosion resistance is expected. Thus, the aim of the present study is the evaluation of the corrosion behaviour in phosphate-buffered saline (PBS) solution of a new Mg-Nd-Zn alloy for biomedical applications.
2. Materials and Methods
The nominal composition of the studied alloy expressed in atomic percentage was Mg98.5Nd1 Zn0.5 (Mg94Nd5Zn in mass percentage), which will be referred to hereafter as EZ51. The processing route comprises the melting of Mg-22Nd% (wt. %) master alloy and high purity magnesium and zinc, for adjusting the composition of the alloy in an electric resistance furnace. The melt was casted in cylindrical steel moulds (42 mm in diameter). Resulting ingots were extruded at 350 °C using an extrusion ratio of 28:1, designated as EZ51-IM350. Experimental chemical composition from fluorescence spectrometry measurements in a Philips PW1404 3kW Rh cathode (Philips, Amsterdam, The Netherlands) confirmed impurity levels below the tolerance of the equipment: The composition of the alloy in weight percentage is Mg 93.95%, Zn 1.15%, Nd 4.85%, Ni < 10 ppm, Fe ≈ 172 ppm and Cu < 10 ppm.
Microstructure characterization was carried out by optical microscopy in an Olympus BX-51 microscope (Olympus, Tokyo, Japan) and scanning electron microscopy in Hitachi S-4800 equipment (Hitachi High-Technologies Corporation, Tokyo, Japan). For this characterization, sections along the extrusion direction were cut from extruded bars, polished with diamond paste down to 1 mm, colloidal silica suspension and final chemical etching with a solution of 0.5 g picric acid ((Sigma-Aldrich, St. Louis, MO, USA), 0.5 mL acetic acid ((Sigma-Aldrich, St. Louis, MO, USA), 1 mL water and 20 mL ethanol (Sigma-Aldrich, St. Louis, MO, USA). Quantitative image analysis was carried out to measure the volume fraction of second phases and grain size in the magnesium matrix after extrusion. For the volume fraction of second phases several backscattered electrons SEM images from the cast alloy were measured using Fiji Imaje J software [30] to get a good statistical measure of this fraction. The grain size was measured counting a minimum of 500 grains from Electron Backscattered Diffraction (EBSD) maps.
X-ray diffraction measurements (XRD) were performed in a Siemens D5000 diffractometer (Bruker AXS, Karlsruhe, Germany) with a horizontal goniometer using Cu-Kα radiation to identify phases presented in the as-cast alloy and after extrusion. Also filtered products from solution after corrosion testing were subjected to XRD (Co-Kα radiation) analysis.
Corrosion tests consisted of the measurement of hydrogen release through the immersion of the samples following ASTM-G31-71 (1999) with a ratio of 40 mL of solution per cm2 of exposed surface. Phosphate buffered saline (PBS) solution was chosen based on its buffer properties (pH is stable around 7.4 for restrained additions of ions) and on its similar concentration of ions as some of the human body fluids. It had a composition of 0.008 M sodium phosphate, 0.002 M potassium phosphate, 0.14 M sodium chloride, 0.0027 M potassium chloride. All corrosion tests in PBS medium have been conducted at 37 °C to simulate human body temperature conditions as well. Schemes for both set up and samples used for corrosion tests are depicted in Figure 1. Samples 7.5 mm in diameter and 3.5 mm thick were prepared from extrusion bars for hydrogen release tests. Surfaces exposed to the corrosion medium were polished with diamond paste down to 1 μm, while the base was sealed with lac to prevent there the occurrence of corrosion (see Figure 1a). The hydrogen released during corrosion process was gathered in a burette, as depicted in Figure 1b [31]. On the other hand, for electrochemical testing, bars about 6 cm long were used, with their exposed lateral surface restricted to 2 cm height by stretched tape. The electrochemical cell was configured with a reference electrode of Ag/AgCl, a counter electrode of graphite, and the sample as working electrode [32], as shown in Figure 1c,d. Measurements were taken in a Gill-AC Potentiostat-Galvanostat (ACM Instruments, Cark, UK). For polarization curves, linear polarization tests at 60 mV/min rate were carried out with an open circuit potential (OCP) of ±1000 mV, at initial conditions and after 48 h, with a different sample for each curve and time. Tafel slopes from anodic and cathodic branches were obtained at OCP ± 100 mV, giving the corrosion current density (icorr) at their intersection. The constant B for the present system metal/electrolyte was calculated using the Stern-Geary equation icorr = B/Rp, with B = βcβa/2.3 (βc + βa), with βc and βa being the slopes of the anodic and cathodic curves in a Tafel plot, and Rp being the polarization resistance.
Linear polarization control in direct current (DC) was measured at the same rate from OCP ± 5 mV in samples immersed for up to 96 h to monitor the evolution of the corrosion rate during the corrosion process. The measured Rp is considered to be the sum of Rp and RΩ, with Rp being the contribution of the alloy and RΩ the ohmic drop of the electrolyte. Also, electrochemical impedance spectroscopy (EIS) in alternating current (AC) was tested right after DC linear polarization control in the same samples, applying a sinusoidal signal of 10 mV amplitude with frequencies from 0.5 to 104 Hz. In this technique, the ohmic drop and the Rp are also obtained together, although their corresponding contributions can be isolated.
3. Results
3.1. Microstructural Characterization
The microstructure of the EZ51 cast alloy presents a dendritic structure formed during solidification of the melt (Figure 2a). A second phase is located within the interdendritic space, as pointed out in Figure 2b. The volume fraction of this second phase is 12.0 ± 0.4%. A fine dispersion is also resolved inside the α-Mg dendrites (Figure 2b). The XRD pattern (Cu-Kα radiation) of the as-cast alloy only reveals peaks due to Mg and Mg12Nd (see Figure 3), although Mg12Nd peaks are slightly shifted with respect to the standard angles. Such shifting could result from deviation from its stoichiometric composition, as deduced from Energy-dispersive X-ray Spectroscopy (EDS) microanalyses. Second phases are Mg-rich particles containing 5 and 7 at. % of zinc and neodymium, respectively, so most of the zinc is probably substituting magnesium atoms in the Mg12Nd lattice.
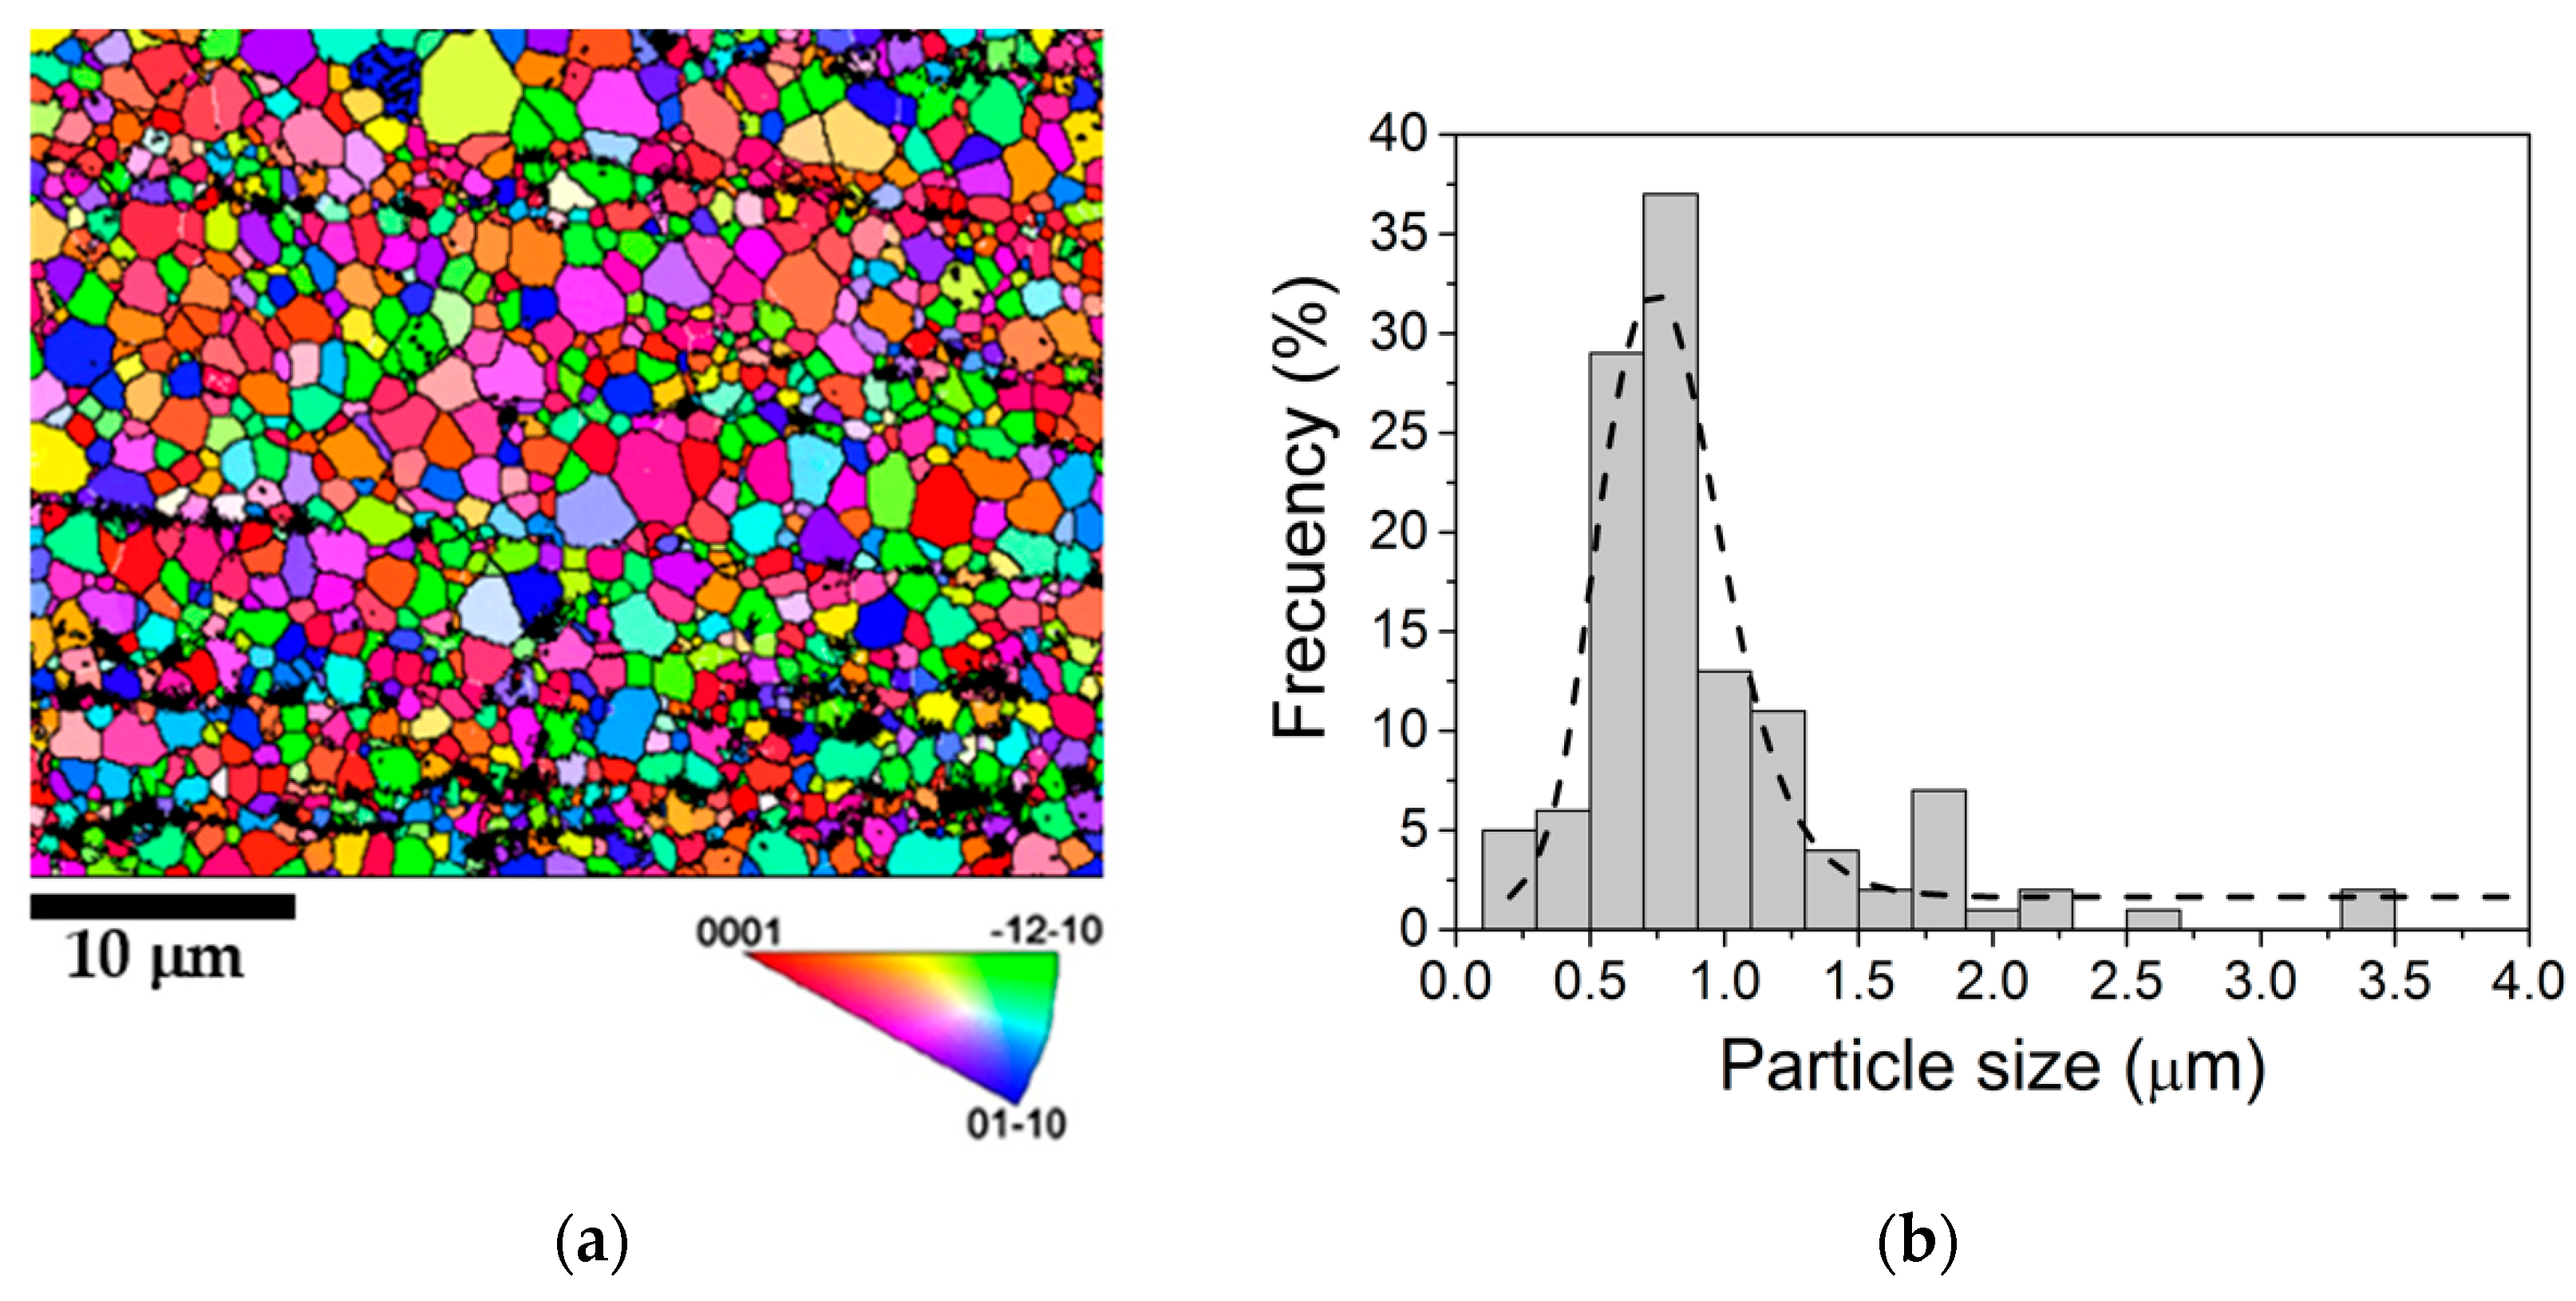
During extrusion, the interdendritic Mg12Nd phase is broken and distributed preferentially along the extrusion direction (Figure 2c,d). Figure 4a depicts the fully recrystallized microstructure of the extruded alloy with an average grain size of 3.8 μm. Figure 4b shows the particle size distribution of Mg12Nd phase, with an average value of 760 ± 16 nm. This microstructure renders a yield stress of 250 MPa, and ultimate tensile strength of 303 MPa and elongation to failure of 15%.
3.2. Corrosion Behaviour
3.2.1. Hydrogen Release
The hydrogen release study of EZ51-IM350 alloy in PBS is presented in Figure 5. The volume of released hydrogen shows a pronounced increment in the first 5 h of immersion, followed by a short plateau region up to 24 h, and then a constant increment until the end of the test after 144 h (see Figure 5a). The pH evolution in the PBS solution (Figure 5b) exhibits a steady increase from the initial value of 7.4 up to a maximum of 9.2 after 122 h of exposure, moment at which the value seems to slightly decrease or stabilize. Corrosion rates were calculated assuming that all hydrogen gas is the result of Mg corrosion according to reaction Mg (s) + 2H2O (1) → Mg2+ + 2OH− + H2 (g). Thus, the volume of hydrogen released can be converted into the mass loss rate (M given as mg/cm2/d), assuming hydrogen as an ideal gas (density ρH2 = 0.082 g/L at 25 °C) and density of the alloys ρalloy = 1.86 g/cm3. Subsequent conversion from mass loss rate (mg/cm2/d) to average corrosion rate (mm/y), assuming uniform attack, can be calculated by using P = 3.65 ∆M/ρalloy [33]. The calculated accumulated mass-loss in Figure 5c follows the same trend as the hydrogen release data, with an accumulated value at the end of the test of 0.002 g/cm2. The corrosion rate (Figure 5d) experiences a progressive increment of up to 1.5 mm/y in the first 5 h of immersion, but decreasing to 0.3 mm/y, coinciding with the plateau at 24 h observed in Figure 5a. Thereafter, the steady increment in hydrogen release stabilizes the corrosion rate at 0.6 mm/year.
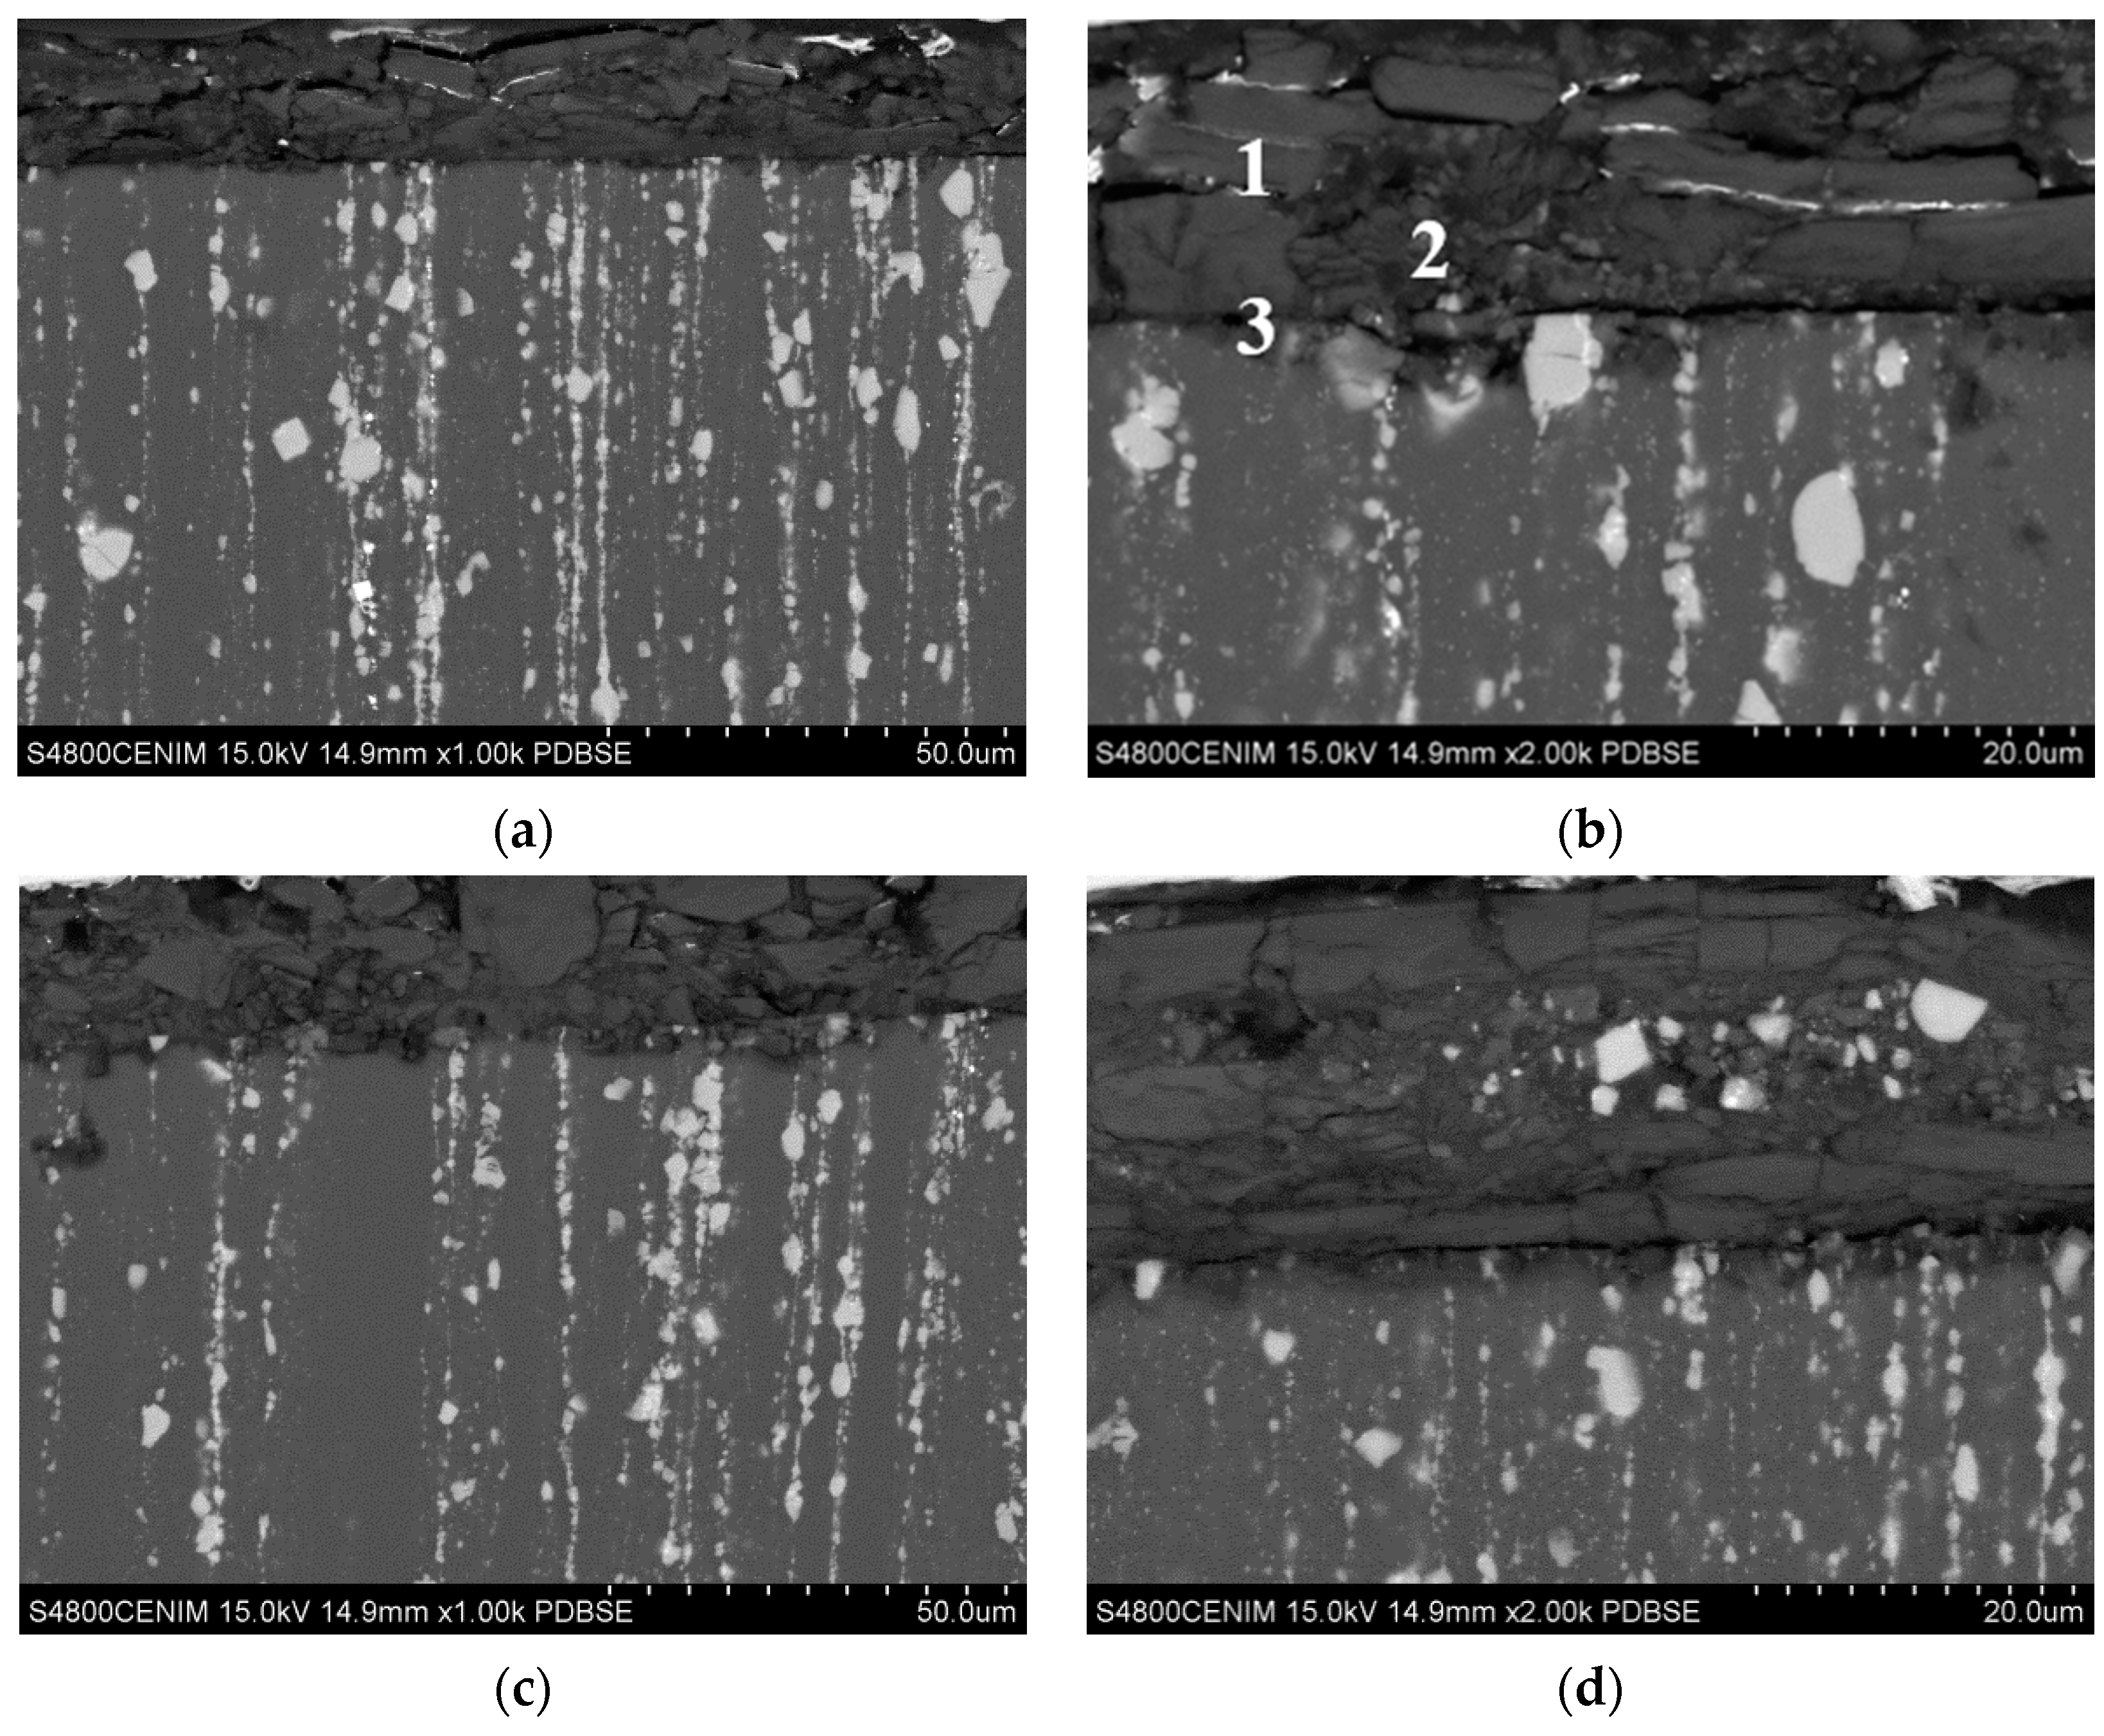
Corrosion products after immersion of EZ51-IM350 in PBS for 144 h were identified by XRD in Figure 6 as Mg(OH)2 and magnesium phosphates. In those phosphates, part of the magnesium was able to be replaced by sodium and potassium. The morphology of corrosion products formed on the surface of EZ51-IM350 alloy was examined after immersions for 48 h (Figure 7a,b) and 144 h (Figure 7c,d). Dense deposits of corrosion products are found over the whole exposed surface, with a stochastic deposition of long phosphorous-rich flakes on the top and an inner layer of Mg(OH)2, the latter of which are only visible after 48 h of immersion (Figure 7b). The thickness of the phosphate layer tends to thicken in the course of the corrosion since the Mg(OH)2 layer underlying long phosphate flakes was not visible after 144 h of immersion (see Figure 7c). Cross-sections of immersed EZ51-IM350 samples reveal a uniform scale of corrosion products, almost parallel to the initial exposed surface during the first 48 h of immersion (see Figure 8a). EDS analyses, taken at different points across the thickness of the corrosion scale in Figure 8b, proved minimal changes in its composition (see Table 1). The scale was enriched in phosphorous and magnesium with minor amounts of sodium and potassium (balance oxygen). This is in good agreement with the phases identified by XRD after 144 h of corrosion, confirming that after 48 h of immersion, the corrosion scale was already constituted by magnesium phosphates containing small concentrations of sodium and potassium. The development of a thin film of corrosion products growing into the metal substrate, with different morphology than that observed for phosphates, was noticed in some regions concentrating a large amount of second-phase particles. There, the continuity of the phosphate layer was broken by the formation of new oxide/hydroxide, as seen in Figure 8b. The thickness of the corrosion scale hardly increases with longer immersion periods for the sample exposed for 144 h (Figure 8c). The scale is mostly composed of phosphate flakes, although some non-corroded second phases are sandwiched among outward and inward phosphate flakes (Figure 8d).
3.2.2. Electrochemical Characterization
Linear polarization tests were measured for EZ51-IM350 alloy. From these curves, the corrosion rate of the alloy in the course of the corrosion process was determined by Tafel extrapolation. It has been reported that evaluation of the corrosion rate by Tafel extrapolation from polarization curves in Mg alloys deviates largely from the corrosion rate calculated using other procedures such weight loss or hydrogen evolution. Such discrepancies are usually attributed to determination of polarization curves in samples immediately after their immersion, i.e., far from the steady state corrosion [33]. Thus, in the present study, Tafel extrapolation was carried out in the sample immersed for 48 h, i.e., once the steady state was attained, as confirmed in Figure 5d. For comparison, Tafel extrapolation was also applied in the case of freshly prepared specimens immediately after immersion in the PBS solution. Their corresponding polarization curves and Tafel extrapolations are shown in Figure 9 while the parameters measured/calculated from these curves are presented in Table 2. No linear behaviour is observed in the Tafel range in cathodic branches while asymptotic tendency is found in anodic branches from 4.6 mA/cm2, likely related to concentration control. The increase in linear polarization resistance from 82 Ω·cm2 (82 Ω·cm2) for the freshly prepared specimen to 877 Ω*·cm2 for the alloy immersed for 48 h evidence the protective nature of the corrosion scale formed in the PBS solution. Furthermore, the analysis of corrosion current densities from intersection of cathodic and anodic Tafel slopes clearly manifests such protection. Thus, the corrosion rate lessens from 7.1 mm/y for the freshly prepared specimen to 2.5 mm/y for the sample immersed 48 h (it is assumed that 1 mA/cm2 corresponds to 22.84 mm/year [34]). The corrosion rate can be also calculated for different immersion times using the well-known Stern-Geary equation [35]. The corresponding Rp values were measured previous to the linear polarization tests (see Figure 10). Measurements of OCP and DC linear polarization (Rp + RΩ) of the EZ51-IM350 alloy with immersion time are displayed in Figure 10. The initial OCP value of −1467 mV is kept mainly constant over the entire exposure, although a slight decrease between 24 and 48 h is noticed (see Figure 10a). A similar trend was found regarding the evolution of linear polarization (Figure 10b); a remarkable increment until 24 h of immersion is followed by a slight decrease and stabilization around 900 Ω·cm2. Once Rp is known, taken the value of B in the stationary state as 45 mV (see Table 2), the variation of the corrosion current density during the corrosion process can be determined, as presented in Figure 10b. The current density drops from values close to 1 mA/cm2 during the initial stage of corrosion to values below 0.1 mA/cm2 once the steady state is reached, which is indicative of the protection conferred by the corrosion scale developed there.
To gain more insight into the corrosion processes and the need to isolate the ohmic drop contribution due to the electrolyte from the polarization resistance provided by the corrosion scale, electrochemical impedance spectroscopy measurements (EIS) in AC were carried out (Figure 11). The Nyquist diagram from Figure 11a shows closed semicircles indicating a single time constant for the range of frequencies measured, with increasing diameters (and so Rp) as the immersion time increases up to 24 h. For longer times, the impedance diameter decreases, so the protective nature of the corrosion scale is partially lost. This decrease is probably related to the local attack observed at the scale/metal interface, in regions where the second phases are concentrated (see Figure 8b). In the corresponding Bode diagram, contributions to global resistance can be distinguished: the contribution of the material Rp is resolved at low frequencies with a maximum around 1400 Ω·cm2 at 24 h, while the ohmic drop RΩ shows up at high frequencies with values around 50 Ω·cm2 (Figure 11b). The Bode diagram for the angle (Figure 11c) confirms the presence of a single time constant within the measured frequency range. Taking this into account, the Nyquist curves can be fitted to an equivalent circuit of Randles (Table 3), showing a notable increment in the modulus of Rp after 24 h of immersion, which is in good agreement with the linear polarization measurements. Figure 11d presents the comparative of calculated icorr from both electrochemical techniques of linear polarization and EIS, disclosing the same tendency but they are slightly overestimated in DC measures for immersion times up to 72 h, becoming very similar for longer exposure tests. The capacitance values indicate that the process is related to the double layer, and therefore that faradaic corrosion was being measured at that time constant.
4. Discussion
4.1. Microstructure
The microstructure of the EZ51 alloy is characterized by the presence of the Mg12Nd intermetallic phase. This phase has been previously observed by Zhang et al. for Mg-Nd-Zn-Zr alloys [11,14,25], where neodymium additions combined with extrusion processing were demonstrated to refine grain size and increase mechanical and corrosion response. However, particles in EZ51-IM350 also contains 5 at. % of Zn, which is in good agreement with partial replacement of magnesium atoms by zinc atoms in the lattice of Mg12Nd, as experimentally found for other intermetallic compounds formed in magnesium alloys [36,37].
4.2. Evaluation of Corrosion Rate
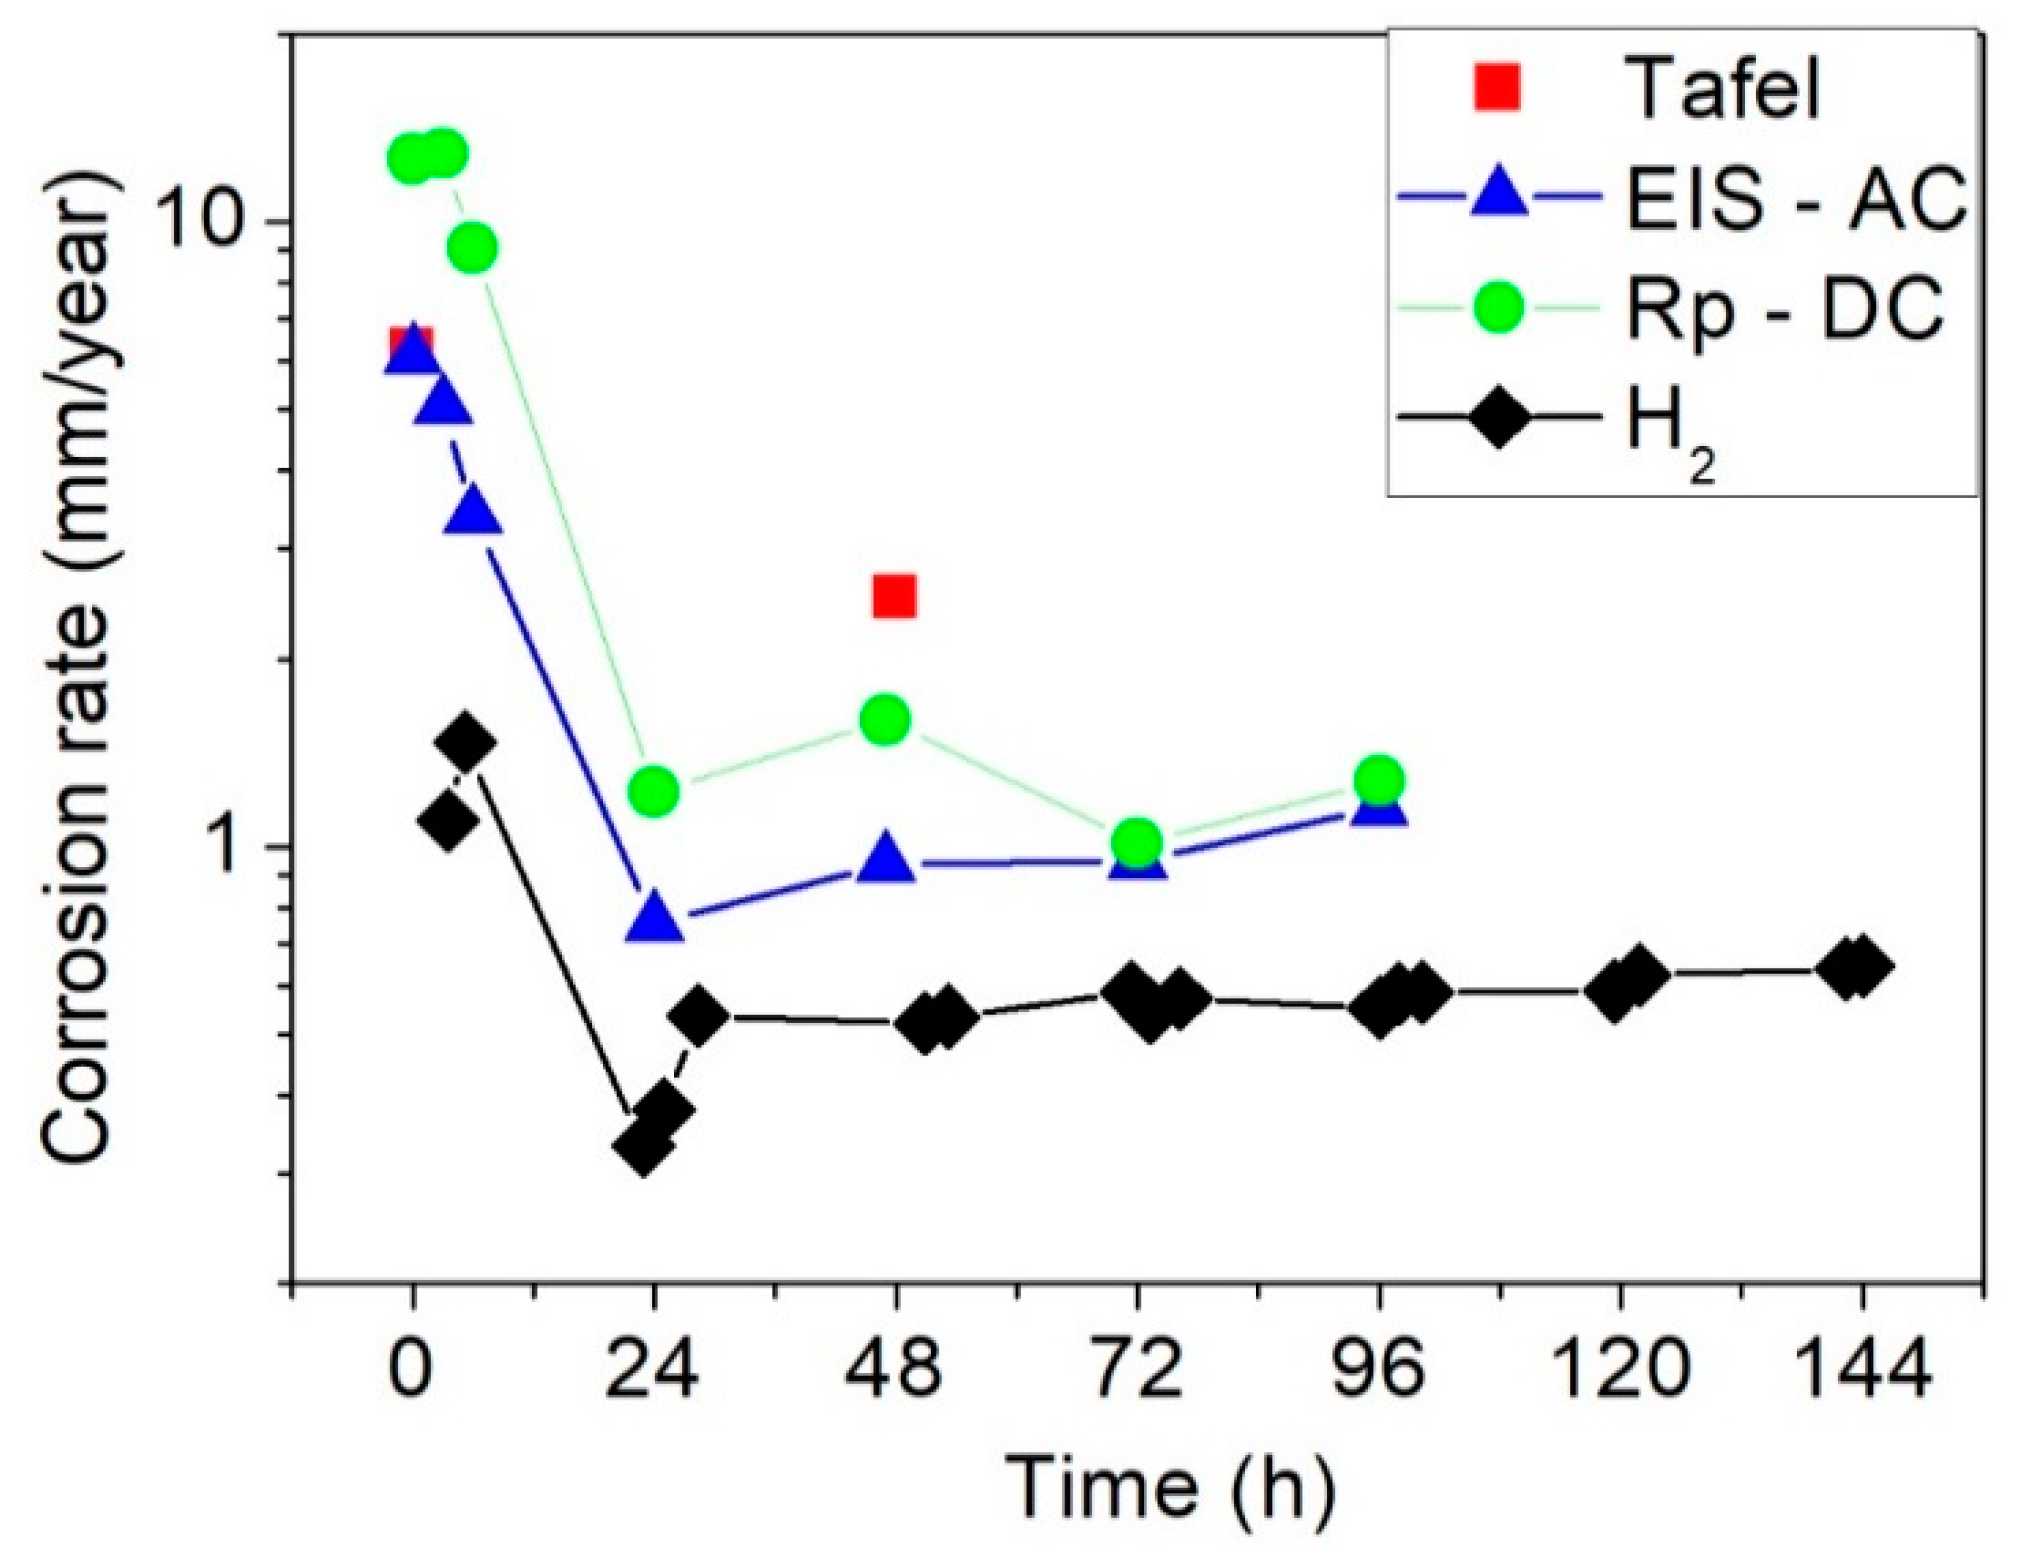
Different experimental techniques have been applied for the study of the corrosion behaviour of Mg alloys [8,33,38], reporting some controversy between the characterization by electrochemical techniques and that obtained from hydrogen release [7,8,33,38]. For the present EZ51-IM350 alloy, there is certain scatter between the corrosion rates calculated by electrochemical techniques with those calculated from hydrogen release tests, which are minimized when the corrosion rate is evaluated in the steady state, i.e., for immersion times longer than 24 h, as shown in Figure 12. Such discrepancies are within the range, even becoming lower, than those reported for other magnesium alloys in which differences in the corrosion rate of several tens of mm/y have been reported [33].
These differences could probably arise from the fact that hydrogen release tests give an accumulated corrosion rate while polarization resistance and EIS measurements give instantaneous rates. In any case, there is a reasonable agreement with a difference of 2 mm/y between the maximum corrosion rate evaluated by Tafel extrapolation and the minimum rate determined by hydrogen evolution tests. Furthermore, differences are below 1 mm/y when compared with the corrosion rates evaluated by EIS or DC linear polarization techniques. Among the corrosion rates calculated by electrochemical measurements, the values determined by EIS measurements are slightly shifted to lower values compared with those obtained from DC linear polarization tests because the ohmic resistance contribution is included within the Rp calculated by DC linear polarization tests. It could be thought that such mismatch could also arise from the different specimen orientation used in EIS measurements (longitudinal sample) compared with transversal sections used in DC linear polarization and hydrogen release tests. It has been proved that the corrosion rate of extruded magnesium alloys containing long arrangements of second phases depends on their orientation, with the corrosion rate being much higher in longitudinal specimens than for transversal samples [39]. The corrosion rates measured by EIS and hydrogen release tests for the EZ51-IM350 alloy in the steady state are 0.95 and 0.55 mm/year, respectively for the samples immersed for 48 h, so it is reasonable to assume the effect of specimen orientation on the corrosion rate, although high fragmentation of second phases could account for the small difference measured in the corrosion rates calculated from EIS and hydrogen release tests. Although the difference is somewhat higher in the case of the corrosion rates determined by Tafel extrapolation or DC linear polarization tests, 2.5 and 1.6 mm/year, respectively, it is widely accepted the high uncertainty introduced for the determination of the corrosion rate for the procedures/approaches based on the Tafel approximation method [8,33]. In any case, the corrosion rate is similar to that reported for other Mg-Zn-RE-(Y) alloys corroded also in biological media [10,40,41,42].
4.3. Corrosion Mechanism
It is well established that the Mg(OH)2 corrosion scale generated during the initial stages of corrosion in magnesium provides certain degree of protection to the magnesium substrate. However, the presence of chlorides in the aggressive medium has an enormous deleterious effect because they promote pitting in the corrosion deposit, by dissolving the Mg(OH)2 scale through the formation of the soluble product MgCl2 according to the reaction Mg(OH)2 + 2Cl− → MgCl2 + 2 OH−. All these reactions result in an increase in the concentration of magnesium dissolved in the PBS solution which is accompanied by an increase in pH in such a way that magnesium-rich phosphates can deposit on the surface of the corrosion scale.
The protectiveness conferred by the Mg(OH)2 combined with the phosphate layer in EZ51-IM350 alloy is confirmed by hydrogen release tests and electrochemical measurements. The corrosion rate is kept at low values for this high-alloyed magnesium alloy, with a maximum of 1.5 mm/year after 5 h of immersion (Figure 5d). According to EIS data, the polarization resistance rises slightly for increasing immersion times, from 203 to 305 Ω·cm2 for 3 and 6 h of immersion, respectively. A similar value of about 300 Ω·cm2 was obtained by DC linear polarization, once the ohmic drop term (calculated from EIS measurements) was removed from the linear polarization value. This indicates that the corrosion scale becomes progressively more protective as the corrosion proceeds, as a consequence of the thickening of a near-defect-free scale. It is interesting to note that for longer immersion times the polarization resistance rises to very high values, about 900–1000 Ωcm2, coinciding with a minimum value of the corrosion rate at 24 h. This decrease in the corrosion rate seems to be associated with compositional changes in the scale rather than inherent shielding of the Mg(OH)2 layer. The surface and cross-sectional views suggested that phosphate deposits over the Mg(OH)2 layer account for further decrease in the corrosion rate. These phosphates could act directly as a physical barrier preventing direct contact of the solution with the metallic substrate and sealing any defect or crack existing in the hydroxide layer [39]. The result was a remarkable decrease of the corrosion rate in the course of the corrosion. For times longer than 24 h, the corrosion rate stabilizes at a somewhat higher value. This is in agreement with the progressive decrease in the polarization resistance for longer immersion times. Cross-sectional views evidence the growth of new hydroxide at local points. The increase in volume associated with the new hydroxide impairs the phosphate layer. Similar corrosion rates have been also reported during corrosion of other Mg-Zn-RE-(Y) alloys in PBS medium [10,40,42]. Nevertheless, the corrosion rate of Mg-Zn-RE-(Y) alloys increases gradually with increasing the immersion time, while it stabilizes in the present case of EZ51 alloy. Such a difference could be related to the development of pits due to local cracking of the scale as result of large growth stresses in the corrosion scale. Moreover, the magnitude of pitting became gradually higher with increasing immersion time. In comparison, new hydroxide growing at the scale/metal interface does not imply overall pit formation in EZ51-IM350. Cross-sections reveal a certain self-healing ability of the alloy to form a phosphate layer at the scale alloy interface in the regions at which a new hydroxide was previously formed. This could be verified by the presence of a hydroxide layer embedding second phases of the alloy between two phosphate-rich layers (Figure 8d). Therefore, coarsening of hydroxide found in Mg-Zn-RE alloys [43] is prevented, avoiding further impairment of the phosphate layer and further acceleration in the corrosion rate. This self-protection could arise as well from a decrease in the activity of microgalvanic cells by Mg-Nd second phases. Neodymium additions probably reduce, compared to other alloying elements, the microgalvanic coupling potential more effectively among the intermetallic second phases and the magnesium matrix [5,14,15].
5. Conclusions
The Mg98.5Nd1Zn0.5 extruded alloy immersed in PBS was investigated. The following conclusions can be drawn:
- The microstructure of the alloy consists of an equiaxed magnesium matrix embedding a high-volume fraction of Mg12Nd particles in the form of arrangements aligned along the extrusion direction. This microstructure renders higher strength and ductility than other Mg-Nd-Zn alloys containing lower zinc and neodymium concentrations.
- Hydrogen release tests and EIS measurements confirms low corrosion rates with values close to 1 mm/y in the steady state after 24 h of immersion. Corrosion rates determined by DC linear polarization tests is at least two times higher than those calculated from hydrogen release tests because of uncertainty for the calculation of Tafel slopes from anodic and cathodic branches.
- The corrosion rate of the EZ51 alloy is similar to that reported for other ternary Mg-Nd-Zn alloys containing lower volume fractions of second phases.
- The low corrosion rate is associated with deposition of dense continuous magnesium-rich phosphates over the Mg(OH)2 layer initially formed. Low corrosion rates allow the sealing of any defect/crack generated in the corrosion scale in the course of the corrosion process.
- Neodymium additions seem to reduce more effectively microgalvanic coupling potential among the intermetallic second phases and the magnesium matrix, as reported in commercial alloys modified with neodymium additions.
Author Contributions
Each author equally contributed to the development of the paper. Design and execution of corrosion tests and electrochemical measurements were carried out by S.C. and C.A., S.C., G.G. and P.A. carried out processing and microstructural characterization of the material. P.P.Z. contributed to characterization of corrosion scales. All the authors contributed to the writing of the manuscript. All authors have read and agreed to the published version of the manuscript.
Funding
This research was funded by Ministry of Economy and Competitively (MINECO) under project MAT2016-78850-R (CENIM).
Acknowledgments
The authors acknowledge the expert support of A. García and A. Tomás from the CENIM Microscopy Laboratory.
Conflicts of Interest
The authors declare no conflict of interest.
References
- Staiger, M.P.; Pietak, A.M.; Huadmai, J.; Dias, G. Magnesium and its alloys as orthopedic biomaterials: A review. Biomaterials 2006, 27, 1728–1734. [Google Scholar] [CrossRef]
- Witte, F.; Hort, N.; Vogt, C.; Cohen, S.; Kainer, K.U.; Willumeit, R.; Feyerabend, F. Degradable biomaterials based on magnesium corrosion. Curr. Opin. Solid State Mater. Sci. 2008, 12, 63–72. [Google Scholar] [CrossRef] [Green Version]
- Chen, J.; Tan, L.; Yu, X.; Etim, I.P.; Ibrahim, M.; Yang, K. Mechanical properties of magnesium alloys for medical application: A review. J. Mech. Behav. Biomed. Mater. 2018, 87, 68–79. [Google Scholar] [CrossRef]
- Willbold, E.; Gu, X.; Albert, D.; Kalla, K.; Bobe, K.; Brauneis, M.; Janning, C.; Nellesen, J.; Czayka, W.; Tillmann, W.; et al. Effect of the addition of low rare earth elements (lanthanum, neodymium, cerium) on the biodegradation and biocompatibility of magnesium. Acta Biomater. 2015, 11, 554–562. [Google Scholar] [CrossRef]
- Hort, N.; Huang, Y.; Fechner, D.; Störmer, M.; Blawert, C.; Witte, F.; Vogt, C.; Drücker, H.; Willumeit, R.; Kainer, K.U.; et al. Magnesium alloys as implant materials—Principles of property design for Mg-RE alloys. Acta Biomater. 2010, 6, 1714–1725. [Google Scholar] [CrossRef] [PubMed] [Green Version]
- Ben-Hamu, G.; Eliezer, D.; Shin, K.S.; Cohen, S. The relation between microstructure and corrosion behaviour of Mg–Y–RE–Zr alloys. J. Alloys Compd. 2007, 431, 269–276. [Google Scholar] [CrossRef]
- Song, G.L.; Atrens, A. Understanding magnesium corrosion—A framework for improved alloy performance. Adv. Eng. Mater. 2003, 5, 837–858. [Google Scholar] [CrossRef]
- Atrens, A.; Song, G.L.; Liu, M.; Shi, Z.; Cao, F.; Dargusch, M.S. Review of recent developments in the field of magnesium corrosion. Adv. Eng. Mater. 2015, 17, 400–453. [Google Scholar] [CrossRef]
- Gusieva, K.; Davies, C.H.J.; Scully, J.R.; Birbilis, N. Corrosion of magnesium alloys: The role of alloying. Int. Mater. Rev. 2015, 60, 169–194. [Google Scholar] [CrossRef]
- Pérez, P.; Onofre, E.; Cabeza, S.; Llorente, I.; del Valle, J.A.; García-Alonso, M.C.; Adeva, P.; Escudero, M.L. Corrosion behaviour of Mg–Zn–Y–Mischmetal alloys in phosphate buffer saline solution. Corros. Sci. 2013, 69, 226–235. [Google Scholar] [CrossRef] [Green Version]
- Zhang, J.; Wang, J.; Qiu, X.; Zhang, D.; Tian, Z.; Niu, X. Effect of Nd on the microstructure, mechanical properties and corrosion behaviour of die-cast Mg–4Al-based alloy. J. Alloys Compd. 2008, 464, 556–564. [Google Scholar] [CrossRef]
- Wang, B.; Guan, S.; Wang, J.; Wang, L.; Zhu, S. Effects of Nd on microstructures and properties of extruded Mg–2Zn–0.46Y–xNd alloys for stent application. Mater. Sci Eng. B Adv. 2011, 176, 1673–1678. [Google Scholar] [CrossRef]
- Mao, L.; Yuan, G.; Wang, S.; Niu, J.; Wu, G.; Ding, W. A novel biodegradable Mg–Nd–Zn–Zr alloy with uniform corrosion behaviour in artificial plasma. Mater. Lett. 2012, 88, 1–4. [Google Scholar] [CrossRef]
- Zhang, X.; Yuan, G.; Niu, J.; Fu, P.; Ding, W. Microstructure, mechanical properties, biocorrosion behaviour, and cytotoxicity of as-extruded Mg–Nd–Zn–Zr alloy with different extrusion ratios. J. Mech. Behav. Biomed. Mater. 2012, 9, 153–162. [Google Scholar] [CrossRef] [PubMed]
- Feyerabend, F.; Fischer, J.; Holtz, J.; Witte, F.; Willumeit, R.; Drücker, H.; Vogt, C.; Horn, N. Evaluation of short-term effects of rare earth and other elements used in magnesium alloys on primary cells and cell lines. Acta Biomater. 2010, 6, 1834–1842. [Google Scholar] [CrossRef] [PubMed] [Green Version]
- Nakatsugawa, I.; Kamado, S.; Kojima, Y.; Ninomiya, R.; Kubota, K. Corrosion of magnesium alloys containing rare earth elements. Corros. Rev. 1998, 16, 139–157. [Google Scholar] [CrossRef]
- Elkaiam, L.; Hakimi, O.; Goldman, J.; Aghion, E. The effect of Nd on mechanical properties and corrosion performance of biodegradable Mg-5%Zn alloy. Metals 2018, 8, 438. [Google Scholar] [CrossRef] [Green Version]
- Elkaiam, L.; Hakimi, O.; Yosafovich-Doitch, G.; Ovadia, S.; Aghion, E. In Vivo evaluation of Mg-5%Zn–2%Nd alloy as an innovative biodegradable implant material. Ann. Biomed. Eng. 2020, 48, 380–392. [Google Scholar] [CrossRef]
- Chen, C.; Chen, J.; Wu, W.; Shi, Y.; Jin, L.; Petrini, L.; Shen, L.; Yuan, G.; Ding, W.; Ge, J.; et al. In vivo and in vitro evaluation of a biodegradable magnesium vascular stent designed by shape optimization strategy. Biomaterials 2019, 221, 119414. [Google Scholar] [CrossRef]
- Kong, X.; Wang, L.; Li, G.; Qu, X.; Niu, J.; Tang, T.; Dai, K.; Yuan, G.; Hao, Y. Mg-based bone implants show promising osteoinductivity and controllable degradation: A long-term study in a goat femoral condyle fracture model. Mater. Sci. Eng. C 2018, 86, 42–47. [Google Scholar] [CrossRef]
- Zhang, J.; Li, H.; Wang, W.; Huang, H.; Pei, J.; Qu, H.; Yuan, G.; Li, Y. The degradation and transport mechanism of a Mg-Nd-Zn-Zr stent in rabbit common carotid artery: A 20-month study. Acta Biomater. 2018, 69, 372–384. [Google Scholar] [CrossRef]
- Liu, W.; Wang, J.; Jiang, G.; Guo, J.; Li, Q.; Li, B.; Wang, Q.; Cheng, M.; He, G.; Zhang, X. The improvement of corrosion resistance, biocompatibility and osteogenesis of the novel porous Mg-Nd-Zn alloy. J. Mater. Chem. B 2017, 5, 7661–7674. [Google Scholar] [CrossRef]
- Mao, L.; Zhou, H.; Chen, L.; Niu, J.; Zhang, L.; Yuan, G.; Song, C. Enhanced biocompatibility and long-term durability in vivo of Mg-Nd-Zn-Zr alloy for vascular stent application. J. Alloys Compd. 2017, 720, 245–253. [Google Scholar] [CrossRef]
- Niu, J.; Xiong, M.; Guan, X.; Zhang, J.; Huang, H.; Pei, J.; Yuan, G. The in vivo degradation and bone-implant interface of Mg-Nd-Zn-Zr alloy screws: 18 months post-operation results. Corros. Sci. 2016, 113, 183–187. [Google Scholar] [CrossRef]
- Nanda, I.P.; Hassim, M.H.; Idris, M.H.; Jahare, M.H.; Abdulmalik, S.S.; Arafat, A. Mechanical and degradation properties of zinc adopted magnesium alloys for biomedical application. In IOP Conference Series: Materials Science and Engineering; IOP Publishing: Bristol, UK, 2019; Volume 602, p. 012094. [Google Scholar]
- Bakhsheshi-Rad, H.R.; Hamzah, E.; Fereidouni-Lotfabadi, A.; Daroonparvar, M.; Yajid, M.A.M.; Mezbahul-Islam, M.; Kasiri-Asgarani, M.; Medraj, M. Microstructure and bio-corrosion behavior of Mg-Zn and Mg-Zn-Ca alloys for biomedical applications. Mater. Corros. 2014, 65, 1178–1187. [Google Scholar] [CrossRef]
- Cai, S.; Lei, T.; Li, N.; Feng, F. Effects of Zn on microstructure, mechanical properties and corrosion behavior of Mg-Zn alloys. Mater. Sci. Eng. C 2012, 32, 2570–2577. [Google Scholar] [CrossRef]
- Song, Y.; Han, E.H.; Shan, D.; Yim, C.D.; You, B.S. The effect of Zn concentration on the corrosion behavior of Mg–xZn alloys. Corros. Sci. 2012, 65, 322–330. [Google Scholar] [CrossRef]
- Makar, G.L.; Kruger, J. Corrosion of magnesium. Int. Mater. Rev. 1993, 38, 138–153. [Google Scholar] [CrossRef]
- Schindelin, J.; Arganda-Carreras, I.; Frise, E.; Kaynig, V.; Longair, M.; Pietzsch, T.; Preibisch, S.; Rueden, C.; Saalfeld, S.; Schmid, B.; et al. Fiji: An open-source platform for biological-image analysis. Nat. Methods 2012, 9, 676–682. [Google Scholar] [CrossRef] [Green Version]
- Song, G.; Atrens, A.; StJohn, D. An hydrogen evolution method for the estimation of the corrosion rate of magnesium alloys. In Proceedings of the Magnesium Technology TMS Symposium, New Orleans, LA, USA, 11–15 February 2001; pp. 255–262. [Google Scholar]
- Andrade, C.; Gónzalez, J.A. Quantitative measurements of corrosion rate of reinforcing steels embedded in concrete using polarization resistance measurements. Mater. Corros. 1978, 29, 515–519. [Google Scholar] [CrossRef]
- Shi, Z.; Liu, M.; Atrens, A. Measurement of the corrosion rate of magnesium alloys using Tafel extrapolation. Corros. Sci. 2010, 52, 579–588. [Google Scholar] [CrossRef]
- Jones, D.A. Principles and Prevention of Corrosion, 2nd ed.; Prentice Hall: Upper Saddle River, NJ, USA, 1996; pp. 76–77. [Google Scholar]
- Stern, M.; Geary, A.L. Electrochemical polarization I. A Theoretical analysis of the shape of polarization curves. J. Electrochem. Soc. 1957, 104, 56–63. [Google Scholar] [CrossRef]
- Pérez, P.; Garcés, G.; Maeso, M.; Adeva, P. Effect of Zn content on microstructure and mechanical properties of MgZnYLaMM alloys. Metall. Mater. Trans. A 2012, 43, 4383–4396. [Google Scholar] [CrossRef] [Green Version]
- Buzolin, R.H.; Mohedano, M.; Mendis, C.L.; Mingo, B.; Tolnai, D.; Blawert, C.; Kainer, K.U.; Pinto, H.; Hort, N. As cast microstructures on the mechanical and corrosion behaviour of ZK40 modified with Gd and Nd additions. Mater. Sci. Eng. A 2017, 682, 238–247. [Google Scholar] [CrossRef]
- Song, G.L.; Atrens, A. Recent insights into the mechanism of magnesium corrosion and research suggestions. Adv. Eng. Mater. 2007, 9, 177–183. [Google Scholar] [CrossRef]
- Pérez, P.; Cabeza, S.; Garcés, G.; Adeva, P. Influence of long period stacking ordered phase arrangements on the corrosion behaviour of extruded Mg97Y2Zn1 alloy. Corros. Sci. 2016, 107, 107–112. [Google Scholar] [CrossRef]
- Yao, H.; Wen, J.; Xiong, Y.; Liu, Y.; Lu, Y.; Cao, W. Microstructures, mechanical properties, and corrosion behavior of as-cast Mg–2.0Zn–0.5Zr–xGd (wt%) biodegradable alloys. Materials 2018, 11, 1564. [Google Scholar] [CrossRef] [Green Version]
- Cai, C.; Song, R.; Wang, L.; Li, J. Effect of anodic T phase on surface micro-galvanic corrosion of biodegradable Mg-Zn-Zr-Nd alloys. Appl. Surf. Sci. 2018, 462, 243–254. [Google Scholar] [CrossRef]
- Zhang, W.; Tan, L.; Ni, D.; Chen, J.; Zhao, Y.-C.; Liu, L.; Shuai, C.; Yang, K.; Atrens, A.; Zhao, M.-C. Effect of grain refinement and crystallographic texture produced by friction stir processing on the biodegradation behavior of a Mg-Nd-Zn alloy. J. Mater. Sci. Technol. 2019, 35, 777–783. [Google Scholar] [CrossRef]
- Cai, C.; Song, R.; Wang, L.; Li, J. Surface corrosion behavior and reaction product film deposition mechanism of Mg-Zn-Zr-Nd alloys during degradation process in Hank’s solution. Surf. Coat. Technol. 2018, 342, 57–68. [Google Scholar] [CrossRef]
Figure 1.
Scheme of hydrogen release set up, adapted from reference [31] (a–d) electrochemical cell, adapted from reference [32].

Figure 2.
Optical micrographs showing the microstructure of EZ51 alloy. (a,b) As-cast ingot, (c,d) extruded bar.
Figure 2.
Optical micrographs showing the microstructure of EZ51 alloy. (a,b) As-cast ingot, (c,d) extruded bar.
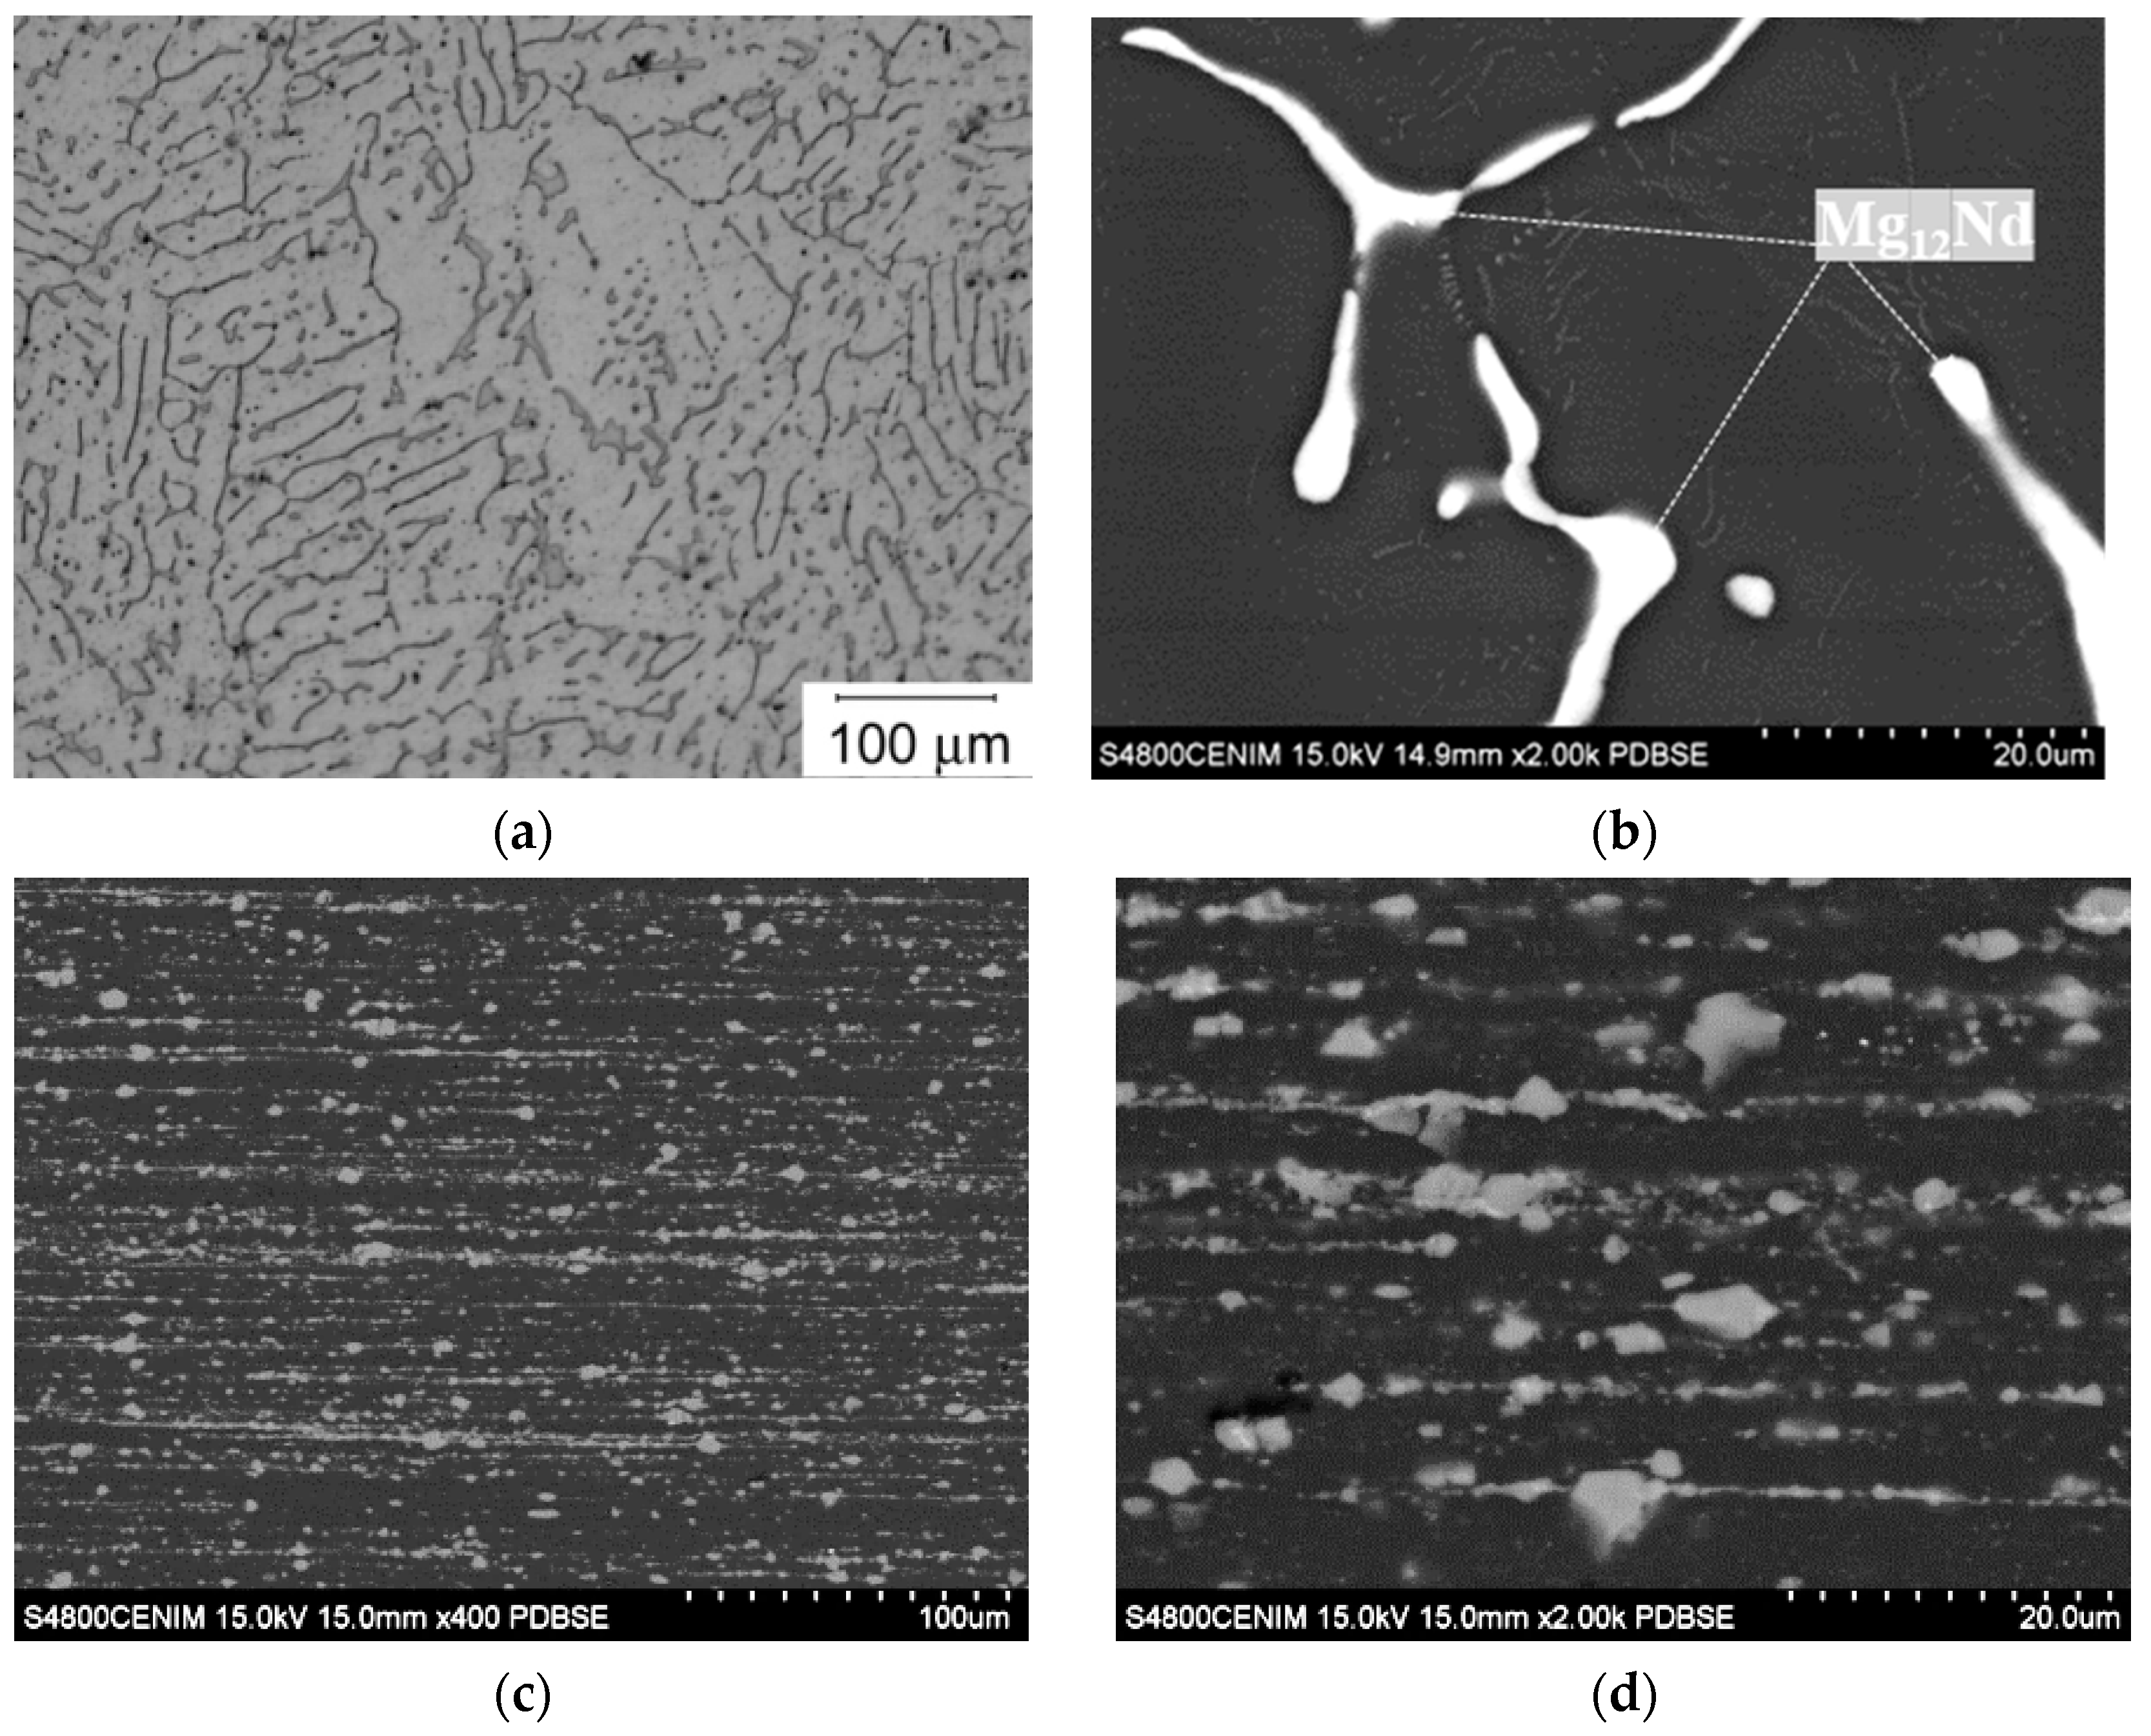
Figure 3.
XRD (X-ray diffraction) pattern of EZ51 as-cast ingot (Cu-Kα radiation).
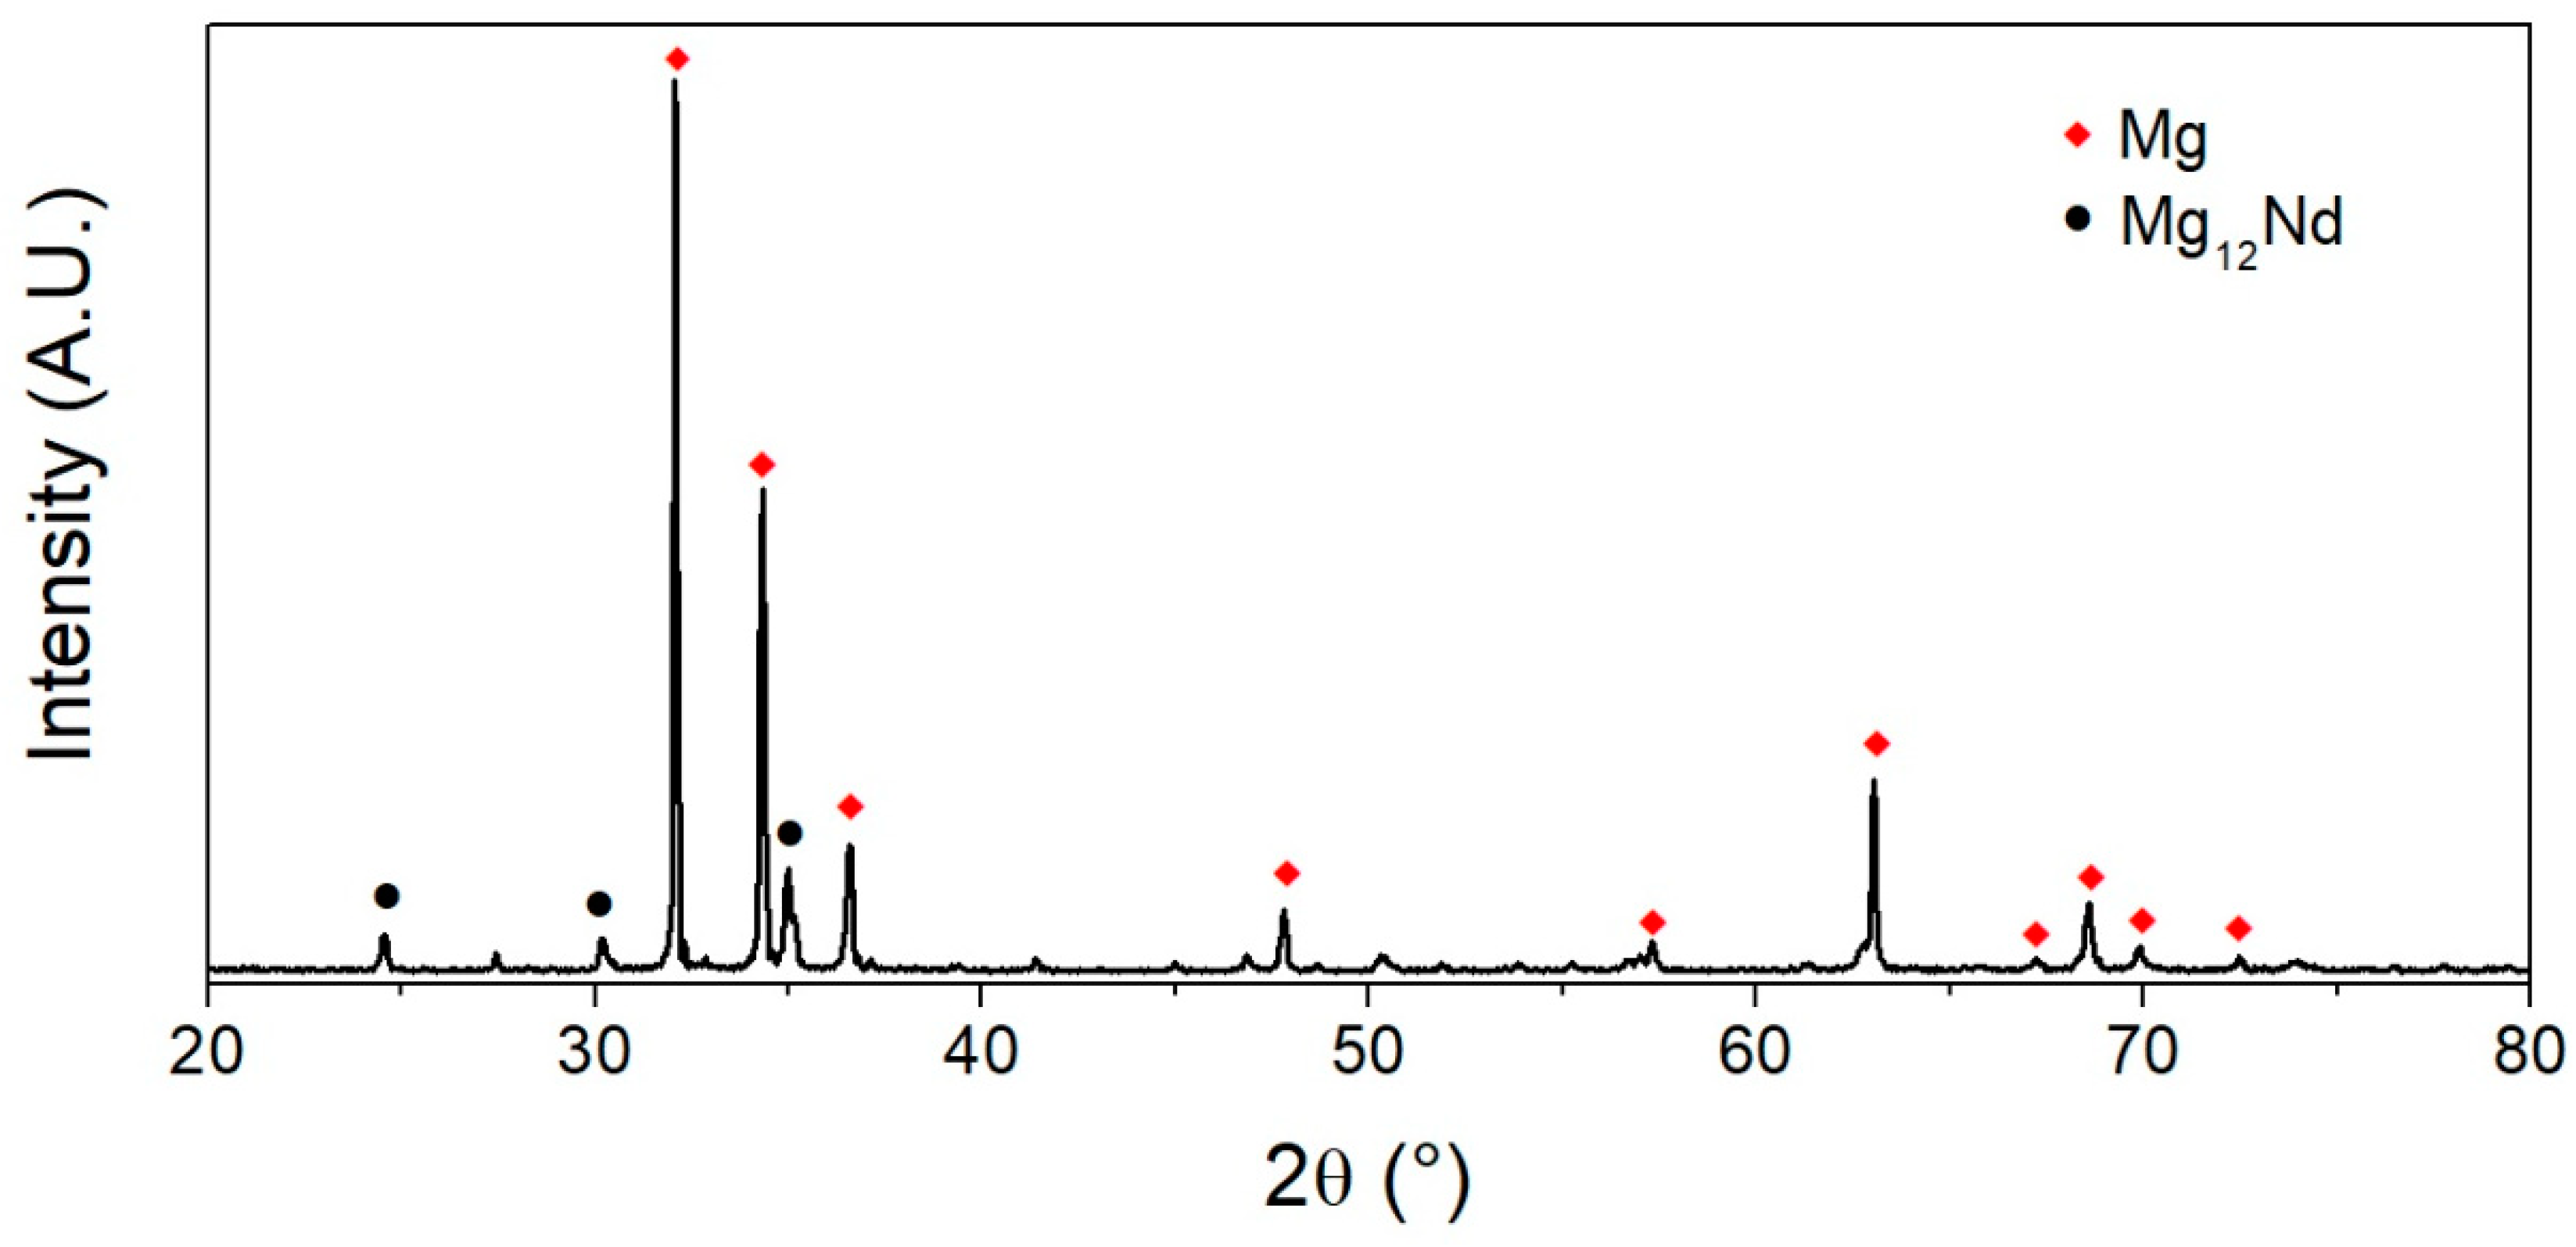
Figure 4.
(a) EBSD (Electron Backscattered Diffraction) map showing the grain size and grain orientation; and (b) particle size distribution of Mg12Nd phase in the extruded bar EZ51-IM350.
Figure 4.
(a) EBSD (Electron Backscattered Diffraction) map showing the grain size and grain orientation; and (b) particle size distribution of Mg12Nd phase in the extruded bar EZ51-IM350.

Figure 5.
Results from hydrogen release tests of EZ51-IM350 alloy immersed in PBS (phosphate buffered saline) solution. (a) Hydrogen release, (b) pH evolution, (c) mass loss, and (d) corrosion rate.
Figure 5.
Results from hydrogen release tests of EZ51-IM350 alloy immersed in PBS (phosphate buffered saline) solution. (a) Hydrogen release, (b) pH evolution, (c) mass loss, and (d) corrosion rate.

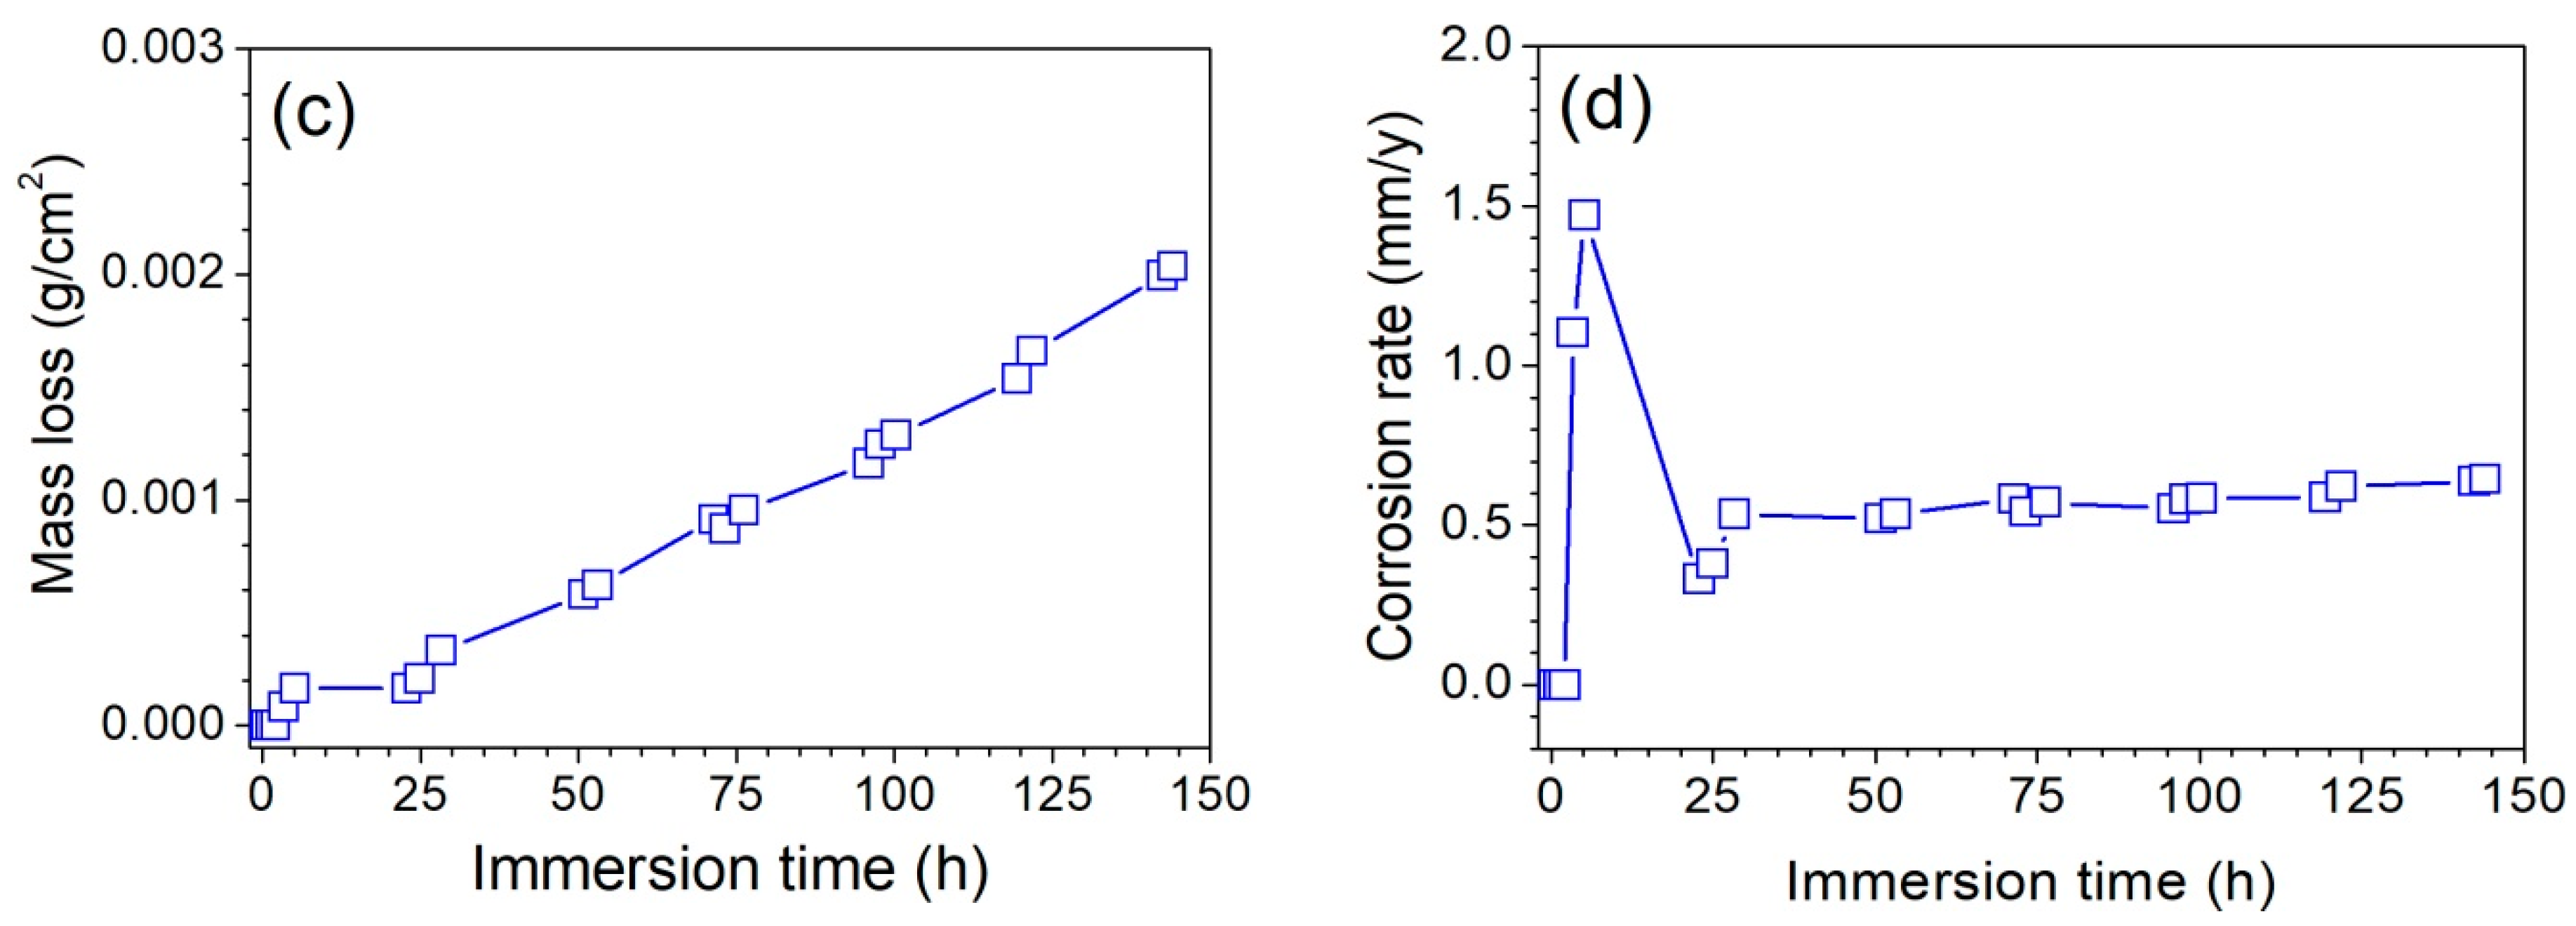
Figure 6.
XRD pattern of the corrosion scale formed on the alloy immersed for 144 h in the PBS solution.
Figure 6.
XRD pattern of the corrosion scale formed on the alloy immersed for 144 h in the PBS solution.

Figure 7.
Secondary electron images of the surface condition of the corrosion scale formed on EZ51-IM350 alloy immersed in PBS solution. (a,b) 48 h, (c,d) 144 h.
Figure 7.
Secondary electron images of the surface condition of the corrosion scale formed on EZ51-IM350 alloy immersed in PBS solution. (a,b) 48 h, (c,d) 144 h.

Figure 8.
Backscattered electron images corresponding to cross sections of the corrosion scale formed on EZ51-IM350 alloy immersed in PBS solution for different times. (a,b) 48 h, (c,d) 144 h.
Figure 8.
Backscattered electron images corresponding to cross sections of the corrosion scale formed on EZ51-IM350 alloy immersed in PBS solution for different times. (a,b) 48 h, (c,d) 144 h.

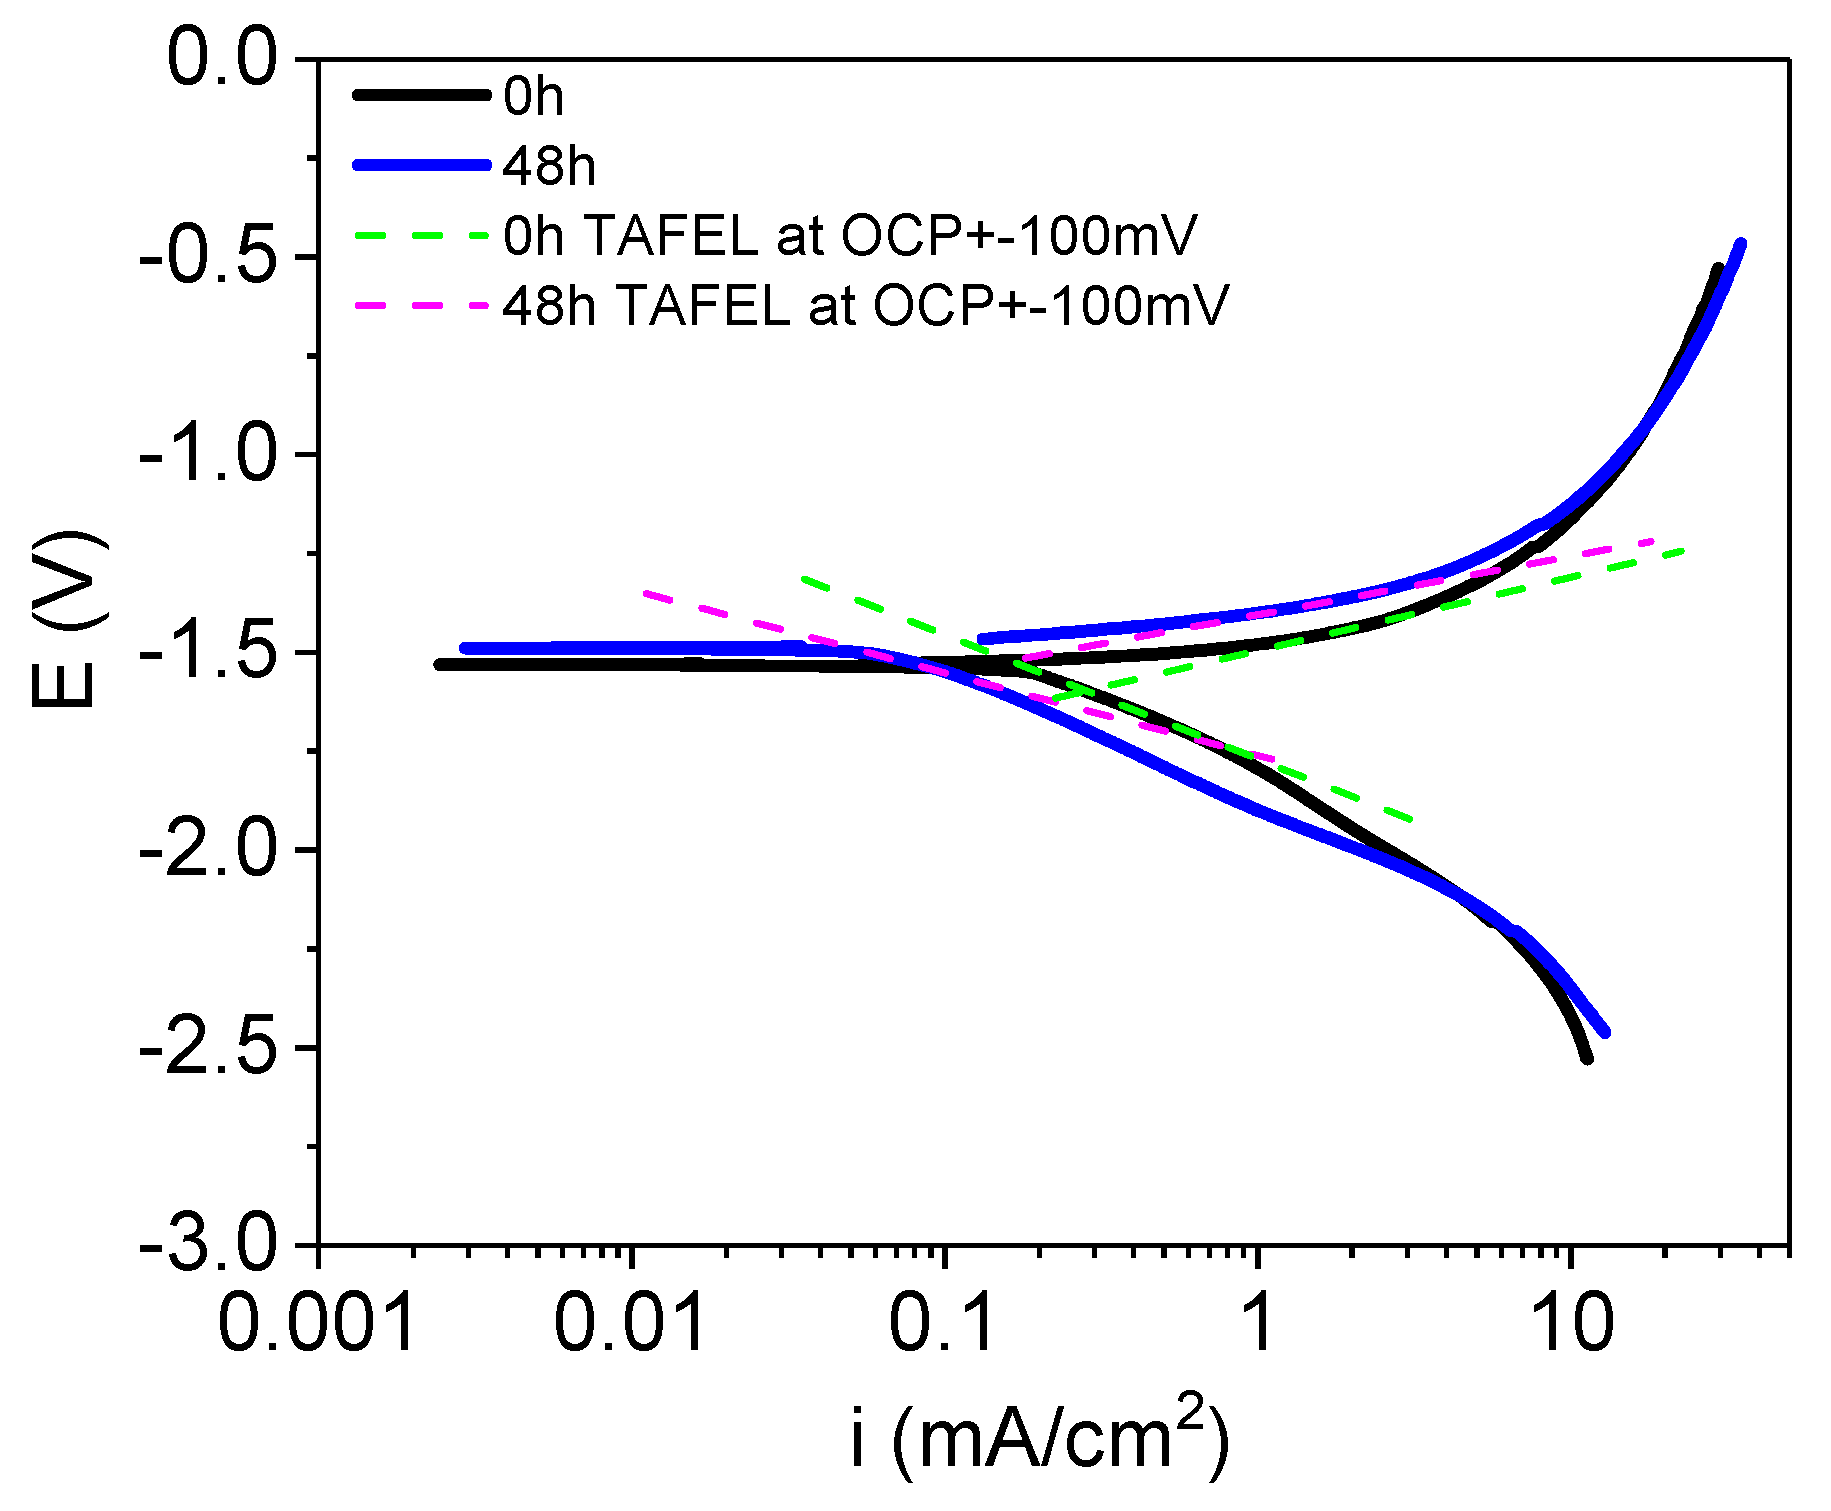
Figure 9.
Linear polarization curves of EZ51-IM350 of freshly prepared specimen immediately after immersion and the specimen immersed in PBS solution during 48 h. Tafel fittings at ± 100mV OCP are also depicted.
Figure 9.
Linear polarization curves of EZ51-IM350 of freshly prepared specimen immediately after immersion and the specimen immersed in PBS solution during 48 h. Tafel fittings at ± 100mV OCP are also depicted.

Figure 10.
Linear polarization control in DC of EZ51-IM350 alloy immersed in PBS: (a) corrosion potential and (b) global resistance Rp + RΩ and calculated icorr taking B = 45 mV.
Figure 10.
Linear polarization control in DC of EZ51-IM350 alloy immersed in PBS: (a) corrosion potential and (b) global resistance Rp + RΩ and calculated icorr taking B = 45 mV.

Figure 11.
Electrochemical Impedance Spectroscopy of EZ51-IM350 immersed in PBS: (a) Nyquist diagram, (b) bode diagram of the module, (c) bode diagram of the angle, and (d) comparison of calculated icorr from Figure 10b and from Nyquist adjustment in Table 3 with B = 45 mV.

Figure 12.
Comparison of corrosion rates from different testing techniques in EZ51-IM350 alloy immersed in PBS solution. Please note that hydrogen release corresponds to accumulated rate while electrochemical techniques are instantaneous rates.
Figure 12.
Comparison of corrosion rates from different testing techniques in EZ51-IM350 alloy immersed in PBS solution. Please note that hydrogen release corresponds to accumulated rate while electrochemical techniques are instantaneous rates.


Table 1.
EDS (Energy-dispersive X-ray spectroscopy) microanalyses corresponding to the points marked in Figure 8b of the corrosion scale formed over the EZ51-IM350 alloy immersed in PBS solution for 48 h. The presence of Nd was attributed to the possible presence of non-corroded second phases embedded in the corrosion scale and within the excited volume of EDS measurement (Figure 8d).
| Site | O (at. %) | Na (at. %) | Mg (at. %) | P (at. %) | K (at. %) | Nd (at. %) |
|---|---|---|---|---|---|---|
| 1 | 63.6 | 5.3 | 12.8 | 14.5 | 3.8 | - |
| 2 | 58.5 | 6.0 | 17.5 | 13.9 | 3.6 | 0.4 |
| 3 | 62.7 | 6.7 | 13.4 | 13.5 | 3.7 | - |
Table 2.
Parameters measured (Ecorr, Rp) and calculated (β, B, graphical icorr1 and corrosion rate (Pi1) from the linear polarization curves of Figure 9 for EZ51-IM350 alloy. Rp value from EIS experiments and B = 45 mV were taken for the calculation of icorr2 and Pi2.
Table 2.
Parameters measured (Ecorr, Rp) and calculated (β, B, graphical icorr1 and corrosion rate (Pi1) from the linear polarization curves of Figure 9 for EZ51-IM350 alloy. Rp value from EIS experiments and B = 45 mV were taken for the calculation of icorr2 and Pi2.
| Parameter | 0 h | 48 h |
|---|---|---|
| Ecorr (mVAg/AgCl) | −1529.9 | −1486.8 |
| βa (mV/decade) | 186 | 148 |
| βc (mV/decade) | −398 | −345 |
| B (mV) | 55* | 44.9 |
| icorr1 (mA/cm2) | 0.27 | 0.11 |
| Pi1 (mm/year) | 6.2 | 2.5 |
| Rp (Ω*cm2) | 169 | 1094 |
| icorr2 (mA/cm2) | 0.27 | 0.04 |
| Pi2 (mm/year) | 6.2 | 0.9 |
Table 3.
Equivalent circuit of Randles used for fitting the experimental EIS curves of the EZ51-IM350 alloy. The table lists the values of RΩ, Rp and C (capacitance).
Table 3.
Equivalent circuit of Randles used for fitting the experimental EIS curves of the EZ51-IM350 alloy. The table lists the values of RΩ, Rp and C (capacitance).
| Equivalent Circuit | Time (h) | RΩ (Ω·cm2) | Rp (Ω·cm2) | C (F/cm2) |
|---|---|---|---|---|
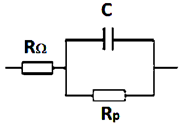 | 0 | 34.30 | 168.58 | 3.15 × 10⁻⁵ |
| 3 | 33.96 | 203.15 | 7.25 × 10⁻⁵ | |
| 6 | 33.25 | 304.77 | 6.79 × 10⁻⁵ | |
| 24 | 47.87 | 1364.63 | 3.63 × 10⁻⁵ | |
| 47 | 80.38 | 1093.73 | 4.04 × 10⁻⁵ | |
| 72 | 104.29 | 1082.70 | 3.77 × 10⁻⁵ | |
| 96 | 112.04 | 890.55 | 5.40 × 10⁻⁵ |
© 2020 by the authors. Licensee MDPI, Basel, Switzerland. This article is an open access article distributed under the terms and conditions of the Creative Commons Attribution (CC BY) license (http://creativecommons.org/licenses/by/4.0/).
Share and Cite
MDPI and ACS Style
Cabeza, S.; Pérez Zubiaur, P.; Garcés, G.; Andrade, C.; Adeva, P. Corrosion Behaviour of Mg98.5Nd1Zn0.5 (at. %) Alloy in Phosphate Buffered Saline Solution. Metals 2020, 10, 148. https://doi.org/10.3390/met10010148
AMA Style
Cabeza S, Pérez Zubiaur P, Garcés G, Andrade C, Adeva P. Corrosion Behaviour of Mg98.5Nd1Zn0.5 (at. %) Alloy in Phosphate Buffered Saline Solution. Metals. 2020; 10(1):148. https://doi.org/10.3390/met10010148
Chicago/Turabian StyleCabeza, Sandra, Pablo Pérez Zubiaur, Gerardo Garcés, Carmen Andrade, and Paloma Adeva. 2020. "Corrosion Behaviour of Mg98.5Nd1Zn0.5 (at. %) Alloy in Phosphate Buffered Saline Solution" Metals 10, no. 1: 148. https://doi.org/10.3390/met10010148
Note that from the first issue of 2016, this journal uses article numbers instead of page numbers. See further details here.