Microstructure Evolution and Mechanical Properties of Refractory Mo-Nb-V-W-Ti High-Entropy Alloys


Institute of Materials and Joining Technology, Otto-von-Guericke University Magdeburg, Universitätsplatz 2, 39106 Magdeburg, Germany
*
Authors to whom correspondence should be addressed.
Metals 2020, 10(11), 1530; https://doi.org/10.3390/met10111530
Submission received: 23 September 2020
/
Revised: 9 November 2020
/
Accepted: 13 November 2020
/
Published: 18 November 2020
(This article belongs to the Special Issue High Entropy Materials: Challenges and Prospects)
Abstract
:High-entropy alloys can either be defined as solid solution alloys containing at least five elements in equiatomic or near-equiatomic composition, or as alloys with high configurational entropies (larger than 1.5R), regardless of the number of elements involved. The present study reports on an alloy design route for refractory high-entropy alloys based on equiatomic Mo-Nb-V alloys with additions of W and Ti. In general, the work was motivated by Senkov et al. The aim of the experiments carried out was to produce a refractory high-entropy alloy with a single-phase structure. For this purpose, a systematic alloy design involving four- and five-element compositions was used. Scanning electron microscopy analysis has shown that Mo-Nb-V-xW-yTi (x = 0, 20; y = 5, 10, 15, 20, 25) is in fact a refractory high-entropy alloy with a body-centered cubic dendritic structure. Furthermore, the Ti-concentration of the experimental alloys was varied, to obtain the influence of Titanium on the microstructure development. Additionally, compressive tests at room temperature were carried out to evaluate the influence of the different alloying elements and the Ti-fraction on the mechanical properties. The observations of the present work are then compared to the published results on similar alloys from the working group of Yao et al. and critically discussed.
1. Introduction
To meet the increasing demand for modern high-temperature materials, extensive research is being carried out in this field. Especially characteristics such as high-temperature strength, creep resistance and oxidation behavior are in the focus of present investigations. As the melting temperatures of materials correlate with the aforesaid properties, emphasis has been put on for example Fe, Ni or Pt and refractory elements like Mo and Nb, as basic alloying components in the manner of producing rather simple binary and ternary alloys, up to complex multi-component superalloys [1,2,3,4].
Besides the classical alloying strategies, starting from a base element and adding minor element additions to design and produce alloys, a multi-component alloy strategy offers the opportunity to design and investigate a completely new class of materials. In general, those alloys consist of five (or more) elements. They are referred to as high-entropy alloys (HEAs) if a single-phase material with relatively simple fcc (face-centered cubic), bcc (body centered cubic), or hcp (hexagonal close-packed) crystal structures is reached [5,6,7,8]. These, mostly equiatomic alloys, gained tremendous scientific attention, caused by their unique properties, such as high strength and hardness (even at high temperatures), outstanding wear resistance, good structural stability, corrosion and oxidation resistance. Those properties are attributed to certain interatomic and lattice effects: the core effect, high entropy effect, sluggish diffusion effect, severe-lattice-distortion effect and a cocktail effect, which are described in detail elsewhere [5,8]. HEAs can be seen as a scientific approach to investigate and understand the metal–physical nature of this new type of materials.
A more practical (or engineering) approach on HEAs may lead to near-equiatomic multi-component alloys in which the element composition can vary in a certain compositional interval (between 5 at.% and 35 at.% as it is defined by Yeh [9]), for each principle element. As a result of that, it is possible to design so-called compositionally complex alloys (CCAs) which show the potential to lead to new developments regarding types of superalloys in which a multi-component solid solution matrix contains high amounts of complex precipitation phases [10,11,12,13].
During the last decade HEAs based on Fe, Al, Cr, Ni, Co, Cu and Mn were emphasized and extensively examined. A well-studied example of this development is Fe-Cr-Mn-Ni-Co [14,15,16,17], which is also known as the so-called Cantor alloy. To be noted in addition is the US Patent published by Bei [18] in which a multi-component solid solution alloy with high mixing entropy, namely Mo-Nb-V-W-Ti, has been mentioned. Senkov et al. [19,20] introduced HEAs based primarily on refractory metals (RHEAs) in demand for high- and ultra-high-temperature structural materials, i.e., in the aerospace industry. Their alloys based on W-Nb-Mo-Ta and W-Nb-Mo-Ta-V were experimentally investigated and have a dendritic bcc structure, which, compared to the Ni-based alloy Inconel 718, shows relatively high yield stresses in a wide temperature range between 600 °C and 1600 °C [20]. These observations lead to the assumption, that the patented alloy Mo-Nb-V-W-Ti also consists of a single-phase body-centered cubic structure. Senkov et al.’s alloys, however, have relatively high densities of 12.36 g/cm3 for W-Nb-Mo-Ta and 13.75 g/cm3 for W-Nb-Mo-Ta-V [19].
In general, the present work aims to follow Senkov et al.’s approach of developing an RHEA, based on principle refractory metals but by substituting at least one and/or both of the heavy elements W and Ta with Ti, to reduce the density of the RHEAs significantly. Thus, the alloying strategy of the present work is based on theoretical calculations which give rise to a stable solid solution formation. In addition, the effects of removing/substituting aforesaid elements on the strength and ductility of the alloys at room temperature was examined.
2. Materials and Methods
For the alloy design of the present study, three quaternary alloys Mo25Nb25V25W25, Mo25Nb25V25Ti25, Mo30Nb30V30Ti10 and two quinary alloys Mo20Nb20V20W20Ti20, Mo22.5Nb22.5V22.5W22.5Ti10 were chosen (all concentrations are given in atomic percent). The alloys were prepared from high-purity metal chips, granules and powders via arc-melting under protective (Ar) atmosphere (Arc Melter MAM-1, Edmund Buehler GmbH, Bodelshausen, Germany). Button-shaped samples of 5–10 g were re-melted and flipped five times each, to ensure good homogeneity.
Powder samples of the alloys produced were manually prepared for X-ray diffraction analysis (XRD, X’Pert PRO, Malvern Panalytival B.V., Almelo, Netherlands), using a hand file. The measuring parameters chosen for the XRD analysis were Cu-Kα1-radiation (λ = 1.541874 Å) at a voltage of 40 kV, current intensity of 30 mA and increment size of 0.0167°.
In order to characterize the as-cast microstructure, the button-shaped samples of each alloy were cut and prepared for metallographic examination. After initial grinding, the specimens were polished using a 3 µm and a 1 µm diamond suspension, and finally polished with colloidal silica (OP-S, Struers, Ballerup, Denmark). The microstructural observations were carried out using a scanning electron microscope (SEM) (ESEM XL30 FEG, FEI, Hillsboro, OR, USA). Additionally, to validate the chemical composition of the alloy samples, (Si(Li))-detector Energy-dispersive X-ray spectroscopy (EDS) analysis, equipped with Genesis software (EDAX, Mahwah, NJ, USA) was conducted. Moreover, area fractions of the microstructures of the Ti-containing 5-element alloys Mo20Nb20V20W20Ti20 and Mo22.5Nb22.5V22.5W22.5Ti10 were calculated by means of graphical image analysis (Photoshop, Adobe, San José, CA, USA) using 15 images each.
Furthermore, Vickers hardness measurements with an applied force of 100 N were performed on the prepared specimens, using a hardness testing device (Duravision, Struers, Ballerup, Denmark).
Regarding the compression tests, 3 to 4 cylindrical samples conforming to standards [21] with specifications of 3 mm in length and 1.8 mm in diameter were prepared by electric discharge machining (EDM). The samples were surface-cleaned (removal of a burr and the surface tarnish) subsequently afterwards, using 800 and 1200 grit SiC paper. The compression tests were performed on an electro-mechanical universal testing machine (TIRAtest 2825, TIRA GmbH, Schalkau, Germany) at a constant crosshead speed corresponding to an initial (engineering) strain rate of 10−3 s−1, up to a maximum deformation of ~50%. The yield strength was determined by the 0.2% offset method and the plastic strain was obtained by subtracting the combined compliance of the testing machine and the sample from the individually measured load-displacement curves.
3. Results and Discussion
3.1. Alloy Design Based on Thermodynamics and Geometrical Effects
The formation of a solid solution phase in multi-component alloys is determined by the system’s Gibbs free energy ΔGmix [22],
Hence, the phase formation in RHEAs is strongly dependent upon the interplay between the entropy of mixing ΔSmix, the absolute temperature T and the enthalpy of mixing ΔHmix [5]. Therefore, the following equations were used to determine the phase stability of the alloys examined [15,16]:
where, R is the gas constant, 8.314 J·mol−1·K−1, N is the number of elements, xi or xj is the composition of the ith or jth element and is the enthalpy of mixing for the binary equiatomic AB alloys. Furthermore, the ratio of entropy to enthalpy Ω (also referred to as solid solution prediction parameter) was used to make predictions about solid solution formation in the present alloying systems [23]:
here, the melting temperature of an n-element alloy is calculated, where Tm is used as the melting point of the ith component of the alloy. Additionally, the atomic size difference δr in % was taken into account, using the equation given below [24]:
where, Ci is the atomic fraction of the ith component, is the average atomic radius and ri is the atomic radius (listed in reference [25]).
The results of the calculations performed (as displayed in Table 1) are in good agreement with the findings of Zhang et al. [26,27], stating that low values of ΔHmix and, respectively, high values of ΔSmix reduce the free energy of the system, thus providing a stable solid solution phase. This assumption is supported by the Ω values stated, all of which are significantly higher than 1 (Ωmin = Ω(Mo25Nb25V25W25) = 8.27), leading to a more dominant contribution of (T)∆Smix than of ∆Hmix to the free energy of the system [23]. In addition to the entropy of mixing, the δr data of the elements mixed contribute to the formation of phases, since the lattice distortion is influenced by the different atomic radii [28]. The stated RHEA alloys show δr values between 2.98% and 4.62%, hence indicating the formation of a stable solid solution [29].
To demonstrate and evaluate the potential of the alloys examined, the generated ΔHmix vs. δr data were graphically displayed in Figure 1a by means of a field diagram, showing the regions of theoretical solid solution, respectively, amorphous phase formation, and compared to obtained data from the corresponding literature.
3.2. X-ray Diffraction of the RHEAs
The XRD analysis results of the RHEA powder samples are depicted in patterns, displaying the relative intensity of the detected reflexes over a 2-θ-range from 20° to 120° in Figure 1b. The XRD reflexes of the different alloys show similar locations, indicating the presence of a bcc crystal structure in all alloys examined. The positions of the diffraction reflexes present are characteristic for elements with a bcc crystal structure (f.e. the refractory elements Mo, V, Nb, W, etc.) in general, however they are slightly shifted here [30]. The exact position of the reflexes obtained varies, due to the lattice distortion of the different solid solutions. The experimentally obtained lattice parameters reaching from a minimum of 3.156 Å (Mo22.5Nb22.5V22.5W22.5Ti10) to a maximum value of 3.174 Å (Mo25Nb25V25Ti25) are listed in Table 2. Theoretical values for the alloys examined were determined, using the equation [19]:
and the results, stated in Table 2 are in good agreement with the experimental values.
3.3. As-Cast Microstructures of the Alloys Examined
As-cast microstructure overview-images of the five alloys produced are depicted in Figure 2. The images were taken at a central position of the arc-melted buttons. In addition, the results of the chemical compositions, analyzed by means of EDS, are shown in Table 3. It can be stated that the actual element concentration is in good agreement with the theoretical calculated values, with a maximum deviation of ±2.1 at.% W in alloy Mo20Nb20V20W20Ti20, regarding all alloys tested. The microstructure evolution is of a similar kind within the button-shaped samples. In principal, the formation of dendrites in different sizes and refinement can be examined. As displayed on alloy Mo25Nb25V25W25 in Figure 3, a coarse-grained dendritic structure is present in the bottom regions of the button-shaped samples, while a more distinctive growth can be obtained from the mid to the top section of the samples. This is attributed to the cooling conditions in the arc-melter or more specifically the fast heat transfer from the sample into the water-cooled copper crucible, thus restricting the dendrite growth.
Even though theory predicts the formation of a solid solution, regarding the Ti-containing 5-element alloys, the presence of a second phase was observed at higher magnifications (small, black colored areas), which are depicted in the micrograph insets of the EDS element mappings. The EDS analysis (Figure 4) revealed that these areas are indeed Ti-rich precipitations, which form at the grain boundaries of the dendrites during solidification (~5% area fraction in alloy Mo22.5Nb22.5V22.5W22.5Ti10 and ~7% area fraction in alloy Mo20Nb20V20W20Ti20). The reason for the formation of the dendritic microstructure in general and the Ti-precipitations in particular lies within the different melting temperatures of the elements present. As titanium exhibits the lowest melting temperature (Tm ≈ 1660 °C) of the alloying elements used, hence solidifying last, the solidification front is pushing the low viscous residual melt forward, resulting in a Ti-enriched interdendritic zone [31]. This observation can also be expanded to vanadium, which exhibits the second lowest melting temperature (Tm ≈ 1910 °C), thus experiencing the same influence (depicted in the EDS mappings in Figure 4). Depending on the alloy composition, tungsten (Tm ≈ 3420 °C), molybdenum (Tm ≈ 2620 °C) and niobium (Tm ≈ 2480 °C) constitute the dendritic crystals, respectively, suppressing the remaining alloying elements in the interdendritic region. If W is present in the alloy (cf. the five-component alloy (Figure 4b), the primary dendrites mainly consist of it, which is due to the extremely high melting point. If the alloy only contains Mo and Nb instead of W as high melting components (cf. the four-element alloy (Figure 4a), the primary dendrites are enriched with both of the aforesaid elements, which can be attributed to the more similar meting point of the components. The results of the EDS mappings were quantitatively verified by means of spot analysis in the dendritic (Cd), interdendritic (Cid) and precipitation (Cpr) regions of the samples (examples regarding alloy Mo25Nb25V25Ti25 and Mo20Nb20V20W20Ti20 are listed in Table 4) and are overall in good agreement.
3.4. Mechanical Properties at Room Temperature
The results of the compression tests regarding the obtained compressive yield strength values (yield strength in the following) vs. the theoretical density of the samples, determined by the formula to calculate the density of a disordered solid solution [19]:
are displayed in Figure 5a. In addition, the obtained hardness values of the RHEAs vs. the theoretical density are depicted in Figure 5b. The corresponding numerical values as well as the calculated theoretical densities of the alloys examined are stated in Table 5. Overall, the alloys tested show relatively high yield strength and low ductility values, which is attributed to the large valence electron concentration (VEC) [8,32] and are in good agreement with the findings of Senkov et al. [19,20]. Nonetheless, it must be stated that the values considering the compressive yield stress partly show some major deviations which is attributed to the presence of porosity in the compression samples. This originates mainly in the manufacturing process. As the specimens were produced by means of arc melting, process related porosity could not be prevented. The ultra-high melting points of the elements used complicate the melting process, leading to a highly viscous melt which solidifies quickly, thus resulting in the present gas porosity and cavities. Referring to the samples of alloy Mo22.5Nb22.5V22.5W22.5Ti10, the obtained porosity is so significant that it can be determined as the main failure mechanism, thus the results of alloy Mo22.5Nb22.5V22.5W22.5Ti10 were not taken into account and are therefore not displayed in the images. By comparing the depicted graphs, it is noticeable that there is no linear dependency present between the yield strength and the theoretical density of the alloys in contrast to the measured hardness values and the theoretical density. The yield strength values of the alloys Mo25Nb25V25Ti25, Mo20Nb20V20W20Ti20 and Mo25Nb25V25W25 are comparable, while alloy Mo30Nb30V30Ti10 displays the highest value. This observation leads to the assumption that a reduced Ti-content (10 at.% in alloy Mo30Nb30V30Ti10 vs. 25 at.% in alloy Mo25Nb25V25Ti25 and 20 at.% in alloy Mo20Nb20V20W20Ti20), respectively, and higher content of the elements Mo, Nb and V, results in a higher compressive yield strength. By showing a relatively low yield strength, however, alloy Mo25Nb25V25W25 is in contrast to this statement. On the one hand, this can be attributed to the aforementioned porosity in the Mo25Nb25V25W25 specimens. On the other hand, the high W (25 at.% W) concentration in the alloy leads to lower concentrations of the strength enhancing components Mo, Nb and V (compared to alloy Mo30Nb30V30Ti10 f.e.) and the enrichment of W in the dendritic crystals must be considered. This results in a suppression of the lower-melting elements in the interdendritic regions, hence generating an imbalance in the element distribution.
Regarding the macro-hardness of the samples and the density, a clear connection between the alloying elements can be obtained. Alloy Mo25Nb25V25Ti25 displays the lowest HV10 value as well as the lowest density, due to the high fraction of Ti. With decreasing Ti content in relation to the other alloying elements, the hardness of the microstructure increases in correlation with the density. A significant increase (both in hardness and density) can be examined regarding the alloys Mo20Nb20V20W20Ti20 and Mo25Nb25V25W25, respectively, which is attributed to the addition of W [19]. Compared to Mo-Nb-V-Ta-Ti alloys investigated by Bei et al. [18] the present results are in good agreement with their hardness values. Thus, substituting W with Ta reveals similar mechanical properties in combination with a decreased density and melting point of the alloy.
In order to position the yield strength in relation to the density (hence the W fraction as it affects the alloys examined the most), the specific compressive yield strengths (SCYS) of the alloys tested were calculated (Table 5). The calculated values were then compared to the obtained compressive yield stresses and displayed in Figure 6. The graph clearly demonstrates the influence of the light elements (mainly Ti, but also V), respectively, the heavy element (W) in the alloy composition: Alloy Mo25Nb25V25Ti25 exhibits a major gap between the two values, which is attributed to the proportionally high Ti and V content, resulting in a comparatively high SCYS. Alloy Mo30Nb30V30Ti10 also shows a, however smaller, increase in the SCYS which still is the highest value overall (due to the aforementioned high fractions of Mo and Nb). In contrast to the alloys discussed, alloy Mo20Nb20V20W20Ti20 and alloy Mo25Nb25V25W25 show a decrease in SCYS in relation to the obtained compressive yield stress, primarily caused by the increased density of both alloys, thus putting the actual increase in the compressive yield stress into perspective. Comparing the SCYS values of all alloys it can be stated that an approximation to a linear trend is present (in contrast to the compressive yield stress values), which leads to an interesting perspective and more faceted way of comparing the microstructure evolution and the resulting properties of RHEAs such as the ones investigated.
3.5. Comparison with Other Works and Superalloys
A comparison regarding SCYS vs. the hardness of different RHEAs, which were the focus of published research in recent years by Yao et al. [33,34] and Senkov et al. [20], common Ni-based superalloys Inconel 718 [35], alloy CMSX-4 [36,37] and alloy Haynes 282 [38] and the alloys investigated in this work is displayed in Figure 7. Considering the SCYS and the hardness values, the examined alloys are superior in comparison to the superalloys. Only alloy Mo25Nb25V25W25 shows a lower SCYS, compared to alloy Inconel 718, however the hardness is significantly higher. In general, the examined alloys fit in well with the values obtained from the other RHEAs. The Ti-containing alloys Mo25Nb25V25Ti25 and Mo30Nb30V30Ti10 show the highest SCYS values of all alloys depicted, which can be attributed to the high Ti and V fractions, thus showing reduced density, compared with the Ta containing alloys from Yao et al. [33,34]. In comparison, the high W-containing alloy Mo25Nb25V25W25 has the lowest SCYS but highest hardness values of the alloys investigated in this study, similar to alloy Mo20Nb20V20W20Ta20 by Senkov et al. [20]. Thus, the alloy Mo20Nb20V20W20Ti20 represents a good compromise between strength and hardness which seems to agree with similar alloy compositions investigated by Yao et al. [33,34].
4. Conclusions
The microstructure evolution and mechanical properties of RHEA alloys Mo25Nb25V25W25, Mo25Nb25V25Ti25, Mo30Nb30V30Ti10, Mo20Nb20V20W20Ti20 and Mo22.5Nb22.5V22.5W22.5Ti10 were investigated in the present work.
The alloy design was based on thermodynamic calculations regarding the Gibbs free energy ΔGmix, the entropy of mixing ΔSmix, the enthalpy of mixing ΔHmix and the solid solution prediction parameter Ω, as well as geometrical effects, considering the difference of atomic radii δr.
XRD analysis showed that all alloys examined have a bcc crystal structure with a lattice parameter between 3.156 Å (Mo22.5Nb22.5V22.5W22.5Ti10) and 3.174 Å (Mo25Nb25V25Ti25), however, the presence of a second, Ti-enriched phase could be detected subsequently via SEM observations. The second phase was not distinguished by the XRD method (no shoulders or modifications of the reflexes as such were determined) due to the small volume fractions present.
Microstructure analysis demonstrated that the alloys produced show a similar single-phase dendritic structure, apart from aforementioned alloy Mo20Nb20V20W20Ti20 and alloy Mo22.5Nb22.5V22.5W22.5Ti10. Deviations in the microstructure-refinement of the different samples were also obtained, which could be attributed to the cooling conditions during the arc-melting process.
To verify the composition of the samples, EDS spot analysis and mappings were conducted, which showed a good distribution of the alloying elements overall and an enrichment of high melting elements in the dendrite crystals vs. an accumulation of elements with a lower melting temperature in the interdendritic regions.
The mechanical properties of the alloys were obtained by means of room temperature compression tests and macro-hardness measurements, which revealed various impacts of the elements involved. The compressive yield strength of the alloys tested is mainly influenced by the Mo and Nb fraction present (see f.e. alloy Mo30Nb30V30Ti10: σ0.2 = 1440 ± 40 MPa vs. alloy Mo25Nb25V25Ti25: σ0.2 = 1210 ± 36 MPa). The W fraction primarily influences the hardness of the alloys; nonetheless, an impact on the compressive yield stress can be obtained regarding alloy Mo20Nb20V20W20Ti20. The density of the Alloys examined was primarily determined by Ti, V and W (see alloy Mo25Nb25V25Ti25: highest share of Ti and V, lowest density vs. alloy Mo25Nb25V25W25: highest share of W, highest density). At this point, the determined porosity which was mainly caused by the arc-melting process as such and the highly viscous melt should also be noted. A different melting process (f.e. cold crucible induction melting) as well as the selection of lower-melting elements shall be mentioned here as alternatives for samples with reduced porosity/cavities.
Additionally, a comparison between the specific compressive yield strength and the nominal compressive yield strength has been carried out, which led to a more differentiated relation between the density (respectively, the content of light elements) and the compressive yield stress vs. the hardness of the alloys investigated. The calculated specific compressive yield stress values were finally compared to other RHEAs and Ni-base superalloys by means of a scatter diagram.
Author Contributions
Conceptualization, M.K., T.H. and G.H.; methodology, M.R., G.H. and M.W.; validation, G.H. and M.K.; formal analysis, M.R., G.H., M.W., T.H. and M.K.; investigation, M.R., G.H. and M.W.; writing—original draft preparation, M.R.; writing—review and editing; M.R., G.H. and M.K.; supervision, M.K. and T.H., funding acquisition, M.K. and T.H. All authors have read and agreed to the published version of the manuscript.
Funding
Financial support of the Methodisch-Diagnostisches Zentrum Werkstoffprüfung (MDZWP) e.V., Magdeburg, Germany and the “Graduiertenförderung Land Sachsen-Anhalt” is greatly acknowledged.
Acknowledgments
Experimental support by J. Kühn and M. Hellriegel is greatly acknowledged. M.R. would like to kindly thank Janett Schmelzer and Julia Becker for their support and fruitful discussions on the topic.
Conflicts of Interest
The authors declare no conflict of interest.
References
- Speich, G.R.; Schwoeble, A.J.; Leslie, W.C. Elastic constants of binary iron-base alloys. Metall. Trans. 1972, 3, 2031–2037. [Google Scholar] [CrossRef]
- Tawancy, H.M.; Klarstrom, D.L.; Rothman, M.F. Development of a New Nickel-Base Superalloy. JOM 1984, 36, 58–62. [Google Scholar] [CrossRef]
- Hemmersmeier, U.; Feller-Kniepmeier, M. Element distribution in the macro- and microstructure of nickel base superalloy CMSX-4. Mater. Sci. Eng. A 1998, 248, 87–97. [Google Scholar] [CrossRef]
- Dimiduk, D.M.; Perepezko, J.H. Mo-Si-B alloys: Developing a revolutionary turbine-engine material. MRS Bull. 2003, 28, 639–645. [Google Scholar] [CrossRef]
- Gao, M.C.; Liaw, P.K.; Yeh, J.W.; Zhang, Y. High-Entropy Alloys: Fundamentals and Applications; Springer International Publishing: Basel, Switzerland, 2016; ISBN 9783319270135. [Google Scholar]
- Yeh, J.W. Alloy design strategies and future trends in high-entropy alloys. JOM 2013, 65, 1759–1771. [Google Scholar] [CrossRef]
- George, E.P.; Raabe, D.; Ritchie, R.O. High-entropy alloys. Nat. Rev. Mater. 2019, 4, 515–534. [Google Scholar] [CrossRef]
- George, E.P.; Curtin, W.A.; Tasan, C.C. High entropy alloys: A focused review of mechanical properties and deformation mechanisms. Acta Mater. 2020, 188, 435–474. [Google Scholar] [CrossRef]
- Tsai, M.H.; Yeh, J.W. High-entropy alloys: A critical review. Mater. Res. Lett. 2014, 2, 107–123. [Google Scholar] [CrossRef]
- Manzoni, A.; Daoud, H.; Mondal, S.; Van Smaalen, S.; Völkl, R.; Glatzel, U.; Wanderka, N. Investigation of phases in Al23Co15Cr 23Cu8Fe15Ni16 and Al 8Co17Cr17Cu8Fe17Ni 33 high entropy alloys and comparison with equilibrium phases predicted by Thermo-Calc. J. Alloys Compd. 2013, 552, 430–436. [Google Scholar] [CrossRef]
- Manzoni, A.M.; Daoud, H.M.; Voelkl, R.; Glatzel, U.; Wanderka, N. Influence of W, Mo and Ti trace elements on the phase separation in Al8Co17Cr17Cu8Fe17Ni33 based high entropy alloy. Ultramicroscopy 2015, 159, 265–271. [Google Scholar] [CrossRef]
- Manzoni, A.M.; Singh, S.; Daoud, H.M.; Popp, R.; Völkl, R.; Glatzel, U.; Wanderka, N. On the path to optimizing the Al-Co-Cr-Cu-Fe-Ni-Ti high entropy alloy family for high temperature applications. Entropy 2016, 18, 104. [Google Scholar] [CrossRef] [Green Version]
- Bolbut, V.; Wessel, E.; Krüger, M. Phase stability and temperature-dependent compressive strength of a low-density Fe32.3Al29.3Cu11.7Ni10.8Ti15.9 alloy. Scr. Mater. 2018, 150, 54–56. [Google Scholar] [CrossRef]
- Cantor, B.; Chang, I.T.H.; Knight, P.; Vincent, A.J.B. Microstructural development in equiatomic multicomponent alloys. Mater. Sci. Eng. A 2004, 375–377, 213–218. [Google Scholar] [CrossRef]
- Yeh, J.W.; Chen, S.K.; Lin, S.J.; Gan, J.Y.; Chin, T.S.; Shun, T.T.; Tsau, C.H.; Chang, S.Y. Nanostructured high-entropy alloys with multiple principal elements: Novel alloy design concepts and outcomes. Adv. Eng. Mater. 2004, 6, 299–303. [Google Scholar] [CrossRef]
- Otto, F.; Yang, Y.; Bei, H.; George, E.P. Relative effects of enthalpy and entropy on the phase stability of equiatomic high-entropy alloys. Acta Mater. 2013, 61, 2628–2638. [Google Scholar] [CrossRef] [Green Version]
- Otto, F.; Dlouhý, A.; Pradeep, K.G.; Kuběnová, M.; Raabe, D.; Eggeler, G.; George, E.P. Decomposition of the single-phase high-entropy alloy CrMnFeCoNi after prolonged anneals at intermediate temperatures. Acta Mater. 2016, 112, 40–52. [Google Scholar] [CrossRef] [Green Version]
- Bei, H. Multi-Component Solid Solution Alloys Having High Mixing Entropy. US Patent US9150945B2, 6 October 2015. [Google Scholar]
- Senkov, O.N.; Wilks, G.B.; Miracle, D.B.; Chuang, C.P.; Liaw, P.K. Refractory high-entropy alloys. Intermetallics 2010, 18, 1758–1765. [Google Scholar] [CrossRef]
- Senkov, O.N.; Wilks, G.B.; Scott, J.M.; Miracle, D.B. Mechanical properties of Nb25Mo25Ta 25W25 and V20Nb20Mo 20Ta20W20 refractory high entropy alloys. Intermetallics 2011, 19, 698–706. [Google Scholar] [CrossRef]
- Materialprüfung, DIN-Normenausschuss. Gleitlager, DIN-Normenausschuss Wälz- und DIN 50106 Prüfung Metallischer Werkstoffe—Druckversuch bei Raumtemperatur. 2016. Available online: https://www.din.de/de/mitwirken/normenausschuesse/nawgl (accessed on 16 November 2020).
- Hasegawa, M. Thermodynamic Basis for Phase Diagrams; Elsevier Ltd.: London, UK, 2013; Volume 1, ISBN 9780080969862. [Google Scholar]
- Yang, X.; Zhang, Y. Prediction of high-entropy stabilized solid-solution in multi-component alloys. Mater. Chem. Phys. 2012, 132, 233–238. [Google Scholar] [CrossRef]
- Fang, S.; Xiao, X.; Xia, L.; Li, W.; Dong, Y. Relationship between the widths of supercooled liquid regions and bond parameters of Mg-based bulk metallic glasses. J. Non-Cryst. Solids 2003, 321, 120–125. [Google Scholar] [CrossRef]
- Kittel, C. Introduction to Solid State Physics, 8th ed.; Wiley John + Sons: Berkeley, CA, USA, 2008; ISBN 047141526X. [Google Scholar]
- Zhang, Y.; Zhou, Y.J.; Lin, J.P.; Chen, G.L.; Liaw, P.K. Solid-solution phase formation rules for multi-component alloys. Adv. Eng. Mater. 2008, 10, 534–538. [Google Scholar] [CrossRef]
- Zhang, Y.; Lu, Z.P.; Ma, S.G.; Liaw, P.K.; Tang, Z.; Cheng, Y.Q.; Gao, M.C. Guidelines in predicting phase formation of high-entropy alloys. MRS Commun. 2014, 4, 57–62. [Google Scholar] [CrossRef]
- Wu, C.S.; Tsai, P.H.; Kuo, C.M.; Tsai, C.W. Effect of atomic size difference on the microstructure and mechanical properties of high-entropy alloys. Entropy 2018, 20, 967. [Google Scholar] [CrossRef] [Green Version]
- Ye, Y.F.; Wang, Q.; Lu, J.; Liu, C.T.; Yang, Y. High-entropy alloy: Challenges and prospects. Mater. Today 2016, 19, 349–362. [Google Scholar] [CrossRef]
- Becker, J.; Betke, U.; Wessel, E.; Krüger, M. Alloying effects in Mo-5X (X = Zr, Ti,V)—Microstructural modifications and mechanical properties. Mater. Today Commun. 2018, 15, 314–321. [Google Scholar] [CrossRef]
- Sahm, P.R.; Egry, I.; Volkmann, T. Schmelze, Erstarrung, Grenzflächen; Sahm, P.R., Egry, I., Volkmann, T., Eds.; Springer Berlin Heidelberg: Berlin/Heidelberg, Germany, 1999; ISBN 978–3–540–41566–4. [Google Scholar]
- Sheikh, S.; Shafeie, S.; Hu, Q.; Ahlström, J.; Persson, C.; Veselý, J.; Zýka, J.; Klement, U.; Guo, S. Alloy design for intrinsically ductile refractory high-entropy alloys. J. Appl. Phys. 2016, 120, 164902. [Google Scholar] [CrossRef] [Green Version]
- Yao, H.; Qiao, J.W.; Gao, M.C.; Hawk, J.A.; Ma, S.G.; Zhou, H. MoNbTaV medium-entropy alloy. Entropy 2016, 18, 189. [Google Scholar] [CrossRef] [Green Version]
- Yao, H.W.; Qiao, J.W.; Gao, M.C.; Hawk, J.A.; Ma, S.G.; Zhou, H.F.; Zhang, Y. NbTaV-(Ti,W) refractory high-entropy alloys: Experiments and modeling. Mater. Sci. Eng. A 2016, 674, 203–211. [Google Scholar] [CrossRef]
- Special Metals IN718 Datasheet; Special Metals Corporation: New Hartford, NY, USA, 2007; Volume 75.
- Sengupta, A.; Putatunda, S.K.; Bartosiewicz, L.; Hangas, J.; Nailos, P.J.; Peputapeck, M.; Alberts, F.E. Tensile behavior of a new single crystal nickel-based superalloy (CMSX-4) at room and elevated temperatures. J. Mater. Eng. Perform. 1994, 3, 664–672. [Google Scholar] [CrossRef]
- Basak, A.; Holenarasipura Raghu, S.; Das, S. Microstructures and Microhardness Properties of CMSX-4® Additively Fabricated Through Scanning Laser Epitaxy (SLE). J. Mater. Eng. Perform. 2017, 26, 5877–5884. [Google Scholar] [CrossRef]
- HAYNES® 282® Alloy—Principal Features; Haynes International: Kokomo, IN, USA, 2020.
Figure 1.
(a) Calculated ∆Hmix to δr ratios from the present work compared to data, obtained from the corresponding literature [26,27]. (b) XRD patterns of the alloys examined in the as-cast condition (from top to bottom).

Figure 2.
SEM backscattered electron (BSE) overview-images of the as-cast microstructures of Mo25Nb25V25W25 (a), Mo25Nb25V25Ti25 (b), Mo30Nb30V30Ti10 (c), Mo20Nb20V20W20Ti20 (d) and Mo22.5Nb22.5V22.5W22.5Ti10 (e).
Figure 2.
SEM backscattered electron (BSE) overview-images of the as-cast microstructures of Mo25Nb25V25W25 (a), Mo25Nb25V25Ti25 (b), Mo30Nb30V30Ti10 (c), Mo20Nb20V20W20Ti20 (d) and Mo22.5Nb22.5V22.5W22.5Ti10 (e).

Figure 3.
Microstructural differences in the formation of dendrites across the produced button-shaped samples, exemplified on alloy Mo25Nb25V25W25.
Figure 3.
Microstructural differences in the formation of dendrites across the produced button-shaped samples, exemplified on alloy Mo25Nb25V25W25.
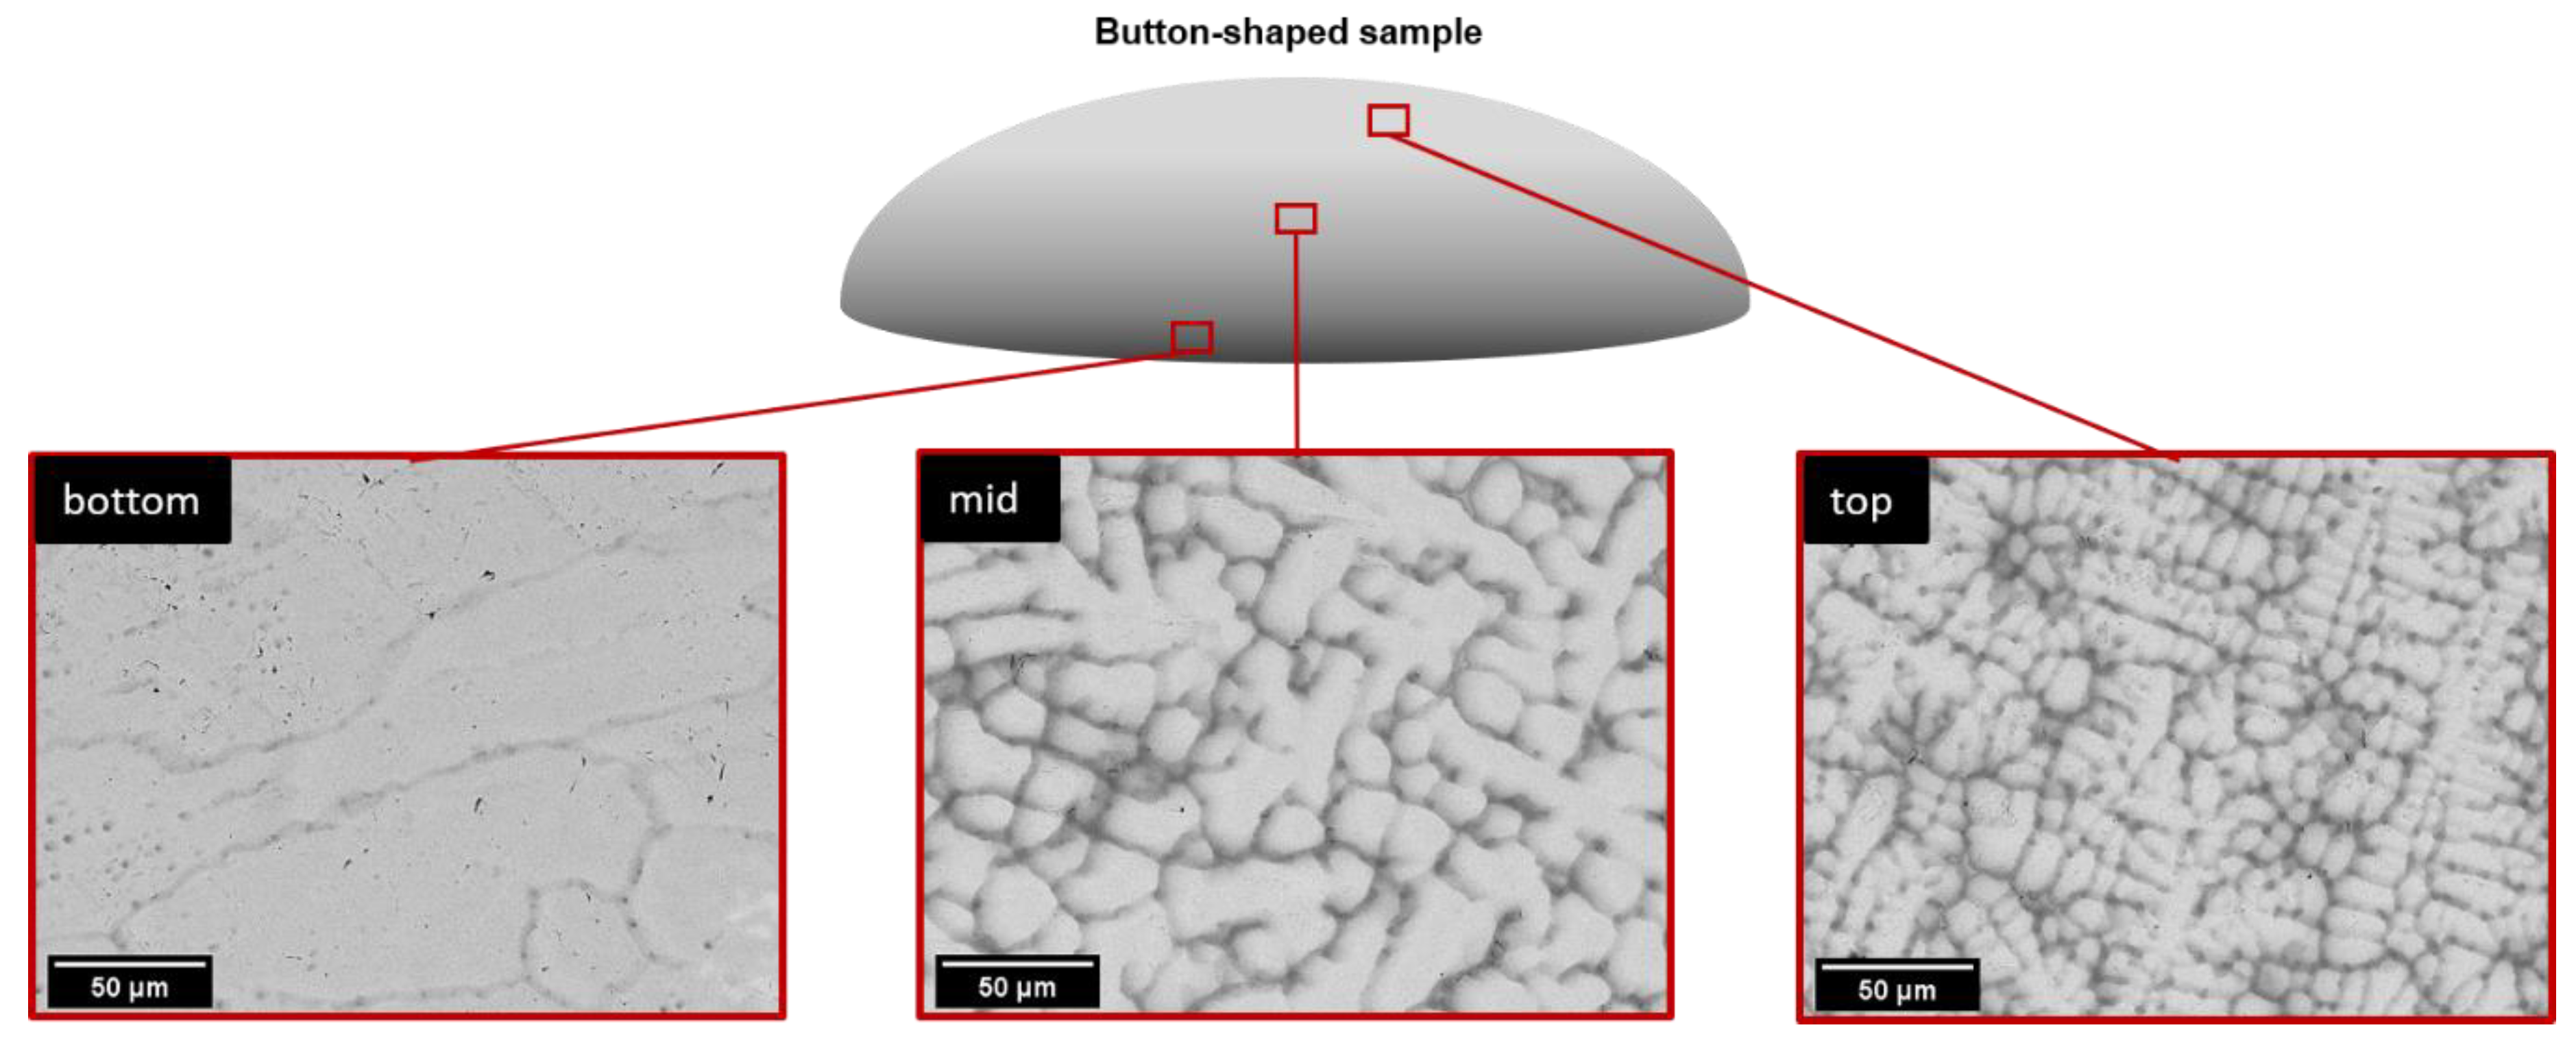
Figure 4.
EDS mappings of the refractory high-entropy alloys (RHEAs) Mo25Nb25V25Ti25 (a) and Mo20Nb20V20W20Ti20 (b).
Figure 4.
EDS mappings of the refractory high-entropy alloys (RHEAs) Mo25Nb25V25Ti25 (a) and Mo20Nb20V20W20Ti20 (b).

Figure 5.
Compressive Yield Stress—theoretical density curve (a) and hardness—theoretical density curve (b) of the alloys investigated.
Figure 5.
Compressive Yield Stress—theoretical density curve (a) and hardness—theoretical density curve (b) of the alloys investigated.

Figure 6.
Comparison of compressive yield stress and specific compressive yield stress with respect to the hardness of the alloys tested.
Figure 6.
Comparison of compressive yield stress and specific compressive yield stress with respect to the hardness of the alloys tested.
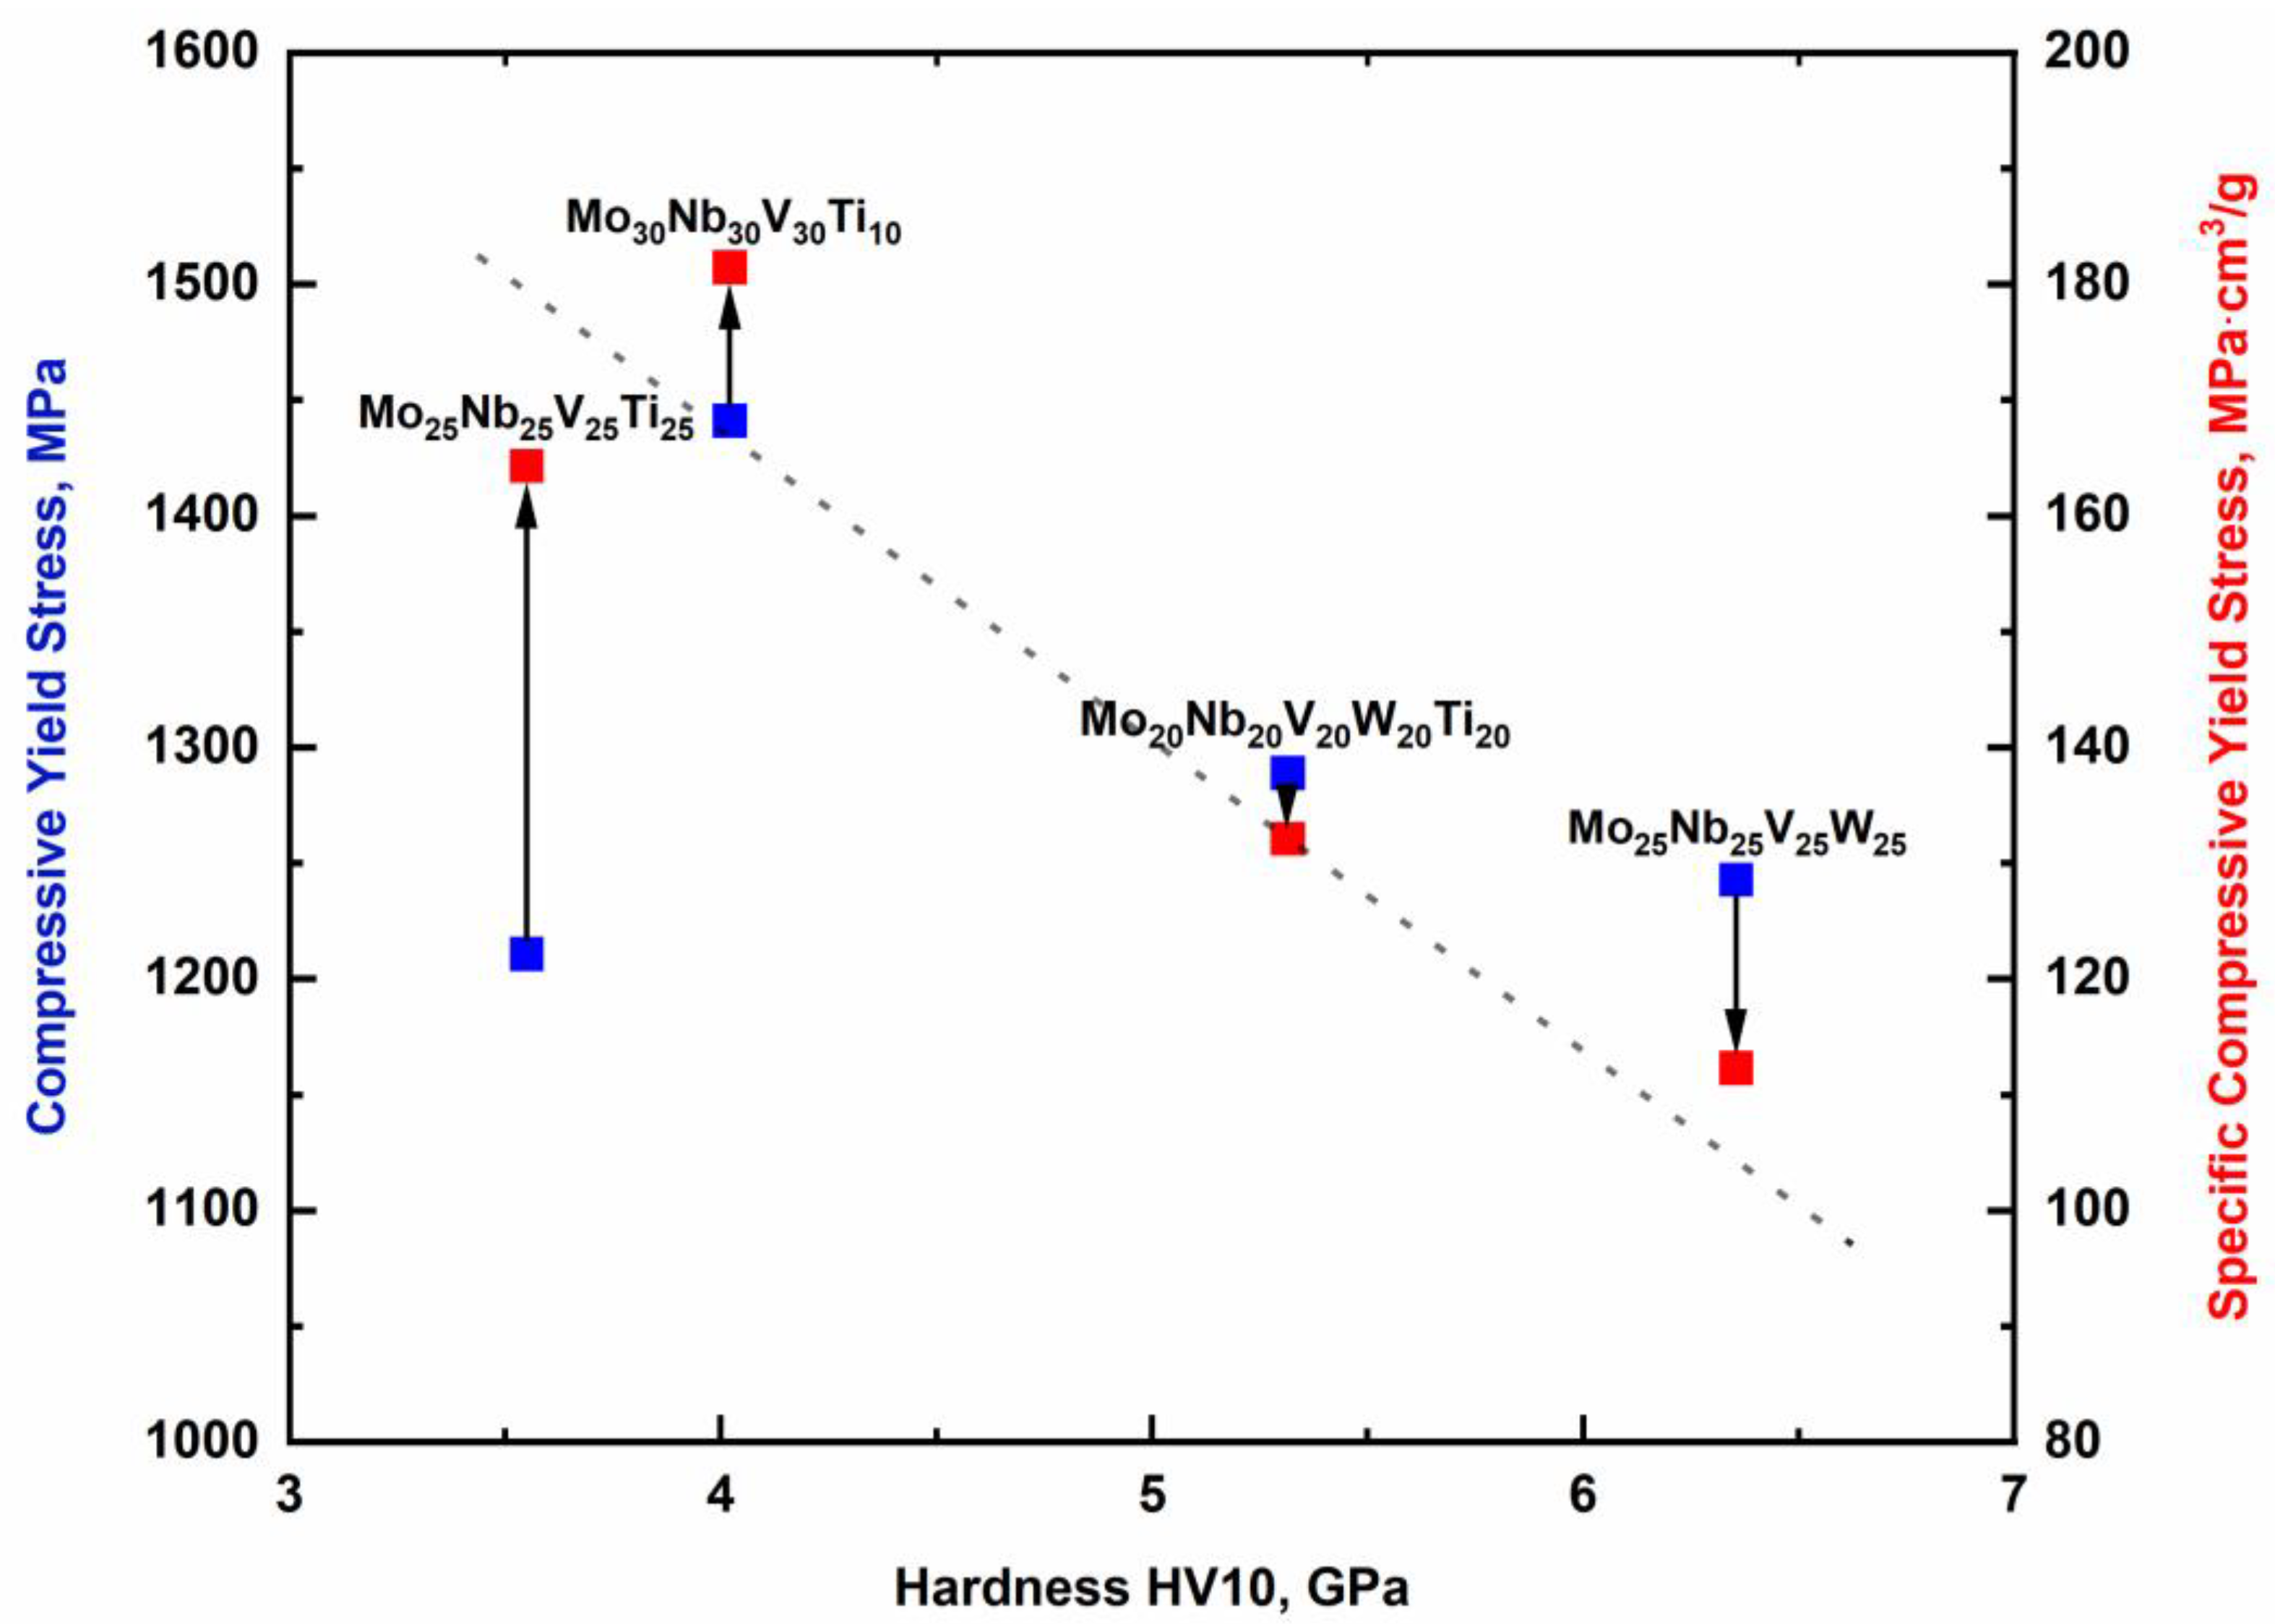
Figure 7.
Specific compressive yield stress and hardness of different RHEAs, investigated by Yao et al. [33,34] and Senkov et al. [20], common Ni-based superalloys [35,36,37,38] and the alloys examined in this work for comparison.


Table 1.
Investigated alloys, and calculated values for the entropy of mixing ΔSmix, the enthalpy of mixing ΔHmix, the solid solution prediction parameter Ω and the atomic size difference δr.
Table 1.
Investigated alloys, and calculated values for the entropy of mixing ΔSmix, the enthalpy of mixing ΔHmix, the solid solution prediction parameter Ω and the atomic size difference δr.
| Alloy | ΔSmix, J·K−1·mol−1 | ΔHmix, kJ·mol−1 | Ω | δr, % |
|---|---|---|---|---|
| Mo25Nb25V25W25 | 11.52 | −4.00 | 8.27 | 2.98 |
| Mo25Nb25V25Ti25 | 11.52 | −2.75 | 10.20 | 4.46 |
| Mo30Nb30V30Ti10 | 10.92 | −3.00 | 9.23 | 4.01 |
| Mo20Nb20V20W20Ti20 | 13.38 | −4.16 | 8.63 | 4.05 |
| Mo22.5Nb22.5V22.5W22.5Ti10 | 13.08 | −4.14 | 8.77 | 3.65 |
Table 2.
Theoretically calculated and experimentally measured lattice parameters of the alloys investigated with standard deviations.
Table 2.
Theoretically calculated and experimentally measured lattice parameters of the alloys investigated with standard deviations.
| Alloy | Theor. Lattice Parameter, Å | Exp. Lattice Parameter, Å | Deviation |
|---|---|---|---|
| Mo25Nb25V25W25 | 3.160 | 3.157 | ±0.11 |
| Mo25Nb25V25Ti25 | 3.196 | 3.174 | ±0.009 |
| Mo30Nb30V30Ti10 | 3.173 | 3.156 | ±0.002 |
| Mo20Nb20V20W20Ti20 | 3.189 | 3.164 | ±0.013 |
| Mo22.5Nb22.5V22.5W22.5Ti10 | 3.175 | 3.159 | ±0.008 |
Table 3.
Chemical compositions (at.%) of the alloys investigated with standard deviations, determined by EDS analysis.
Table 3.
Chemical compositions (at.%) of the alloys investigated with standard deviations, determined by EDS analysis.
| Alloy | Mo | V | Nb | W | Ti |
|---|---|---|---|---|---|
| Mo25Nb25V25W25 | 28 ± 1 | 21 ± 1 | 26 ± 1 | 25 ± 2 | - |
| Mo25Nb25V25Ti25 | 26 ± 1 | 24 ± 0.1 | 26 ± 0.1 | - | 24 ± 1 |
| Mo30Nb30V30Ti10 | 31 ± 0.1 | 28 ± 0.1 | 31 ± 0.1 | - | 10 ± 0.2 |
| Mo20Nb20V20W20Ti20 | 21 ± 1 | 19 ± 1 | 21 ± 0.4 | 20 ± 2 | 19 ± 1 |
| Mo22.5Nb22.5V22.5W22.5Ti10 | 26 ± 1 | 23 ± 0.2 | 22 ± 0.2 | 20 ± 0.2 | 10 ± 0.1 |
Table 4.
Results of the EDS spot analysis in the dendritic (Cd), interdendritic (Cid), and precipitation (Cpr) areas of alloy Mo25Nb25V25Ti25 and alloy Mo20Nb20V20W20Ti20.
Table 4.
Results of the EDS spot analysis in the dendritic (Cd), interdendritic (Cid), and precipitation (Cpr) areas of alloy Mo25Nb25V25Ti25 and alloy Mo20Nb20V20W20Ti20.
| Alloy | Area | Mo, at.% | Nb, at.% | V, at.% | W, at.% | Ti, at.% |
|---|---|---|---|---|---|---|
| Mo25Nb25V25Ti25 | Cd | 28 | 28 | 22 | - | 22 |
| Cid | 16 | 22 | 31 | - | 30 | |
| Mo20Nb20V20W20Ti20 | Cd | 23 | 19 | 14 | 32 | 12 |
| Cid | 19 | 25 | 26 | 11 | 19 | |
| Cpr | 2 | 7 | 5 | 2 | 85 |
Table 5.
Theoretical densities of the present HEAs in increasing order, as well as the obtained compressive yield stress values, the specific compressive yield stress values and the hardness values.
Table 5.
Theoretical densities of the present HEAs in increasing order, as well as the obtained compressive yield stress values, the specific compressive yield stress values and the hardness values.
| Alloy | ρtheor., g·cm−3 | σ0.2, MPa | σ0.2 spec., MPa∙cm3/g | Hardness HV10, GPa |
|---|---|---|---|---|
| Mo25Nb25V25Ti25 | 7.4 | 1210 ± 36 | 164 ± 5 | 4 ± 0.1 |
| Mo30Nb30V30Ti10 | 7.9 | 1441 ± 39 | 182 ± 5 | 4 ± 0.2 |
| Mo20Nb20V20W20Ti20 | 9.8 | 1289 ± 42 | 132 ± 4 | 5 ± 0.1 |
| Mo25Nb25V25W25 | 11.1 | 1243 ± 49 | 112 ± 4 | 6 ± 0.2 |
Publisher’s Note: MDPI stays neutral with regard to jurisdictional claims in published maps and institutional affiliations. |
© 2020 by the authors. Licensee MDPI, Basel, Switzerland. This article is an open access article distributed under the terms and conditions of the Creative Commons Attribution (CC BY) license (http://creativecommons.org/licenses/by/4.0/).
Share and Cite
MDPI and ACS Style
Regenberg, M.; Hasemann, G.; Wilke, M.; Halle, T.; Krüger, M. Microstructure Evolution and Mechanical Properties of Refractory Mo-Nb-V-W-Ti High-Entropy Alloys. Metals 2020, 10, 1530. https://doi.org/10.3390/met10111530
AMA Style
Regenberg M, Hasemann G, Wilke M, Halle T, Krüger M. Microstructure Evolution and Mechanical Properties of Refractory Mo-Nb-V-W-Ti High-Entropy Alloys. Metals. 2020; 10(11):1530. https://doi.org/10.3390/met10111530
Chicago/Turabian StyleRegenberg, Maximilian, Georg Hasemann, Markus Wilke, Thorsten Halle, and Manja Krüger. 2020. "Microstructure Evolution and Mechanical Properties of Refractory Mo-Nb-V-W-Ti High-Entropy Alloys" Metals 10, no. 11: 1530. https://doi.org/10.3390/met10111530
Note that from the first issue of 2016, this journal uses article numbers instead of page numbers. See further details here.